Embed Size (px)
Citation preview

RESEARCH ARTICLE10.1002/2015GC006229
A mass balance and isostasy model: Exploring the interplaybetween magmatism, deformation and surface erosion incontinental arcs using central Sierra Nevada as a case studyWenrong Cao1,2 and Scott Paterson1
1Department of Earth Sciences, University of Southern California, Los Angeles, California, USA, 2Department of EarthScience, Rice University, Houston, Texas, USA
ABSTRACT A one-dimensional mass balance and isostasy model is used to explore the feedbacksbetween magmatism, deformation and surface erosion and how they together affect crustal thickness, ele-vation, and exhumation in a continental arc. The model is applied to central Sierra Nevada in California byparameterizing magma volume and deformational strain. The simulations capture the first-order Mesozoic-Cenozoic histories of crustal thickness, elevation and erosion including moderate Triassic crustal thickeningand Jurassic crustal thinning followed by a strong Cretaceous crustal thickening, the latter resulting in a60–70 km-thick crust plus a 20 km-thick arc eclogitic root, and a �5 km elevation in the Late Cretaceous.The contribution of contractional deformation to the crustal thickening is twice that of the magmatism. Thecontribution to elevation from magmatism is dampened by the formation of an eclogitic root. Erosion rateincreases with the magnitude of crustal thickening (by magmatism and deformation) but its peak ratealways lags behind the peak rate of thickening. We propose that thickened crust initially promotes magmageneration by downward transport of materials to the magma source region, which may eventually jam themantle wedge affecting the retro-arc underthrusting process and reducing arc magmatism.
1. Introduction
Unraveling links between magmatism, deformation, and surface erosion are critical to understand masstransfers between different layers of lithosphere and Earth’s surface. Models of deformation-driven erosionand weathering have been discussed by many researchers, usually using Tibet or Andes as a case study[e.g., Fielding, 1996; Beaumont et al., 2001; Rey et al., 2001; Strecker et al., 2009; Molnar et al., 2010; Pelletieret al., 2010]. Models of magmatism-driven erosion in magmatic belts have been recently discussed by Leeet al. [2015]. Both types of models involve erosion of regional or local high-elevation topography caused bycrustal thickening induced by contractional deformation or magma addition. Yet no model so far takes bothmagmatism and deformation and their episodic occurrences in orogenic belts into account. Here we pres-ent a simple one-dimensional mass balance and isostasy model capable of linking magmatism, deformationand surface erosion together over a period over 200 Myr. This model is applied to the Sierra Nevada arc inCalifornia.
The Sierra Nevada arc (Figure 1) is a continental arc built on the Mesozoic convergence boundary betweenFarallon and North America plates from Triassic to Late Cretaceous [e.g., Dickinson, 2004]. Recent studies rec-ognized that during the arc evolution, the magmatism and intra-arc deformation are episodic, featuringthree high-magma addition rate events or flare-ups temporally overlapping with three major deformationalphases [Paterson and Ducea, 2015, Cao et al., 2105] (Figures 2a and 2b). These magmatic and deformationalevents changed the crustal thickness and further affected the elevation and surface erosion of the arc. Geo-logic observations suggest that the Sierran elevation and erosion rate fluctuated during arc evolution (Fig-ures 2c–2e and see section 3.1 and 3.2 for details) but constraints on elevation and erosion rate are tooscattered to reconstruct continuous histories. The opportunity we see here is to ‘‘connect the dots’’ and inte-grate individual observations using one meaningful and self-consistent model capable of linking magma-tism, deformation and surface elevation. The model uses magmatic and deformational thickeningparameterized from observations as inputs. The outputs are histories of elevation, crustal thickness and ero-sion rate from Triassic to present, which can be tested by comparison with independent observations. By
Key Points:� We present a generic model linking
magmatism, deformation and surfaceerosion� Model simulates crustal thickness,
paleo-elevation, and erosion rate� Simulation results capture 1st order
observations of Sierra Nevada inCalifornia
Supporting Information:� Supporting Information S1� Supporting Information S2� Supporting Information S3� Supporting Information S4
Correspondence to:W. Cao,[email protected]
Citation:Cao, W., and S. Paterson (2016), A massbalance and isostasy model: Exploringthe interplay between magmatism,deformation and surface erosion incontinental arcs using central SierraNevada as a case study, Geochem.Geophys. Geosyst., 17, doi:10.1002/2015GC006229.
Received 14 DEC 2015
Accepted 14 MAY 2016
Accepted article online 18 MAY 2016
VC 2016. American Geophysical Union.
All Rights Reserved.
CAO AND PATERSON MASS BALANCE AND ISOSTASY MODEL 1
Geochemistry, Geophysics, Geosystems
PUBLICATIONS

applying the model, the outstanding questions to address are: (1) What drives the changes of crustal thick-ness and elevation through time and can we link them to cyclic magmatism and deformation? (2) What arethe contributions of magmatism and deformation to the crustal thickening and elevation? (3) And finally,how does the knowledge about the interplay between magmatism, deformation and surface erosion helpto understand the evolution of continental arcs and orogenic belts?
2. Model Setup
2.1. Mass Balance and IsostasyThe mass balance equation (equation (1)) describes the addition and subtraction of materials to a crustalcolumn (Figure 3):
H5Magmatism1Deformation2Erosion (1)
H denotes to crustal thickness, which is defined as the vertical distance from Earth’s surface to seismicMoho, where densities of rocks and velocities of seismic waves changes abruptly [Griffin and O’Reilly, 1987].The magmatic thickening is caused by intrusion of magma, differentiated from mantle-derived melts, intothe crust [e.g., Annen et al., 2006]. The deformational thickening is caused by tectonic contraction
Figure 1. A simplified geological map showing the Sierra Nevada mountain belt, California. The box shows the central Sierra Nevada studyarea. The map is modified from the 1:2,250,000 Simplified Geologic Map of California published by California Geological Survey [2006].
Geochemistry, Geophysics, Geosystems 10.1002/2015GC006229
CAO AND PATERSON MASS BALANCE AND ISOSTASY MODEL 2
[Allmendinger et al., 1997; Tobisch and Fiske, 1982; Taboada et al., 2000; Cao et al., 2016]. Surface erosionreduces the crustal thickness by removing materials from the top of crustal column.
The second equation is the isostasy equation (equation (2)). Isostasy, known as ‘‘the roots of mountain’’theory, states that a crust is in a flotational equilibrium with the mantle beneath it. The theory is supportedby the positive correlation between elevation and crustal thickness for most orogenic belts across the world[Lee et al., 2015]. Elevation (h) and crustal thickness (H) has the following relationship:
dhdH
5 12qc
qm
� �(2)
qc is the density of crust and qm the density of lithospheric mantle. For the first-order approximation, weassume that crust and mantle have uniform densities. We also assume the isostastic adjustment is
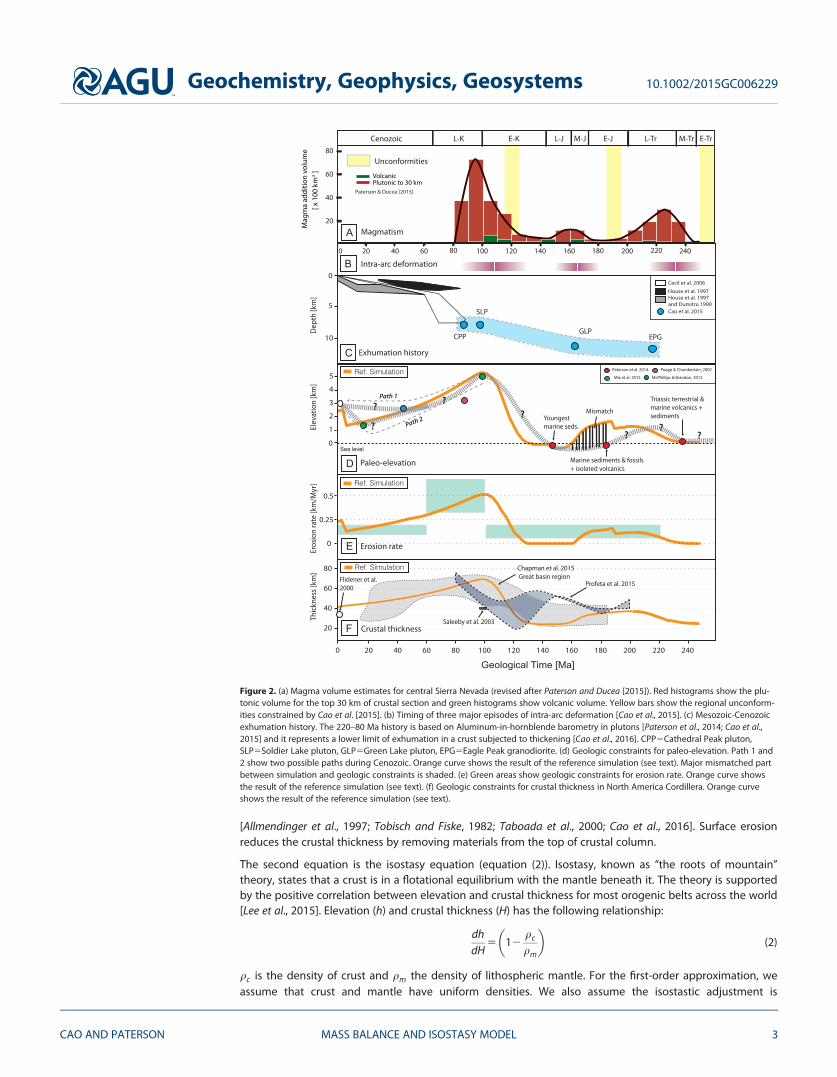
Figure 2. (a) Magma volume estimates for central Sierra Nevada (revised after Paterson and Ducea [2015]). Red histograms show the plu-tonic volume for the top 30 km of crustal section and green histograms show volcanic volume. Yellow bars show the regional unconform-ities constrained by Cao et al. [2015]. (b) Timing of three major episodes of intra-arc deformation [Cao et al., 2015]. (c) Mesozoic-Cenozoicexhumation history. The 220–80 Ma history is based on Aluminum-in-hornblende barometry in plutons [Paterson et al., 2014; Cao et al.,2015] and it represents a lower limit of exhumation in a crust subjected to thickening [Cao et al., 2016]. CPP5Cathedral Peak pluton,SLP5Soldier Lake pluton, GLP5Green Lake pluton, EPG5Eagle Peak granodiorite. (d) Geologic constraints for paleo-elevation. Path 1 and2 show two possible paths during Cenozoic. Orange curve shows the result of the reference simulation (see text). Major mismatched partbetween simulation and geologic constraints is shaded. (e) Green areas show geologic constraints for erosion rate. Orange curve showsthe result of the reference simulation (see text). (f) Geologic constraints for crustal thickness in North America Cordillera. Orange curveshows the result of the reference simulation (see text).
Geochemistry, Geophysics, Geosystems 10.1002/2015GC006229
CAO AND PATERSON MASS BALANCE AND ISOSTASY MODEL 3

instantaneous due to a shorter Maxwell time of mantle (�1 kyr) [Ranalli, 1995] compared to the time scaleof simulation (102 Myr). Notation lists the definitions of the symbols and their values.
2.2. Magmatic and Deformational ThickeningTo parameterize magmatic thickening, we employ the volumetric fraction (b) of magma, which is the ratiobetween the volume of magma added to the crust and the initial volume of crust of a given size. If the sec-tional area of the arc remains the same, after magmatism, the crust will be thickened to
H05H0 11bð Þ (3)where H0 is the initial thickness of the crust. In term of deformational thickening in host rocks, the thicken-ing strain (e1) can be derived from the shortening strain (e3), which can be more easily determined fromfield measurements. To convert from shortening to thickening strain, volume loss and/or arc-parallel exten-sion during the deformation have to be considered. Since the two have the same effect, we denote u todescribe the percentage of volume loss and/or arc-parallel extension. Thus e1 and e3 can be linked as:
11e1ð Þ 11e3ð Þ512u (4)
After deformation, a crust will be thickened to:
H05H0 11e1ð Þ5H012u11e3
(5)
To derive the total thickening caused by magmatism and deformation (HM1D), we calculate the crustalthickness after simultaneous magmatism and deformation by alternatively adding increments of magma
Figure 3. Model setup showing three major factors that modify the thickness of a continental arc crust: Magmatism, deformation, and sur-face erosion. Magma intruding the crust is generated in the source region located in lower crust and upper mantle. Arc root is generated in thelithospheric mantle. Since the arc root is denser than the surrounding mantle, it will founder under certain conditions. h5Elevation, h05Initialelevation at sea level, H05Initial crustal thickness, H05Crustal thickness modified by magmatism, deformation and erosion, DH5Thickened partof the crust (DH5H02H0), R5Thickness of arc root, qc5 Density of crust, qm5 Density of lithospheric mantle, qr5 Density of arc root.
Geochemistry, Geophysics, Geosystems 10.1002/2015GC006229
CAO AND PATERSON MASS BALANCE AND ISOSTASY MODEL 4

and straining the host rock incrementally (Matlab script is in supporting information). Finally, in contrast tothe linear treatment of a magmatic flare-up in Lee et al. [2015], we assume the total thickening rate _HM1D
� �follows a Gaussian distribution and the area beneath the Gaussian curve is scaled to the thickened crust DH5H02H0 (Figures 4a and 4b).
2.3. Growth and Foundering of Arc RootThe arc root refers to garnet-rich pyroxenites or eclogites in the lower crust or upper mantle [Saleeby et al.,2003; Lee et al., 2006]. The arc root is denser than the surrounding mantle thus will have a ‘‘pull-down’’ effecton elevation. The arc root is interpreted as either cumulates formed during fractionational crystallization ofmantle-derived basaltic melts [Lee et al., 2006; Horodyskyj et al., 2007] or restites from partial melting oflower crust [Ducea, 2002; Saleeby et al., 2003] or a mix of the two [Ducea, 2002]. Despite the debated origin,it is agreed that the arc root is related to the formation of arc magmas [Ducea, 2001; Saleeby et al., 2003; Leeet al., 2006]. We link the arc root with arc magmatism via a mass-of-root to mass-of-melt ratio (c). c is con-strained between 1 and 3 [Ducea, 2002]. For example, if c52, to generate 1 unit mass of arc magma, 2 unitsmass of arc root will be generated. We also assume that the arc root growth rate follows a Gaussian distribu-tion and the area beneath the Gaussian curve is scaled to the final thickness of root (Figures 4a and 4b).Since the density of the arc root is higher than mantle peridotite [Saleeby et al., 2003; Lee, 2014], the arc rootwill become unstable and founder [e.g., Zandt et al., 2004; Saleeby et al., 2012; Lee, 2014]. For simplicity, wetreat the arc root foundering as an instantaneous event during which it founders as a whole at an assignedtime. The limitations of such treatment are discussed in section 5.4.
2.4. ErosionWe simplify Simoes et al.’s [2010] model for erosion and elevation, which was also adopted by Lee et al.[2015]. The model addresses erosion of large-scale topographic features (�100 km) and the average eleva-tion of mountains [Simoes et al., 2010]. The erosion rate ( _E ) is linked to elevation (h) via erosion responsetime (sE) (equation (6)), which in turn is a function of bedrock erodibility (ke) and precipitation rate (p) (equa-tion (7)).
_E5hsE
(6)
sE51
kep(7)
Higher rock erodibility and precipitation rate lead to shorter sE and higher erosion rate for a given elevation.sE ranges from 0.5 to 300 Myr across the globe [Simoes et al., 2010]. The low end of sE (0.5 Myr) refers to
Figure 4. (a) The total crustal thickening rate and arc root growth rate are simulated as Gaussian distribution curves. The areas beneath the crustal thickening rate curve and arc rootgrowth rate curve are scaled to the thickened crust (DH) and arc root thickness (R), respectively. (b) Cumulative crustal thickness and arc root thickness are shown. H0 and R0 are initialcrustal and arc root thicknesses, respectively. H0 is the final crustal thickness after thickening. Arbitrary numbers are used to show the setup.
Geochemistry, Geophysics, Geosystems 10.1002/2015GC006229
CAO AND PATERSON MASS BALANCE AND ISOSTASY MODEL 5
regions like Taiwan where precipitation rate is high (2–3 m/yr) and bedrock erodibility is also high (7.6 3
1027 m21) [Simoes et al., 2010]. The high end of sE (�15–300 Myr) describes arid regions where precipita-tion rates are extremely low. With world-averaged ke 51.84 3 1027 m21, [Simoes et al., 2010] and the pres-ent global average annual precipitation rate of 1022 mm/yr [NOAA National Centers for EnvironmentalInformation, 2015], sE is �5 Myr.
2.5. Integration of Mass Balance and IsostasyMass balance and isostasy are integrated into equations (8) and (9), which are the mathematically moreexpressed forms of equations (1) and (2), respectively. Both equations (8) and (9) are modified from Leeet al. [2015] with deformational thickening incorporated. Equation (8) relates the crust thickening rate (dH/dt) to magmatic and deformation thickening ( _HM1D) and erosion rate ( _E ). Equation (9) describes the isostas-tic relationship between crustal thickness (H), arc root thickness (R) and surface elevation (h).
dH tð Þdt
5 _HM1D2 _E hð Þ (8)
h tð Þ5h01 12qc
qm
� �� H tð Þ2H0½ �1 12
qr
qm
� �� R tð Þ (9)
h0 and H0 are the initial surface elevation and crustal thickness, respectively. qc , qm, and qr are the charac-teristic densities of crust, lithospheric mantel and arc root, respectively. Numerical methods are used tosolve equations (8) and (9). Matlab scripts are included in supporting information.
3. Application to Mesozoic Sierra Nevada Arc
3.1. Magmatism and Deformation in Sierra NevadaThe Sierra Nevada is an exhumed continental arc constructed during Mesozoic ocean-continent conver-gence along western North America. The exposed arc batholith consists mainly of granodioritic to tonaliticplutons of Triassic to Late Cretaceous in age. The magmatic history is retrieved from geologic maps withextensive databases of igneous and sedimentary rock ages [e.g., Barton et al., 1988; Nadin and Saleeby,2008; DeCelles et al., 2009]. Recent studies of igneous bedrock and detrital zircons ages suggest that thebatholith is constructed in three major high-magma addition rate events or flare-ups [Ducea, 2001; Patersonand Ducea, 2015], whose peak times were at �220 Ma, �160 Ma, and �98 Ma, respectively [Paterson andDucea, 2015] (Figure 2a). For each magmatic flare-up event in the central Sierra Nevada, first-order magmavolume estimates have been made based on exposed pluton areas and pluton ages [Paterson and Ducea,2015] (Table 1).
In the central Sierra Nevada, the batholith was emplaced into Late Paleozoic to Late Cretaceoussedimentary-volcanic strata, which are persevered as several disconnected host rock pendants within oralong the eastern and western margins of the batholith. The structures in the host rock pendants featureregional steeply tilted bedding, NW-striking, bedding-parallel cleavages and NE-or SW-vergent thrusts[Tobisch et al., 2000; Schweickert and Lahren, 2006; Cao et al., 2015]. These structures suggest arc-perpendicular shortening strain resulted from episodes of deformational events [Tobisch and Fiske, 1982;Cao et al., 2015]. The finite shortening strain (e3) in host rocks has been estimated by Cao et al. [2016] viacompiling> 650 field strain measurements across the central and southern Sierra Nevada. The ductile short-ening strain associated with regional cleavage is estimated to 20.5 and the brittle shortening strain relatedto thrust and duplex formation is about 20.3 [Cao et al., 2016]. The finite bulk arc in shortening strain inhost rocks is thus a combination of the ductile and brittle strain e35 120:5ð Þ 120:3ð Þ21520:65. Cao et al.[2016] also determined the percentage of volume loss and/or arc-parallel extension u520%: According toequation (4), the bulk finite thickening of host rocks is e151:19. A detailed field study and compilation ofstructures in host rocks in several host rock pendants suggest that there were also three major deforma-tional events in Triassic, Jurassic and Cretaceous and they were separated by regional unconformities (Fig-ure 2a). The timing of deformation seems to mimic the magmatic flare-ups [see Cao et al., 2015, Table 3](Figure 2b). In our model, for simplicity, we assume the magmatic and deformational events temporallyoverlap (Table 1). Such temporally overlapping between magmatism and regional deformation is alsoobserved in central Andes in the Miocene and Pliocene [e.g., Isacks, 1988; Allmendinger et al., 1997].
Geochemistry, Geophysics, Geosystems 10.1002/2015GC006229
CAO AND PATERSON MASS BALANCE AND ISOSTASY MODEL 6

3.2. Constraints on Paleo-Elevation, Crustal Thickness and ErosionField geology and studies on geochronology, geobarometry and paleo-altimetry (Figure 2c) suggested thatSierra Nevada was locally above sea level and subjected to erosion in Early Triassic [Paterson et al., 2014;Saleeby and Dunne, 2003] and then broadly evolved to or below sea level during Early-Middle Jurassic[Busby-Spera, 1988; Paterson and Ducea, 2015] and again rose to a high elevation in the Late Cretaceous(�3–5 km) [House et al., 2001; Page and Chamberlain, 2002; McPhillips and Brandon, 2012] and Early Eocene(>2.4 km) [Mix et al., 2016]. The origin of present elevation of Sierra Nevada (�3 km) is still debated. It canbe either a relatively young (<20–30 Ma) feature [e.g., Unruh, 1991; Wakabayashi and Sawyer, 2001; Joneset al., 2004] or it was established in the Late Cretaceous-early Cenozoic [Cassel et al., 2009].
Exhumation from Triassic to Late Cretaceous is estimated to be �10–20 km [Cao et al., 2016; J. B. Saleeby,personal communication, 2015] (Figure 2c). The exhumation rate during Late Cretaceous and Early Cenozoichas been estimated to be 0.3–0.7 km/Myr and it reduced below 0.25 km/Myr in average after 60 Ma [Dumi-tru, 1990; House et al., 1997; Cecil et al., 2006; Saleeby, personal communication, 2015] (Figure 2e).
Recent research on crustal thicknesses of North American Cordillera (Great Basin region) based on Sr/Y ratiofrom arc plutons suggests a 30–35 km-thick crust during Middle Jurassic to Early Cretaceous and increasingto �60 km in Late Cretaceous [Chapman et al., 2015a] (Figure 2f). In the Sierran region, based on Sr/Y andLa/Yb ratios in Sierran plutons, Profeta et al. [2015] suggested that the Sierran crust was about 35–50 km thickin from Triassic to middle Cretaceous, and then it started to thicken again from �110 Ma to 80 Ma. Saleebyet al. [2003] suggested the crust was about 40 km (plus a 35 km-thick-elcogitic root) at �100 Ma. The averagepresent crustal thickness in Sierra Nevada is about 35 km based on seismic studies [Fliedner et al., 2000].
3.3. Formalizing Model InputsThe volume estimates of magma in central Sierra Nevada [Paterson and Ducea, 2015] allow us to calculatethe volumetric fraction of magma (b) in each flare-up. We denote bT ; bJ; and bK for Triassic, Jurassic andCretaceous flare-ups, respectively and their numbers are shown in Table 1.
From the deformation, we denote eT1 ; eJ
1; and eK1 for Triassic, Jurassic and Cretaceous thickening strain in
host rocks. They should satisfy the following relationship:
11eT1
� �11eJ
1
� �11eK
1
� �5 11e1ð Þ52:29 (10)
Since it is uncertain how the finite strain was temporally partitioned in three deformational events, the exactvalues of eT
1 ; eJ1 and eK
1 are unknown. To cover this uncertainty, we tested 4 different combinations of eT1 ; eJ
1;
and eK1 (Table 1).
As for the timing of arc root foundering, there are few geological constraints for the Jurassic and Triassicroots. We adopt DeCelles et al.’s [2009] idea on cyclic behaviors of Cordilleran arcs, which suggests that thearc root founders at the end of each flare-up. In our model, 190 Ma and 150 Ma are used as the foundering
Table 1. Parameters Used in Simulation Experiments
Triassic Events Jurassic Events Cretaceous Events H0 (initial crustal thickness) 25 km
Common settingsStart-End age (Ma) 250–190 180–150 140–90 h0 (initial elevation) 0 kmDuration (Myr) 60 30 50 Root foundering timeMagma volume (km3) 77,900 28,650 17,4225 For Triassic root 190 Ma
For Jurassic root 150 Mab1 0.24 0.087 0.53 For Cretaceous root 5 Ma
Simulation
TriassicEvents Jurassic Events
CretaceousEvents
c sE (Myr) CommentsbT eT1 bJ eJ
1 bK eK1
Specific Settings for SimulationsSet 1 0.24 0 0.087 0 0.53 0 1, 2, 3 2.5, 5, 10, 15 No deformationSet 2 0.24 0.32 0.087 0.32 0.53 0.32 1, 2, 3 2.5, 5, 10, 15 Even deformationSet 3 0.24 0.32 0.087 0 0.53 0.73 1, 2, 3 2.5, 5, 10, 15 No Jurassic deformationSet 4 0.24 0.32 0.087 20.32 0.53 1.55 1, 2, 3 2.5, 5, 10, 15 Jurassic crustal extensionReference Simulation 0.24 0.32 0.087 20.32 0.53 1.55 2 10 Best result (see text)
Notes: 1. b is calculated based on the dimension of crust of central Sierra Nevada: 110 km-wide, 100 km-long, and 30 km-deep.
Geochemistry, Geophysics, Geosystems 10.1002/2015GC006229
CAO AND PATERSON MASS BALANCE AND ISOSTASY MODEL 7

time for Triassic and Jurassic root, respectively (Table 1). Lines of evidence suggest that at least some of theCretaceous root did not founder until between 10 and 3 Ma [Zandt et al., 2004; Jones et al., 2004; Saleebyet al., 2012]. In our model, 5 Ma is set as the time for the Cretaceous root to founder (Table 1).
We have conducted 4 sets and a total of 48 simulations to cover a parameter space comprising the threeleast unconstrained parameters: thickening strain (eT
1 ; eJ1; eK
1 ), erosion response time (sEÞ, and mass-of-rootto mass-of-melt ratio (c). Four values of sE are tested in our model: 2.5 Myr, 5 Myr, 10 Myr, and 15 Myr. Notein our model, an erosion response time is held constant for Mesozoic and Cenozoic, which is a simplifiedtreatment allowing us to study the first-order feedbacks between processes. Model limitations are discussedlater. Three values of c are tested: 1, 2 and 3. For each set of simulations, we fix the combination of eT
1 ; eJ1;
eK1 and vary sE and c systematically (Table 1).
4. Simulation Results
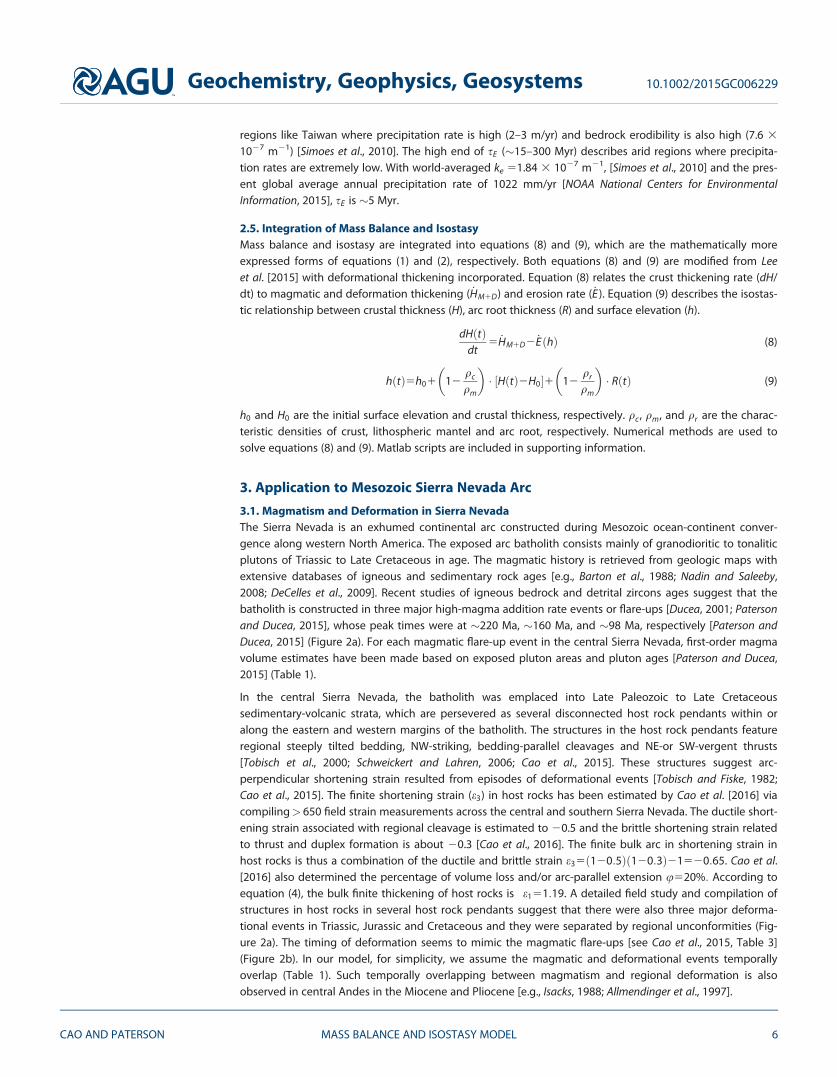
In Set 1 simulations (Figure 5), only magmatism is employed and deformation is not incorporated(eT
15eJ15eK
1 50). Peak rates of magmatic thickening are smaller than 0.25 km/Myr for Triassic and Jurassicflare-ups (Figures 5a and 5b) and smaller than 0.75 km/Myr for Cretaceous flare-up (Figure 5c). All simula-tions in Set 1 show lower elevation (<3 km), thinner crust (�45 km), and smaller total exhumation (<20 km)compared to values in other sets (Figures 6–8). Shorter sE results in a faster erosion rate during flare-ups butthe erosion rate decays faster as elevation drops. As expected, a shorter sE also results in lower elevation,thinner crust, and larger total exhumation for a given c value (Figures 5d–5l). For a given sE value, a thickerarc root (higher c values) will suppress the elevation, thus resulting in reduced erosion rate, thicker crustand less total exhumation (Figures 5d–5l). The foundering of an arc root causes an immediate elevationrebound, resulting in a sudden increase in erosion rate (Figures 5d–5l). Such increases of elevation and ero-sion rate are more dramatic if the root is thicker (Figure 5f).
In Set 2 simulations (Figure 6), deformational thickening is equally partitioned between the three events(eT
15eJ15eK
150:32). Peak rates of crustal thickening during Triassic and Jurassic are all higher than 0.5 km/Myr. Thickening rates in Cretaceous are slightly higher than 1 km/Myr (Figures 6a–6c). Comparing to Set 1(Figure 5), erosion rate, elevation, crustal thickness, and cumulative exhumation all increase (Figures 6a–6l).
In Set 3 simulations (Figure 7), neutral deformation in Jurassic, and a stronger Cretaceous contraction areapplied (eJ
150; eK1 > eT
1 > 0). To make Set 3 comparable to Set 2, we fix eT150.32 and increase eK
1 to 0.73. Asa result, Jurassic erosion rate is very low (<0.25 km/Myr) (Figures 7a–7c). Jurassic elevation, crustal thicknessand cumulative exhumation also remain more or less the same (Figure 7d–7l). Cretaceous thickening rate ishigher than 1.5 km/Myr. Erosion rate, elevation, crustal thickness, and cumulative exhumation all increaseduring the Cretaceous.
Simulations in Set 4 (Figure 8) employ extensional deformation in the Jurassic and the strongest Cretaceouscontraction among all sets of simulations (eK
1 > eT1 > 0 > eJ
1). To make Set 4 comparable to Set 2 and 3, wefix eT
150.32 but let eJ15 20.32, which has a same strain magnitude but of revered kinematics (thinning
instead of thickening). Peak crustal thickening rate is negative (20.5 km/Myr) during Jurassic (Figures 8a–8c). Cretaceous thickening rate peaks at �2.7 km/Myr at ca. 115 Ma. Elevation between Late Jurassic andEarly Cretaceous (roughly from 165 Ma to 130 Ma) is close or below to sea level and the elevation increasesdramatically in the Late Cretaceous (Figures 8d–8f). With a sE510 or sE515, the peak elevation is close tohigher than 5 km at 100 Ma. Crustal thickness first increases in the Triassic, then decreases during the Juras-sic to less than 30 km and afterward increases rapidly to �45–72 km (Figures 8g–8i) in the Cretaceous.Cumulative exhumation plateaus between the Late Jurassic and Early Cretaceous and then sharply increasesduring the Cretaceous (Figures 8j–8l).
By comparing the simulation results to the geologic constraints on paleo-elevation, erosion rate and crustalthickness (Figure 2 and section 3.2), we find the elevations in Set 1 are too low for the Cretaceous and pres-ent. Erosion rates in Set 1 are also too low in the Late Cretaceous-Early Cenozoic. None of Set 1, 2 and 3 dis-plays the below-sea-level elevation in the Jurassic. In Set 4 simulations, sE 52.5 and 5 Myr giveunreasonably low present elevation (<2 km) compared to observations. sE 515 Myr gives a shorter Jurassicbelow-sea-level period and an elevation seemly too high (5.8–6.7 km) for the Late Cretaceous. Among allthe simulations, Set 4 (Figure 8, middle column), which has intermediate arc root (c 52) and a sE 510 Myr
Geochemistry, Geophysics, Geosystems 10.1002/2015GC006229
CAO AND PATERSON MASS BALANCE AND ISOSTASY MODEL 8
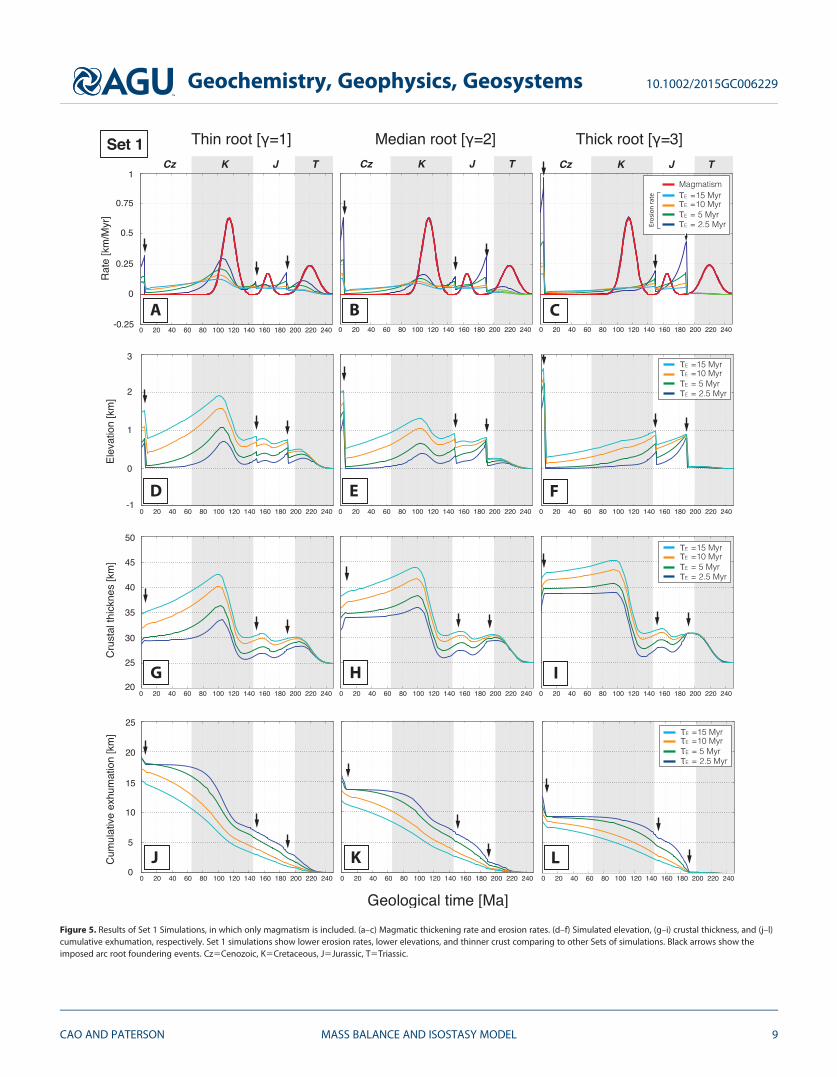
Figure 5. Results of Set 1 Simulations, in which only magmatism is included. (a–c) Magmatic thickening rate and erosion rates. (d–f) Simulated elevation, (g–i) crustal thickness, and (j–l)cumulative exhumation, respectively. Set 1 simulations show lower erosion rates, lower elevations, and thinner crust comparing to other Sets of simulations. Black arrows show theimposed arc root foundering events. Cz5Cenozoic, K5Cretaceous, J5Jurassic, T5Triassic.
Geochemistry, Geophysics, Geosystems 10.1002/2015GC006229
CAO AND PATERSON MASS BALANCE AND ISOSTASY MODEL 9
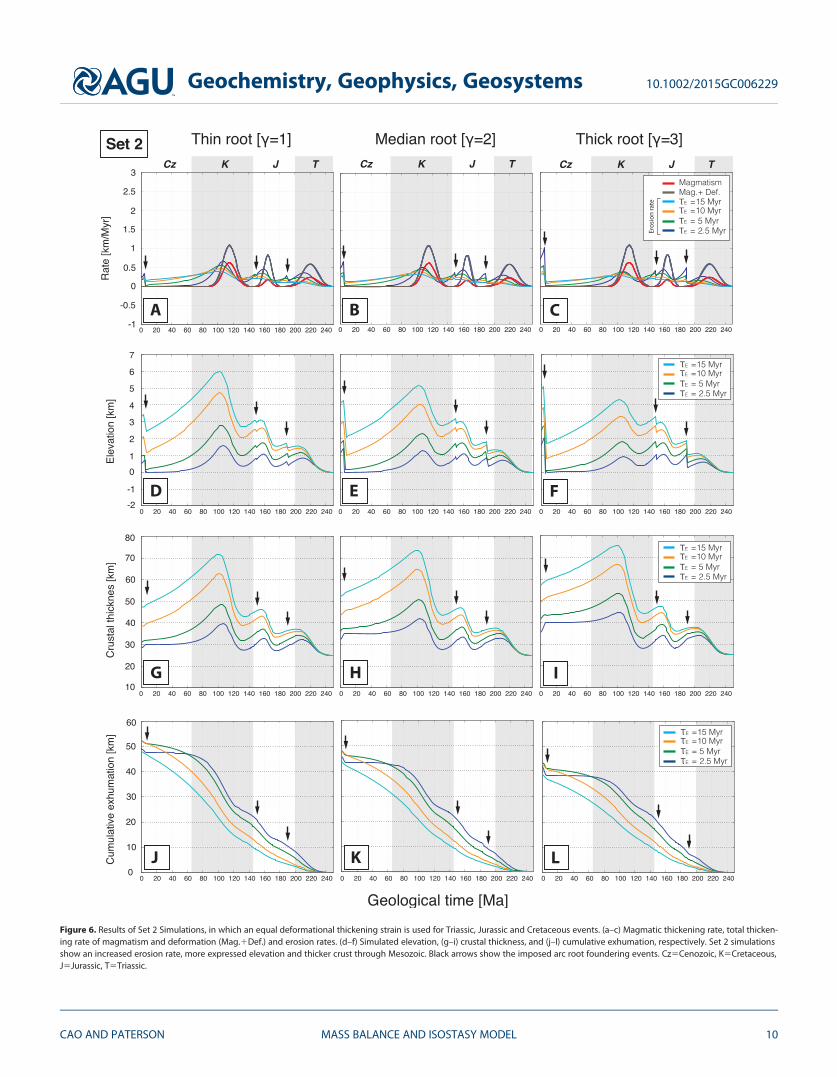
Figure 6. Results of Set 2 Simulations, in which an equal deformational thickening strain is used for Triassic, Jurassic and Cretaceous events. (a–c) Magmatic thickening rate, total thicken-ing rate of magmatism and deformation (Mag.1Def.) and erosion rates. (d–f) Simulated elevation, (g–i) crustal thickness, and (j–l) cumulative exhumation, respectively. Set 2 simulationsshow an increased erosion rate, more expressed elevation and thicker crust through Mesozoic. Black arrows show the imposed arc root foundering events. Cz5Cenozoic, K5Cretaceous,J5Jurassic, T5Triassic.
Geochemistry, Geophysics, Geosystems 10.1002/2015GC006229
CAO AND PATERSON MASS BALANCE AND ISOSTASY MODEL 10

Figure 7. Results of Set 3 Simulations, in which no Jurassic deformation is used. (a–c) Magmatic thickening rate, total thickening rate of magmatism and deformation (Mag.1Def.) anderosion rates. (d–f) Simulated elevation, (g–i) crustal thickness, and (j–l) cumulative exhumation, respectively. Set 3 simulations show low erosion rates and elevation in Jurassic. Sincemore thickening strain is partitioned into Cretaceous event, there are sharp increases of erosion rate, elevation, and crustal thickness during Cretaceous. Black arrows show the imposedarc root foundering events. Cz5Cenozoic, K5Cretaceous, J5Jurassic, T5Triassic.
Geochemistry, Geophysics, Geosystems 10.1002/2015GC006229
CAO AND PATERSON MASS BALANCE AND ISOSTASY MODEL 11
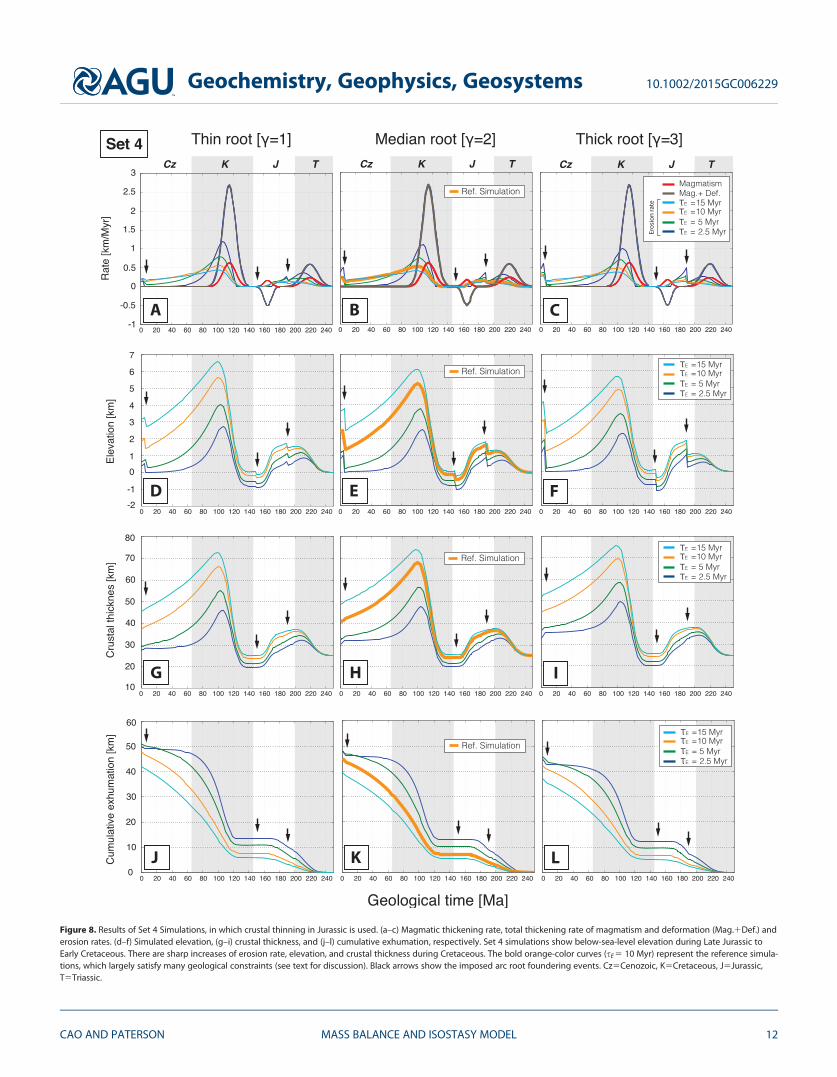
Figure 8. Results of Set 4 Simulations, in which crustal thinning in Jurassic is used. (a–c) Magmatic thickening rate, total thickening rate of magmatism and deformation (Mag.1Def.) anderosion rates. (d–f) Simulated elevation, (g–i) crustal thickness, and (j–l) cumulative exhumation, respectively. Set 4 simulations show below-sea-level elevation during Late Jurassic toEarly Cretaceous. There are sharp increases of erosion rate, elevation, and crustal thickness during Cretaceous. The bold orange-color curves (sE 5 10 Myr) represent the reference simula-tions, which largely satisfy many geological constraints (see text for discussion). Black arrows show the imposed arc root foundering events. Cz5Cenozoic, K5Cretaceous, J5Jurassic,T5Triassic.
Geochemistry, Geophysics, Geosystems 10.1002/2015GC006229
CAO AND PATERSON MASS BALANCE AND ISOSTASY MODEL 12
gives the best results. We herein call Set 4 (c52 and sE 510 Myr) as the reference simulation, which satisfymany first-order geologic constraints on elevation and erosion rate presented in section 3.2 and Figures 2dand 2e. For Cenozoic elevation, since the root foundering occurred at 5 Ma, the simulation result is close tothe ‘‘Path 2’’ (Figure 2d) [e.g., Jones et al., 2004]. In this sense, our simple model is able to capture the first-order temporal patterns of elevation and erosion rate.
One mismatch is that the reference simulation has higher elevation from late Early to Middle Jurassicwhereas geologic observations suggest the elevation was near or below sea level. Although we could tweakthe model to make the simulation results more close to observations (e.g., set Jurassic extension event tem-porally slightly earlier and add more extensional strain in Early-Middle Jurassic), we don’t want to tune themodel to observations since our model is simplified and one-dimensional and thus exact matches to obser-vations are not expected. In terms of crustal thickness, although the reference simulation gives a smallervalue of thickness in Middle and Late Jurassic, it does predict the major trend of increase of crustal thicknessfrom the middle Cretaceous (Figure 2f).
5. Discussion
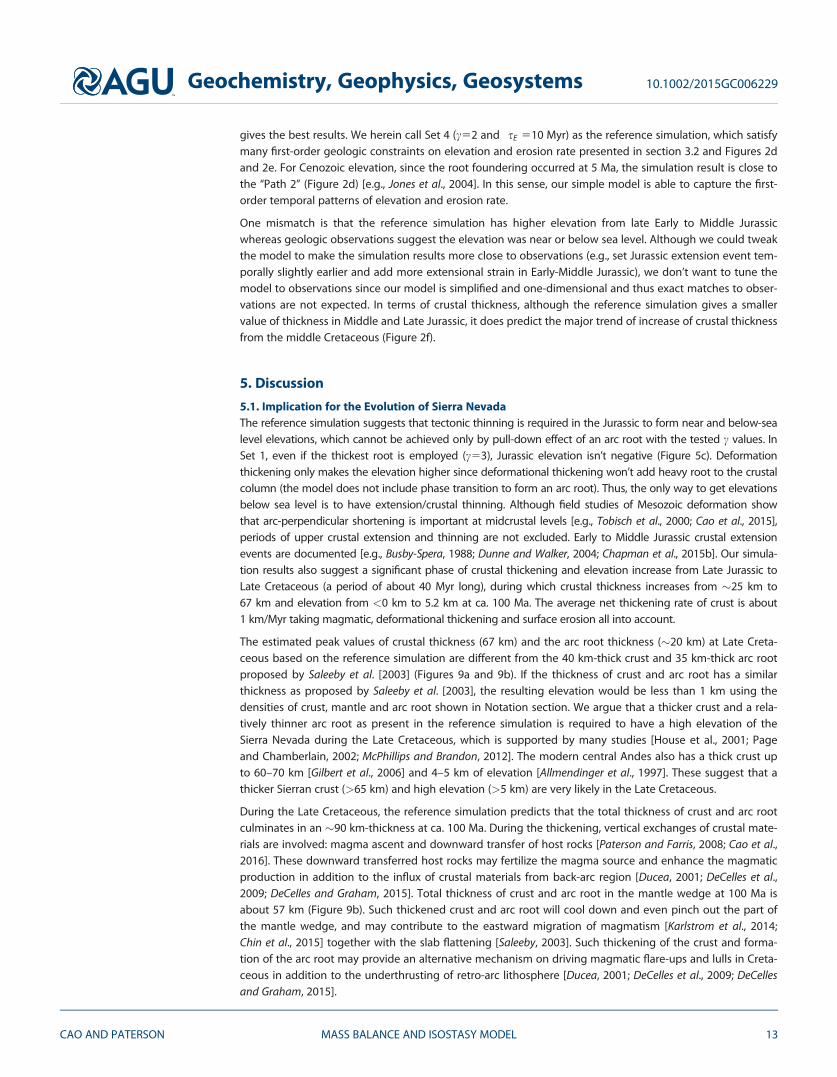
5.1. Implication for the Evolution of Sierra NevadaThe reference simulation suggests that tectonic thinning is required in the Jurassic to form near and below-sealevel elevations, which cannot be achieved only by pull-down effect of an arc root with the tested c values. InSet 1, even if the thickest root is employed (c53), Jurassic elevation isn’t negative (Figure 5c). Deformationthickening only makes the elevation higher since deformational thickening won’t add heavy root to the crustalcolumn (the model does not include phase transition to form an arc root). Thus, the only way to get elevationsbelow sea level is to have extension/crustal thinning. Although field studies of Mesozoic deformation showthat arc-perpendicular shortening is important at midcrustal levels [e.g., Tobisch et al., 2000; Cao et al., 2015],periods of upper crustal extension and thinning are not excluded. Early to Middle Jurassic crustal extensionevents are documented [e.g., Busby-Spera, 1988; Dunne and Walker, 2004; Chapman et al., 2015b]. Our simula-tion results also suggest a significant phase of crustal thickening and elevation increase from Late Jurassic toLate Cretaceous (a period of about 40 Myr long), during which crustal thickness increases from �25 km to67 km and elevation from <0 km to 5.2 km at ca. 100 Ma. The average net thickening rate of crust is about1 km/Myr taking magmatic, deformational thickening and surface erosion all into account.
The estimated peak values of crustal thickness (67 km) and the arc root thickness (�20 km) at Late Creta-ceous based on the reference simulation are different from the 40 km-thick crust and 35 km-thick arc rootproposed by Saleeby et al. [2003] (Figures 9a and 9b). If the thickness of crust and arc root has a similarthickness as proposed by Saleeby et al. [2003], the resulting elevation would be less than 1 km using thedensities of crust, mantle and arc root shown in Notation section. We argue that a thicker crust and a rela-tively thinner arc root as present in the reference simulation is required to have a high elevation of theSierra Nevada during the Late Cretaceous, which is supported by many studies [House et al., 2001; Pageand Chamberlain, 2002; McPhillips and Brandon, 2012]. The modern central Andes also has a thick crust upto 60–70 km [Gilbert et al., 2006] and 4–5 km of elevation [Allmendinger et al., 1997]. These suggest that athicker Sierran crust (>65 km) and high elevation (>5 km) are very likely in the Late Cretaceous.
During the Late Cretaceous, the reference simulation predicts that the total thickness of crust and arc rootculminates in an �90 km-thickness at ca. 100 Ma. During the thickening, vertical exchanges of crustal mate-rials are involved: magma ascent and downward transfer of host rocks [Paterson and Farris, 2008; Cao et al.,2016]. These downward transferred host rocks may fertilize the magma source and enhance the magmaticproduction in addition to the influx of crustal materials from back-arc region [Ducea, 2001; DeCelles et al.,2009; DeCelles and Graham, 2015]. Total thickness of crust and arc root in the mantle wedge at 100 Ma isabout 57 km (Figure 9b). Such thickened crust and arc root will cool down and even pinch out the part ofthe mantle wedge, and may contribute to the eastward migration of magmatism [Karlstrom et al., 2014;Chin et al., 2015] together with the slab flattening [Saleeby, 2003]. Such thickening of the crust and forma-tion of the arc root may provide an alternative mechanism on driving magmatic flare-ups and lulls in Creta-ceous in addition to the underthrusting of retro-arc lithosphere [Ducea, 2001; DeCelles et al., 2009; DeCellesand Graham, 2015].
Geochemistry, Geophysics, Geosystems 10.1002/2015GC006229
CAO AND PATERSON MASS BALANCE AND ISOSTASY MODEL 13
We also envision that during the Cretaceous, the mantle wedge will be crowded by influx of materialscaused by significant crustal thickening (Figure 9c), which might interfere with the underthrusting of retro-arc materials. However, the reference simulation does not predict thick crust and arc root during Triassicand Jurassic thus leaving plenty of room for retro-arc materials to be underthrusted and/or greater influx ofmantle magma. The roles of influx of materials through crustal thickening and retro-arc underthrustingneed to be evaluated in future.
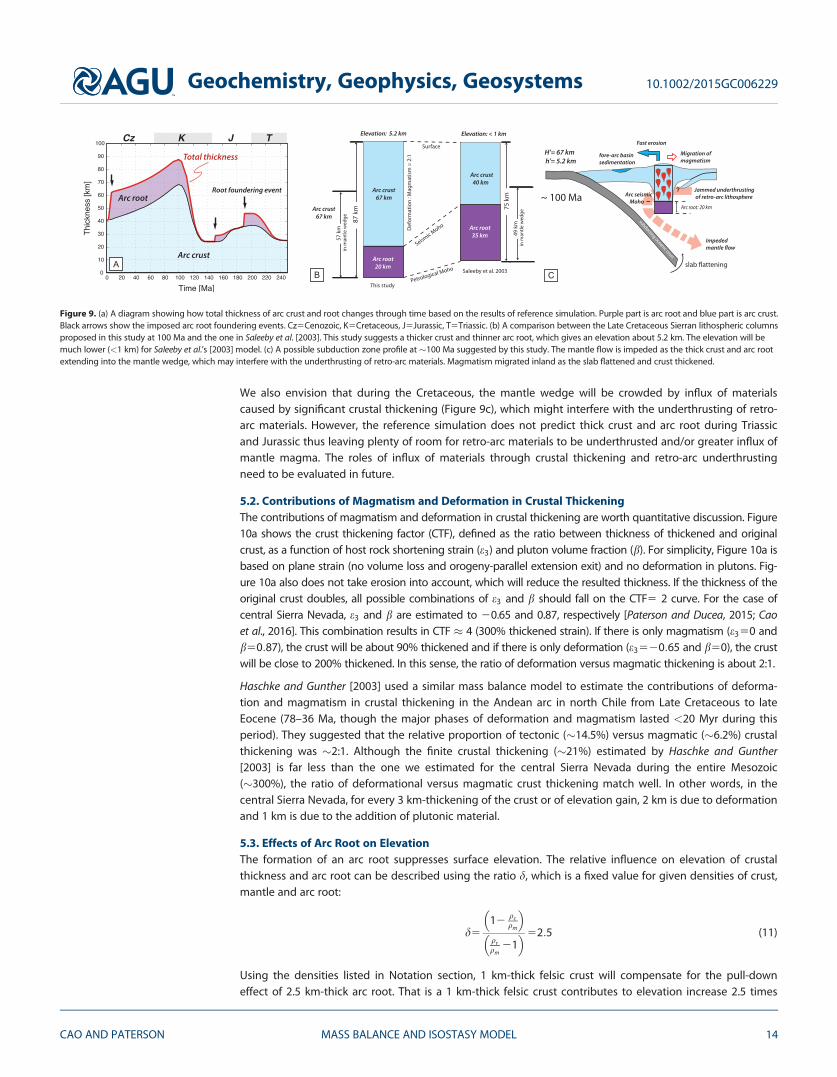
5.2. Contributions of Magmatism and Deformation in Crustal ThickeningThe contributions of magmatism and deformation in crustal thickening are worth quantitative discussion. Figure10a shows the crust thickening factor (CTF), defined as the ratio between thickness of thickened and originalcrust, as a function of host rock shortening strain (e3) and pluton volume fraction (b). For simplicity, Figure 10a isbased on plane strain (no volume loss and orogeny-parallel extension exit) and no deformation in plutons. Fig-ure 10a also does not take erosion into account, which will reduce the resulted thickness. If the thickness of theoriginal crust doubles, all possible combinations of e3 and b should fall on the CTF5 2 curve. For the case ofcentral Sierra Nevada, e3 and b are estimated to 20.65 and 0.87, respectively [Paterson and Ducea, 2015; Caoet al., 2016]. This combination results in CTF � 4 (300% thickened strain). If there is only magmatism (e350 andb50:87), the crust will be about 90% thickened and if there is only deformation (e3520:65 and b50), the crustwill be close to 200% thickened. In this sense, the ratio of deformation versus magmatic thickening is about 2:1.
Haschke and Gunther [2003] used a similar mass balance model to estimate the contributions of deforma-tion and magmatism in crustal thickening in the Andean arc in north Chile from Late Cretaceous to lateEocene (78–36 Ma, though the major phases of deformation and magmatism lasted <20 Myr during thisperiod). They suggested that the relative proportion of tectonic (�14.5%) versus magmatic (�6.2%) crustalthickening was �2:1. Although the finite crustal thickening (�21%) estimated by Haschke and Gunther[2003] is far less than the one we estimated for the central Sierra Nevada during the entire Mesozoic(�300%), the ratio of deformational versus magmatic crust thickening match well. In other words, in thecentral Sierra Nevada, for every 3 km-thickening of the crust or of elevation gain, 2 km is due to deformationand 1 km is due to the addition of plutonic material.
5.3. Effects of Arc Root on ElevationThe formation of an arc root suppresses surface elevation. The relative influence on elevation of crustalthickness and arc root can be described using the ratio d, which is a fixed value for given densities of crust,mantle and arc root:
d512
qcqm
� �qrqm
21� �52:5 (11)
Using the densities listed in Notation section, 1 km-thick felsic crust will compensate for the pull-downeffect of 2.5 km-thick arc root. That is a 1 km-thick felsic crust contributes to elevation increase 2.5 times
Figure 9. (a) A diagram showing how total thickness of arc crust and root changes through time based on the results of reference simulation. Purple part is arc root and blue part is arc crust.Black arrows show the imposed arc root foundering events. Cz5Cenozoic, K5Cretaceous, J5Jurassic, T5Triassic. (b) A comparison between the Late Cretaceous Sierran lithospheric columnsproposed in this study at 100 Ma and the one in Saleeby et al. [2003]. This study suggests a thicker crust and thinner arc root, which gives an elevation about 5.2 km. The elevation will bemuch lower (<1 km) for Saleeby et al.’s [2003] model. (c) A possible subduction zone profile at �100 Ma suggested by this study. The mantle flow is impeded as the thick crust and arc rootextending into the mantle wedge, which may interfere with the underthrusting of retro-arc materials. Magmatism migrated inland as the slab flattened and crust thickened.
Geochemistry, Geophysics, Geosystems 10.1002/2015GC006229
CAO AND PATERSON MASS BALANCE AND ISOSTASY MODEL 14
more than the elevation gain when 1 km-thick arc root founders. Note we also link the magmatism withroot formation via the mass ratio c, and thus the effects of magmatism on elevation increase will be damp-ened due to the formation of an eclogitic root. The mass-of-residue to mass-of-melt ratio (c) can be con-verted to length ratio (cL) assuming constant sectional area:
cL5c � qc
qr50:8c (12)
If cL < d, magmatism will contribute positively to elevation, and if cL > d, the magmatism will pull downthe elevation because the arc root is too thick. If cL5d, there is no net effect of magmatism on elevation. For c5 1–3 used in the model, the cL 50.8–2.4, which means magmatism in our model all contribute positively toelevation. When c53 or cL 52.4, the net effect of magmatism on elevation increase is very small but still pos-itive. This explains why in Set 1 (c53) the elevation has little change in Triassic although magmatismoccurred.
5.4. Model LimitationsOur model employs several simplifications. Constant erosion response time is used throughout Mesozoic andCenozoic, which is unlikely. Global climate has changed significantly during the last 250 Myr [e.g., Berner andKothavala, 1988; Zachos et al., 2004; Zhang et al., 2001; Herman et al., 2013] and the paleo-location of SierraNevada also changed [e.g., Wright et al., 2013]. Since the simulations suggest that the erosion response timehas strong effects on crustal thickness, elevation and erosion rate, the results should be treated as end-member approximations rather than realistic reproductions of crustal thickness, paleo-elevation, etc. A morerealistic approach is to implement erosion response time as a function of paleo-climate and the paleo-location of Sierra Nevada.
Our model does not include gravitational collapse, which may reduce the elevation of orogenic belts andenhance exhumation in addition to surface erosion [e.g., England and McKenzie, 1982; Rey, 2001; Rey et al.,2001; Jadamec et al., 2007]. A simple but effective analytical treatment of gravitational collapse is using a thinviscous sheet model [England and McKenzie, 1982; Jadamec et al., 2007]. In this model, the relative importanceof gravitational collapse increases inversely with the bulk effective viscosity of the crust [Jadamec et al., 2007].For the viscosity of �1022 Pa s for Tibetan crust [England and Molnar, 1997], the surface erosion and gravita-tional collapses can be equally important [Jadamec et al., 2007]. Given that the arc crust is likely to be warmedby magmatism, the effective viscosity of crust should be lower and thus favor gravitational collapse. In thissense, the elevation and crustal thickness shortly after a flare-up should decrease faster with the help of
Figure 10. (a) A diagram showing how crustal thickness increases as a result of pluton volume fraction (b) and finite host rock contractional strain (e3). Plane strain and no erosion areincluded in this diagram. The contours are the Crustal Thickening Factor (CTF), which is simply a ratio between final crustal thickness (H’) and its original thickness (H0): CTF5H0/H0. The redpoint represents the central Sierra Nevada with a CTF � 4 (300% thickened). If there is only magmatism (e350 and b50:87), the crust will be about 90% thickened (CTF � 2) and if there isonly deformation (e3520:65 and b50), the crust will be about 200% thickened (CTF � 3). The ratio of thickening contribution between deformation and magmatism is about 2:1. (b) Adiagram showing time needed to achieve t0:9 for different erosion conditions. Faster erosion 5 shorter erosion response time (sE ). The thickening forcing (F) is applied at 0 Myr and itremains constant. If sE 5 0.5 (blue curve) and 2 Myr (green curve), t0:9 57.6 and 30 Myr, respectively. The erosion rates ( _E ) response to the forcing as _E 5 12e2t=sL
� �F (equation (15)).
Geochemistry, Geophysics, Geosystems 10.1002/2015GC006229
CAO AND PATERSON MASS BALANCE AND ISOSTASY MODEL 15
gravitational collapse. To fully investigate the effect of gravitational collapse in a continental arc setting, athermomechanical model is required.
The critical conditions, timing, and styles of arc root foundering are not well known. Depending on thermo-rheological and compositional conditions of arc root and lithospheric mantle [e.g., Ducea, 2002; Saleebyet al., 2012; Lee, 2014], there are various possible scenarios of root foundering such as Rayleigh-Taylor insta-bility, peeling, and mechanical detachment. Sophisticated numerical simulations are used to investigate thefoundering process [e.g., Le Pourhiet et al., 2006; Saleeby et al., 2012]. If root foundering lasts to several totens of millions years or if there is no root foundering in some cases, the elevation rebound will be moregradual or totally muted. The critical foundering conditions also depend on the thickness of root and thedepth the root reaches during conversion to dense eclogites [Ducea, 2002; Pelletier et al., 2010; Lee et al.,2015]. Since our model does not include the phase transition for crustal material to form eclogites, theeffects of arc roots are underestimated and the elevation estimates here may represent an upper limit.
5.5. Relationship Between Surface Erosion and ThickeningThe model allows us to quantify the relations between erosion, magmatism and deformation. In all simulations,the timing of peak erosion rate always lags behind the peak thickening. A shorter sE (faster erosion) will shortenthe lag time. A simple explanation is that the peak erosion rate corresponds with the maximum crust thickness,which is always achieved after the peak thickening rate since crust thickness continues to grow after the peakthickening rate is reached. We follow Lee et al.’s [2015] equation (7), reorganize our equation (8) into equation(13) and use internal forcing (F) to represent magmatic and deformational thickening together.
dDHdt
5F21sL
DH (13)
DH is the thickened part of crust. sL is the landform relaxation time [Lee et al., 2015]: sL5sE= 12qcqm
� �5 6.6
sE . Since DH5sL _E , equation (13) is equivalent to:
sLd _Edt
5F2 _E (14)
If _E 050 (initial _E at t50), and a constant F is applied at t50. Integrating the above equation, we have:
_E tð Þ5 12e2t=sL
� �F (15)
In equation (15), erosion rate ( _E ) scales with the thickening (F) and approaches but can never be higherthan F (Figure 10b). In this setup, infinite time is needed to achieve long-term steady state ( _E5FÞ or thehighest value of _E . In a practical way, we define that the steady state is reached when _E50:9F. To achieve_E5lF 0 < l < 1ð Þ, the time needed is:
tl5sL � ln1
12l
� �(16)
The time needed to achieve _E50:9F is t0:9, which can be calculated using l50:9 (Figure 10b). We gett0:952:3 sL515:2 sE , which scales with sL and sE . Also, t0:9 is also always achieved after the forcing isapplied (t0:9>0). In our simulations, F is not constant, but the underliying kinetics are the same, the peakerosion rate always lags behind the peak thickening rate, the lag time scales with the sL and sE .
In nature, no orogenic belts have constant forcing. The forcing is always temporally episodic just like theSierra Nevada. However, if the time to achieve steady state (t0:9) is short enough comparing to the durationof an episode of forcing, our analyses shown above should be applicable. An example is Taiwan, where theerosion response time is about 0.5 Myr [Simoes et al., 2010]. Thus t0:957:6 Myr. The ongoing arc-continentcollision of Taiwan started at �12 Ma [Teng, 1990], whose duration is longer than 7.6 Myr. Thus Taiwan islikely to have steady-state exhumation, which is supported by observations [e.g., Suppe, 1981; Willett andBrandon, 2013]. For the Sierran example simulated here, since the forcing is simulated as a Gaussian shape,no constant forcing existed and it declines after 15–30 Myr. No long-term steady state will be achieved inour simulations although transient _E5F is achieved when F is at the waning stage.
The geological implication is that if the erosion response time is shorter, erosion rate will more closely trackthe crustal thickening in terms of timing and magnitude. If erosion catches up to the thickening rate, then it
Geochemistry, Geophysics, Geosystems 10.1002/2015GC006229
CAO AND PATERSON MASS BALANCE AND ISOSTASY MODEL 16
will reach steady state and the erosion rate and elevation won’t change with time unless the forcing anderosion condition changes. To achieve a long-term steady state, t0:9 should be much shorter than the dura-tion of the forcing, which has little to do with the magnitude of forcing itself.
Once the forcing terminates, erosion will cause the exponential decay of the elevation with time. The timespan needed for a certain elevation to decrease to its 1/e value (e is base of natural logarithm, 1/e � 34%)after the thickening forcing ceases, is equal to the landform relaxation time sL [Lee et al., 2015]. For example,if sE 55 Myr, to reduce an elevation to about 10% its height, about two sL or about 66 Myr is needed (536:632566Þ. This explains the long tail of gradual decrease of elevation and crustal thickness during theCenozoic in simulation Set 1–4 when sE � 5 Myr. As suggested by Lee et al. [2015], a mountain range main-tains a relatively high elevation for a long period of time (several tens of million years) after forcing ceases.The larger the sE is, the longer time needed to reduce elevation.
6. Conclusions
The mass balance and isostasy model presented in this study catches the first-order evolution of Sierran ele-vation, crustal thickness and erosion rate from Mesozoic to present. Our model favors moderate Triassiccrustal thickening and Jurassic crustal thinning followed by a strong Cretaceous crustal thickening, whichresults in a 60–70 km-thick crust, a 20 km-thick arc eclogitic root, and �5 km elevation in the Late Creta-ceous. The thickened crust may initially promote magma generation by downward transport materials intothe magma source region. This process may eventually jam the mantle wedge, affect the retro-arc under-thrusting and reduce arc magmatism. Quantitative analyses based on this model suggest that for the cen-tral Sierra Nevada, the contribution of contractional deformation to the crustal thickening is twice that ofthe magmatism. The erosion rate increases with the magnitude of thickening, but its peak rate always lagsbehind the peak rate of forcing. To reach a long-term steady state (erosion rate � crustal thickening rate),the time should be shorter than the duration of the forcing, which requires faster erosion conditions. Themagmatism-associated arc root will dampen the elevation increases caused by the magmatic thickening.
Notation
H Crustal thickness, km.H0 Initial crustal thickness, km.H0 Crustal thickness after magmatism or deformation, km.DH Thickened part of crust, km.h Elevation, km.h0 Initial elevation, km.R Thickness of arc root, km.b Volumetric fraction of magma.e1 Deformational thickening strain.e3 Deformational shortening strain.u Percentage of volume loss and/or are-parallel extension of host rocks._HM1D Combined magmatic and deformational thickening rate, km/Myr.c Mass-of-root to mass-of-melt ratio for arc root.cL Length-of-root to length-of-melt ratio for arc root, cL5 c � qc=qr :
d A ratio showing the influence to elevation of crustal thickness and arc root,d5 12qc=qmð Þ= qr=qm 21ð Þ.
_E Erosion rate, km/Myr.F Forcing of crustal thickening, km/Myr.sE Erosion response time, Myr.sL Landscape relaxation time, sL5sE= 12qc=qmð Þ; Myr.ke Bedrock erodibility, m21.p Precipitation rate, mm/yr.t Time, Myr.tl Time for _E to reach to lF; Myr.l A factor for solving tl 0 < l < 1ð Þ
Geochemistry, Geophysics, Geosystems 10.1002/2015GC006229
CAO AND PATERSON MASS BALANCE AND ISOSTASY MODEL 17
qc Density of crust (2.8 3 103 kg/m3), kg/m3.qm Density of lithospheric mantle (3.3 3 103 kg/m3), kg/m3.qr Density of arc root (3.5 3 103 kg/m3), kg/m3.
ReferencesAllmendinger, R. W., T. E. Jordan, S. M. Kay, and B. L. Isacks (1997), The evolution of the Altiplano-Puna plateau of the Central Andes, Annu.
Rev. Earth Planet. Sci., 251, 139–174.Annen, C., J. D. Blundy, and R. S. J. Sparks (2006), The genesis of intermediate and silicic magmas in deep crustal hot zones, J. Petrol., 47,
505–539.Barton, M. D., D. A. Battles, G. E. Debout, R. C. Capo, J. N. Christensen, S. R. Davis, R. B. Hanson, C. J. Michelsen, and H. E. Trim (1988), Meso-
zoic contact metamorphism in the western United States, in Metamorphism and Crustal Evolution of the Western United States, vol. 7,edited by W. G. Ernst, pp. 110–178, Prentice Hall, Englewood Cliffs, N. J.
Beaumont, C., R. A. Jamieson, M. H. Nguyen, and B. Lee (2001), Himalayan tectonics explained by extrusion of a low-viscosity crustal chan-nel coupled to focused surface denudation, Nature, 414(6865), 738–742.
Berner, R. A., and Z. Kothavala (2001), GEOCARB III: A revised model of atmospheric CO2 over Phanerozoic time, Am. J. Sci., 301(2), 182–204.Busby-Spera, C. J. (1988), Speculative tectonic model for the early Mesozoic arc of the southwest Cordilleran United States, Geology, 16,
1121–1125.California Geological Survey (2006), Simplified Geologic Map of California, sheet 57, scale 1:2,250,000, Calif. Geol. Surv., Sacramento, Calif.Cao, W., S. R. Paterson, V. Memeti, R. Mundil, L. J. Anderson, and K. Schmidt (2015), Tracking paleo-strain field in a continental arc: A study
of incremental and finite strain in Mesozoic plutons and host rocks, respectively in central Sierra Nevada, California, Lithosphere, 7,296–320, doi:10.1130/L389.1.
Cao, W., S. R. Paterson, J. Saleeby, and S. Zalunardo (2016), Bulk arc strain, crustal thickening, magma emplacement, and mass balances inthe Mesozoic Sierra Nevada arc, J. Struct. Geol., 84, 14–30, doi:10.1016/j.jsg.2015.11.002.
Cassel, E. J., S. A. Graham, and C. P. Chamberlain (2009), Cenozoic tectonic and topographic evolution of the northern Sierra Nevada, Cali-fornia, through stable isotope paleoaltimetry in volcanic glass, Geology, 37(6), 547–550.
Cecil, M. R., M. N. Ducea, P. W. Reiners, and C. G. Chase (2006), Cenozoic exhumation of the northern Sierra Nevada, California, from (U-Th)/He thermochronology, Geol. Soc. Am. Bull., 118, 1481–1488, doi:10.1130/B25876.1.
Chapman, J. B., M. N. Ducea, P.G. DeCelles, and L. Profeta (2015a), Tracking changes in crustal thickness during orogenic evolution with Sr/Y: An example from the North American Cordillera. Geology, 43, 919–922, doi:10.1130/G36996.1
Chapman, A. D., W. G. Ernst, E. Gottlieb, V. Powerman, and E. P. Metzger (2015b), Detrital zircon geochronology of Neoproterozoic–LowerCambrian passive-margin strata of the White-Inyo Range, east-central California: Implications for the Mojave–Snow Lake fault hypothe-sis, Geol. Soc. Am. Bull., 127, 926–944, doi:10.1130/B31142.1.
Chin, E. J., C.-T. A. Lee, and J. Blichert-Toft (2015), Growth of upper plate lithosphere controls tempo of arc magmatism: Constraints fromAl-diffusion kinetics and coupled Lu-Hf and Sm-Nd chronology, Geochem. Perspect. Lett., 1, 20–32, doi:10.7185/geochemlet.1503.
DeCelles, P. G., and S. A. Graham (2015), Cyclical processes in the North American Cordilleran orogenic system, Geology, 43, 499–502.DeCelles, P. G., M. N. Ducea, P. Kapp, and G. Zandt (2009), Cyclicity in Cordilleran orogenic systems, Nat. Geosci., 2, 251–157.Dickinson, W. R. (2004), Evolution of the North American Cordillera, Annu. Rev. Earth Planet. Sci., 32, 13–45.Ducea, M. N. (2001), The California Arc: Thick granitic batholiths, eclogitic residues, lithospheric-scale thrusting, and magmatic flare-ups,
GSA Today, 11, 4–10.Ducea, M. N. (2002), Constraints on the bulk composition and root foundering rates of continental arcs: A California arc perspective, J. Geo-
phys. Res., 107(B11), 2304, doi:10.1029/2001JB000643.Dumitru, T. A. (1990), Subnormal Cenozoic geothermal gradients in the extinct Sierra Nevada magmatic arc: Consequences of Laramide
and post-Laramide shallow angle subduction, J. Geophys. Res., 95, 4925–4941, doi:10.1029/JB095iB04p04925.Dunne, G. C., and J. D. Walker (2004), Structure and evolution of the East Sierran thrust system, east central California, Tectonics, 23,
TC4012, doi:10.1029/2002TC001478.England, P. and D. McKenzie (1982), A thin viscous sheet model for continental deformation, Geophys. J. Int., 70, 295–321.England, P. and P. Molnar (1997), Active deformation of Asia: from kinematics to dynamics, Science, 278, 647–650, doi:10.1126/
science.278.5338.647Fielding, E. J. (1996), Tibet uplift and erosion, Tectonophysics, 260(1), 55–84.Fliedner, M. M., S. L. Klemperer, and N. I. Christensen (2000), Three-dimensional seismic model of the Sierra Nevada arc California and its
implications for crustal and upper mantle composition, J. Geophys. Res., 105, 10889–10921, doi:10.1029/2000JB900029.Gilbert, H., S. Beck, and G. Zandt (2006), Lithospheric and upper mantle structure of central Chile and Argentina, Geophys. J. Int., 165, 383–
398, doi:10.1111/j.1365-246X.2006.02867.x.Griffin, W. L. and S. Y. O’Reilly (1987), Is the continental Moho the crust-mantle boundary?, Geology, 15, 241–244.Haschke, M., and A. Gunther (2003), Balancing crustal thickening in arcs by tectonic vs. magmatic means, Geology, 31, 933–936.Herman, F., D. Seward, P. G. Valla, A. Carter, B. Kohn, S. D. Willett, and T. A. Ehlers (2013), Worldwide acceleration of mountain erosion under
a cooling climate, Nature, 504, 423–426, doi:10.1038/nature12877.Horodyskyj, U. N., C.-T. A. Lee, and M. N. Ducea (2007), Similarities between Archean high MgO eclogites and Phanerozoic arc-eclogite
cumulates and the role of arcs in Archean continent formation, Earth Planet. Sci. Lett., 256(3), 510–520.House, M. A., B. P. Wernicke, K. A. Farley, and T. A. Dumitru (1997), Cenozoic thermal evolution of the central Sierra Nevada, California, from
(U-Th)/He thermochronometry, Earth Planet. Sci. Lett., 151, 167–179, doi:10.1016/S0012-821X(97)81846-8.House, M. A., B. P. Wernicke, and K. A. Farley (2001), Paleogeomorphology of the Sierra Nevada, California, from the (U-Th)/He ages in apa-
tite, American Journal of Science, 301, 77–102, doi:10.2475/ajs.301.2.77.Isacks, B. L. (1988), Uplift of the Central Andean Plateau and bending of the Bolivian Orocline, J. Geophys. Res., 93, 3211–3231.Jadamec, M. A., D. L. Turcotte, and P. Howell (2007), Analytic models for orogenic collapse, Tectonophysics, 435, 1–12.Jones, C. H., G. L. Farmer, and J. Unruh (2004), Tectonics of Pliocene removal of lithosphere of the Sierra Nevada, California, Geol. Soc. Am.
Bull., 116, 1408–1422.Karlstrom, L., C.-T. A. Lee, and M. Manga (2014), The role of magmatically driven lithospheric thickening on arc front migration, Geochem.
Geophys. Geosyst., 15, 2655–2675, doi:10.1002/2014GC005355.
AcknowledgmentsWe acknowledge support fromNational Science Foundation grantsEAR-0537892 and EAR-0073943awarded to Paterson and U.S.Geological Survey EDMAP GrantG12AC20178, Geological Society ofAmerica Graduate Student ResearchGrants awarded to Cao. Cao thanksCin-Ty Lee for the inspiring discussionon isostasy, Hehe Jiang and MikeFarner on erosion timescale. We thanktwo anonymous reviewers and P. Reyfor their constructive comments.Review #1 is especially thanked for hisvery detailed comments, which greatlyhelped to improve the quality of themanuscript. Editor Janne Blichert-Toftis thanked for handling thissubmission. Supporting information ofMatlab script can be found in SI file.They can also be obtained from Cao(email: [email protected]).
Geochemistry, Geophysics, Geosystems 10.1002/2015GC006229
CAO AND PATERSON MASS BALANCE AND ISOSTASY MODEL 18

Lee, C.-T. A. (2014), The physics and chemistry of recycling lower continental crust, in Treatise of Geochemistry, H. Holland and K. Turekian,2nd ed., 423–456, Elsevier, Waltham, Mass., doi:10.1016/B978-0-08-095975-7.00314-4.
Lee, C.-T. A., X. Cheng, and U. Horodyskyj (2006), The development and refinement of continental arcs by primary basaltic magmatism, gar-net pyroxenite accumulation, basaltic recharge and delamination: Insights from the Sierra Nevada, California, Contrib. Mineral. Petrol.,151(2), 222–242.
Lee, C. T. A., S. Thurner, S. R. Paterson, and W. Cao (2015), The rise and fall of continental arcs: Interplays between magmatism, uplift,weathering, and climate, Earth Planet. Sci. Lett., 425, 105–119.
Le Pourhiet, L., M. Gurnis J. B. Saleeby (2006), Mantle instability beneath the Sierra Nevada Mountains in California and Death Valley exten-sion, Earth Planet. Sci. Lett., 251, 104–119, doi:10.1016/j.epsl.2006.08.028.
McPhillips, D., and M. T. Brandon (2012), Topographic evolution of the Sierra Nevada measured directly by inversion of low-temperaturethermochronology, Am. J. Sci., 312, 90–116.
Mix, H. T., D. E. Ibarra, A. Mulch, S. A. Graham and C. P. Chamberlain (2016), A hot and high Eocene Sierra Nevada, Geol. Soc. Am. Bull., 128,531–542, doi:10.1130/B31294.1.
Molnar, P., W. R. Boos, and D. S. Battisti (2010), Orographic controls on climate and paleoclimate of Asia: Thermal and mechanical roles forthe Tibetan Plateau, Annu. Rev. Earth Planet. Sci., 38(1), 77.
Nadin, E. S., and J. B. Saleeby (2008), Disruption of regional primary structure of the Sierra Nevada batholith by the Kern Canyon fault sys-tem, California, Geol. Soc. Am. Spec. Pap., 438, 429–454.
NOAA National Centers for Environmental Information (2015), State of the Climate: Global Analysis for Annual 2014. [Available at http://www.ncdc.noaa.gov/sotc/global/201413, last accessed 11 Dec. 2015.]
Paterson, S. R., and M. N. Ducea (2015), Arc magmatic tempos: Gathering the evidence, Elements, 11, 91–98.Paterson, S. R., and D. W. Farris (2008), Downward host rock transport and the formation of rim monoclines during the emplacement of
Cordilleran batholiths, Trans. R. Soc. Edinburgh Earth Sci., 97, 397–413, doi:10.1017/S026359330000153X.Paterson, S. R., V. Memeti, J. L. Anderson, W. Cao, J. S. Lackey, K. D. Putirka, R. B. Miller, J. S. Miller, and R. Mundil (2014), Day 6: Overview of
arc processes and tempos, GSA Field Guides, 34, 87–116, doi:10.1130/2014.0034(06).Pelletier, J. D., P. G. DeCelles, and G. Zandt (2010), Relationships among climate, erosion, topography, and delamination in the Andes: A
numerical modeling investigation, Geology, 38, 259–262, doi:10.1130/G30755.1.Page, M. A., and C. P. Chamberlain (2002), Stable isotopic evidence for a pre-Middle Miocene rain shadow in the western Basin and Range:
Implications for the pa- leotopography of the Sierra Nevada, Tectonics, 21(4), 1034, doi:10.1029/2001TC001303.Profeta, L., M. N. Ducea, J. B. Chapman, S. R. Paterson, S. M. H. Gonzales, M. Kirsch, L. Peterscu, and P. G. DeCelles (2015), Quantifying crustal
thickness over time in magmatic arcs, Sci. Rep., 5, 1–7.Ranalli, G. (1995), Rheology of the Earth, Chapman and Hall, London, U. K.Rey, P. (2001), From lithospheric thickening and divergent collapse to active continental rifting, Geol. Soc. Spec. Publ., 184, 77–88.Rey, P., O. Vanderhaeghe, and C. Teyssier (2001), Gravitational collapse of the continental crust: Definition, regimes and modes, Tectono-
physics, 342, 435–449.Saleeby, J. B. (2003), Segmentation of the Laramide Slab-evidence from the southern Sierra Nevada region, Geol. Soc. Am. Bull., 115, 655–
668, doi:10.1130/0016-7606(2003)115<0655:SOTLSF>2.0.CO;2.Saleeby, J. B., and G. Dunne (2015), Temporal and tectonic relations of early Mesozoic arc magmatism, southern Sierra Nevada, California,
in Late Jurassic Margin of the Laurasia—A Record of Faulting Accommodating Plate Rotation, edited by T. H. Anderson et al., Geol. Soc.Am. Spec. Pap., 513, 223–268, Geol. Soc. Amer., Denver, Colo., doi:10.1130/2015.2513(05).
Saleeby, J. B., and M. N. Ducea, and K. D. Clemens (2003), Production and loss of high-density batholithic root, southern Sierra Nevada,California, Tectonics, 22(6), 1064, doi:10.1029/2002TC001374.
Saleeby, J. B., L. Le Pourhiet, Z. Saleeby, and M. Gurnis (2012), Epeirogenic transients related to mantle lithosphere removal in the southernSierra Nevada region, California, part I: Implications of thermomechanical modeling, Geosphere, 8, 1286–1309.
Schweickert, R. A., and M. M. Lahren (2006), Geologic evolution of Saddlebag Lake pendant, eastern Sierra Nevada, California: Tectonicimplications, in Using Stratigraphy, Sedimentology, and Geochemistry to Unravel the Geologic History of the Southwestern Cordillera: PacificSection, edited by G. Girty, and J. D. Cooper, Soc. for Sediment. Geol., Fullerton, Calif.
Simoes, M., J. Braun, and S. Bonnet (2010), Continental-scale erosion and transport laws: A new approach to quantitatively investigatemacroscale landscapes and associated sediment fluxes over the geological past, Geochem. Geophys. Geosyst. 11, Q09001.
Strecker, M. R., R. Alonso, B. Bookhagen, B. Carrapa, I. Coutand, M. P. Hain, G. E Hilley, E. Mortimer, L. Schoenbohm and E. R. Sobel (2009),Does the topographic distribution of the central Andean Puna Plateau result from climatic or geodynamic processes?, Geology, 37(7),643–646.
Suppe, J. (1981), Mechanics of mountain building and metamorphism in Taiwan, Mem. Geol. Soc. China, 4, 67–89.Taboada, A., L. A. Rivera, A. Fuenzalida, A., Cisternas, H. Philip, H. Bijwaard, J. Olaya, and C. Rivera (2000), Geodynamics of the northern
Andes: Subductions and intracontinental deformation (Colombia), Tectonics, 19, 787–813.Teng, L. S. (1990), Geotectonic evolution of late Cenozoic arc-continent collision in Taiwan, Tectonophysics, 183(1), 57–76.Tobisch, O. T., and R. S. Fiske (1982), Repeated parallel deformation in part of the eastern Sierra Nevada, California and its implications for
dating structural events, J. Struct. Geol., 4(2), 177–195.Tobisch, O. T., R. S. Fiske, J. B. Saleeby, E. Holt, and S. S. Sorensen (2000), Steep tilting of metavolcanic rocks by multiple mechanisms,
central Sierra Nevada, California, Geol. Soc. Am. Bull., 112, 1043–1058.Unruh, J. R. (1991), The uplift of the Sierra Nevada and implications for late Cenozoic epeirogeny in the western Cordillera, Geol. Soc. Am.
Bull., 103, 1395–1404.Wakabayashi, J., and T. L. Sawyer (2001), Stream incision, tectonics, uplift, and evolution of topography of the Sierra Nevada, California,
J. Geol., 109, 539–562.Willett, S. D., and M. T. Brandon (2002), On steady states in mountain belts, Geology, 30, 175–178.Wright, N., S. Zahirovic, R. D. M€uller, and M. Seton (2013), Towards community-driven paleogeographic reconstructions: Integrating open-
access paleogeographic and paleobiology data with plate tectonics, Biogeosciences, 10(3), 1529–1541.Zachos, J., M. Pagani, L. Sloan, E. Thomas, and K. Billups (2001), Trends, rhythms, and aberrations in global climate 65 Ma to present, Sci-
ence, 292, 686–693.Zandt, G., H. Gilbert, T. J. Owens, M. N. Ducea, J. Saleeby, and C. H. Jones (2004), Active foundering of a continental arc root beneath the
southern Sierra Nevada in California, Nature, 431, 41–46.Zhang, P., P. Molnar, and W. R. Downs (2001), Increased sedimentation rates and grain sizes 2 6 4 Myr ago due to the influence of climate
change on erosion rates, Nature, 410, 891–897.
Geochemistry, Geophysics, Geosystems 10.1002/2015GC006229
CAO AND PATERSON MASS BALANCE AND ISOSTASY MODEL 19