Embed Size (px)
Citation preview
Clinical Neurophysiology 122 (2011) 2139–2150
Contents lists available at ScienceDirect
Clinical Neurophysiology
journal homepage: www.elsevier .com/locate /c l inph
A machine learning approach for distinguishing age of infants using auditoryevoked potentials
Maryam Ravan a,⇑, James P. Reilly a, Laurel J. Trainor b, Ahmad Khodayari-Rostamabad a
a Department of Electrical and Computer Engineering, McMaster University, Hamilton, ON, Canadab Department of Psychology, Neuroscience and Behavior, McMaster University, Hamilton, ON, Canada
a r t i c l e i n f o
Article history:Accepted 5 April 2011Available online 14 May 2011
Keywords:Age group determinationMachine learningElectroencephalogram (EEG)Event related potentials (ERPs)Feature extractionClassificationWavelet coefficients
1388-2457/$36.00 � 2011 International Federation odoi:10.1016/j.clinph.2011.04.002
⇑ Corresponding author. Address: 1280 Main StreetL8S 4K1. Tel.: +1 905 515 9360.
E-mail address: [email protected] (M. Rav
h i g h l i g h t s
� We demonstrate that machine learning algorithms can be used to classify individual subjects by agegroup.� Three age groups (6-month, 12-month, and adult) are classified based on auditory event-related poten-tials (ERPs).� The method is unique in that it assumes no a priori structure, such as the composition of ERP compo-nents, on the ERP signal.� A potential clinical application is the identification of abnormal neural development of infants.
a b s t r a c t
Objective: To develop a high performance machine learning (ML) approach for predicting the age andconsequently the state of brain development of infants, based on their event related potentials (ERPs)in response to an auditory stimulus.Methods: The ERP responses of twenty-nine 6-month-olds, nineteen 12-month-olds and 10 adults to anauditory stimulus were derived from electroencephalogram (EEG) recordings. The most relevant waveletcoefficients corresponding to the first- and second-order moment sequences of the ERP signals were thenidentified using a feature selection scheme that made no a priori assumptions about the features of inter-est. These features are then fed into a classifier for determination of age group.Results: We verified that ERP data could yield features that discriminate the age group of individual sub-jects with high reliability. A low dimensional representation of the selected feature vectors show signif-icant clustering behavior corresponding to the subject age group. The performance of the proposed agegroup prediction scheme was evaluated using the leave-one-out cross validation method and found toexceed 90% accuracy.Conclusions: This study indicates that ERP responses to an acoustic stimulus can be used to predict theage and consequently the state of brain development of infants.Significance: This study is of fundamental scientific significance in demonstrating that a machine classi-fication algorithm with no a priori assumptions can classify ERP responses according to age and with fur-ther work, potentially provide useful clues in the understanding of the development of the human brain.A potential clinical use for the proposed methodology is the identification of developmental delay: anabnormal condition may be suspected if the age estimated by the proposed technique is significantly lessthan the chronological age of the subject.� 2011 International Federation of Clinical Neurophysiology. Published by Elsevier Ireland Ltd. All rights
reserved.
1. Introduction
Electroencephalography (EEG) has become a prominent methodfor studying auditory perception in infants (e.g., de Haan, 2007;
f Clinical Neurophysiology. Publish
West, Hamilton, ON, Canada
an).
Trainor, 2008). The EEG is a non-invasive procedure that allowsan experimenter to record brain responses from multipleelectrodes on the scalp. The event-related potential (ERP) is ob-tained from the EEG and is any stereotyped electrophysiological re-sponse to an internal or external stimulus.
ERPs can also be used to examine auditory perception in veryyoung infants since they do not require any overt behavioural re-sponse or direct attention (de Boer et al., 2007; Kropotov et al.,
ed by Elsevier Ireland Ltd. All rights reserved.
2140 M. Ravan et al. / Clinical Neurophysiology 122 (2011) 2139–2150
1995). They are one of the few methods that can easily and safelybe used to study the rapid development of the brain in infants, andhave led to exciting discoveries about human brain functioningand the neural basis of cognition. The evoked response from anauditory stimulus consists of a series of positive and negativedeflections (components) in the recorded EEG signal that occur atcharacteristic times with respect to the time of occurrence of thestimulus. Responses to the repeated presentation of the same stim-ulus are typically averaged together in order to reduce noise. Theresulting waveforms reflect the underlying neural activity fromprocessing the stimulus.
ERPs consist of many different components. The componentspresent and their latencies and morphologies change greatly withdevelopment (Taylor and Baldeweg, 2002; Trainor, 2008). Further-more, at a particular developmental stage, an ERP component maybe affected by the type of auditory stimulus presented, the rate ofpresentation, and state of the subject (asleep, awake, alert, attend-ing, etc.) to a much larger degree than in adulthood. Thus, thedetermination of the subject’s age based solely on an analysis ofthe ERP components is a complex process (e.g., Ceponiené et al.,2002; Choudhury and Benasich, 2011; de Haan, 2007; He et al.,2007, 2009a,b; He and Trainor, 2009; Kushnerenko et al.,2002a,b; Morr et al., 2002; Trainor et al., 2001, 2003). One compo-nent of the ERP that can be elicited across a wide age range byauditory stimulation is the mismatch negativity (MMN) response(e.g., Näätänen et al., 2007; Picton et al., 2000). MMN is elicitedwhen a repeating auditory stimulus is occasionally altered in somemanner. Even before the adult-like MMN is elicited, infants pro-duce mismatch responses (MMRs) to a change in stimulus. Forexample, He et al. (2007) found that 2-month-olds generated aslow positive MMR in response to occasional pitch changes in arepeating piano tone, whereas 3- and 4-month-old infants gener-ated negative MMRs similar to the adult MMN in response to thissimple pitch change. In another study, Tew et al. (2009) used thesame method as He et al. (2007) to examine whether young infantscould detect changes in the relative pitch of a melody in transposi-tion. In this study the stimulus consisted of a 4-note melody thatwas transposed (starting on a different note on different trials) torelated keys from trial to trial. Occasionally the last note was chan-ged by a semitone (1/12th octave). This study also demonstrateddifferent MMRs with age, but for this more complex stimulus, 6-month-old infants produced positive slow MMR and adults fasterMMN. Thus, these previous studies have suggested that a conclu-sive determination of age based solely on an analysis of the ERPcomponents is complicated by many factors, including the fact thatthe ERP patterns which discriminate age vary according to thecomplexity of the stimulus.
Furthermore, because infants will only remain awake and con-tent, and therefore testable, for a short period of time, in both ofthe described developmental MMR studies the differences acrossage in the MMRs were not discernible in individual infants. There-fore, averaging over all ERP trials of all subjects in each age groupwas performed to improve the signal-to-noise ratio so that the dif-ference in the MMRs across age could be observed. This averagingprocedure determines only the aggregate behaviour of the entiregroup, but for clinical purposes, reliable categorization of matura-tion is needed in individuals. In this paper, we introduce a new ap-proach that enables the classification into age group for singlesubjects that, unlike previous studies, is not explicitly based onan ERP model and hence incorporates no a priori assumptionsabout the ERP components present. The proposed approach poten-tially exploits all the relevant information present in the ERP sig-nal, whereas determining age by characterizing only the ERPcomponents may result in some information present in the ERPbeing lost. For example, as we see later, the proposed method di-rectly incorporates features relating to cross-couplings between
electrodes, whereas previous methods do not explicitly use thisinformation.
The fact that the proposed methodology can classify individualsubjects enables several important clinical applications inpsychology, psychiatry and neurology, such as the diagnosis ofbrain injuries, disorders in the central nervous system, or delayedneurological development. The present approach differs from pre-vious clinical approaches (e.g., Friedrich and Friederici, 2006; Gut-torm et al., 2001) in that it does not select a priori aspects of theERP to examine. In the present case, since the method applies todetermination of age, an important question such as abnormaldevelopment is indicated when the chronological age of an infantis considerably greater than the age determined by the classifica-tion procedure. Additionally, from a theoretical perspective, thefeatures selected by the machine learning process that are highlyindicative of age could potentially give us important clues in theunderstanding of infant brain development.
The machine learning field evolved from the broader field of arti-ficial intelligence, which aims to mimic intelligent abilities of humansby machines. One of the goals of machine learning is to automaticallyextract salient features from a given data set that are most statisti-cally dependent upon the outcome variable, which in this case isthe age group of the subject. These features are then applied to ana-lyze new cases. Hence, learning is not only a question of remembering(or learning) but also of generalization to unseen cases.
Machine learning methods have been used previously in theanalysis of EEG signals for various medical applications. For exam-ple, Greene et al. (2007) developed a method for the detection ofseizures in infants. The system uses a linear discriminant classifierto classify ictal and interictal epochs of 1-min duration. Also,Ghosh-Dastidar et al. (2008) used the cosine ‘radial basis functionneural network’ (RBFNN) model to classify the EEG of normal sub-jects versus epileptic subjects during ictal and interictal periods. Inanother study, Krajca1 et al. (2007) developed a new method forautomatic sleep stage detection in neonates, based on time profileprocessing using a fuzzy c-means algorithm. Khodayari-Rostama-bad et al. (2010) used machine learning methods to predict the re-sponse of schizophrenic subjects to the potentially harmful buteffective anti-psychotic drug clozapine. In the present paper, weshow that a machine learning method can classify ERP data by age.
2. Methods
2.1. The EEG data used for analysis
The objective of the current classification problem is the assign-ment of subjects to one of the three predetermined age groups,corresponding to 6- and 12-month-old infants, and adults. Theseage groups are of interest because phoneme processing in speech(e.g., Curtin and Werker, 2007; Kuhl, 2008) and rhythm processingin music (e.g., Hannon and Trainor, 2007) become specialized be-tween 6 and 12 months of age for the particular language and mu-sical system the infant is exposed to. A total of 58 healthy subjectsconsisting of twenty-nine 6-month-olds, (15 male, 14 female;mean age = 6 months and 4 days, SD = 28 days) nineteen 12-month-olds (9 male, 10 female; mean age = 11 months and18 days, SD = 25.7 days), and 10 adults (2 male, 8 female; meanage = 24, SD = 2.86 years) with no known hearing deficits were in-cluded in the present study. Infants were recruited as part of theMcMaster Infant database from hospitals in the Hamilton, Ontario,Canada area. It should be noted that the machine learning algo-rithm is quite robust for different sample sizes between groups.
The stimulus files were 300 ms grand piano timbre tones cre-ated through MIDI and the synthesizer program, Creative SB (Cre-ative Technology Ltd., CA). The sound intensity of each tone wasnormalized using Adobe Audition (Adobe Systems Incorporated,
M. Ravan et al. / Clinical Neurophysiology 122 (2011) 2139–2150 2141
San Jose, CA). The tones were then combined to produce a standardshort 4-note (1200 ms) melody consisting of two rising intervalsfollowed by a falling interval (E F G C) using MATLAB (The Math-Works, Inc., Natick, MA). The melodies were presented in 20 differ-ent transpositions, with starting notes ranging between G3(294 Hz) and D5 (784 Hz). Each successive transposition was al-ways to a related key (i.e., up or down a perfect 5th, 7/12 octaveor a perfect 4th, 5/12 octave) from the current key, in a randomizedorder. Occasional deviant trials contained a wrong last note, butthese were not analyzed in the present paper. Melodies were sep-arated by a 700 ms inter-stimulus interval (ISI). The 200 ms priorto melody onset was used as the pre-stimulus baseline reference.
The stimuli were played using E-prime 1.2 software (Psychol-ogy Software Tools, Inc., Pittsburgh, PA) from a Dell OptiPlex280computer through a speaker (WestSun Jason Sound JS1P63, Missis-sauga, ON) which was located approximately 1 m in front of thesubject, at a level of 70 dB(A). The adults were instructed to sit qui-etly and as still as possible for the duration on the experiment, andinfants were kept as still as possible. A silent movie was played tokeep the subjects happy and still. Attention to the auditory stimuliwas not necessary to elicit the desired EEG samples.
The EEGs were recorded with a sampling frequency of 1000 Hzusing HydroCel GSN (HCGSN) sensor nets (Electrical Geodesics,Inc., Eugene, OR) with 128 electrodes. The data were then filteredcontinuously offline using band-pass filter settings of 0.5–20 Hzby first passing the data through a Blackman-weighted low-passFIR filter of length 195 with a cut-off frequency of 20 Hz and thenpassing the resulting data through a second Blackman-weightedhigh-pass FIR filter of length 7683 with a cut-off frequency of0.5 Hz. Both of these filters have a very flat frequency responseand linear phase in the pass-band, thus minimizing distortion inthe output signal.
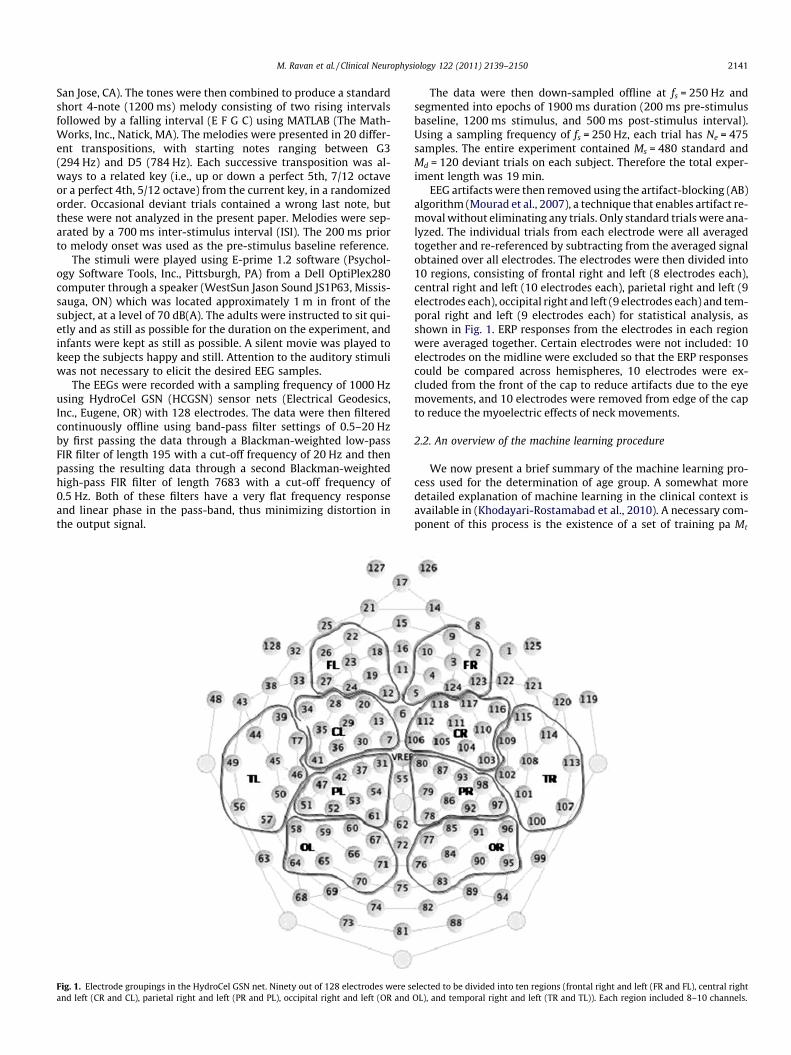
Fig. 1. Electrode groupings in the HydroCel GSN net. Ninety out of 128 electrodes were sand left (CR and CL), parietal right and left (PR and PL), occipital right and left (OR and
The data were then down-sampled offline at fs = 250 Hz andsegmented into epochs of 1900 ms duration (200 ms pre-stimulusbaseline, 1200 ms stimulus, and 500 ms post-stimulus interval).Using a sampling frequency of fs = 250 Hz, each trial has Ne = 475samples. The entire experiment contained Ms = 480 standard andMd = 120 deviant trials on each subject. Therefore the total exper-iment length was 19 min.
EEG artifacts were then removed using the artifact-blocking (AB)algorithm (Mourad et al., 2007), a technique that enables artifact re-moval without eliminating any trials. Only standard trials were ana-lyzed. The individual trials from each electrode were all averagedtogether and re-referenced by subtracting from the averaged signalobtained over all electrodes. The electrodes were then divided into10 regions, consisting of frontal right and left (8 electrodes each),central right and left (10 electrodes each), parietal right and left (9electrodes each), occipital right and left (9 electrodes each) and tem-poral right and left (9 electrodes each) for statistical analysis, asshown in Fig. 1. ERP responses from the electrodes in each regionwere averaged together. Certain electrodes were not included: 10electrodes on the midline were excluded so that the ERP responsescould be compared across hemispheres, 10 electrodes were ex-cluded from the front of the cap to reduce artifacts due to the eyemovements, and 10 electrodes were removed from edge of the capto reduce the myoelectric effects of neck movements.
2.2. An overview of the machine learning procedure
We now present a brief summary of the machine learning pro-cess used for the determination of age group. A somewhat moredetailed explanation of machine learning in the clinical context isavailable in (Khodayari-Rostamabad et al., 2010). A necessary com-ponent of this process is the existence of a set of training pa Mt
elected to be divided into ten regions (frontal right and left (FR and FL), central rightOL), and temporal right and left (TR and TL)). Each region included 8–10 channels.
2142 M. Ravan et al. / Clinical Neurophysiology 122 (2011) 2139–2150
tterns (subjects). In our case, this set consists of the ERP data of all10 regions in addition to the age group designation (target vari-ables) yi 2 C; i ¼ 1; . . . ;Mt corresponding to each subject, whereC ¼ f1;2; . . . ;Ncg, Nc is the number of classes and Mt is the numberof training patterns. In this study, Nc = 3 and the corresponding agegroups are 6-month-olds, 12-month-olds, and adults, respectively.The value of Mt is 58.
We first compute candidate features from the ERP data. For thisstudy, the set of candidate features consists of a discrete waveletdecomposition (DWT) of first- and second-order cumulant func-tions extracted from the ERP data, as described in more detail inSection 2.3. The number Nf of such candidate features can be quitelarge. The result of the feature extraction process is a set of vectors~xi 2 RNf ; i ¼ 1; . . . ;Mt . After extracting candidate features, the nextstep is feature selection, which will be described in more detail inSection 2.4. This procedure is critical to the performance of theresulting classifier or predictor. Feature selection is an ongoing to-pic of research in the machine learning community. Typically, onlya relatively small number of the candidate features bear any signif-icant statistical relationship with the target variables. We thereforeselect only those features that share the strongest statisticaldependencies with the target variables. The result of the featureselection process is to reduce the number Nf of candidate featuresto a much smaller number Nr<<Nf of most relevant features.
The feature selection process yields a set of dimensionally re-duced vectors, xi 2 RNr ; i ¼ 1; . . . ;Mt . We refer to the set D ¼ fðxi;
yiÞ; i ¼ 1;2 . . . ;Mtg as the training set. Each of these reduced vectorscorrespond to a point in an Nr – dimensional feature space. Ideally,these points should cluster into distinct non-overlapping regions inthe feature space, corresponding to the respective age groups. Inpractice however, the clusters may overlap somewhat, so that fea-ture vectors from a few subjects of one age group will map into thecluster of another group, resulting in a classification error corre-sponding to those subjects. The selection of ‘‘better’’ features; i.e.,features with greater statistical dependence on the outcome vari-able, leads to the formation of tighter clusters with smaller vari-ances and with greater separation between the means of theclusters of different classes, resulting in improved performance.
The reduced feature vectors are fed into a classifier for classifi-cation. Generally speaking, the classification process may beviewed as a mapping f ðxÞ : RNr ! y 2 C, between the input featurevector x of a test subject and the subject’s corresponding agegroup. Given a set of training patterns where the subject agegroups are known, the objective in implementing the classifier isto determine the function f. There are many methods of determin-ing the function f, which result in different classifiers, e.g., (Vapnik,1998; Haykin, 2008; Theodoridis and Koutroumbas, 2008). A sum-mary of some classification methods that performed well in thepresent application is described in Section 2.5.
2.3. Computing candidate features
For this study, the set of candidate features consists of the DWT ofthe first- and second-order cumulant functions extracted from theERP data. Cumulants are average (statistical) quantities and there-fore have less inter-trial variance than the ERP signal itself. First or-der cumulants correspond to the (time-varying) mean value of thesignals averaged over all trials and over all electrodes in each regionof the scalp, as described above. Second-order cumulants consist ofthe cross-correlation functions of the averaged signals betweenrespective regions. These cumulants are defined as follows:
(1) First order cumulant: C1XðnÞ ¼ mxðnÞ; n ¼ 1;2; . . . ;Ne (aver-
aged signal of all the sensors in region X)(2) Second order cumulant: C2
XYðkÞ ¼P
nmXðnÞmYðnþ kÞ;jkj ¼ 1;2; . . . ;Ne � 1
where n ¼ 1; . . . ;Ne and mXðnÞ is the time-varying signal obtainedby averaging over all trials and all electrodes in region X. The quan-tities X and Y represent different regions on the scalp: X and Y2{‘‘FR’’, ‘‘FL’’ (frontal right and left), ‘‘CR’’, ‘‘CL’’(Central right and left),‘‘PR’’, ‘‘PL’’ (Parietal right and left), ‘‘OR’’, ‘‘OL’’ (Occipital right andleft), ‘‘TR’’, ‘‘TL’’ (Temporal right and left)}. Since the signal in eachregion is 1.9 s long (corresponding to Ne = 475 samples) from 0 to1.9 s, the duration of each second-order cumulant function is 3.8 s;i.e., from �1.9 to 1.9 s.
The cumulant sequences themselves are not very efficient as re-duced features. However, their wavelet coefficients are much morediscriminative as features for this study. The DWT is well known tobe effective for compression of signals. Since compression and fea-ture selection are very closely connected entities, it is natural toconsider the use of wavelet coefficients as features. The waveletdecomposition is relevant for non-stationary signals and may beinterpreted as the time variation of a frequency decomposition ofthe signal.
The wavelet decomposition and the coherence function corre-sponding to a second-order cumulant sequence are both frequencydomain representations of the EEG signal. The power containedwithin a wavelet sequence at a particular frequency band is withina constant multiple of the power contained in the coherence func-tion, over the same band. Since the spectral coherence function be-tween two brain regions at a specific frequency is indicative ofsynchronization between these regions at that frequency, thepower level of the wavelet sequence is also indicative of the samesynchronization.
Selection of the appropriate wavelet and the number of decom-position levels is very important in the analysis of signals using theDWT. In this study, a 5-level wavelet decomposition, correspond-ing to detail components d1�d5 and one final approximation com-ponent a5 (Vetterli and Kovacevic, 1995), was found to yieldsatisfactory performance. Since the EEG signals are filtered withinthe band 0.5–20 Hz, whereas the Nyquist frequency is at 125 Hz,there are no frequency components of interest in the band 20–125 Hz. Therefore, only the detail components (d3–d5) and theapproximation wavelet coefficients (a5), which represent the band0.5–20 Hz, are used in subsequent analyses.
The smoothing property inherent in the Daubechies wavelet oforder 2 (db2) made it most suitable for use in our application. Inour experiments, the total number of candidate features, whichare the wavelet coefficients corresponding to the various cumulantsequences, is Nf = 6330.
2.4. Feature selection
We use a feature selection procedure based on mutual informa-tion (Cover and Thomas, 1991). A useful procedure is to select fea-tures that are both relevant (i.e., have high mutual informationwith the target variables) but also have minimum mutual redun-dancy. In this respect, we use the suboptimal greedy algorithm ofPeng et al. (2005). Suppose that the set of Nr best selected featuresis denoted by A, and the set of all Nf available features is denotedby ~X. The first member of A is the feature with maximum mutualinformation with the target value y. Then, suppose we already haveAm�1, the feature set with m�1 best features. The task is to selectthe mth feature from the remaining set ~A ¼ f~X� Am�1g. This canbe done by solving the following optimization problem whichimplements a trade-off between maximum relevance and mini-mum redundancy (MRmR).
xm ¼ argmaxxj2~A
¼ argmaxxj2~A
Mðxj; =; yÞ �g
m� 1
Xxi2Am�1
Mðxj;xiÞ( )
ð1Þ

M. Ravan et al. / Clinical Neurophysiology 122 (2011) 2139–2150 2143
where g > 0 is a regularization or trade-off parameter and Mða; bÞ isthe mutual information between the random variables a nd b. Notethat the maximized value lðxmÞ with respect to the argument pro-vides an indication of the suitability of the proposed mth feature. Byevaluating (1) over Nr iterations, we are able to produce a selectedset of most relevant features.
In order to improve the performance of the feature selectiontechnique and consequently of the classification methods, thesefeatures are normalized to have a maximum absolute magnitudeof unity, so that each feature is in the interval [�1, 1]. The selectedfeatures are then used to train the classifier to determine the agegroup of each subject.
In order to avoid choosing features that are dominant in just afew patterns, a leave-one-out (LOO) procedure was used to selectthe best Nr features. The proposed methodology actually usestwo LOO procedures executed in succession. The second is usedto evaluate the final performance of the method, as described laterin Section 2.6. The LOO procedure is an iterative process, where ineach iteration, all the data associated with one particular subject isomitted from the training set. The iterations repeat until all sub-jects have been omitted once. In the proposed feature selectionscheme, in each iteration, a list of the best kNr, k > 1 features wasdetermined using the MRmR feature selection procedure. For thisstudy the value of k was chosen to be 2. After all iterations are com-plete, the Nr features with the highest number of repetitions (prob-ability of appearance) among the available lists were selected asthe final set of selected features.
The optimal value of the parameter Nr was found by first clas-sifying the three age groups using only the single most relevantfeature (i.e., Nr = 1) using the MRmR procedure. The entire featureselection procedure described above was then applied repetitively,each time incrementing the value of Nr , until no further improve-ment was observed in the resulting classification error. This proce-dure yielded a value Nr = 18.
2.5. Techniques for classification
In this subsection we give a summary of the classification meth-ods that were found to give good performance in our experimentsfor predicting the age group of the subjects. These include:
(1) The kernelized support vector machine (SVM) as proposed byVapnik (1995). The kernelization procedure imposes a nonlin-ear transformation on the feature space in a computationallyefficient manner (Cristianini and Shawe-Taylor, 2000). Thekernelized version of the SVM was found to result in improvedperformance for this application. This technique requiresspecification of a kernel function, which is dependent on thespecific data (Vapnik, 1995; Cristianini and Shawe-Taylor,2000; Cortes and Vapnik, 1995). In this paper, the choice ofthe kernel function was studied empirically and optimalresults were achieved using radial-basis function (RBF) kernelfunction. The SVM is inherently a binary classifier; however, itcan be extended into a multi-class classifier by fusing severalof its kind together. In our experiments, we fuse SVM binarydecisions using the error correcting output-coding (ECOC)approach, adopted from digital communication theory(Dietterich and Bakiri, 1995; Gluer and Ubeyli, 2007).
(2) The fuzzy c-means (FCM) algorithm, which is a method ofclassification where each point is allowed to belong to twoor more classes. This method was developed by Dunn(1973) and improved by Bezdek (1981). This algorithm isan iterative classification method having some advantageswith respect to other classifiers, the most prominent ofwhich is its high generalization capacity for a reduced num-ber of training trials.
(3) The multilayer perceptron neural network (MLPNN) classi-fier. This is the most commonly used neural-network archi-tecture since it enjoys properties such as the ability to learnand generalize, fast operation, and ease of implementation.One major characteristic of these networks is their abilityto find nonlinear surfaces separating the underlying pat-terns. The MLPNN is a nonparametric technique for perform-ing a wide variety of detection and estimation tasks (Haykin,1998 Mt). We use the Levenberg–Marquardt algorithm totrain the MLPNN. This algorithm combines the best featuresof the Gauss–Newton technique and the steepest-descentalgorithm, but avoids many of their limitations (Hagan andMenhaj, 1994).
2.6. The evaluation procedure
The performance of the proposed methodology was evaluatedusing a second LOO cross-validation procedure. In each iteration(fold) of the current LOO evaluation procedure, the set of featurescorresponding to one particular subject is again omitted from thetraining set. The classifier is trained using the remaining availabletraining set and the structure tested using the omitted subject. Thetest result is compared to the known result provided by the train-ing set. The process repeats times, each time using a different omit-ted subject, until all subjects have been omitted/tested once. Thesame set of previously-identified features is used in each fold. Inthis way, considering the small size of our available training set,we can obtain an efficient estimate of the performance of the pre-diction process. LOO cross validation is useful because it does notwaste data and provides an asymptotically unbiased estimate ofthe averaged classification error probability over all possible train-ing sets (Theodoridis and Koutroumbas, 2008). The main drawbackof the leave-one-out method is that it is expensive – the computa-tion must be repeated as many times as there are training set datapoints.
The classifier design and feature selection procedures requirethe setting of values for various hyperparameters, such as the reg-ularization constant g in (1) and the kernel parameters. These maybe conveniently determined using a nested cross-validation proce-dure within each fold of the main LOO process, in the manner de-scribed by (Varma and Simon, 2006; Guyon and Elisseeff, 2003). Aflowchart describing the machine learning process for age discrim-ination is summarized in Fig. 2.
The classification results provided by the LOO procedure can beused to compute various performance indexes, which are indica-tive of overall performance. The indexes we have chosen are sensi-tivity, specificity, and total classification accuracy (TCA). These aredefined as follows:
- Sensitivity: number of subjects that are truly identified to be inone class divided by the number of subjects that are actually inthat class.
- Specificity: number of subjects that are truly identified not to bein a particular class divided by the total number of subjects thatare actually not in that class.
- Total classification accuracy (TCA): number of correct identifica-tions in all classes divided by the total number of subjects.
3. Experimental results
The set of the most relevant features selected by the MRmR pro-cedure is shown in Table 1, sorted in terms of the optimized MRmRvaluelðxÞ from Eq. (1). For example, the first row shows that themost relevant feature is the wavelet coefficient of the averagedfirst-order cumulant sequence C1
OR at the occipital right region inthe frequency band FB = 3.90–7.81 Hz (theta band), occurring at

Select the most relevant features (wavelet coefficients) using the MRmR criterion in conjunction with the first LOO procedure.
Calculate the wavelet coefficients of the 1st and 2nd order cumulant
sequences using a Daubechie wavelet of order 2 ((db2)).
Record EEG responses to the melody trials
Start
Calculate the 2nd order cross-cumulants between all possible pairs of regions X and Y to give
the sequences 2CXY .
Remove the artefacts using AB algorithm.
Time average and re-reference the standard ERP trails.
Average the ERP responses over each region X to give the 1st order
cumulants 1CX .
Second LOO (evaluation) procedure For 1, ti ,= K
Omit the ith training sample
Train classifier using remaining samples
Test classifier using omitted sample
Compare outcome with known result
••
•
•
M
Fig. 2. Flow chart of the proposed age discrimination procedure.
Table 1List of the Nr = 18 selected features used to predict the age group of subjects and theirMRmR criteria value lðxÞ, where ‘‘FB’’ and ‘‘T’’ denote the frequency band and thetime for each wavelet coefficient, respectively.
Feature # Feature MRmR
1 C1OR, FB = 3.90–7.81 Hz, T = 1.19 s 0.7561
2 C1OL, FB = 3.90–7.81 Hz, T = 1.19 s 0.7526
3 C1TL, FB = 3.90–7.81 Hz, T = 1.19 s 0.7422
4 C1OR, FB = 3.90–7.81 Hz, T = 0.71 s 0.7319
5 C1FL, FB = 3.90–7.81 Hz, T = 0.71 s 0.7008
6 C1CL, FB = 3.90–7.81 Hz, T = 0.71 s 0.6694
7 C2FL;FR FB = 7.81–15.63 Hz, T = 0.28 s 0.6642
8 C1FL, FB = 3.90–7.81 Hz, T = 1.19 s 0.6626
9 C1CL, FB = 3.90–7.81 Hz, T = 1.19 s 0.6617
10 C1FL, FB = 7.81–15.63 Hz, T = 0.61 s 0.6467
11 C1TR, FB = 3.90–7.81 Hz, T = 1.19 s 0.6453
12 C2TR;OR, FB = 7.81–15.63 Hz, T = �0.22 s 0.6357
13 C2FR;OL, FB = 7.81–15.63 Hz, T = �0.59 s 0.6217
14 C1TR, FB = 3.90–7.81 Hz, T = 0.36 s 0.6185
15 C1OL, FB = 3.90–7.81 Hz, T = 0.71 s 0.6179
16 C2CL;CR, FB = 7.81–15.63 Hz, T = �0.22 s 0.6095
17 C1OL, FB = 7.81–15.63 Hz, T = 1.10 s 0.6086
18 C2OL;OR, FB = 7.81–15.63 Hz, T = �0.09 s 0.6081
2144 M. Ravan et al. / Clinical Neurophysiology 122 (2011) 2139–2150
time T = 1.19 s., with an MRmR value of lðxÞ ¼ 0:7561. The selec-tion of this feature is an indication that this wavelet coefficientchanges significantly with the age, and is thus highly indicativeof the subject age group.
A further example is the seventh most relevant feature of Ta-ble 1, which is the wavelet coefficient of the second-order cross-correlation cumulant sequence C2
FL;FR between the frontal rightand frontal left regions in the frequency band FB = 7.81–15.63 Hz(alpha band) occurring at time T = 0.28 s with an MRmR value oflðxÞ = 0.6642. We have seen that the DWT of a cross-correlationfunction is closely related to the spectral coherence function be-tween the corresponding regions at a specified frequency band, ex-cept that the classical definition of coherence does not provide anyvariation in time. Coherence between two regions at frequency kindicates there is neural synchronous activity between these re-gions at that frequency. Thus, the selection of a DWT coefficientof a cross correlation function as a most relevant feature meansthat synchronous activity between respective regions at a particu-lar frequency is indicative of age group.
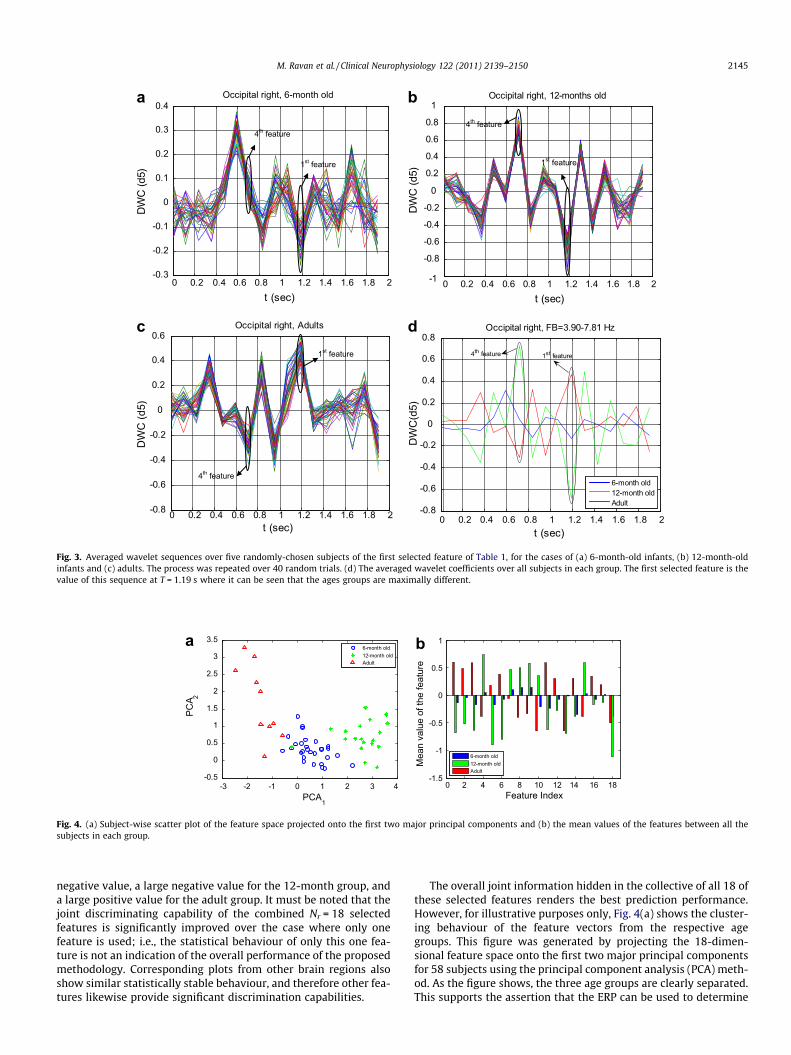
An experiment to demonstrate the statistical stability of the se-lected features is described next. This is important in order to beconfident that the results are not skewed by a small number of in-fants with anomalous data. Note that this procedure is distinctfrom the LOO process used to evaluate performance. The resultsare shown with respect to the first feature in Table 1. Five subjectsfrom one particular age group are chosen at random and the d5wavelet coefficient sequences corresponding to this feature areevaluated for each subject. The sequences from these five subjectsare then averaged together. This process is repeated 40 times foreach of the three age groups, where each time a different set of fivesubjects is randomly chosen. The resulting averaged sequences areshown in Figs. 3(a)–(c) for the 6-, 12-month-olds and adult agegroups, respectively. Fig. 3(d) shows the averaged wavelet coeffi-cients over all subjects in each group. Note that the first featureis the value of these sequences at T = 1.19 s (recall that the fourstimulus tones occur every 300 ms with the first tone starting att = 200 ms in Fig. 3). It may be seen from this figure that the stan-dard deviations of the traces (at T = 1.19 s) are small in comparisonto the differences between the traces of the respective age groups,even considering the averaging over the five subjects. Thus, weconclude that this feature is sufficiently statistically stable and pro-vides significant discrimination between the age groups for theparticular ERP stimulus used in this experiment. From Fig. 3, it isevident that for the 6-month age group, this feature has a small
0 0.2 0.4 0.6 0.8 1 1.2 1.4 1.6 1.8 2-0.8
-0.6
-0.4
-0.2
0
0.2
0.4
0.6
0.8
t (sec)
DW
C(d
5)
Occipital right, FB=3.90-7.81 Hz
6-month old12-month oldAdult
4th feature 1st feature
0 0.2 0.4 0.6 0.8 1 1.2 1.4 1.6 1.8 2-0.3
-0.2
-0.1
0
0.1
0.2
0.3
0.4
t (sec)
DW
C (d
5)
1st feature
4th feature
Occipital right, 6-month old
0 0.2 0.4 0.6 0.8 1 1.2 1.4 1.6 1.8 2-1
-0.8
-0.6
-0.4
-0.2
0
0.2
0.4
0.6
0.8
1Occipital right, 12-months old
t (sec)
DW
C (d
5)
1st feature
4th feature
0 0.2 0.4 0.6 0.8 1 1.2 1.4 1.6 1.8 2-0.8
-0.6
-0.4
-0.2
0
0.2
0.4
0.6
t (sec)
DW
C (d
5)
Occipital right, Adults
4th feature
1st feature
a b
c d
Fig. 3. Averaged wavelet sequences over five randomly-chosen subjects of the first selected feature of Table 1, for the cases of (a) 6-month-old infants, (b) 12-month-oldinfants and (c) adults. The process was repeated over 40 random trials. (d) The averaged wavelet coefficients over all subjects in each group. The first selected feature is thevalue of this sequence at T = 1.19 s where it can be seen that the ages groups are maximally different.
-3 -2 -1 0 1 2 3 4-0.5
0
0.5
1
1.5
2
2.5
3
3.5
PCA1
PCA 2
6-month old12-month oldAdult
0 2 4 6 8 10 12 14 16 18-1.5
-1
-0.5
0
0.5
1
Feature Index
Mea
n va
lue
of th
e fe
atur
e
6-month old12-month oldAdult
a b
Fig. 4. (a) Subject-wise scatter plot of the feature space projected onto the first two major principal components and (b) the mean values of the features between all thesubjects in each group.
M. Ravan et al. / Clinical Neurophysiology 122 (2011) 2139–2150 2145
negative value, a large negative value for the 12-month group, anda large positive value for the adult group. It must be noted that thejoint discriminating capability of the combined Nr = 18 selectedfeatures is significantly improved over the case where only onefeature is used; i.e., the statistical behaviour of only this one fea-ture is not an indication of the overall performance of the proposedmethodology. Corresponding plots from other brain regions alsoshow similar statistically stable behaviour, and therefore other fea-tures likewise provide significant discrimination capabilities.
The overall joint information hidden in the collective of all 18 ofthese selected features renders the best prediction performance.However, for illustrative purposes only, Fig. 4(a) shows the cluster-ing behaviour of the feature vectors from the respective agegroups. This figure was generated by projecting the 18-dimen-sional feature space onto the first two major principal componentsfor 58 subjects using the principal component analysis (PCA) meth-od. As the figure shows, the three age groups are clearly separated.This supports the assertion that the ERP can be used to determine

Table 2Comparison of the performance among different classifiers for predicting the age of subjects using all selected features, for Nr = 18.
Method Classes 6-Month 12-Month Adults Sensitivity (%) Specificity (%) TCA (%)
MLPNN 6-Month 26 2 1 89.7 82.8 84.512-Month 4 15 0 78.9 92.3Adults 1 1 8 80 97.9
SVM 6-Month 28 1 0 96.6 93.1 94.812-Month 2 17 0 89.5 97.4Adults 0 0 10 100 100
FCM 6-Month 27 1 1 93.1 96.5 94.812-Month 1 18 0 94.7 97.4Adults 0 0 10 100 95.9
Table 3Comparison of performance among different classifiers in predicting the age ofsubjects under varying conditions. The first two columns show the performanceobtained from the LOO cross-validation procedure, for different values of Nr . The thirdcolumn shows results where all 18 features are used, and 80% of the subjects in eachgroup are used for training, and the remaining 20% are used for evaluation.
Method TCA using LOOwith 12features (%)
TCA using LOOwith 15features (%)
TCA using 80% of the subjectsand all 18 features fortraining (%)
MLPNN 78.3 82.1 81.2SVM 88.2 92.7 91.5FCM 89.7 92.7 93.8
2146 M. Ravan et al. / Clinical Neurophysiology 122 (2011) 2139–2150
the age group of the subjects. Note that even though excellent per-formance is demonstrated with this 2-dimensional representation,better overall performance is obtained in the Nr = 18 dimensionalfeature space.
A further example showing the behaviour of the selected fea-tures is shown in Fig. 4(b). This figure shows the average value ofthe features between all the subjects in each age group. It maybe noted that for most of the selected features, the values of thefeatures for adults and 12-month-olds tend to be large and ofopposite polarity, while the corresponding feature for 6-months-old tends to be small in magnitude.
The classification performance of the proposed methodology forage determination is shown for various classifier structures in Ta-ble 2. The MLPNN classifier is used for comparison purposes sinceit is a very well-known form of classifier (Haykin, 1998). In the hid-den layer of the MLPNN, 30 neurons were used. According to Ta-ble 2, the SVM and FCM methods perform well in thisapplication, with classification performances above 94%. This veri-fies the hypothesis that the ERP can yield features that discrimi-nate age group with high reliability.
4. Discussion and conclusions
4.1. Summary
This study proposes a method to determine the age category of6-month-olds, 12-month-olds, and adults from their ERP responsesto a 4-note melody based on modern machine learning principles.Training data from the ERP signals of the three age groups are usedto build a classifier, which determines the age group of the subject.The process consists of the following components: feature extrac-tion by computing the wavelet coefficients of the first and secondorder cumulant sequences, a feature selection procedure where themost statistically relevant features are selected from the set of ex-tracted features, and a classification procedure using classifierstrained on the reduced features.
The feature reduction process uses a ‘‘mutual information crite-rion’’, in which the most relevant discriminating features are se-lected among all the available features, with the condition thatthey should also satisfy a minimum redundancy criterion. Threedifferent types of classifiers were evaluated. The multiclass SVMand fuzzy C-mean classifiers show more than 94% performancewhile the performance of MLPNN was not as high. In addition,we used a low dimensional representation of the feature spaceusing the PCA method that provides a useful tool for visualizationof the classification process.
The proposed method of feature selection is in contrast to pre-vious approaches for categorizing subjects according to their ERPcomponents. These methods hypothesize beforehand that a singlefeature may be discriminative, and then verify or reject thishypothesis by experiment. In contrast, our proposed featureselection method finds a small number of maximally discrimina-
tive features that are automatically identified from a very large listof candidate features. Thus our method can potentially identifysalient features that could be missed using previous methods.
It should be noted that the top 18 features described in Table 1are not unique. Due to the rich redundancy of the candidate fea-tures, other selected feature sets could be chosen with almostequal MRmR values. An interesting topic for further investigationis to explicitly include various parameters relating to the ERP com-ponents (such as component intensity, latency, duration, etc.) inthe list of candidate features, to determine whether they are cho-sen as selected features.
4.2. Over-training
Over-training is always an issue in any machine learning appli-cation. Over-training happens when the feature selection and clas-sifier design processes over-adapt to the specific training set, withthe result that the resulting structure performs well with the giventraining set, but does not generalize well to new samples. We nowpresent examples that suggest over-training is not a dominantphenomenon in this study. First, the behaviour shown in Fig. 4(a)shows clean separation of the clusters representing each class,which means that good classification performance can be obtainedwith boundaries in the form of low-dimensional hyperplanes. Thissuggests the boundaries have not over-adapted to the specifictraining set, and therefore the classifier structure should behavewell with new data. The second demonstration is based on theargument that when the dimension of the feature space is compa-rable to the number of training samples, over-training may exist. Inthe first two columns of Table 3, we show performance results cor-responding to those shown in the last column of Table 2, exceptthat we use different values of Nr. It is seen that performance isnot overly sensitive to this parameter. Particularly, performanceis not seriously degraded when Nr is reduced to 12, which isapproximately 1/5 of the total number of training samples. Thus,the proposed structure behaves well when the dimension of thefeature space is significantly lower than the number of trainingsamples, further suggesting that over-training is not a dominantconsideration in this study.
0 0.2 0.4 0.6 0.8 1 1.2 1.4 1.6 1.8 2-1
-0.8
-0.6
-0.4
-0.2
0
0.2
0.4
0.6
0.8
t (sec)
Frontal left
6-month old
12-month oldAdult
N1
P1
P2
0 0.2 0.4 0.6 0.8 1 1.2 1.4 1.6 1.8 2-1
-0.8
-0.6
-0.4
-0.2
0
0.2
0.4
0.6
t (sec)
DW
C(d
5)
Frontal left, FB=3.90-7.81 Hz
6-month old
12-month oldAdult
5th feature
8th feature
0 0.2 0.4 0.6 0.8 1 1.2 1.4 1.6 1.8 2-0.8
-0.6
-0.4
-0.2
0
0.2
0.4
0.6
0.8
t (sec)
Central left
6-month old
12-month oldAdult
0 0.2 0.4 0.6 0.8 1 1.2 1.4 1.6 1.8 2-0.8
-0.6
-0.4
-0.2
0
0.2
0.4
0.6
t (sec)
DW
C(d
5)
Central left, FB=3.90-7.81 Hz
6-month old
12-month oldAdult
6th feature
9th feature
0 0.2 0.4 0.6 0.8 1 1.2 1.4 1.6 1.8 2-0.8
-0.6
-0.4
-0.2
0
0.2
0.4
0.6
t (sec)
Temporal left
6-month old
12-month oldAdult
0 0.2 0.4 0.6 0.8 1 1.2 1.4 1.6 1.8 2-0.8
-0.6
-0.4
-0.2
0
0.2
0.4
0.6
t (sec)
DW
C(d
5)
Temporal left, FB=3.90-7.81 Hz
6-month old
12-month oldAdult
3rd feature
14th feature
0 0.2 0.4 0.6 0.8 1 1.2 1.4 1.6 1.8 2-1
-0.8
-0.6
-0.4
-0.2
0
0.2
0.4
0.6
0.8
t (sec)
Occipital left
6-month old
12-month oldAdult
0 0.2 0.4 0.6 0.8 1 1.2 1.4 1.6 1.8 2-0.8
-0.6
-0.4
-0.2
0
0.2
0.4
0.6
t (sec)
DW
C(d
5)
Occipital left, FB=3.90-7.81 Hz
6-month old
12-month oldAdult
15th feature
2nd feature
a
b
c
d
e
f
g
h
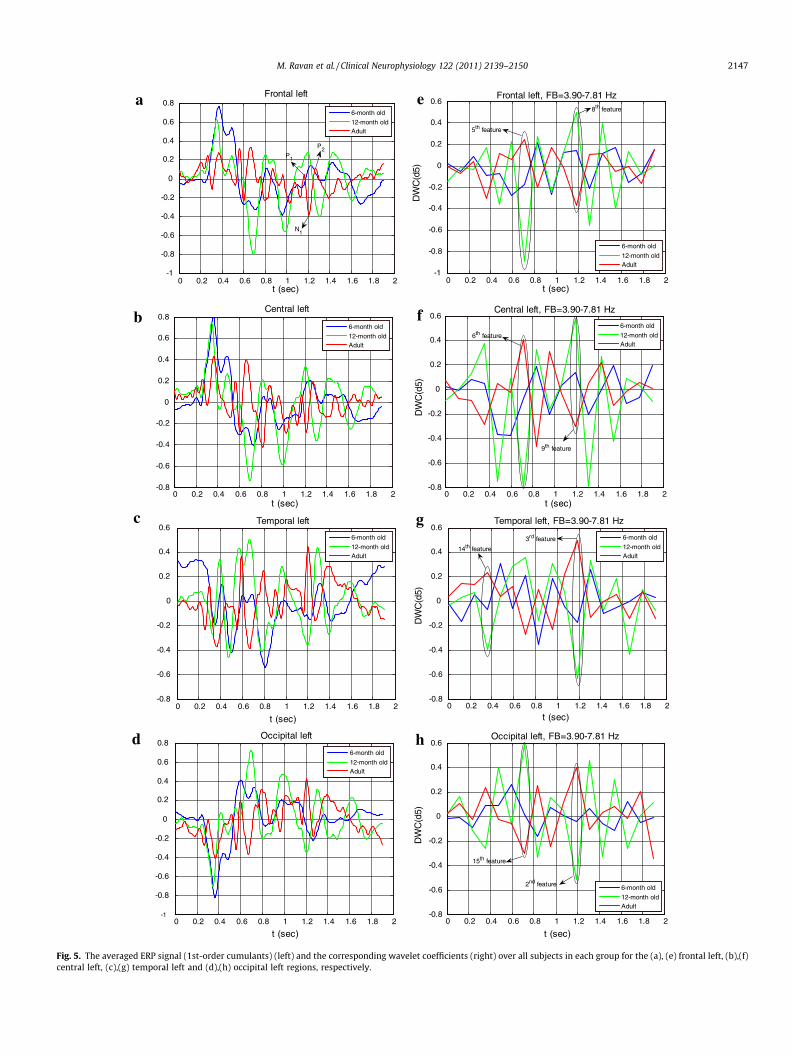
Fig. 5. The averaged ERP signal (1st-order cumulants) (left) and the corresponding wavelet coefficients (right) over all subjects in each group for the (a), (e) frontal left, (b),(f)central left, (c),(g) temporal left and (d),(h) occipital left regions, respectively.
M. Ravan et al. / Clinical Neurophysiology 122 (2011) 2139–2150 2147
2148 M. Ravan et al. / Clinical Neurophysiology 122 (2011) 2139–2150
An additional demonstration involves testing variations of thesame training set. In this procedure, we used 80% of the subjectsin each age group for training and the remaining 20% of the sub-jects for testing. A 100 experiments with different randomly se-lected training and test subjects were carried out and theaverage performance is reported in the third column of Table 3.As the table shows, the performance of the classifiers do notchange significantly in comparison to that shown in Table 2, sug-gesting over-training has not occurred. The final point with regardto over-training concerns feature selection. The regularized featureselection method described in Section 2.4 is specifically chosen toavoid the situation where a few training samples dominate the fea-ture selection process.
4.3. Neurophysiological interpretation of the selected features
The optimality of our proposed feature selection procedure sug-gests that these selected features are highly indicative of theunderlying neurophysiological processes that accompany develop-ment. A complete understanding of the clues these features pro-vide with respect to neural development is beyond the scope ofthis paper and remains a topic for future work. Nevertheless, wepresent some examples and observations in the following para-graphs that provide some limited insight in this respect.
Features 1–6, 8, 9, 11, 14, 15 of Table 1 are all wavelet coeffi-cients extracted from first-order cumulant sequences of the ERPwaveforms in the theta band (3.9–7.8 Hz), and therefore probablycapture age differences in traditional ERP components such P1, N1and P3 that fall within this frequency range. Most of the first orderfeatures (features 1, 2, 3, 8, 9, 11) occur at time T = 1.19 s at wide-spread regions (OR, OL, TL, FL, CL, and TR) across the brain. The left-hand side (panels (a)–(d)) of Fig. 5 shows the first-order cumulantsequences from the FL, CL, TL and OL regions. These sequences are
-2 -1.5 -1 -0.5 0 0.5 1 1.5 2-20
-10
0
10
20
30
40
50
60
70
t (sec)
Frontal left and frontal right
6-month old
12-month oldAdult
-2 -1.5 -1 -0.5 0 0.5 1 1.5 2-20
-10
0
10
20
30
40
50
t (sec)
Temporal right and Occipital right
6-month old
12-month oldAdult
a
b
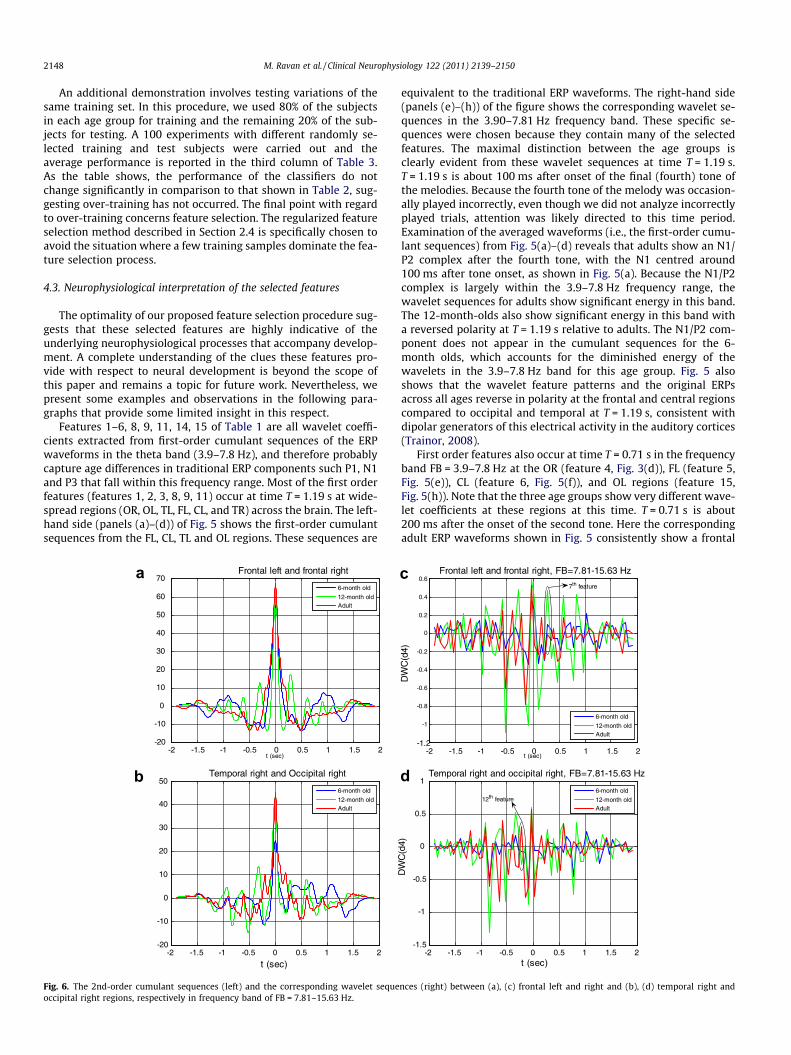
Fig. 6. The 2nd-order cumulant sequences (left) and the corresponding wavelet sequeoccipital right regions, respectively in frequency band of FB = 7.81–15.63 Hz.
equivalent to the traditional ERP waveforms. The right-hand side(panels (e)–(h)) of the figure shows the corresponding wavelet se-quences in the 3.90–7.81 Hz frequency band. These specific se-quences were chosen because they contain many of the selectedfeatures. The maximal distinction between the age groups isclearly evident from these wavelet sequences at time T = 1.19 s.T = 1.19 s is about 100 ms after onset of the final (fourth) tone ofthe melodies. Because the fourth tone of the melody was occasion-ally played incorrectly, even though we did not analyze incorrectlyplayed trials, attention was likely directed to this time period.Examination of the averaged waveforms (i.e., the first-order cumu-lant sequences) from Fig. 5(a)–(d) reveals that adults show an N1/P2 complex after the fourth tone, with the N1 centred around100 ms after tone onset, as shown in Fig. 5(a). Because the N1/P2complex is largely within the 3.9–7.8 Hz frequency range, thewavelet sequences for adults show significant energy in this band.The 12-month-olds also show significant energy in this band witha reversed polarity at T = 1.19 s relative to adults. The N1/P2 com-ponent does not appear in the cumulant sequences for the 6-month olds, which accounts for the diminished energy of thewavelets in the 3.9–7.8 Hz band for this age group. Fig. 5 alsoshows that the wavelet feature patterns and the original ERPsacross all ages reverse in polarity at the frontal and central regionscompared to occipital and temporal at T = 1.19 s, consistent withdipolar generators of this electrical activity in the auditory cortices(Trainor, 2008).
First order features also occur at time T = 0.71 s in the frequencyband FB = 3.9–7.8 Hz at the OR (feature 4, Fig. 3(d)), FL (feature 5,Fig. 5(e)), CL (feature 6, Fig. 5(f)), and OL regions (feature 15,Fig. 5(h)). Note that the three age groups show very different wave-let coefficients at these regions at this time. T = 0.71 s is about200 ms after the onset of the second tone. Here the correspondingadult ERP waveforms shown in Fig. 5 consistently show a frontal
-2 -1.5 -1 -0.5 0 0.5 1 1.5 2-1.2
-1
-0.8
-0.6
-0.4
-0.2
0
0.2
0.4
0.6
t (sec)
DW
C(d
4)
Frontal left and frontal right, FB=7.81-15.63 Hz
6-month old
12-month oldAdult
7th feature
-2 -1.5 -1 -0.5 0 0.5 1 1.5 2-1.5
-1
-0.5
0
0.5
1
t (sec)
DW
C(d
4)
Temporal right and occipital right, FB=7.81-15.63 Hz
6-month old
12-month oldAdult
12th feature
c
d
nces (right) between (a), (c) frontal left and right and (b), (d) temporal right and
M. Ravan et al. / Clinical Neurophysiology 122 (2011) 2139–2150 2149
and central positivity whereas 12-month-olds show a negativity atthese times (Fig. 5(e) and (f)). Six-month-olds have very little en-ergy in this band, resulting in low-level wavelet coefficients. Thesefeatures also reverse polarity from the front to the back of the head,(see Fig. 5(e) vs. (h)) again consistent with generators of activity inthe auditory cortex.
The wavelet coefficients extracted from second order cumulantsequences are all in the alpha band (7.81–15.63 Hz). As previouslydiscussed, this suggests that alpha-band synchronization betweenregions is an additional neural condition that changes with devel-opment. For example, Fig. 6(a) and (c) shows the cross-correlationand corresponding wavelet sequences between the frontal left andright regions (feature 7), whereas Fig. 6(b) and (d) shows similarplots between the temporal right and occipital right regions (fea-ture 12). The cross-correlation sequences for all three age groupsshow the largest peak near zero. For feature 7, this means thatthe two hemispheres are quite closely in synch with no time delay.For all three age groups, the wavelet sequences within this bandexhibit narrow-band oscillatory behaviour, with a centre fre-quency that varies with age. Thus the wavelet coefficients for thethree age groups are in-phase at some delays and out-of-phase atothers, allowing there to exist a delay value at which the waveletsequences of the three age groups are maximally different, andtherefore qualify as a selected feature in Table 1. The change inthe frequency of the oscillatory characteristic of these wavelet se-quences with age is an indication that changes in synchrony be-tween the left and right frontal regions (feature 7) and temporalright and occipital right regions (feature 12) are an indication ofdevelopmental maturation of the human brain.
Although we cannot know for sure what neurological develop-ments are associated with the age differences that are apparent,the first order cumulants are likely associated with short-range mat-uration of connections between neurons. It is known from autopsystudies of human brain tissue that myelination and neurofilamentexpression increase in auditory areas during infancy, which enablesfaster and more efficient connections between neurons withincreasing age (Huttenlocher and Dabholkar, 1997; Moore andGuan, 2001). The differences in synchrony between brain regionsuncovered in the second order cumulants are perhaps more interest-ing in that there are few previous studies showing developmentalEEG differences related to changes in long-range connections, butthis development is crucial for optimal brain functioning (e.g., Casa-nova et al., 2009; Keary et al., 2009; Thatcher et al., 2008).
5. Conclusions
In sum, we have shown that the present approach of using amachine learning procedure that does not require prior hypothesesfor uncovering features that distinguish maturational age has thepotential to uncover new theoretical understanding of maturationchanges in long-range synchrony. It also opens the possibility ofdevising a clinical test that can compare the chronological andmaturational ages of individual subjects in order to determinewhether an infant is developing normally or experiencing signifi-cant delay. In the present study, we compared only three ages. Itremains for further study to determine how fine-grained the clas-sification by age can be made.
Acknowledgments
The Natural Science and Engineering Research Council ofCanada (NSERC) has funded a large portion of this research throughits Discovery Grants program, and also through a Co-OperativeResearch and Development (CRD) grant, in conjunction with Intra-tech Inline Inspection Services (I3SL) Ltd., Mississauga, Ontario.
References
Bezdek JC. Pattern recognition with fuzzy objective function algorithms, New York:Plenum Press; 1981.
Casanova MF, El-Baz A, Mott M, Mannheim G, Hassan H, Fahmi R, et al. Reducedgyral window and corpus callosum size in autism: possible macroscopiccorrelates of a minicolumnopathy. J Autism Dev Disord 2009;39:751–64.
Ceponiené R, Kushnerenko E, Fellman V, Renlund M, Suominen K, Näätänen R.Event-related potential features indexing central auditory discrimination bynewborns. Cogn Brain Res 2002;13:101–13.
Choudhury N, Benasich AA. Maturation of auditory evoked potentials from 6 to48 months: Prediction to 3 and 4 year language and cognitive abilities. ClinNeurophysiol 2011;122(2):320–38.
Cortes C, Vapnik VN. Support vector networks. Mach Learn 1995;20(3):273–97.Cover TM, Thomas JA. Elements of information theory. New York: Wiley; 1991.Cristianini N, Shawe-Taylor J. An introduction to support vector machines and other
kernel-based learning methods, 1st ed.. Cambridge: Cambridge UniversityPress; 2000.
Curtin S, Werker JF. The perceptual foundations of phonological development. In:Gaskell MG, editor. The oxford handbook of psycholinguistics. Oxford: OxfordUniversity Press; 2007. p. 579–99.
De Boer T, Scott LS, Nelson CA. Methods for acquiring and analyzing infant event-related potentials. In: De Haan M, editor. Infant EEG and event-related potentials:satudies in developmental psychology. New York: Psychology Press; 2007. p.5–37.
De Haan M, editor. Infant EEG and event-related potentials: studies indevelopmental psychology. New York: Psychology Press; 2007.
Dietterich TG, Bakiri G. Solving multiclass learning problems via error-correctingoutput codes. J Artif Intell Res 1995;2:263–86.
Dunn JC. A fuzzy relative of the ISODATA process and its use in detecting compactwell-separated clusters. J Cyber 1973;3(3):32–57.
Friedrich H, Friederici AD. Early N400 development and later language acquisition.Psychophysiol 2006;43(1):1–12.
Ghosh-Dastidar S, Adeli H, Dadmehr N. Principal component analysis-enhancedcosine radial basis function neural network for robust epilepsy and seizuredetection. IEEE Trans Biomed Eng 2008;55(2):512–8.
Gluer I, Ubeyli ED. Multiclass support vector machines for EEG-signalsclassification. IEEE Trans Inf Technol Biomed 2007;11(2):117–26.
Greene BR, De Chazal P, Boylan GB, Connolly S, Reilly RB. Electrocardiogram basedneonatal seizure detection. IEEE Trans Biomed Eng 2007;54(4):673–82.
Guttorm TK, Leppänen PHT, Richardson U, Lyytinen H. Event-related potentials andconsonant differentiation in newborns with familial risk for dyslexia. J LearnDisabil 2001;34(6):534–44.
Guyon I, Elisseeff A. An introduction to variable and feature selection. J Mach LearnRes 2003;3:1157–82.
Hagan MT, Menhaj MB. Training feedforward networks with the Marquardtalgorithm. IEEE Trans Neural Net 1994;5(6):989–93.
Hannon EE, Trainor LJ. Music acquisition: effects of enculturation and formaltraining on development. Trends Cogn Sci 2007;11:466–72.
Haykin S. Neural networks: A comprehensive foundation, 2nd ed. Prentice Hall; 1998.Haykin S. Neural networks and learning machines, 3rd ed. Prentice Hall; 2008.He C, Hotson L, Trainor LJ. Mismatch responses to pitch changes in early infancy. J
Cogn Neurosci 2007;19(5):878–92.He C, Hotson L, Trainor LJ. Development of infant mismatch responses to auditory
pattern changes between 2 and 4 months old. Eur J Neurosci 2009a;29:861–7.He C, Hotson L, Trainor LJ. Maturation of cortical mismatch mismatch responses to
occasional pitch change in early infancy: effects of presentation rate andmagnitude of change. Neuropsychology 2009b;47:218–29.
He C, Trainor LJ. Finding the pitch of the missing fundamental in infants. J Neurosci2009;29:7718–22.
Huttenlocher PR, Dabholkar AS. Regional differences in synaptogenesis in humancerebral cortex. J Comp Neurol 1997;387(2):167–78.
Keary CJ, Minshew NJ, Bansal R, Goradia D, Fedorov S, Keshavan MS, et al. Corpuscallosum volume and neurocognition in autism. J Autism Dev Disord2009;39:834–41.
Khodayari-Rostamabad A, Hasey GM, MacCrimmon DJ, Reilly JP, de Bruin H. A pilotstudy to determine whether machine learning methodologies using pre-treatment electroencephalography can predict the symptomatic response toclozapine therapy. Clin Neurophysiol 2010;121(12):1998–2006.
Krajca1 V, Petránek1 S, Mohylová J, Paul K, Gerla V, Lhotská L. Neonatal EEG sleepstages modeling by temporal profiles. Comp Aided Syst Theory, Eurocast2007;195–201.
Kropotov JD, Näätäen R, Sevostianov AV, Alho K, Reinikainen K, Kropotova OV.Mismatch negativity to auditory stimulus change recorded directly from thehuman temporal cortex. Psychophysiol 1995;32(4):418–22.
Kuhl PK. Linking infant speech perception to language acquisition: Phoneticlearning predicts language growth. In: McCardle P, Colombo J, Freund L,editors. Infant pathways to language: Methods, models, and research directions.New York: Erlbaum; 2008. p. 213–243.
Kushnerenko E, Ceponiene R, Balan P, Fellman V, Naatanen R. Maturation of theauditory change-detection response in infants: a longitudinal ERP study.NeuroReport 2002a;13(15):1843–8.
Kushnerenko E, Ceponiene R, Balan P, Fellman V, Huotilainen M, Naatanen R.Maturation of the auditory event-related potentials during the first year of life.NeuroReport 2002b;13(1):47–51.

2150 M. Ravan et al. / Clinical Neurophysiology 122 (2011) 2139–2150
Moore JK, Guan YL. Cytoarchitectural and axonal maturation in human auditorycortex. J Assoc Res Otolaryngol 2001;2:297–311.
Morr ML, Shafer VL, Kreuzer JA, Kurtzberg D. Maturation of mismatch negativity intypically developing infants and preschool children. Ear Hear 2002;23:118–36.
Mourad N, Reilly JP, De Bruin H, Hasey G, MacCrimmon D. A simple and fastalgorithm for automatic suppression of high-amplitude artifacts in EEG data.ICASSP 2007; 1: I-393-I-396.
Näätänen R, Paavilainen P, Rinne T, Alho K. The mismatch negativity (MMN) in basicresearch of central auditory processing: a review. Clin Neurophysiol2007;118:2544–90.
Peng H, Long F, Ding C. Feature selection based on mutual information: Criteria ofmax-dependency, max-relevance, and min-redundancy. IEEE Trans Pattern AnalMach Intell 2005;27(8):1226–38.
Picton TW, Alain C, Otten L, Ritter W, Achim A. Mismatch negativity: different waterin the same river. Audiol Neurootol 2000;5(3–4):111–39.
Taylor MJ, Baldeweg M. Application of EEG, ERP and intracranial recordings to theinvestigation of cognitive functions in children. Dev Sci 2002;5(3):318–34.
Tew S, Fujioka T, He C, Trainor LJ. Neural representation of transposed melody ininfants at 6 months of age. Ann N Y Acad Sci 2009;1169:287–90.
Thatcher RW, North DM, Biver CJ. Development of cortical connections as measuredby EEG coherence and phase delays. Hum Brain Mapp 2008;29(12):1400–15.
Theodoridis S, Koutroumbas K. Pattern recognition, 4th ed. Academic Press; 2008.Trainor LJ, Samuel SS, Galay L, Hevenor SJ, Desjardins RN, Sonnadara R. Measuring
temporal resolution in infants using mismatch negativity. NeuroReport2001;12:2443–8.
Trainor LJ, McFadden M, Hodgson L, Darragh L, Barlow J, Matsos L, et al. Changes inauditory cortex and the development of mismatch negativity between 2 and6 months of age. Int J Psychophysiol 2003;51:5–15.
Trainor LJ. Event-related potential (ERP) measures in auditory developmentalresearch. In: Schmidt LA, Segalowitz SJ, editors. Developmentalpsychophysiology: theory, systems and methods. New York: CambridgeUniversity Press; 2008. p. 69–102.
Vapnik VN. The nature of statistical learning theory, NewYork: Springer-Verlag;1995.
Vapnik VN. Statistical learning theory, New York: Wiley; 1998.Varma S, Simon R. Bias in error estimation when using cross-validation for model
selection. BMC Bioinformatics 2006;7(1):91.Vetterli M, Kovacevic J. Wavelets and subband coding. Prentice Hall; 1995.