Embed Size (px)
Citation preview

A frequently occurring mutation in the lipoprotein lipase gene (Asn291 Ser) results in altered postprandial chylomicron triglyceride and retinyl palmitate response in normolipidemic carriers'
Simon N. Pimstone,. Susanne M. Clee,' S. Eric GagnC,* Li Miao,' Hanfang Zhang,' Evan A. Stein,? and Michael R. Hayden*?* Department of Medical Genetics,* University of British Columbia, 416-2125 East Mall, Vancouver, B.C., V6T 124, Canada, and Medical Research Laboratories,+ Cincinnati, OH
Abstract An Asn291Ser mutation in exon 6 of the lipopro- tein lipase gene (LPL) frequently occurs in Caucasians (2-4%) and results in a partial catalytic defect. Although this muta- tion may be associated with low HDL cholesterol and elevated triglyceride levels, some carriers are normolipidemic and may have LPL activity in the normal range in the fasting state. To assess in vivo the influence of dietary stress on the function of this mutation, we have performed oral fat load studies on three unrelated normolipidemic Asn291Ser carriers and com- pared these results to five healthy controls and to a subject with a clear 50% reduction in LPL activity compared with controls. The Asn291Ser carriers exhibited a more pro- nounced postprandial response compared with noncarriers as evidenced by higher chylomicron triglyceride (TG) and chylomicron retinyl palmitate peaks (P = 0.03 and P = 0.02, respectively). Significantly higher area under response curves were also seen for both chylomicron triglycerides (P = 0.02) and chylomicron retinyl palmitate (P = 0.01) when compared with non-carriers. I These results provide further in vivo evi- dence for the functional effects of this common mutation despite normal fasting lipid levels. These data suggest that even though subjects with this mutation may be normo- lipidemic in the fasting state, environmental stress such as an oral fat load may unmask the catalytic defect and result in significant disturbances in postprandial chylomicron metabo- lism.-Pimstone, S. N., S. M. Clee, S. E. Gagne, L. Miao, H. Zhang, E. A. Stein, and M. R. Hayden. A frequently occur- ring mutation in the lipoprotein lipase gene (Asn291Ser) results in altered postprandial chylomicron triglyceride and retinyl palmitate response in normolipidemic carriers.]. Lipid Res. 1996.37: 1675-1684.
Supplementary key words molipidemic * postprandial response * chylomicron
lipoprotein lipase oral fat load nor-
Lipoprotein lipase (LPL) is a crucial protein in plasma lipoprotein metabolism, where its main function is the hydrolysis of chylomicron (CM) and very low density lipoprotein (VLDL) particles to monoacylglycerols and
free fatty acids (1). Complete LPL deficiency results in the inability to process TG-rich particles, leading to massive elevations in plasma TG levels, deposition of lipids in various body sites, and recurrent bouts of pancreatitis. This disorder, familial chylomicronemia, is however rare, with approximately 1 in one million per- sons affected (1). Over 50 mutations in the gene for LPL have been described which when present on both alleles completely disrupt the catalytic function of the protein
Recently, however, an Asn291Ser mutation in exon 6 of the LPL gene has been described which occurs in approximately 2-4% of individuals in Westem popula- tions (3, 4). In vivo and in vitro assessments of LPL activity suggest that this mutation is associated with approximately 50-70% normal lipase catalytic activity (4). Recent studies have shown that this mutation is frequently associated with low HDL-cholesterol and ele- vated TG levels in the fasting state. This may be exacer- bated in the presence of secondary influences such as absence of the E3 allele (5) or an elevated BMI (6). However, some carriers are normolipidemic and may have LPL activity in the normal range in the fasting state (4). The high frequency of this mutation in Western populations and the finding of normolipidemia in some
(2).
Abbreviations: RP, retinyl palmitate; CRP, chylomicron retinyl palmitate; NCRP, nonchylomicron retinyl palmitate; CM, chylomicron; CTG, chylomicron triglyceride; AUC, area under curve; LPL, lipoprotein lipase; HL, hepatic lipase.
'Presented in part at the 68th Meeting of the American Heart Association November 13-16, 1995. 'To whom correspondence should be addressed.
Journal of Lipid Research Volume 37,1996 1675
by guest, on April 10, 2019
ww
w.jlr.org
Dow
nloaded from

persons with this mutation, have raised questions as to the functional effects of this common mutation.
Postprandial metabolic studies have been performed previously on individuals heterozygous for mutations in the LPL gene (7, 8). Carriers of true null alleles had exaggeration of lipid abnormalities after a fat challenge despite the fact that overlap existed between carriers and noncarriers for both LPL lipolytic and specific activity measurements (8). Humans spend approxi- mately 75% of their time in the postprandial state (9), therefore postprandial assessment of lipoprotein meta- bolism may provide a more physiological perspective of disturbances in lipoprotein homeostasis compared to assessment in the fasting state. As much controversy remains regarding the functional nature of the Asn291Ser mutation and due to its potential importance as a result of its high frequency in the general popula- tion, we have studied postprandial metabolism in three normolipidemic Asn29 lSer heterozygotes and com- pared the response to five healthy BMI-matched con- trols and one subject with a catalytically defective LPL protein.
Normolipidemic Asn29 lSer carriers had a signifi- cantly greater chylomicron postprandial response to a fat load test compared with normolipidemic controls. This would suggest that other environmental factors such as diet do influence the expression of this mutation and may unmask a significant partial lipolytic defect that may not be evident in the fasting state.
MATERIALS AND METHODS
Subjects
The studies were performed on five normal subjects, three Asn291Ser heterozygotes (subjects 1,2, and 3) and one individual with a catalytically defective LPL protein as defined by 50% of normal LPL activity (subject 4) (age range 24-49 years). All individuals were ascertained through screening a population of healthy, unrelated volunteers. Inclusion criteria included normal fasting lipids and normal body mass index (BMI < 26 kglm2). Normolipidemia was defined by: total cholesterol < 5.2 mmol/l; LDLcholesterol < 3.4 mmol/l; triglyceride < 2.3 mmol/l and HDL-cholesterol > 0.9 mmol/l. No subject had any disease or was taking medications known to affect lipoprotein metabolism. None of the subjects smoked or took alcohol in excess (>2 glasses of alcohol/day). Pregnancy was excluded in all female subjects by a rapid HCG test (Ovu Date hCG). One of the male Asn29lSer carriers (subject 1) was a marathon runner, but all other subjects exercised less frequently ((2 times weekly).
Study design
The heparin challenge test and vitamin A fat load study were conducted on an outpatient basis in the Department of Medical Genetics at the University of British Columbia, Vancouver. The protocol was a p proved by the Clinical Screening Committee of the
TABLE 1. Baseline characteristics and metabolic parameters in different cohorts
Asn291Ser Heterozygotes Control
Subject 4 Mean Mean P Value' (n=3) (n=5)
Age (yr) 49 37.7 f 10.5 29.2 f 5.2 NS Sex M 2 M , 1 F 2 M , 3 F Body Mass Index (BMI) 25.8 24.1 f 1.3 22.5 f 1.3 NS ApoE genotypes E2/3 2 E2/3,1 E3/3 2 E3/4,3 E3/3
Plasma triglyceride 2.18 1.72 f 0.27 0.85 f 0.29 0.005 LDL triglyceride (0.01 0.05 f 0.08 0.02 f 0.03 NS HDL triglyceride 0.52 0.54 f 0.05 0.42 f 0.06 NS
HDL3 triglyceride 0.23 0.18 f 0.07 0.18 f 0.03 NS
IDL triglyceride 0.11 0.15 f 0.07 0.09 f 0.03 NS
mmol/L
HDL2 triglyceride 0.29 0.35 f 0.01 0.24 f 0.03 0.02
VLDL triglyceride 1.12 0.66 f 0.21 0.23 f 0.12 0.02
Total cholesterol LDL cholesterol HDL cholesterol HDL2 cholesterol HDW cholesterol VLDL cholesterol IDL cholesterol
AwC-I11
5.1 2.8
1.14 0.41 0.72 1.19 0.23
35
5.2 f 1.0 3.2 f 1.1
1.24 f 0.16 0.53 f 0.15 0.71 f 0.02 0.81 f 0.02 0.29 f 0.13
35.0 f 2.0
4.5 f 0.6 2.7 f 0.5
1.37 f 0.27 0.55 f 0.11 0.81 f 0.16 0.43 f 0.14 0.25 f 0.09
21.0 f 5.2 W L
NS NS NS NS NS
0.02 NS
0.004
OP values are for comparisons between Asn29lSer heterozygotes and controls; NS, not significant.
1676 Journal of Lipid Research Volume 37, 1996
by guest, on April 10, 2019
ww
w.jlr.org
Dow
nloaded from
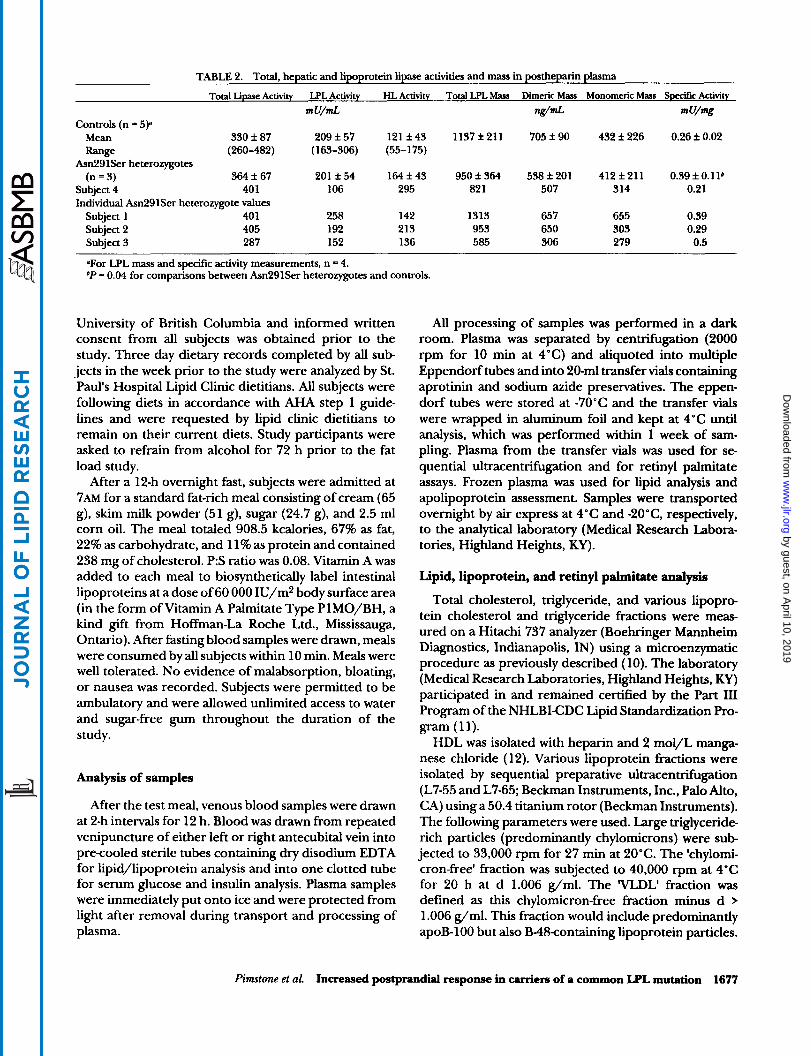
TABU 2. Total, hepatic and lipoprotein lipase activities and mass in postheparin plasma
Total Lipase Activity LPL Activity HL Activity Total LPL Mass Dimeric Mas Monomeric Mass Speeifrc Activity
m U/mL MmL mu!% Controls (n = 5p
Mean 330 f 87 209 f 57 121 f 43 1137 f 211 705 f 90 432 f 226 0.26 f 0.02 Range (260-482) (163-306) (55-175)
Asn291Ser heterozygotes (n = 3) 364 f 67 201 f 54 164 f 43 950 f 364 538 f 201 412 f 211 0.39 f O . l l b
Subject 4 401 106 295 82 1 507 314 0.21 Individual Asn291Ser heterozygote values
Subject 1 40 1 258 142 1313 657 655 0.39 Subject 2 405 192 213 953 650 303 0.29 Subject 3 287 152 136 585 306 279 0.5
OFor LPL mass and specific activity measurements, n = 4. bP = 0.04 for comparisons between Asn291Ser heterozygotes and controls.
University of British Columbia and informed written consent from all subjects was obtained prior to the study. Three day dietary records completed by all sub- jects in the week prior to the study were analyzed by St. Paul's Hospital Lipid Clinic dietitians. All subjects were following diets in accordance with AHA step 1 guide- lines and were requested by lipid clinic dietitians to remain on their current diets. Study participants were asked to refrain from alcohol for 72 h prior to the fat load study.
After a 12-h overnight fast, subjects were admitted at 7AM for a standard fat-rich meal consisting of cream (65 g), skim milk powder (51 g), sugar (24.7 g), and 2.5 ml corn oil. The meal totaled 908.5 kcalories, 67% as fat, 22% as carbohydrate, and 11% as protein and contained 238 mg of cholesterol. P:S ratio was 0.08. Vitamin A was added to each meal to biosynthetically label intestinal lipoproteins at a dose of 60 000 IU/m2 body surface area (in the form of Vitamin A Palmitate Type PlMO/BH, a kind gift from Hoffman-La Roche Ltd., Mississauga, Ontario). After fasting blood samples were drawn, meals were consumed by all subjects within 10 min. Meals were well tolerated. No evidence of malabsorption, bloating, or nausea was recorded. Subjects were permitted to be ambulatory and were allowed unlimited access to water and sugar-free gum throughout the duration of the study.
Analysis of samples
After the test meal, venous blood samples were drawn at 2-h intervals for 12 h. Blood was drawn from repeated venipuncture of either left or right antecubital vein into precooled sterile tubes containing dry disodium EDTA for lipid/lipoprotein analysis and into one clotted tube for serum glucose and insulin analysis. Plasma samples were immediately put onto ice and were protected from light after removal during transport and processing of plasma.
All processing of samples was performed in a dark room. Plasma was separated by centrifugation (2000 rpm for 10 min at 4°C) and diquoted into multiple Eppendorf tubes and into 20-ml transfer vials containing aprotinin and sodium azide preservatives. The eppen- dorf tubes were stored at -70°C and the transfer vials were wrapped in aluminum foil and kept at 4°C until analysis, which was performed within 1 week of sam- pling. Plasma from the transfer vials was used for se- quential ultracentrifugation and for retinyl palmitate assays. Frozen plasma was used for lipid analysis and apolipoprotein assessment. Samples were transported overnight by air express at 4°C and -2O"C, respectively, to the analytical laboratory (Medical Research Labora- tories, Highland Heights, KY).
Lipid, lipoprotein, and retinyl palmitate analysis
Total cholesterol, triglyceride, and various lipopro- tein cholesterol and triglyceride fractions were meas- ured on a Hitachi 737 analyzer (Boehringer Mannheim Diagnostics, Indianapolis, IN) using a microenzymatic procedure as previously described (10). The laboratory (Medical Research Laboratories, Highland Heights, KY) participated in and remained certified by the Part 111 Program of the NHLBI-CDC Lipid Standardization Pro-
HDL was isolated with heparin and 2 mol/L manga- nese chloride ( 12). Various lipoprotein fractions were isolated by sequential preparative ultracentrifugation (L7-55 and L7-65; Beckman Instruments, Inc., Palo Alto, CA) using a 50.4 titanium rotor (Beckman Instruments). The following parameters were used. Large triglyceride- rich particles (predominantly chylomicrons) were sub- jected to 33,000 rpm for 27 min at 20°C. The 'chylomi- cron-free' fraction was subjected to 40,000 rpm at 4°C for 20 h at d 1.006 g/ml. The 'VLDL' fraction was defined as this chylomicron-free fraction minus d > 1.006 g/ml. This fraction would include predominantly apoB-100 but also B48containing lipoprotein particles.
gram (11).
Pimtone et al. Increased postprandial response in carriers of a common LPL mutation 1677
by guest, on April 10, 2019
ww
w.jlr.org
Dow
nloaded from

PlASMARmhMPALMl'rAlERESWNSE 3.2
h -I E 2.8 2 2.4
4 2.0
1.6
p 1.2
a Q 4
c Q
c
2 0.8 z
0.4
0 AsnZglSer SubJect4 Controls
(n=3) (n=s)
C H Y L O " REllNYL PAlMKATE REspoNsE
2.5 I i n -J E 2 2.0 .€ a 4 (D 1.5 '' E
1.0 a c
c
2 5 0.5
d 0
Am291Ser SubJect 4 Controls (n=3) (-5)
Fig. 1. A Mean plasma retinyl palmitate response for Asn29lSer carriers, subject 4 and controls. B: Mean chylomicron retinyl palmitate response for Asn291Ser carriers, subject 4 and controls.
IDL was isolated by ultracentrifugation of the d > 1.006 g/ml fraction using the same parameters except at d 1.019 g/ml. LDL was defined as the difference between the d > 1.019 g/ml and the isolated HDL fraction described above. HDL-3 was isolated by ultracentrifuga- tion at d 1.125 g/ml and HDL-2 by the difference between HDL by precipitation and the HDL-3 isolate.
Plasma retinyl palmitate (RP), the RP content of chy- lomicron and non-chylomicron fractions were meas- ured by HPLC as previously described (8). Apolipopro- teins A-I and B were analyzed by immunonephelometry using monospecific antisera and standardized to WHO referenced calibrators (Behring, Germany) ( 13).
Apolipoprotein C-I11 and LpAI (lipoprotein particles containing only apolipoprotein A-I) were quantitated using hydrogel electroimmunodiffusion as previously described (14). Glucose was measured on the Hitachi
747 using hexokinase-based reagent. Insulins were quan- titated by radioimmunoassay (Diagnostic Products Cor- poration, Los Angeles, CA).
Postheparin plasma lipolytic activities and mass
One week prior to the fat load study, all subjects received an intravenous dose of heparin (60 U/kg body weight, Hepalean, Organon Teknika, Toronto, Can- ada). Subjects were fasted for 12-14 h and were asked to refrain from alcohol for 72 h prior to the heparin challenge test. Fasting plasma samples were drawn pre- heparin challenge into EDTA tubes and 15 min post- heparin challenge into lithium heparin tubes for assess- ment of plasma total lipase (TL) and hepatic lipase (HL) activities. Plasma was separated by centrifugation at 2000 rpm for 10 min at 4°C and thereafter frozen at -70°C. Lipolytic activities were measured using a radio- labeled Tri-[3H]oleoylglycerol emulsion as previously described (15). Total lipase activity was measured by the release of oleic acid at 37°C. HL activity was quantified after inhibition of LPL by 1 M NaCl. LPL activity was extrapolated by subtraction of HL from TL activities. Measurements are in mU/ml, where 1 mU is equivalent to 1 nmol FFA released per min at 37°C. Total and dimeric LPL mass in post-heparin plasma samples were measured by an ELISA method as previously described (16).
DNA analysis of LPL mutations
DNA was extracted from leukocytes by standard pro- cedures ( 17). Exon 6 of the LPL gene was amplified and underwent RSA I digestion as previously described (4).
Two LPL mutations occurring with allelic frequency of >1% in the general population, the Asp9Asn and Ser447-Ter mutations in exons 2 and 9, respectively, were excluded in all subjects by PCR techniques pre- viously described (18, 19). Subject 4 with 50% normal LPL activity was assessed for mutations in his LPL gene by SSCP analysis as previously described (20). No band- shifts were noted in exons 1-9 and the molecular cause for the underlying functional defect remains as yet unknown.
ApoE genotyping
ApoE genotyping was performed using a PCR ampli- fication method previously described (21) followed by digestion with the restriction enzyme CFO 1, an isoschi- zomer of HhaI. This method has been described in detail elsewhere (22). Restriction fragments were then separated on polyacrylamide gel electrophoresis run at 30 mA and isoforms were read against a PUC 18 marker, digested with MspI.
1678 Journal of Lipid Research Volume 37, 1996
by guest, on April 10, 2019
ww
w.jlr.org
Dow
nloaded from

Statistical methods
Means and standard deviations (SD) were calculated using conventional methods. Within-group compari- sons of means at various time points during the fat load study were made using the Student's paired t-test (Mi- crosoft Excel, version 5.0). Between-group comparisons were tested using the one-way ANOVA after variance was shown to be equal by the Bartlett test for homoge- neity of group variance. When the variance values of the two groups were unequal, a non-parametric Mann-Whit- ney U test was used to detect between-group signifi- cance. Where the coefficient for age as a covariate was significant, an analysis of covariance was performed to take into account age effects on the parameter meas- ured.
Where indicated, values in our study were corrected for baseline by subtracting t = 0 (baseline) values from values at each subsequent timepoint. The TG and RP response curves were drawn by plotting the corrected for baseline values versus time and fitting a smooth curve through the data points, using the cubic spline fit (KaleidaGraph, version 2.0.2). The area between this curve and the x-axis (area under curve, AUC) was inte- grated using the trapezoidal rule (KaleidaGraph, version
TG had returned to baseline in all subjects by 10 h and therefore plasma and CM TG AUC were calculated between t = 0 and t = 10. RP on the other hand had not returned to baseline by 10 h in all subjects and therefore RP AUCs were calculated as the area between t = 0 and t = 12. To determine the correlations between various measured parameters, data for both groups were pooled and the Spearman correlation coefficients were deter- mined. To account for the effect of multiple compari- sons, the accepted level of significance was adjusted using the Bonferroni correction (adjusted level of sig- nificance, P = 0.01). Unless otherwise stated, statistical analyses were performed on the Systat statistical pack- age (Version 5.2 for the Macintosh, U.B.C).
2.0.2).
RESULTS
Subject characteristics The baseline characteristics of study subjects are
shown in Table 1. Asn291Ser carriers, controls, and subject 4 with a catalytically defective LPL were matched for BMI and were between 24 and 49 years of age. No significant difference was noted between carriers and controls for age or BMI. All subjects were normotensive and non-smokers (data not shown).
Fasting plasma triglycerides were below the 80th per- centile for age and sex in all Asn291Ser subjects, a criterion for inclusion in the study. Despite fasting
plasma triglyceride levels in the normal range, the Asn291Ser heterozygote group had higher values com- pared with controls (P = 0.005). In addition, VLDLTG and VLDL-cholesterol were both significantly higher in Asn291Ser carriers compared with controls (P = 0.02, respectively). HDL2-TG was higher in Asn291Ser carri- ers compared with controls (P= 0.02) and was somewhat higher than the level seen in subject 4. No significant difference was seen in fasting HDLcholesterol levels among Asn291Ser carriers, controls, and subject 4. Mean plasma apoC-I11 was significantly higher in carri- ers compared with controls at baseline (P = 0.004). N o significant difference was seen in mean apoA-I and apoB levels among the groups (data not shown). Fasting glu- cose and insulin levels were normal in all subjects and no significant difference was observed among the groups (data not shown).
Postheparin lipase activities and mass Mean LPL activity between carriers of the Asn291Ser
mutation and controls was similar (Table 2). This was primarily due to the high LPL activity of subject 1, an Asn291Ser carrier and a marathon runner whose higher LPL activity is in keeping with the higher levels pre- viously reported in endurance trained athletes (23,24). Subject 4 had an LPL activity approximately 50% of controls. Total and dimeric LPL mass were not signifi- cantly different between Asn29lSer carriers and con- trols (Table 2). Overlap existed in specific activity (SA) measurements among subjects in both Asn291Ser car- rier and control groups. Subject 4 had the lowest SA of all study participants (Table 2).
Total plasma, chylomicron (CM), and non-chylomicron (NC) RP response to the vitamin A fat load
The mean plasma RP response over time is shown in Fig. 1A. Mean plasma RP peak was reached at 4 h in controls and was delayed to 6 h in the Asn291Ser carriers and 8 h in subject 4. It must be noted that variation in the time to reach peak RP levels was seen in individuals within both Asn29 lSer carrier and control groups. One of the five controls peaked at 6 h and the female Asn291Ser carrier (subject 3) had a marginally higher level at t = 4 h than at t = 6 (data not shown). Mean plasma RP peak levels were higher in Asn291Ser carriers compared with controls (P = 0.03) (Table 3). All Asn291Ser carriers had higher RP peak levels than the mean RP peak for the control population. Significance was reached between Asn291Ser carriers and controls in plasma RP levels at t = 4 (P= 0.008) and t = 6 ( P = 0.03) (Fig. 1A). Peak plasma RP was higher in subject 4 than in all Asn291Ser carriers (Table 3).
Mean plasma RP area under curve (AUC) was signifi- cantly higher in the Asn291Ser carrier group compared
Pimstone et al. Increased postprandial response in carriers of a common LPL mutation 1679
by guest, on April 10, 2019
ww
w.jlr.org
Dow
nloaded from

TABLE 3. Peak retinyl palmitate and triglyceride levels
- Retinyl PalmitaLe Triglycerides
Plasma Chylomicron Non-Chylomicron Plasma Chylomicron
mg/mL mmol/L
Controls (n = 5)
Mean 0.68 + 0.10 0.52 i 0.24 0.26 f 0.15 0.38 f 0.12 0.27 f 0.10
Range (0.55-0.82) (0.25-0.89) (0.08-0.45) (0.22-0.50) (0.10-0.35)
Asn291Ser heterozygotes (n = 3) 1.67 f 0.6qe 1.30 f O.3Sb 0.55 It 0.43 1.25 f 0.69 0.86 f 0.4W
Subject 4 3.15 2.36 0.95 1.28 1.30
Individual Am29 lSer heterozygote values
Subject 1 1.97 1.38 1.05 0.47 0.59
Subject 2 2.16 1.65 0.32 1.77 1.32
Subject 3 0.88 0.90 0.28 1.51 0.67
P values compared to controls: aP = 0.03; *P = 0.02.
with controls ( P = 0.05), but lower than the plasma RP AUC in subject 4 (Table 4).
Postprandial alterations in chylomicron metabolism. Asn29 lSer carriers had significantly increased chylomi- cron RP (CRP) peak heights compared with controls ( P = 0.02) (Table 3). The difference between the two groups was particularly evident at t = 6 ( P = 0.001). No overlap existed between any Asn291Ser carrier or control in CRP peak height (data not shown). As with peak plasma RP, peak CRP was delayed in the male Asn291Ser carriers (t = 6) compared with controls (t = 4) (Fig. 1B). All controls had peaked at 4 h (data not shown). The female LPL carrier (subject 3) had her CRP peak at t =
4, earlier than the male Asn291Ser carriers who peaked at t = 6. CRP peak level was higher in subject 4 than in any Asn291Ser carrier (Table 3). Mean CRP AUC was significantly higher in the Asn291Ser carriers compared with controls ( P = 0.01) (Table 4) and no overlap existed between the two groups. Subject 4 had the greatest CRP AUC (Table 4).
Alterations in non-chylomicron RP response. Mean NCRP peak was higher in the Asn29lSer heterozygotes com- pared with controls, but this did not reach significance (Table 3). Within the Asn291Ser group, one male sub- ject (subject l), displayed a greater NCRP compared with the other two carriers whose peak NCRP levels were more in keeping with those of the control group (Table 3). An elevated NCRP curve was also observed in subject 4. Both subjects 1 and 4 with greater NCRP curves are carriers of the apoE2 isoform (E2/E3 genotypes) and these results are in keeping with delayed remnant clear- ance as is often seen in carriers of the E2 isoform.
Plasma and lipoprotein TG response to the vitamin A fat load
The mean plasma TG clearance is shown in Fig. 2A. All subjects had a mean peak level at t = 4 and had
returned to baseline by t = 10. Significantly higher plasma TG levels were noted in the Asn291Ser group at t = 4 ( P = 0.02) and t = 6 (P = 0.03) when compared with controls. Variation existed within Asn291Ser carriers and controls in the peak plasma TG level. Within the Asn291Ser heterozygote group, subject 1, a long dis- tance runner, had a lower peak level compared with the other two Asn291Ser carriers in the group. This is probably a reflection of the substantially reduced peak VLDL-TG in this individual (data not shown). His peak plasma TG level however, was still marginally higher than the mean peak plasma TG level for the control group (Table 3). Plasma TG AUC was higher in Asn291Ser carriers compared with controls, but signifi- cance was not reached. The highest peak plasma TG level was reached in subject 4.
Alterations in chylomicron triglyceride metabolism (CTG). Mean peak CTG levels were significantly higher in the Asn291Ser carriers compared with controls ( P = 0.03) (Table 3). Levels were higher at t = 4 ( P = 0.001) and t =
6 ( P = 0.05) (Fig. 2B). CTG in all subjects had returned to baseline by 10 h. As with CRP, all carriers had higher CTG peaks than any control. Peak CTG level was highest in subject 4 with his peak being reached at t = 4. CTG AUC was significantly higher in Asn291Ser carriers compared with controls ( P = 0.02) (Table 4), but was highest in subject 4 .
Postprandial VLDL and HDL TG response. Asn291Ser carriers had significantly higher VLDL TG levels at 6 h postprandially (P = 0.036) (data not shown). Variation was small within the control group for VLDL TG in response to the fat load (data not shown). However, within the LPL carrier group, subject 1 responded very differently from the other Asn29 lSer carriers and from subject 4 with functionally defective LPL. In subject 1, the endurance-trained athlete, there was very little re- sponse in VLDL TG to the fat meal (data not shown).
1680 Joumd of Lipid Research Volume 37, 1996
by guest, on April 10, 2019
ww
w.jlr.org
Dow
nloaded from

TABLE 4. Retinyl palmitate and triglyceride areas under curve
Retinyl Palmitate Plasma Chylomicron NonGhylomicron
Controls (n = 5) Mean 4.43 f 0.53
9.28 f 4.05' Range (3.90-5.32)
Asn291Ser heterozygotes (n = 3) Subject 4 21.6 Individual Asn291Ser heterozygote values
Subject 1 12.6 Subject 2 10.5 Subject 3 4.77
mdml x h
2.59 f 1.12
6.66 It 2.066
1.93 f 1.09
3.37 f 2.33 (1.16-4.01) (0.54-3.28)
13.8 6.62
6.78 6.03 8.66 2.37 4.55 1.72
Triglycerides
mmol/L x h Chylomicron Plasma
0.91 f 0.63
4.32 f 3.15
1.11 f 0.53
2.87 f 1.12' (0.08- 1.55) (0.23- 1.55)
4.92 5.63
0.75 1.96 6.72 4.11 5.48 2.53
P values compared to controls: = 0.05; bP = 0.01; cP = 0.02.
This individual's lower VLDL TG response is in keeping with what has been observed previously in trained ath- letes (25).
After correcting for baseline HDL TG values, the response to the fat load was different between the two groups in that higher peaks were obtained in Asn291Ser carriers at both 4 and 6 h with significance being ap- proached at t = 6 (P = 0.053). This elevated HDL TG was contributed to by both HDL2 and HDLs components, TG in HDLs being higher in Asn291Ser carriers at t = 4 (P = 0.049) and TG in HDLz being higher in carriers at t = 6 (P = 0.038).
LDL and IDL-TG did not show an appreciable rise in either group in response to the fat load study. Nor was there an appreciable change in HDL cholesterol levels postprandially (data not shown).
Correlation between postabsorptive TG, LPL activity, and TG AUC
Fasting TG levels were positively associated with plasma TG AUC (P = 0.036), but did not reach the Bonferroni adjusted significance level of P = 0.01. How- ever, baseline TG was positively associated with CTG AUC (P = 0.001) (Fig. 3A). Baseline TG was also posi- tively correlated with CRP AUC (P= 0.001) (Fig. 3B). No significant correlations were observed between fasting LPL activity and either CTG or CRP AUC (data not shown).
DISCUSSION
The present study was undertaken to determine the influence of an environmental stress in the form of an oral high fat load on carrier status for a common muta- tion in the LPL gene (Asn291Ser). Our hypothesis was that normolipidemic carriers of this mutation would exhibit a more pronounced postprandial response to a high fat meal compared with normolipidemic controls. We find that despite normolipidemia amongst carriers
in the fasting state, carriers of the Asn291Ser mutation in this study could be recognized by an oral fat challenge with or without labeling intestinally derived particles with Vitamin A. This response in these Asn291Ser car- riers was intermediate between that of controls and a subject with 50% LPL catalytic activity, suggesting a partial lipolytic defect associated with the Asn291Ser mutation, even for subjects with fasting nor- molipidemia. Although fasting triglyceride levels fell within the normal range in Asn291Ser carriers, these levels were approximately twice those of the control group. As fasting triglyceride levels have been shown previously to be a predictor of postprandial response (26,27), all relevant analyses were performed correcting for baseline lipid values similar to that used by other investigators (28, 29).
Carriers for mutations in the LPL gene (Gly188Glu) have previously been shown to have exaggeration of disturbances in lipoprotein values after a dietary fat challenge (8). Our investigation, however, differs in two ways from those previously examining postprandial re- sponse in LPL heterozygotes. First, unlike the vast ma- jority of mutations in the LPL gene which are fairly rare (incidence of carrier status is estimated at approximately 1 in 500 persons (l)), we have investigated a common mutation, (2-4%) in Caucasians (4). Second, the lipolytic defect induced by this common DNA alteration is partial in nature, resulting in a loss of approximately 30% of LPL activity when measured after a heparin challenge (4). Furthermore, these moderate reductions in lipolytic activity are not evident in all Asn291Ser carriers, many of whom are clearly normolipidemic (4, 30).
These factors have posed valid questions as to the functional nature of this common mutation. Secondary genetic and environmental factors have previously been shown to influence the phenotypic expression of this mutation (5, 6).
One potentially important confounding factor in this study is the presence of the E2 genotype in two Asn291Ser carriers. While the apoE genotype may influ-
Pimstone et al. Increased postprandial response in carriers of a common LPL mutation 1681
by guest, on April 10, 2019
ww
w.jlr.org
Dow
nloaded from

-"" 0 2 4 6 8 1012 ' 0 2 4 8 81012 ' 0 2 4 6 8 1 0 1 2 I Asn291Ser Subject4 Controls
(n.3) (n=6)
CHYLXlMCRONTFPGLYCEW#RESWNSE 1 . A X
0 2 4 6 81012 ' 0 2 4 6 81012 ' 0 2 4 6 8 1 0 1 2 '
Asn29lSer Subject4 Controls (no31 (n=W
Fig. 2. A: Mean plasma triglyceride response for Asn291Ser carriers, subject 4 and controls after correction for baseline triglyceride values. B: Mean chylomicron triglyceride response for Asn29lSer carriers, subject 4 and controls after correction for baseline triglyceride values.
ence the metabolism of the non-chylomicron (predomi- nantly remnant) fraction, postprandial chylomicron triglyceride and chylomicron retinyl palmitate re- sponses have not been shown to be influenced by the apoE genotype (31-34). Indeed, both postprandial chy- lomicron and non-chylomicron metabolism were signifi- cantly altered and therefore apoE genotype cannot be invoked to account for these findings.
Despite a small sample size, significantly different results were observed in the Asn291Ser carriers com- pared with controls with respect to markers used for determining postprandial response. Peak CTG and CRP levels were significantly higher in carriers of the Asn291Ser mutation compared with controls (P = 0.03 and P = 0.02, respectively). In particular, subject 1, a marathon runner, had a significant postprandial CTG response. This was in spite of an extremely low VLDL
TG level postprandially which should have resulted in less inhibition of lipolysis of intestinally derived particles by competition from VLDL. One may, therefore, have expected in this individual with elevated LPL activity and reduced VLDL TG, that his postprandial chylomicron response would not have been abnormal. However, despite this, an increased postprandial response was observed. Delayed plasma and CRP peaks at 6 h were observed in both male carriers compared with 4 h in controls. This was not, however, the case in the female Asn291Ser carrier (subject 3), who peaked at 4 h. This finding is in keeping with prior reports suggesting ear- lier peak RP levels and lower postprandial RP response in women compared with men matched for age and BMI (35). Delayed CRP peaks in both male Asn291Ser carri- ers compared with male controls may suggest a delay in clearance of large TG-rich (predominantly CM) parti- cles.
Another assessment of CM particle clearance was made by determining the magnitude of the area under the CM curve postprandially. Mean CTG AUC was significantly higher in Am29 lSer carriers compared with controls (P = 0.02) as was mean peak CRP AUC (P = 0.01), suggesting delayed clearance of large TG-rich particles.
An abnormal postprandial response in Asn291Ser carriers in our study would not have been predicted by measurements of LPL activity and mass. Subject 3 had the lowest postprandial response of the Asn291Ser car- riers despite the lowest LPL activity. Subject 1, on the other hand, had a marked postprandial response despite the second highest LPL activity of all subjects studied. In addition, fasting LPL activity measurements did not correlate significantly with CTG or CRP AUC. Fasting LPL activity measurements, therefore, may not always predict postprandial response, particularly in persons with a mutation in the LPL gene. It is possible that mechanisms regulating LPL activity in vivo, either tran- scriptional or translational, may be different in the fasting state compared to when challenged by a high fat meal. In fact, LPL activity in both animal and normal human subjects has shown significant increases after fat feeding, (36, 37). Carriers of this mutation in the LPL gene may therefore be unable to respond to a high fat diet by an increase in their LPL activity compared to normal subjects. Thus, a high fat diet may unmask a previously hidden defect in lipolysis in these subjects.
As LPL activity has been shown to be modulated by apoC-111, it is of interest that higher levels of total plasma apoC-111 were seen in Asn291Ser carriers compared with controls (Table 1). These findings are in keeping with another study of LPL heterozygotes that demonstrated higher plasma C-111 levels in VLDL in heterozygotes for LPL deficiency (38). ApoC-111 has previously been
1682 Journal of Lipid Research Volume 37,1996
by guest, on April 10, 2019
ww
w.jlr.org
Dow
nloaded from

6 , 1
0 0.5 1 2 2: 5 Triglycdd# (mmdn)
0 % -
14 a
M . 8 4 1 ,P = 0.001 z :; 12 --
B f 0 - c I I I I 4
0 0.5 1 1.6 2 2.6 <
Trlglycddor (mmolk)
Fig. 3. A Area under chylomicron TG response curve versus base- line TG levels. A significant positive correlation is shown between these variables. B: Area under chylomicron RP response curve versus baseline TG levels. A significant positive correlation is shown between these variables.
shown to inhibit the action of LPL in vivo and in vitro (39,40). Higher apoC-I11 levels may therefore be impor- tant modulators of LPL activity in these Asn291Ser carriers and may contribute to the impaired post- prandial response.
The present study suggests that normolipidemic car- riers of the common Asn291Ser mutation have an ab- normal postprandial response to an oral fat load and provides further in vivo evidence as to the functional nature of this mutation in the LPL gene.
This paper is dedicated to Marianne H, a study participant who passed away tragically during preparation of the manuscript. This work was supported by the MRC Canada and the Heart and Stroke Foundation of British Columbia and the Yukon. We acknowledge the support of Drs. Ulrike Beisegel, Howard Henderson, John Brunzell, John Hokanson, Jiri Frohlich, and Haydn Pritchard for their valuable comments and criticisms. We also acknowledge and thank St. Paul's Hospital Lipid
Clinic dietitians, Shauna Rattner and Francis Johnson, for their contribution. Dr. M. R. Hayden is an established investi- gator of the British Columbia Children's Hospital.
Manuccript received 28 December 1995, in revised form 12 March 1996, and in re-revised fm 13 May 1996.
1.
2.
3.
4.
5.
6.
7.
8.
9.
10.
11.
REFERENCES
Brunzell, J. D. 1995. Familial lipoprotein lipase deficiency and other causes of the chylomicronemia syndrome. In The Metabolic Basis of Inherited Disease. 7th ed. C. R. Scriver, A. L. Beaudet, W. S. Sly and D. Valle, editors. McCraw-Hill BookCo., New York. Volume 11.1913-1932. Hayden, M. R., and Y. Ma. 1990. Molecular genetics of lipoprotein lipase deficiency. Mol. Cell. Biochem. 113:
Ma, Y., T. C. Ooi, M. S. Liu, H. Zhang, R. McPherson, A. L. Edwards, I. J. Forsythe, J. Frohlich, J. D. Brunzell, and M. R. Hayden. 1994. High frequency of mutations in the human lipoprotein lipase gene in pregnancy-induced chy- lomicronemia: possible association with apolipoprotein E2 isof0rm.J Lipid Res. 35: 1066-1075. Reymer, P. W. A., S. E. Gagn6, B. E. Groenemeyer, H. Zhang, I. Forsythe, H. Jansen, J. C. Seidell, D. Kromhout, K. E. Lie, J. Kastelein, and M. R. Hayden. 1995. Alipopro- tein lipase mutation (Asn291Ser) is associated with re- duced HDL cholesterol levels in premature atherosclerosis. Nut. Genet. 10: 28-34. Zhang, H., P. W. A. Reymer, M-S. Liu, I. J. Forsythe, B. E. Groenemeyer, J. Frohlich, J. D. Brunzell, J. J. P. Kastelein, M. R. Hayden, and Y. Ma. 1995. Patients with apoE3 deficiency (E2/2, E3/2, and E4/2) who manifest with hyperlipidemia have increased frequency of an Asn291Ser mutation in the human LPL gene. Arta'oscler. Thromb. 15: 1695-1703. Reymer, P. W. A., B. E. Groenemeyer, S. E. Gagn6, L. Miao, E. E. G. Appelman, J. C. Seidell, D. Kromhout, S. M. Bijvoet, K. vd Oever, T. Bruin, M. R. Hayden, and J. J. P. Kastelein. 1995. A frequently occurring mutation in the lipoprotein lipase gene (Asn291Ser) contributes to the expression of familial combined hyperlipidemia. Hum. Mol. Genet. 4: 1543-1549. Miesenbock, G., B. Holzl, B. Foger, E. Brandstatter, B. Paulweber, F. Sandhofer, andJ. R. Patsch. 1993. Heterozy- gous lipoprotein lipase deficiency due to a missense mu- tation as the cause of impaired triglyceride tolerance with multiple lipoprotein abnormalities. J. Clin. Invest. 91:
Sprecher, D. L., S. L. Knauer, D. M. Black, L. A. Kaplan, A. A. Akeson, M. Dusing, D. Lattier, E. A. Stein, M. Rymaszewski, and D. A. Wiginton. 1991. Chylomicron-ret- inyl palmitate clearance in type I hyperlipidemic families. J. Clin. Invest. 88: 985-994. Cohen, J. C., T. D. Noakes, and A. J. Spinnler Benade. 1989. Postprandial lipemia and chylomicron clearance in athletes and in sedentary men. Am. J. Clin. Nutr. 49: 443-447. Lipid Research Clinics Program. 1982. Manual of Labo- ratory Operations: Lipid and Lipoprotein Analysis. Wash- ington D.C., U.S. Department of Health, Education and Welfare. 1982. Publication (NIH) 75-628. Myers, G. L., G. R. Cooper, C. L. Winn, and S. J. Smith. 1989. The Centers for Disease Control National Heart,
171- 176.
448-455.
Pimtone et al. Increased postprandial response in carriers of a common LPL mutation 1683
by guest, on April 10, 2019
ww
w.jlr.org
Dow
nloaded from

Lung, and Blood Institute Lipid Standardization Pro- gram: an approach to accurate and precise lipid measure- ments. Clin. Lab. Med. 9: 105-135.
12. Warnick, G. R., and J. J. Albers. 1978. A comprehensive evaluation of the heparin manganese precipitation proce- dure for estimating high-density lipoprotein cholesterol. J. Lipid Res. 19: 65-76.
13. Smith, S. J., G. R. Cooper, L. 0. Henderson, and W. H. Hannon. 1987. An international collaborative study on standardization of apolipoproteins A-I and B. Clin. Chem.
14. Parra, H. J., G. Mezdourh, J. M. Bard, and J. C. Fruchart. 1990. Differential electroimmunoassay of human LpA-I lipoprotein particles on ready-to-use plates. Clin. Chem.
15. Nilssohn-Ehle, P., and M. C. Scholtz. 1976. A stable, radioactive substrate emulsion for assay of lipoprotein lipase. J. Lipid Res. 17: 536-541.
16. Babirak, S. P., P. H. Iverius, W. Y. Fujimoto, and J. D. Brunzell. 1989. Detection and characterization of het- erozygous state for lipoprotein lipase deficiency. Artm’o-
17. Technical Tips. 1989. An efficient salt-chloroform extrac- tion of DNA from blood and tissue. Trends Genet. 5: 391.
18. Mailly, F., Y. Tugrul, P. W. A. Reymer, T. Bruin, M. Seed, B. J. Groenemeyer, A. Asplund-Carlson, D. Vallance, A. F. Winder, G. J. Miller, J. J. P. Kastelein, A. Hamsten, G. Olivecrona, S. E. Humphries, and P. J. Talmud. 1995. A common variant in the gene for lipoprotein lipase (Asp9Asn): functional implications and prevalence in nor- mal and hyperlipidemic subjects. Artm’oscler. Thromb. Vasc. Biol. 15: 468-478.
19. Mattu, R. K. E. W. A. Needham, R. Morgan, A. Rees, A. K. Hackshaw, J. Stocks, P. C. Elwood, and D. J. Galton. 1994. DNA variants at the LPL gene locus associate with angiographically defined severity of atherosclerosis and serum lipoprotein levels in a Welsh population. Arterios- cler. Thromb. 14: 1090-1097.
20. GagnC, S. E., J. Genest, Jr., H. Zhang, L. A. Clarke, and M. R. Hayden. 1994. Analysis of DNA changes in the LPL gene in patients with familial combined hyperlipidemia. Arterioscler. Thromb. 14: 1250-1257.
21. Main, B. F., P. J. H. Jones, R. T. A. MacGillivray, and D. K. Banfield. 1991. Apolipoprotein E genotyping using the polymerase chain reaction and allele-specific oligonu- cleotide primers. J. Lipid Res. 32: 183-187.
22. Hixson, J. E., and T. E. Vernier. 1990. Restriction isotyp ing of human apolipoprotein E by gene amplification and cleavage with HhaI. J. Lipid Res. 31: 545-548.
23. Peltonen, P., J. Marniemi, E. Hietanen, I. Vuori, and C. Enholm. 1981. Changes in serum lipids, lipoproteins and heparin releasable lipolytic enzymes during moderate physical training in man: a longitudinal study. Metabolism.
24. Nikkila, E. A., M-R. Taskinen, S. Rehunen, and M. Harkonen. 1978. Lipoprotein lipase activity in adipose tissue and skeletal muscle of runners: relation to serum lipoproteins. Metabolism. 27: 1661 - 1667.
25. Wirth, A., C. Diehm, W. Hanel, J. Welte, and I. Vogel. 1985. Training-induced changes in serum lipids, fat toler- ance, and adipose tissue metabolism in patients with hypertriglyceridemia. Atheroscbosis. 5 4 263-271.
33: 2240-2251.
36: 1431-1435.
S C ~ U O S ~ ~ . 9: 326-334.
3 0 518-526.
26. O’Meara, N. M., G. F. Lewis, V. G. Cabana, P. H. Iverius, G. S. Getz, and K. S. Polonsky. 1992. Role of basal triglyceride and high density lipoprotein in determination of postprandial lipid and lipoprotein responses. ./. Clin. Endocrinol. Metab. 75: 465-471.
27. Karpe, F., G. Steiner, T. Olivecrona, L. A. Carlson, and A. Hamsten. 1993. Metabolism of triglyceride-rich lipopro- teins during alimentary lipemia. J. Clin. Invest. 9: 748-758.
28. Cohen, J. C., J. Stray-Gunderson, and S. M. Crundy. 1991. Dissociation between postprandial lipemia and high den- sity lipoprotein cholesterol concentrations in endurance- trained men. Arterioscler. Thromb. 11: 838-843.
29. Syvanne, M., M. Rosseneu, C. Labeur, H. Hilden, and M-R. Taskinen. 1993. Enrichment with apolipoprotein E characterizes postprandial TG-rich lipoproteins in pa- tients with non-insdindependent diabetes mellitus and coro- nary artery disease: a preliminary report. Athoschosis. 105: 25-34.
30. Funke, H., and G. Assmann. 1995. The lowdown on lipoprotein lipase. Nat. Genet. 10: 6-7.
31. Brown, A. J., and D. C. K. Roberts. 1991. The effect of fasting triacylglyceride concentration and apolipoprotein E polymorphism on postprandial lipemia. Artm‘oscler. Thromb. 11: 1737-1744.
32. Brenninkmeijer, B. J., P. M. J. Stuyt, P. N. M. Demacker, A. F. H. Stalenhoef, and A. van’t Laar. 1987. Catabolism of chylomicron remnants in normolipidemic subjects in relation to the apolipoprotein E phen0type.J. Lipid Res.
33. Weintraub, M. S., S. Eisenberg, and J. L. Breslow. 1987. Dietary fat clearance in normal subjects is regulated by genetic variation in apolipoprotein E. J. Clin. Invest. 80:
34. Boerwinkle, E., S. Brown, A. R. Sharret, G. Heiss, and W. Patsch. 1994. Apolipoprotein E polymorphism influences postprandial retinyl palmitate but not triglyceride concen- trations. Am. J. Hum. Genet. 54: 341-360.
35. Johnson, E. J,, S. D. Krasinski, and R. M. Russell. 1992. Sex differences in postabsorptive plasma vitamin A trans- port. Am. J. Clin. Nutr. 56: 911-916.
36. Zsigmond, E., E. Scheffler, T. M. Forte, R. Potenz, W. Wu, and L. Chan. 1994. Transgenic mice expressing human lipoprotein lipase driven by the mouse metallothionein promoter. J. Biol. Chem. 269: 18757-18766.
37. Peterson, J., B. E. Bihain, G. Bengtsson-Olivecrona, R. J. Deckelbaum, Y. A. Carpentier, and T. Olivecrona. 1990. Fatty acid control of lipoprotein lipase: a link between energy metabolism and lipid transport. Proc. Natl. Acad. Sci. USA. 87: 909-913.
38. Bijvoet, S., S. E. GagnC, S. Moorjani, C. GagnC, H. E. Henderson, J-C. Fruchart, J. Dallongeville, P. Alaupovic, M. Prins, J. J. P. Kastelein, and M. R. Hayden. 1996. Alterations in plasma lipoproteins and apolipoproteins before the age of 40 in heterozygotes for LPL deficiency. J. Lipid Res. 37: 640-650.
39. Wang, C-S., W. J. McConathy, H. U. Kloer, and P. Alau- povic. 1985. Modulation of lipoprotein lipase activity by apolipoproteins: effect of apolipoprotein C-111. J. Clin. Invest. 75: 384-390.
40. McConathy, W. J., J. C. Gesquire, H. Bass, A. Tartar, J-C. Fruchart, and C-S. Wang. 1992. Inhibition of lipoprotein lipase activity by synthetic peptides of apolipoprotein C-I1I.J. Lipid Res. 33: 995-1003.
28: 361-370.
1571-1577.
1684 Journal of Lipid Research Volume 37, 1996
by guest, on April 10, 2019
ww
w.jlr.org
Dow
nloaded from