Embed Size (px)
Citation preview

A Framework for GIS and Safe Routesto School
Improving Data Collection, Access and Usage
?
??
?
?????
??
?????
??
??
???
^
^
^
^
^
^^
^^^
^
^̂
^^̂ ^
^ ^ ^ ^ ^
^ ^^ ^
^̂ ^^^̂^ ^
^
^^^ ^
^^ ^̂̂
^ ^ ^^
^^ ^ ^^^ ^
^^ ^^^^ ^ ^ ^
^ ^ ^^
^ ^^
^^ ^
^^ ^ ^
^
^ ^
^^
^
^
^
Bakersfield City Elementary
Panama-Buena Vista Union Elementary
Lamont Elementary
Fairfax Elementary
Greenfield Union Elementary
Fruitvale ElementaryRosedale Union Elementary
Edison Elementary
Lakeside Union Elementary
Norris Elementary
Beardsley Elementary
Standard Elementary
Vineland Elementary¯
Bakersfield - Pedestrian or Bicycle Collisions Near School Sites (2007-2009)
0 0.5 1 Miles
*Schools classified according to percentage of students eligible for the Free/Reduced Price Meal Program (2010). **Safe Routes to School awards include state and federal funding from 2005 - 2011.
Sources: California Public School Database; SWITRS 2007-2009; Bing Maps
Schools by % FRPM*
^ Unknown
^ High Income (<40)
^ Middle Income (40-75)
^ Low Income (>75)
? Merged or Closed Schools
Pedestrian or Bicycle CollisionsInjury
Fatality
Safe Routes Grants Awarded**
") Infrastructure
") Non-Infrastructure
") Both
Collisions within 1/2 Mile
0
1 - 4
5 - 8
9 - 17
18 - 303

A
01 Executive Summary
03 Introduction
04 Background
06 Data Collection
08 Findings from the Field
10 The Top Ten List
14 GIS and Active Transportation: Recommendations
17 GIS Specific to Safe Routes to School
21 Conclusion
22 Acknowledgements
23 Footnotes
Table of Contents
front cover bottom photo courtesy U.S. Army Corps of Engineers Savannah District
photo above courtesy Lee Toma on Flickr

1
In light of this, the Safe Routes to School
National Partnership brought 15 experts
from various GIS-related fields to Austin,
Texas in April 2013 to discuss existing
datasets and what is not being collected,
how the general public can create and access
data, existing tools and technology and what
is needed to improve data connectivity and
mapping, how GIS could be better utilized
in Safe Routes to School and other active
transportation initiatives, and how to create
a national bicycling and walking database.
This group of experts first discussed
valuable tools and collections of data that
already exist at the federal, state and local
levels. They identified ways that the federal
government could improve data collection
through federal funding processes and
possible solutions to assist communities that
lack the funding or staff to collect data.
As Safe Routes to School programs have increased across the country, a clear need for better data management at the national level has become apparent. Many communities and Safe Routes to School programs have used Geographic Information System (GIS) mapping in assessments of the built environment and promotional campaigns, but because there is not a central place to store data, this information is stuck, in a sense, at the local level, and often not accessible to local champions. This leads to minimal sharing and discovery of local data and a lack of continuity in data collection on a national scale.
EXECUTIVE SUMMARY

After discussing the basics of GIS, how it is
currently being used in the active transporta-
tion world and the major players that are
involved, the group made several recommen-
dations. Some recommendations were easy to
make, while other topics, such as how to go
about funding a national database, will require
more discussion with important players in
the future.
The two biggest discussions that came out
of the meeting were for 1) a national
database that could store data which could
be easily accessed via the internet, and 2)
a standard Top Ten list of datasets that
should be collected when communities
assess built environment conditions for
bicycling and walking.
One way to make the data accessible is to
use open source, where the underlying
software code is freely available to all users,
and open data, where the data is available
for anyone to access and use. The biggest
advantage to these approaches is that users
are not constrained to one private GIS
company or tool and they can access and
use data as soon as it has been uploaded.
In order to feed data into a national
database, there needs to be a software
application (app) and/or standards for
mobile devices that allow champions,
parents, communities and schools to easily
assess and map sidewalks, bicycle lanes and
crosswalks, produce quality maps, and
upload data. Mobile devices are an impor-
tant component of the database, as they
allow information to be quickly and easily
uploaded to the database.
The Top Ten datasets list was recommended
as a way to ensure that data from across
the country can be collected and compared.
While most recommended datasets had to
do with infrastructure such as the presence
of sidewalks, striped crosswalks, and bicycle
facilities, the group consistently came back
to one question: “Do people feel safe
walking or riding a bicycle here?” Regardless
of the presence or absence of sidewalks,
paths, crosswalks, crossing guards or traffic
calming devices, if people do not feel safe,
they are less likely to walk or ride a bicycle.
By using GIS to map where people do
and do not feel safe at a particular block
or street, a community can then evaluate
why they feel that way and then address
the specific problems.
Our goal is that this report will advance
conversations regarding ways that GIS can
assist Safe Routes to School programs and
how to go about creating a national active
transportation. GIS is an extremely powerful
tool for numerous reasons, especially
as it allows people to have a more complete
picture of what is happening in their own
communities, states and the nation.
2
EXECUTIVE SUMMARY CONTINUED
photo courtesy U.S. Army Corps of Engineers Savannah District

Safe Routes to School is a national and international movement to get more students walking and bicycling to school and in daily life. Safe Routes to School initiatives can save money, decrease traffic congestion, increase safety, improve health and have long-term positive economic impacts for communities that are interested and willing to make the initial investment.
A critical first step for any initiative is to
perform an inventory of the built environ-
ment around the school to identify existing
sidewalks, sidewalk gaps, needed sidewalk
improvements, bicycle facilities, and traffic
safety hotspots, and to assess the environ-
ment where students live and play. Many
programs create maps that outline the safest
routes to and from school, highlighting
infrastructure elements such as crossings,
stoplights and bicycle lanes.
The number of people viewing the world
from the perspective of a map has greatly
increased thanks to the use of the internet;
various Global Positioning System (GPS)
devices such as smartphones enable people
to get directions, view images and make
maps. Geographic Information Systems
(GIS) is a tool that can help map walking
routes within a community, identify existing
infrastructure, safety and equity problems,
and provide clues to better understand
complex issues. GIS is a commonly used
tool within the planning sector. There are
thousands of GIS datasets, and communities
all over the country are now using GIS in
planning, implementation and evaluation
efforts. It is also gaining traction among
champions. By tapping into this new
paradigm, communities can collect and
disseminate data and have a more complete
picture of what is happening at the local
level by integrating GIS technology.
As Safe Routes to School programs have
increased across the country, a clear need
for a national inventory of walking and
bicycling facilities has become apparent.
Many communities have done assessments
of their built environment conditions,
but because there is not a central place to
store data, this information is “stuck” at the
local level. This leads to minimal sharing
of data and a lack of continuity in data
collection on a national scale. As a result,
it is difficult to demonstrate the cumulative
impact of Safe Routes to School successes
across the country and to make the case that
bicycling and walking is under-resourced
throughout the nation. However, local
communities may or may not be collecting
data on bicycling and walking, and many
people do not yet understand the value
and possibility of collecting datasets and
using GIS to benefit and other active
transportation and health initiatives.
The first step in the effort to increase the
number of communities using GIS for Safe
Routes to School and active transportation
is to create a clear understanding of what
needs to be done and where to begin. In
this report, we will address ways to collect
consistent data, using GIS to improve Safe
Routes to School efforts, and where all the
data needs to be kept.
INTRODUCTION
3

In April 2013, the Safe Routes to School National Partnership (National Partnership) brought together fifteen Geographic Information System (GIS) experts in Austin, Texas to discuss the development of a framework for the use of GIS in active transportation. (A list of attendees is available at the end of the report.) Because GIS covers such a broad spectrum, experts from various active transportation and GIS-related professions were invited to participate.
GIS is a tool that can store, manage, analyze and display locational data in a way that allows the user to see correlations, patterns and a picture of their community that words, graphs and tables cannot communicate as well.
GIS can provide strategic and economic
benefits to local governments, schools,
businesses, and organizations of all sizes.
Nearly all data are tied to geography, and
GIS is the best way to understand the
interaction of data in a comprehensive way.
By creating a visual display on a map, GIS
can show relationships between informa-
tion previously thought to be unrelated.
A map will not always provide solutions to
every problem, but can raise questions and
begin conversations by ‘painting a picture’
of the community that can make scientific
data relatable and easily understood.
What is GIS?
Several of these experts specialize in technol-
ogy that focuses on walking and bicycling
applications, others focus on education work
involving GIS, while the rest concentrate on
projects that integrate mapping into regional
Safe Routes to School programs. During the
meeting, this group of experts focused on four
main topics:
1. Obtaining data necessary for planning and implementation of Safe Routes to School, walking and bicycling
2. Creating standards for data collection, dissemination and storage
3. Storing collected data on a local and national level so that they are accessible to all people
4. Ensuring that accessible and standardized data tools will be open source in order to allow for future creation of new applications and uses
After the meeting, the National Partnership
staff created this report based on meeting
notes to give an overview of GIS, data
collection and existing tools and to present
the group’s thoughts, recommendations and
concerns regarding each of the above topics.
This report aims to foster a new national
conversation highlighting ways that GIS
can assist Safe Routes to School efforts and
active transportation in general. Some recom-
mendations from the meeting were clear,
such as the creation of a Top Ten list of vital,
basic datasets that most communities can
reasonably expect to collect to ensure that
they have enough quality data for active
transportation planning and implementation.
Other topics, such as how to create a national
bicycling and walking database, will require
more discussion and resources in the future.
BACKGROUND
4
Franklin Middle School
W John St
S N
eil S
t
W Hill St
W Clark St
W Green St
S St
ate
St
W Healey St
W Church St
S Ly
nn S
t
S N
ew S
t W White St
S Pr
airie
St
W Park Ave
W Springfield Ave
S Pr
ospe
ct A
ve
W University Ave
S R
ando
lph
St
S W
illis
Ave
Hessel Blvd
S R
usse
ll S
t
S El
m S
t
S O
ak S
t
W Daniel St
Fole
y Av
e
S Pi
ne S
t
Ells Ave
W Charles St
S Ja
mes
St
S M
cKin
ley
Ave
W Armory Ave
Haines Blvd
N E
lm S
t
N N
eil S
t
William St
N L
ynn
St
Stanage Ave
Pine
St
Flor
a D
r
N W
alnu
t St
S Ed
win
St
N J
ames
St
La Sell Dr
Elm
woo
d D
rC
hica
go A
ve
Main StN R
ando
lph
St
N P
rosp
ect A
ve
Buena Vista Dr
Logan St
S H
ighl
and
Ave
S R
idge
way
Ave
Avondale Ave
Stadium Dr
N N
ew S
t
N E
dwin
St
N P
rairi
e St
W Union St
E Green St
N W
illis
Ave
Waverly D
r
Fairway Dr
S El
m B
lvd
Frem
ont S
t
Grandview Dr
S W
alnu
t St
Cot
tage
Ct
N R
usse
ll St
E University Ave
E Washington St
Whe
aton
Ave
Van
Dor
en S
t
E Springfield Ave
Arlington Ct
Greencroft Dr
Marshall St
N S
tate
St
Dav
idso
n D
r
Cheshire Dr
W Union St
W White St
S M
cKin
ley
Ave
N R
usse
ll St
William St
Avondale Ave
S O
ak S
t
W Charles St
W University Ave
William St
W Union St
S El
m B
lvd
0 0.2 0.40.1Miles
Edison Middle School306 West Green Street
Champaign, IL 61820
Legend
Crossing Guard
Sidewalks
Crosswalks
Safe Routes
Bike Racks
Traffic Signal
Pedestrian Pushbutton
Bike Lanes (on-street)
Shared Lane Markings (sharrows)
Shared-Use Path (off-street)
Streets
Alleys
Railroads
Edison Middle School
School Footprint
Safe Walking Route Maps 2011Safe Walking Route Maps 2011
W John St
S El
m S
t
W Green St
S St
ate
StW Healey St
S Pr
airie
St
S R
ando
lph
St
School Inset
EdisonMiddleSchool
EdisonMiddleSchool
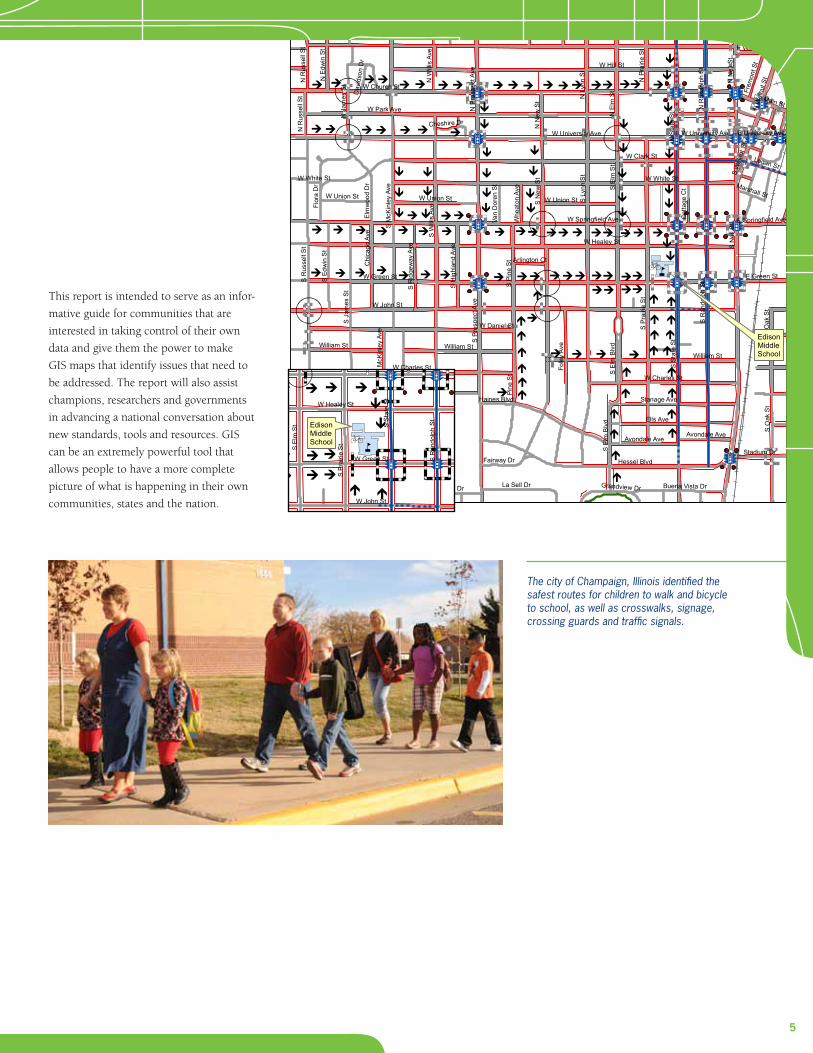
This report is intended to serve as an infor-
mative guide for communities that are
interested in taking control of their own
data and give them the power to make
GIS maps that identify issues that need to
be addressed. The report will also assist
champions, researchers and governments
in advancing a national conversation about
new standards, tools and resources. GIS
can be an extremely powerful tool that
allows people to have a more complete
picture of what is happening in their own
communities, states and the nation.
The city of Champaign, Illinois identified the safest routes for children to walk and bicycle to school, as well as crosswalks, signage, crossing guards and traffic signals.
5

Regional governments are required to
consider all transportation options in
planning, but are not required to dedicate
staff time and resources to GIS or bicycle
and pedestrian data collection. In addition,
some cities, regions and states will readily
allow their data to be released to the public
while others will only share when petitioned
through high-level officials or Freedom of
Information Act (FOIA) requests. Because
each governing body is independent,
gathering data from local level entities can
be time-consuming, inconsistent
and incomplete.
The majority of Safe Routes to School
programs use volunteers to collect data.
These volunteers can be parents, teachers,
public and private sector representatives
and even students. Many high school and
college students are required to do com-
munity service to graduate. These students
can work with project organizers to collect
and upload data. Younger students can also
be involved in data collection. They can be
asked to draw their favorite bicycle or
walking routes or they can use methods
such as Photovoice to photograph what
they see in the community that they like
or think needs to be changed. It is also
possible to collect built environment data
by looking at photos available through
Google Street View and Google Earth,
although these efforts tend to be less
complete and accurate.
Data Collection at the Local Level
Local level walking and bicycling data are being regularly collected in many communities, but not in all of them, and not in consistent ways. Many municipali-ties and regional governments now have bicycle and pedestrian coordinators, and GIS staff are becoming more common in local governments, but still not everywhere.
What kinds of data might be included? The Transportation Research Board, a division on the National Research Council which promotes innovation and progress in transportation through research, has identified three broad categories of data that are important for bicycle and pedestrian planning and management1 through their Bicycle and Pedestrian Data Subcommittee:
DATA COLLECTION
6
• Travel Monitoring Data (bicycle and
pedestrian traffic counts)
• Travel Behavior Data (survey results)
• Transportation General
(other data such as GPS routes
or infrastructure)
The National Bicycle and Pedestrian
Documentation Project is an example of a
travel monitoring data collection effort that
standardizes data but does not currently
disseminate the datasets publically.
The National Household Travel Survey and
American Community Survey are national
examples of travel behavior data, and many
regional transportation planning agencies
perform their own travel surveys. The U.S.
Department of the Interior disseminates
infrastructure data through its National
Atlas of the United States. Sidewalks, bicycle
lanes, crosswalks and traffic-calmed streets
are examples of transportation infrastructure
that impact Safe Routes to School.
The two biggest questions regarding data
collection are: “What are the most important
data to collect?” and “How does one ensure
that the data are collected in a reliable,
consistent and usable way?” Because analysis
can only be defendable if data are reasonably
accurate, one must ensure that the data are
comprehensive, understandable, complete
and comparable. For example, if one
community measures all sidewalk or
roadway widths and linear miles, but
another community does not take width
into consideration, there will be a lack of
consistency and usability of the data at a
national level.
The two biggest questions
regarding data collection are:
“What are the most important
data to collect?” and
“How does one ensure that the
data are collected in a reliable,
consistent and usable way?”

Tools and Datasets
Federal
Open Street Map
URISA
Cycle Track
Non-profit/Private
Federal Analysis
Reporting System (FARS)
Spotify
Walkscore
ITO World
Boltage Program
American Community
Survey (ACS)
SarisRacks
Vertices
ESRI
311 GISapp
General Transit Fee Standard (GTFS)
STRAVA
City Scan
Highway performance
measure set
(HPMS)
TELE Atlas
NATVEQ
Community Commons
Several federal agencies collect various types
of data that impact walking and bicycling,
but the majority of federal transportation
data is focused on motorized vehicles:
airplanes, trains and automobiles. The
attendees agreed that the federal Transpor-
tation Investment Generating Economic
Recovery (TIGER) grantees, the U.S. Census,
the U.S. Household Travel Survey and the
Federal Highway Administration were the
best places to start looking for data to begin
building a national walking and bicycling
database. The concern with federal-level
non-motorized transportation data is that
the data are often incomplete at best and
inaccurate at worst. This is why local-level
data need to be collected in a consistent,
timely and efficient way to correct inaccura-
cies and to fill in the gaps left by current
federal data collection systems.
There is a massive amount of existing data
already in various GIS-based products,
but the differences in how data are collected
and stored make it difficult to analyze at
a national level. Often, data collection
software is not compatible or the data
collected are incomplete, making the data
difficult to use and compare. A range of
tools are available for auditing the built
environment, but many were designed with
researchers,2 not community members, in
mind. Another challenge is that data are
being collected in certain communities and
not in others. This inconsistency may lead
to underrepresentation of low-income and
low-resourced communities.
There are many available tools for collecting
data, including high-cost robust solutions
used by professionals, as well as easy-to-use
GIS tools available for laypersons, especially
for those in low-income and low-resourced
communities. Although it would be difficult
to create a complete list of all existing tools
to collect, store and analyze geographically
related data, the group convened in Austin,
Texas compiled a list of what they consider
to be the most prominent examples, includ-
ing Google maps, Community Commons,
and smartphone apps.
Data Collection at the Federal/National Level
Existing Data Collection Tools
The single biggest data collector is the federal government, which has the largest amount of data regarding streets, safety, education, land use, demographics and other datasets.
The group discussed the belief that there is a strong intersection between people who are interested in transit and people with knowledge of software design, the result of which is the creation of numerous applications and tools related to transportation data.
7

A Uniform Data Tool is Needed
Protocols are Necessary
While these existing tools are important resources, the consensus was that a new uniform tool should be created that makes it easy to collect new data, upload existing data from other tools, and store all the data in one centralized location.
Since there are so many types of data, and because data can be collected and stored in so many ways, there will need to be an established set of protocols or standards that will ensure that data are of a high enough and consistent quality that governments, decision makers and researchers can use the data for the common good.
The convening of GIS experts in Austin, Texas in April 2013 produced a number of findings and recommendations:
All the experts agreed that the tool must be
easily accessible using the internet, that
anyone who has an understanding of the
data standards protocol must be able to use
the tool, and that the data must be imme-
diately available once it has been uploaded,
without privacy controls or other restrictions.
The group discussed the need to identify a
funder for this new data tool, collection and
storage project. There was consensus that
while the project should be a collaborative
effort between numerous groups interested
in increasing active transportation across the
country, the database needs to be owned
and operated by the federal government.
This will ensure that the data will be public
and accessible, the website and database
will be sustainable and that the active
transportation conversation will continue
on a national scale.
Determining the actual protocols is likely to
be the job of the federal government or its
designees to facilitate in collaboration with
leading experts.
Data can be enormously powerful, but only
if they are reasonably accurate and up-to-
date. Data must also be collected uniformly
to ensure that information can be compared
across datasets and communities.
Because Google has become the most popular worldwide internet site for people looking for mapping information, it was brought up several times during the meeting.
Whether it is to get driving directions,
make a labeled map, or find a local park,
Google is the most prominent example of a
tool that is free, comprehensive, accessible
and easy to use. At the same time, there
are a number of issues with Google and
its data that made the attendees apprehen-
sive about asking Google to store national
walking and bicycling data. Google owns
all of its data, which could make public
access difficult and unpredictable; since
Google is a private enterprise, the public
generally has no control over its actions
or the data stored there. The group deter-
mined that Google would not be the right
place to store a national public database
of active transportation data.
What About Google?
FINDINGS FROM THE FIELD
To ensure that this is possible, all collectors
should conduct responsible data collection.
Data collection can be done by a parent,
teacher, school professional, bicycling/walk-
ing supporter, or local municipal employee,
but all should have access to – and a basic
understanding of - the tools and protocols
that will ensure that their data are useful and
consistent.
8

National Center’s Database
Mobile Devices Are Key
Photos Provide Perspective
Established in May 2006, the National Center for Safe Routes to School (National Center) serves as the information clearinghouse for the federal Safe Routes to School program and assists states and communities in enabling and encouraging children to safely walk and bicycle to school.
Many people now have phones that allow them to access the internet, so the group agreed that an app for a mobile device would be a must-have as a data collection tool.
Photos are another tool that can be helpful in data collection.
Uploading photos from a computer or
smartphone gives a visual record of the
current conditions, which would add an-
other type of valuable information to
the database. Photos can be labeled and
Open Source and Open Data
Open source and open data are important considerations in collecting and disseminating data and GIS mapping.
Both approaches allow anyone to use and
input their own information, and to make
improvements to the underlying tools. By
creating a system that lets the general public
contribute data and control how that data
are used, a truly collaborative initiative can
This would allow users to map sidewalks,
crosswalks and other data points, produce
high quality maps, and save data easily into
a national database. The ability to upload
data from anywhere is important for two
reasons: first, because people are more likely
The National Center is part of the
University of North Carolina Highway
Safety Research Center with funding from
the U.S. Department of Transportation
Federal Highway Administration. In 2009,
the National Center unveiled a searchable
database of federally-funded Safe Routes
to School projects.
to participate in data collection if they can
easily enter information while they are at the
site being measured, and second, because
data are more likely to be accurate when it is
uploaded right at its location.
9
become a reality. The biggest advantage is
that users are not locked into a relatively
static and private GIS company or tool that
would require substantial funding and time
to modify.
graphics such as text, arrows and route
markings can be overlaid onto photos using
inexpensive apps.
Data are provided to the database by each
state Department of Transportation. This is
an extremely valuable source of information
and a unique tool that can assist in bicycle
and pedestrian GIS mapping efforts.
means that the underlying software
code is freely available to the general
public for use and/or modification from
its original design. It is typically created
as a collaborative effort in which pro-
grammers improve upon the code and
share the changes with the community.
Open Source
Open Data
refers to data that is available for
anyone to access and use. It can be
downloaded by anyone and integrated
into any GIS system.
Regardless of the presence or absence of sidewalks, paths,
crosswalks, crossing guards or other traffic calming devices,
if people do not feel safe, the majority will not walk, bicycle, scooter, skateboard or wheelchair
to and from local destinations. By identifying where people do
and do not feel safe, one can then evaluate why they do not feel safe.
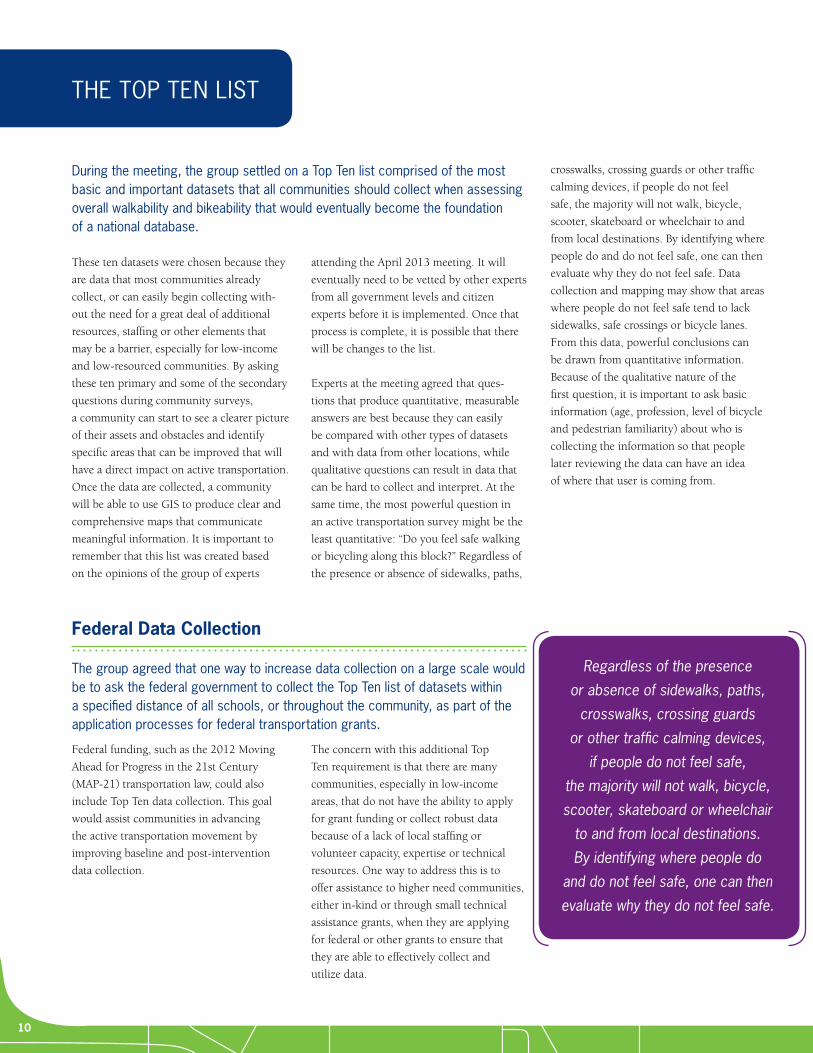
THE TOP TEN LIST
attending the April 2013 meeting. It will
eventually need to be vetted by other experts
from all government levels and citizen
experts before it is implemented. Once that
process is complete, it is possible that there
will be changes to the list.
Experts at the meeting agreed that ques-
tions that produce quantitative, measurable
answers are best because they can easily
be compared with other types of datasets
and with data from other locations, while
qualitative questions can result in data that
can be hard to collect and interpret. At the
same time, the most powerful question in
an active transportation survey might be the
least quantitative: “Do you feel safe walking
or bicycling along this block?” Regardless of
the presence or absence of sidewalks, paths,
These ten datasets were chosen because they
are data that most communities already
collect, or can easily begin collecting with-
out the need for a great deal of additional
resources, staffing or other elements that
may be a barrier, especially for low-income
and low-resourced communities. By asking
these ten primary and some of the secondary
questions during community surveys,
a community can start to see a clearer picture
of their assets and obstacles and identify
specific areas that can be improved that will
have a direct impact on active transportation.
Once the data are collected, a community
will be able to use GIS to produce clear and
comprehensive maps that communicate
meaningful information. It is important to
remember that this list was created based
on the opinions of the group of experts
Federal Data Collection
The group agreed that one way to increase data collection on a large scale would be to ask the federal government to collect the Top Ten list of datasets within a specified distance of all schools, or throughout the community, as part of the application processes for federal transportation grants.
Federal funding, such as the 2012 Moving
Ahead for Progress in the 21st Century
(MAP-21) transportation law, could also
include Top Ten data collection. This goal
would assist communities in advancing
the active transportation movement by
improving baseline and post-intervention
data collection.
The concern with this additional Top
Ten requirement is that there are many
communities, especially in low-income
areas, that do not have the ability to apply
for grant funding or collect robust data
because of a lack of local staffing or
volunteer capacity, expertise or technical
resources. One way to address this is to
offer assistance to higher need communities,
either in-kind or through small technical
assistance grants, when they are applying
for federal or other grants to ensure that
they are able to effectively collect and
utilize data.
crosswalks, crossing guards or other traffic
calming devices, if people do not feel
safe, the majority will not walk, bicycle,
scooter, skateboard or wheelchair to and
from local destinations. By identifying where
people do and do not feel safe, one can then
evaluate why they do not feel safe. Data
collection and mapping may show that areas
where people do not feel safe tend to lack
sidewalks, safe crossings or bicycle lanes.
From this data, powerful conclusions can
be drawn from quantitative information.
Because of the qualitative nature of the
first question, it is important to ask basic
information (age, profession, level of bicycle
and pedestrian familiarity) about who is
collecting the information so that people
later reviewing the data can have an idea
of where that user is coming from.
During the meeting, the group settled on a Top Ten list comprised of the most basic and important datasets that all communities should collect when assessing overall walkability and bikeability that would eventually become the foundation of a national database.
10

Do you feel safe walking or riding a bicycle along this block?
Top Ten GIS Datasets for Safe Routes to School
11
DATASET
OTHER IMPORTANT DATA TO COLLECT
Standard Level of Comfort
Presence of a Sidewalk
Intersections
Bicycle Facilities
School location and Student Catchment Areas
Speed
Collision Data
Health Indicators
Existing patterns
Air Quality
Crime Data
Block Length
Adjacent Land Use
Number of Street Lanes
Street Width
Does a sidewalk exist?
Are crosswalks Present?
Are there places to safely ride a bicycle?
How many students live within a 1 to 2-mile radius of a school?
What is the speed limit of the street?
How many injuries and accidents have happened on this block?
Are there basic public health concerns in the neighborhood?
Where are people currently walking? Are there goat paths?
Is the air quality good enough to promote active transportation?
Is crime a deterrent to walking and bicycle riding?
What is the length of the block?
What are the primary land uses in the area?
How many lanes does the street have?
What is the street width?
Condition of the sidewalk- Does the sidewalk have cracks? Is it uneven? How wide is the sidewalk?
Are there crossing signals at the intersection?
Does the intersection have a stop sign of stop lights?
Are crosswalks striped?
Are crossing guards present before and after school?
Does the street have medians?
Are there mid-street crosswalks?
Are the intersections near the school safe?
Are there places to park a bicycle securely?
Do lower income areas have less access to walking and bicycle riding?
Are children using a more direct path that lacks sidewalks?
Is there a high asthma rate in this neighborhood?
PRIMARY QUESTIONS SECONDARY QUESTIONS
1.
2.
3.
4.
5.
6.
7.
8.
9.
10.
At a minimum, all communities should be collecting the following data:

Evaluation
Scoring the Data
Evaluation, including the procurement of baseline and post intervention data, must be a part of every community’s efforts. Baseline data collection is especially important, as it can be difficult to determine success if there are no data with which to compare.
The group decided that the best way to collect data was for communities to ask simple questions with straightforward answers.
When paired with GIS mapping, evaluation
can be easier to conduct and results more
easily interpreted. If a community does
not take the proper steps to evaluate a pro-
grammatic, infrastructure or system change
effort, it can be hard to show if real change
was accomplished. Evidence-based strategies
are also beneficial to garner public support.
Some walking audits currently score side-
walks, roads, and intersections by giving
them a number or star rating, but it can
be difficult on a national scale to ensure that
various scores mean the same thing in
different communities. For instance, knowing
if a sidewalk was given three out of five stars
may be less important to decision makers
and other stakeholders than knowing if
a sidewalk exists at all, and if so, what its
width is. Another reason is that a sidewalk
could score highly on paper, but still feel
unsafe in person. Simple, direct questions
can often identify the issue better than a
numbered ranking scale, especially in regards
to active transportation infrastructure, which
adds complexity to data collection and inter-
pretation and the usability of the data
to catalyze positive change.
GIS mapping can create a picture of the
community before, during and after
infrastructure, policy and programmatic
changes were implemented, giving evidence
that active transportation interventions
help communities to be more economically
sound, healthier, safer and more active.
A disagreement within a community about
whether a particular aspect, such as a side-
walk segment, is an asset or actually an
obstacle can be a good thing. Disagreement
(in a friendly, constructive way) can lead
to conversations about issues that may
have been overlooked if everyone easily
agreed on a score. For example, if one
community member believes a sidewalk
segment should be scored highly, while
another believes it is a poor sidewalk,
a conversation will likely happen regarding
what is an ideal sidewalk within that
community, leading to a deeper discussion
about what the community needs and how
to achieve active transportation goals.
TOP TEN LIST CONTINUED
?
??
?
?????
??
?????
??
??
???
^
^
^
^
^
^^
^^^
^
^̂
^^̂ ^
^ ^ ^ ^ ^
^ ^^ ^
^̂ ^^^̂^ ^
^
^^^ ^
^^ ^̂̂
^ ^ ^^
^^ ^ ^^^ ^
^^ ^^^^ ^ ^ ^
^ ^ ^^
^ ^^
^^ ^
^^ ^ ^
^
^ ^
^^
^
^
^
Bakersfield City Elementary
Panama-Buena Vista Union Elementary
Lamont Elementary
Fairfax Elementary
Greenfield Union Elementary
Fruitvale ElementaryRosedale Union Elementary
Edison Elementary
Lakeside Union Elementary
Norris Elementary
Beardsley Elementary
Standard Elementary
Vineland Elementary¯
Bakersfield - Pedestrian or Bicycle Collisions Near School Sites (2007-2009)
0 0.5 1 Miles
*Schools classified according to percentage of students eligible for the Free/Reduced Price Meal Program (2010). **Safe Routes to School awards include state and federal funding from 2005 - 2011.
Sources: California Public School Database; SWITRS 2007-2009; Bing Maps
Schools by % FRPM*
^ Unknown
^ High Income (<40)
^ Middle Income (40-75)
^ Low Income (>75)
? Merged or Closed Schools
Pedestrian or Bicycle CollisionsInjury
Fatality
Safe Routes Grants Awarded**
") Infrastructure
") Non-Infrastructure
") Both
Collisions within 1/2 Mile
0
1 - 4
5 - 8
9 - 17
18 - 303
When assessing streets for all modes, it is important to remember that not all streets, bicycle lanes, and sidewalks are created equally.
Some streets that have high traffic volume may
need a space that is a buffered or separated
sidewalk/pathway, while a lower speed road
with minimal traffic could easily support an
on-road bicycle lane with no space between
the road and the sidewalk. By using Complete
Streets guiding principles, every community
can recognize and implement the appropriate
treatments on all streets. GIS mapping can
assist in identifying the different types of
roads and can show the best routes for
bicyclists and pedestrians, which will not
often be the same. GIS can also map streets
around schools, parks, retail centers and
neighborhoods to determine if they are
following Complete Streets principles. GIS
can identify any inequities that might exist in
regards to the locations of Complete Streets.
Complete Streets
12

Bakersfield - Pedestrian or Bicycle Collisions Near School Sites (2007 - 2009)
?
??
?
?????
??
?????
??
??
???
^
^
^
^
^
^^
^^^
^
^̂
^^̂ ^
^ ^ ^ ^ ^
^ ^^ ^
^̂ ^^^̂^ ^
^
^^^ ^
^^ ^̂̂
^ ^ ^^
^^ ^ ^^^ ^
^^ ^^^^ ^ ^ ^
^ ^ ^^
^ ^^
^^ ^
^^ ^ ^
^
^ ^
^^
^
^
^
Bakersfield City Elementary
Panama-Buena Vista Union Elementary
Lamont Elementary
Fairfax Elementary
Greenfield Union Elementary
Fruitvale ElementaryRosedale Union Elementary
Edison Elementary
Lakeside Union Elementary
Norris Elementary
Beardsley Elementary
Standard Elementary
Vineland Elementary¯
Bakersfield - Pedestrian or Bicycle Collisions Near School Sites (2007-2009)
0 0.5 1 Miles
*Schools classified according to percentage of students eligible for the Free/Reduced Price Meal Program (2010). **Safe Routes to School awards include state and federal funding from 2005 - 2011.
Sources: California Public School Database; SWITRS 2007-2009; Bing Maps
Schools by % FRPM*
^ Unknown
^ High Income (<40)
^ Middle Income (40-75)
^ Low Income (>75)
? Merged or Closed Schools
Pedestrian or Bicycle CollisionsInjury
Fatality
Safe Routes Grants Awarded**
") Infrastructure
") Non-Infrastructure
") Both
Collisions within 1/2 Mile
0
1 - 4
5 - 8
9 - 17
18 - 303
The city of Bakersfield. California mapped collisions that occured 1/2 mile of each school. They then overlaid data showing the percentage of students that received Safe Routes funds. By viewing all of the data on one map, advocates can observe relationships between areas with high collision rates, lower income and a lack of Safe Routes funding.
13

The way that a community uses GIS will vary depending on what they are trying to accomplish. GIS can map many types of data: roads, health, sidewalks, obesity, school catchment areas, busing routes, bus stops, income, ethnicity, age, underserved populations, test scores, zoning, parks, equitable distribution of services, programmatic impact and much more.
GIS AND ACTIVE TRANSPORTATION: RECOMMENDATIONS
In fact, there are already tens of thousands
of useful and publicly available datasets,
mostly collected by the federal government
through the U.S. Census, National Household
Travel Survey, Department of Education and
other sources.
Once data are collected, GIS helps practitio-
ners put those data together to create a visual
aid. Many communities collect data, but then
do not have the ability to put the seemingly
disparate pieces together to see possible
relationships. In the past, GIS software
was expensive and difficult for many people
to use. Nowadays, with the advancements
of technology and the availability of internet-
based options, basic GIS is not cost-
prohibitive for most communities.
GIS mapping can be useful in a number of
decision-making situations at local, state
and national levels. GIS maps are not a
quick fix, but they can identify trends and
tell a story in a way that words and raw
data cannot. They can help illustrate need
in grant applications, impact placement of
new amenities such as community centers,
schools, parks, bicycle lanes or trails, and
illustrate social equity disparities. Communi-
ties, agencies, bicyclists and pedestrians will
be more likely to focus on good data collec-
tion and mapping when they see what good
can come out of it.
GIS can create a level playing field for data.
By presenting data in a non-political way
through mapping, GIS can illustrate
community issues in a way that is not
aggressive or accusatory, just factual and
visible. Among other things, GIS has been
used to show lack of sidewalks, zoning
14
Underserved Communitites - Results MISSOURI SAFE ROUTES STATE NETWORK
AWARDS 2007 - 2011 IDEAL DISTRIBUTION (POPULATION) APPLICATIONS 2011
discrepancies, walking routes, the location
of traffic safety improvements, even ‘food
deserts’, and to make direct links between a
lack of community amenities and high obesity
rates, especially in underserved communities.
But if a community has limited access to maps
and data, a significant number of people are
missing the powerful stories that GIS can tell.
Communities cannot afford to view sidewalks
and bicycle lanes as alternatives or enhance-
ments to existing or future roads. By arming
decision-makers with the best data possible
presented in straightforward and easily
understood ways, GIS allows them to see a
more complete picture of why investing in
bicycle and pedestrian projects makes sense.
In addition, non-motorized transportation
costs usually have to be justified, but road
projects seldom have to explain why the cost
is worthwhile. By incorporating factors such
as bicycle or pedestrian counts, health
indicators and cost analyses, supporters can
show through GIS that walking and bicycling
are useful, convenient and financially efficient
modes of transportation. GIS has the
potential to change the conversation so that
decision makers will understand the positive
benefit of having various options when
choosing transportation.
The Missouri Safe Routes to School State Network used GIS to identify where Safe Routes to School grants had been awarded prior to 2011 and then determine the ideal distribution of the grants for communities to be funded in 2011 with a targeted approach to underserved communities.
Show Economic Benefits with GIS
Make the Health Connection with GIS
GIS provides a framework for understanding and communicating the potential economic benefits of active transportation.
15
GIS can map out average rental prices,
incomes, overall sales for businesses,
population, and property taxes before and
after infrastructure improvements were built.
Active transportation can impact the economy
in various ways. It can lead to a decrease in
public health issues, such as obesity and
asthma, which in turn decrease health care
costs. Areas with active transportation also
tend to attract more tourism. GIS can identify
areas that are bicycle or pedestrian-friendly
(presence of bicycle paths, bicycle racks,
bicycle lanes, sidewalks, and buffers from cars)
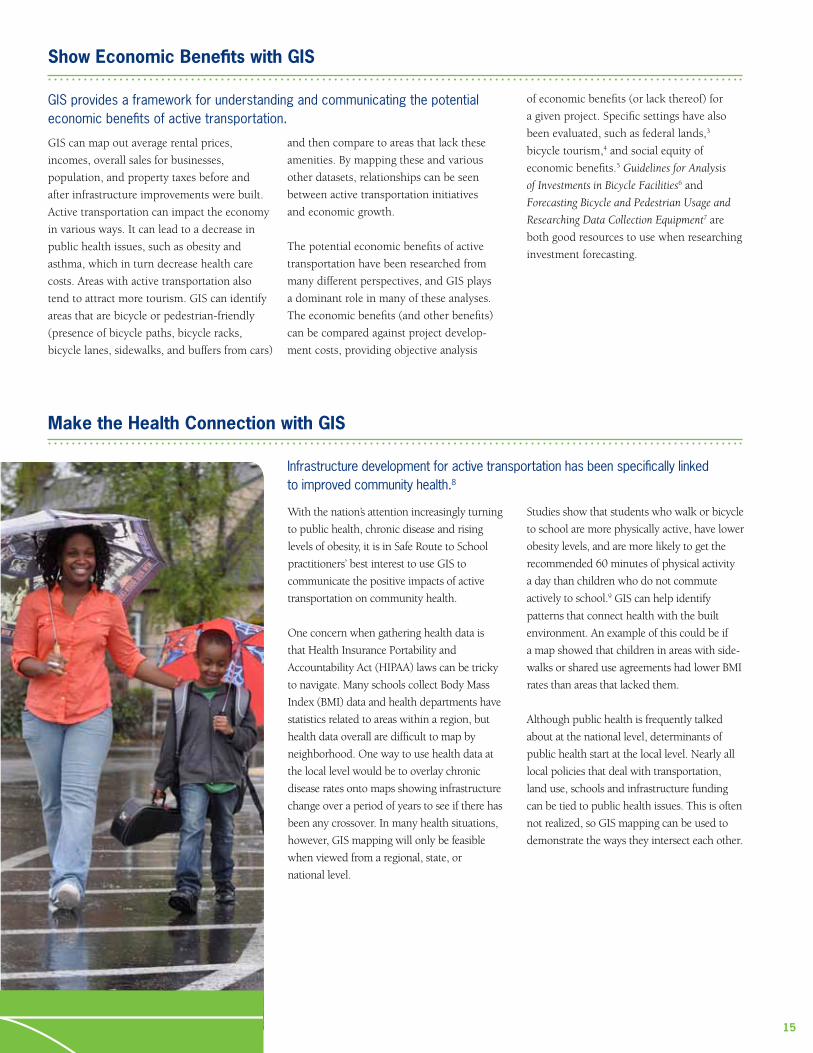
With the nation’s attention increasingly turning
to public health, chronic disease and rising
levels of obesity, it is in Safe Route to School
practitioners’ best interest to use GIS to
communicate the positive impacts of active
transportation on community health.
One concern when gathering health data is
that Health Insurance Portability and
Accountability Act (HIPAA) laws can be tricky
to navigate. Many schools collect Body Mass
Index (BMI) data and health departments have
statistics related to areas within a region, but
health data overall are difficult to map by
neighborhood. One way to use health data at
the local level would be to overlay chronic
disease rates onto maps showing infrastructure
change over a period of years to see if there has
been any crossover. In many health situations,
however, GIS mapping will only be feasible
when viewed from a regional, state, or
national level.
and then compare to areas that lack these
amenities. By mapping these and various
other datasets, relationships can be seen
between active transportation initiatives
and economic growth.
The potential economic benefits of active
transportation have been researched from
many different perspectives, and GIS plays
a dominant role in many of these analyses.
The economic benefits (and other benefits)
can be compared against project develop-
ment costs, providing objective analysis
Studies show that students who walk or bicycle
to school are more physically active, have lower
obesity levels, and are more likely to get the
recommended 60 minutes of physical activity
a day than children who do not commute
actively to school.9 GIS can help identify
patterns that connect health with the built
environment. An example of this could be if
a map showed that children in areas with side-
walks or shared use agreements had lower BMI
rates than areas that lacked them.
Although public health is frequently talked
about at the national level, determinants of
public health start at the local level. Nearly all
local policies that deal with transportation,
land use, schools and infrastructure funding
can be tied to public health issues. This is often
not realized, so GIS mapping can be used to
demonstrate the ways they intersect each other.
of economic benefits (or lack thereof) for
a given project. Specific settings have also
been evaluated, such as federal lands,3
bicycle tourism,4 and social equity of
economic benefits.5 Guidelines for Analysis
of Investments in Bicycle Facilities6 and
Forecasting Bicycle and Pedestrian Usage and
Researching Data Collection Equipment7 are
both good resources to use when researching
investment forecasting.
Infrastructure development for active transportation has been specifically linked to improved community health.8

Social Media
Local Assistance and Data Access
Active Transportation Committee on GIS
Social media can be used as a communication outlet to engage the public with GIS by having maps online and allowing the public to comment on issues (e.g., sidewalk cracks, cars parked in bicycle lanes, etc.) in a way that is easily collected by the local government agency.
The consensus was also that, while there are fantastic tools already in existence that collect and store data, there is a disconnect between an expert familiar with GIS and a local person wanting to access information specific to their community.
The group recommended the idea of working with an existing committee through the
Transportation Research Board as a way to ensure consistent and sustainable methods
of data collection and GIS mapping.
Various Web 2.0 technologies broaden the
toolset for developing and updating infor-
mation on active transportation10 and engag-
ing the public in transportation planning.11
The use of geotagged imagesis particularly
compelling in the case of recommending
or improving Safe Routes to School because
they document conditions and comments
with a specific geographic location in real
time. The advantage of the social aspect to
GIS technology is available to nearly any
community with internet access, but
often staffing restrictions and a lack of GIS
knowledge are barriers to a community’s
ability to collect data and take advantage
of GIS mapping. Because of this, local
assistance needs to be provided from the
this type of data input is that participants’
contributions can be visible to their “friends”
or “followers,” expanding outreach about
Safe Routes to School issues. Most state
departments of transportation and many
local agencies already use social media.
Leveraging their use of social media with
public input is a logical next step for low-
cost, local information.
GIS AND ACTIVE TRANSPORTATION: RECOMMENDATIONS CONTINUED
regional and state levels and data needs to
be widely available across all levels of govern-
ment. Regional and state governments can
help empower local communities by engaging
with them in conversations related to data
collection and GIS mapping.
Activity-Based Modeling
Activity-based modeling (ABM) is a way to predict travel demand based on activities that individuals need and want to perform.
ABM takes into consideration the fact
that people do not travel purely for the
sake of traveling, but rather as a means
to get from one activity to another based
on what they need or want to do. For
example, a mother is more likely to
travel from work to pick up her child
from school, then go to a park, then
to a grocery store in that order instead
of making individual trips from home
to each of those locations. ABM tries
to predict when, where, why and how
travel will occur.
16

When parents and local walking and bicycling enthusiasts work together to create a Safe Routes to School program, one of the first and most important steps is to do an assessment of the current landscape.
Does the route from a child’s house to school
have sidewalks or pathways? Is it safe for
a child to ride a bicycle to school? How far
does the child live from school? These are
some of the basic questions that must be
answered before a child is allowed or
encouraged to walk or bicycle to school.
Many Safe Routes to School programs
currently use GIS to identify walking school
bus and bike train routes, school location
and catchment areas, and intersections that
need improvement. But GIS mapping can
do much more than show routes and infra-
structure. Safe Routes to School champions
can use GIS to show cost-benefit relation-
ship between funds spent on Safe Routes
to School programs and safe infrastructure,
health improvements, decreased gas usage,
increased student test scores, decreased
vehicular accidents, and improved sense of
safety across an entire community.
There is a direct correlation between Safe
Routes to School success and detailed
mapping. GIS can show where students
are currently walking, locations of current
sidewalks, areas that lack sidewalks,
changes in test scores in relation to increases
in students that walk or bicycle to school,
changes in obesity rates, decreases in behav-
ior issues, and involvement in overall active
transportation by all community members.
One of the most popular ways to use GIS
is to map out one-mile or two-mile
buffers around schools to see if and where
students can walk and bicycle to school.
Overlaying the best routes within the walk-
able catchment areas of a school can be
powerful information.
GIS SPECIFIC TO SAFE ROUTES TO SCHOOL
Engineering GIS can use precise engineering data to
inform future funding decisions, locations
of future projects, and prioritization
of maintenance.
Education GIS can map locations of schools that offer
traffic safety classes, bicycle rodeos, and
various other education programs.
Encouragement GIS can map various encouragement efforts
to see if they overlap with increases in
walking and biking to school.
Enforcement GIS can map locations of traffic violations
and crashes, abandoned houses, areas with
crime and unsafe intersections.
Evaluation GIS allows for detailed evaluation of data
and creates the ability to assess relationships
between seemingly unrelated information.
The potential uses of GIS are enormous,
and mapping datasets together from
various sources, even those that might seem
unrelated, can create a whole new picture of
the community, that, in turn, can spark new
realizations about the community’s assets
and obstacles. This type of experimentation
can ultimately lead to increased support for
related policies and programs.
17
GIS and the 5E’s of Safe Routes to School
Safe Routes to School champions
can use GIS to show cost-benefit
relationship between funds spent
on Safe Routes to School
programs and safe infrastructure,
health improvements, decreased
gas usage, increased student
test scores, decreased vehicular
accidents, and improved sense of
safety across an entire community.

Funding
Where Students Live
Due to recent budget cuts across all active transportation programs, including the loss of the standalone federal funding program, Safe Routes to School must find new ways to prove its importance and secure funding at the national and state levels.
Gathering information on where students live can be one of the most important and challenging steps in Safe Routes to School data collection.
18
Safe Routes to School champions must be
able to prove there is a definite interest and
need for walking and bicycling in order to
make the case for increased funding. GIS
mapping is an effective way to use existing
data to show why this work is important.
The Department of Education at the national,
state and local levels is understandably
cautious about giving out any private
information regarding home addresses, but
this makes it difficult to show how many
students could easily walk or bicycle to
school. Knowledge of catchment areas can
be helpful as they give an idea of how many
students live within a specified area (one to
two miles). U.S. Census data are another way
GIS SPECIF IC TO SAFE ROUTES TO SCHOOL CONTINUED
Shared Use
Shared use agreements (also referred to as joint use agreements) have become a popular and successful strategy for communities across the country.
By using GIS to map the locations of all playgrounds, community centers, ball fields, courts, and schools that
have opened their doors to the public through shared use
agreements, practitioners can make a powerful case for increasing access
to physical activity opportunities.
Shared use agreements can be formal or
informal agreements between two separate
government or private entities setting forth
the terms and conditions for the shared
use of public or private property. In light
of the obesity epidemic, as well as financial
concerns, a shared use agreement between a
school and a park department or community
organization can be an easy and inexpensive
way to ensure that all people have access
to physical activity opportunities. By using
GIS to map the locations of all playgrounds,
community centers, ball fields, courts, and
schools that have opened their doors to the
GIS can help show a larger picture of students
walking and biking to school. Several hundred
students in one school district may not have
a big impact on state and national decision
makers, but if active transportation champions
can use numbers from dozens of communities
to provide evidence that a large percentage of
students are walking to school, it will have
a much bigger impact. When active trans-
portation supporters have better evidence
of people asking for and using active
transportation, it will cease to be seen as
an enhancement or alternative and instead
as a viable transportation need.
to find out the number of students in each
neighborhood or on each block; although
it will not tell you which school a child is
going to. Classroom hand tallying of who
walks or rides bicycles to school has proven
to be inaccurate, as it is self-reporting,
although these are the most popular and
accessible tools for measuring where
students live and how they get to school.
public through shared use agreements,
practitioners can make a powerful case
for increasing access to physical activity
opportunities. Relationships might be
observed between shared use and an
increase in use, decrease in obesity rates,
overall cost savings for a community, and an
increase in physical activity. Mapping shared
use locations may also show inequities in
access to physical activity opportunities
across a community.
photo courtesy Mayor MgGinn on Flickr

School Siting
School siting is a major school board decision that can be influenced with GIS data.
There is a trend to build or consolidate
multiple schools into larger school buildings
on the edge of towns, often far away from
students, where land is cheap and plentiful,
and to close older schools that tend to be
within walkable neighborhoods. The rationale
is that it is more expensive to retrofit older
buildings than it is to build a new one. A GIS
map could model the impact of new traffic
traveling to/from the new school, including
new congestion, crashes and wear and tear
on roadways, the number of students that
could or could not walk and bicycle, existing
infrastructure, the cost of new infrastructure
such as roads, sewers and electrical service,
school busing costs over a future period
of time, fuel consumption and many other
possibilities. GIS mapping could educate
decision-makers about the long-term
impacts of the new, closed or consolidated
school location, not only the immediate
costs and concerns.
GIS can map various factors that impact the
type of environments that surround schools.
If a large parking lot is present, it is more
likely to encourage car travel, while sidewalks
and low traffic streets will encourage walking
and bicycling. By looking at GIS mapping
in areas where students walk and bicycle
regularly, communities can better understand
what it takes to increase the number of
students taking part in active transportation.
The group envisioned the creation of a school
site design manual focusing on educating
school boards, developers and architects
about the best and worst practices that
would detail the factors listed above, as well
as a study of the long-term economic costs
of locating schools on the outskirts of town.
School Oriented Development
Centrally located neighborhood schools are not only a goal of Safe Routes to School and smart growth supporters.
Realtors have long discussed the positive
effect that good, community-centered schools
have on real estate decisions and most
communities recognize the positive impact
that community-centered schools play in a
community. One idea that came out of the
meeting was the possibility of creating a new
way of planning our communities: School-
Oriented Development.
A scoring system similar to Walk Score, an
app that grades locations based on how easy
it is to walk to community amenities, could
use GIS data to grade schools based on the
number of students who can walk to school,
the presence of infrastructure supporting
walking and bicycling, and various other
factors that influence active transportation
to and from schools.
School Siting In Montana
GIS is an important part of the curriculum that assists communities in making decisions to construct new schools or close existing schools.
One of the identified priorities for the
Montana Safe Routes to School Network
was school siting. The Network recog-
nized the importance of using GIS to solve
problems and visualize the complex factors
that can help decision makers do a better
job of siting schools. Some of these factors
include location of existing infrastructure,
housing density, student density, student
yield by housing type, diversity, access to
public transportation and more. GIS can
be used to help school districts and cities
increase efficiency and coordination and
deliver transparency and accountability. The
Georgia Conservancy has developed a school
siting training based on the Environmental
Protection Agency’s School Siting Guidelines
that were released in 2011. During the sum-
mer of 2013, the Georgia Conservancy will
bring the school siting training to Billings,
Montana.
19
Crash Data
GIS mapping can assist in identifying the number of automobile accidents related to school traffic.
By making crash data geographic, as well as
time-based, people can better understand
when and where crashes are occurring. These
data can be compared between schools that
have varying percentages of students that get
to school by walking, bicycle, car or bus.
Social Equity
Transportation investments are frequently not distributed equally across communities.12
Higher-income areas are more likely to be
able to afford costly improvements and
investments, and these areas can usually
predict a faster return on investment than
lower-income areas. Lower-income areas
also tend to wield less influence and involve-
ment in local decision making and are
therefore less likely to be vocal about needs
in their area. However, because active trans-
portation investments are usually inexpensive
and sustainable, more effort should be used
to ensure that these investments are spent
equally across a community.13 In some cases,
they provide access to jobs with the most
inexpensive modes (walking and bicycling)
while other transportation modes cost more
to the individual.14
There is also concern with lower-income
areas, such as rural communities and inner-
cities, which often lack access to GIS
technologies and the internet.
These communities could be assisted by
larger communities, or regional planning
groups, that have the resources to assist in
data collection and GIS mapping. A final
equity issue that was raised at the meeting
was the fact that not all possible users have
mobile devices. This digital divide needs to
be addressed so that these people are not
left out of both the data collection and GIS
mapping opportunities, which will lead
to certain areas being underrepresented in
this initiative.
GIS SPECIF IC TO SAFE ROUTES TO SCHOOL CONTINUED
Identifying Remote Drop-offs in Rural Areas
The experts at the April 2013 meeting agreed that the issues suburban and urban communities deal with are more commonly addressed, while rural problems require different approaches, solutions and evaluation measures.
Little time was dedicated to the issues that
rural communities exclusively deal with,
such as infrastructure limitations in low-
income rural areas and the more common
need for busing students due to longer travel
distances that limit the ability to walk or
bicycle to school. One way to increase the
amount of physical activity students have
access to before and after school is known
as the remote drop-off. GIS can map out
various safe locations for busses to drop
off children. By looking at possible remote
drop-off locations on a map, decision makers
can identify the best places that will have the
smallest impact on traffic, will be the safest
and most direct routes for students, and will
allow the students to walk an appropriate
distance to and from school and the bus.
GIS Identifies Funding Inequity in Missouri
In 2010, the Missouri Safe Routes to School State Network suspected that low-income and minority com-munities were receiving less than their fair share of Safe Routes to School funding throughout the state.
The Network used GIS to identify specifi-
cally where these inequities were occurring
by mapping out data on population, ethnic-
ity, free and reduced lunch percentages
and grant recipients. These maps showed
that prior to 2011, Missouri Safe Routes to
School funding was not reaching poor or
minority schools. Their data led them to
the conclusion that they were not receiv-
ing many applications from underserved
areas, they had more success reaching poor
schools than minority schools and there
were little funds going to urban schools. In
2011, the Network worked with Missouri
Department of Transportation to encourage
applications from underserved communities.
Within one year of this implementing this
targeted approach, the State Network saw a
huge increase in the number of underserved
communities that applied for and received
funding.
By plotting vehicle crash data, GIS can help
identify crashes that happen on the way to and
from school and other locations that might be
avoided, or where to focus infrastructure or
safety improvements, if those students walked
or rode a bicycle instead of commuting in a
car or bus.
20

The City of Portland Safe Routes To School program strongly encourages parents to walk and/or bike with your students initially, to explore the safest path from your home to your school. If you see safetyproblems along the identified recommended routes, please contact Gabe Graff, City of Portland Safe Routes to Schools Coordinator at 503.823.5291 or [email protected].
GG
G
G
GG
G
G
èéë èéë èéë èéë èéë èéë èéëèéë
èéë èéë
èéë èéë èéë èéë
èéë
èéë
èéë
èéë
èéë
èéë èéë èéë
èéë èéë èéë èéë èéë
èéë
èéë
èéë
èéë
èéë
èéë
èéë
èéë
èéë
èéë
èéë
èéë
èéë
èéë
èéë
èéë
èéë
èéë
èéë èéë èéë
èéë
èéë
èéë
èéì
èéì
èéìèéì
èéë èéë èéë èéë èéë èéë èéë
èéë
èéë èéë èéë èéë èéë èéë èéë èéëèéë
èéë
èéë
èéë
èéë
èéëèéëèéë
èéë
èéëèéë èéë èéë èéë èéë èéë èéë èéë èéë
èéë èéë
èéë èéë èéë èéë
èéë
èéë
èéëèéë èéë èéë èéë
èéë èéë èéë èéë èéë èéë èéë
èéë
èéë
èéë
èéë
èéë
èéë
èéë
èéë
èéë
èéë
èéë
èéë
èéë
èéë
èéì
èéì
èéì
èéìèéì
èéì
èéì
èéë
èéë
èéë
èéë
èéë
èéë
èéë èéëèéë
èéë
èéë
èéëèéë
èéë
èéì
èéë èéëèéë èéë
èéëèéë
èéë èéëèéë
èéëèéë
èéëèéë èéë
èéëèéë
èéëèéë
"
"
"
"
""
"
"
"
AA
A AA AA AA A A A AA
AA
A
AAA A A A
A
AA
A
A
A
S E 47
TH AV
E
SE 42
ND
A VE
NE
EAS
TBAN
K ES
PLA
NAD
E
NE
ROYA
L CT
NE
7 TH
A VE
SE 11
TH A V
E
SE 17
TH AV
E
S E 3 0
TH AV
E
NE 39
TH AV
E
MT TABOR
SE
SALMO N W
A
Y
SE TAYLOR ST
PATH
SE 51
ST AV
E
SE LADD
AVE
NE
4 5T H
A VE
NE PACIFIC ST
SE 6 9
T H AV
E
NE
45TH
A VE
NE
60TH
A VE
S E 60
T H AV
E
SE 6 5
T H AV
E
NE HASSALO ST
SE 5 3
R D A V
E
SE STARK ST
SE
THORBURN ST
SE SA
ND
Y BLVD
SE 9 T
H AV
E
NE
41S T
AVE
SE 39
TH AV
E
SE 11
TH A V
E
NE
8 TH
A VE
NE GLISAN ST
SE 1 2
T H A V
E
SE TIBBETTS ST
SE 2 5
T H AV
E
S E 16
T H AV
E
SE 4T
H A V
E
S E 2 6
TH A V
E
NE
12TH
A VE
NE
21ST
A VE
SE 1 2
T H AV
E
S E 11
T H A V
E
S E 17
TH A V
E
NE 32
ND AV
E
SE 20
T H AV
E
S E 27
TH A V
E
SE 3 9
TH A V
E
NE IRVING ST
NE BROADWAY
NE
28TH
A VE
S E 55
TH A V
E
SE TAYLOR ST
SE POWELL BLVD
SE 1 6
T H AV
E
ROSS ISLAND BRG
SE 22
ND
A VE
S E 21
ST AV
E
S E 27
TH AV
E
SE 50
TH AV
ES E
50TH
AVE
NE
16TH
AVE
SPRING
WATER
ON
WILLAM
ETTE
SE BUSH ST
SE CLAY ST
SE DIVISION ST
SE CLINTON ST
SE 49
T H AV
E
NE MULTNOMAH ST
SE 62
ND A V
E
SE 6 9
TH AV
E
SE TAYLOR ST
NE BROADWAY
SE 52
ND
A VE
S E 2 6
TH AV
E
NE EVERETT ST
NE GLISAN ST
SE 3 9
T H AV
E
SE 4 1
S T AV
E
SE EA
STBA
NK
ESPL
AN
ADE
SE YAM
HIL
L ST
SE 41
ST A V
E
SE 60
T H AV
E
51ST
46TH
YAMHILL
BROOKLYN
53RD
63RD
34TH
22N
D
HAZELFERN
68TH
MEIKLE
41ST
63RD
66T H
31ST
LARC
H
57TH
69TH
43RD
10TH
38TH
1ST
35TH
36TH
8TH
32N
D
24TH21ST
62N
D
LAWRENCE
49TH
37TH
59TH
6TH
23RD
8TH
SCOTT
45TH
30TH
49TH
22N
D
69TH
42N
D
2ND
54TH
59TH
56TH
48TH
SHERMAN
GRANT
STEPHENS
HARRISON
40TH
PEDESTRIAN
EUCLID
WAVERLEIGH
ASH
PINE
GRANT
HASSALO
ELLIOTT
OAK
ASH
PACIFIC
70TH
47TH
OAK
48TH
IRVINGROYAL
52N
D
33RD
MAIN
BROOKLYN
LAURELHURST
WINDSOR
BROOKLYN
21ST
KELLY
HOYT
EVERETT
13TH
VERA
MULTNOMAH
59TH
56TH
54TH51ST
50TH
32N
D
48TH
15TH
46TH
18TH
27TH
28TH
LAFAYETTE
FRANCIS14TH
33RD
MILL
GRANT
CLACKAMAS
46TH
WEIDLER
64TH
GRANT
65TH
LINCOLN
63RD
SHERMAN
50TH
LADDINGTON
54TH53
RD
55TH
21ST
24TH
56TH
58TH
SALMON
IRVING
66TH
HICKORY
65TH
68TH
30TH
CENTER
58TH
HOLLY
67TH
MIRIM
AR
DAVIS
69TH
BUSH
70TH
35TH
FLANDERS
CLAY
COUCH
EVERETT
45TH
CARUTHERS
SHERMAN
61ST
OREGON
WILLOW
71ST
29TH
37TH
MULTNOMAH
TIBBETTS
TIBBETTS
KELLY
HAIG
43RD
ALDER
27TH
WASHINGTON
MORRISON
HAIG
STEPHENS
CLACKAMAS
OR
E GON
65TH
IRVING
7TH
23RD
66TH
47TH
ANKENY
CENTER
44TH
IVON
KELLY
GRANT
ASH
COUCH
FIR
YAMHILL
8TH
KELLY
16TH
FLO
RAL
35TH
2ND
36TH
LAFAYETTE
28TH
YAMHILL
WOODWARD
RHONE
MILL
HAIG
25TH
11TH
SHERMAN
38TH
CARUTHERS
LINCOLN
29TH
COUCH
HOYT
11TH
TAYLOR
ALDER
RHINE
18TH
31ST
7TH
8TH
13TH6T
H
18TH
37TH
38TH
OAK
10TH
20TH
14TH
19TH
17TH
BROOKLYN
CLAY
23RD
22N
D
HOYT
HOLLADAY
29TH
17TH6T
H
IRVING
15TH
PINE
10TH
FLANDERS
MADISON
WASCO 22N
D
OREGON
FLANDERS
ASH
20TH
GLISAN
TAGGART
FRANKLIN
ASH
9TH
9TH
22N
D
HASSALO
IRVING
FLANDERS
MORRISON
33RD
WOODWARD
MADISON
HALSEY
25TH
3RD
3RD
YAMHILL
PACIFIC
SALMON
MORRISON
2ND
MAIN
64TH
49TH
MORRISON
MADISON
SALMON
STEPHENS
MARKET
HARRISON
RHONE
TAYLOR
WASCO
16TH
57TH
56TH
WASCO
TAYLOR
MADISON
24TH
13TH
ALDER
WASHINGTON
ANKENY
ANKENY
WASHINGTON
IVON
DAVIS
BUSH
32N
D
PEAC
OCK
HASSALO
WASCO
20TH
HARRISON
34TH
PINE
62N
D
MCLO
UGH
LIN
CLINTON
HALSEY
STEPHENS
MAIN
MARKET
51ST
HAWTHORNE
MAIN
40TH
MAPLE
IMPERIAL
PACIFIC
67TH
TAGGART
TAGGART
HARRISON
EVERETT
55TH
IVONCLINTON
HOLLADAY
68TH
31ST
63RD
67TH
MARKET
27TH
44TH
WINDSOR
14TH
LOCUST
20TH
65TH
MULBERRY
PALM
LAVENDER
PEERLESS
26TH
HAZEL
CYPRESS
MAIN
FLANDERS
FRANKLIN
HOYT
61ST
44TH
SENATE
52N
D
RHONE
BROADWAY
21ST
19TH
IVON
WASCO
PINE
RANDALL
POWELL BLVD FRONTAGE
DAVIS
CARUTHERS
GIDEON
6TH 25
TH
SE BELMONT ST
NE
MA
RTIN
LU
THER
KIN
G J
R B
LVD
SE HAWTHORNE BLVD
SE HAWTHORNE BLVD SE HAWTHORNE BLVD
NE
47TH
AVE
NE
2 8T H
A VE
SE MORRISON ST
NE
24TH
A VE
S E 55
TH AV
E
NE DAVIS ST
SE CARUTHERS ST
SE ANKENY ST
SE HARRISON ST
SE 6 2
ND
A VE
NE
53R D
AVE
SE 43
RD
A VE
SE 52
ND
AVE
SE DIVISION STSE DIVISION ST
LAURELHURST PARK PATHWAY
SE POWELL BLVD
SE 8T
H AV
E
NE
60T H
AVE
S E 16
T H
SE STARK ST
SE WOODWARD ST
SE 7 T
H A V
E
NE HALSEY ST
NE
20TH
A VE
SE 12
TH A V
E
SE BELMONT ST
SE 34
TH AV
E
SE DIVISION ST
SE 45
TH A V
E
NE 16TH
DR
NE WEIDLE R ST
SE 71
ST A V
E
SE 33
RD
A VE
SE POWELL BLVD
SE STARK ST
SE POWELL BLVD
NE HALSEY ST
SE 42
ND
AVE
NE SANDY BLVD
NE
47TH
A VE
SE FRANKLIN ST
NE GLISAN ST
SE W
ATER
A VE
SE M
ARTI
N LU
THE
R KI
NG
JR B
LVD
ALDER
61ST
49TH
RHONE
57TH
SHERMAN
FRANCIS
26TH
19TH
67TH
SUL LIVA
N
55TH
68TH
34TH
WOODWARD
30TH
ALDER
OREGON
58TH
28TH
58TH
3RD
BURNSIDE BRG
Mt. Tabor Park
Laurelhurst Park
Buckman Field
Frazer Park
Clinton Park
Colonel Summers Park
Oregon Park
Sewallcrest Park
Washington Monroe Property
Normandale Park
Sunnyside School Park
Mt. Tabor Annex
Piccolo Park
Ladds Circle & Squares
Sewallcrest Community Garden
Clinton Community Garden Richmond Property
Blair Community Garden
Ivon Community Garden
Powell Park
Buckman Community Garden
A
A
B
B
C
C
D
D
E
E
F
F
6 6
5 5
4 4
3 3
2 2
1 1
Sunnyside Environmental K-8
µ"
""
""
""
""
""
""
"
"
"
""
""
""
""
""""""""""""
""
""
""
""
"
"
""
""
""
""
""
""
""
""
""
""
""
""
""
""
"
"
""
""
""
""
"" " " " " " " " " " "
""
""
""
""
"
"
"
""
""
""
""
""
""
""
Jun 07, 2011
3421 SE Salmon St
Portland
The Portland Bureau of Transportation produced Safe Routes Maps for Schools to identify the best ways for students to bike and walk to school. Their goal is to make family-friendly maps that were easy to read and colorful.
Sunnyside Environmental K-8 - 3421 SE Salmon St
GIS Maps Crash Data Surrounding New York City Schools
In April 2003, New York City Department of Transportation used GIS mapping to improve traffic safety around public schools.
The city used GIS mapping to identify the
highest need schools by collecting crash in-
formation within a 700 foot radius around
1,426 schools. 135 schools were selected
for priority treatment based on location
and accident data that were collected
at intersection and mid-block locations
throughout the city. Once selected, each
school underwent meetings with parents
and other interested parties, collection
and analysis of data concerning traffic
conditions and student travel patterns and
development, evaluation and approval of
comprehensive short-and long-term pedes-
trian safety improvement measures. All of
the short-term safety improvements at the
first 135 schools are complete.
21
The April 2013 meeting was considered a success by all that attended.
All attendees reported that they were excited
to be involved in this initiative and expected
that this overall effort would foster a new
national conversation regarding the collection,
storage and accessibility of non-motorized
infrastructure data. The group agreed that
the presence of a federally-operated database,
as well as standards for data collection,
would be vital to ensure the success and
sustainability of active transportation.
A webinar will be held on July 11, 2013
to present the major recommendations
that came out of the meeting as well as the
highlights from this report. The hope is that
this report and the webinar will serve as
informative guides for communities that are
interested in taking control of their own data
and give them the power to better under-
stand GIS tools and how GIS maps can
identify issues that need to be addressed.
CONCLUSION
The City of Portland Safe Routes To School program strongly encourages parents to walk and/or bike with your students initially, to explore the safest path from your home to your school. If you see safetyproblems along the identified recommended routes, please contact Gabe Graff, City of Portland Safe Routes to Schools Coordinator at 503.823.5291 or [email protected].
GG
G
GGG
G
G
èéë èéë èéë èéë èéë èéë èéëèéë
èéë èéë
èéë èéë èéë èéë
èéë
èéë
èéë
èéë
èéë
èéë èéë èéë
èéë èéë èéë èéë èéë
èéë
èéë
èéë
èéë
èéë
èéë
èéë
èéë
èéë
èéë
èéë
èéë
èéë
èéë
èéë
èéë
èéë
èéë
èéë èéë èéë
èéë
èéë
èéë
èéì
èéì
èéìèéì
èéë èéë èéë èéë èéë èéë èéë
èéë
èéë èéë èéë èéë èéë èéë èéë èéëèéë
èéë
èéë
èéë
èéë
èéëèéëèéë
èéë
èéëèéë èéë èéë èéë èéë èéë èéë èéë èéë
èéë èéë
èéë èéë èéë èéë
èéë
èéë
èéëèéë èéë èéë èéë
èéë èéë èéë èéë èéë èéë èéë
èéë
èéë
èéë
èéë
èéë
èéë
èéë
èéë
èéë
èéë
èéë
èéë
èéë
èéë
èéì
èéì
èéì
èéìèéì
èéì
èéì
èéë
èéë
èéë
èéë
èéë
èéë
èéë èéëèéë
èéë
èéë
èéëèéë
èéë
èéì
èéë èéëèéë èéë
èéëèéë
èéë èéëèéë
èéëèéë
èéëèéë èéë
èéëèéë
èéëèéë
"
"
"
"
""
"
"
"
AA
A AA AA AA A A A AA
AA
A
AAA A A A
A
AA
A
A
AS E
47TH
AVE
SE 42
ND
A VE
NE
EAS
TBAN
K ES
PLA
NAD
E
NE
ROYA
L CT
NE
7 TH
A VE
SE 11
TH A V
E
SE 17
TH AV
E
S E 3 0
TH AV
E
NE 39
TH AV
E
MT TABOR
SE
SALMO N W
A
Y
SE TAYLOR ST
PATH
SE 51
ST AV
E
SE LADD
AVE
NE
4 5T H
A VE
NE PACIFIC ST
SE 6 9
T H AV
E
NE
45TH
A VE
NE
60TH
A VE
S E 60
T H AV
E
SE 6 5
T H AV
E
NE HASSALO STSE
5 3R D
A VE
SE STARK ST
SE
THORBURN ST
SE SA
ND
Y BLVD
SE 9 T
H AV
E
NE
41S T
AVE
SE 39
TH AV
E
SE 11
TH A V
E
NE
8 TH
A VE
NE GLISAN ST
SE 1 2
T H A V
E
SE TIBBETTS ST
SE 2 5
T H AV
E
S E 16
T H AV
E
SE 4T
H A V
E
S E 2 6
TH A V
E
NE
12TH
A VE
NE
21ST
A VE
SE 1 2
T H AV
E
S E 11
T H A V
E
S E 17
TH A V
E
NE 32
ND AV
E
SE 20
T H AV
E
S E 27
TH A V
E
SE 3 9
TH A V
E
NE IRVING ST
NE BROADWAY
NE
28TH
A VE
S E 55
TH A V
E
SE TAYLOR ST
SE POWELL BLVD
SE 1 6
T H AV
E
ROSS ISLAND BRG
SE 22
ND
A VE
S E 21
ST AV
E
S E 27
TH AV
E
SE 50
TH AV
ES E
50TH
AVE
NE
16TH
AVE
SPRING
WATER
ON
WILLAM
ETTE
SE BUSH ST
SE CLAY ST
SE DIVISION ST
SE CLINTON ST
SE 49
T H AV
E
NE MULTNOMAH ST
SE 62
ND A V
E
SE 6 9
TH AV
E
SE TAYLOR ST
NE BROADWAY
SE 52
ND
A VE
S E 2 6
TH AV
E
NE EVERETT ST
NE GLISAN ST
SE 3 9
T H AV
E
SE 4 1
S T AV
E
SE EA
STBA
NK
ESPL
AN
ADE
SE YAM
HIL
L ST
SE 41
ST A V
E
SE 60
T H AV
E
51ST
46TH
YAMHILL
BROOKLYN
53RD
63RD
34TH
22N
D
HAZELFERN
68TH
MEIKLE
41ST
63RD
66T H
31ST
LARC
H
57TH
69TH
43RD
10TH
38TH
1ST
35TH
36TH
8TH
32N
D
24TH21ST
62N
D
LAWRENCE
49TH
37TH
59TH
6TH
23RD
8TH
SCOTT
45TH
30TH
49TH
22N
D
69TH
42N
D
2ND
54TH
59TH
56TH
48TH
SHERMAN
GRANT
STEPHENS
HARRISON
40TH
PEDESTRIAN
EUCLID
WAVERLEIGH
ASH
PINE
GRANT
HASSALO
ELLIOTT
OAK
ASH
PACIFIC
70TH
47TH
OAK
48TH
IRVINGROYAL
52N
D
33RD
MAIN
BROOKLYN
LAURELHURST
WINDSOR
BROOKLYN
21ST
KELLY
HOYT
EVERETT
13TH
VERA
MULTNOMAH
59TH
56TH
54TH51ST
50TH
32N
D
48TH
15TH
46TH
18TH
27TH
28TH
LAFAYETTE
FRANCIS14TH
33RD
MILL
GRANT
CLACKAMAS
46TH
WEIDLER
64TH
GRANT
65TH
LINCOLN
63RD
SHERMAN
50TH
LADDINGTON
54TH53
RD
55TH
21ST
24TH
56TH
58TH
SALMON
IRVING
66TH
HICKORY
65TH
68TH
30TH
CENTER
58TH
HOLLY
67TH
MIRIM
AR
DAVIS
69TH
BUSH
70TH
35TH
FLANDERS
CLAY
COUCH
EVERETT
45TH
CARUTHERS
SHERMAN
61ST
OREGON
WILLOW
71ST
29TH
37TH
MULTNOMAH
TIBBETTS
TIBBETTS
KELLY
HAIG
43RD
ALDER
27TH
WASHINGTON
MORRISON
HAIG
STEPHENS
CLACKAMAS
OR
E GON
65TH
IRVING
7TH
23RD
66TH
47TH
ANKENY
CENTER
44TH
IVON
KELLY
GRANT
ASH
COUCH
FIR
YAMHILL
8TH
KELLY
16TH
FLO
RAL
35TH
2ND
36TH
LAFAYETTE
28TH
YAMHILL
WOODWARD
RHONE
MILL
HAIG
25TH
11TH
SHERMAN
38TH
CARUTHERS
LINCOLN
29TH
COUCH
HOYT
11TH
TAYLOR
ALDER
RHINE
18TH
31ST
7TH
8TH
13TH6T
H
18TH
37TH
38TH
OAK
10TH
20TH
14TH
19TH
17TH
BROOKLYN
CLAY
23RD
22N
D
HOYT
HOLLADAY
29TH
17TH6T
H
IRVING
15TH
PINE
10TH
FLANDERS
MADISON
WASCO 22N
D
OREGON
FLANDERS
ASH
20TH
GLISAN
TAGGART
FRANKLIN
ASH
9TH
9TH
22N
D
HASSALO
IRVING
FLANDERS
MORRISON
33RD
WOODWARD
MADISON
HALSEY
25TH
3RD
3RD
YAMHILL
PACIFIC
SALMON
MORRISON
2ND
MAIN
64TH
49TH
MORRISON
MADISON
SALMON
STEPHENS
MARKET
HARRISON
RHONE
TAYLOR
WASCO
16TH
57TH
56TH
WASCO
TAYLOR
MADISON
24TH
13TH
ALDER
WASHINGTON
ANKENY
ANKENY
WASHINGTON
IVON
DAVIS
BUSH
32N
D
PEAC
OCK
HASSALO
WASCO
20TH
HARRISON
34TH
PINE
62N
D
MCLO
UGH
LIN
CLINTON
HALSEY
STEPHENS
MAIN
MARKET
51ST
HAWTHORNE
MAIN
40TH
MAPLE
IMPERIAL
PACIFIC
67TH
TAGGART
TAGGART
HARRISON
EVERETT
55TH
IVONCLINTON
HOLLADAY
68TH
31ST
63RD
67TH
MARKET
27TH
44TH
WINDSOR
14TH
LOCUST
20TH
65TH
MULBERRY
PALM
LAVENDER
PEERLESS
26TH
HAZEL
CYPRESS
MAIN
FLANDERS
FRANKLIN
HOYT
61ST
44TH
SENATE
52N
D
RHONE
BROADWAY
21ST
19TH
IVON
WASCO
PINE
RANDALL
POWELL BLVD FRONTAGE
DAVIS
CARUTHERS
GIDEON
6TH 25
TH
SE BELMONT ST
NE
MA
RTIN
LU
THER
KIN
G J
R B
LVD
SE HAWTHORNE BLVD
SE HAWTHORNE BLVD SE HAWTHORNE BLVD
NE
47TH
AVE
NE
2 8T H
A VE
SE MORRISON ST
NE
24TH
A VE
S E 55
TH AV
E
NE DAVIS ST
SE CARUTHERS ST
SE ANKENY ST
SE HARRISON ST
SE 6 2
ND
A VE
NE
53R D
AVE
SE 43
RD
A VE
SE 52
ND
AVE
SE DIVISION STSE DIVISION ST
LAURELHURST PARK PATHWAY
SE POWELL BLVD
SE 8T
H AV
E
NE
60T H
AVE
S E 16
T H
SE STARK ST
SE WOODWARD ST
SE 7 T
H A V
E
NE HALSEY ST
NE
20TH
A VE
SE 12
TH A V
E
SE BELMONT ST
SE 34
TH AV
E
SE DIVISION ST
SE 45
TH A V
E
NE 16TH
DR
NE WEIDLE R ST
SE 71
ST A V
E
SE 33
RD
A VE
SE POWELL BLVD
SE STARK ST
SE POWELL BLVD
NE HALSEY ST
SE 42
ND
AVE
NE SANDY BLVD
NE
47TH
A VE
SE FRANKLIN ST
NE GLISAN ST
SE W
ATER
A VE
SE M
ARTI
N LU
THE
R KI
NG
JR B
LVD
ALDER
61ST
49TH
RHONE
57TH
SHERMAN
FRANCIS
26TH
19TH
67TH
SUL LIVA
N
55TH
68TH
34TH
WOODWARD
30TH
ALDER
OREGON
58TH
28TH
58TH
3RD
BURNSIDE BRG
Mt. Tabor Park
Laurelhurst Park
Buckman Field
Frazer Park
Clinton Park
Colonel Summers Park
Oregon Park
Sewallcrest Park
Washington Monroe Property
Normandale Park
Sunnyside School Park
Mt. Tabor Annex
Piccolo Park
Ladds Circle & Squares
Sewallcrest Community Garden
Clinton Community Garden Richmond Property
Blair Community Garden
Ivon Community Garden
Powell Park
Buckman Community Garden
A
A
B
B
C
C
D
D
E
E
F
F
6 6
5 5
4 4
3 3
2 2
1 1
Sunnyside Environmental K-8
µ
""
""
""
""
""
""
""
"
"
""
""
""
""
""""""""""""
""
""
""
""
"
"
""
""
""
""
""
""
""
""
""
""
""
""
""
""
"
"
""
""
""
""
"" " " " " " " " " " "
""
""
""
""
"
"
"
""
""
""
""
""
""
""
Jun 07, 2011
3421 SE Salmon St
Portland

Wansoo Im President Vertices www.vertices.com
Robert Ping Technical Assistance Director Safe Routes to School National Partnership www.saferoutespartnership.org
Jack Sanford Safe Routes to School Program Manager Bike Texas www.biketexas.org
Marc Schlossberg Associate Professor Sustainable Cities Initiative University of Oregonhttp://sci.uoregon.edu/
Drusilla van Hengel NW Planning Manager Alta Planning + Design www.altaplanning.com
Ben Zhan Professor and Director Texas Center for Geographic Information Science www.geo.txstate.edu/txgisci
22
This publication was made possible by grant number 5U38HM000459-04 from the Centers for Disease Control and Prevention, through funding from the CDC/NCEH Healthy Community Design Initiative. Funding was administered through a contract with the American Public Health Association. Its contents are solely the responsibility of the authors and do not necessarily represent the official views of the Centers for Disease Control and Prevention or the American Public Health Association.
John Bigham GIS Program Manager University of California, Berkeley Safe Transportation Research and Education Center www.safetrec.berkeley.edu
Melissa Badtke Safe Routes to School Coordinator, Associate Planner East Central Wisconsin Regional Planning Commission www.eastcentralrpc.org
Erin Barbaro Assistance Director and Senior Geographic Information Systems Specialist Center for Applied Research and Environmental Systems www.cares.missouri.edu
Maggie Cooper Technical Assistance Manager Safe Routes to School National Partnership www.saferoutespartnership.org
Chelsea Donahue Child Safety, Safe Routes to School Program Neighborhood Connectivity Division, Public Works Department, City of Austin www.austintexas.gov/department/public-works
Jen Duthie Research Associate and Director of Network Center The University of Texas at Austin, Center of Transportation Research www.utexas.edu/research/ctr/
Billy Fields Assistant Professor Political Science Texas State university www.polisci.txstate.edu
Christopher Fulcher Co-Director Center for Applied Research and Environmental Systems University of Missouri www.cares.missouri.edu
Greg Griffin Associate Transportation Researcher Texas A&M Transportation Institute www.tti.tamu.edu
Peter Haas Chief Research Scientist Center for Neighborhood Technology www.cnt.org
Francis Hebbert Director Open Plans www.openplans.org
GIS Framework Discussion Attendees, April 22-23, 2013
ACKNOWLEDGEMENTS

23
1 TRB Bicycle and Pedestrian Data Subcom-mittee. BP/T3 Data Clearinghouse. https://sites.google.com/site/bikepeddata/bp-t3-data-clearinghous Accessed June 5, 2013.
2 Clifton, K. J., Livi Smith, A. D., & Rodriguez, D. (2007). The development and testing of an audit for the pedestrian environment. Land-scape and Urban Planning, 80(1-2), 95–110. doi:10.1016/j.landurbplan.2006.06.008
3 Villwock-Witte, N., & May, D. (2012). Eco-nomic Benefits of Alternative Transportation Systems on Federal Lands.
4 Downward, P., Lumsdon, L., & Weston, R. (2009). Visitor Expenditure: The Case of Cycle Recreation and Tourism. Jour-nal of Sport & Tourism, 14(1), 25–42. doi:10.1080/14775080902847397
5 Sanchez, T., Stolz, R., & Ma, J. (2004). Inequitable Effects of Transportation Policies on Minorities. Transportation Research Record: Journal of the Transportation Research Board, 1885(-1), 104–110. doi:10.3141/1885-15
6 Krizek, K. J., & et al. (2006). NCHRP Report 552 Guidelines for Analysis of Investments in Bicycle Facilities. Retrieved from http://www.bicyclinginfo.org/bikecost
7 Hudson, J., Qu, T.-B., & Turner, S. (2010). Forecasting Bicycle and Pedestrian Usage and Researching Data Collection Equipment. Retrieved from http://www.campotexas.org/pdfs/TTIForecasting_bicycle_and_pe-destrian_usage_and_research_data_collec-tion_equipment.pdf
8 Dill, J. (2009). Bicycling for Transportation and Health: The Role of Infrastructure. Jour-nal of Public Health Policy, 30(Supplement 1), S95–S110. doi:10.1057/jphp.2008.56
Footnotes
9 Rojas-Rueda, D., De Nazelle, A., Tainio, M., & Nieuwenhuijsen, M. J. (2011). The health risks and benefits of cycling in urban environ-ments compared with car use: health impact assessment study. BMJ, 343. doi:10.1136/bmj.d4521
10 Adams, D. (2012). Volunteered Geographic Information: Potential Implications for Participatory Planning. Planning Practice and Research, (September), 1–6. doi:10.1080/02697459.2012.725549
11 Evans-Cowley, J. S., & Griffin, G. (2012). Mic-roparticipation with Social Media for Commu-nity Engagement in Transportation Planning. Transportation Research Record: Journal of the Transportation Research Board, 2307, 90–98. doi:10.3141/2307-10
12 Ungemah, D. (2007). This Land Is Your Land, This Land Is My Land: Addressing Equity and Fairness in Tolling and Pricing. Transportation Research Record: Journal of the Transpor-tation Research Board, 2013(-1), 13–20. doi:10.3141/2013-03
13 Boschmann, E. E., & Kwan, M.-P. (2008). Toward Socially Sustainable Urban Transportation: Progress and Potentials. International Journal of Sus-tainable Transportation, 2(3), 138–157. doi:10.1080/15568310701517265
14 Boschmann, E. E., & Kwan, M.-P. (2010). Metropolitan Area Job Accessibility and the Working Poor: Exploring Local Spatial Varia-tions Of Geographic context. Urban Geogra-phy, 31(4), 498–522. doi:10.2747/0272-3638.31.4.498