Embed Size (px)
Citation preview

A fair society?How the cuts target disabled people
by Dr Simon Duffy on behalf of the Campaign for a Fair Society


A fair society?How the cuts target disabled people
by Dr Simon Duffy
Published by The Centre for Welfare Reform
On behalf of the Campaign for a Fair Society
About the AuthorDr Simon Duffy is Director of The Centre for Welfare Reform. Simon is a philosopher and social innovator who has worked for over 22 years to find practical ways to try and improve the welfare system.
Publishing InformationA Fair Society? © Simon Duffy 2013
Figures 1, 2, 3, 4, 5, 6, 7 and 8 © Simon Duffy 2013
All rights reserved.
First published January 2013
No part of this book may be reproduced in any form without permission from the publisher except for the quotation of brief passages in reviews.
A Fair Society? is published by The Centre for Welfare Reform
www.centreforwelfarereform.org
Designed by Henry Iles: www.henryiles.com
44 pp.
ISBN download: 978-1-907790-44-7
The Campaign for a Fair Society is a diverse UK-wide alliance of organisations and individuals campaigning for a society that values, includes and supports all of its citizens. It is independent of all political parties. It represents the interests of disabled people and everyone who is disadvantaged by the laws, policies and systems in the UK. The Campaign for a Fair Society is a federation with equal representation from England, Scotland and Northern Ireland.
www.campaignforafairsociety.org
The Centre for Welfare Reform is an independent research and development organisation that works to redesign the welfare state in order to promote citizenship, family, community and social justice. It is based in Sheffield and has an international network of over 70 Fellows.
www.centreforwelfarereform.org

A RepoRT FRom THe CenTRe FoR WelFARe ReFoRm on beHAlF oF THe CAmpAign FoR A FAiR SoCieTy
3
Acknowledgements
This report was produced, pro bono, by Dr Simon Duffy of The Centre for Welfare Reform on behalf of the Campaign for a Fair Society.
Grateful thanks to all those who helped with ideas and additional information. In particular Simon thanks Dr Ben Baumberg, Professor Peter Taylor-Gooby (especially for giving access to a draft of his forthcoming book), Rosemary Trustam, Sue Livett, Jim Elder-Woodward, Simon Cramp, Jane Young, Rosemary O'Neill, Frances Kelly and Ivanka Antova.
Thanks also to pat’s petition for all their tireless work in advocating for the need for a Cumulative Impact Assessment of the cuts on disabled people.


Contents
Summary . . . . . . . . . . . . . . . . . . . . . . . . . . . . . . . . . . . . . . . . . . . . . . . . . . . . . . . . . . . . . . . . . . . . . . . . . . . . . . . . . . . . . . . 6
Foreword . . . . . . . . . . . . . . . . . . . . . . . . . . . . . . . . . . . . . . . . . . . . . . . . . . . . . . . . . . . . . . . . . . . . . . . . . . . . . . . . . . . . . . 9
1. The cuts programme . . . . . . . . . . . . . . . . . . . . . . . . . . . . . . . . . . . . . . . . . . . . . . . . . . . . . . . . . . . . . . 10
2. Targeted cuts . . . . . . . . . . . . . . . . . . . . . . . . . . . . . . . . . . . . . . . . . . . . . . . . . . . . . . . . . . . . . . . . . . . . . . . . . . 12
3. Cuts implementation . . . . . . . . . . . . . . . . . . . . . . . . . . . . . . . . . . . . . . . . . . . . . . . . . . . . . . . . . . . . . 15
3.1 Cuts in social care . . . . . . . . . . . . . . . . . . . . . . . . . . . . . . . . . . . . . . . . . . . . . . . . . . . . . . . . . . . . . . . . . 15
3.2 Cuts in personal income . . . . . . . . . . . . . . . . . . . . . . . . . . . . . . . . . . . . . . . . . . . . . . . . . . . . . . . . . 17
4. Who is targeted . . . . . . . . . . . . . . . . . . . . . . . . . . . . . . . . . . . . . . . . . . . . . . . . . . . . . . . . . . . . . . . . . . . . . . 19
4.1 People In Poverty . . . . . . . . . . . . . . . . . . . . . . . . . . . . . . . . . . . . . . . . . . . . . . . . . . . . . . . . . . . . . . . . . 20
4.2 Disabled people . . . . . . . . . . . . . . . . . . . . . . . . . . . . . . . . . . . . . . . . . . . . . . . . . . . . . . . . . . . . . . . . . . . . 21
4.3 People with severe impairments . . . . . . . . . . . . . . . . . . . . . . . . . . . . . . . . . . . . . . . . . . . . . 22
5. The damage done . . . . . . . . . . . . . . . . . . . . . . . . . . . . . . . . . . . . . . . . . . . . . . . . . . . . . . . . . . . . . . . . . . 25
5.1 These cuts won’t solve the real problem . . . . . . . . . . . . . . . . . . . . . . . . . . . . . . . . . 25
5.2 Taking from people in poverty doesn’t work . . . . . . . . . . . . . . . . . . . . . . . . . . . . . 25
5.3 Increased inequality is expensive . . . . . . . . . . . . . . . . . . . . . . . . . . . . . . . . . . . . . . . . . . . . 26
5.4 Cutting social care is costly . . . . . . . . . . . . . . . . . . . . . . . . . . . . . . . . . . . . . . . . . . . . . . . . . . . . 26
5.5 Cutting social care is contradictory . . . . . . . . . . . . . . . . . . . . . . . . . . . . . . . . . . . . . . . . . . 27
5.6 The human cost is dreadful . . . . . . . . . . . . . . . . . . . . . . . . . . . . . . . . . . . . . . . . . . . . . . . . . . . . 27
6. Why the cuts target . . . . . . . . . . . . . . . . . . . . . . . . . . . . . . . . . . . . . . . . . . . . . . . . . . . . . . . . . . . . . . . 28
6.1 The government may be confused . . . . . . . . . . . . . . . . . . . . . . . . . . . . . . . . . . . . . . . . . . . 28
6.2 Pandering to electoral interests . . . . . . . . . . . . . . . . . . . . . . . . . . . . . . . . . . . . . . . . . . . . . . 28
6.3 Demonisation of disabled people . . . . . . . . . . . . . . . . . . . . . . . . . . . . . . . . . . . . . . . . . . . . 28
6.4 Pinning the blame elsewhere . . . . . . . . . . . . . . . . . . . . . . . . . . . . . . . . . . . . . . . . . . . . . . . . . 29
6.5 Disguising the cuts in 'reforms' . . . . . . . . . . . . . . . . . . . . . . . . . . . . . . . . . . . . . . . . . . . . . . 29
6.6 Design flaws in the welfare state . . . . . . . . . . . . . . . . . . . . . . . . . . . . . . . . . . . . . . . . . . . . 29
7. What we should do . . . . . . . . . . . . . . . . . . . . . . . . . . . . . . . . . . . . . . . . . . . . . . . . . . . . . . . . . . . . . . . . 31
Conclusion . . . . . . . . . . . . . . . . . . . . . . . . . . . . . . . . . . . . . . . . . . . . . . . . . . . . . . . . . . . . . . . . . . . . . . . . . . . . . . . . . . . 33
background information . . . . . . . . . . . . . . . . . . . . . . . . . . . . . . . . . . . . . . . . . . . . . . . . . . . . . . . . . . . . 34
References & readings . . . . . . . . . . . . . . . . . . . . . . . . . . . . . . . . . . . . . . . . . . . . . . . . . . . . . . . . . . . . . . . 36
notes . . . . . . . . . . . . . . . . . . . . . . . . . . . . . . . . . . . . . . . . . . . . . . . . . . . . . . . . . . . . . . . . . . . . . . . . . . . . . . . . . . . . . . . . . . . 38

A FAiR SoCieTy? |
A RepoRT FRom THe CenTRe FoR WelFARe ReFoRm on beHAlF oF THe CAmpAign FoR A FAiR SoCieTy
6
Summary
The current UK Government aims to significantly reduce the level of public expenditure in the UK by an overall cut of £63.4 billion by 2015, a reduction of 10.8%.
However, not everything is being cut. The NHS and Pensions are protected. No 10 and No. 11 have increased their own budgets by over 240% and the level of cuts to other services varies considerably. If we exclude the areas of growth and protected services there are in fact cuts of £75.2 billion. And of these cuts over 50% fall on just two areas, benefits and local government, despite the fact that together they make up only 26.8% of central government expenditure. Most people do not realise that local government’s primary function (over 60%) is to provide social care to children and adults.
In other words, the cuts are not fair but targeted, and they target people in poverty, disabled people and their families.
The government seems to have made no effort to understand the cumulative impact of its cuts on minority groups, especially those with the greatest needs. It has rejected calls for a ‘Cumulative Impact Assessment’ of the cuts despite the obvious fact that those with the most severe disabilities now face the combined impact of:
�� Social care cuts
�� Benefit cuts
�� Housing cuts
�� Regressive tax increases
For this reason The Centre for Welfare Reform, on behalf of the Campaign for a Fair Society, has done its own analysis - A Fair Society? - how the cuts target disabled people.
Using the government’s own figures, it is clear that by 2015, in England alone, local government and housing will be cut by £16.2 billion. This is a cut in real terms of 41.9%. Social care for children and adults makes up 60% of all spending over which local authorities have any control. Data collected over the past two years indicates that social care has already been cut by nearly £4 billion, and will be cut by £8 billion by 2015, a cut of about 33%.
Benefits for disabled people and the poorest will also have been cut by £18 billion, a cut of about 20%.
When we look at the combined impact of all the cuts we find:
�� People in poverty (21% of the population) bear 39% of all cuts.
�� Disabled people (8% of the population) bear 29% of all cuts.
�� People with severest disabilities (2% of the whole population) bear 15% of all cuts.

HoW THe CuTS TARgeT DiSAbleD people | SUmmARy
A RepoRT FRom THe CenTRe FoR WelFARe ReFoRm on beHAlF oF THe CAmpAign FoR A FAiR SoCieTy
7
The extreme unfairness of this is policy is even clearer if we compare the burden per person with the cuts born by most other citizens (£467 per person).
�� People in poverty will lose an average of £2,195 per person, per year - this is 5 times
more than the burden placed on most other citizens.
�� Disabled people will lose an average of £4,410 per person - this is 9 times more than
the burden placed on most other citizens.
The combination of cuts in benefits and services means that:
�� People with severe disabilities will lose an average of £8,832 per person - this is 19
times more than the burden placed on most other citizens.
These facts are represented graphically below:
Share of cuts
Share of population
39% 29% 15%
2%8%21%
People inpoverty
Disabled People
People with severest disabilites
5
9
19
Social Care Cuts
Bene t Cuts
Housing Cuts
Tax Increases
Burden on people in poverty: 5 x rest of population
Burden on disabled people: 9 x rest of population
Burden on people with severest disabilities: 19 x rest of population
How cuts target disabled people

A FAiR SoCieTy? | SUmmARy
A RepoRT FRom THe CenTRe FoR WelFARe ReFoRm on beHAlF oF THe CAmpAign FoR A FAiR SoCieTy
8
This means that one person in 50 (2% of the population) has to face a loss of income and vital support of nearly £9,000 per year. But this one person will also be somebody's brother, sister, mother, father or child. The impact on over 1 million families in the UK will be devastating.
Not only do these cuts target disabled people unfairly, their reality has been covered up with falsehoods, distortions and ugly rhetoric.
The truth is:
�� Disabled people and people in poverty did not cause the current debt crisis, and
targeting them for cuts will not solve the crisis.
�� Social care is not being protected, it will be severely cut, for it is the major activity of
local authorities.
�� Benefit fraud is rare and disabled people and people in poverty commit much less
fraud than other citizens.
The overall impact of these cuts, and other so called ‘reforms’ is going to be expensive and deeply damaging. Increased inequality will worsen society for everyone and will lead to increased spending pressures in other areas. Reducing social care will create more crises, more institutional, abusive and inefficient services and will increase the pressure on the NHS and other public services. It will lead to more family breakdowns and reduce the ability of citizens and families to partipate in their communities and in the economy.
The Campaign for a Fair Society calls for:
1. A halt to the current programme of cuts
2. An independent assessment of the cumulative impact of the cuts on disabled people
and other vulnerable groups
3. The development of a fairer and more sustainable welfare system that recognises the
equal worth of all human beings and the protection of human rights for all

HoW THe CuTS TARgeT DiSAbleD people | FoREWoRD
A RepoRT FRom THe CenTRe FoR WelFARe ReFoRm on beHAlF oF THe CAmpAign FoR A FAiR SoCieTy
9
Foreword
Sir Winston Churchill, that staunch Conservative Prime minister of the mid-20th Century, is reputed to have said: “you measure the degree of civilization of a society by how it treats its weakest members.” I just wonder how he would measure up this Con-Lib Government’s attack on the weakest members of today’s British ‘civilised’ state.
When millionaires are getting tax rebates and international companies go without paying any tax whatsoever, the poorest in society are getting less and less support, whether or not they are on low pay inside the labour market or even lower benefits outside the market. This situation is made even worse by this Con-Lib Government vilifying and stigmatising those outside the labour market, for no fault of their own, as lazy scroungers, who have no sense of responsibility or self-worth.
This report by Simon Duffy counteracts this purposeful 1984 orwellian ‘Newspeak’. It shows how disabled people, particularly those who are the most impaired, have been ‘hit’ the hardest by the present welfare cuts.
Disabled people want to work, if they can; they want to participate as equal members of society; but even if they do work, they still live in multidimensional poverty and disadvantage. They are not just disadvantaged by their impairment, but by the housing they live in, the education and transportation from which they are excluded, the limitations in shopping for food and the additional costs of heating, laundry etc. Finally, they are forced to remain in poverty, even if they have worked hard and saved for their retirement, by a system of community care charging which leaves them with an income and savings just above that of those on jobseekers allowance, in return for minimum levels of social care support.
The Campaign for a Fair Society is a group of people who want to show the public just how unfair our present society is towards its weakest members. Epidemiologists, like Richard Wilkinson and Kate Pickett, have shown that societies with a narrow band between rich and power experience better quality of life than those with a much wider divide. If we, as a British society wish our lives, all of our lives, to be quality lives then we must tackle this growing divide between us.
on behalf of the Campaign for a Fair Society, I would wish to thank Simon Duffy for writing and producing this paper; and to those who read it, I hope it will give us the eyes not just to see the Grand Canyon which is between the richest and the poorest in our society, but to find a way to bridge it.
Jim Elder-Woodward, OBEChair of the UK steering committee of the Campaign for a Fair Society

A FAiR SoCieTy? | 1. THE CUTS PRoGRAmmE
A RepoRT FRom THe CenTRe FoR WelFARe ReFoRm on beHAlF oF THe CAmpAign FoR A FAiR SoCieTy
10
1. The cuts programme
The current UK government is committed to making a significant reduction in the size of public expenditure relative to the overall economy. Table 1 describes the government’s spending plans in 2010 and their ambitions for what they will have achieved by 2014-15. These figures are taken directly from the Comprehensive Spending Review 2010 (CSR).[1]
These figures are represented in 2010/11 prices, discounting inflation, but in the expectation of a certain level of growth. Benefits, pension and tax credit data has been added from other government sources (for it is not included within the CSR). The calculation of the cut to benefits and tax credits is based on the government’s declared intention to make a £22 billion annual saving in real terms by 2015.[2]
The government’s own plans include a commitment to ensure that pensions and the NHS would be protected in order to keep pace, not just with inflation, but also with overall economic growth. This commitment provides a useful starting point for our analysis, because it means that we can treat the cash growth of these two major items as equivalent to no change in real terms. The CSR plans to increase the cash expenditure on the NHS and Pensions by 12.6% by 2014-15 (equivalent to no real growth). This means any increase over and above 12.6% this can be treated as real growth, and any increase lower than this as a real cut.
These figures suggest that, in real terms, if the government’s plans were successful, then public expenditure would be 10.8% lower.[3]
For the purpose of our analysis we are going to take, to treat the overall cut to public expenditure, the aggregate real-term annual cut by 2015, as £63.4 billion. This is the overall cut which will have been achieved by the government if its 2010 plans are successful. However, because there are some areas of growth the actual level of cuts is greater than that, so by 2015 there will be an annual real-term cut of £75.2 billion. Although, as we will see, these cuts only fall hard on some services and on a fraction of the UK population.

HoW THe CuTS TARgeT DiSAbleD people | 1. THE CUTS PRoGRAmmE
A RepoRT FRom THe CenTRe FoR WelFARe ReFoRm on beHAlF oF THe CAmpAign FoR A FAiR SoCieTy
11
Spending 2010–11
Spending 2014–15
AnnualChange
Change if protected
Change in real terms
Change from
2010-15
Schools & colleges
£60.6 £61.5 £0.9 £68.2 -£6.7 -11.1%
NHS £101.8 £114.6 £12.8 £114.6 £0 0
Transport £13.1 £12.2 -£0.9 £14.8 -£2.6 -19.5%
English local authorities
£38.6 £27.3 -£11.3 £43.5 -£16.2 -41.9%
Business & universities
£20 £16.1 -£3.9 £22.5 -£6.4 -32.1%
Policing, justice & prisons
£22.4 £19.3 -£3.1 £25.2 -£5.9 -26.4%
Defence £35.7 £36.8 £1.1 £40.2 -£3.4 -9.5%
Foreign aid et al
£9.6 £12.8 £3.2 £10.8 £2.0 20.7%
Energy, environment & culture
£14.1 £12.4 -£1.7 £15.9 -£3.5 -24.7%
Scotland £28.2 £28.1 -£0.1 £31.8 -£3.7 -13.0%
Wales £14.9 £14.5 -£0.4 £16.8 -£2.3 -15.3%
Northern ireland
£16 £16.4 £0.4 £18.0 -£1.6 -10.1%
Tax & benefit administration
£10.7 £11.1 £0.4 £12.0 -£0.9 -8.9%
Treasure, cabinet & quangos
£1.1 £3.9 £2.8 £1.2 £2.7 241.9%
Financial crisis measures
£8.2 £7.2 £1 n/a n/a n/a
Pensions £71.6 £80.6 £9 £80.6 £0 0
Benefits & tax credits
£118.4 £111.3 -£7.1 £133.3 -£22.0 -18.6%
TOTAL £585 £586.1 £1.1 £649.5 -£63.4 -10.8%
TAble 1. government spending plans for 2014-15 (in billions)

A FAiR SoCieTy? | 2. TARGETED CUTS
A RepoRT FRom THe CenTRe FoR WelFARe ReFoRm on beHAlF oF THe CAmpAign FoR A FAiR SoCieTy
12
2. Targeted cuts
Not everything is being cut and some things are even growing. As can be seen in Figure 1.
FiguRe 1. Cut in annual real term funding by 2015
The largest cut in terms of cash is to benefits (that is, minimal income protection for disabled people and people in poverty). The second biggest cuts is to English local government (whose main function is to provide support to disabled people and families). Table 2 shows both how government expenditure is distributed in percentage terms, and how the cuts are also distributed. Figure 2 shows that in percentage terms, English local government faces the deepest cuts.
When we examine Table 2 it is also striking that:
�� Some expenditure is growing in cash and real terms: Foreign Aid (20.7%) and Cabinet
office, Treasury and associated quangos (241.9%).
�� The NHS and pensions are protected and do not change, and together they represent
over 30% of all government expenditure.
�� There are many areas where there are important cuts, cuts in real terms, but not in
cash terms (e.g. Defence, Education, Administration of Tax & Benefits)
�� The cuts to English local government (41.9%) benefits (18.6%) universities (32.1%)
and criminal justice (26.4%) are staggeringly large and together make-up about 70%
of all cuts. This is despite only representing 33% of all government expenditure. See
Figure 3.
�� Together the cuts on English local government (whose main function is social care)
and on Benefits (whose main function is to reduce poverty) make up 50.8% of all
cuts, despite the fact they represent only 26.8% of central government expenditure.
£-25 bn. £-20 bn. £-15 bn. £-10 bn. £-5 bn. £0 bn. £5 bn.Bene�ts & tax credits
Local gov (England)Schools
University & businessPolicing, justice etc.
ScotlandEnergy, environment, culture
DefenceTransport
WalesN. Ireland
Tax & bene�ts adminPensions
NHSForeign aid
No 10, No 11, quangos

HoW THe CuTS TARgeT DiSAbleD people | 2. TARGETED CUTS
A RepoRT FRom THe CenTRe FoR WelFARe ReFoRm on beHAlF oF THe CAmpAign FoR A FAiR SoCieTy
13
Spending 2010-11
Share of spending
Annual real change
by 2015
Change by 2015
Where cuts are targeted
Schools & colleges
£60.6 10.4% -£6.7 -11.1% 9.0%
NHS £101.8 17.4% £0 0% n/a
Transport £13.1 2.2% -£2.6 -19.5% 3.4%
English local authorities
£38.6 6.6% -£16.2 -41.9% 21.5%
Business & universities
£20 3.4% -£6.4 -32.1% 8.5%
Policing, justice & prisons
£22.4 3.8% -£5.9 -26.4% 7.9%
Defence £35.7 6.1% -£3.4 -9.5% 4.5%
Foreign aid et al.
£9.6 1.6% £2.0 20.7% n/a
Energy, environment &culture
£14.1 2.4% -£3.5 -24.7% 4.6%
Scotland £28.2 4.8% -£3.7 -13.0% 4.9%
Wales £14.9 2.5% -£2.3 -15.3% 3.0%
Northern ireland
£16 2.7% -£1.6 -10.1% 2.1%
Tax & benefit administration
£10.7 1.8% -£0.9 -8.9% 1.3%
Treasury, cabinet & quangos
£1.1 0.2% £2.7 241.9% n/a
Financial crisis measures
£8.2 1.4% n/a n/a n/a
Pensions £71.6 12.2% £0 0% n/a
Benefits & tax credits
£118.4 20.2% -£22.0 -18.6% 29.3%
TOTAL £585 -£63.4 -10.8%
TAble 2. How central government expenditure and the cuts are distibuted (in billions)
In other words, despite the government’s claim that the cuts would be made fairly, the cuts are not spread evenly across public services or systems of entitlements. The cuts have been targeted.
Moreover, the fact that deep cuts are being targeted on only a small fraction of public expenditure ensures that these targeted cuts will be even more severe. As Figure 3 makes clear, if we see how the cuts have been distributed, the vast majority fall on just two areas - benefits and local government.

A FAiR SoCieTy? | 2. TARGETED CUTS
A RepoRT FRom THe CenTRe FoR WelFARe ReFoRm on beHAlF oF THe CAmpAign FoR A FAiR SoCieTy
14
FiguRe 2. percentage change in annual funding by 2015 in real terms
FiguRe 3. Where the cuts are targeted
-50%-40%-30%-20%-10% 0% 10% 20% 30% 40% 50%Local gov (England)
University & businessPolicing, justice etc.
Energy, environment, cultureTransport
Bene�ts & tax creditsWales
ScotlandSchools
N. IrelandDefence
Tax & bene�ts adminPensions
NHSForeign aid
No 10, No 11, quangos[240%]
Tax & bene�ts admin
N. Ireland
Wales
Transport
Defence
Energy, environ., culture
Scotland
Policing, justice etc.
University & business
Schools
Local gov (England)
Bene�ts & tax credits
HoW THe CuTS TARgeT DiSAbleD people | 3. CUTS ImPLEmENTATIoN
A RepoRT FRom THe CenTRe FoR WelFARe ReFoRm on beHAlF oF THe CAmpAign FoR A FAiR SoCieTy
15
3. Cuts implementation
In this report we are going to concentrate on the cuts that target disabled people and people living in poverty, in particular:
1. Cuts in social care (the main activity of local government)
2. Cuts in personal income (benefits and tax credits)
3.1 Cuts in social care
The highest percentage cut in public expenditure is the 41.9% cut in real-term funding for English local government. There has never been such a severe cut to a vital public services like this.
Cuts to spending in Scotland (13%), Northern Ireland (10.1%) and Wales (15.3%) do not seem so severe. However this is somewhat misleading, for these figures also include NHS spending. So, it is likely that any effort to copy Whitehall, and to protect NHS spending, will also lead to similar cuts in social care. For the sake of simplicity we will concentrate on the English figures here, but it is important to recognise that similar forces are at work in every country. However, there are some encouraging signs that the devolved governments have tried to mitigate the more extreme cuts to social care that are taking place in England.
Many people do not realise that local government’s primary function is to provide social care services. Social care provides:
�� Help to older people living at home, or in residential care
�� Independent living for disabled people, including people severe learning difficulties
�� Help for people with mental health problems to regain ordinary lives
�� Support to families who have children with severe disabilities
�� Safeguards for children who are being abused or neglected
�� Support for families, and many others who are in greatest need
Social care is the front-line prevention service of the welfare state. When people do not get this practical assistance it can quickly lead to death, health crisis, hospital admission, institutionalisation, fractured families and police action - all of which is more expensive and less effective than early support to stay strong and independent.
Many people do not realise that social care is also the main activity of local government. Many of the activities that we associate with local government are effectively controlled from Whitehall and local authorities have no control over how that funding is used. Table 3 sets out local authority expenditure and the funding which is really controlled locally.

A FAiR SoCieTy? | 3. CUTS ImPLEmENTATIoN
A RepoRT FRom THe CenTRe FoR WelFARe ReFoRm on beHAlF oF THe CAmpAign FoR A FAiR SoCieTy
16
Spending protected from local authority cuts
Education £46.0 ring-fenced
Police £12.2 ring-fenced
Fire & rescue £2.9 ring-fenced
Total of expenditure outside cuts £60.4
Spending that local authorities are forced to cut
Adult social care £14.4 40.3%
Children’s social care £7.7 21.6%
Environment and regulatory services £5.5 15.4%
Culture and leisure £3.4 9.5%
Housing £2.7 7.6%
Planning & development £2.1 5.7%
Total of expenditure to be cut £35.9
Theoretical total for local expenditure £96.3
TAble 3. Annual expenditure (in billions) by english local authorities in 2010-11
Figure 4 describes the balance of funding that is in genuine local control and which must therefore be cut as a response to the targeting of English local government in the government’s plans. As can be seen, over 60% of relevant local government expenditure is for social care for children or adults.[4]
FiguRe 4. The services actually controlled by local government
Local authorities can raise some income themselves, although this is a minority of the income they control. Most local government funding comes from taxes raised centrally. However this means that the relationship between the cut in central government funding and the actual cuts in social care won't be identical. To find how the cut in funding does reduce social care funding we need to look at what is actually happening to social care.
Together (ignoring charges and private purchasing of care) and using 2010 data, adult social care cost about £14.4 billion, while children’s social care cost £7.7 billion.[5] The Campaign for a Fair Society predicted severe cuts in social care funding when it was
Planning & development
Housing
Culture and leisure
Environment and regulation
Children’s social care
Adult social care

HoW THe CuTS TARgeT DiSAbleD people | 3. CUTS ImPLEmENTATIoN
A RepoRT FRom THe CenTRe FoR WelFARe ReFoRm on beHAlF oF THe CAmpAign FoR A FAiR SoCieTy
17
launched in February 2011. Today, after more than two years of cuts, these predictions have been proved correct.
�� Adult social care in England was cut by £991 million by 2011 [6]
�� Adult social care in England was cut by a further £890 million by 2012 [7]
�� Children’s social care in England was cut by £1.852 billion from 2010 to 2012 [8]
In fact the Campaign’s original estimate for cuts to social care understated the problem. In just two years nearly £4 billion has been cut from social care, and further cuts are planned over the next three years. IBy 2015 social care in England will be have been cut by £8 billion. This is a real term cut of about 33%. This may seem a surprising figure given the government’s supposed commitment to ‘protect social care’ but in fact it is the logical result of cuts to local government that must then fall on social care.[9]
In practice these cuts are actually experienced by a range of different measures:
�� Reduced levels of support for voluntary organisations, advocacy and services not
covered by FACS (e.g. support for women experiencing domestic violence).[10]
�� Reductions in support, freezing of fees for service providers and the reduction of
personal budgets.[11]
�� Reducing expenditure on supported housing services funded through ‘Supporting
People’.[12]
�� Increasing the threshold for eligibility; e.g. by 2011, 78% Councils had stopped
supporting people with ‘Low’ or ‘moderate’ needs.[13]
�� Increasing, so called, ‘social care charges’, effectively increasing what is a direct tax
on those disabled people who have the most severe needs
It is difficult to overstate the problem here. These kinds of cuts (cuts to services that have historically always been under-funded) are devastating. Given the gloomy economic outlook, and the on-going trend and pattern of expenditure cuts, then it is likely that we will see social care cut by 50% by 2018. The lack of public debate about this is very surprising.
3.2 Cuts in personal income
Before the Autumn Statement 2012 Steven Kennedy, of the House of Commons Library, summarised the government’s plans to save £18 billion a year by 2014-15 benefits in the following analysis:[14]
�� £5.8 billion due to switch to CPI indexation
�� £3.6 billion from Child Benefit freeze and clawback from higher rate taxpayers
�� £2.6 billion from tax credit changes
�� £1.9 billion from Housing Benefit reforms
�� £1.2 billion from DLA reform
�� £1.2 billion from time-limiting contributory ESA
In practice the cuts will be experienced in these and many other forms, often as part of changes to the rules of local and national systems. Also the Autumn Statement 2012
A FAiR SoCieTy? | 3. CUTS ImPLEmENTATIoN
A RepoRT FRom THe CenTRe FoR WelFARe ReFoRm on beHAlF oF THe CAmpAign FoR A FAiR SoCieTy
18
contained further provisions to increase the burden of cuts on both the poorest (and the very richest) to bring the total level of benefit cuts, in real terms, to £22 billion.[15]
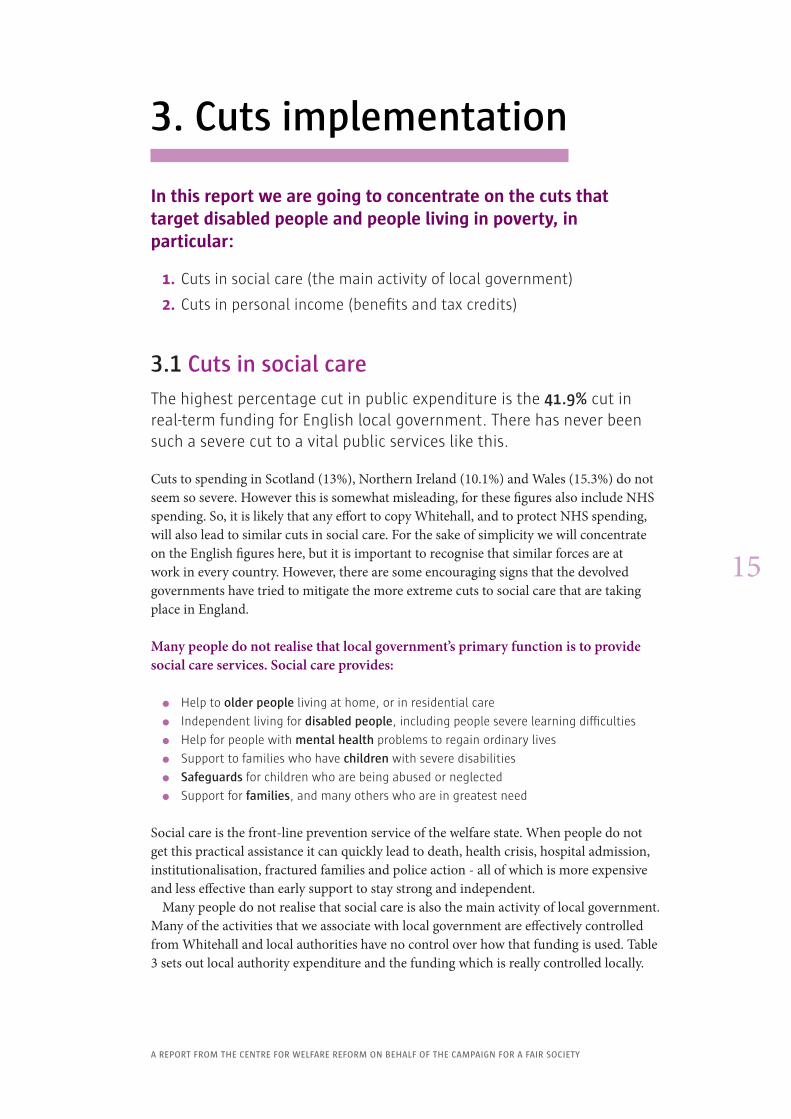
The list of changes, ‘reforms’ or cuts is varied, complex and many details are unresolved. Table 4 provides a brief overview of many of these cuts and ‘reforms’.
Replacing DLA with PIP Time-limiting of contributory ESA
Change to CPI indexation of benefits Child Benefit freeze
Council Tax Benefit – 10% reduction and localisation
Child Benefit clawback from higher rate taxpayers
Housing Benefit cuts Tax credit changes
Universal Credit Abolition of the Independent Living Fund
Closure of Remploy services Localisation of the Social Fund
Reductions in Access to Work funding Abolition of the Child Trust Fund
Abolition of the Health in Pregnancy Grant Abolition of the ESA youth rules
Abolition of Sure Start Maternity for second and subsequent children
Household benefit cap
Extension of JSA lone parents with a youngest child aged 5-6.
Continued use of ATOS or others
Transfer of Social Fund to local government
Reductions in support for carers
TAble 4. An overview of the cuts in benefits and tax credits
It seems that the enormous complexity of these changes, supported by the rhetorical impact of the language of ‘reform’ and the language of ‘stigma’, is disguising a rapid shift towards an unprecedented level of income inequality and poverty in modern Britain.
Although the policy details are complex, the direction of policy is clear. It is important to resist the flow of this policy and to avoid losing sight of the overall issue within the mire of current legislative and regulatory changes. Political leaders have a particular responsibility to outline the real social and economic problems that will arise if we allow inequality to grow in this way.

HoW THe CuTS TARgeT DiSAbleD people | 4. WHo IS TARGETED
A RepoRT FRom THe CenTRe FoR WelFARe ReFoRm on beHAlF oF THe CAmpAign FoR A FAiR SoCieTy
19
4. Who is targeted
It is useful to look at how the cuts impact on services and on systems of entitlements. But what is much more fundamental is to understand how these cuts will impact on people themselves.
When the cuts were announced the government declared that its cuts had been organised fairly. In particular it accepted that fairness demands that the poorest and the most needy should bear the smallest burden and that the wealthiest should bear the largest burden. This is not what has happened.
In fact it is hard to imagine a less fair way of targeting the cuts. If the total level of cuts is equal to £75.2 billion, and the population of the UK is 63 million then the mean level of cuts would be just over £1,200 per person. If we were to spread that burden in proportion to income then we might expect the poorest to be targeted less than this, and the richest to be targeted more than this. This is not what has happened.
Some cuts, like cuts to the defence budget, are not directly discriminatory in their impact. Other cuts, like cuts to schools and student grants, are indirectly discriminatory. For they impact more on those who cannot subsidise their child’s education in some other way. However, for the purpose of this analysis, we will treat all these kinds of cuts as if they are not targeted on any particular group. These cuts include
�� Education - cut by £6.7 billion
�� Transport - cut by £2.6 billion
�� Business & universities - cut by £6.4 billion
�� Policing etc. - cut by £5.9 billion
�� Defence - cut by £3.4 billion
�� Energy etc. - cut by £3.5 billion
�� Tax & benefit administration - cut by ££0.9 billion
Together the cuts that are neither discriminatory, or only indirectly discriminatory, come to £29.4 billion. So we might say that these are shared roughly equally by the whole population. This gives a per person burden of £467. That is the modal average - what most people will face.
However, while many cuts are organised in ways that are complex and difficult to model, it is very clear that the cuts do target the very groups that a fair society would seek to protect:
1. People In Poverty
2. Disabled people
3. People with the severest disabilities
It would be unfair enough if these groups were asked to bear the same burden as the rest of the population; but the reality is that they are being asked to bear a far greater burden than the rest of the population.

A FAiR SoCieTy? | 4. WHo IS TARGETED
A RepoRT FRom THe CenTRe FoR WelFARe ReFoRm on beHAlF oF THe CAmpAign FoR A FAiR SoCieTy
20
4.1 people in poverty
Approximately 13.5 million people live below the government’s official poverty line, which is 21% of the population and some of these people are very poor indeed, surviving on less than £3,000 per year. The UK is the third most unequal developed country in the world and its rate of growth in inequality is now greater than the USA’s.[16]
Almost all of the benefit cuts are targeted at people in poverty. If we exclude the £4 billion reduction in child benefit for the rich, then the remaining cuts in benefits and tax credits will be born by primarily by people in poverty, including many disabled people.[17]
In real annual terms, by 2015, people in poverty and disabled people will be bearing cuts in personal income of £18 billion per year.
To understand how this impacts on people in poverty and on disabled people we must distinguish benefits that try to reduce poverty, from benefits which help disabled people deal with the extra costs of disability. There are 7 main disability benefits, as set out in Table 5.[18] This excludes funding for housing, which in the past, also aimed to reflect the extra costs of disability in the details of the regulations - but which is now also under threat.
Main disability benefits 2010-11
Attendance Allowance £5.2
Carer's Allowance £1.6
Disability Living Allowance £11.9
Incapacity Benefit £5.5
Independent Living Funds £0.4
Industrial injuries benefits £0.9
Severe Disablement Allowance £0.9
TOTAL £26.4
TAble 5. Annual expenditure on main disability benefits (in billions)
This suggests that of the £90 billion of benefits and tax credits available to improve personal income, about 30% are used to assist disabled people (including disabled children, frail older people, and their families).
Ideally we would be able to distinguish the benefit losses which will only harm disabled people from those benefit losses that will only harm people who are poor (including disabled people). However, this is very difficult to do, because many of the details of the actual regulations are still unclear. The termination of DLA, and other similar changes outlined above, make it clear that there is certainly no special protection for disabled people in the government’s plans. They will harm disabled people and they will harm people in poverty.
So, for this analysis, we have made the simplest reasonable assumption, that cuts to disability benefits will be proportionate to other benefit cuts. As we discussed above, the cuts to benefits can be broadly broken down into three categories:

HoW THe CuTS TARgeT DiSAbleD people | 4. WHo IS TARGETED
A RepoRT FRom THe CenTRe FoR WelFARe ReFoRm on beHAlF oF THe CAmpAign FoR A FAiR SoCieTy
21
�� £4 billion of child benefits cuts that will harm the better-off
�� £12.6 billion of benefit cuts that will harm people in poverty (including those
disabled people who are poor)
�� £5.4 billion of benefit cuts that will harm only disabled people
We can use this analysis to understand the extra burden placed by the government on people in poverty. The burdens faced by an average person in poverty includes:
�� The burden faced by the whole population - £467
�� 100% of the burden experienced by people in poverty - £934
�� 50% of the burden of the disability cuts - £200
�� 100% of the burden of the social care cuts - £593
This means that people in poverty do not bear the same burden as other people, instead they bear a much greater burden of £2,195.
This means that the cuts target people, in poverty about 5 times more than other citizens.
As a group, people in poverty, 21% of the population (1 in 5 of us), will bear 39% of all cuts.
4.2 Disabled people
There are many disabled people, including many people who have become frail in old age or who are managing chronic conditions. At least 5 million people have impairments that are so significant that they are currently entitled to Attendance Allowance or Disability Living Allowance; this is 8% of the population.
Many, but not all, disabled people are poor. About 50% of disabled people live in poverty, and they are therefore subject to the same level of targeting as people in poverty. However disabled people have also been subject to additional targeting, because many disability benefits have been singled out for reductions within the overall cuts. In particular the following areas of cuts are likely to be very damaging to disabled people:
�� The end of ILF
�� The end of DLA, replacement with PIP
�� Time-limiting and means-testing ESA
�� Changes built into development of UC
�� Changes included in cuts to Housing Benefit
�� Reductions in relief for Council Tax for disabled people
Although there are some reasons to think that disability benefits are under greater attack than other benefits, we have (as we described above) made the more conservative assumption that cuts to disability benefits will be proportionate to other benefit cuts.

A FAiR SoCieTy? | 4. WHo IS TARGETED
A RepoRT FRom THe CenTRe FoR WelFARe ReFoRm on beHAlF oF THe CAmpAign FoR A FAiR SoCieTy
22
For disabled people then we need to distinguish the following burdens:
�� The same burden as the rest of the population - £467
�� 50% of the burden experienced by people in poverty - £1,261
�� 100% of the burden of the disability benefit cuts - £1,081
�� 100% of the burden of the social care cuts - £1,600
This means the overall burden on disabled people will be an average of £4,410 per person.
This means the cuts targeting disabled people are 9 times more than that place on most other citizens.
As a group, disabled people, 8% of the population (1 in 13 of us), bear 29% of all cuts.
4.3 people with severe impairments
There are also approximately 1.3 million children or adults whose needs are so severe that they are also eligible for additional support from local government - that is, social care. About 2% of the population are currently entitled to social care.
However, this figure excludes those people who have very high needs, but who are excluded because of the extreme means-testing in social care (which should be called, the disability tax). In fact, the flawed design of the current social care system guarantees that those who receive social care are almost always poor, on low incomes and with low savings.
For this reason people who receive social care are subject to a triple whammy:
�� Cuts in personal income, including housing costs
�� Cuts in disability income, including special housing costs
�� Cuts in social care
As we discussed above the total cut in social care (children and adults) will be about £8 billion by 2015. If we divide this by the current social care population then this means that the burden, per person, is an additional £6,349.
In practice this burden will be faced unequally by this population. Many will lose eligibility for vital services, and then find themselves in hospital. Others will see their support and services slashed and this will limit their freedom, increase social isolation and create other problems. Those in the most expensive and institutional services will be the least impacted (e.g. the likes of Winterbourne View) while low level, community-focused services are the first to be cut.

HoW THe CuTS TARgeT DiSAbleD people | 4. WHo IS TARGETED
A RepoRT FRom THe CenTRe FoR WelFARe ReFoRm on beHAlF oF THe CAmpAign FoR A FAiR SoCieTy
23
All of this means that those who have the greatest needs will also bearing the biggest burden:
�� The same burden as the rest of the population - £467
�� 100% of the burden experienced by people in poverty - £934
�� 100% of the burden of the disability cuts - £1,081
�� 100% of the burden of the social care cuts - £6,349
This means the overall burden on disabled people with the severest disabilities will be £8,832 per person.
This means the cuts target disabled people 19 times more than other citizens.
people with severest disabilities, 2% of the population (1 in 50 of us), bear 15% of all cuts.
Figure 5 represents how the burden of cuts is shared between different sections of the population.
FiguRe 5. How the cuts target different population groups
Figure 6 goes further and shows how the burden of cuts, per person, compares with the burden on placed on the rest of the population. As need and poverty increases, so does the intensity with which the cuts are targeted - the very opposite of fair
If all this seems very surprising then this is because the real facts have not been discussed by politicians or by the press.
Our analysis is certainly reasonable and it could be argued that it is rather conservative. For example, we have not included reference to regressive taxes that also target people in poverty and disabled people, like the increases in VAT and increased social care charges. We have not included the cuts in Northern Ireland, Wales and Scotland - even though we
Share of cuts
Share of population
39% 29% 15%
2%8%21%
People inpoverty
Disabled People
People with severest disabilites

A FAiR SoCieTy? | 4. WHo IS TARGETED
A RepoRT FRom THe CenTRe FoR WelFARe ReFoRm on beHAlF oF THe CAmpAign FoR A FAiR SoCieTy
24
have used the UK population as the base for our calculations. Nor have we been able to keep pace with every cut that has been imposed.
There are of course many genuine complications and other factors that would need to considered in a full analysis. The government claims that it is refocusing some benefits (e.g. PIP) on people with more severe disabilities, however this is largely code for making many people ineligible for those benefits. Excluding someone with real and significant needs from a benefit can be described as 'targeting more resources' on people with greater needs - but only as political spin.
There will also be other important distributive affects caused by changes in the benefit regulations, tax and tax credit systems, housing benefit and in cuts to other services. An even more detailed analysis would find that some particular groups, within the categories we have used, will be harmed a little less than our figures suggest, but logically this only means that some other group will have been harmed even more than our figures suggest.
To some degree we will only find out exactly how the harm of the cut has been distributed after all the cuts have been made. Waiting for that degree of statistical perfection is self-defeating; what we must do is reverse the current and clear trend of government policy - to target cuts on disabled people and people in poverty.
Ideally the government would have carried out a full analysis of its own programme of cuts and then seen how unfair they were going to be. Or, perhaps, the fact that the government has repeatedly refused to make such an analysis demonstrates that it already knows how unfair these cuts will be. Either way, our analysis demonstrates, very clearly, that the cuts programme is not fair and that it harms most, those whom we should protect first.
FiguRe 6. How the cuts target disabled people
5
9
19
Social Care Cuts
Bene t Cuts
Housing Cuts
Tax Increases
Burden on people in poverty: 5 x rest of population
Burden on disabled people: 9 x rest of population
Burden on people with severest disabilities: 19 x rest of population
How cuts target disabled people

HoW THe CuTS TARgeT DiSAbleD people | 5. THE DAmAGE DoNE
A RepoRT FRom THe CenTRe FoR WelFARe ReFoRm on beHAlF oF THe CAmpAign FoR A FAiR SoCieTy
25
5. The damage done
The cuts are targeted on the very people who need the most protection, and the cuts are targeted on those services and income entitlements that do the most good for the least cost. The cuts will not solve the current economic crisis, but will lead to greater injustice, social damage and increasing costs in other parts of the welfare system.
5.1 These cuts won’t solve the real problem
The current economic crisis was not created by people in poverty or disabled people. The economic crisis was caused by the ending of an artificial economic bubble that had benefited home owners and banks. Unprecedented growth in house prices encouraged unsustainable borrowing. This has now created an economic and a political problem. Politicians need to protect home owners (not people in poverty) from the negative impact of the bursting of this bubble because the critical swing voters are home owners. Reducing the incomes of the poorest will not solve a problem that is rooted in the problems of the better-off.
5.2 Taking from people in poverty doesn’t work
Not only do people in poverty not have enough money to solve the economic problems of the better off they are also major tax payers. The vast majority of benefits paid out come back as taxes.
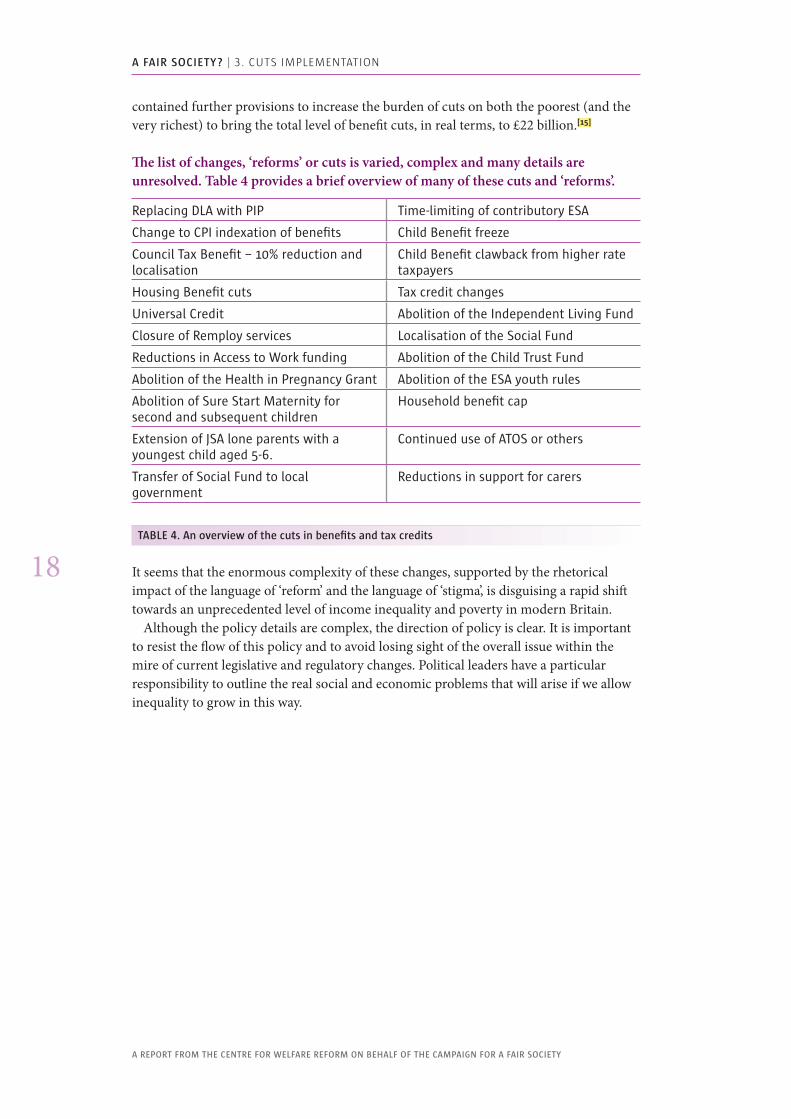
The claim that benefits are the largest part of the welfare system is false, because most benefits are paid back as taxes. What we should really fouc on, the net cost of benefits and pensions, after taxes, is only £25 billion (3% of GDP).[19] Moreover the poorest 10% of households actually pay the highest percentage of their income in tax (47%) (see Figure 7). As the government tries to reduce the incomes of the poorest it will find that it also loses tax revenue.
A FAiR SoCieTy? | 5. THE DAmAGE DoNE
A RepoRT FRom THe CenTRe FoR WelFARe ReFoRm on beHAlF oF THe CAmpAign FoR A FAiR SoCieTy
26
FiguRe 7. Tax paid as a proportion of annual family income by decile (onS data 2009)
5.3 increased inequality is expensive
The overall impact of reducing the value of benefits is to increase the level of overall inequality. But increased inequality has a series of negative and expensive consequences.
As Wilkinson and Pickett have shown, income inequality is correlated with:
�� Lower levels of trust, thereby higher levels of regulation and bureaucracy
�� Lower levels of life expectancy
�� Higher levels of infant mortality
�� Greater obesity
�� Worsening mental health
�� Poor educational achievement
�� Higher teenage birth rates
�� more homicides
�� Higher levels of imprisonment
Inequality is expensive. Often governments are forced to spend more to deal with the consequences of inequality. The UK can expect more riots, social conflict, stigma and unhappiness.[20]
5.4 Cutting social care is costly
At its best, social care ensures people can carry on as independent and contributing citizens. it prevents:
�� Social isolation, abuse, exclusion and the inability of individuals to fully contribute to
society - it is critical to ensuring all citizens can play their full part in society.
�� Hospital admissions and it reduces length of stay in hospital.
0
10000
20000
30000
40000
50000
60000
70000
80000
Income
10th9th8th7th6th5th4th3rd2nd1st 0%10%20%30%40%50%60%70%80%90%100%
% Tax

HoW THe CuTS TARgeT DiSAbleD people | 5. THE DAmAGE DoNE
A RepoRT FRom THe CenTRe FoR WelFARe ReFoRm on beHAlF oF THe CAmpAign FoR A FAiR SoCieTy
27
�� institutionalisation, including the use of private institutions like Winterbourne View.
[There are currently 21,000 people in such institutions, costing well over £1.5 billion,
possibly very much more.].[21]
�� Family breakdowns, prison costs and abuse. For example, voluntary organisations
like WomenCentre in Halifax are often the first to be cut, but provide high quality
supports for women and families which saves millions by reducing rates of domestic
violence, other crimes and re-offending, while improving mental and physical health
and keeping families safe.[22]
5.5 Cutting social care is contradictory
This government, like the previous government, claims to be shifting power and control into the hands of disabled people and families through the use of individual (or personal) budgets. However the reality is that the very budgets that are being transferred directly to citizens are being slashed.
This reality of government policy contradicts its own rhetoric:
�� Instead of increasing the economic power and status of disabled people, government
policy will reduce that power.
�� Instead of strengthening families, government policy will leave families weaker.
�� Instead of promoting prevention and local resilience, government policy will increase
isolation, crisis and expensive institutional services.[23]
5.6 The human cost is dreadful
As the cuts are implemented, and as the cumulative impact focuses increasingly on disabled people with the greatest needs the human cost grows.
Here are just a few examples of what the cuts mean, from one of the local campaigns that support the Campaign for a Fair Society - Don’t Cut Us Out in West Sussex:[24]
�� Susie Rowbottom, a 41-year old lady with Downs Syndrome has seen her support
slashed to levels which are endangering her health.
�� elizabeth parker is 93, lives alone, is severely arthritic and profoundly deaf, but she
has now lost the care support from West Sussex County Council because she is no
longer eligible.
�� Tony munn has limited mobility and must carry an oxygen cylinder wherever he
goes and susceptible to blackouts and periods of deep depression, but is judged
to have only ‘moderate’ disabilities and will lose all benefits and care support
currently provided by West Sussex County Council.
These cuts do not just fall on ‘other people’ they will harm your neighbours, your friends and your families. If you should lose your job or acquire a disability they will fall on you.

A FAiR SoCieTy? | 6. WHy THE CUTS TARGET
A RepoRT FRom THe CenTRe FoR WelFARe ReFoRm on beHAlF oF THe CAmpAign FoR A FAiR SoCieTy
28
6. Why the cuts target
The government did not declare its intention to target disabled people or people in poverty. In fact it claimed, on the contrary, that it aimed to impose cuts in a way that would be fair. So it is impossible to be sure why the cuts do target the very groups that one would expect a decent society to protect.
A number of factors may have played a part:
6.1 The government may be confused
often senior politicians and civil servants are surprisingly ignorant of the consequences of their own actions. It may be, for example, that they simply do not know that about 60% of local authority expenditure is for social care for children and adults. Some may not even know what social care is for, or they may think it is provided by the NHS.
6.2 pandering to electoral interests
Politicians of all parties focus their primary attention on swing-voters and the issues that gain a lot of media attention. It is noticeable that the NHS, which is often treated as a point of vulnerability for politicians with the media, is not facing the same cuts, despite the greater efficiency of benefits and social care at producing social benefits.
6.3 Demonisation of disabled people
Worryingly it may be that politicians welcome the opportunity to target groups that some in the media, and in the general public, fear or dislike.
For example, false or misleading information about benefit fraud is rife and seems to be rooted in intentionally miselading briefings by the DWP.[25] As Figure 8 shows,
�� Tax fraud is 15 times the level of benefit fraud and
�� Unclaimed benefits is 17 times the level of benefit fraud (this figure might arguably
be treated as government fraud as it is a function of the obscurity and complexity of
a benefits system that often fails to enable people to get what they are entitled to).
�� Government cuts are 22 times the level of benefit fraud.

HoW THe CuTS TARgeT DiSAbleD people | 6. WHy THE CUTS TARGET
A RepoRT FRom THe CenTRe FoR WelFARe ReFoRm on beHAlF oF THe CAmpAign FoR A FAiR SoCieTy
29
FiguRe 8. Fraud and the benefit system
6.4 pinning the blame elsewhere
If the public does not understand the degree to which local spending is controlled by central government then they may blame local politicians for decisions made in Whitehall.[26]
6.5 Disguising the cuts in 'reforms'
many of the cuts in benefits are being hidden within technical changes made to tax, tax credit and benefits systems. This means they can be hard to identify and easier to justify as technical change or 'reform'. Changes in the way in which benefits are uprated are a good example of a change which few people fully understand but whose long-term consequences are devastating.
6.6 Design flaws in the welfare state
It is also possible to distinguish a certain pattern to the cuts. As Table 6 suggests, the cuts have been targeted in those areas that are the least likely to cause embarrassment to politicians in central government. The fact that these are the areas that are likely to be most socially damaging does not appear to have any significant weight with policy makers.
Bene�t fraud = £ 1 bn.
Cuts in bene�ts = £ 22 bn.
Total cost of bene�ts & pensions = £ 180 bn.
Tax fraud = £ 15 bn.
Unclaimed entitlements = £ 17 bn.
Net impact of bene�ts & pensions = £ 25 bn.

A FAiR SoCieTy? | 6. WHy THE CUTS TARGET
A RepoRT FRom THe CenTRe FoR WelFARe ReFoRm on beHAlF oF THe CAmpAign FoR A FAiR SoCieTy
30
More likely to be protected if... More likely to be targeted if...
no stigma associated with services services or recipients are stigmatised
perceived as mainstream or universal services
means-tested services that are perceived as only being relevant to a minority
centrally controlled and offering prestige to national leaders
locally controlled, where responsibility for cuts can be blamed on others
clear lines of accountability back to Whitehall
complex and obscure with overlapping sources of funding
TAble 6. Factors that seem to determine targeting of cuts
This analysis suggests that, while there may be a certain degree of prejudice against people in poverty and disabled people at work in the targeting of the cuts, the real reason may be structural. The current design of the welfare system seems to lead to some parts of the welfare system being scapegoated and targeted for cuts, while other parts are protected.
This would also explain why the only other significant targeting of cuts has been on the very well-off, for example the cut in Child Benefit for the wealthy. This is further indicates that what we are seeing is so much an attack by the rich on people in poverty, but rather it is the weakening of our shared commitment to the principles of a universal welfare state, one that offers support to everyone.
It seems that the political desire to pander to swing voters and to ‘the middle’ is probably the most corrosive factor in the decline of our collective welfare security. It is for this very reason that the Campaign for a Fair Society is working to promote a modernised welfare state, that is both universal and empowering - properly reflecting our shared human rights.
However, whatever the explanation for these cuts, what is certainly true is that the full extent of these cuts - their severity and their unfairness - is not widely understood. The cuts will mount in severity year on year, until at least 2014-15 and the long-term damage caused by income inequality, deepening poverty and social exclusion will grow greater over next few years. Even if there is a change in government, there is still no reason to expect any change in policy beyond 2015 unless there is a more fundamental rethink by policy makers and political leaders and a new level of self-discipline within the political process itself.
It is politics, not economics, that has caused the targeting of disabled people for cuts.

HoW THe CuTS TARgeT DiSAbleD people | 7. WHAT WE SHoULD Do
A RepoRT FRom THe CenTRe FoR WelFARe ReFoRm on beHAlF oF THe CAmpAign FoR A FAiR SoCieTy
31
7. What we should do
The government has made many optimistic assumptions about the impact of its deficit reduction plans and its reform of the welfare system. However, even if we were to share that optimism, and assume that economic growth will be restored and that incentives for work will increase earnings for some, there can still be no doubt that:
�� Poverty will deepen for many, and overall income inequality will increase.
�� Lack of care and support for people with moderate needs will increase the number of crises and the cost of support for the smaller number of people eligible for support.
The consequence of these changes will be felt in increased social unrest and increased costs and pressures in other parts of society and the welfare system. Creating savings in the wrong way will lead to increased costs elsewhere.[27]
If the government is wrong and growth is not restored and unemployment continues to grow then these problems will grow even more quickly.
It is the view of the Campaign for a Fair Society that:
1. These cuts, and particularly the unfair targeting of the cuts on people in poverty and
disabled people, should cease.
2. There should be a radical review of all the proposals in the light of the human rights
of disabled people and the requirement for fairness and equal treatment for all.
3. Instead of these unfair cuts, wrongly called ‘reforms’, there should be a genuine effort
to reform the current system - the Campaign’s Manifesto for a Fair Society describes
how this could be achieved.
In particular, the Campaign believes that, instead of disparaging human rights, our political leaders should be working with civil society, disabled people and others to build a welfare system which is underpinned by human rights. The current system falls well short of this international standard, and the current failure to implement cuts fairly underlines our failure to respect human rights and the social obligations they entail.

A FAiR SoCieTy? | 7. WHAT WE SHoULD Do
A RepoRT FRom THe CenTRe FoR WelFARe ReFoRm on beHAlF oF THe CAmpAign FoR A FAiR SoCieTy
32
THe CAmpAign WAnTS A neW WelFARe SySTem, one THAT WoRkS FoR eveRy CiTizen:
1. Human rights - not just services
2. Clear entitlements - not confusion
3. Early support - not crisis
4. Equal access - not institutional care
5. Choice & control - not dependence
6. Fair incomes - not insecurity
7. Fair taxes - not injustice
8. Financial reform - an affordable system
More information about the Campaign is available at www.campaignforafairsociety.org
Manifesto for a Fair Society
2012

HoW THe CuTS TARgeT DiSAbleD people | CoNCLUSIoN
A RepoRT FRom THe CenTRe FoR WelFARe ReFoRm on beHAlF oF THe CAmpAign FoR A FAiR SoCieTy
33
Conclusion
The UK is in the midst of a serious financial crisis created by over-lending to home owners by our financial institutions. This is an economic bubble that has not yet burst. The UK government has taken successive measures to borrow more money to resolve this problem, creating further national debt.
For political reasons, the costs of this debt is primarily being paid by people in poverty, by disabled people and by other vulnerable groups. As we have explained:
�� People in poverty are targeted 5 times more than most other citizens
�� Disabled people are targeted 9 times more
�� People with the severest needs are targeted 19 times more
Although there are many reasons for the unfairness of the way in which these cuts have been targeted the most important seems to be a failure in the political process to respect human rights and the need for a universal welfare system - which benefits everyone.
What is even more concerning is that the current sense of economic panic and concern is leading to increased stigmatisation of disabled people and people in poverty. A wealthy, twenty-first century society, is increasingly beginning to sound uncivilised. Blaming the poor for poverty and stigmatising disabled people is the kind of rhetoric that led in the 1920s. and 1930s to the worst kinds of eugenics, terrors and inhumanities. All of this is not only wrong, it is wrong-headed. It will not solve our eoncomic problems and it will not create the kind of fair society that most people want to live in.
And there is no reaon to think things will not get a lot worse. A change in government, on its own, may not help and is unlikely to reverse the harm done to disabled people and people in poverty. Furthermore, if picking on vulnerable minority groups for electoral advantage is seen as a successful strategy, then even a change in government may make no difference. We need our political leaders to reflect more deeply on what they are doing, to look beyond short-term political games and to consider the legacy they want to leave.
Civil society also faces a significant challenge. Charities, voluntary organisations and service providers used to provide some protection for the most vulnerable and could force politicians to face uncomfortable realities. Today we see very little resistance from these organisations. Mostly they seem to be just trying to survive as a business or maintaining their lucrative relationship with central government. It is time for these organisations to take their courage in both hands and to remember why they really exist.
For those of us who do want to resist then it is clear we have much still to do. The public do not know the facts and do not understand what is really happening. We have not yet made a break through and genuine resistance is fragmented and can too narrowly focused. We have not yet helped people understand the whole picture or why these problems should matter to every citizen of the United Kingdom,
This report has been written to help our political leaders, journalists and the general public face reality. The facts are clear - the cuts target those with greatest need. The question for our society is: Do we care?
A FAiR SoCieTy? | BACKGRoUND INFoRmATIoN
A RepoRT FRom THe CenTRe FoR WelFARe ReFoRm on beHAlF oF THe CAmpAign FoR A FAiR SoCieTy
34
background information
The category ‘disabled people’ is broad, it includes many different groups including:
�� older people who need help and support
�� People with long-term health conditions
�� People with learning difficulties
�� People with mental health issues
�� People with physical impairments
�� People with neurological impairments
�� People on the Autism spectrum who may describe themselves as ‘neurodiverse’
�� People with sensory impairments
�� People who are deaf
�� many other groups of people whose impairments, when combined with social
structures, face barriers to independent living
Disabled people face many barriers and disadvantages, especially because society is not organised to support their full involvement and contribution to ordinary life.
�� older people who need support and disabled people are much more likely to live
in poverty. When the extra costs of being a disabled person are taken into account,
47.5% of families with disabled people in the household, live in poverty.[28]
�� People who want to work cannot access work (7% of people with learning difficulty
work - 65% want to work). only 50% of disabled people of working age are in work,
compared with 80% of non disabled people of working age.[29]
�� Disabled people officially constitute only 6% of formal volunteers and around 4.3% of
public appointments across Britain. This is compared to 20% of the population as a
whole.[30]
�� 17% of disabled adults experience restrictions in their learning opportunities
compared with 9% of non disabled adults. 23% of disabled people have no
qualifications compared to 9% of non disabled people.[31]
�� 45% of households with at least one disabled person living in them are unable to
afford expenses or make loan repayments. This compares with 29% of households
without any disabled people.
�� 74% of disabled adults experience restrictions in using transport compared with 58%
of non disabled adults.
�� 12% of disabled adults experience difficulty accessing rooms within their home or
difficulty getting in or out of their home, compared with 1% of non disabled adults.
�� 29% of disabled adults experience a restriction to accessing buildings outside their
home [including not being able to visit friends or family] compared with 7% of adults
without impairments.
�� Disabled people often lose their homes or cannot access real homes of their own.
�� Disabled people are subject to hate crimes and abuse, encouraged by
institutionalisation. older people are more than 10 times likely to be abused in
residential care than in their own home.[32]
�� 92% of unborn children with Downs Syndrome are aborted in the UK.[33]

HoW THe CuTS TARgeT DiSAbleD people | BACKGRoUND INFoRmATIoN
A RepoRT FRom THe CenTRe FoR WelFARe ReFoRm on beHAlF oF THe CAmpAign FoR A FAiR SoCieTy
35
�� By the age of 26, young disabled people are three times more likely than other
young people to agree with the statement “whatever I do has no real effect on what
happens to me”.[34]
�� Disabled people are carers too. of the nearly two million people aged 16-74 in
England and Wales who were permanently sick or disabled according to the 2001
Census, over a quarter of a million provided some unpaid care for other people.[35]
�� Disabled people are almost ten times more likely to report poor health than non-
disabled people.[36]

A FAiR SoCieTy? |
A RepoRT FRom THe CenTRe FoR WelFARe ReFoRm on beHAlF oF THe CAmpAign FoR A FAiR SoCieTy
36
References & readings
Adam, S. (2012) Personal Tax and Benefits. London, Institute of Fiscal Studies.
ADASS (2011) Budget Survey 2011
ADASS (2012) Budget Survey 2012
Alakeson, V. and Duffy, S. (2011) Health Efficiencies. Sheffield, The Centre for Welfare Reform.
Baumberg, B. (2012) Benefit Cuts, Welfare Reform and Inequality. One Society.
Baumberg, B. Bell, K. & Gaffney, D. with Deacon, R. Hood, C. and Sage, D. (2012) Benefits Stigma in Britain. London, Turn 2 Us.
Brown, M. (2011) Context for charging – Financial Challenges. CoSLA Community Care Charging Listening Event (ADSW Resources Committee)
Burchardt, T. (2005) The Education and Employment of Disabled Young People: Frustrated Ambition. York, JRF
Campaign for a Fair Society (2012) Manifesto for a Fair Society. Sheffield, The Centre for Welfare Reform.
Carpenter, M. (2000) Charging with care: how councils charge for home care. London, The Audit Commission
Citizen Advice Bureau (2010) Charities challenge government over £16bn unclaimed benefits http://www.citizensadvice.org.uk/press_office201022 (accessed 30th January 2012)
CIPFA (2011) Smart Cuts? Public spending on children’s social care. London, NSPCC
Clements, L (2011) Social Care Law Developments: A Sideways Look at Personalisation and Tightening Eligibility Criteria. Elder Law volume 1, pp47-52.
Counsel and Care (2010) Care Home Fees: Paying Them in England. London, Counsel and Care
Cowen A. (2010) Personalised Transition. Sheffield, The Centre for Welfare Reform.
Crisp, Nigel. (2009) Turning the World Upside Down. London, RSM Press
CSCI (2008) State of Social Care 2007-08. London, CSCI
DH (Department of Health) (2010) Prioritising need in the context of Putting People First: A whole system approach to eligibility for social care Guidance on Eligibility Criteria for Adult Social Care, England 2010. London, DH
DRC (2006) Disability Agenda: Increasing Participation and Active Citizenship
DWP (2010) 21st Century Welfare. London, DWP
DWP (2011a) Social Security Benefit Up-rating. London, DWP
DWP (2011b) Benefit Tables. London, DWP
Duffy, S. (2010) Safety for Citizens: Personalisation & Safeguarding. Sheffield, The Centre for Welfare Reform.
Duffy, S. & Fulton, K. (2010) Architecture for Personalisation. Sheffield, The Centre for Welfare Reform.
Duffy S (2011a) Personalisation in social care – what does it really mean? Social Care and Neurodisability, Vol. 2 No. 4 pp. 186-195
Duffy, S. (2011b) A Fair Income. Sheffield, The Centre for Welfare Reform.
Duffy, S. (2012a) Who Really Benefits from Welfare? http://www.centreforwelfarereform.org/library/by-az/who-really-benefits-from-welfare.html (accessed 10th January 2013)
Duffy, S. (2012b) Real Localism. http://www.centreforwelfarereform.org/library/by-az/real-localism.html (accessed 10th January 2013)
Duffy, S. and Hyde, C. (2011) Women at the Centre. Sheffield, The Centre for Welfare Reform.
EHRC (Equality and Human Rights Commission) (2011) How Fair is Wales? London, EHRC
Harker, R. (2011) NHS funding and expenditure (SN/SG/724) London, House of Commons Library
Hutton, W. (2010) Them and Us - Changing Britain - Why We Need a Fair Society. London, Abacus
Independent Living in Scotland (2009) The Essential Guide to Independent Living in Scotland. Glasgow, Independent Living in Scotland Project
Kane, D. and Allen, J. (2011) Counting the Cuts The impact of cuts on the UK voluntary and community sector. London, NCVO.
Kennedy, S (2012) Welfare Reform Update. London, House of Commons Library.

HoW THe CuTS TARgeT DiSAbleD people | REFERENCES & READINGS
A RepoRT FRom THe CenTRe FoR WelFARe ReFoRm on beHAlF oF THe CAmpAign FoR A FAiR SoCieTy
37
Law Commission (2008) Adult Social Care Scoping Report. London, Law Commission
Morris, J. K. and Alberman, E. (2009) Trends in Down’s syndrome live births and antenatal diagnoses in England and Wales from 1989 to 2008: analysis of data from the National Down Syndrome Cytogenetic Register. British Medical Journal (BMJ 2009;339:bmj.b3794)
Murray, P. (2011) A Fair Start. Sheffield, The Centre for Welfare Reform.
National Audit Office (2010) Report by the Comptroller and Auditor General of Fraud and Error in Benefits. London, NAO
National Fraud Authority (2011) Annual Fraud Indicator. London, National Fraud Authority
Naysmith, Stephen (12.04.2011) Glasgow Herald: This time it’s personal.
ONS (Office for National Statistics) (2009) Labour Force Survey, January to March 2009. London, ONS
Pickles, E. (2013) Oral Statement on Financial Statement 2013/14.
Roxburgh et. al. (2010) Debt and Deleveraging: The Global Credit Bubble and its Economic Consequences. McKinsey Global Institute.
Taylor-Gooby, P. and Stoker, G. (2011) The Coalition Programme: A New Vision for Britain or Politics as Usual? The Political Quarterly, Vol. 82, No. 1, January–March 2011
The Treasury (2010) Spending Review 2010. London, The Treasury
The Treasury (2011) Spending Review 2011 London, The Treasury
University of Leeds (2007) Valuing Carers – calculating the value of unpaid care. London, Carers UK
Whittaker, K. (2011) Personalisation in a Time of Cuts. http://www.centreforwelfarereform.org/library/by-az/personalisation-in-a-time-of-cuts.html (accessed 10th January 2013)
Wilkinson, R. & Pickett, K. (2010) The Spirit Level. London, Penguin
Wood, C and Grant, E. (2010) Destination Unknown. London, Demos

A FAiR SoCieTy? |
A RepoRT FRom THe CenTRe FoR WelFARe ReFoRm on beHAlF oF THe CAmpAign FoR A FAiR SoCieTy
38
notes
The statistics used in this report build on earlier work published by the Campaign for a Fair Society. The difference between these figures and those in our earlier work is primarily that in these figures we have taken full account of the government's predictions for growth. In the earlier reports we focused on only the cuts in cash terms. This is why, instead of 25%, we have now calculated that 15% of all cuts fall on people with the most severe disabilities. Clearly the essential injustice of the cuts has not changed.
[1] This analysis is based upon the 2010 CSR. The revenue and capital figures have been combined and benefits data has been added from other government sources (data on benefits is excluded from the CSR). The government has made some minor changes to the original 2010 CSR, however there has been no opportunity to revise the figures in the light of these changes and the changes are not significant enough to make any difference to the overall analysis of this briefing paper. For another independent analysis that reaches similar conclusions see Taylor-Gooby and Stoker (2011).
[2] By 2011 the planned cuts to benefits were at £18 billion. The Autumn Statement 2012 announced further reductions in uprating and changes to the design of Universal Credit that would save a further amount of approximately £4 billion. So by 2015 the target saving is £22 billion. The fact that worsening economic circumstances will almost inevitably mean that the actual gross spend will not meet its target, for more people will be reliant on benefits, is no comfort; for the value of these benefits and the overall level of income inequality and poverty will be much greater than it would have been.
[3] For obvious reasons the cost of ‘financial
crisis measures’ has been excluded from the calculation of the total cuts. In principle it would be interesting to see this analysed in distributional terms. Effectively it would seem to be a huge subsidy to banks and, indirectly, to those who took out large and unsustainable loans on their property. That is, it would appear to be a further subsidy to homeowners - and therefore, not people in poverty. However we have not pursued this matter here.
[4] As we also know there is a significant regional redistribution of harm from the cuts. See http://www.guardian.co.uk/news/datablog/interactive/2012/nov/14/local-authority-cuts-map However for this analysis we have not tried to capture the fact that, broadly speaking, the North has been cut much more than the South.
[5] The data on local authority expenditure in England is taken form the useful report by Chartered Institute of Public Finance and Accountancy (CIPFA) the NSPCC - Smart Cuts?
[6] See ADASS Budget Survey 2011, report produced by Directors of Adult Social Services
[7] See ADASS Budget Survey 2012, report produced by Directors of Adult Social Services
[8] See CIPFA (2011)
[9] As part of the 2010 Spending Review the government announced extra spending for social care and this statement continues to be used by the media. However it is extremely misleading. The money that it described as new (the Adult Personal Social Services Grant PSS Grant) is not new. It is the same money that was described in the 2007 letter by the Director General of Social Care and which has been provided to local government for many years. This PSS Grant does not provide any for social care; in fact the only innovation is that this money (which is only about 5% of the whole social care budget) is now fully pooled into the general funding of local government. This tiny transfer from the Department of Health to local government can be used to reduce Council Tax bills or mend roads, it does not need to be spent on disabled people.
[10] See Kane and Allen (2011)
[11] See ADASS (2011)
[12] See ADASS (2011)
[13] See ADASS (2011), note that these levels are technical terms that are defined by the ironically titled policy Fair Access to Care Services (FACS). For instance, if you live in an area where eligibility is set at ‘Critical’ then this means you will NoT be entitled to care

HoW THe CuTS TARgeT DiSAbleD people | NoTES
A RepoRT FRom THe CenTRe FoR WelFARe ReFoRm on beHAlF oF THe CAmpAign FoR A FAiR SoCieTy
39
even if: (a) you have only partial choice and control over your immediate environment, or (b) you have been abused or neglected, or you will be abused or neglected, or (c) you cannot carry out the majority of your personal care or domestic routines, or (d) you cannot sustain involvement in work, education or learning, or (e) you cannot sustain the majority of your social supports and relationships, or (f) you cannot fulfil the majority of your family roles or other social roles. As the Campaign for a Fair Society have argued, the current system was already prone to respond only in a crisis, the current cuts worsen this problem.
[14] See Kennedy (2012)
[15] See Adam (2012)
[16] See Wilkinson and Pickett (2010) for a full analysis of inequality in the UK and the social problems associated with income inequality.
[17] See Kennedy (2012) and Adam (2012)
[18] See DWP (2011b)
[19] See Duffy’s A Fair Income (2011b) and also the essay Who Really Benefits from Welfare? (2012a)
[20] See Wilkinson and Pickett (2010)
[21] See Alakeson and Duffy’s Health Efficiencies (2011)
[22] Duffy and Hyde’s Women at the Centre (2011)
[23] See Whittaker’s Personalisation in a Time of Cuts (2011)
[24] For these and many other stories go to: http://www.dontcutusout.org.uk
[25] For example, 1 in 5 people believe a majority of claims are false, while 14% believe a majority of claims are fraudulent. The Government’s own statistics indicate an actual fraud rate of around 1%. See Baumberg et
al. (2012) For data on the different types of fraud and references see the manifesto for a Fair Society 2012. For misinformation on local government finance see Pickles (2013) who said “English local government accounts for £1 of every £4 spent on public services. It spends £114 billion – that’s twice the defence budget and more than the NHS.” This incredible and misleading figure is only possible by including Education and other funding streams over which local authorities have no meaningful control.
[26] See Duffy’s essay Real Localism (2012b) for an analysis of the ways in which the welfare system distorts the relationship between local and central government.
[27] Wilkinson and Pickett argue persuasively that high levels of inequality reduce well-being even for those who are better off and also increase social problems which then lead to higher levels of ‘compensatory’ public spending (Wilkinson and Pickett, 2010)
[28] See Wood and Grant, 2010
[29] See oNS, 2009
[30] See DRC, 2006
[31] See oNS, 2009
[32] See Duffy, 2010
[33] See morris & Alberman, 2009
[34] See Burchardt, 2005
[35] See EHRC, 2011
[36] See EHRC, 2011


published by The Centre for Welfare Reform
www.centreforwelfarereform.org
design: henry iles & associates / [email protected]