Embed Size (px)
Citation preview
1 E-7------
Cl-81-6 No. 3 .’
A COMPRESSOR SIMULATION MODEL WITH cORRECTIONS FOR THE LEVEL OF SUCTION GAS SUPERHEAT . DR. A.E. DABIRI C.K. RICE Member ASHRAE
INTRODUCTION
The guidelines for the appliance energy efficiency standards (1) currently being implemented by the U.S. Department of Energy indicate that more extensive testing of heat pumps will be required. However, the guidelines also allow for the use of computer programs to generate rating information in some cases. A Heat Pump Simulation Model (HPSM), currently under development by the authors, has potential as a tool for reducing the amount of testing needed to meet the guidelines. Although the compressor simulation routine described in this paper is for this HPSM, it may be used with other heat pump models as well.
In order to generate steady-state heat pump rating information with a minimum of experi- mental data, the HPSM has a compressor routine that uses data available from manufacturers' compressor maps and applies corrections for operation at evaporator superheat levels that differ from those used in generating the maps. The performance of other components of the heat pump must be simulated by the model used with this compressor routine. The authors based the HPSM on the Oak Ridge Heat Pump Model (2,3,4) which was chosen for its availability and comprehensive component modeling characteristics. Compressor routines used in heat pump models described in the open literature, such as those given by Kirshbaum and Veyo (5) and by Hiller and Glicksman (6), also were considered. Since these compressor routines, as well as the original compressor routine of Refs. 2, 3, and 4, were not suitable for the present purpose, the decision was reached to develop a new compressor model for the HPSM.
In the following sections of this paper, the compressor model is described and compared with available experimental data. Methods are derived to correct the mass flow rate and compressor power consumption values obtained from compress& maps to account for variations in suction gas superheat. For most cases the corrections are not large; however, it was judged important to seek maximum accuracy for a model with the potential for use in lieu of actual testing. The form of these corrections allows the use of a map-based compressor model in cases when "wet" refrigerant reaches the compressor shell inlet. The magnitude of the cor- rections is compared with available information from four manufacturers of two- to four-ton, re?rigerant 22, hermetic, reciprocating compressors; the agreement between compressor map data (as corrected) and available data on the performance of compressors installed in heat pumps is examined.
OVERVIEW OF THE HPSM COMPRESSOR MODEL
The HPSM compressor model is based on the use of empirical compressor performance curves obtained from compressor calorimeter measurements performed by the manufacturers. These performance curves, or maps, which in most cases are readily available from the manufacturers,
This research was sponsored by the U.S. Department of Energy under contract DE-AC03-79-C510757 with Science Applications, Inc., and contract W-7405-eng-26 with the Union Carbide Corporation.
C. K. Rice fs a member of the Conservation Technology Program, Energy Division, Oak Ridge National Laboratory, Oak Ridge, Tennessee.
A. E. Dabiri is a Senior Scientist, Energy Technology and Engineering Group, Science Applications, Inc., La Jolla, California.
THIS PREPRINT FOR DISCUSSION PURPOSES ONLY. FOR INCLUSION IN ASHRAE TRANSACTIONS 1981, ‘/. 87, pt. 2. NoI to be reprinted In whole or in part without written permission of the Ameilcan Society of Heating, Refrigerating and Air-Con- ditionlng Englncers, Inc., 1791 Tullle Circle NE, Atlanta, GA 30329Oplnions, findlngs, conclusions, or recommendations ex- pressed In this paper are those of the author(s) and do not necessarily reflect the views of ASHRAE.

* . provide compressor power input, refrigerating capacity and/or refrigerant mass flow rate as functions of evaporator saturation temperature (or pressure) for four to six condenser satu-
.ration temperatures (or pressures). Usually each set of maps is generated for fixed values of condenser subcooling and evaporator superheat, although for some maps the superheat is allowed to vary with changes in evaporator saturation temperature while the suction gas temperature at the compressor shell inlet is held constant.
Refrigerating capacity erefr,,as commonly defined,'is given by :
6 refr = &(h in,comp -h in,evap ) = &Ah refr ' . . (1)
., -.
where
H = refrigerant mass flow rate;
h in,comp = refrigerant enthalpy at compressor shell inlet;
h in,evap = refrigerant enthalpy at evaporator inlet [equal to the enthalpy of saturated liquid refrigerant at
(Tsat,cond - subcooling)].
For given values of condenser subcooling, evaporator superheat, and evaporator and condenser saturation te?peratures, Ahrefr can be calculated from refrigerant property routines. Thus, given either Qrefr or m, the other quantity can be evaluated from Eq 1 (provided that oil circulation effects have been included in the given quantity). Refrigerant mass flow rate can be considered a more basic compressor performance characteristic than Qrefr since the latter is dependent on the value of condenser subcooling chosen for the map.
The main task in preparing compressor maps for use in heat pump simulations is to account for operating conditions that differ from those conditions for which the maps were generated. Since the level of condenser subcooling affects only the value of refrigeratsng capacity, this parameter is needed only when ti must be calculated from given map values of Qrefr. Changes in the levels of evaporator superheat, however, potentially may affect both the refrigerant mass flow rate and the required compressor power input. The effect of various superheat levels will be considered. Other possible factors affecting compressor performance include the fraction of oil circulating with the refrigerant and the temperature and quantity of air passing over the compressor shell ("forced air temperature"). Since the fraction of oil circulating with the refrigerant is not generally measured in heat pump experiments, this effect is not considered here. Possible effects due to forced air temperatures over the compressor shell that are lower than those used in the calorimeter tests are briefly discussed.
The effect of the level of superheat at the compressor shell inlet on compressor per- formance has been discussed in the open literature by only a few investigators (7,8,9). Generally, these investigators focused on the effects of superheat on refrigerating capacity and EER. At the higher levels of superheat, refrigerating capacity and compressor EER were found to increase.
Further information was obtained from the compressor manufacturers' catalogs and from discussionswith the manufacturers. Two of the manufacturers (10,ll.) provide refrigerating capacity and power consumption at two air-conditioning rating points that differ only in superheat level. Both rating points have 7.2"C (45F) evaporator saturation temperature, 54.4'C (130F) condenser saturation temperature, and 8.3 Co (15 F') subcooling. Rating point A has a superheat value of 28 Co (50 F') while rating point B has 11.1 Co (20 F"). For the 17 Co (30 F') increase in superheat from condition B to condition A, tabulated refrigerating capacity values typically increase by 2.5 to 4%, and compressor power remains constant or increases 1 to 3%, depending upon the model.
A third manufacturer (12) provides capacity conversion graphs to correct for various superheat and subcooling levels. The correction curves show a 1.7% increase in refrigerating capacity for the increase in superheat from rating point B to A. In conversations with this manufacturer (13), it was noted that the basis for the correction curves is experimental data which indicate that, on the average, the refrigerant mass flow rate was found to increase by about 1% for each 2.8 Co (5 F") drop in superheat.
Finally, another manufacturer (14) adjusts refrigerating capacity for superheat level by the equation
'new = (1 f Fs~)~B s (2)

--.i ’
where
kew = capacity at the new superheat level,
4, = capacity from the map at rating point B (11.1 Co superheat),
and
FSH = 0.00144 l (superheat - 11:l Co). (3) 'Tz -z=-
For the 17 Co (30 F") increase in superheat from rating point B to A, use of Eqs 2 and 3 yields a 2.4% increase in refrigerating,capacity.
__._---.
Thus the data from four compressor manufacturers indicate that the refrigerating capacity increases from 1.7 to 4% for the 17 Co (30 F") increase in superheat from rating points B to A. Since Ah .increases by 7.8% from condition B to condition A, the 1.7 to 4% capacity
$& by the manufacturers imply (from Eq 1) 5.6 to 3.5% decreases in mass flow corrections rate, respectively, for the 17 Co (30 F") change in superheat between the rating conditions.
The'effect of superheat on compressor power was generally assumed by the manufacturers to be zero; however, the limited data available show that in some cases the power increased 1 to 3% from rating point B to rating point A. No information was found describing the effect on compressor performance due to wet suction gas at the compressor inlet.
Obviously, for cases where the actual superheat differs 5 to 10 Co from the map value, the magnitude of the corrections to mass flow rate and power are rather small. However, since a potential use of the compressor model is for heat pump simulation in lieu of testing, any corrections which can reduce potential simulation errors are worthy of consideration. Furthermore, for some compressors, the only maps available were generated at a 35°C (95F) suction gas temperature; in these cases the difference in superheat between the map and actual heat pump application could be 28 to 44 C" (50 to 80 Fe). Even in cases where the suction gas temperature for the map is held constant at 18°C (65F), the difference in the superheat level could be 11 to 28 Co (20 to 50 F').
Since the range of mass flow rate and power changes reported by the various manufac- turers were within a reasonably narrow band, a general correction procedure was developed based on refrigerant density changes and the assumption of constant compression efficiency. One advantage of the general correction procedure developed herein over corrections based directly on superheat change (such as Eq 3) is that the former is easily applied to cases where the refrigerant at the compressor shell inlet is in the two-phase region.
ANALYSIS OF THE EFFECT OF SUPERHEAT ON REFRIGERANT MASS FLOW RATE
The refrigerant mass flow rate, m, can be related to compressor parameters in the following manner:
. &= 'vol ' "D N ' (4)
where
%ol = volumetric efficiency,
P = refrigerant density,
"D = compressor displacement (total),
N = compressor motor speed.
The volumetric efficiency can be based on either compressor shell inlet conditions or suction port conditions provided that p is evaluated accordingly.

- I I
*----- \ A straightforward mass flow rate correction for various superheat levels .results
* from
the assumption that the compressor speed, N, and nvol evaluated at the compressor shell inlet (nvol,i) remain constant. The resulting mass flow rate correction, from Eq. 4, is given by
(5)
Use of Eq 5 yields a 7.5% decrease in mass flow rate and an 0.3% decrease in refriger- ating capacity for the 17 C" (30 F") increase in superheat from rating point B to rating point A. These results are an overprediction of the decrease in mass flow rate and a pre- diction in the wrong direction concerning the refrigerating capacity change. Thus the straightforward mass flow rate correction is inadequate. Since compressor power is generally observed to remain constant within a few percent as superheat is varied and since the compressor motor speed variation would be more than an order of magnitude smaller, the assumption of constant motor speed is justified. Therefore, the assumption of constant nvol at the shell inlet must be inadequate. To provide a basis for a better assumption, the implications of the assumption of a constant nvol at the shell inlet are examined.
Upon entrance to the compressor shell, the refrigerant gas comes in contact with the compressor motor windings, the compressor body, the discharge muffler, a section of the discharge line, the oil sump, and finally the suction muffler. This contact results in additional superheating of the suction gas before it reaches the suction port. Assuming that the refrigerant pressure, P, remains constant while the suction gas is being heated within the shell, and assuming an average value of the specific heat of the refrigerant constant pressure, c-, the heat transfer to the suction gas as it moves from the shell inlet to the suctionPport, Q, p, may be calculated by the equation
,
%,p = fi cp (Tp - T;) = incp ATi p , ,
where the subscripts "p" and "i" refer to compressor suction port and shell inlet, tively. Assuming the perfect gas relationship (Pv = RT), Eq 4 can be rewritten as
lil=ll P
vol,p 'D N F
Using Eq 7 to eliminate Tp in Eq 6 and solving fqr rh yields
PVDN -L . cP )
If 'IVOI,P and k,p are assumed to expression in parentheses in Eq 8 change in superheat is then given
at
(6)
respec-
(7)
(8)
remain constant as the superheat level is varied, the remains constant. The ratio of mass flow rates for a from Eq 8 by
Iii T new i,map ---=-
lil T , map i,new
(9)
where the temperatures are given in absolute degrees. Application of the perfect gas relation to Eq 9 gives Eq 5. Therefore varied implies that
,,the original assumption of a constant nvol i as superheat is 'I,,
t rP and Qi,, a$o remain constant. Further , since fi decreases as T
is increased (from Eq 9 , a constant Qi 9
implies (from Eq 6) that ATi,!,, the suction gas i temperature rise from shell inlet to sue ion port, increases at higher evaporator superheat levels.
If 6i p instead is assumed to decrease in some manner as evaporator superheat Is increased, Q,,,~,~ would increase at the higher superheat levels. The assumption will. be made that Qi [ varies with superheat in direct proportion to the refrigerant mass flow rate. From Eq 6, thi:; assumption implies that AT
i,P or more exactly, Ah
i,P remains constant as superheat is
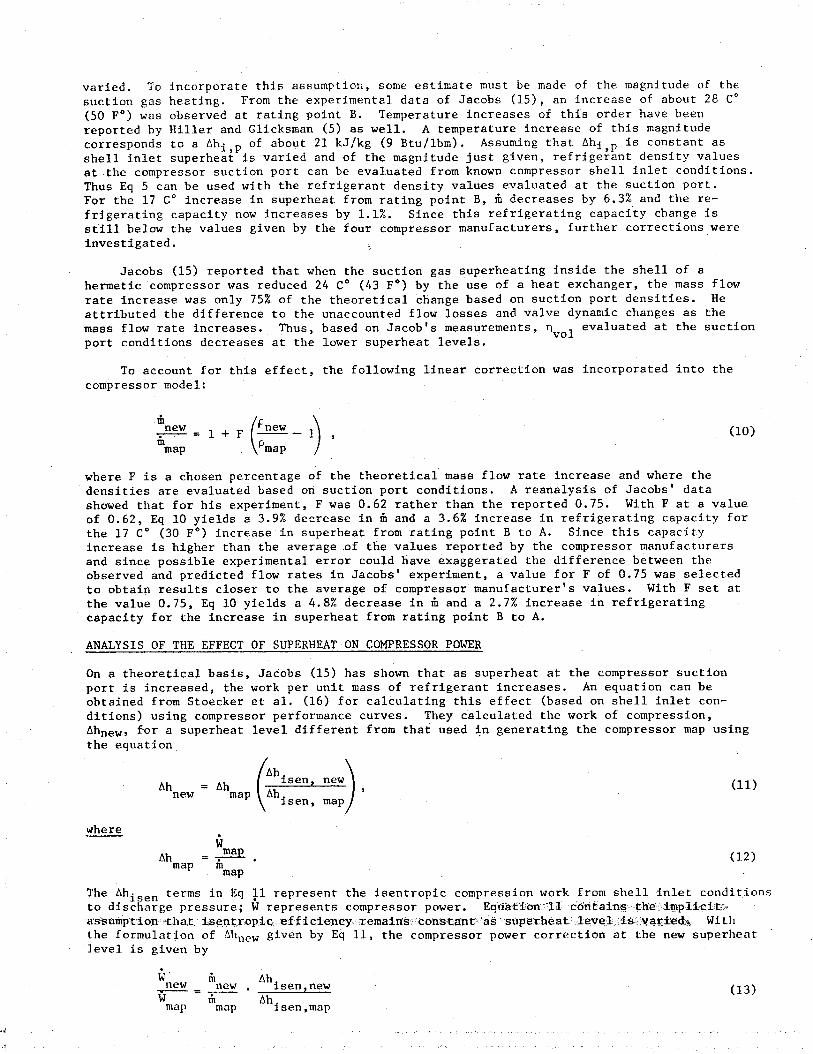
varied. TO incorporate this assumption, some estimate must be made of the magnitude of the suction gas heating. From the experimental data of Jacobs (15), an increase of about 28 C" (50 F') was observed at rating point B. Temperature increases of this order have been reported by Biller and Glicksman (5) as well. A temperature increase of this magnitude corresponds to a Ahi,p of about 21 kJ/kg (9 Btu/lbm). Assuming that Ahi,p is constant as shell inlet superheat is varied and of the magnitude just given, refrigerant density values at the compressor suction port can be evaluated from known compressor shell inlet conditions. Thus Eq 5 can be used with the refrigerant density values evaluated at the suction port. For the 17 Co increase in superheat from rating point B, xi~ decreases by 6.3% and the re- frigerating capacity now increases by 1.1%. Since this refrigerating capacity change is still below the values given by the four compressor manufacturers, further corrections were investigated.
Jacobs (15) reported that when the suction gas superheating inside the shell of a hermetic compressor was reduced 24 Co (43 F") by the use of a heat exchanger, the mass flow rate increase was only 75% of the theoretical change based on suction port densities. He attributed the difference to the unaccounted flow losses and valve dynamic chan.ges as the mass flow rate increases. Thus, based on Jacob's measurements, nvol evaluated at the suction port conditions decreases at the lower superheat levels.
To account for this effect, the following linear correction was incorporated into the compressor model:
Iii new -=l+F i
map (10)
where F is a chosen percentage of the theoretical mass flow rate increase and where the densities are evaluated based on suction port conditions. A reanalysis of Jacobs' data showed that for his experiment, F was 0.62 rather than the reported 0.75. With F at a value of 0.62, Eq 10 yields a 3.9% decrease in 6 and a 3.6% increase in refrigerating capacity for the 17 C" (30 F') increase in superheat from rating point B to A. Since this capacity increase is higher than the average of the values reported by the'compressor manufacturers and since possible experimental error could have exaggerated the difference between the observed and predicted flow rates in Jacobs' experiment, a value for F of 0.75 was selected to obtain results closer to the average of compressor manufacturer's values. With F set at the value 0.75, Eq 10 yields a 4.8% decrease in m and a 2.7% increase in refrigerating capacity for the increase in superheat from rating point B to A.
ANALYSIS OF THE EFFECT OF SUPERHEAT ON COMPRESSOR POWER
On a theoretical basis, Jadobs (15) has shown that as superheat at the compressor suction port is increased, the work per unit mass of refrigerant increases. An equation can be obtained from Stoecker et al. (16) for calculating this effect (based on shell inlet con- ditions) using compressor performance curves. They calculated the work of compression, Ahnew, for a superheat level different from that used in generating the compressor map using the equation
(11)
where .
Ah =Wmap* map in
map (12)
The Ahisen terms in Eq 11 represent the isentropic compression work from shell inlet conditions to discharge pressure; W represents compressor power. Equation‘11 cdntains-th~.i.mplici-tj~‘ ass'umption that isentropic.efficiency remains'constant' as‘superheat level.is:varied.~ With the formulatdon of Ahnew g iven by Eq 11, the compressor power correction at the new superheat level is given by
l
W Ii1
new Ah new -=-* isen,new
W Ii Ah (13)
map map isen,map
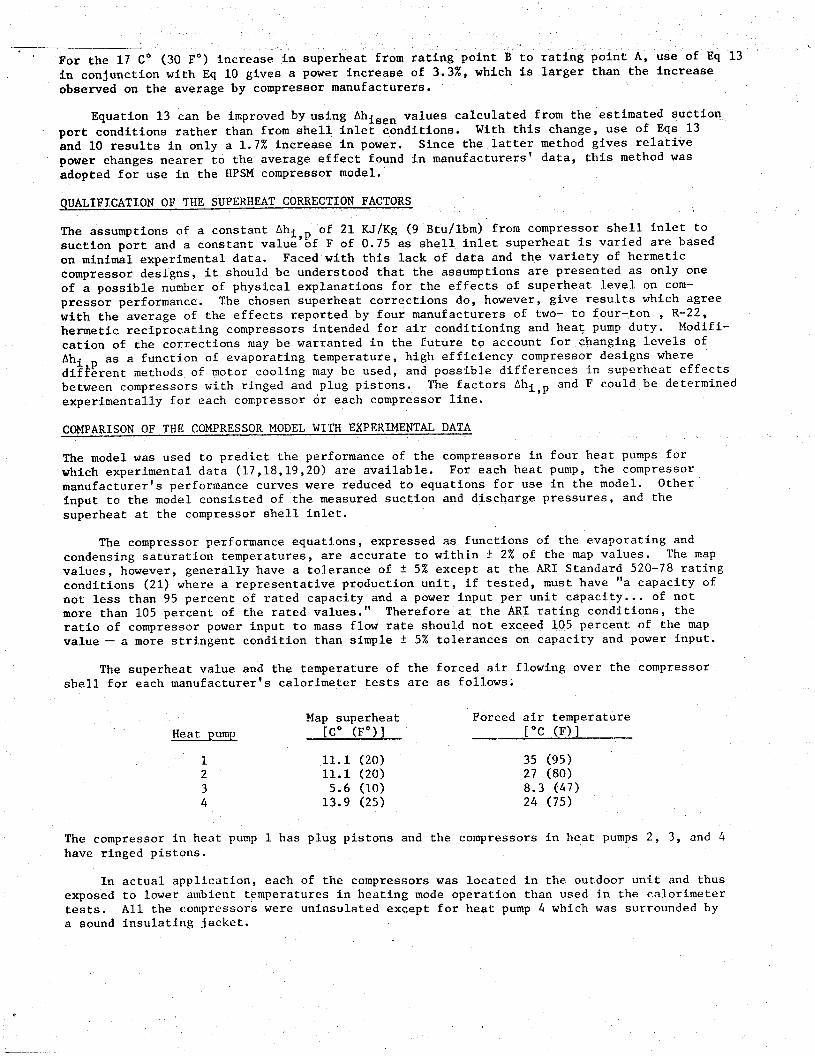
For the 17 Co (30 F') increase in superheat from rating point B to rating point Ai use of Eq 13 in conjunction with Eq 10 gives a power increase of 3.3%, which is larger than the increase observed on the average by compressor manufacturers.
Equation 13 can be improved by using Ahisen values calculated from the estimated suction port conditions rather than from shell inlet conditions. With this change, use of Eqs 13 and 10 results in only a 1.7% increase in power. Since the latter method gives relative power changes nearer to the average effect found in manufacturers' data, this method was adopted for use in the HPSM compressor model.
QUALIFICATION OF THE SUPERHEAT CORRECTION FACTORS
The assumptions of a constant Ahi,p of 21 KJ/Kg (9 Btu/lbm) from compressor shell inlet to suction port and a constant value of F of 0.75 as shell inlet superheat is varied are based on minimal experimental data. Faced with this lack of data and the variety of hermetic compressor designs, it should be understood that the assumptions are presented as only one of a possible number of physical explanations for the effects of superheat level on com- pressor performance. The chosen superheat corrections do, however, give results which agree with the average of the effects reported by four manufacturers of two- to four-ton , R-22, hermetic reciprocating compressors intended for air conditioning and heat pump duty. Modifi- cation of the corrections may be warranted in the future to account for changing levels of Ahi p as a function of evaporating temperature, high efficiency compressor designs where difkerent methods of motor cooling may be used, and possible differences in superheat effects between compressors with ringed and plug pistons. The factors Ahi,p and F could be determined experimentally for each compressor or each compressor line.
COMPARISON OF THE COMPRESSOR MODEL WITH EXPERIMENTAL DATA
The model was used to predict the performance of the compressors in four heat pumps for which experimental data (17,18,19,20) are available. For each heat pump, the compressor manufacturer's performance curves were reduced to equations for use in the model. Other input to the model consisted of the measured suction and discharge pressures, and the superheat at the compressor shell inlet.
The compressor performance equations, expressed as functions of the evaporating and condensing saturation temperatures, are accurate to within + 2% of the map values. The map values, however, generally have a tolerance of +_ 5% except at the AK1 Standard 520-78 rating conditions (21) where a representative production unit, if tested, must have "a capacity of not less than 95 percent of rated capacity and a power input per unit capacity... of not more than 105 percent of the rated values." Therefore at the AR1 rating conditions, the ratio of compressor power input to mass flow rate should not exceed 105 percent of the map value - a more stringent condition than simple + 5% tolerances on capacity and power input.
The superheat value and the temperature of the forced air flowing over the compressor shell for each manufacturer's calorimeter tests are as follows.
Heat pump Map superheat Forced air temperature
[Co (Fe)1 ["C 091
1 11.1 (20) 35 (95) 2 11.1 (20) 27 (80) 3 5.6 (10) 8.3 (47) 4 13.9 (25) 24 (75)
The compressor in heat pump 1 has plug pistons and the compressors in heat pumps 2, 3, and 4 have ringed pistons.
In actual application, each of the compressors was located in the outdoor unit and thus exposed to lower ambient temperatures in heating mode operation than used in the calorimeter tests. All the compressors were uninsulated except for heat pump 4 which was surrounded by a sound insulating jacket.
,
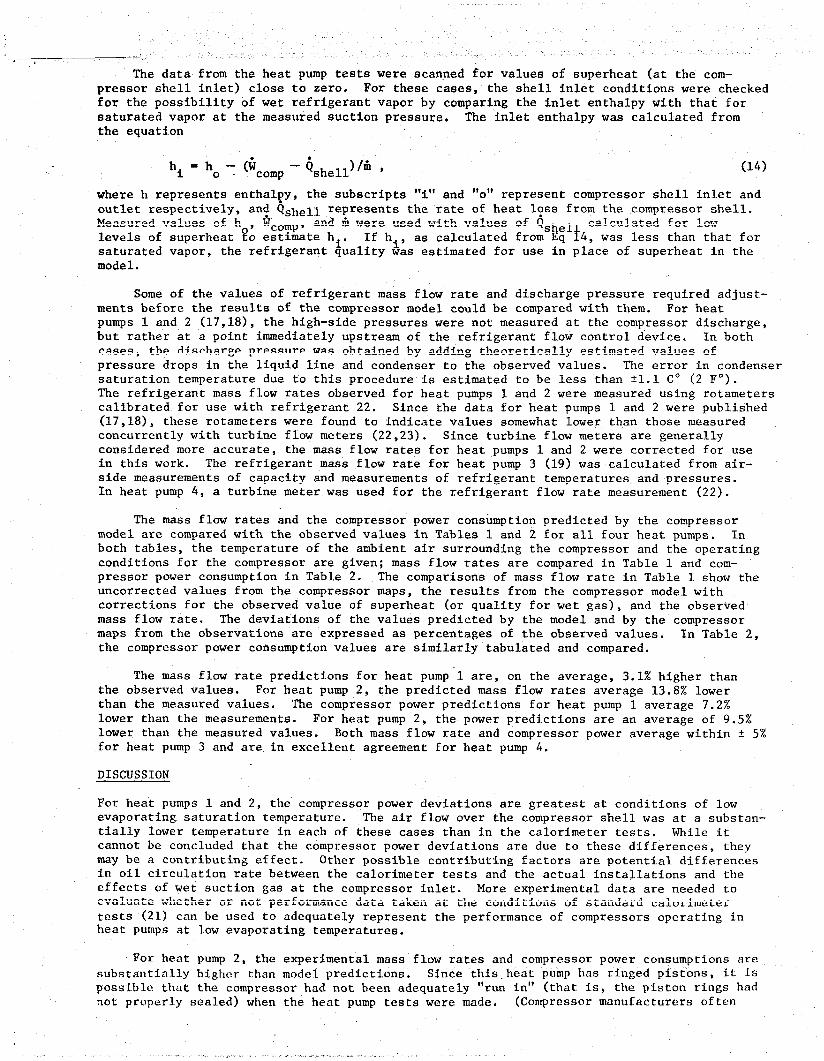
The data from the heat pump tests were scanned for values of superheat (at the com- pressor shell inlet) close to zero. For these cases, the shell inlet conditions were checked for the possibility of wet refrigerant vapor by comparing the inlet enthalpy with that for saturated vapor at the measured suction pressure. The inlet enthalpy was calculated from the equation
hi = ho 7 cicomp - $.hell)l t (14)
where h represents enthalpy, the subscripts "i." and "0" represent compressor shell inlet and outlet respectively, and (&hell represents the rate of heat l?ss from the compressor shell. Measured values of h , Wcomp, and 6 were used with values of levels of superheat ?o estimate h . If h
Qshel
the refrigerant iuality &is as calculated from Eq i
calculated for low 4, was less than that for
saturated vapor, model.
estimated for use in place of superheat in the
Some of the values of refrigerant mass flow rate and discharge pressure required adjust- ments before the results of the compressor model could be compared with them. For heat pumps 1 and 2 (17,18), the high-side pressures were not measured at the compressor discharge, but rather at a point immediately upstream of the refrigerant flow control device. In both cases, the discharge pressure was obtained by adding theoretically estimated values of pressure drops in the liquid line and condenser to the observed values. The error in condenser saturation temperature due to this procedure is estimated to be less than fl.1 Co (2 F"). The refrigerant mass flow rates observed for heat pumps 1 and 2 were measured using rotameters calibrated for use with refrigerant 22. Since the data for heat pumps 1 and 2 were published (17,18), these rotameters were found to indicate values somewhat lower than those measured concurrently with turbine flow meters (22,23). Since turbine flow meters are generally considered more accurate, the mass flow rates for heat pumps 1 and 2 were corrected for use in this work. The refrigerant mass flow rate for heat pump 3 (19) was calculated from air- side measurements of capacity and measurements of refrigerant temperatures and pressures. In heat pump 4, a turbine meter was used for the refrigerant flow rate measurement (22).
The mass flow rates and the compressor power consumption predicted by the compressor model are compared with the observed values in Tables 1 and 2 for all four heat pumps. In both tables, the temperature of the ambient air surrounding the compressor and the operating conditions for the compressor are given; mass flow rates are compared in Table 1 and com- pressor power consumption in Table 2. The comparisons of mass flow rate in Table 1 show the uncorrected values from the compressor maps, the results from the compressor model with corrections for the observed value of superheat (or quality for wet gas), and the observed mass flow rate. The deviations of the values predicted by the model and by the compressor maps from the observations are expressed as percentages of the observed values. In Table 2, the compressor power consumption values are similarly tabulated and compared.
The mass flow rate predictions for heat pump'1 are, on the average, 3.1% higher than the observed values. For heat pump 2, the predicted mass flow rates average 13.8% lower than the measured values. The compressor power predictions for heat pump 1 average 7.2% lower than the measurements. For heat pump 2, the power predictions are an average of 9.5% lower than the measured values. Both mass flow rate and compressor power average within + 5% for heat pump 3 and are in excellent agreement for heat pump 4.
DISCUSSION
For heat pumps 1 and 2, the compressor power deviations are greatest at conditions of low evaporating saturation temperature. The air flow over the compressor shell was at a substan- tially lower temperature in each of these cases than in the calorimeter tests. While it cannot be concluded that the compressor power deviations are due to these differences, they may be a contributing effect. Other possible contributing factors are potential differences in oil circulation rate between the calorimeter tests and the actual installations and the effects of wet suction gas at the compressor inlet. More experimental data are needed to evaluate whether or not performance data taken at the conditions of standard calorimeter tests (21) can be used to adequately represent the performance of compressors operating in heat pumps at low evaporating temperatures.
For heat pump 2, the experimental mass flow rates and compressor power consumptions are substantially higher than model predictions. Since this.heat pump has ringed pistons, it 1s possible that the compressor had not been adequately "run in" (that is, the piston rings had not properly sealed) when the heat pump tests were made. (Compressor manufacturers often
, .., II -^ ‘.,
note on the compressor maps that particular compressors require "'run in" to achieve rated performance.) .
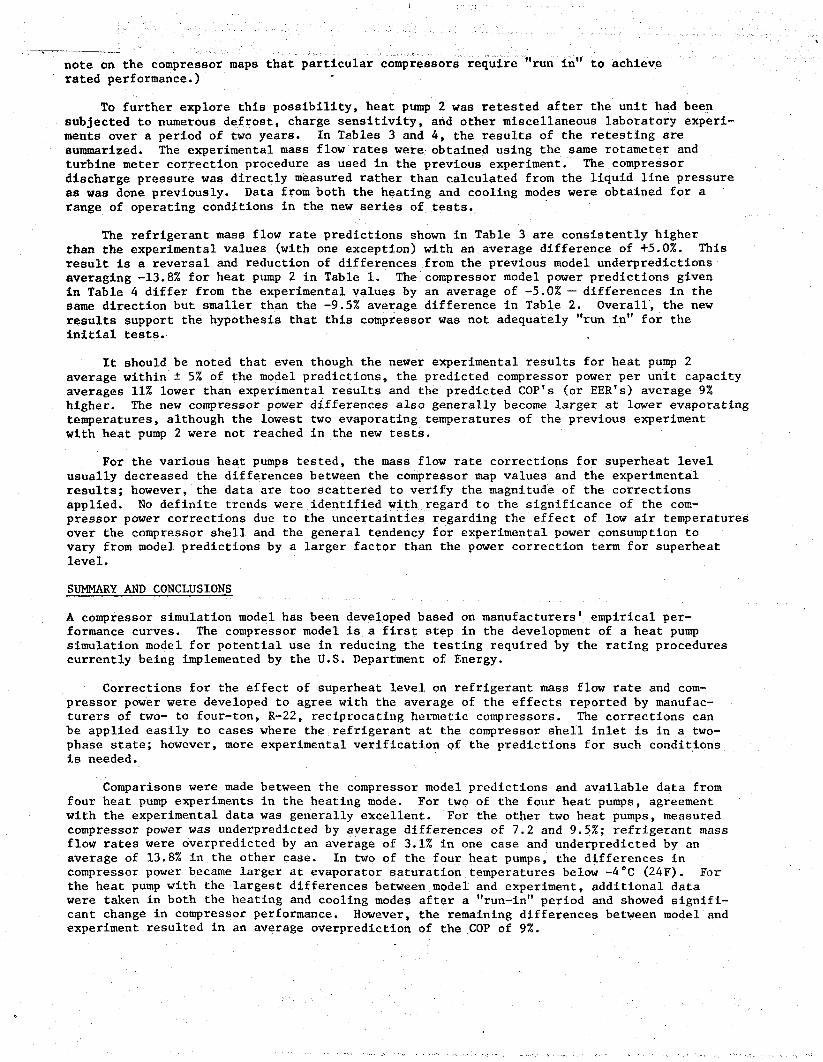
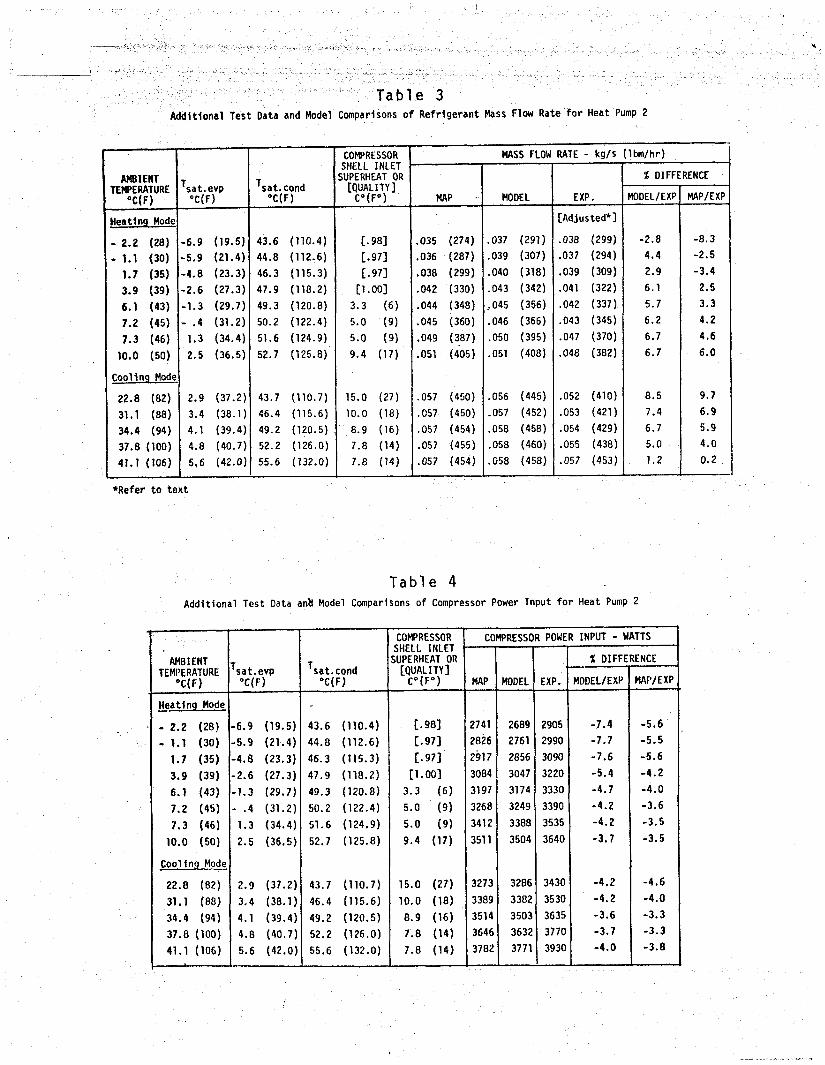
To further explore this possibility, heat pump 2 was retested after the unit had been subjected to numerous defrost, charge sensitivity, and other miscellaneous laboratory experi- ments over a period of two years. In Tables 3 and 4, the results of the retesting are summarized. The experimental mass flow rates were obtained using the same rotameter and turbine meter correction procedure as used in the previous experiment. The compressor discharge pressure was directly measured rather than calculated from the liquid line pressure as was done previously. Data from both the heating and cooling modes were obtained for a range of operating conditions in the new series of tests.
The refrigerant mass flow rate predictions shown in Table 3 are consistently higher than the experimental values (with one exception) with an average difference of +5.0%. This result is 2 reversal and reduction of differences from the previous model underpredictions averaging -13.8% for heat pump 2 in Table 1. The compressor model power predictions given in Table 4 differ from the experimental values by an average of -5.0% - differences in the same direction but smaller than the -9.5% average difference in Table 2. Overall, the new results support the hypothesis that this compressor was not adequately "run in" for the initial tests..
It should be noted that even though the newer experimental results for heat pump 2 average within + 5% of the model predictions, the predicted compressor power per unit capacity averages 11% lower than experimental results and the predicted COP's (or EER's) average 9% higher. The new compressor power differences also generally become larger at lower evaporating temperatures, although the lowest two evaporating temperatures of the previous experiment with heat pump 2 were not reached in the new tests.
For the various heat pumps tested, the mass flow rate corrections for superheat level usually decreased the differences between the compressor map values and the experimental results; however, the data are too scattered to verify the magnitude of the corrections applied. No definite trends were identified with regard to the significance of the com- pressor power corrections due to the uncertainties regarding the effect of low air temperatures over the compressor shell and the general tendency for experimental power consumption to vary from model predictions by a larger factor than the power correction term for superheat level.
SUMMARY AND CONCIJJSIONS
A compressor simulation model has been developed based on manufacturers' empirical per- formance curves. The compressor model is a first step in the development of a heat pump simulation model for potential use in reducing the testing required by the rating procedures currently being implemented by the U.S. Department of Energy.
Corrections for the effect of superheat level on refrigerant mass flow rate and com- pressor power were developed to agree with the average of the effects reported by manufac- turers of two- to four-ton, R-22, reciprocating hermetic compressors. The corrections can be applied easily to cases where the refrigerant at the compressor shell inlet is in a two- phase state; however, more experimental verification of the predictions for such conditions is needed.
Comparisons were made between the compressor model predictions and available data from four heat pump experiments in the heating mode. For two of the four heat pumps, agreement with the experimental data was generally excellent. For the other two heat pumps, measured compressor power was underpredicted by average differences of 7.2 and 9.5%; refrigerant mass flow rates were overpredicted by an average of 3.1% in one case and underpredicted by an average of 13.8% in the other case. In two of the four heat pumps, the differences in compressor power became larger at evaporator saturation temperatures below -4°C (24F). For the heat pump with the largest differences between model and experiment, additional data were taken in both the heating and cooling modes after a "run-in" period and showed signifi- cant change in compressor performance. However, the remaining differences between model and experiment resulted in an average overprediction of the COP of 9%.

,,_,., _,. .,
In view of the potential use of the model for rating purposes, more experimental data are needed to quantify the effects on compressor performance of wet suction gas and air flow over the compressor shell at temperatures more representative of eventual heat pump applic- ation. Refinements to the superheat correction factors may be warranted to account for the superheat characteristics of new high-efficiency compressor designs, different methods of motor cooling, and superheat effects at low evaporator temperature. In lieu of such informa- tion, our results suggest that each compressor map should be calibrated with steady-state heat pump test data- (possibly at two heating mode and two cooling mode conditions) to ensure simulation accuracy comparable to the experimental testing program. Further, attention should be given to proper "run-in" of the test units so that experimental data reflect eventual field performance.
REFERENCES
1.
2.
3.
4..
5.
6.
7.
8.
9.
U.S. Department of Energy, "Energy Conservation Program for Consumer Products; Test Proceduresfor Central Air Conditioners, Including Heat Pumps", 1OCFR Part 430, Federal Register, Vol. 44, No. 249, pp. 76700-76723, December 27, 1979.
R. D. Ellison and F. A. Creswick, A Computer Simulation of Steady-State Performance of Air-to-Air Heat Ebmps, ORNLICON-16 (March 1978).
R. D. Ellison, F. A. Creswick, C. K. Rice, W. L. Jackson and S. K. Fischer, "Heat Pump Modeling: A Progress Report", Proceedings of the Fourth Annual Heat Pump Technology Conference, Oklahoma State University, Stillwater, OK, April 9-10, 1979.
C. K. Rice, S. K. Fischer, R. D. Ellison, and W. L. Jackson, Design @timization and the Limits of Steady-State Heating Efficiency for Conventional SingZe-Speed Air-Source Heat Pwnpa, ORNL/CON-63 (to be published).
H. S. Kirschbaum and S. E. Veyo, An Investigation of Methods to Improve Heat Pump Performance and ReZiabiZity in a Northern CZimate, Vol. III, Electric Power Research Institute, EPRI EM-319 (January 1977).
C. C. Hiller and L. R. Glicksman, Improving Heat Pwnp Performance via Compressor Capacity Control-AnaZysis and Test, Report No. 24525-96, Heat Transfer Laboratory, Massachusetts Institute of Technology (1976).
W. D. Cooper, "Refrigeration Compressor Performance as Affected by Suction Vapor Superheating", ASHR4E Transactions, Vol. 80, Part 2, (1974).
V. B. Yakobsen, "Investigation of Influence of Suction Vapor Superheat of Refrigerating Compressor Performance", BuZZetin of the IIR-Commission, 3 and 6, (1965).
E. R. Wolfert, "Effect of Superheat on Compressor Capacity", ASHRAE Journal (June 1940).
10. Copeland Corporation, compressor performance curves catalog, Sidney, OH (1980).
111 Bristol Corporation, compressor performance curves catalog, Bristol, VA (1980).
12.
13.
14.
Tecumseh Products Company, "Tecumseh Refrigeration Compressors and Condensing Units", Tecumseh, MI (1980).
E. H. Schwartz, Tecumseh Products Company, Techumseh, MI, private communication, November 1980.
S. Blankenship, Westinghouse Electric Corporation, Norman, OK, private communication, November 1980.
1s. J. J. Jacobs, "Analytical and Experimental Techniques for Evaluating Compressor Per- formance Losses", Proceedings of the 1978 Purdue Compressor TechnoZogy Conference, Ray W. Herrick Laboratories, Purdue University, July 6-9, 1976.
16. W. F. Stoecker, L. D. Smith III, and B. N. Emde, "Influence of the Expansion Device on . the Seasonal Energy Requirements of a Residential Air Conditioner," ASHRAE Transactzonc, Vol. 87, Part 1 (1981).
17. A. A. Domingorena, Performance hVa&.uztion of a Low-Fht-Cost, !l%ree-Ton, Air-to-Air Heat Pwnp hz the i'leating Mode, ORNL/CON-18 (October 1978).
18, A. A. Domingorena and S. J. Ball, Performance EvaZuation of a Selected Three-Ton Air- to-Air Heat Pwnp Cn the Heating Mode, ORNL/CON-34 (January 1980).
.19. . A. Kessler, Trane Company, La Crosse, WI, private communication, October 1980.
20. W. A. Miller, Oak Ridge National Laboratory, private communication, September 1980.
21. Air-Conditioning and Refrigeration Institute, Stundard for Positive Displacement Refrigerant Compressors, Compressor Units and Condensing Units, Standard 520-78, Arlington, VA (1978).
22. W. A. Miller, The Influence of Ambient Taperature and Relative Humidity on the Heating Mode Performance of a High-Efficiency Air-to-Air Heat Pwnp, Masters Thesis, University of Tennessee, Knoxville, TN, pp. 204-210 (August 1980).
23. V. C. Mei, Oak Ridge National Laboratory, private communication, February 1981.

Table 1 Comparison of Compressor Model Predictions for Refrigerant Mass Flow Rate With Erperlmental Results for Four Heat Pumps
l- CORlrRltSoll SHELL INLET
HCAT AMlENT SUPERHFAT OR PUMP ILflPERAlURE 'sat.evP 'sat.cnnd NO. 'C(f) =x(f) "WI
'0$&y I
I
- 3.1 (26.5) - 9.2 (15.5) 41.2 (117) f.941
3.1 (37.5) - 5.0 (21.6) 50.0 (122) 0.9 (161 5.4 (41.7) - 4.5 (23.9) 51.7 (125) 10.6 (191
10.6 (51.0) - 2.3 (27.9) 55.0 (131) 14.4, (26) _
17.9 (61.3) 1.3 (34.4) 50.9 (130) 10.3 (33)
2 - 5.1 (22.9) -12.7 ( 9.2) 38.9 (102) 1.901 - 2.9 (26.7) -10.9 (12.4) 40.0 (104) C.981
3.6 (38.4) - 6.3 (20.6) 46.1 (115) c.991 9.0 (40.2) - 1.2 (29.0) 50.5 (123) [1.001
13.3 (56.0) - .3 (31.4) 52.0 (127) 2.2 (4)
3 - a.3 (17) -14.1 ( 6.6) 35.6 ( 96) f.971
1.7 (35) - 5.7 (21.7) 48.3 (119) c.971
a.3 (47) - 1.2 (29.9) 52.0 (127) 5.0 (9)
4 - a.3 (17.1) -15.1 ( 4.8) 32.2 ( 90) a.3 (15)
- 6.0 (19.0) -14.0 ( 6.0) 32.8 ( 91) 7.0 (14)
- .8 (30.5) -10.0 (14.0) 35.6 ( 96) 7.2 (13)
1.4 (34.6) - 0.4 (11.11) 36.7 ( 90) 7.2 (13)
3.6 (30.5) _ 6.6 (211.2) 30.3 (101) 6.7 (12)
a.3 (47.1)) ' - 3.7 (25.3) 40.0 (104) 7.2 (13)
l Refer to text + Map values based on 10°C (65F) return ga
MASS FLOW RAIE - L :g/r(lhm/hr) 1 % UlFf
MAP HOIJEL EXPERlHENlAl nmL/EXl
[Adjusted']
.037 (295) .041 (325) .041 (322) .9
.043 (340) .043 (343) .042 (336) 2.1
.045 (350) ,045 (359) .044 (351) 2.3
.040 (303) .040 (379) .047 (371) 2.2
.055 (434) .054 (426) .050 (395) 7.0
-IAdjusted*: -025 (201) .027 (212) .033 (261) -10.0
.020 (221) .029 (233) .036 (2021 -17.4
.034 (271) .036 (203) .042 (3301 -14.2
.043 (344) .045 (356) .O40 (3011 - 6.7
.044 (351) .046 (361) .051 (4051 -10.9
[Computed] .032 (253) .034 (266) .osq (267) - .5
-041 (329) .046 (364) .044 (347) 4.9
-050 (396). .052 (413) .052 (409) 1.0
lurbine Hcter -024 (190) .024 (193) .024 (192) 19
.026 (202) .026 (205) .026 (204) .7
.031 (245) .032 (250) .032 (251) - .6
.033 (264) .034 (269) .034 (271) - .a
.036 .(287) .037 (293) .037 (292) .4
.041 (320) .042 (334) ,042 t-m) 0.0
temperature, 32Y (9OF) ambient air over compres
+
+
qp/Exp
- 0.4
1.2
2.0
3.2
9.9
-23.1
-21.7
,-17.0
- 9.6
-13.3
- 5.4
- 5.2
- 3.2
- .a
- .9
- i.4
- 2.6
- 1.7
- 1.9
, SOI
Table 2 Comoarison of Compressor Model Predictions for Compressor Power With Experimental Results for Four Heat Pumps
T COMPRESSOR POWER INPUT - Wdtts I
I sat.cond
oc(F) HAP 4OOEL
KE .._----
PAP/EXP
3.1 (26.5) - 9.2 (15.5) 47.2 (117) 1.941 3310 3232 3670 -12.0 - 9.6
3.1 (37.5) - 5.0 (21.6) 50.0 (122) 0.9 06) '3630 3627 3960 - a.4 - a.)
5.4 (41.7) - 4.5 (23.9) 51.7 (125) 10.6 (19) 3703 3779 4090 - 7.6 - 7.5
10.6 (51.0) - 2.3 (27.9) 55.0 (131) 14.4 (26) 4020 4011 4170 - 3.0 - 3.6
17.9 (64.3) 1.3 (34.4) 50.9 (130) 10.3 (33) 4440 4475 4660 - 4.0 - 4.5
5.1 (22.9) -12.7 ( 9.2) 30.9 (102) E.981 2345 2305
ii.9 (26.7) -10.9 (12.4) 40.0 (104) C.981 2461 2429
3.6 (38.4) - 6.3 (20.6) 46.1 (115) L.991 2010 2766
9.0 (48.2) - 1.2 (29.0) 50.5 (123) Cl .ool 3210 3100
13.3 (56.0) - .3 (31.4) 52.0 (127) 2.2 (4) 3300 3337
2610
2730
3100
-11.7
-11.0 -10.0
3390
I
- 6.0
3500 - 7.7
-10.1
- 9.9
- 9.4
- 5.1
- 7.0
a.3 (17) -14.1 ( 6.6) 35.6 ( 96) t.971 2637 2597
1.7 (35) - 5.7 (21.7) 40.3 (119) t.971 3270+ 3165
a.3 (47) - 1.2 (29.9) 52.0 (127) 5.0 (9) 3720t 3660
- 2.3
0.6
0.3
a.3 (17.1) -15.1 ( 4.0) 32.2 ( 90) 0.3 (15) 1909 1976 1996 - 1.0 - .4
6.0 (19.0) -14.0 ( 6.0) 32.0 ( 91) 7.0 (14) 2052 2046 2053 - .3 0.0
.a (30.5) -10.0 (14.0) 35.6 ( 96) 7.2 (13) 2291 2202 2250 1.0 1.5
1.4 (34.6) - 8.4 (16.0) 36.7 ( go) 7.2 (13) 2376 2364 2322 1.0 2.3
3.6 (305) - 6.6 (20.2) 30.3 (101) 6.7 (12) 2495 2475 .2416 . 2.4 3.3
8.3 (47.0) - 3.7 (25.3) 40.0 (104) 7.2 (13) 2647 2631 2564 2.6 3.2
HEAl PUMP NO.
-
* Hap values based on 10% (65F) return gas temperature. 32°C (9OF) amblent air over compressor
. /
.̂ _ I
I
___I./ ,.. _.._, . . .-, “. ,j,, ./, __,._ \ ,.
--__ -’ .’ ” ._. I . _, .-, .,;
: .,i j._ .I’/
Table 3 Additfenal Test Data and Model Comparisons of Refrigerant Mass Flow Rate for Heat Pump 2
r? sat.evp 'X(F)
AMBIENT "MP'$JRE
deatlng Hods
- 2.2 (28)
- 1.1 (30)
1.7 (351
3.9 (39)
6.1 (43)
7.2 (45)
7.3 (46)
10.0 (50)
Cooling Mod
T
E
-
-
.
e
6.9 (19.5)
5.9 (21.4)
4.8 (23.3)
2.6 (27.3)
1.3 (29.7)
.4 (31.2)
1.3 (34.4)
2.5 (36.5)
i! MASS FLOW RATE - kg/s Ibm/hr)
% DIFFERENCE
MAP EXP. ODEL/EXP MAP/EXP
[Adjusted*]
C.981 .035 (274) .037 (291) .038 (299) -2.8 -8.3
L.973 ,036 (287) .039 (307) .037 (294) 4.4 -2.5
c.973 .038 (299) .040 (318) .039 (309) 2.9 -3.4
[l.OO] .042 (330) .043 (342) .041 (322) 6.1 2.5
3.3 (6) .044 (348) ,045 (356) .042 (337) 5.7 3.3
5.0 (9) .045 (360) .046 (366) .043 (345) 6.2 4.2
5.0 (9) .049 (387) .050 (395) .047 (370) 6.7 4.6
9.4 (17) .051 (405) .051 (408) .048 (382) 6.7 6.0
.057 (450)
.057 (450)
.057 (454)
.057 (455)
.057 (454)
8.5 9.7
7.4 6.9
6.7 5.9
5.0 4.0
1.2 0.2
22.8 (82) 2.9 (37.2)
31.1 (88) 3.4 (38.11
34.4 (94) 4.1 (39.41
37.8 (100) 4.8 (40.7:
41.1 (106) 56 (42.0:
43.6 (110.4)
44.8 (112.6)
46.3
47.9
49.3
50.2
51.6
52.7
115.3)
118.2)
120.8)
122.4)
124.9)
125.8)
*Refer to text
Table 4 Additional Test Data anb Model Comparisons of Compressor Power Input for Heat Pump
I ,
COMPRESSOR POW1 :R INPUT - WATTS COMPRESSOR jHELL INLET UPERHEAT OR X DIFFERENCE __
IODEL/EXP MAP/EXP
AMBIENT TEMPERATURE
'C(F)
Heatlng Mode
- 2.2 (28)
- 1.1 (30)
1.7 (35)
3.9 (39)
6.1 (43)
7.2 (45)
7.3 (46)
10.0 (50)
Cooling Modr
22.8 (82)
31.1 (88)
34.4 (94)
37.8 (100)
41.1 (106)
5at.evp T sat.cond 'C(F) "C(F) NAP MODEL EXP.
6.9 (19.5) 43.6 (110.4) C.981 2741 2689 2905
5.9 (21.4) 44.8 (112.6) c.971 2826 2761 2990
4.8 (23.3) 46.3 (115.3) 1.971 2917 2856 3090
2.6 (27.3) 47.9 (118.2) [l.OO] 3084 3047 3220
1.3 (29.7) 49.3 (120.8) 3.3 (6) 3197 3174 3330
.4 (31.2) 50.2 (122.4) 5.0 (9) 3268 3249 3390
1.3 (34.4) 51.6 (124.9) 5.0 (9) 3412 3388 3535
2.5 (36.5) 52.7 (125.8) 9.4 (17) 3511 3504 3640
2.9 (37.21 43.7 (110.7) 15.0 (27) 3273 3286 3430
3.4 (38.1) 46.4 (115.6) 10.0 (18) 3389 3382 3530
4.1 (39.41 49.2 (120.5) 8.9 (16) 3514 3503 3635
4.8 (40.71 52.2 (126.0) 7.8 (14) 3646 3632 377C
5.6 (42.01 55.6 (132.0) 7.8 (14) 3782 3771 393(
-1.4 -5.6
-7.7 -5.5
-7.6 -5.6
-5.4 -4.2
-4.7 -4.0
-4.2 -3.6
-4.2 -3.5
-3.7 -3.5
-4.2 -4.6
-4.2 -4.0
-3.6 -3.3
-3.7 -3.3
-L
-4.0 -3.8