Embed Size (px)
Citation preview

A COMPREHENSIVE MODEL OF INSTRUCTIONAL LEADERSHIP:
THE EFFECTS OF MIDDLE SCHOOL LEADERSHIP ON GROWTH IN STUDENT
LEARNING
A Dissertation
Presented in Partial Fulfillment of the Requirements for the
Degree of Doctor of Education
With a
Major in Educational Leadership
in the
Department of Graduate Education
Northwest Nazarene University
by
Kasey Teske
April 2014
Major Professor: Dr. Heidi Curtis, Ed.D.


i
© Copyright by Kasey Teske 2014
All Rights Reserved

ii
ACKNOWLEDGMENTS
I would like to acknowledge the tireless support of Dr. Loredana Werth and Dr. Heidi
Curtis, as well as the insightful support of my committee members, Dr. Catherine Beals, Dr.
Lynette Hill, and Dr. Wiley Dobbs. Their combined support was instrumental in the work of my
dissertation.

iii
DEDICATION
I simply want to dedicate this dissertation to my wife and family. My wife is my forever
love and endless support. My life would be incomplete without my wonderful children. My
family inspires me with eternal purpose.

iv
ABSTRACT
Using a comprehensive model of instructional leadership, this mixed-methods study investigates
the relationship between the leadership of middle school principals and growth in student
learning. This study also delineates specific actions performed by principals to execute research-
based instructional leadership behaviors. The researcher used annual student growth data from
the Idaho Star Rating System of schools to identify five middle schools of high growth and five
middle schools of low growth. The researcher’s newly developed comprehensive instructional
leadership survey based on a 5-point Likert scale measured differences in leadership styles,
school cultures, and the correlations between 21 researched-based leadership behaviors and three
school cultures. The open survey items of the survey collected specific actions that school
principals used to perform the leadership behaviors. The results of this study verified that the
comprehensive instructional leadership survey is a valid and reliable measurement of effective
middle school leadership, and yielded three significant differences between the leadership of
high-growth schools and low-growth schools. The correlation results ascertained that a majority
of transformational behaviors, which comprise half of the comprehensive instructional leadership
model, are highly correlated with fostering a collaborative, teacher-learning culture of
instructional innovation and support. A near majority of the transformational behaviors of this
study also correlate highly with creating a high-trust culture of teacher satisfaction and
commitment.

v
TABLE OF CONTENTS
ACKNOWLEDGMENTS .............................................................................................................. ii
DEDICATION ............................................................................................................................... iii
ABSTRACT ................................................................................................................................... iv
Chapter I Introduction ......................................................................................................................1
Statement of the Problem .....................................................................................................3
Background ..........................................................................................................................4
Research Questions ..............................................................................................................6
Description of Terms ...........................................................................................................7
Significance of the Study ...................................................................................................10
Overview of Research Methods .........................................................................................12
Chapter II The Literature Review ..................................................................................................14
Introduction ........................................................................................................................14
Instructional Leadership.....................................................................................................17
Transformational Leadership .............................................................................................21
Comprehensive Instructional Leadership: An Integrated Approach .................................26
The Proposed Model of Comprehensive Instructional Leadership ....................................32
Growth-Based Measurement of Achievement ...................................................................49
Conclusion .........................................................................................................................51
Chapter III Design and Methodology ............................................................................................53
Introduction ........................................................................................................................53
Research Design.................................................................................................................55
Participants .........................................................................................................................58

vi
Chapter III Design and Methodology
Data Collection ..................................................................................................................63
Analytical Methods ............................................................................................................65
Limitations .........................................................................................................................66
Chapter IV Results .........................................................................................................................68
Introduction ........................................................................................................................68
Overview of Analysis ........................................................................................................68
Chapter V Discussion ..................................................................................................................110
Significance of the Study .................................................................................................110
Summary of Results .........................................................................................................112
Discussion of Findings .....................................................................................................129
Impact of Limitation ........................................................................................................139
Conclusion .......................................................................................................................140
Recommendations for Further Research ..........................................................................141
Implications for Professional Practice .............................................................................142
References ....................................................................................................................................144
Appendix A: Comprehensive Instructional Leadership Survey ..................................................153
Appendix B: Comprehensive Instructional Leadership Model’s Alignment to Existing Models
......................................................................................................................................................156
Appendix C: Critical Values of the Pearson Product-Moment Correlation Coefficient .............157

vii
LIST OF TABLES
Table 1. A Comparison of Common Leadership Models with Comprehensive Model ..................21
Table 2. Content Validty of Eight Experts for the Comprehensive Leadership Survey ...............57
Table 3. Eight Principalship Experts Who Validated Content of the Survey ................................58
Table 4. Middle School Participants Overview .............................................................................62
Table 5. Surveys Retuned by School ..............................................................................................63
Table 6. Cronbach's Alpha Scale ...................................................................................................69
Table 7. Comparison of Descriptive Statistics ...............................................................................70
Table 8. Mann-Whitney U Test ......................................................................................................71
Table 9. Item Analysis for Survey Item 1 .......................................................................................72
Table 10. Item Analysis for Survey Item 2 .....................................................................................73
Table 11. Themes and Frequency for Survey Item 2 .....................................................................73
Table 12. Item Analysis for Survey Item 3 .....................................................................................74
Table 13. Themes and Frequency for Survey Item 3 .....................................................................75
Table 14. Item Analysis for Survey Item 4 .....................................................................................75
Table 15. Themes and Frequency for Survey Item 4 .....................................................................76
Table 16. Item Analysis for Survey Item 5 .....................................................................................76
Table 17. Themes and Frequency for Survey Item 5 .....................................................................77
Table 18. Item Analysis for Survey Item 6 .....................................................................................78
Table 19. Themes and Frequency for Survey Item 6 .....................................................................78
Table 20. Item Analysis for Survey Item 7 .....................................................................................79
Table 21. Themes and Frequency for Survey Item 7 .....................................................................80
Table 22. Item Analysis for Survey Item 8 .....................................................................................80

viii
Table 23. Themes and Frequency for Survey Item 8 .....................................................................81
Table 24. Item Analysis for Survey Item 9 .....................................................................................82
Table 25. Themes and Frequency for Survey Item 9 .....................................................................82
Table 26. Item Analysis for Survey Item 10 ...................................................................................83
Table 27. Themes and Frequency for Survey Item 10 ...................................................................84
Table 28. Item Analysis for Survey Item 11 ...................................................................................85
Table 29. Themes and Frequency for Survey Item 11 ...................................................................85
Table 30. Item Analysis for Survey Item 12 ...................................................................................86
Table 31. Item Analysis for Survey Item 13 ...................................................................................87
Table 32. Themes and Frequency for Survey Item 13 ...................................................................87
Table 33. Item Analysis for Survey Item 14 ...................................................................................88
Table 34. Themes and Frequency for Survey Item 14 ...................................................................88
Table 35. Item Analysis for Survey Item 15 ...................................................................................89
Table 36. Themes and Frequency for Survey Item 15 ...................................................................90
Table 37. Item Analysis for Survey Item 16 ...................................................................................90
Table 38. Themes and Frequency for Survey Item 16 ...................................................................91
Table 39. Item Analysis for Survey Item 17 ...................................................................................91
Table 40. Themes and Frequency for Survey Item 17 ...................................................................92
Table 41. Item Analysis for Survey Item 18 ...................................................................................93
Table 42. Item Analysis for Survey Item 19 ...................................................................................93
Table 43. Themes and Frequency for Survey Item 19 ...................................................................94
Table 44. Item Analysis for Survey Item 20 ...................................................................................94
Table 45. Themes and Frequency for Survey Item 20 ...................................................................95

ix
Table 46. Item Analysis for Survey Item 21 ...................................................................................96
Table 47. Themes and Frequency for Survey Item 21 ...................................................................96
Table 48. Item Analysis for Survey Item 22 ...................................................................................97
Table 49. Themes and Frequency for Survey Item 22 ...................................................................98
Table 50. Item Analysis for Survey Item 23 ...................................................................................98
Table 51. Themes and Frequency for Survey Item 23 ...................................................................99
Table 52. Item Analysis for Survey Item 24 ...................................................................................99
Table 53. Themes and Frequency for Survey Item 24 .................................................................100
Table 54. Correlations Between Culture-Related Items and Focus-Setting Items ......................102
Table 55. Correlations Between Culture-Related Items and Focus-Keeping Items ....................103
Table 56. Correlations Between Culture-Related Items and Trust-Modeling Items ...................104
Table 57. Correlations Between Culture-Related Items and Innovation-Stimulating Items .......105
Table 58. Correlations Between Culture-Related Items and Innovation-Supporting Items ........106
Table 59. The Mean of Correlations Between Culture-Related Items and Managerial Items and
Transformational Items ................................................................................................................107
Table 60. Mean Correlations Between Culture-Related Items and the Five Sets of Leadership
Behaviors .....................................................................................................................................108

x
LIST OF FIGURES
Figure 1. Visual Representation of Comprehensive Instructional Leadership Model ...................35
Figure 2. Adequate Growth Flowchart to Determine Points for Meidan SGP Ranking................61
Figure 3. Mean Comparisons Within the Comprehensive Instructional Leadership Model .......114
Figure 4. Correlation Comparisons within the Comprehensive Instructional Leadership Model
......................................................................................................................................................125

1
Chapter I
Introduction
With the vast majority of school leadership studies centered on the principalship, research
confirms school leadership as the most influential factor on students’ learning—second only to
teachers’ classroom instruction (Louis, Leithwood, Wahlstrom, & Anderson, 2010). Among
educational leaders, principals possess a unique position to influence the improvement of
teaching, which bears the greatest impact on student learning (Hattie, 2002; Louis et al., 2010).
Replete evidence exists regarding the contributions of school leadership in implementing all
initiatives aimed at improving the quality of schools, teacher effectiveness, and student learning
(Hallinger, 2011; Leithwood & Jantzi, 2005; Louis et al., 2010). In short, effective schools do
not exist without effective principals (Cotton, 2003). Louis et al. (2010) affirmed that they did
not encounter any instance in which a school increased its students’ learning achievement
without effective leadership.
Throughout educational history, principals’ leadership behaviors have evolved to meet
the changing demands of education (Hallinger, 2003, 2005, 2011; Leithwood, Jantze, &
Steinback, 1999; Marks & Printy, 2003; Shatzer, 2009; Stewart, 2006). Since 1978, school
leadership models among principals have evolved from a top–down set of managerial behaviors
focused on teaching and learning to a bottom–up set of collaborative behaviors that implements
systemic change for school reform (Hallinger, 2003, 2005, 2011; Marks & Printy, 2003; Shatzer,
2009; Stewart, 2006). As the most researched leadership models in education, “instructional” and
“transformational” leadership illuminates this pattern of evolutional development within the
educational leadership of principals (Hallinger, 2003, 2005, 2011; Marks & Printy, 2003;
Shatzer, 2009; Stewart, 2006).

2
The principal’s ability to create a positive and productive school culture, which indirectly
influences student achievement, remains one of the most widely supported school leadership
behaviors within the literature (Hallinger, 2003, 2005; Leithwood & Jantzi, 2005; Marzano,
Waters, & McNulty, 2005). Extensive research related to school culture confirms that principals
shape the conditions of the teaching and learning culture of the classroom as well as the
collaborative teacher-learning culture within the school (Hallinger, 2005; Leithwood & Jantzi,
2005). Instructional leadership creates a strong teaching and learning environment of high
expectations in the classroom with its top–down, managerial focus on the instructional program,
while transformational leadership ignites bottom–up support for deep, second-order school
reform through shared leadership and professional learning (Hallinger, 2003, 2005, 2011;
Leithwood & Jantzi, 2005; Marzano et al., 2005). A high-trust culture of commitment and
satisfaction serves as a key indicator of a healthy and productive culture of professional learning
(Bryk & Schneider, 2002; Harchar & Hyle, 1996; Louis & Wahlstrom, 2010; Robinson, 2010).
The growing complexity of education requires an integrated approach of eclectic
leadership behaviors to manage the school’s instructional program and its learning environment,
while allowing time to create a professional learning culture that generates instructional
innovations necessary to implement standards-based education (Louis et al., 2010; Louis &
Wahlstrom, 2011; Marks & Printy, 2003; Southworth, 2002). Balyer (2012) concluded from a
study designed to discover the level of transformational leadership demonstrated by school
principals that the tenets of transformational leadership continue to contribute significantly to the
effectiveness of principal leadership—especially as the complexity of the educational
environment requires increased innovation.

3
Statement of the Problem
Although more eclectic views of instructional leadership continue to evolve, a
comprehensive model of instructional leadership with the integration of instructional and
transformational leadership behaviors needs to be developed in order to measure the current
leadership styles among principals (Marks & Printy, 2003). Current research has not generated
an adequate set of school leadership behaviors to measure the increasingly complex and
influential roles of principals and to represent an accurate description of the leadership function
of effective principals (Leithwood & Jantzi, 2005). Within educational research, two primary
models emerge: Hallinger's instructional leadership model (1985), which measures top–down
instructional management, and Leithwood's set of transformational leadership behaviors, which
measures bottom–up shared leadership and professional learning (Leithwood & Jantzi, 2005).
The instructional leadership behaviors of Hallinger’s (1985) model espouse a style that maintains
a laser-like focus on teaching within the student-learning environment (Hallinger & Murphy,
1985; Hallinger, 2003, 2005, 2011). In alignment with the findings of Marzano's (2005) meta-
analysis, Leithwood's (2005) set of transformational leadership behaviors stimulates a
professional learning culture of shared leadership conducive to deep, second-order change
(Hallinger, 2003; Leithwood & Jantzi, 2005; Marzano et al., 2005).
This study proposes a newly-developed model of comprehensive instructional leadership
based on both Hallinger's (1985) model and Leithwood's (2005) model in addition to Marzano's
(2005) 21 responsibilities of the school leader. This study’s newly developed model aims to
measure differences between middle school and junior high principals who lead schools with
high growth in student learning and middle school and junior high principals who lead schools
with low growth in student learning. Secondly, it gathers specific actions related to how

4
principals carry out leadership behaviors aligned to the research in the proposed comprehensive
model of this study.
Background
Instructional leadership holds claim as one of the most researched approaches to
educational leadership (Hallinger, 2005; Louis et al., 2010; Marks & Printy, 2003; Southworth,
2002). First designed as a management model, Hallinger’s model of instructional leadership
served as a popular framework for other instructional leadership approaches (Hallinger, 2011).
School leaders heavily employed instructional leadership strategies to manage the instructional
program for the explicit purposes of setting and maintaining the focus on improving teaching and
learning during the effective schools era (Hallinger, 2003, 2005, 2011).
Originally, instructional leadership narrowly focused on principals working directly with
individual teachers to improve their instructional behaviors without sharing leadership with
teachers for professional learning purposes (Marks & Printy, 2003). Because of its focus on
teaching and learning, instructional leadership has a compelling draw that continues to endure in
educational leadership. The traditional assumption, however, that one heroic principal can solely
shoulder the responsibility of instructional leadership falls on tenuous ground within the complex
landscape of education today (Hallinger, 2003, 2005, 2011; Marks & Printy, 2003; Shatzer,
2009; Stewart, 2006). In addition to the time requirement of working with each teacher directly,
principals must exhibit adept knowledge of instructional, curricular, and assessment practices to
become effective instructional leaders (Marks & Printy, 2003; Shatzer, 2009; Stewart, 2006).
More recently, “shared” instructional leadership refers to a broader variant of
instructional leadership, which entails teachers learning in collaboration and serving as leaders in
the process of improving instruction (Louis et al., 2010; Southworth, 2002). This broadly defined

5
concept of shared instructional leadership extends beyond directly observing and working with
individual teachers at the classroom level and focuses on the collaborative culture of teachers
(Marks & Printy, 2003). In a broader sense, shared instructional leadership aims to establish a
culture that harnesses the talents of teacher–leaders to support continuous professional growth.
Marks and Printy (2003) asserted, “The principal becomes less an inspector of teacher
competence and more a facilitator of teacher growth” (p. 374). This shift to shared leadership
and professional learning blurs the line between instructional leadership behaviors and
transformational leadership behaviors. This convergence of both models suggests that principals
are subscribing to a blended approach of leadership in which instructional and transformational
behaviors work in tandem to deal with the ever-changing backdrop of education and its resulting
complexity (Hallinger, 2003; Leithwood & Jantzi, 2005; Marks & Printy, 2003).
Transformational leadership theory originated outside of education but became one of the
most abundant models used in education during the school reform era (Hallinger, 2003; Leithwood
& Jantzi, 2005; Marks & Printy, 2003; Shatzer, 2009). School reform requires principals to
initiate and manage school-wide changes. Transformational leadership approaches allowed
principals to learn that empowering teachers through collaborative structures increased the
likelihood of successful reform (Leithwood & Jantzi, 2005; Marks & Printy, 2003; Shatzer,
2009). Transformational leadership involves stakeholders in a transformative process from the
bottom–up, which generates collective commitment toward a shared purpose that is necessary to
effect profound change (Leithwood & Jantzi, 2005; Marks & Printy, 2003, Shatzer, 2009).
Transformational leadership extends the influence of the principal through teacher collaboration
and leadership to introduce innovation and, thereby, creates a culture that promotes and supports
change (Leithwood & Jantzi, 2005; Louis et al., 2010; Marks & Printy, 2003; Shatzer, 2009).

6
Research Questions
Because research indicates that high schools and middle schools lack shared leadership
and robust teacher-learning communities as compared to elementary schools, the researcher
decided to make middle schools, including junior high schools, a focus of this study (Louis et al,
2010). This focus comes with interest to ascertain if principals of effective middle schools and
junior high schools share leadership and establish professional learning cultures beyond less
effective middle schools. As suggested in research, sharing leadership with teachers and
increasing professional learning impacts student learning positively (Louis et al., 2010). The lack
of replete corroboration to this claim, however, implies an empirical need to identify specific
leadership behaviors related to shared leadership and professional learning cultures (Leithwood
& Jantzi, 2005; Louis et al., 2010; Marks & Printy, 2003; Southworth, 2002).
With an eclectic set of school leadership behaviors from Hallinger’s (1985) instructional
leadership model and Leithwood’s (2005) transformational leadership model, this mixed-
methods study utilizes the researcher’s newly-developed model of comprehensive instructional
leadership to measure the differences between middle school principals who generate high
growth in student learning, and those who generate low growth. A 5-point Likert survey based
on the proposed comprehensive model of instructional leadership comprises the quantitative
portion of the measurement instrument (see Appendix A). The qualitative portion of the
measurement instrument includes open-ended items designed to collect specific actions that
principals perform in alignment with the research-based leadership behaviors of the proposed
model in this study.
This study answers the following research questions:

7
1. What differences exist in leadership behaviors between middle school who lead
schools of high growth in learning and those who lead schools of low growth?
2. What are the specific actions principals perform that align with effective leadership
behaviors found in research?
In addition, investigative methods of this study consider four hypotheses:
1. (H1) Effective middle school principals practice an integrated approach of
instructional leadership behaviors and transformational behaviors.
2. (H2) Instructional leadership behaviors correlate highly to the building of strong
student-learning cultures of high expectations and support.
3. (H3) Transformational leadership behaviors correlate highly to the creation of a
collaborative, teacher-learning culture of innovation and support and the high-trust
culture of commitment and satisfaction.
4. (H4) Modeling ideals of trustworthiness and innovation correlate highly to a culture
high-trust, commitment, and satisfaction.
Description of Terms
This section defines the terms used in the literature to describe the school leadership
models considered in this study. Many of the descriptive words used to distinguish instructional
leadership from transformational leadership originated from Hallinger (2003).
Narrow approach. This leadership style consists of the principal directly working with
individual teachers in a supervisory role to improve instruction (Lambert, 2002; May &
Supovitz, 2011; Printy & Marks, 2006; Shatzer, 2009).

8
Broad approach. This leadership style entails the principal working with a group of
teachers through shared leadership and collaboration in a facilitative role to improve instruction
(Lambert, 2002; May & Supovitz, 2011; Printy & Marks, 2006; Shatzer, 2009).
Top–down approach. Hallinger (2003) described a top–down style of leadership as a
directive approach in which the principal acts in a strong supervisory role.
Bottom–up approach. Hallinger (2003) described a bottom–up style of leadership as a
facilitative approach that involves stakeholders and shares leadership in making decisions.
First-order change. Marzano et al. (2005) defined first-order change as an extension of
past knowledge, implemented with existing knowledge and skills within existing paradigms. The
changes are incremental and consistent with prevailing values and norms.
Second-order change. Marzano et al. (2005) defined second-order change as a break
with the past outside of existing paradigms that conflicts with prevailing values and norms.
These more complex changes require new knowledge and skills to implement (Hallinger, 2003;
Marzano et al., 2005).
Managerial or transactional approach. Hallinger (2003) defined this approach as a
leadership style that emphasizes the centrality of the principal’s top–down role in managing and
directing first-order improvements in the school.
Management. Lewis, Goodman, and Fandt (2006) defined management as the process of
administering and coordinating resources effectively and efficiently in an effort to achieve the
goals of the organization.
Transformational approach. Hallinger (2003) defined this approach as a leadership
style that focuses on stimulating second-order change through bottom–up participation and
shared leadership in decision making.

9
The following terms are derived from Bass’s (1985) tenets of transformational leadership.
There terms are still used to define transformational leadership approaches in education.
Inspirational motivation. This transformational tenet involves leaders developing a
shared vision of the future, which provides a decision-making framework for organizational
goals and priorities, as well as for the conveyance of high-performance expectations (Bass,
1985).
Individualized consideration. This transformational tenet occurs as school leaders
become aware of teachers’ developmental needs and provide for those needs by extending
opportunities for growth and providing coaching (Bass, 1985).
Intellectual stimulation. This transformational tenet ensures principals present new
ideas, encourage innovation, and create a supportive culture of change (Bass, 1985).
Idealized influence. This transformational tenet involves principals leading by example
and modeling cultural values and ideals (Bass, 1985).
Shared leadership. Principals share leadership when they empower teachers and other
staff members to present ideas for consideration, participate in decision making, or lead small
groups of colleagues within collaborative structures.
Shared instructional leadership. Definitions of shared instructional leadership vary
widely depending on the person using the term, and no well-known model exists (Harris,
Leithwood, Day, Sammons, & Hopkins, 2007; Lee, Hallinger, & Walker, 2012). For the purpose
of this study, the researcher defined this term as instructional leadership distributed to teachers as
the principal and teachers work together within collaborative structures of professional learning
to implement instructional improvements. Shared instructional leadership primarily occurs when
principals use the tenets of transformational leadership.

10
This study will assess the effectiveness of school leadership based on the learning growth
that schools achieve. No Child Left Behind legislation allows two types of student outcomes to
meet accountability requirements: status achievement within a proficiency model and growth
achievement within a growth model (U.S. Department of Education, 2013).
Status achievement. This model measures achievement in learning with a summative
test usually evaluated on differing levels of proficiency (Zvoch & Stevens, 2006).
Growth achievement. This model measures achievement in learning with annual growth
between two summative tests (Zvoch & Stevens, 2006).
Significance of the Study
In educational leadership literature, the researcher was unable to locate studies that
considered the impact of school leadership on student achievement as measured by growth
models (Hallinger, 2011; Leithwood & Jantzi, 2005). This study quantitatively investigates
which school leadership behaviors are used most often by principals who lead middle schools
with high growth achievement, and if differences exist between those principals and the
principals who lead middle schools of low growth achievement. Growth achievement, rather than
status achievement, minimizes the effect of student backgrounds and stands as a reliable,
nonbiased means of measuring learning (Di Carlo, 2012; Gordon, Kane, & Staiger, 2006;
Lipscomb, Teh, Gill, Chiang, & Owens, 2010; Zvoch & Stevens, 2006).
Traditionally, researchers have used status achievement rather than growth achievement
as the student outcome to measure the impact of school leadership on student learning for
quantitative studies (Hallinger, 2011; Leithwood & Jantzi, 2005). Growth achievement measures
student learning that occurs between two summative tests. Some states utilize state proficiency
tests to measure growth achievement with a growth model for federal accountability purposes

11
(U.S. Department of Education, 2013). Growth models tabulate individual achievement in
student learning from one year to the next on state accountability assessments and credit schools
for student improvement over time (U.S. Department of Education, 2013). Proponents of growth
models assume that all students can exhibit adequate annual growth with quality instruction—
regardless of their current levels of status achievement, which is affected by socioeconomic and
other background factors (Di Carlo, 2012; Gordon et al., 2006; Lipscomb et al., 2010; Zvoch &
Stevens, 2006). In addition, evidence from recent growth models in pilot states suggests that
traditional low-performing schools, based on proficiency rankings, can outperform traditional
high-performing schools when compared by annual growth rankings (Parry, 2010).
Because school leadership among principals serves as the most critical factor impacting
student achievement second only to the quality of instruction, a compelling case for additional
research exists regarding the impact of successful school leadership on academic growth (Louis
et al., 2010; Markow, Macia, & Lee, 2013). Researchers have not developed a comprehensive
model of instructional leadership, which more accurately represents the current leadership of
principals, to measure the effectiveness of principals and school leadership (Marks & Printy,
2003). Moreover, research suggests that when school leaders distribute and share leadership,
student achievement improves. The evidence base, however, remains low, and more research
with regard to shared leadership needs to identify specific leadership behaviors (Leithwood &
Jantzi, 2005; Louis et al., 2010; Marks & Printy, 2003; Southworth, 2002).
This mixed-methods study employs a newly-developed comprehensive model of
instructional leadership that measures the differences in leadership styles, including the sharing
of leadership. It also measures the differences in three school cultures created by the associated
leadership behaviors of principals. The principal’s ability to create school culture is widely

12
supported in the literature (Hallinger, 2003, 2005; Leithwood & Jantzi, 2005; Marzano, Waters,
& McNulty, 2005). Research indicates that principals primarily influence the student-learning
culture of classrooms and the teacher-learning culture within the school (Hallinger, 2005;
Leithwood & Jantzi, 2005). A high-trust culture of commitment and satisfaction results from a
healthy and productive culture of professional learning (Bryk & Schneider, 2002; Harchar &
Hyle, 1996; Louis & Wahlstrom, 2010; Robinson, 2010). The process of using the
Comprehensive Instructional Leadership Survey to measure the effects of middle school
leadership on growth in student achievement confirmed the validity and reliability of the model.
Likewise, the survey instrument gathered themes to clarify specific actions that practicing
principals perform in order to share leadership within the professional learning cultures of their
schools.
The researcher selected the school leadership of middle school principals as a focus,
because the leadership of secondary principals had been shown to be inadequate in raising
students’ achievement as compared to elementary schools (Louis & Wahlstrom, 2010). The
primary reason for this is attributed to the ineffective efforts of secondary principals to build
teacher-learning cultures of collaboration through shared leadership, which results in limited
trust and lowered student achievement (Louis & Wahlstrom, 2010).
Overview of Research Methods
This study employed a mixed-methods approach to determine the relationship between
principal leadership behaviors and growth in student learning, along with the qualitative
determinations of specific actions performed by principals to execute research-based school
leadership behaviors. The researcher of this study used student growth data from the Idaho Star

13
Rating System to identify five middle schools of high growth and five middle schools of low
growth. The selection process excluded schools with fewer than 250 students.
Based on a 5-point Likert scale, this study employed the newly-developed
Comprehensive Instructional Leadership Survey to measure the differences in leadership styles,
school cultures, and the correlations among them. Employing open-ended items, the survey also
collected specific actions of principals used to accomplish the research-based leadership
behaviors. The survey additionally collected some simple descriptive data regarding the number
of years the principals, mathematics teachers, and language arts teachers worked within each
school and the name of each school represented. Prior to administering the survey instrument to
each selected school, eight school leadership experts validated the content of the survey.

14
Chapter II
Literature Review
Introduction
Louis et al. (2010) boldly declared that school leadership possesses the greatest influence
on learning, second only to the influence of teachers. Since 1978, school leadership has evolved
from a top–down set of managerial behaviors focused on teaching and learning to a bottom–up
web of collaborative behaviors that effect change and innovation for school improvement
(Hallinger, 2003, 2005, 2011; Marks & Printy, 2003; Shatzer, 2009; Stewart, 2006). Illustrating
this evolution, instructional leadership and transformational leadership have become most
researched leadership models in education in relation to the principalship and school leadership
(Hallinger, 2003, 2005, 2011; Marks & Printy, 2003; Shatzer, 2009; Stewart, 2006). Both
instructional leadership and transformation leadership have resulted in improved teaching and
student learning (Hallinger, 2011; Leithwood & Jantzi, 2005; Robinson, Lloyd, & Rowe, 2008).
For these reasons, this study applied an integrated set of leadership behaviors from these
two models to determine which leadership behaviors Idaho middle school principals most
frequently use and to ascertain if a difference exists between leadership behaviors in high-growth
schools and low-growth schools. Marzano’s 21 Responsibilities of the School Leader, identified
by a meta-analysis of 69 studies, substantiated the comprehensive set of instructional and
transformational leadership behaviors proposed in this study as a measurement of effective
leadership in schools (Marzano el al., 2005). Shared leadership with an instructional focus has
gained much attention in recent research, demonstrating its impact on student learning (Lambert,
2002; Louis et al., 2010; Printy & Marks, 2006). Although no widely accepted model exists for
shared leadership, and definitions vary widely between shared, distributed, and collaborative

15
leadership, this discussion reviews related research to confirm that the comprehensive set of
leadership behaviors compiled in this study represents a cutting-edge framework of effective
school leadership, which involves the sharing of leadership (Harris et al., 2007; Lee et al., 2012;
Shatzer, 2009).
The review of the literature presents the history of instructional leadership and
transformational leadership, the purposes for which these models originated, and descriptions of
the most common instruments that measure each leadership style. The literature review further
presents research findings demonstrating the effectiveness of both leadership models in relation
to improved teacher performance and student learning, along with their strengths and
weaknesses. In a similar manner, this section includes information regarding the integrated use
of both leadership models and the concept of comprehensive instructional leadership. The
conclusion of the literature review presents an integrated and comprehensive framework of
school leadership behaviors along with advantages of measuring growth when considering the
effectiveness of school leadership.
Louis et al. (2010) discussed the usefulness of describing leadership in terms of two
general functions, one of which involves clarifying focus, and the other, exerting influence.
Thus, in general, school leadership sets a focus for the school and then exerts influence to move
the school in that direction. These two leadership functions of focus and influence provide a
means to compare and contrast models of school leadership (Leithwood et al., 2010).
Within the traditional model of instructional leadership, the principal functions as the
central figure, who exerts direct influence on individual teachers in a narrow approach to impact
the quality of teaching and learning (Hallinger, 2011; Lambert, 2002; Louis et al., 2010; Marks
& Printy, 2003; Shatzer, 2009; Southworth, 2002). This traditional leadership style relies solely

16
on the skilled leadership of the principal working directly with teachers as a key school
improvement factor (Hallinger, 2011; Lambert, 2002; Louis et al., 2010; Marks & Printy, 2003;
Shatzer, 2009; Southworth, 2002). With the challenging and complex need for quality school
leadership today, the heroic efforts of the principal alone do not sufficiently provide instructional
leadership throughout the school (Lambert, 2002; Louis et al., 2010; Marks & Printy, 2003;
Shatzer, 2009; Southworth, 2002). Southworth (2002) declared that a broad approach of building
a school culture of teacher collaboration deserves preference because shared leadership entails
direct and indirect influences and is more likely to distribute the responsibility of instructional
leadership to teachers.
Transformational leadership embodies a broad approach that allows the principal to
create a culture that exerts direct influence and indirect influence on teachers through inspiring
their collective commitment toward the common purpose of implementing school reform
(Leithwood & Jantzi, 2005; Marks & Printy, 2003; Shatzer, 2009). This broad approach does not
rely solely on the principal as the central influencer to effect change, and with an instructional
focus, transformational leadership can encourage a shared responsibility in instructional
leadership (Lambert, 2002; Printy & Marks, 2006; Shatzer, 2009).
May and Supovitz (2011) conducted a unique study to clarify the frequency and scope of
the principal’s leadership activities to improve instruction. With a narrow scope, principals focus
on improving instruction with individual teachers. With a broad scope, principals focus on
improving instruction with the entire staff. The quantitative results from 51 urban schools in
southeastern America indicate that principals spend differing amounts of their time (0% to 25%)
on instructional leadership activities. The magnitude of the changes in instructional practices
relates to the frequency of the principal’s instructional leadership activities (May & Supovitz,

17
2011). Unrelated to the size of the school, only 22% of teachers reported high instructional
leadership contact with their principals. The principal’s instructional interactions with individual
teachers in a narrow scope significantly relate to instructional changes, but these results suggest
that greater changes in instructional practice result from a combination of narrow and broad
approaches (May & Supovitz, 2011).
Based on a review of instructional and transformational leadership research, however,
Hallinger (2003) concluded that relatively few studies confirm a correlation between the
principal’s direct work of supervising the instruction of teachers with teacher effectiveness and
student achievement. The desired results of increased teacher performance and student learning
occurred in elementary schools indicating that school size may serve as a limiting factor
(Hallinger, 2003). Therefore, one may conclude that a narrow focus appears effective as long as
the principal provides frequent instructional interactions with teachers (Hallinger, 2003).
Instructional Leadership
First introduced in the 1970s, instructional leadership models developed during the
effective schools movement of the 1980s (Hallinger 2003, 2005, 2011; Louis et al., 2010; Marks
& Printy, 2003; Shatzer, 2009; Stewart, 2006). Instructional leadership and its variety of models
have endured in education and received much attention in the literature as a result of its
compelling focus on teaching and learning (Hallinger, 2005, 2011; Marks & Printy, 2003). The
concept of instructional leadership evolved recently to include the sharing of leadership (Louis et
al., 2010; Marks & Printy, 2003; Shatzer, 2009). In the original concept, the principal provides
the primary source of instructional leadership (Hallinger, 2005, 2011; Lambert, 2002; Louis et
al., 2010; Marks & Printy, 2003; Shatzer, 2009; Southworth, 2002; Stewart, 2006). The principal
acts as the central supervisor of the instructional program and leads the primary effort to improve

18
teaching and learning by serving as the expert in curriculum, instruction, and assessment and
directly interacting with teachers (Hallinger, 2003, 2005, 2011; Lambert, 2002; Louis et al.,
2010; Marks & Printy, 2003; Shatzer, 2009; Southworth, 2002; Stewart, 2006).
Historically, researchers proposed different models of instructional leadership to measure
the principal’s impact on teaching and learning (Hallinger, 2005; Shatzer, 2009). Although
overlap and commonalities exist between the models, Hallinger’s (1985) model emerged as the
most commonly-used instrument to measure principal leadership for the past 30 years (Hallinger,
2011; Shazter, 2009). Known as the Principal Instructional Management Rating Scale, this
instrument has assessed principal leadership throughout the world since 1982 (Hallinger, 2011).
For these reasons, the researcher of this study selected Hallinger’s (1985) model of instructional
leadership as one of the primary models used to develop the comprehensive set of instructional
leadership behaviors.
Hallinger and Murphy (1985) described instructional leadership with three general
domains: defining the school mission, managing the instructional program, and promoting a
positive learning environment. Within the domain of defining the school mission, they (1985)
included leadership behaviors for framing the school goals and communicating the school goals.
The domain of managing the instructional program includes supervising and evaluating
instruction, coordinating the curriculum, and monitoring student progress. Halliger’s (1985)
domain of promoting a positive learning environment includes (a) protecting instructional time,
(b) maintaining high visibility, (c) providing incentives for teachers, (d) promoting professional
development, and (e) providing incentives for learning. Hallinger’s (1985) instructional
leadership model aligns to portions of the comprehensive school leadership model of this study
and Marzano’s (2005) meta-analysis (see Appendix B).

19
The following exemplifies a recent example of Hallinger’s (1985) model used in school
leadership research. Minus (2010) conducted a study of 121 middle school principals and 484
middle school teachers using Hallinger’s (1985) instructional leadership model to assess the
model’s impact on student achievement in reading and math as measured by Maryland’s state
assessment. The results validated the impact of some of Hallinger’s (1985) instructional
leadership behaviors on student learning, which included promoting professional development,
framing school goals, supervising and evaluating curriculum, coordinating curriculum, and
providing incentives for learning (Minus, 2010).
Robinson et al. (2008) performed a meta-analysis of 22 studies that investigated the effect
size of different forms of leadership and student outcomes. The meta-analysis looked at both
instructional leadership and transformational leadership as the primary leadership models. The
results of all 22 studies indicated strong support for instructional leadership (ES = .42).
Transformational leadership possessed a smaller effect size (ES = .11) even when compared to
other theories (ES = .30). Among the five studies that focused on transformational leadership,
however, only one occurred in the United States, and it had an effect size of .68. The researcher
suggests that school leadership models lack impact on student achievement because they are too
general and too abstract to describe the specific actions school leaders should implement
(Robinson et al., 2008).
Specifically, instructional leadership requires the principal to act as a dynamic
instructional leader with a laser-like focus on teaching and learning (Hallinger, 2003; Louis et
al., 2010; Shatzer, 2009; Southworth, 2002). Instructional leadership has proven effective in
managing the instructional program and learning environment of the school in order to produce
first-order changes focused on improving teacher performance (Halliger, 2003). The traditional

20
role of instructional leadership presumes that principals act as instructional experts solely
capable of accomplishing the leadership behaviors of Hallinger’s model (1985). Although
evidence corroborates the impact of principals’ instructional leadership on teaching and learning,
the one-person act of principals has proved inadequate to fulfill the complex and challenging
need of providing instructional leadership throughout the school and ensuring quality learning
for all students (Hallinger, 2003; Lambert, 2002; Louis et al., 2010; Marks & Printy, 2003, 2006;
Shatzer, 2009; Southworth, 2002). Secondary schools accentuate this claim because of larger
principal-to-teacher ratios (Hallinger, 2003; Shatzner, 2009). Moreover, the traditional, top–
down, narrow view of instructional leadership has not taken advantage of empowering teachers
to create instructional improvement (Marks & Printy, 2003; Southworth, 2002). Due to the
overreliance on the principal to improve schools and frequent principal turnover, any
improvements achieved by schools under the principal-driven model have not been sustainable
(Lambert, 2002). Table 1 summarizes the historical use of instructional leadership and the
model’s strengths and weaknesses.

21
Table 1
A Comparison of Common Leadership Models with Comprehensive Model
Instructional Leadership Transformational Leadership Comprehensive Instructional Leadership
History: Models were developed during the effective schools movement for principals to manage the instructional program and learning environment of schools. Common Model: The most common model used to measure the instructional leadership of principals was posited by Hallinger (1985). Strengths: • Requires principal to act as
strong instructional leader • Maintains strong focus on
teaching and learning • Manages instructional
program and learning environment
• Improves student achievement
Criticisms: • Does not foster
collaboration and shared leadership with teachers
• Does not create second-order change
History: Models were applied to education to effectively transform schools during the school reform movement. Common Model: The most common model used to measure transformational leadership in education was posited by Leithwood and Jantzi (2005). Strengths: • Utilizes the leadership of
teachers • Creates second-order change • Improves collective teacher
efficacy, organizational learning, instructional quality, changes in teacher practice, planning for change, job satisfaction, organizational commitment, and school culture
• Improves student achievement Criticisms: • Lacks strong focus on teaching
and learning • Does not require principal to
be strong instructional leader
History: This model was developed to measure shared leadership with teachers in concert with the principal as a strong instructional leader to effectively implement standards-based reform. Proposed Model: This comprehensive model of instructional leadership is based Hallinger’s model of instructional leadership, Leithwood’s model of transformational leadership, and Marzano’s (2005) meta-analysis. Strengths: The integrated strengths of instructional leadership and transformational leadership synergistically complement the weaknesses of each model. The proposed model of comprehensive instructional leadership holds promise in implementing standards-based reform to boost teacher quality and student achievement.
Transformational Leadership
Transformational leadership theory first developed outside of the educational realm but has
gained a popular foothold in educational research since the 1990s with the school reform movement
(Hallinger, 2003; Leithwood & Jantzi, 2005; Marks & Printy, 2003; Shatzer, 2009). Bass and
Riggio (2006) contended that the effectiveness of transformational leadership universally applies

22
across organizations in business, education, military, government, and the private sector. Using
surveys based on the transformational leadership principles of Kouses and Posner (1995),
Hechanova and Cementina-Olpoc (2012) recently determined that higher education extensively
employs transformational leadership to support changes as compared to the service industry.
Other studies have also shown that transformational leadership exists across the globe with
universal applicability (Bass, 1997; Omary, Khasawneh, & Abu-Tineh, 2009; Sandbakken,
2004).
When principals realized that empowering teachers boosted the chances for reform to
succeed and that transformational leadership offered tools for change, principals started
espousing the theoretical principles of transformational leadership (Leithwood & Jantzi, 2005;
Marks & Printy, 2003; Shatzer, 2009). School reform necessitated principals to function as
change agents. Transformational leadership involves stakeholders within the transformational
process and collectively moves them toward a shared purpose in order to effect desired change
(Leithwood & Jantzi, 2005; Marks & Printy, 2003; Shatzer, 2009). Transformational leadership
focuses on how leaders can exert influence directly and indirectly throughout the organization to
introduce innovation and to shape a supportive culture of change (Leithwood & Jantzi, 2005;
Louis et al., 2010; Marks & Printy, 2003; Shatzer, 2009).
Bass’s original work (1985) included four domains: (a) idealized influence, (b)
inspirational motivation, (c) intellectual stimulation, and (d) individualized consideration. From
his original work, Bass and Avolio (1995) recategorized transformational leadership behaviors
into five general domains by separating idealized influence into idealized attributes and idealized
behaviors. This reconceptualized model of transformational leadership also included separate

23
domains of contingent reward, management-by-exception (active), management-by-exception
(passive), and laissez-faire (Bass & Avolio, 1995).
Along with the reconceptualization of transformational leadership, Bass and Avolio
(1995) developed an instrument, the Multifactor Leadership Questionnaire (MLQ), to measure
transformational leadership behaviors along with the other separate leadership types. Leithwood
and Jantzi (2005) noted that Bass’s theory of transformational leadership consistently appeared
in the vast majority of empirical studies outside the realm of education. In general, Bass’s four
domains guided the use of transformational leadership in the school setting (Leithwood & Jantzi,
2005; Shatzer, 2009). Specifically, researchers used Bass’s MLQ in school contexts and
Leithwood’s (2005) set of transformational leadership behaviors, which were designed to
measure the transformational qualities of school leaders beyond the work of Bass (Leithwood &
Jantzi, 2005).
Leithwood and Jantzi (2005) reviewed 32 empirical studies between 1996 and 2005 that
dealt solely with transformational leadership within the context of schools. Seven of the
reviewed studies used some version of Bass’s MLQ; eighteen of the studies used Leithwood’s
school-specific instrument (Leithwood & Jantzi, 2005). Leithwood’s (2005) set of
transformational leadership behaviors included some of the behaviors proposed by Bass (1997)
but were based on the extensive research within the school setting conducted by Podsakoff et al.
(1992). The researcher of this study selected Leithwood’s (2005) set of transformational
leadership behaviors as a primary model used to create a framework of integrated school
leadership behaviors because of its specific applicability to education and abundant use in
education as a measuring instrument of school leadership (Leithwood & Jantzi, 2005).

24
Leithwood’s (2005) model organizes the set of transformational leadership behaviors into
four general domains: (a) setting directions, (b) helping people, (c) redesigning the organization,
and (d) the transactional–managerial aggregate (Leithwood & Jantzi, 2005). Leithwood’s (2005)
transformational behavior of setting directions includes Bass’s (1997) inspirational motivation.
Leithwood’s (2005) general domain of helping people includes the remainder of Bass’s (1997)
domains of individualized consideration, intellectual stimulation, and idealized influence.
Leithwood’s (2005) transformational leadership model aligns with portions of the comprehensive
instructional leadership model of this study and Marzano’s (2005) meta-analysis (see Appendix
B).
Having reviewed 32 empirical studies between 1996 and 2005, Leithwood and Jantzi
(2005) discovered a web of positive effects on student outcomes, as well as on organizational
outcomes. Regarding student achievement, nine of the studies exhibited mixed results with an
overall conclusion of significant positive effects on student achievement. The results also
revealed that transformational leadership affects student engagement in a modestly positive yet
uniform way (Leithwood & Jantzi, 2005).
Besides impacting student outcomes, transformational leadership influences other
mediating outcomes within schools (Leithwood & Jantzi, 2005). Ross and Gray (2006)
determined that transformational leadership impacts collective teacher efficacy of the school and
the direct and indirect effects on teacher commitment toward the school mission and professional
learning community. Transformational leadership also allows teachers to participate in decision
making, which leads to job satisfaction and better planning for change (Ejimofor, 2007;
Leithwood & Jantzi, 2005; Shatzer, 2009). Transformational leadership fosters a positive school

25
climate and a professional working culture (Leithwood & Jantzi, 2005; McCarley, 2012; Shatzer,
2009).
Leithwood and Jantzi (2005) found that transformational leadership enhances
instructional quality and supports changes in teacher practice. In 2006, a large-scale study
successfully confirmed that Leithwood’s model of transformational school leadership assisted in
changing teachers’ classroom strategies and improving student achievement (Leithwood &
Jantzi, 2006). These results led to three important findings: (a) school leadership can influence
teachers to alter their classroom practices; (b) transformational leadership behaviors appear to
cause the influence needed to alter classroom practices; and (c) a significant gap exists between
classroom practices that were altered and classroom practices that led to increased student
learning (Leithwood & Jantzi, 2006). Leithwood and Jantzi (2006) concluded that the
effectiveness of school leadership for increased student learning relies on the ability of the leader
to promote specific classroom practices. Likewise, Leithwood, Steinbach, and Jantzi’s (2002)
study reminds school leadership practitioners that commitment strategies through a
transformational leadership style prove more effective than authoritative control strategies to
effect instructional change.
Historically, school leaders utilized transformational leadership in cultivating cultures of
change to implement school reform through broad, bottom–up influence by including teachers
within the change process. This style, however, lacked a clear and strong focus on teaching and
learning (Hallinger, 2003; Marks & Printy, 2003). This lack of instructional focus may contribute
to reasons why studies have gleaned mixed results related to student achievement and modest
results related to student engagement (Leithwood & Jantzi, 2005; Shatzer, 2009). Many of the

26
leadership behaviors of Leithwood’s (2005) model align with producing second-order change
(Marzano et al., 2005).
As a strong point, transformational leadership transforms the collective organization
through a supportive culture of second-order innovation (Hallinger, 2003). Transformational
leadership not only impacts students’ learning outcomes positively but also produces high levels
of (a) collective teacher efficacy, (b) organizational learning, (c) instructional quality, (d)
changes in teacher practice, (e) planning for change, (f) job satisfaction, (g) organizational
commitment, and (h) school culture with a learning focus and a teacher collaboration focus
(Leithwood & Jantzi, 2005; Shatzer, 2009). Table 1 presents a brief summary of the
transformational leadership discussed here.
Comprehensive Instructional Leadership: An Integrated Approach
Although commonalities exist between instructional and transformational leadership,
important distinctions also exist between them (Hallinger, 2003). Hallinger (2003) compared the
intersections between instructional and transformational leadership and identified three important
differences. These include top–down or bottom–up approaches, first-order or second-order
changes, and transactional or transformational relationships. Traditional instructional leadership
delivers strong top–down directive supervision, whereas transformational leadership supplies
bottom–up collaborative teacher-learning opportunities with the sharing of leadership (Hallinger,
2003). Shatzer (2009) stated the difference elegantly: “Rather than controlling from above, the
principal stimulates change through the participation of the individual staff members. Thus,
rather than managing people through change, transformational leadership brings about change
through people” (p. 31). Traditional instructional leadership bears a transactional nature that
brings about compliance as it relates to the principal’s management and supervision of the

27
instructional program (Hallinger, 2003). Transformational leadership specializes at effecting
second-order changes through the collaborative culture of people committed to a common cause
through distributed leadership (Hallinger, 2003; Marzano et al., 2005).
If used in tandem, distinctions between the two leadership models complement the
criticisms between them and hold promise as a means for managing the demand of large-scale
reform set on improving teaching and learning (Leithwood, Jantzi, Watson, Levin, & Fullan,
2004). For example, transformational leaders distribute leadership and invite the participation of
teachers in school decisions, which produce positive effects on teacher satisfaction and school
climate. Traditional instructional leaders limit themselves to isolated heroic efforts that generate
a less desirable culture in teacher satisfaction (Hallinger, 2003). The sharp focus on teaching and
learning by a strong instructional leader as compared to a transformational leader with a school
reform focus exists as another historical difference (Hallinger, 2003). With regard to influence,
instructional leadership embraces behaviors that limit the direct influence of the principal in
monitoring the instructional program. Transformational leadership, on the other hand, extends
the influence of the principal through influencing others indirectly through shared leadership
(Hallinger, 2003).
In relation to contemporary views of instructional leadership, research illuminates a
convergence of instructional and transformational leadership behaviors. Instructional leaders are
becoming more transformational through the broad approach of sharing leadership and
reculturing schools to include professional learning communities (Louis et al., 2010; Louis &
Wahlstrom, 2011; Marks & Printy, 2003; Southworth, 2002). Marks and Printy (2003) stated:
“When principals who are transformational leaders accept their instructional role and exercise it
in collaboration with teachers, they practice an integrated form of leadership” (p. 376). In an

28
integrated approach to instructional leadership, principals impact teaching and learning
indirectly, as well as directly, with transformational leadership behaviors, such as by developing
a vision, mission, and goals and by establishing a climate for deep learning and change while
maintaining a supportive work environment (Marks & Printy, 2003).
Marks & Printy (2003) selected eight elementary schools, eight middle schools, and eight
high schools, all of which were nationally nominated for substantial progress in reform, to study
the combined effects of instructional and transformational leadership on pedagogy, assessment,
and student achievement. The results revealed that transformational leadership alone without an
instructional leadership focus results in a higher probability of inadequate school leadership.
When principals exercise transformational leadership in concert with shared instructional
leadership, the combined effect synergistically influences school effectiveness as measured by
pedagogical quality and student achievement (Marks & Printy, 2003).
Few empirical studies have examined the effects of integrated leadership (Marks &
Printy, 2003). In 2011, Greb conducted a quantitative study to determine whether using
instructional and transformational leadership in tandem produced a stronger effect on student
achievement. The inconclusive results only showed a nonsignificant correlation between male
principals who exercised integrated leadership and student achievement (Greb, 2011). When
comparing the effects of instructional leadership and transformational leadership on student
achievement and teacher satisfaction, the results indicated that instructional leadership elevated
the impact on student achievement and teacher job satisfaction over transformational leadership
(Shatzner, 2009). The study indicated that the leadership style of the principal significantly
impacted teacher satisfaction, whereas, school context significantly impacted student

29
achievement (Shatzner, 2009). Because instructional leadership produced higher job satisfaction,
one may conclude that strong instructional leaders share leadership in order to accomplish more.
With the onset of standards-based reform and accountability, shared leadership between
principals and teachers to improve teaching and learning has become an urgent inevitability
(Marks & Printy, 2003). Principals face increasing pressure to deliver better support to teachers
as they attempt to make curricular, instructional, and assessment changes, while monitoring the
progress of teaching and learning with increased accountability (Hattie, 2002; Louis et al., 2010).
Thus, compared to the original concept, shared instructional leadership redefines the leadership
function of the principal in comprehensive terms, which includes teachers in the process of
improving the instructional program and learning environment (Lambert, 2002). Definitions of
distributed, shared, or collaborative leadership vary widely depending on the person using the
term (Harris et al., 2007; Lee et al., 2012).
This study focuses on instructional leadership distributed to teachers as the principal and
teachers work together within collaborative structures of professional learning. In this way,
comprehensive instructional leadership functions as an integrated form of school leadership that
uses the tenets of both instructional and transformational leadership. Table 1 provides a brief
summary of the comprehensive leadership model discussed in this literature review.
The role of the principal has transcended the role of instructional supervisor to the role of
instructional collaborator in which the principal capitalizes on the leadership contributions of
teachers (Lambert, 2002). Sharing instructional leadership enables principals and teachers the
opportunity to work together to improve curriculum, instruction, and assessment (Louis et al.,
2010; Louis & Wahlstrom, 2010; Marks & Printy, 2003; Shatzer, 2009; Southworth, 2002). In
the new conceptualization of comprehensive instructional leadership, the principal operates as

30
the primary instructional leader in concert with other empowered teacher–leaders in the school.
The principal facilitates as the leader of instructional leaders (Lambert, 2002). The principal
empowers teachers to act as instructional leaders and to take responsibility for their professional
learning and instructional improvements. They provide structures in which teacher collaboration
can flourish (Marks & Printy, 2003; Shatzer, 2009). Teachers assist in creating cultural
conditions necessary for second-order change at the classroom level (Hattie, 2002; Shatzer,
2009).
Empirical results suggest that increased influence from teachers improves schools
significantly (Harris et al., 2007; Louis et al., 2010; Marks & Printy, 2003). Jackson and Marriot
(2012) discovered, however, that slightly over 25% of the schools demonstrated a high level of
shared leadership. The study also highlights a disturbing pattern in which schools of higher
poverty demonstrate less quality school leadership (Jackson & Marriot, 2012).
Principals who share instructional leadership elicit profound pedagogical changes in
teacher behavior in which teachers feel psychologically safe to innovate and to take risks (Harris
et al., 2007; Lineburg, 2010; Marks & Printy, 2003). Harris et al. (2007) concluded that widely
distributing leadership activities to classroom teachers improves teaching effectiveness and
learning engagement. When sharing leadership, teachers are able to create a greater difference on
student achievement than that of principals (Harris et al., 2007). Likewise, Lineburg (2010)
discovered the direct influence of collegial interactions among teachers is more significant in
changing teachers’ instructional practices.
Although the previous three studies support the direct and significant influence of teacher
collaboration in creating a supportive culture of instructional innovation, Louis et al. (2010)
determined from their extensive research that results appear mixed regarding the impact of

31
distributed leadership on student achievement. Increased influence from teachers in formal
decision making or leadership roles may have an insignificant impact on student achievement
without the strong instructional leadership of a principal (Louis et al., 2010). The findings offer
more evidence that an integrated approach of comprehensive instructional leadership with strong
leadership from the principal and teachers together support increased instructional improvement
and student learning (Louis et al., 2010; Louis & Wahlstrom, 2011; Marks & Printy, 2003;
Southworth, 2002).
When Louis et al. (2010) conducted the most comprehensive study of its kind regarding
educational leadership at all levels, three general themes emerged regarding the principalship: (a)
principals are most effective when collaborating toward a clear, common focus with
stakeholders; (b) principals most effectively create strong working relationships that impact
student achievement when they share leadership with teachers; and (c) principals who ask for
more input from stakeholders better impact the effectiveness of the school (Louis et al., 2010).
A leader who works to develop a collaborative culture within a school can foster a
positive school culture that influences student achievement (Ohlson, 2009; Sahin, 2011). Schools
with a positive school culture, common mission, and a school leader who establishes
collaborative relationships with teachers may realize decreased suspensions, increased
attendance, and ultimately increased student achievement (Ohlson, 2009). Likewise, shared
instructional leadership widely distributed both formally and informally among teachers,
teacher–leaders, and administrators improves the coherence and consistency within and between
schools (Lee et al., 2012). Table 1 summarizes the primary similarities and differences between
instructional leadership, transformational leadership, and the proposed model of comprehensive
instructional leadership that integrates the strengths of the other two models.

32
The Proposed Model of Comprehensive Instructional Leadership
The framework of this comprehensive set of leadership behaviors draws elements from
the instructional leadership model of Hallinger (1985) and the transformational leadership model
of Leithwood and Jantzi (2005). The framework also integrates the 21 Responsibilities of the
School Leader identified in Marzano et al.’s meta-analysis (2005). The framework divides the
model into two general categories based on the research regarding culture building. A widely
supported claim within literature regarding principal leadership touts the power of the principal
to impact school effectiveness and student achievement indirectly through creating a positive and
productive school culture (Hallinger, 2003; Leithwood & Jantzi, 2005; Marzano et al., 2005).
The research on school culture bears a dichotomy: the principal’s influence to impact the
teaching and learning conditions of the classroom and to impact the collaborative learning
conditions of teachers in the school (Leithwood & Jantzi, 2005). Thus, the leadership behaviors
of this integrated school leadership framework likewise align with these two categories of
cultures found in school leadership research—the student-learning environment and the teacher-
learning environment. Moreover, the level of trust within the school culture influences the
productivity of student learning and teacher learning (Bryk & Schneider, 2002; Harchar & Hyle,
1996; Louis & Wahlstrom, 2010).
The ability of principals to create a positive and productive culture implicitly and
explicitly permeates all responsibilities of the school leader (Marzano et al., 2005). The culture-
building power of the principal, which potently impacts teacher effectiveness and student
achievement, inherently exists while performing all the other school leadership behaviors in
concert (Hallinger, 2003; Leithwood & Jantzi, 2005; Marzano et al., 2005). For this reason, the
researcher opted not to treat culture building as a stand-alone behavior in the integrated

33
framework of comprehensive instructional leadership. The researcher makes the assumption that
certain sets of leadership behaviors construct different types of culture based on Hallinger’s
(2003) claim that his instructional leadership behaviors construct a high-performing culture of
students’ learning. Similarly, the researcher assumes that the transformational leadership
behaviors of this model correlate to the construction of an effective culture of professional
learning with some of the transformational behaviors correlating highly to building trust in
school culture.
This comprehensive leadership model sequences the leadership behaviors in the order of
how a principal may logically approach using the integrated leadership behaviors most
effectively to impact the culture of student learning and professional learning. Evidence suggests
that the instructional leadership focused on classroom instruction with a vertical, top–down
management structure is foundational for successful change (Louis et al., 2010). On the
foundation of good management, transformational leadership with a laterally-distributed,
bottom–up leadership structure can effect the greatest changes (Leithwood et al., 2004; Louis et
al., 2010). Additionally, research suggests that the better a professional learning community
collaborates with shared leadership within the school, the better the teachers will teach, and
students will learn in the classroom (Louis & Wahlstrom, 2011). The model sequences the
managerial leadership behaviors first and the transformational leadership behaviors last. The first
two domains contain more top–down, managerial behaviors. The last two domains include more
bottom–up, transformational behaviors. Because transformational approaches associate with
deep, innovative changes, the latter sequence of behaviors naturally aligns with the seven
responsibilities identified by Marzano et al. (2005) as essential in effecting second-order change
(See Appendix B).

34
Even though culture creating by principals indirectly impacts student achievement,
principals can directly and indirectly impact teacher effectiveness (Hallinger, 2003; Leithwood &
Jantzi 2005; Louis et al., 2010; Marzano et al., 2005). Indirectly, principals can impact teacher
effectiveness through building a collaborative culture of instructional innovation and support, but
directly, school leaders can impact teacher effectiveness through face-to-face interaction with
individual teachers involving observation and feedback (Louis et al., 2010). In the literature, this
type of traditional instructional leadership has been shown to impact student achievement, but it
has been difficult for principals to execute this direct-contact leadership—primarily for two
reasons: lack of time or lack of instructional expertise (Hallinger, 2003; Marks & Printy, 2003;
May & Supovitz, 2011). Lack of time may be attributed to ineffective school management or to
the size of the school.
Sequenced between both ends of the model, the middle domain of the comprehensive
instructional leadership framework represents school leaders modeling the ideals of
trustworthiness and innovation, which are executed by transformational leadership. The
leadership behaviors included in the middle domain are manifested and modeled when executing
all the other school leadership behaviors. Figure 1 provides an overview of the five sets of
leadership behaviors within the comprehensive instructional leadership model and visually
represents the organization of the model in relation to different cultures effecting different orders
of change.
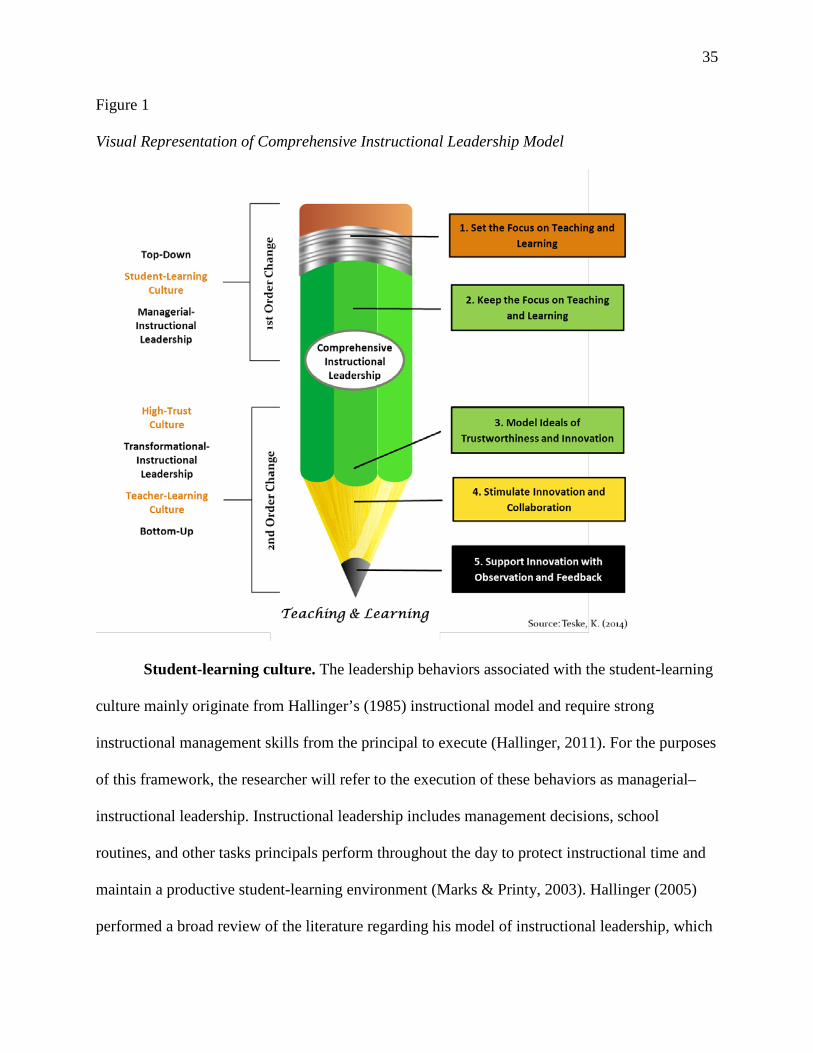
35
Figure 1
Visual Representation of Comprehensive Instructional Leadership Model
Student-learning culture. The leadership behaviors associated with the student-learning
culture mainly originate from Hallinger’s (1985) instructional model and require strong
instructional management skills from the principal to execute (Hallinger, 2011). For the purposes
of this framework, the researcher will refer to the execution of these behaviors as managerial–
instructional leadership. Instructional leadership includes management decisions, school
routines, and other tasks principals perform throughout the day to protect instructional time and
maintain a productive student-learning environment (Marks & Printy, 2003). Hallinger (2005)
performed a broad review of the literature regarding his model of instructional leadership, which

36
many have used the past 25 years. Many of the behaviors of this managerial–instructional
leadership section were advocated by Hallinger (2005) as high priority for the evolving role of
principals.
To be effective, the focus of instructional leadership must remain on teaching and
learning (Cotton, 2003; Hallinger, 2005; Louis et al., 2010; Southworth, 2002). In this
framework, managerial–instructional leadership sets and keeps the focus on creating a teaching
and learning culture of high expectations and support (Cotton, 2003; Hallinger, 2005). Effective
management of a school builds the foundation for successful change (Louis et al., 2010). School
improvement efforts generate the most success when principals effectively manage the teaching
and learning environment of their schools and achieve stability and consistency (Louis et al.,
2010). Schools with orderly teaching and learning environments exhibit well-established
processes, procedures, and policies that guide the smooth operation of the school (Bas & Yavuz,
2010; Marzano et al., 2005; McCoy, 2011). In contrast, schools that are not well managed, and
which lack essential infrastructure create a void of stable conditions necessary to produce deep
change (Louis et al., 2010; Marzano et al., 2005). The stable conditions provided by managerial–
instructional leadership interact synergistically with transformational–instructional leadership to
produce innovation and systemic improvement (Louis et al., 2010; Marzano et al., 2005).
The essential beginning of shaping the right kind of teaching and learning culture
happens when the principal sets the focus of the school on quality teaching and rigorous learning
through a shared vision, mission, core values and beliefs, and goals (Cotton, 2003; Hallinger,
2005, 2011; Marzano et al., 2005). Related to Bass’s concept of inspirational motivation (1985),
Leithwood and Jantzi (2005) identified promoting a vision for the school as a necessary
transformational leadership behavior to set the direction of a school. With the current and

37
complex landscape of school leadership, evidence supports that a compelling vision must be
shared among stakeholders, and must focus on providing challenging learning through quality
teaching (Cotton, 2003; Hallinger, 2005; Hattie, 2002; Lambert, 2002; Leithwood & Jantzi,
2005). A shared vision that inspires all stakeholders involves the principal stimulating active
collaboration among all stakeholders, including parents, teachers, students, support staff,
administrators, and even local community members, toward setting and achieving a common
vision (Bas & Yavuz, 2010; Cotton, 2003; Doyle & Rice, 2002; Hallinger, 2005; Harchar &
Hyle, 1996; Louis et al., 2010).
Establishing school-wide, specific student achievement goals and keeping them in the
minds of teachers and students embodies another necessary ingredient of setting and keeping the
focus on teaching and learning (Hallinger, 2005; Waters & McNulty, 2005). The instructional
leadership behavior that involves framing and communicating school-wide goals works to define
the school mission and to set the direction of the school (Hallinger, 2005, 2011; Leithwood &
Jantzi, 2005). In alignment with the school’s shared vision of rigorous learning and quality
teaching, the principal establishes specific, school-wide student achievement goals and plans that
become the focal point of the school’s collective efforts (Hallinger, 2005, 2011; Leithwood &
Jantzi, 2005; Marzano et al., 2005). Principals who frequently communicate and promote high,
achievable goals enhance the effectiveness of the school (McCoy 2011). The school leadership
behavior of communicating and reinforcing high-performance expectations for teachers and
students importantly contributes as well to setting the focus on teaching and learning (Leithwood
& Jantzi, 2005). Providing clear expectations outlining standard operating policies, procedures,
and practices that staff and students follow creates an orderly teaching and learning environment
within the structure necessary for school effectiveness (Marzano et al., 2005; McCoy, 2011).

38
Effective principals generate a collective commitment to a shared vision, to school
achievement goals, and to performance expectations through participative decision making
(Fullan, 2008; Kotter, 1996; Senge, 1990). To accomplish this, principals must allow staff input
on important decisions (Cotton, 2003; Hallinger, 2005; Marzano et al., 2005). When shaping
school policies and procedures, school leaders can use school leadership teams for decision
making or to provide opportunities for interested staff members to participate (Cotton, 2003;
Hallinger, 2005; Marzano et al., 2005). Continuous improvement planning that positively
impacts school effectiveness involves a wide range of stakeholders (Cotton, 2003; Hallinger,
2005; Marzano et al., 2005).
Hallinger (2011) asserted that four, school leadership behaviors develop a school-
learning environment and build a positive culture and climate focused on teaching and learning.
These four behaviors involve protecting instructional time, maintaining high visibility, providing
incentives for successful learning, and providing recognition of effective teaching.
Within Hallinger’s (1985) instructional leadership model, these four behaviors function to
maintain the focus on teaching and learning. The instructional leadership behavior of protecting
instructional time is manifested when the principal minimizes interruptions that impact the
teaching and learning environment of the classroom and shields teachers from internal or
external distractions (Cotton, 2003; Hallinger, 1985, 2011; Marzano et al., 2005). Therefore,
school-wide disciplinary procedures that allow the removal of disruptive students support this
(Cotton, 2003; Marzano et al., 2005). Along with protecting instructional time, effective school
leaders maximize the instructional efforts of the teachers and instructional resources of the
school by aligning work to the vision and goals of the school (Cotton, 2003; Marzano et al.,
2005).

39
Effective school leaders maintain high visibility by visiting classrooms as a daily routine
and by interacting with teachers and students in hallways throughout the school as well as with
other stakeholders when opportunities arise (Cotton, 2003; Hallinger, 2005; Marzano et al.,
2005). High visibility provides school leaders with frequent opportunities to model desired
values and beliefs (Hallinger, 2005). Maintaining high visibility also provides frequent
communication with stakeholders. Visibility and communication in the community outside the
school additionally allow principals to advocate for their schools to parents, to the central office,
and to the community at large (Cotton, 2003; Marzano et al., 2005). The more visible principals
make themselves, the more face-to-face opportunities they will have to build relationships with
stakeholders on a personal level (Cotton, 2003).
Leithwood and Jantzi (2005) identified the transactional leadership behavior of actively
managing by exception as applicable to the school setting. Actively managing by exception
occurs when leaders attempt to actively prevent anticipated problems, whereas passive
management by exception ensues when leaders reactively deal with problems as they come
(Bass, 1984). Marzano et al. (2005) identified the anticipatory leadership skill of accurately
predicting what may go wrong throughout the day as having a significant impact on student
achievement. Principals must proactively problem solve (Bass, 1984; Leithwood & Jantzi, 2005;
Marzano et al., 2005; Robinson, 2010).
Ineffective principals underuse contingent rewards to recognize teachers in K–12
education, but effective school leaders use rewards to recognize the hard work or exemplary
results of teachers (Cotton, 2003; Hallinger, 1984, 2005; Marzano et al., 2005). Research also
supports that celebratory recognition of teachers and students positively impacts student
achievement (Cotton, 2003; Hallinger, 2005; Marzano et al., 2005). Effective use of a rewards

40
system reinforces the mission and goals of the school (Hallinger, 2005). Moreover, the
instructional leadership behavior of monitoring student progress initiates the collaboration
between school leaders with staff to recognize when efforts fall short of expectations, and when
to intervene if necessary (Cotton, 2003; Hallinger, 2005; Hattie, 2002). With shared leadership,
collaborative teams of school professionals can determine when to intervene as they focus on
student progress and growth as measured with quality assessment data (Hallinger, 2005; McCoy
2011).
High-trust culture. Relationships of trust need to be noted as key indicators of a well-
functioning, productive organization (Bryk & Schneider, 2002; Harchar & Hyle, 1996; Louis &
Wahlstrom, 2010). Louis and Wahlstrom stated: “Neither organizational learning nor
professional community can endure without trust—between teachers and administrators” (2010,
p. 55). Trust supports achievement of students through healthy professional communities with
quality collaboration focused on improving teaching (Bryk & Schneider, 2002; Harchar & Hyle,
1996; Louis & Wahlstrom, 2010).
Principals should establish a culture of high trust in which the teaching and learning
conditions promote teacher satisfaction and commitment, because a positive atmosphere has a
constructive impact on student learning (Cotton, 2003; Leithwood & Jantzi, 2005; Louis &
Wahlstrom, 2011; McCarley, 2012; Shatzer, 2009). In the culture of a school, how adults in the
school treat each other and work together affects the learning environment, as well as how
students experience school (Cotton, 2003; Louis & Wahlstrom, 2011). School culture starts with
the leadership and behavior of adults (Cotton, 2003; Louis & Wahlstrom, 2011). Students in
high-trust schools feel safe and secure, enjoy teachers who care about them, and experience
greater challenge in learning (Bryk & Schneider, 2002; Vodicka, 2006).

41
Trust impacts collective commitment and satisfaction (Bryk & Schneider, 2002;
Robinson, 2010). Trust and collective commitment wane, for example, when teachers observe
others reducing their hard work to improve instruction or failing to fulfill agreed-upon
commitments (Robinson, 2010). Principals who display trustworthy leadership create a
transparent climate that influences teachers to display openness (Butler, 2012). When principals
extend trust, and when teachers feel trusted, it serves as a significant predictor for risk-taking
behaviors and a better attitude about innovation (Bryk & Schneider, 2002; Louis et al., 2010).
Bass’s (1985) conceptualization of idealized influence offers insight in how leaders
model the ideal of trustworthiness to create innovation. Trust-inspiring leaders influence others
by example. They lead with caring communication, confidence, conviction, and competence,
which promote trust, respect, admiration, and even emulation (Bass, 1985; Vodicka, 2006).
When applying the concept of idealized influence to the educational setting, principals model the
ideal of trustworthiness to formulate a high-trust culture of commitment and satisfaction (Cotton,
2003; Leithwood & Jantzi, 2005). This type of idealized influence from the principal leads
teachers along a psychological safe path of questioning the status quo and taking innovative risks
(Leithwood & Jantzi, 2005; Marzano et al., 2005)
High visibility of the principal enhances the modeling of desired ideals, values, and
beliefs (Hallinger, 2005). Moreover, when principals make themselves highly accessible to
teachers who may have concerns, such effort maintains lines of open and caring communication
to resolve issues that may otherwise inhibit the effectiveness of the school (Cotton, 2003;
Marzano et al., 2005). Relationships of trust built on the foundation of communication between
the principal and teachers prove especially important in successfully facing challenges as a
unified staff (Marzano et al., 2005).

42
Regarding change, effective transformational leaders model the leadership ideal of
optimism (Cotton, 2003; Marzano et al., 2005). Marzano et al. (2005) described the leadership
behaviors of optimism as follows: (a) school leaders inspire teachers to accomplish challenging
goals; (b) school leaders drive momentum behind school-wide changes; and (c) school leaders
project confidence in the ability of teachers to accomplish goals. Bass’s work (1985) also
acknowledged the importance of a leader in maintaining a positive attitude of personal
confidence and confidence in others.
Strong instructional leaders demonstrate conviction in what they believe regarding
teaching and learning (Cotton, 2003; Marzano et al., 2005; Youngs & King, 2002). Marzano et
al. (2005) contended that school leaders and teachers perform their best when they act according
to strong beliefs related to their own efficacy and the efficacy of others, particularly when it
comes to teaching and learning. Youngs and King (2002) asserted that principals can change
school conditions and instructional practices through strong beliefs. School leaders’ beliefs can
effect change in school climates and teaching practices when they are related to teaching and
learning, expressed with oral and written language, and manifested through leadership behaviors
(Marzano et al., 2005; Youngs & King, 2002).
Principals’ knowledge and expertise in instructional matters prove invaluable to strong
instructional leadership in which they are able to provide quality guidance to teachers regarding
teaching and learning (Hallinger, 2003, 2005, 2011; Marks & Printy, 2003; Marzano et al., 2005;
Shatzer, 2009; Stewart, 2006). Without this deep knowledge base of instructional matters,
principals find hands-on facilitation and modeling of intellectual stimulation difficult (Hallinger,
2003, 2005, 2011; Hattie, 2002; Marks & Printy, 2003; Marzano et al., 2005; Shatzer, 2009;

43
Stewart, 2006)). The principals’ instructional competence enlarges the teachers’ confidence and
trust in their abilities to lead the school (Bryk & Schneider, 2002; Vodicka, 2006).
Marzano et al. (2005) discussed the importance of modeling the ideals of innovation
related to the principal functioning as a change agent. School leaders who act as change agents
must model values and practices that support the instructional innovations of teachers, such as
empowering teachers to make decisions to innovate and protecting those who experiment from
risks (Bass, 1985; Cotton, 2003; Marzano et al., 2005). School leaders create a psychologically
safe culture of innovation by suspending judgments and giving teachers permission to make
errors in the name of innovation (Cotton, 2003; Fullan, 2008). School leaders acting as change
agents model questioning the status quo, thinking divergently, and taking risks to make changes.
Implementing collaborative changes with teachers may push them to the edge of their
competence and cause conflict (Cotton, 2003; Marzano et al., 2005). School leaders bear a tall
order to be flexible and comfortable with managing change while remaining open to conflict and
differing opinions that may arise (Marzano et al., 2005).
Teacher-learning culture. The tenets of transformational leadership help to foster a
collaborative, teacher-learning culture of innovation and support (Hallinger, 2005; Leithwood &
Jantzi, 2005; Marzano et al., 2005). The school leadership behaviors of the teacher-learning
culture mainly comprise Leithwood’s set of transformational leadership behaviors (Leithwood &
Jantzi, 2005). For the purposes of this framework, the researcher refers to the group of these
behaviors as transformational–instructional leadership because they focus on making innovative,
second-order improvements at the classroom level. Transformational–instructional leadership
behaviors effectively create a strong organizational culture of collective commitment and job
satisfaction in which schools experience high levels of collective teacher efficacy and

44
organizational learning (Leithwood & Jantzi, 2005). Professional learning cultures of
collaboration and support strongly correlate with instructional innovations, leading to quality
teaching and improved practices in the classroom (Cotton, 2003; Hallinger, 2005; Leithwood &
Jantzi, 2005; Louis & Wahlstrom, 2011).
In reference to the power of professional culture, Louis and Wahlstrom (2011) stated:
It’s [culture’s] a critical element of effective leadership, and there is increasing evidence
from both private and public organizations that organizations with stronger cultures are
more adaptable, have higher member motivation and commitment, are more cooperative
and better able to resolve conflicts, have greater capacity for innovation, and are more
effective in achieving their goals. (p. 52)
With the investigation of vast approaches that create collaborative cultures, the role of the school
leader in setting the focus and building the culture emerges as the hinge of success in instituting
collaboration throughout the school (Beatty, 2007; Cotton, 2003; Hallinger, 2005; Leithwood &
Jantzi, 2005; Marzano et al., 2005).
Stimulating collaboration for instructional innovation at the classroom level relates
directly to Bass’s (1985) concept of intellectual stimulation. Bass’s original work (1985)
described intellectual stimulation as the encouragement of innovation and divergent thinking, the
empowerment of others to challenge norms and take risks, and the climate-creation of creativity.
Instructional leadership that incorporates elements of transformational leadership inspires a
collective commitment along a common direction of instructional innovation toward excellence
(Hallinger, 2005; Hattie, 2002; Leithwood & Jantzi, 2005; Louis & Wahlstrom, 2011).
Within standards-based education, one of the first steps required to build a desired culture
of professional learning that stimulates instructional innovation begins with principals utilizing

45
challenging standards to set and communicate an instructional vision of what quality teaching
looks like with goals and expectations to direct efforts toward deep change and innovation
(Cotton, 2003; Hallinger 2005, Marzano et al., 2005). Effective school leaders formulate a vision
to harness collaborative power and create cohesion and coherence through the change process
(Cotton, 2003; Harchar & Hyle, 1996; Marzano et al., 2005).
Once an instructional vision is in place, school leaders are prepared to stimulate
instructional innovation with cutting-edge teaching practices presented, modeled, and discussed
as continuous training throughout the school year (Hattie, 2002; Marzano et al., 2005). Principals
of high-achieving schools promote professional development on a regular basis (Cotton, 2003;
Hallinger, 1985, 2003, 2005; Leithwood & Jantzi, 2005; Minus, 2010; Southworth, 2003). One
of the most important resources for teacher effectiveness is professional development (Marzano
et al., 2005).
Next, effective school leaders create a collaborative culture of professional learning in
which teachers are empowered as instructional leaders to challenge the status quo and innovate
with curriculum, instruction, and assessment (Cotton, 2003; Doyle & Rice, 2002; Leithwood &
Jantzi, 2005). Most importantly, the professional learning culture of the school must focus on
improving the craft of teaching (Hallinger, 2005; Hattie, 2002). The content knowledge of
innovative stimulation should focus on pedagogy, which includes knowing how to organize
curriculum for lesson delivery and how to assess learning; principals need to know how to teach
teachers how to teach (Hattie, 2002; Marzano et al., 2005; Southworth, 2002).
Innovative stimulation through principal and teacher collaboration provides a natural
opportunity to distribute instructional leadership to teachers (Marks & Printy, 2003). Shared
instructional leadership comprises principal and teacher collaborative leadership that produces

46
professional learning necessary for innovation and deep change (Printy & Marks, 2006). Thus,
innovative stimulation should be a collaborative process directed by the principal with a shared
delivery from teachers within the school (Lambert, 2002). Principals who treat teachers in their
schools as entrusted instructional leaders empower them to question the status quo, make
decisions, and take risks through experimentation with instructional innovations (Cotton, 2003;
Lambert, 2002; Printy & Marks, 2006).
Effective collaboration within professional learning communities abounds when school
conditions include the structures and routines that solidify how teachers work together while
pursing continuous professional learning and innovation (Cotton, 2003; Printy & Marks, 2006).
Principals participating and modeling in collaborative structures stimulates innovative
productivity at the classroom level (Cotton, 2003; Lambert, 2003). Teaching practices change the
most, however, through the direct influence of teacher-to-teacher collaboration and collegial
interactions (Lineburg, 2010). Collaboration between teachers provides the basis for professional
learning and teacher leadership (Printy & Marks, 2006). Thus, effective school leaders establish
and maintain collaborative structures within the schools (Harchar & Hyle, 1996; Printy & Marks,
2006).
Louis and Wahlstrom (2011) discovered two courses of action that stifle innovative
stimulation: (a) when principals share instructional leadership with teachers, yet cease to
stimulate new ideas and (b) when principals stimulate new ideas, yet refuse to provide
collaborative structures with the extension of opportunities for teachers to lead. These two
behaviors negatively affect the willingness of teachers to work hard for change (Louis &
Wahlstrom, 2010). Principals can counteract these negative effects by stimulating new ideas and
extending trust to teachers to innovate through shared leadership. When Hattie’s (1999) meta-

47
analysis compared effect sizes on student learning, most innovations introduced in schools to
improve achievement exhibited .4 of a standard deviation. School cultures conducive to deep
implementation of innovations yield a high likelihood of positive gains in student achievement
(Hallinger, 2005; Hattie, 1999; Marzano et al., 2005).
Highly collaborative cultures focused on improving instruction increase the number of
instructional conversations as a by-product (Cotton, 2003; Hattie, 2002). The facilitative
instructional leadership of the principal acts as an indispensable catalyst that stimulates
instructional conversations between teachers, which, in turn, produces changes in instruction
(Cotton, 2003; Louis & Wahlstrom, 2010). Principals need to create an expectation where the
focus of professional conversations in the school revolves around quality teaching and
challenging learning (Hattie, 2002). Within the context of shared instructional leadership,
teachers talking to teachers about instruction elicit innovation and instructional improvement
(Cotton, 2003; Printy & Marks, 2006). Instructional conversations only have value if they occur
around the intent of advancing the school’s instructional and learning goals (Hattie, 2002).
Reflections on instructional practice take place more frequently as well due to
professional collaboration and community learning (Prytula, 2012). Learning in context, which
leads to deep change, requires more reflection on the part of teachers and school leaders (Louis
& Wahlstrom, 2011). With the difficulty of taking time to reflect during the daily grind of
teaching, principals must provide routine opportunities in the school to reflect on instruction and
student learning on a regular basis (Louis & Wahlstrom 2011).
The foundation of this work lies in the instructional leadership behavior of the principal
taking a hands-on approach with teachers to coordinate and manage the curricular, instructional,
and assessment program of the school (Hallinger, 1985, 2005; Marzano et al., 2005). This work,

48
however, bears the greatest impact when principals act as strong instructional leaders and
facilitate the instructional leadership of teachers and when principals collaborate in concert with
teachers as full professional partners (Marzano, Waters, & McNulty, 2005; Printy & Marks,
2006). Teachers are more likely to engage deeply in professional learning when teachers and
principals find a doable balance between maintaining the status quo regarding what works and
making changes for innovation (Fullan, 2008; Printy & Marks, 2006).
Principals develop teacher effectiveness and support instructional innovation by creating
a supportive culture equal to the instructional improvement expected by the principal (Cotton,
2003; Hallinger, 2005; Leithwood & Jantzi, 2005). This set of school leadership behaviors has
transformational roots in Bass’s (1985) individualized consideration and support. Bass’s (1985)
conceptualization of individualized consideration included descriptions such as understanding
individual needs, developing individuals with coaching, providing opportunities for growth, and
establishing a supportive climate.
To develop teacher effectiveness and support innovation, principals need to monitor and
evaluate instruction with feedback to teachers (Cotton, 2003; Hallinger, 1985; Marzano et al.,
2005). Deep instructional knowledge of the principal allows for greater specific feedback to
teachers (Marzano et al., 2005; Robinson, 2010). Hattie (1999) concluded that the most
important factor to improving performance is feedback. This includes observing lesson plans and
lesson delivery in the classroom, evaluating teaching, and monitoring school practices that have
potential impact on student achievement (Marzano et al., 2005). As Marzano et al. (2005)
pointed out, however, quality feedback does not happen by accident. Frequent feedback must
happen by design. Principals who design a systematic way to provide a wide range of continuous

49
feedback effectively develop teachers and support instructional innovation (Cotton, 2003;
Hallinger, 2005; Marzano et al., 2005).
In addition to the support principals offer through observation and feedback as teachers
change instructional practices, effective school leaders expand their influence to develop teachers
through follow-up training performed by instructional coaches (Cotton, 2003; Hallinger &
Murphy, 1985, Hallinger, 2003, 2005; Leithwood & Jantzi, 2005). Instructional coaching aimed
at ongoing support to implement new teaching practices yields significant changes in the
instructional behavior of teachers.
Knight and Cornett (2008) reported from a study conducted by Knight (2007) that 85% of
teachers who attended a summer professional development implemented the strategies upon
receiving instructional coaching. With no control group for this study, the results indicated a
70% increase over the results of a similar study conducted by Showers (1983), which indicated
the rate of implementation as 15% without follow-up coaching. Thus, follow-up coaching by
school leaders and instructional coaches substantiates the importance of continued support in
making instructional changes at the classroom level. Principals can also promote professional
growth by requiring and discussing professional growth plans with teachers (Nunnelley, Whaley,
Mull, & Hott, 2003).
Growth-Based Measurement of Student Achievement
Zvoch and Stevens (2006) examined the reliability of using status models and growth
models to measure student achievement. Among the four different models, the results of the
study suggest that the only reliable and nonbiased model for evaluating school performance was
measuring growth achievement in student learning averaged across cohorts (Zvoch & Stevens,
2006). Status achievement in student learning closely relates to student demographics, and

50
student background is the most significant predictor of status achievement (Francera & Bliss,
2011; Leithwood & Jantzi, 2000; Zvoch & Stevens, 2006). Leithwood and Jantzi (2000) noted
that the majority of educational effects studies attribute socioeconomic status as the dominant
factor impacting the variation found in the student achievement levels of schools. Thus, one may
assume a more nonbiased measurement of effective school leadership unrelated to student
background would be a growth-based model across cohorts.
Value-added models use statistical growth models to evaluate teacher effectiveness on
student learning and are being used by some states and districts in teacher evaluation and
principal evaluation (Di Carlo, 2012; Lipscomb et al., 2010). The value-added models attempt to
measure the growth of learning for each student during the current school year to assess teacher
and principal effectiveness and aim at controlling measurable factors, which are out of the
teacher’s control, like student background and school characteristics (Di Carlo, 2012; Lipscomb
et al., 2010). The principal’s effectiveness is determined in most cases by averaging the growth
of the teachers in the school (Lipscomb et al., 2010). Lipscomb et al. (2010) suggested that
multiple years of data showing the principal’s improvement may be an effective way to evaluate
principals.
Gordon, Kane, and Staiger (2006) conducted a study to find out the correlation between
socioeconomic background and student background (student race–ethnicity, gender, participation
in federal lunch-subsidy programs, and English language learner status). When using a growth
model that measured student achievement compared to baseline data, the researcher concluded
that as long as growth measures use student baseline test scores, it makes only a modest
difference whether or not there were additional controls for demographic characteristics and
family background (Gordon et al., 2006).

51
Conclusion
With the conditions of education ever changing and becoming more complex with each
passing decade, the changing complexity continues to demand more sophisticated models of
school leadership that can systemically improve teaching and learning throughout schools
(Hallinger, 2003, 2005, 2011; Leithwood et al., 1999; Marks & Printy, 2003; Shatzer, 2009;
Stewart, 2006). Since 1978, school leadership employed by principals has evolved from a top–
down list of managerial behaviors focused on teaching and learning, to a bottom–up set of
collaborative behaviors that foster innovation and school reform, and more recently to an
integrated approach of shared instructional leadership necessary to implement standards-based
education (Hallinger, 2003, 2005, 2011; Marks & Printy, 2003; Shatzer, 2009; Stewart, 2006).
Instructional leadership and transformational leadership are well-known leadership models in
educational research. Recent evidence suggests a convergence of these two leadership styles in
which principals are integrating both approaches to lead instructional improvement (Hallinger,
2003, 2005, 2011; Marks & Printy, 2003; Shatzer, 2009; Stewart, 2006).
In the literature review, the researcher discovered that Hallinger’s (1985) instructional
leadership model and Leithwood’s (2005) transformational leadership model effectively measure
the school leadership of principals and are more commonly used than any other school leadership
model (Hallinger 2003, 2005, 2011; Louis et al., 2010; Marks & Printy, 2003; Shatzer, 2009;
Stewart, 2006). These two prolific models of school leadership have been used by principals for
different reasons at different times throughout the history of education (Hallinger, 2003;
Leithwood & Jantzi, 2005; Marks & Printy, 2003; Shatzer, 2009). Both models have been
demonstrated to have a significant impact on student–learning outcomes (Robinson et al., 2008).
Each of the two models has strengths and weaknesses, and when used in tandem, the

52
comprehensiveness of the approach seems to synergistically complement the leadership of the
principal (Leithwood et al., 2004).
From these widely accepted models of school leadership, the researcher developed a new
integrated model intended to measure the effectiveness of school leadership in a more
comprehensive way that captures the current approach of principals. The researcher augmented
and substantiated the new comprehensive model with the 21 research-based leadership habits
identified in Marzano’s (2005) meta-analysis. The integrated approach of instructional leadership
and transformational leadership inherently serves as a comprehensive model of school leadership
that fully represents the current research in the literature (Lambert, 2002; Louis et al., 2010;
Printy & Marks, 2006).

53
Chapter III
Design and Methodology
Introduction
This mixed-methods study explored the effects of middle school and junior high school
leadership on growth in student learning. The newly developed comprehensive instructional
leadership model designed for this study measured the school leadership exerted by middle
school and junior high principals who consented to involve their schools in the research project.
The survey instrument consisted of 21 leadership behaviors and three cultures (see Appendix A).
The researcher compiled the 21 leadership behaviors primarily from two leadership models—
instructional leadership and transformational leadership. Both models are common in educational
research and hold claim as effective measures of school leadership. Hallinger's (1985) model
measured instructional leadership and Letihwood's (2005) model measured transformational
leadership. Marzano's meta-analysis (2005) served as a research reference to augment and
substantiate the compilation of leadership behaviors included in the comprehensive model
developed for this study and identified which leadership practices are most likely to create
second-order change (see Appendix B).
This study sought to answer two primary research questions with the same web-based
survey (see Appendix A). Quantitative methodology addressed the first question and qualitative
methodology addressed the second question. The researcher worded the respective research
questions as follows.
1. What differences exist in leadership behaviors between middle school principals who
lead schools of high growth in learning and those who lead schools of low growth?

54
2. What specific actions performed by principals align with effective leadership
behaviors found in research?
Moreover, the study will consider four hypotheses:
1. (H1) Effective middle school principals practice an integrated approach of
instructional leadership behaviors and transformational leadership behaviors.
2. (H2) Managerial–instructional leadership behaviors correlate highly to the building of
strong student-learning cultures of high expectations and support.
3. (H3) Transformational–instructional leadership behaviors correlate highly to the
creation of a collaborative, teacher-learning culture of innovation and support and a
high-trust culture of commitment and satisfaction.
4. (H4) Modeling the ideals of trustworthiness and innovation correlates highly to a
high-trust culture of commitment and satisfaction.
This research study considered the leadership of middle school and junior high school
principals of high-growth schools and low-growth schools to determine if any differences existed
between them. As an interest, the researcher endeavored to determine if there was a difference in
the type of culture middle school principals build between schools of high growth and low
growth. Principals predominately build two types of culture, which entails the conditions that
impact the teaching and learning environment of the classroom and the conditions that affect the
professional learning community of the school (Hallinger, 2003; Leithwood & Jantzi, 2005;
Marzano et al., 2005). Likewise, principals build or hinder a high-trust culture of commitment
and satisfaction (Bryk & Schneider, 2002; Harchar & Hyle, 1996; Louis & Wahlstrom, 2010).
Hallinger’s (1985) instructional leadership model possesses a top–down, managerial
focus on improving teaching and learning at the classroom level. Leithwood's (2005) set of

55
transformational leadership behaviors includes teachers in the transformational process of school
reform though professional learning and shared leadership within collaborative structures.
Quantitative methods determined if middle school principals exhibited differences in the
integration of both models. The qualitative methods of this mixed-methods study identified
specific actions that principals perform to execute the school leadership behaviors found in the
research.
Research Design
The first research question asked: What differences exist in leadership behaviors between
middle school principals who lead schools of high growth in learning and those who lead schools
of low growth? The design of a 5-point Likert survey, which measured the building principals’
level of use of the 21 research-based school leadership behaviors and creation of three cultures
listed in the comprehensive leadership model, answered the first research question (see Appendix
A). Principals exude the most influence on learning through the culture they foster in the
classrooms and throughout the school (Hallinger, 2003; Leithwood & Jantzi, 2005; Marzano et
al., 2005).
The second research question examined: What specific actions performed by principals
align with effective leadership behaviors found in research? The design of the open-ended survey
items answered the second research question. The directions of the survey requested the
participants to give at least one example of a specific action principals exhibited for each
leadership behavior. The open-ended survey items corresponded to each leadership behavior,
excluding the three culture-building behaviors. The survey collected other descriptive data
related to the participants’ position, the number of years in the position, and the name of their
schools.

56
Eight subject-matter experts validated the content of the survey prior to administering the
survey to the principals and teachers of each school taking part in the study (see Table 2). The
scale-level content validity index (S-CVI) as calculated with the mean of the item-level content
validity indexes (I-CVI) was .98. This was well over .90, which was the acceptable rate for S-
CVI (Polit & Beck, 2006). The mean of the expert proportional relevance (EPR) was also .98.
Table 2 displays that only one expert disagreed with three items. All the other items of the survey
were rated as valid content for the function of school leadership with a 3 or 4 on a 4-point
relevance scale.

57
Table 2
Content Validity Ratings of Eight Experts for the Comprehensive Instructional Leadership
Survey
Item Exp. 1
Exp. 2
Exp. 3
Exp. 4
Exp. 5
Exp. 6
Exp. 7
Exp. 8
Total Agreed
Item CVI
1 X X X X X X X X 8 1.00 2 X -- X X X X X X 7 .875 3 X X X X X X X X 8 1.00 4 X X X X X X X X 8 1.00 5 X X X X X X X X 8 1.00 6 X X X X X X X X 8 1.00 7 X X X X X X X X 8 1.00 8 X X X X X X X X 8 1.00 9 X X X X X X X X 8 1.00 10 X X X X X X X X 8 1.00 11 X X X X X X X X 8 1.00 12 X X X X X X X X 8 1.00 13 X X X X X X X X 8 .875 14 X -- X X X X X X 7 1.00 15 X X X X X X X X 8 1.00 16 X X X X X X X X 8 1.00 17 X X X X X X X X 8 1.00 18 X X X X X X X X 8 1.00 19 X -- X X X X X X 7 .875 20 X X X X X X X X 8 1.00 21 X X X X X X X X 8 1.00 22 X X X X X X X X 8 1.00 23 X X X X X X X X 8 1.00 24 X X X X X X X X 8 1.00 Mean *I-CVI .98 Mean EPR 1.00 .875 1.00 1.00 1.00 1.00 1.00 1.00 *EPR .98 *I-CVI: Item-level Content Validity Index. *EPR: Expert Proportional Relevance
All eight of the experts served in the Twin Falls School District, in Twin Falls, Idaho, and
represented a population of female and male principals with high and moderate years of
experience at every level. Table 3 lists the names of the eight principalship experts, their years of
experience as head principal, and their most recent level of experience.

58
Table 3
Eight Principalship Experts Who Validated Content of the Survey
Name of Principal Years as Experience Most Recent Level John Hyatt 34 Middle School Ben Allen 20 High School L.T. Erickson 3 Middle School Shari Cowger 3 Elementary School Jim Brown 5 Middle School Brady Dickinson 4 High School Roger Keller 5 High School Beth Olmstead 14 Elementary School
Participants
Using Idaho’s new accountability system called the Five Star Rating System, the
researcher selected the participating schools. The Five Star Rating System of schools in Idaho
consists primarily of a growth model. Idaho received approval to use annual growth measures in
their accountability system through a federal waiver (Idaho Department of Education, 2013). The
accountability system blends proficiency-rate achievement (25%) with annual-growth
achievement (75%). Fifty percent of the annual-growth achievement includes the entire student
body, 25% of the annual-growth achievement consists of a combined super-subpopulation of all
at-risk students and minorities. Additionally, at the high school level, the system includes
postsecondary preparedness measures with a differing percentage for annual-growth
achievement (Idaho Department of Education, 2013).
A school may earn 100 points for their star rating: 5-star schools earn between 83 and
100 star points; 4-star schools receive between 67 and 82 star points; 3-star schools reach
between 54 and 66 star points; 2-star schools attain between 40 to 53 star points; and 1-star
schools achieve between 0 to 39 star points. A middle school, junior high school, intermediate
school, or elementary school may earn 25 star points for the category Achievement, which is

59
based on proficiency. These schools may also earn 50 star points for the category Achievement
to Growth, which is established on the annual growth of all students. Lastly, these schools may
earn 25 star points for the category At-Risk Achievement to Growth, which is centered on the
annual growth of an at-risk subpopulation of students. The at-risk subgroup includes free and
reduced lunch eligible students, students with disabilities, limited English proficient students,
and minority students. Minority students may encompass American Indian/Alaskan Native,
Asian, Black/African American, Hawaiian/Other Pacific Islander, Hispanic/Latino, or two or
more races. High schools possess a differing point system that entails an additional category of
postsecondary preparedness.
Using this two-year average, the combined 75 star points based solely on Achievement to
Growth, with all students 50 points and at-risk subpopulations 25 points, were used to identify
five middle schools of high growth and five middle schools of low growth. Some of the
identified schools included junior high schools with a grade configuration of seven through nine,
but middle schools and junior high schools with student populations fewer than 250 students
were not selected. No elementary schools, intermediate schools, or high schools were selected.
In the state of Idaho, 100 traditional middle schools and junior high schools exist. At the
high-growth end, 24 of these schools exhibited a two-year average greater than or equal to 55
star points within the combined Achievement to Growth category. At the low-growth end, 11 of
these schools attained a two-year average equal to or less than 39 star points in the same
combined category. All the schools selected for this study came from these two pools of possible
participants. Student enrollment size and the willingness of the school to participate in the
research project ultimately determined the participants from these two pools of schools. The
researcher did not contact all of the possible participants to attain the desired sample size.

60
To calculate star points, the Idaho Department of Education used summative data from
Idaho’s accountability test called the Idaho Standards Achievement Test (ISAT) in reading,
language usage, and mathematics. For each Achievement to Growth category separately, a
school may earn up to five growth points for reading, up to five growth points for language
usage, and up to five growth points for mathematics. The percentage of total growth points
earned out of 15 points (reading, language usage, and mathematics all together) is then applied to
calculate the star points for each Achievement to Growth category separately. For example, in
the Achievement to Growth category for all students, if a school earned three growth points for
reading, three growth points for language usage, and three growth points for mathematics, the
school would earn nine total growth points out of 15 points possible, or 60%. Applying 60% to
the 50 star points possible awards the school 30 star points for that particular category.
To assign growth points for each Growth to Achievement category, the five-point scale
uses a statistical calculation called student growth percentile (SGP). This normative measure of
individual student growth uses whole numbers from one to 99. This measure uses ISAT test
scores over two or more grade levels and aims to answers the question: “What is the percentile
rank of a student compared to all Idaho students with similar score histories?” For example, a
student who earns an SGP of 70 grew as much or more than 70 percent of his or her academic
peers. The more a student grows from spring to spring as compared to his academic peers who
had similar score histories, the student will earn a higher SGP.
The median SGP is calculated by school for each subject for both the total student body
and the at-risk subgroup. The median SGP describes the typical growth status of students in
school for all three of the particular subjects separately and for each Growth to Achievement
category separately. The median SGP is calculated by rank ordering all the students in a school

61
or at-risk subgroup and selecting the middle number of the median. At this point, two five-point
scales may be used to determine the level of growth points earned by a school for each
Achievement to Growth category, depending on whether the median SGP of a school or the at-
risk subgroup is larger or smaller than the adequate growth percentile (AGP).
AGP is a criterion-referenced measure relative to proficiency. The measure uses whole
numbers from one to 99 to show how far away a student is from proficiency. The measure
answers the question: How much growth would a student have to make to reach proficiency in
three years or by tenth grade? If the SGP is greater than or equal to the AGP, the growth points
are awarded to a school on a more favorable scale (see Figure 2). Conversely, if the SGP is less
than the AGP, growth points are given to a school on a less favorable scale (see Figure 2). Figure
2 displays the dichotomy of scales that are used to award growth points depending on whether
SGP is greater than or equal to AGP.
Figure 2
Adequate Growth Flowchart to Determine Points for Meidan SGP Ranking
Source: Idaho Department of Education (2013)

62
For this study, the researcher selected schools with student populations greater than 250
students based on the two-year average of star points for growth. Table 4 shows the schools that
took part in this study with their corresponding star rating, approximate star points for growth,
and approximate student enrollment.
Table 4
Middle School Participants Overview
School
Name
Star Rating
2011–2012
Star Rating
2012–2013
Star Points for Growth
2-Year Average
Number of
Students A 4 5 65–69 250–599
B 5 4 60–64 250–599
C 4 4 60–64 600–1200
D 4 4 55–59 600–1200
E 4 4 55–59 600–1200
F 3 2 35–39 250–599
G 2 3 35–39 600–1200
H 2 3
30–34 600–1200
I 2 2 30–34 250–599
J 2 2 30–34 600–1200
The total number of participants were 14 principals, 34 mathematics teachers, and 30
language arts teachers (N = 78). The total number of participants for the high-growth schools
equaled 45 (N = 45) and for the low-growth school equaled 32 (N = 32). Only principals, vice
principals, language arts teachers, and mathematics teachers who worked at the selected schools
during the 2012–2013 school year were allowed to take the survey. Newly hired administrators
and teachers at the selected schools were not as familiar with the leadership of the school and
were excluded. The researcher selected math teachers and language arts teachers and excluded

63
the others because they are more heavily involved with the standards-based movement and state
testing.
After receiving written consent from a district administrator, the researcher recruited the
principals of each selected school through phone calls and e-mails requesting them and their
returning language arts and mathematics teachers to participate in a comprehensive school
leadership survey (see Appendix A). The identity of the schools and the individuals who
participated were kept confidential, and the survey responses of the participants were
anonymous. Table 5 displays the selected schools, the number of categorized participants, and
number of participants with six years or more at the same position.
Table 5
Surveys Returned by School
School Administrators
L. A. Teachers Math Teachers
6+ Years in Position
A 1 3 3 4 of 7
B 1 3 2 4 of 6
C 2 8 4 11 of 14
D 3 4 2 4 of 9
E 1 3 5 7 of 9
F 0 3 3 6 of 6
G 2 5 7 8 of 14
H 3 0
5 4 of 8
I 1 1 2 3 of 4
Total 14 30 33 52 of 77
Data Collection
The researcher directly explained the purpose of the survey to district-level
administrators and principals to encourage a high return rate from the targeted sample of teachers

64
and principals. The researcher collected the data during the months of September, October, and
November at the beginning of the new school year of 2013–2014. The data collection required
three months, which allowed time to encourage a high return rate with frequent communication
to the principals who consented for their schools to participate. The comprehensive instructional
leadership survey based on a five-point Likert scale was developed from 24 research-based
school leadership behaviors to measure the differences in leadership styles. The survey also
required the participants to indicate specific actions within open-ended survey items that were
performed by the principal or other school leaders to accomplish the research-based school
leadership behaviors. The survey also collected some simple descriptive data of the principal and
the mathematics and language arts teachers of each school, such as the nature and length of their
current positions. The survey was electronically administered through the web-based tool
Qualtrics, which ensured higher security for confidentiality and anonymity.
The extent to which the survey accurately measured effective school leadership
determined the validity of the survey. A trusted colleague of the researcher took the survey to
examine its face validity. Eight experienced and well-respected principals at various levels
within the Twin Falls School District validated the content of the survey to ensure the relevance
of the individual questions in the questionnaire to the school leadership function (see Table2).
Following the content validation process, the researcher scheduled times with the participating
principals, mathematics teachers, and language arts teachers to take the survey.
Only the primary researcher had access to the study’s survey data. The identities of the
schools remained separate from the data with identity coding. The researcher password protected
all the collected survey data and master lists of identity codes on his secure work computer.
Identities of the participating schools did not and will not appear in any reports or publications

65
that resulted from this study. The survey did not collect the individual identities in order to
safeguard anonymity.
Analytical Methods
Creswell (2008) advocated that “the use of both quantitative and qualitative methods, in
combination, provides a better understanding of the research problem and questions than either
method by itself” (p. 552). Thus, the first research question of this study was designed to be
addressed with quantitative analysis. The researcher determined the reliability of survey
instrument using the Cronbach’s alpha reliability statistic with the IBM Statistical Package for
the Social Sciences (SPSS, 2013). Cronbach’s alpha can measure the internal consistency of a
survey that has only been administered once (Tanner, 2012). The first research question directed
the analytic methods to determine the difference between both sample groups. Thus, the
researcher performed the descriptive statistics of minimum, maximum, mean, and standard
deviation to compare the groups. In addition, the survey results of both groups were analyzed
with a Mann–Whitney U test to determine any significant differences in school leadership
between high-growth schools and low-growth schools. The Mann-Whitney U test is appropriate
to analyze two independent groups for significant differences when both sets of data are interval,
but normality of data or the equivalent variability of both groups is questionable (Tanner, 2012).
The researcher performed an item analysis for each survey item to further determine differences.
The collection of qualitative data with open survey items answered the second research
question of this study. With the use of thematic coding, a list of most frequent themes related to
each research-based leadership behavior emerged from the qualitative data (Marshall &
Rossman, 2011). The researcher used Microsoft Excel to organize the open-ended responses of
the participants into themes that emerged for each leadership behavior and included the

66
frequency of similar responses from high-growth schools and low-growth schools. Qualitative
data was not collected for any of the culture-related survey items, because the researcher
assumed that the related sets of leadership behaviors in the survey create the different school
cultures. In this study, the Pearson correlation quantified the relationship between each
leadership behavior and three of the different cultures considered in this study. The Pearson
correlation measures the linear relationship between two variables (Tanner, 2012).
Limitations
Marshall and Rossman (2011) clarified that no research project is perfectly designed and
all studies have limitations. The purpose of identifying limitations here is to state upfront what
the study will be and what it will not be and how the results of the study can and cannot
contribute to existing research and understanding.
To make this study manageable with limited resources, the researcher included a small
sample of schools in Idaho—many of which are in rural communities. Using the Idaho Star
Rating System for schools, the researcher selected the participating middle schools and junior
high schools based on annual growth as measured with the ISAT. Idaho’s student enrollment
predominantly consisted of Caucasian students with the main minority being Hispanic. The
sample population included some Title I schools. Title I schools entailed a significant portion of
students on free or reduced lunch. As pointed out in the literature review of this study, however,
growth models are the most nonbiased way to measure student achievement, which limits the
effect of student background (Di Carlo, 2012; Gordan et al., 2006; Lipscomb et al., 2010; Zvoch
& Stevens, 2006).
Because the selection of the schools was based on a growth model rather than traditional
proficiency rates, the researcher assumed the effects of demographic inequalities and student

67
background were minimized. The researcher assumed that all students could exhibit adequate
annual growth regardless of their current proficiency level, which was affected by
socioeconomic and other background factors. Evidence from recent growth models in pilot states
suggests that traditional low-performing schools based on proficiency rankings can outperform
traditional high-performing schools when compared using a growth model (Parry, 2010).
The quantitative generalizability may not be strong because of the small sampling, but the
applicability of the research to middle schools with student populations of 250–1000 will be
strong. Because of the research base behind the comprehensive instructional leadership survey
and model, the findings of the study have value in extending the existing research of school
leadership. Especially, the qualitative clarification of successful instructional leadership practices
adds valuable understanding to the existing research. The evidence base of specific leadership
practices within different leadership models is not as robust and needs be clarified by more
studies and further evidence (Louis et al., 2010; Southworth, 2002).

68
Chapter IV
Results
Introduction
This chapter presents the analysis of data collected with the comprehensive instructional
leadership survey (see Appendix A). The study endeavored to answer one research question with
quantitative data from the survey and the other research question with qualitative data from the
survey. Using the quantitative data, the researcher investigated: What differences exist in
leadership behaviors between middle school principals who lead schools of high growth in
learning and those who lead schools of low growth? Using the qualitative data, the researcher
examined: What specific actions performed by principals align with effective leadership
behaviors found in research?
Overview of Analysis
Eight administrators, 21 language arts teachers, and 16 mathematics teachers completed
the comprehensive instructional leadership survey from the five selected schools of high growth
(see Table 5). Only four schools participated from the five selected schools of low growth. Six
principals, nine language arts teachers, and 17 mathematics teachers completed the
comprehensive instructional leadership survey from the low-growth pool of schools (see Table
5). The analysis included all of the completed surveys, except one that lacked a school name.
Without a school name, the researcher could not determine if the survey came from a low-growth
or high-growth school. Table 5 summarizes the nominal data collected by the survey.
The researcher determined the reliability of this study’s survey instrument using the
Cronbach’s alpha reliability statistic with the IBM Statistical Package for the Social Sciences
(SPSS, 2013). Also known as the coefficients alpha test, Cronbach’s alpha can measure the

69
internal consistency of a survey that has only been administered once (Tanner, 2012). The
researcher included the responses of all 77 participants for all 24 survey items in the calculation.
The calculation of Cronbach’s alpha for the comprehensive instructional leadership survey was
.966. George and Mallery (2003) provided a scale to rank values generated by a Cronbach’s
alpha test (see Table 6). According to the Cronbach’s alpha scale of internal consistency, the
comprehensive instructional leadership survey in this study displayed an excellent level of
reliability.
Table 6
Cronbach’s Alpha Scale
> 0.9—Excellent > 0.8—Good > 0.7—Acceptable > 0.6—Questionable < 0.5—Unacceptable
Using IBM SPSS (2013), the researcher performed descriptive statistics to compare the
collective responses for each 5-point, Likert-scale item of the survey between the high-growth
schools and low-growth schools. The descriptive statistics included the minimum, maximum,
mean, and standard deviation displayed in Table 7. The high-growth schools consistently
demonstrated a slightly higher mean than low-growth schools. Seventeen items out of the 24
exuded a higher mean than low-growth schools. As a regular trend, low-growth schools
exhibited a slightly larger standard deviation than the high-growth schools. Among the 24 items,
19 demonstrated a greater standard deviation for low-growth schools. Both categories of schools,
however, exhibited a close similarity with these descriptive statistics.

70
Table 7
Comparison of Descriptive Statistics
High-Growth Schools Low-Growth Schools
Item N Min. Max. Mean Std.
Deviation N Min. Max. Mean Std.
Deviation 1 45 2.00 5.00 4.3333 .70711 32 1.00 5.00 4.0313 .96668 2 45 2.00 5.00 4.2444 .67942 32 1.00 5.00 4.0938 .85607 3 45 2.00 5.00 4.3556 .64511 32 1.00 5.00 3.9688 .86077 4 45 2.00 5.00 4.1333 .75679 32 1.00 5.00 4.0000 .87988 5 44 2.00 5.00 4.1591 .74532 32 1.00 5.00 3.9375 .84003 6 44 1.00 5.00 3.9091 1.11685 31 1.00 5.00 3.9677 .98265 7 45 1.00 5.00 3.5111 1.12052 32 1.00 5.00 3.5313 .98323 8 45 1.00 5.00 3.8444 .92823 32 1.00 5.00 3.7500 .91581 9 44 1.00 5.00 3.8864 .72227 32 1.00 5.00 3.7500 1.01600 10 43 2.00 5.00 4.0233 .85880 32 1.00 5.00 3.9063 .99545 11 43 1.00 5.00 4.0930 .94652 31 1.00 5.00 3.8065 .94585 12 45 1.00 5.00 3.6222 1.07215 32 1.00 5.00 3.8750 1.12880 13 45 1.00 5.00 3.9556 .97597 32 1.00 5.00 3.8438 1.11034 14 45 1.00 5.00 4.1111 .77525 32 1.00 5.00 4.0313 .93272 15 44 3.00 5.00 4.2045 .59375 32 1.00 5.00 4.0625 .91361 16 45 2.00 5.00 3.7111 .78689 32 1.00 5.00 3.7500 1.01600 17 45 1.00 5.00 3.8222 1.00654 32 1.00 5.00 3.7813 1.00753 18 43 1.00 5.00 3.9302 .70357 31 1.00 5.00 3.9677 .91228 19 44 1.00 5.00 3.9091 .83019 31 1.00 5.00 3.6774 .90874 20 44 1.00 5.00 3.9318 1.02066 32 1.00 5.00 3.6875 1.06066 21 43 1.00 5.00 3.7674 1.01974 32 1.00 5.00 3.8750 1.07012 22 43 1.00 5.00 3.2326 1.15134 32 1.00 5.00 3.5000 1.04727 23 45 1.00 5.00 3.9778 .91674 32 1.00 5.00 3.5000 1.13592 24 43 1.00 5.00 3.4884 1.16235 32 1.00 5.00 3.4688 1.19094
To determine if any of the Likert-scale survey items significantly differed, the researcher
performed a Mann–Whitney U test with IBM SPSS (2013). The calculated test values were
considered for each survey item with two-tailed significance and one-tailed significance as
displayed in Table 8. Significance of the two-tailed variety compared two groups in which the
direction of the treatment was not considered (Tanner, 2012). Significance of the one-tailed
variety considered the direction of the treatment based on prior research (Tanner, 2012). Because

71
the comprehensive instructional leadership survey was based on the research of effective school
leadership that impacts student learning, the researcher expected that high-growth schools would
produce greater survey scores than low-growth schools. The high-growth schools of this study
exhibited greater scores on survey item 3 with one-tailed significance (p = .014) and on survey
item 23 with one-tailed significance (p = .031). Survey item 11 indicated that high-growth
schools barely showed one-tailed significance (p = .054). Significance was recognized at p > .05.
Table 8
Mann–Whitney U Test
Item
Two-Tailed Significance p > .05
One-Tailed Significance p > .05
1 .152 .076 2 .471 .235 3 .029 .014 4 .549 .275 5 .166 .083 6 .991 .495 7 .969 .485 8 .549 .274 9 .851 .426 10 .731 .365 11 .107 .054 12 .161 .081 13 .739 .370 14 .895 .447 15 .761 .380 16 .513 .257 17 .818 .409 18 .427 .214 19 .302 .151 20 .277 .139 21 .509 .254 22 .309 .155 23 .063 .031 24 .955 .478

72
For each survey item presented in this section, the researcher displays an item analysis
comparing both types of schools and the qualitative themes with their associated frequency to
assist in answering the two primary research questions of the study. For each survey item
presented, the researcher shows the difference between high-growth schools and low-growth
schools in terms of one-tailed significance as calculated with the Mann–Whitney U test.
Survey Item 1: Creates a student-learning culture of high expectations and support.
This survey used three items to measure three different cultures. Survey item 1 related to the
student-learning culture. Table 9 indicates high-growth schools show more favorable results in
creating a student-learning culture of high expectations and support than do low-growth schools.
The results, however, did not significantly differ (p = .076). Qualitative data was not collected
for any of the culture-related survey items, because the researcher assumed that the related sets
of leadership behaviors in the survey contributed to the creation of different cultures. Compared
to the other leadership behaviors, item 1 exhibited the second highest mean for high-growth
schools and the third highest mean for low-growth schools (see Table 7).
Table 9
Item Analysis for Survey Item 1
High-Growth Schools Low-Growth Schools
Frequency Percent
Frequency Percent
Strongly Disagree 0 0 Strongly Disagree 2 6.3 Disagree 1 2.2 Disagree 0 0 Neutral 3 6.7 Neutral 2 6.3 Agree 21 46.7 Agree 19 59.4 Strongly Agree 20 44.4 Strongly Agree 9 28.1 Total 45 100.0 Total 32 100.0
Survey Item 2: Develops and advocates a school mission and vision with associated
beliefs and values focused on quality teaching and rigorous learning. Table 10 shows the
survey results for item 2 and indicates that high-growth schools rate themselves slightly higher

73
than do low-growth schools but not significantly higher (p = .235). In comparison to all the other
leadership behaviors on the survey, item 2 exuded the third highest mean for high-growth
schools and the first highest mean for low-growth schools (see Table 7).
Table 10
Item Analysis for Survey Item 2
High-Growth Schools Low-Growth Schools
Frequency Percent
Frequency Percent
Strongly Disagree 0 0 Strongly Disagree 1 3.1 Disagree 2 4.4 Disagree 1 3.1 Neutral 0 0 Neutral 1 3.1 Agree 28 62.2 Agree 20 62.5 Strongly Agree 15 33.3 Strongly Agree 9 28.1 Total 45 100.0 Total 32 100.0
As indicated by Table 11, 26 responses out of 58 responses stated a specific focus of the
school’s principal related to teaching and learning. Additional top themes that materialized
included communicating the mission and vision of the school at regular meetings and using the
school mission and vision to guide decisions and actions.
Table 11
Themes and Frequency for Survey Item 2
Themes Frequency A specific focus was stated by respondent 26 Mission and vision communicated regularly at meetings 9 Mission and vision utilized to guide decisions and actions 8 Stakeholder involvement in developing mission and vision 5 Annually revisits mission and vision with staff 5 *Mission and vision posted around school 3 *Mission and vision was developed 2 *High-growth schools only Total 58
Survey Item 3: Establishes and promotes specific school-wide goals focused on high
performance in student learning. Table 12 shows that survey item 3 manifested much higher

74
results for high-growth schools than low-growth schools. In fact, item 3 boasted the most
significant difference (p = .014) between high-growth schools and low-growth schools. Item 3
also possessed the highest mean of all the items for high-growth schools (see Table 7).
Table 12
Item Analysis for Survey Item 3
High-Growth Schools Low-Growth Schools
Frequency Percent
Frequency Percent
1.00 0 0 1.00 1 3.1 2.00 1 2.2 2.00 1 3.1 3.00 1 2.2 3.00 3 9.4 4.00 24 53.3 4.00 20 62.5 5.00 19 42.2 5.00 7 21.9 Total 45 100.0 Total 32 100.0
Table 13 displays frequent themes that emerged for survey item 3. The listed themes
represented specific leadership behaviors that school leaders perform to establish and promote
specific, school-wide goals focused on student achievement. The frequency of responses for each
theme was fairly balanced between high-growth schools and low-growth schools except for the
most frequent theme: a goal of focus was stated by respondent. Among the 17 responses, two
responses originated from low-growth schools with regard to a goal of focus mentioned by a
respondent. Table 13 identifies principals continually revisiting goals and principals using state
assessments to make specific goals for student achievement as other top themes.

75
Table 13
Themes and Frequency for Survey Item 3
Themes Frequency A goal of focus was stated by respondent 17 Goals are continually revisited 11 Specific goals set using state assessments 10 Collection of progress data/evidence 8 Leadership team makes school-wide goals 8 Specific goals set using common assessments 8 *Beginning of the year consensus 3 **Goals are unknown or dictated by state/district 2 *High-growth schools only/**Low-growth schools only Total 67
Survey Item 4: Communicates and reinforces high-performance expectations for
teachers and students focused on teaching and learning. In relation to survey item 4, Table 14
reveals the same pattern of high-growth schools demonstrating slightly more favorable results on
the item analysis. Accordingly, the mean was also slightly higher for high-growth schools (see
Table 7). A significant difference, however, did not exist between the high-growth and low-
growth schools with this survey item (p = .275).
Table 14
Item Analysis for Survey Item 4
High-Growth Schools Low-Growth Schools
Frequency Percent
Frequency Percent
1.00 0 0 1.00 1 3.1 2.00 2 4.4 2.00 1 3.1 3.00 4 8.9 3.00 3 9.4 4.00 25 55.6 4.00 19 59.4 5.00 14 31.1 5.00 8 25.0 Total 45 100.0 Total 32 100.0
Table 15 summarizes various ways school leaders communicated high-performance
expectations to their teachers and students. The most frequent theme entailed a specific
expectation of focus stated by the respondents. Additional top themes included expectations

76
communicated via oral communication, the evaluation tool, and the use of data. Although the
frequency was low, only high-growth schools were indicated as having inadequate
communication with low expectations.
Table 15
Themes and Frequency for Survey Item 4
Themes Frequency A specific expectation of focus was stated by respondent 13 Expectations communicated through oral communication 9 Expectations communicated through evaluation tool 8 Expectations communicated through data use 7 Expectations communicated through writing 5 Expectations communicated through teacher collaboration 4 Adequate communication/high expectations 4 *Inadequate communication/low expectations 4 **Expectations communicated through training 3 *High-growth schools only/**Low-growth schools only Total 57
Survey Item 5: Provides and enforces school policies, procedures, and practices that
are focused on quality teaching and rigorous learning. In relation to survey item 5, Table 16
presents results that insignificantly favor high-growth schools over low-growth schools (p =
.083). Accordingly, high-growth schools possessed a slightly higher mean (see Table 7).
Table 16
Item Analysis for Survey Item 5
High-Growth Schools Low-Growth Schools
Frequency Percent
Frequency Percent
1.00 0 0 1.00 1 3.1 2.00 0 0 2.00 1 3.1 3.00 3 6.7 3.00 3 9.4 4.00 28 62.2 4.00 21 65.6 5.00 13 28.9 5.00 6 18.8 Total 44 97.8 Total 32 100.0 Left Blank 1 2.2 Total 45 100.0

77
Table 17 lists the themes that emerged regarding how principals provide and enforce
policies, procedures, and practices focused on teaching and learning. A specific practice of focus
emerged as the most frequent theme. Other top themes included consistent enforcement of
procedures and communicating procedures at staff meetings.
Table 17
Themes and Frequency for Survey Item 5
Themes Frequency Specific practice of focus mentioned by respondent 16 Consistent enforcement 10 Communicated at staff meetings 6 Inconsistent enforcement 5 Communicated in weekly bulletin/newsletter 4 Communicated in observation/evaluation/surveys 4 Communicated with reminders 3 Communicated in teacher collaboration 2 Communicated in handbooks 2 **Communicated at staff development 1 **Low-growth schools only Total 53
Survey Item 6: Utilizes a representative leadership team of staff members to set the
focus on the continuous improvement of teaching and learning and provides opportunities
for staff input. The item analysis of Table 18 displays minute differences between both
categories of schools, but item 6 was one of seven items in which low-growth schools exuded a
higher mean than high-growth schools (see Table 7). No significant difference, however, existed
in how low-growth schools utilized representative leadership for school improvement as
compared to high-growth schools (p = .495).

78
Table 18
Item Analysis for Survey Item 6
High-Growth Schools Low-Growth Schools
Frequency Percent
Frequency Percent
1.00 2 4.4 1.00 1 3.1 2.00 4 8.9 2.00 2 6.3 3.00 5 11.1 3.00 3 9.4 4.00 18 40.0 4.00 16 50.0 5.00 15 33.3 5.00 9 28.1 Total 44 97.8 Total 31 96.9 Left Blank 1 2.2 Left Blank 1 3.1 Total 45 100.0 Total 32 100.0
Table 19 summarizes the themes and the frequency of responses relating to how
principals shared leadership with teachers to set the focus of school improvement and seek input
from staff. The most frequent themes revealed that principals involved teachers in school
leadership teams and other collaborative teams focused on improving teaching and learning, such
as Response to Intervention teams. Additionally, principals used department leaders to play a
role in improving instruction and elicit input from the collective staff. Only high-growth schools
received responses indicating that principals did not use representative leadership.
Table 19
Themes and Frequency for Survey Item 6
Themes Frequency School leadership team leads improvement efforts 24 Collaborative teams lead improvement efforts 14 Department leaders lead improvement efforts 9 Leadership team elicits input from staff 9 *No representative leadership 4 Leadership team lacks communication to staff 3 District opportunities to lead improvement efforts 1 *High-growth schools only Total 64

79
Survey Item 7: Protects teachers from distractions and maximizes instructional time
and resources for quality teaching and rigorous learning. Table 20 exhibits a close similarity
between high-growth schools and low-growth schools as shown with the item analysis of survey
item 7. Among the survey items, high-growth schools and low-growth schools displayed their
third lowest mean for item 7 (see Table 7). This is the second item in which low-growth schools
recorded a higher mean than high-growth schools. The difference, however, between both types
of schools was not significant (p = .485).
Table 20
Item Analysis for Survey Item 7
High-Growth Schools Low-Growth Schools
Frequency Percent
Frequency Percent
1.00 2 4.4 1.00 2 6.3 2.00 8 17.8 2.00 2 6.3 3.00 8 17.8 3.00 8 25.0 4.00 19 42.2 4.00 17 53.1 5.00 8 17.8 5.00 3 9.4 Total 45 100.0 Total 32 100.0
In Table 21, the qualitative data of item 7 indicated that teachers experienced initiative
overload as the most frequent theme distracting teachers from their focus on teaching and
learning. Among the 15 responses regarding overload, 14 originated from educators within high-
growth schools. The second most frequent theme indicated that administrators shielded teachers
from distractions. The third most frequent theme indicated that too many teaching interruptions
existed during the school day.

80
Table 21
Themes and Frequency for Survey Item 7
Themes Frequency Teachers experience overload without enough time 15 Administration shields teachers from distractions 13 Too many interruptions exist 9 Instructional time kept sacred 7 Administration removes disruptive students 3 Collaboration time kept sacred 2 Scheduling maximizes time 2 *Scheduling lessened time 2 **Students spend too much time on testing 1 *High-growth schools only/**Low-growth schools only Total 54
Survey Item 8: Maintains high visibility and accessibility with frequent
communication to stakeholders regarding quality teaching and rigorous learning. Table 22
presents the item analysis for item 8 of the survey. The results are slightly more favorable for
high-growth schools than low-growth schools in accordance with the pattern of the survey. For
item 8, high-growth schools exhibited a higher mean than did low-growth schools (see Table 7),
yet the difference was not significant (p = .274).
Table 22
Item Analysis for Survey Item 8
High-Growth Schools Low-Growth Schools
Frequency Percent
Frequency Percent
1.00 1 2.2 1.00 1 3.1 2.00 4 8.9 2.00 2 6.3 3.00 5 11.1 3.00 6 18.8 4.00 26 57.8 4.00 18 56.3 5.00 9 20.0 5.00 5 15.6 Total 45 100.0 Total 32 100.0
The most recurrent theme for survey item 8 showed administrators were frequently
visible throughout the school during passing time and lunch time (see Table 23). Among the nine

81
responses, seven indicated that administrators of high-growth schools made time to be visible in
classrooms. Ironically, seven responses out of nine also indicated the principals of high-growth
schools were not as visible as needed due to the demand of numerous meetings. Six responses to
one, principals of high-growth schools more frequently communicated to parents using a variety
of modes such as websites, progress reports, mass autodialed messages via voice and text, and e-
mailed newsletters.
Table 23
Themes and Frequency for Survey Item 8
Themes Frequency Administration visible in hallways/lunch time 21 Administration visible in classrooms 9 Not visible as needed due meeting demands 9 Indirect communication to parents (multimodal) 7 Direct communication to parent groups 7 Accessible to individuals (open-door policy) 5 Administration visible at student performance events 3 Indirect communication with whole staff (written) 2 Administration communication to board/community 2 **Announcements to staff and students 1 **Direct communication at staff meeting 1 **Low-growth schools only Total 67
Survey Item 9: Maintains a keen awareness of the situational reality of the school in
order to anticipate and prevent problems that may have a negative impact on quality
teaching and rigorous learning. Table 24 summarizes the item analysis for survey item 9.
Following the consistent pattern of the survey, similar results appeared between both categories
of schools. The mean of high-growth schools exceeded the mean of low-growth schools (see
Table 7). The difference between both categories of schools was not significant (p = .426).

82
Table 24
Item Analysis for Survey Item 9
High-Growth Schools Low-Growth Schools
Frequency Percent
Frequency Percent
1.00 1 2.2 1.00 1 3.1 2.00 0 0 2.00 4 12.5 3.00 8 17.8 3.00 3 9.4 4.00 29 64.4 4.00 18 56.3 5.00 6 13.3 5.00 6 18.8 Total 44 97.8 Total 32 100.0 Left Blank 1 2.2 Total 45 100.0
Table 25 shows the most frequent theme as specific examples of anticipating problems
and responding to them. The next most frequent theme related to school leaders not recognizing
the overload concerns of the teachers or administrators not responding to the concern of
overload. Principals of high-growth schools demonstrated anticipation and prevention of
instructional interruptions.
Table 25
Themes and Frequency for Survey Item 9
Themes Frequency Examples of anticipating and responding 11 Administration unresponsive to teacher overload concerns 8 *Administration anticipates and prevents interruptions 6 Administration aware of situational reality 4 **Administration monitors data and responds 3 Administration speaks to students to learn concerns 2 **Administration informs staff of concerns 2 *Administration monitors classrooms 1 *Administration speaks to leadership team to learn concerns 1 *High-growth schools only/**Low-growth schools only Total 38
Survey Item 10: Recognizes contributions and instructional successes of teachers
and academic achievements and growth of students. With the item analysis of survey item 10,

83
Table 26 displays the consistent pattern of high-growth schools exuding higher results. Thus, the
mean of the results was higher for high-growth schools (see Table 7). The difference between
high-growth schools and low-growth schools was not significant (p = .365).
Table 26
Item Analysis for Survey Item 10
High-Growth Schools Low-Growth Schools
Frequency Percent
Frequency Percent
1.00 0 0 1.00 2 6.3 2.00 3 6.7 2.00 1 3.1 3.00 6 13.3 3.00 2 6.3 4.00 21 46.7 4.00 20 62.5 5.00 13 28.9 5.00 7 21.9 Total 43 95.6 Total 32 100.0 Left Blank 2 4.4 Total 45 100.0
Table 27 displays the themes and the frequency of related responses to each theme. As
the most frequent theme, teachers were publicly recognized for school and individual
achievements, yet the second most frequent theme indicated that the recognition of teachers
needs to be improved. Many teachers viewed that recognition and praise for teachers were not
adequately widespread. A high majority of the responses related to these two themes originated
from high-growth schools—nine out of 12 responses. The third most frequent theme related to
students getting recognized for successes.

84
Table 27
Themes and Frequency for Survey Item 10
Themes Frequency Teachers are publicly recognized for successes 16 Improvement needed for recognizing teachers 12 Students are publicly recognized for successes 10 Uses data to recognize teacher and school successes 9 Teachers feel appreciated 9 Uses incentives for teacher and student successes 3 Feedback through walk-throughs/evaluations 2 Award assemblies for teacher and student successes 2 Teachers publicly recognize teachers 2 *Improvement needed for recognizing students 1 *High-growth schools only Total 66
Survey Item 11: Monitors student progress in learning challenging standards and
provides instructional interventions as necessary. In relation to survey item 11, Table 28
shows consistent results of high-growth schools outscoring low-growth schools in the item
analysis. Thus, the high-growth schools boasted a higher mean (see Table 7). The difference
found for item 11 between both types of schools was significant (p = .054) in that high-growth
schools significantly outperformed low-growth schools in monitoring student progress and
intervening as needed.

85
Table 28
Item Analysis for Survey Item 11
High-Growth Schools Low-Growth Schools
Frequency Percent
Frequency Percent
1.00 1 2.2 1.00 1 3.1 2.00 3 6.7 2.00 2 6.3 3.00 2 4.4 3.00 5 15.6 4.00 22 48.9 4.00 17 53.1 5.00 15 33.3 5.00 6 18.8 Total 43 95.6 Total 31 96.9 Left Blank 2 4.4 Left Blank 1 3.1 Total 45 100.0 Total 32 100.0
Table 29 tabulates the frequency of responses for each related theme discovered in survey
item 11. Within a comprehensive program, intervention teams, which meet regularly to discuss
the progress of struggling students and apply necessary intervention, rated as the most frequent
theme. Among the14 responses, 11 originated from high-growth schools. Other frequent themes
listed in Table 29 were closely related. Ten responses indicated that schools provided an
intervention period, and seven indicated that schools intervened based on data. Six of the 10
responses regarding the existence of an intervention period originated from high-growth schools.
Table 29
Themes and Frequency for Survey Item 11
Themes Frequency Intervention teams meet regularly for struggling students 14 Intervention period exists 10 Interventions based on data 7 Struggling students are monitored for interventions 6 *Principal counsels with students not meeting standards 5 Intervention program needs improvement 4 Interventions based on grades 2 Interventions based on teacher judgment 2 *Data day for struggling students and interventions 2 Specific intervention mentioned 2 *High-growth schools only Total 54
86
Survey Item 12: Fosters a high-trust culture of commitment and satisfaction. Item
12 is a culture-related survey item. The item analysis of Table 30 indicated low-growth schools
received a higher percentage of five ratings than did high-growth schools. This was one of seven
survey items in which low-growth schools exhibited a higher mean than high-growth schools.
Item 12 exhibited a non-significant difference (p = .081). The researcher did not collect
qualitative data on this item because he assumed the five sets of leadership behaviors on the
survey correlated to the creation of culture.
Table 30
Item Analysis for Survey Item 12
High-Growth Schools Low-Growth Schools
Frequency Percent
Frequency Percent
1.00 3 6.7 1.00 2 6.3 2.00 4 8.9 2.00 3 9.4 3.00 7 15.6 3.00 1 3.1 4.00 24 53.3 4.00 17 53.1 5.00 7 15.6 5.00 9 28.1 Total 45 100.0 Total 32 100.0
Survey Item 13: Builds and maintains relationships with teachers through personal
communication and individualized concern. Table 31 summarizes the item analysis of survey
item 13. The analysis revealed more favorable results for high-growth schools. Accordingly, the
mean calculated higher for high-growth schools (see Table 7). The differences between the two
categories of schools exhibited no significance (p = .370).

87
Table 31
Item Analysis for Survey Item 13
High-Growth Schools Low-Growth Schools
Frequency Percent
Frequency Percent
1.00 2 4.4 1.00 2 6.3 2.00 2 4.4 2.00 2 6.3 3.00 4 8.9 3.00 4 12.5 4.00 25 55.6 4.00 15 46.9 5.00 12 26.7 5.00 9 28.1 Total 45 100.0 Total 32 100.0
Table 32 conveys open-door communication as the most frequent theme in which school
leaders build relationships with teachers. Second to that most frequent theme, teachers perceive
relationships as built through personal interactions. The third most frequent theme indicated
relationships with teachers could be improved through better personal communication from the
principal.
Table 32
Themes and Frequency for Survey Item 13
Themes Frequency Relationships through open-door communication 19 Relationships through personal interactions 15 Communicative relationships could be improved 10 Communicative relationships exist 8 Relationships through written communication 4 Relationships through evaluative communication 3 Relationships through collaborative communication 2
Total 61
Survey Item 14: Demonstrates ideals of optimism by being confident and expressing
confidence in the abilities of teachers to make instructional innovations. Table 33 expresses
the summarized results of the item of analysis for survey item 14, which are minutely more
favorable for high-growth schools than low-growth schools. Accordingly, high-growth schools

88
exhibited a higher mean (see Table 7). No significant difference existed (p = .447). The mean for
low-growth schools, however, was the third highest.
Table 33
Item Analysis for Survey Item 14
High-Growth Schools Low-Growth Schools
Frequency Percent
Frequency Percent
1.00 1 2.2 1.00 1 3.1 2.00 1 2.2 2.00 2 6.3 3.00 2 4.4 3.00 1 3.1 4.00 29 64.4 4.00 19 59.4 5.00 12 26.7 5.00 9 28.1 Total 45 100.0 Total 32 100.0
Table 34 tabulates the frequency of responses of related themes for survey item 14. The
most frequent theme indicated that principals optimistically express confidence in teachers when
they give teachers latitude and support to make instructional innovations. Secondarily, Table 34
shows that teachers perceived principals as school leaders who take an optimistic approach when
seeking to improve teaching.
Table 34
Themes and Frequency for Survey Item 14
Themes Frequency Expressed by giving teachers latitude and support 20 Optimistic approach exists 14 Optimistic approach needs improvement 6 Expressed by encouraging e-mails/comments of praise 3 **Expressed at staff meetings/professional development 2 **Expressed through new plan and goals 1 **Low-growth schools only Total 46
Survey Item 15: Displays strong beliefs of what effective teaching is and that all
students can experience high growth in learning with effective teaching. Table 35 displays
the item analysis for survey item 15. In accordance with the mean (see Table 7), high-growth

89
schools had slightly higher results overall, but the difference was not significant (p = .380). For
low-growth schools, the mean represented the second highest out of all the survey items.
Table 35
Item Analysis for Survey Item 15
High-Growth Schools Low-Growth Schools
Frequency Percent
Frequency Percent
1.00 0 0 1.00 1 3.1 2.00 0 0 2.00 1 3.1 3.00 4 8.9 3.00 3 9.4 4.00 27 60.0 4.00 17 53.1 5.00 13 28.9 5.00 10 31.3 Total 44 97.8 Total 32 100.0 Left Blank 1 2.2 Total 45 100.0
As shown in Table 36, the collection of responses indicated that specific beliefs regarding
effective teaching and learning as the most frequent theme. Principals communicated strong
beliefs regarding teaching and learning through displaying examples and modeling effective
teaching strategies. For high-growth schools only, the data for this item revealed that principals
communicated beliefs regarding teaching and learning through presentations to staff and through
the evaluation process.

90
Table 36
Themes and Frequency for Survey Item 15
Themes Frequency Specific belief stated 15 Beliefs communicated with examples/modeling 5 *Beliefs communicated through principal’s presentation 4 *Beliefs communicated through evaluations 4 *Problems with communicating beliefs 3 Beliefs communicated at staff meetings 3 **Beliefs communicated at professional development 2 **Beliefs communicated through book studies 1 *Beliefs communicated during peer observations 1 *Beliefs communicated through teachers presenting 1 *High-growth schools only/**Low-growth schools only Total 39
Survey Item 16: Exhibits strong expertise in curriculum, instruction and assessment
necessary to support teachers in making instructional innovations. The item analysis of
survey item 16 in Table 37 shows a higher percentage of favorable scores for low-growth
schools compared to high-growth schools. Thus, the mean was higher for low-growth schools
(see Table 7). The difference between both categories of school for this item was not significant
(p = .257).
Table 37
Item Analysis for Survey Item 16
High-Growth Schools Low-Growth Schools
Frequency Percent
Frequency Percent
1.00 0 0 1.00 2 6.3 2.00 3 6.7 2.00 1 3.1 3.00 13 28.9 3.00 6 18.8 4.00 23 51.1 4.00 17 53.1 5.00 6 13.3 5.00 6 18.8 Total 45 100.0 Total 32 100.0
Table 38 displays that administrators demonstrated sufficient expertise regarding
curriculum, instruction, and assessment as the most frequent theme from the qualitative

91
responses of item 16. The next frequent theme indicated that administrators were lacking in
curricular, instructional, and assessment knowledge. For this theme, eight responses out of 11
originated from high-growth schools.
Table 38
Themes and Frequency for Survey Item 16
Themes Frequency Administrators exhibit sufficient expertise 17 Administrators exhibit insufficient expertise 11 Administrators attend professional development 4 Administrators exhibit expertise in evaluation/observation 4 **Administrators provide resources 3 **Administrators use book study to build expertise 1 **Low-growth schools only Total 40
Survey Item 17: Models ideals of innovation by questioning the status quo, taking
risks to innovate, and making it safe for teachers to take risks. Table 39 displays the item
analysis for survey item 17 and holds to the pervasive pattern of high-growth schools outscoring
low-growth schools by a slim margin with no significant difference manifested (p = .409).
Accordingly, the high-growth schools exhibited a higher mean value (see Table 7).
Table 39
Item Analysis for Survey Item 17
High-Growth Schools Low-Growth Schools
Frequency Percent
Frequency Percent
1.00 2 4.4 1.00 1 3.1 2.00 3 6.7 2.00 3 9.4 3.00 6 13.3 3.00 5 15.6 4.00 24 53.3 4.00 16 50.0 5.00 10 22.2 5.00 7 21.9 Total 45 100.0 Total 32 100.0
Table 40 summarizes the qualitative responses for survey item 17 into themes with
accompanying numbers of responses for each theme. The most frequent theme by a large margin

92
emerged as principals providing encouragement and support to teachers for innovative risk
taking. The next frequent theme revealed that principals modeled innovative thinking. Six
responses indicated the opposite of the most frequent theme—principals did not provide
encouragement or support to teachers for instructional risk taking.
Table 40
Themes and Frequency for Survey Item 17
Themes Frequency Innovative risk taking encouraged/supported 23 Administration models innovative thinking 7 Innovative risk taking discouraged/unsupported 6 Specific innovation stated 6 *Administration doesn't model innovative thinking 1 *High-growth schools only Total 43
Survey Item 18: Creates a teacher-learning culture of instructional innovation and
support. Item 18 is a culture-related survey item. Table 41 reveals once again that a culture-
related survey item did not follow the persistent pattern of high-growth schools outscoring low-
growth schools. The item analysis indicated that low-growth schools received a higher
percentage of five scores than high-growth schools and produced a higher mean value (see Table
7). A significant difference between the two categories of schools did not exist (p = .214).
Qualitative data was not collected for the survey items dealing with culture because the
researcher assumed that the five sets of leadership behaviors in the survey contributed to the
creation of culture.

93
Table 41
Item Analysis for Survey Item 18
High-Growth Schools Low-Growth Schools
Frequency Percent
Frequency Percent
1.00 1 2.2 1.00 1 3.1 2.00 0 0 2.00 2 6.3 3.00 6 13.3 3.00 1 3.1 4.00 30 66.7 4.00 20 62.5 5.00 6 13.3 5.00 7 21.9 Total 43 95.6 Total 31 96.9 Left Blank 2 4.4 Left Blank 1 3.1 Total 45 100.0 Total 32 100.0
Survey Item 19: Uses challenging standards to set an instructional vision, goals, and
expectations that inspire and guide teachers in making instructional innovations. Table 42
shows small differences between both types of schools in the item analysis of survey item 19.
The responses calculated to a higher mean for high-growth schools (see Table 7). The difference
manifested no significance (p = .151).
Table 42
Item Analysis for Survey Item 19
High-Growth Schools Low-Growth Schools
Frequency Percent
Frequency Percent
1.00 1 2.2 1.00 1 3.1 2.00 1 2.2 2.00 3 9.4 3.00 8 17.8 3.00 4 12.5 4.00 25 55.6 4.00 20 62.5 5.00 9 20.0 5.00 3 9.4 Total 44 97.8 Total 31 96.9 Left Blank 1 2.2 Left Blank 1 3.1 Total 45 100.0 Total 32 100.0
Looking at the top two themes, Table 43 displays that the Common Core State Standards
(CCSS) were providing a challenging instructional focus aimed at improving student learning,

94
and principals provided sufficient implementation guidance. Six responses indicated that
principals were not providing enough implementation guidance.
Table 43
Themes and Frequency for Survey Item 19
Themes Frequency CCSS provides a challenging instructional focus 14 Implementation guidance for instructional focus exits 10 Implementation guidance for instructional focus lacks 6 *International Baccalaureate Courses provide challenge 4 Specific instructional focus mentioned 4 *Instructional focus is unclear 2 *Teachers are encouraged to try new things 2 *Advanced Placement Courses provide challenge 1 *High-growth schools only Total 43
Survey Item 20: Provides training for teachers to learn best practices and empowers
them to make instructional innovations within the curriculum to improve student
performance on assessments. Table 44 depicts the persistent pattern of the survey, in which
high-growth schools outscored low-growth schools. The item analysis was more favorable for
high-growth schools, but the difference was not significant (p = .139). Accordingly, the mean for
item 20 was higher for high-growth schools as shown in Table 7.
Table 44
Item Analysis for Survey Item 20
High-Growth Schools Low-Growth Schools
Frequency Percent
Frequency Percent
1.00 1 2.2 1.00 1 3.1 2.00 4 8.9 2.00 4 12.5 3.00 6 13.3 3.00 6 18.8 4.00 19 42.2 4.00 14 43.8 5.00 14 31.1 5.00 7 21.9 Total 44 97.8 Total 32 100.0 Left Blank 1 2.2 Total 45 100.0

95
For survey item 20, Table 45 indicates the three most frequent themes that principals
provided adequate training to teachers in three main ways: in-building training, external training,
and district training.
Table 45
Themes and Frequency for Survey Item 20
Themes Frequency In-building training is provided 14 External training is provided 13 District training is provided 9 *More focused training needed 6 Resources for training is not sufficient 4 Specific training mentioned 3 Training is provided 3 No in-building training is provided 2 **Training is not connected to focus 1 *High-growth schools only/**Low-growth schools only Total 55
Survey Item 21: Establishes collaborative structures with shared leadership for the
continuous professional learning of teachers and the development of curricular units with
aligned assessments. Table 46 discloses another survey item out of seven in which the results
are higher for low-growth schools than high-growth schools. The low-growth schools received a
higher percentage of five ratings than the high-growth schools as shown in Table 46.
Accordingly, the mean for low-growth schools was higher (see Table 7). No significant
difference existed between the high-growth schools and low-growth schools (p = .254).

96
Table 46
Item Analysis for Survey Item 21
High-Growth Schools Low-Growth Schools
Frequency Percent
Frequency Percent
1.00 2 4.4 1.00 1 3.1 2.00 4 8.9 2.00 4 12.5 3.00 4 8.9 3.00 2 6.3 4.00 25 55.6 4.00 16 50.0 5.00 8 17.8 5.00 9 28.1 Total 43 95.6 Total 32 100.0 Left Blank 2 4.4 Total 45 100.0
As the most common theme in Table 47, the use of weekly collaboration time was
widespread between both types of schools. Among 14 responses, 11 originated from high-growth
schools, indicating that high-growth schools focused their collaboration on curricular
development and related issues more than low-growth schools. On the other hand, high-growth
schools indicated dissatisfaction with either the amount of time or structure of their collaboration
with nine responses out of 11.
Table 47
Themes and Frequency for Survey Item 21
Themes Frequency Collaboration time exists 16 Collaboration time exists for curricular development 14 Collaboration time/structure needs improvement 11 Specific focus of collaboration mentioned 3 Shared leadership exists 8 **Shared leaderships needs improvement 1 **Low-growth schools only Total 53
Survey Item 22: Takes a hands-on approach to assist teachers with developing and
aligning standards-based curriculum and assessment that allows for instructional
innovations. Table 48 displays that low-growth schools exhibited a greater percentage of higher

97
marks in the item analysis of survey item 22. Accordingly, low-growth schools exuded a higher
mean than high-growth schools (see Table 7). Considering the mean values, survey item 22
represented the lowest result for high-growth schools and the second lowest result for low-
growth schools. For item 22, the difference between both types of schools indicated no
significant difference (p = .155).
Table 48
Item Analysis for Survey Item 22
High-Growth Schools Low-Growth Schools
Frequency Percent
Frequency Percent
1.00 3 6.7 1.00 1 3.1 2.00 9 20.0 2.00 5 15.6 3.00 12 26.7 3.00 8 25.0 4.00 13 28.9 4.00 13 40.6 5.00 6 13.3 5.00 5 15.6 Total 43 95.6 Total 32 100.0 Left Blank 2 4.4 Total 45 100.0
The most frequent theme in Table 49 substantiates the low mean values for survey item
22. Nineteen responses indicated that a principal’s hands-on approach in curricular development
and related issues was not evident. Fourteen of those 19 responses originated from high-growth
schools.

98
Table 49
Themes and Frequency for Survey Item 22
Themes Frequency Hands-on approach not evident 19 Hands-on approach available 6 Hands-on participation in collaboration 5 Hands-on participation in professional development 3 Hands-on help from designee 3 **Hands-on help with specific focus 2 **Hands-on feedback on lesson plans 1 **Low-growth schools only Total 39
Survey Item 23: Observes instruction frequently with feedback and questioning to
teachers that elicits reflection and instructional conversations related to the instructional
vision, goals, and expectations. For survey item 23, Table 50 presents the item analysis of high-
growth schools and low-growth schools. The difference between the two categories of schools
was significant (p = .031). For low-growth schools, the mean of responses for survey item 23
was the second lowest of all the survey items (see Table 7).
Table 50
Item Analysis for Survey Item 23
High-Growth Schools Low-Growth Schools
Frequency Percent
Frequency Percent
1.00 1 2.2 1.00 1 3.1 2.00 3 6.7 2.00 8 25.0 3.00 4 8.9 3.00 2 6.3 4.00 25 55.6 4.00 16 50.0 5.00 12 26.7 5.00 5 15.6 Total 45 100.0 Total 32 100.0
As the most frequent theme, Table 51 indicates that principals performed frequent
observations with feedback. Among 13 responses, seven originated from high-growth schools.
Related to the top theme, the next frequent theme emerged as principals providing observations

99
with feedback, but the frequency of observation was not indicated. Among 12 responses, nine
originated from high-growth schools.
Table 51
Themes and Frequency for Survey Item 23
Themes Frequency Frequent observations with feedback 13 Observations with feedback provided 12 Evaluative feedback provided 10 Infrequent observations with feedback 10 Concerns expressed regarding observation process 4 Evaluative feedback provided multiple times 3
Total 52
Survey Item 24: Provides teachers additional support to make instructional
innovations with the assistance of an instructional coach. The item analysis of item 24
demonstrated only minute differences between high-growth schools and low-growth schools, as
shown in Table 52. The difference was not significant (p = .478). Regarding item 24, low-growth
schools exuded the lowest mean and high-growth schools the second lowest mean (see Table 7).
Table 52
Item Analysis for Survey Item 23
High-Growth Schools Low-Growth Schools
Frequency Percent
Frequency Percent
1.00 4 8.9 1.00 3 9.4 2.00 3 6.7 2.00 4 12.5 3.00 12 26.7 3.00 5 15.6 4.00 16 35.6 4.00 15 46.9 5.00 8 17.8 5.00 5 15.6 Total 43 95.6 Total 32 100.0 Left Blank 2 4.4 Total 45 100.0

100
The results summarized in Table 53 corroborate the low mean for survey item 24. The
most frequent theme indicated that teachers go without assistance from instructional coaches and
the second frequent theme indicated that assistance from an instructional coach occurs as needed.
Table 53
Themes and Frequency for Survey Item 24
Themes Frequency Assistance not received from instructional coach 18 Assistance received from instructional coach as needed 18 Assistance received from department chairs and others 6 **Assistance from instructional coach is not helpful 3 **Instructional coach leads professional development 2 Assistance received from mentors 2 **Low-growth schools only Total 49
The rest of the results in this chapter relate to the Pearson correlation. Formally known as
the Pearson product-moment correlation, the Pearson correlation measures the linear relationship
between two variables (Tanner, 2012). In this study, the Pearson correlation quantified the
relationship between each leadership behavior and the three different cultures considered in this
study: (a) creating a student-learning culture of high expectations and support, (b) fostering a
high-trust culture of satisfaction and commitment, and (c) building a teaching-learning culture of
innovation and support. The Pearson correlation was performed for each school type: high-
growth schools, low-growth schools, and both types of schools combined.
As a general rule, weak correlations occur between 0 and .3; moderate correlations fall
between .3 and .7; and high correlations reach above .7 (Tanner, 2012). With correlations, the
range of significance changes as population samples increase (Tanner, 2012). For the sample size
of high-growth schools (df = 43), the critical value of two-tailed significance equaled .304 at the
.05 level (see Appendix C). For the sample size of low-growth schools (df = 30), the critical
value equaled .349 at the .05 level (see Appendix C). For the combined sample size of both types

101
of schools (df = 85), the critical value equaled .217 at the .05 level (see Appendix C). Critical
values determine if a significant relationship exists. With 95% confidence (p < .05), one may
determine that no relationship exists if the correlation value is less than the critical value (Siegle,
2009). According to the above critical values, the value for high correlation were set at .704 for
high-growth schools, .749 for low-growth schools, and .617 for both types of schools.
Table 54 tabulates the Pearson correlations between the survey items titled Setting the
Focus on Quality Teaching and Rigorous Learning and the three culture-related survey items.
The three culture-related items included the student-learning culture, the teacher-learning culture,
and the culture of trust. Table 54 also groups the correlations by types of school—high-growth
schools, low-growth schools, and both types of schools together.
The set of items categorized as Setting a Focus on Quality Teaching and Rigorous
Learning exhibited a stronger correlation with the teacher-learning culture than the other two
cultures as displayed in Table 54. For both types of schools, items 2 and 5 showed a high
correlation with the teaching-learning culture; only item 6 demonstrated a high correlation with
the high-trust culture. For low-growth schools, each item of the set correlated highly with the
teacher-learning culture; only item 6 correlated highly with the high-trust culture.
Compared to high-growth schools, each item of the low-growth schools exhibited a
stronger correlation with the high-trust culture and the teacher-learning culture. The correlations
between the student-learning culture and each item were similar for high-growth and low-growth
schools. The correlations in Table 54 indicated that each item possessed a significant relationship
with all three cultures, except item 3 lacked a significant relationship with the teacher-learning
culture for high-growth schools (rxy = .263).

102
Table 54
Correlations between Culture-Related Items and Focus-Setting Items
School Type
Culture-Related Item
Item 2
Item 3
Item 4
Item 5
Item 6
Mean
High-Growth Student-Learning 0.442 0.631 0.425 0.387 0.567 0.490 Low-Growth Student-Learning 0.542 0.505 0.417 0.479 0.484 0.485 Both Types Student-Learning 0.504 0.579 0.426 0.447 0.503 0.492 High-Growth High-Trust 0.379 0.396 0.372 0.366 0.634 0.429 Low-Growth High-Trust 0.747 0.693 0.650 0.740 *.765 0.719 Both Types High-Trust 0.537 0.490 0.485 0.512 *.680 0.541 High-Growth Teacher-Learning 0.430 0.263 0.374 0.387 0.487 0.388 Low-Growth Teacher-Learning *.816 *.834 *.792 *.896 *.780 *.824 Both Types Teacher-Learning *.630 0.556 0.586 *.643 0.610 0.605
Correlation is significant at the 0.05 level (two-tailed). *High Correlation
The next set of items—Keeping the Focus on Quality Learning and Rigorous Learning—
as shown in Table 55 displays a stronger relationship to the high-trust culture than the other
cultures. Specifically, items 8 and 10 demonstrated a high correlation with the high-trust culture
for both types of schools; only item 9 was highly correlated with the teacher-learning culture (see
Table 55). For the low-growth schools, items 7, 9, and 10 demonstrated a high correlation with
the high-trust culture; only item 8 exuded a high correlation with the teacher-learning culture.
Compared to high-growth schools, almost every item of the low-growth schools exhibited
a stronger correlation with the student-learning culture, the high-trust culture, and the teacher-
learning culture (see Table 55). In Table 55, every item was significantly correlated to each of
the three cultures, except item 7 lacked a significant correlation with the student-learning culture
for high-growth schools (rxy = .296).

103
Table 55
Correlations between Culture-Related Items and Focus-Keeping Items
School Type
Culture-Related Item
Item 7
Item 8
Item 9
Item 10
Item 11
Mean
High-Growth Student-Learning 0.296 0.462 0.348 0.419 0.312 0.367 Low-Growth Student-Learning 0.423 0.556 0.534 0.372 0.509 0.479 Both Types Student-Learning 0.339 0.501 0.461 0.397 0.419 0.423 High-Growth High-Trust 0.467 0.693 0.393 0.579 0.335 0.493 Low-Growth High-Trust *.759 0.655 *.816 *.822 0.683 0.747 Both Types High-Trust 0.577 *.666 0.590 *.677 0.457 0.593 High-Growth Teacher-Learning 0.465 0.452 0.552 0.364 0.404 0.447 Low-Growth Teacher-Learning 0.718 *.758 0.716 0.732 0.746 0.734 Both Types Teacher-Learning 0.569 0.588 *.640 0.554 0.547 0.580
Correlation is significant at the 0.05 level (two-tailed). *High Correlation
Table 56 displays a general pattern in which the five items classified as Modeling Ideals
of Trustworthiness and Innovation correlated more strongly to the high-trust culture and the
teacher-learning culture than the student-learning culture. For both types of schools, four of the
five items comprising the trust-building items exuded high correlations with the high-trust
culture; three of the five items exhibited high correlations with the teaching-learning culture.
None of the items were highly correlated to the student-learning culture. Only item 15 did not
correlate highly with the high-trust culture, and only item 14 and 15 did not correlate at a high
level with the teaching-learning culture.
In relation to low-growth schools, four of the five items correlated highly with the high-
trust culture. Only item 17 did not correlate highly to the high-trust culture. For low-growth
schools, all five of the items displayed a high correlation with the teacher-learning culture. For
high-growth schools, only item 13 exhibited a high correlation with the high-trust culture and
only item 16 with the teaching-learning culture.

104
In comparison to high-growth schools, low-growth schools exhibited stronger
correlations between each item and the three different cultures. All five items demonstrated a
significant correlation with each type of culture, except for two items. For high-growth schools,
item 15 did not show a significant relationship with the student-learning culture (rxy = .162), and
item 16 did not show a significant relationship with the teacher-learning culture (rxy = .300).
Table 56
Correlations between Culture-Related Items and Trust-Building Items
School Type
Culture-Related Item
Item 13
Item 14
Item 15
Item 16
Item 17
Mean
High-Growth Student-Learning 0.318 0.345 0.340 0.300 0.309 0.322 Low-Growth Student-Learning 0.456 0.500 0.619 0.567 0.537 0.536 Both Types Student-Learning 0.391 0.428 0.513 0.436 0.413 0.436 High-Growth High-Trust *.722 0.516 0.357 0.595 0.589 0.556 Low-Growth High-Trust *.910 *.770 *.821 *.759 0.713 *.795 Both Types High-Trust *.795 *.624 0.578 *.670 *.635 *.660 High-Growth Teacher-Learning 0.548 0.318 0.162 *.705 0.647 0.476 Low-Growth Teacher-Learning *.818 *.772 *.882 *.849 *.786 *.821 Both Types Teacher-Learning *.683 0.559 0.587 *.784 *.708 *.664
Correlation is significant at the 0.05 level (two-tailed). *High Correlation
Table 57 showcases a stronger correlation between the teacher-learning culture and
survey items related to innovation-stimulating items. For both types of schools, two of the four
items correlated highly with the teacher-learning culture, and only item 21correlated highly to
the high-trust culture. For low-growth schools, all four items correlated highly with the teacher-
learning culture; only item 21 demonstrated a high correlation with the high-trust culture.
Compared to high-growth schools, all of the items of low-growth schools except one
manifested a stronger correlation with each kind of culture. Only item 20 did not display a
significant relationship with each kind of culture. For high-growth schools, item 20 did not
possess a significant correlation with the student-learning culture (rxy = .256) or with the high-

105
trust culture (rxy = .293). For low-growth schools, item 20 did not display a significant
correlation to the student-learning culture (rxy = .324).
Table 57
Correlations between Culture-Related Items and Innovation-Stimulating Items
School Type Culture-Related Item
Item 19
Item 20
Item 21
Item 22
Mean
High-Growth Student-Learning 0.485 0.256 0.531 0.398 0.418 Low-Growth Student-Learning 0.535 0.324 0.409 0.462 0.433 Both Types Student-Learning 0.519 0.303 0.448 0.390 0.415 High-Growth High-Trust 0.481 0.293 0.669 0.506 0.487 Low-Growth High-Trust 0.694 0.613 *.841 0.600 0.687 Both Types High-Trust 0.554 0.416 *.746 0.550 0.567 High-Growth Teacher-Learning 0.685 0.389 0.659 0.389 0.531 Low-Growth Teacher-Learning *.800 *.805 *.836 *.837 *.820 Both Types Teacher-Learning *.733 0.582 *.746 0.586 *.662
Correlation is significant at the 0.05 level (two-tailed). *High Correlation
Table 58 displays one high correlation between the teaching-learning culture and the two
items related to supporting innovation. For both types of schools, item 23 exhibited a high
correlation with the teacher-learning culture. Thus, this set of items correlated more strongly to
the teacher-learning culture than the other two cultures.
Compared to low-growth schools, high-growth schools manifested a stronger correlation
between items 23 and 24 and the student-learning culture. In contrast with high-growth schools,
the low-growth schools exhibited a stronger correlation between items 23 and 24 and the high-
trust culture and the teacher-learning culture. For these two survey items, however, only high-
growth schools showed a significant correlation to the student-learning culture. Low-growth
schools exhibited insignificant correlations between the student-learning culture and item 23
(rxy = .279) and item 24 (rxy = .267). For high-growth schools, item 24 did not exhibit a
significant correlation with the teacher-learning culture (rxy = .160).

106
Table 58
Correlations between Culture-Related Items and Innovation-Supporting Items
School Type Culture-Related Item
Item 23
Item 24
Mean
High-Growth Student-Learning 0.432 0.474 0.453 Low-Growth Student-Learning 0.279 .267 0.273 Both Types Student-Learning 0.375 0.362 0.369 High-Growth High-Trust 0.523 0.331 0.427 Low-Growth High-Trust 0.528 0.549 0.539 Both Types High-Trust 0.480 0.428 0.454 High-Growth Teacher-Learning 0.624 0.160 0.392 Low-Growth Teacher-Learning 0.651 0.728 0.690 Both Types Teacher-Learning *.621 0.466 0.544
Correlation is significant at the 0.05 level (two-tailed). *High Correlation
Table 59 presents the Pearson correlations for the model’s primary sets of leadership
behaviors in relation to each of the three cultures. One primary set of leadership behaviors is
classified as managerial and the other set is classified as transformational. Compared to the
transformational items, items 2 through 11, which represent managerial–instructional leadership,
correlated slightly higher with the student-learning culture. Compared to the managerial items,
items 13 through 17 and items 19 through 24, which represent transformational–instructional
leadership, correlated highest with the culture of teacher-learning and the culture of high-trust
(see Table 59). Transformational-instructional leadership manifests six of eleven behaviors that
are highly correlated to the teacher-learning culture and five of eleven behaviors that are highly
correlated to the high-trust culture. Managerial-instructional leadership exhibits three of ten
behaviors that are highly correlated to the teacher-learning culture and the high-trust culture.

107
Table 59
Correlations between Culture-Related Items and Managerial Items and Transformational Items
Managerial 2 3 4 5 6 7 8 9 10 11 x Student-Learning 0.50 0.58 0.43 0.45 0.50 0.34 0.50 0.46 0.40 0.42 x High-Trust 0.54 0.49 0.49 0.51 *.68 0.58 *.67 0.59 *.68 0.46 x Teacher-Learning *.63 0.56 0.59 *.64 0.61 0.57 0.59 *.64 0.55 0.55 x Transformational 13 14 15 16 17 19 20 21 22 23 24 Student-Learning 0.39 0.43 0.51 0.44 0.41 0.52 0.30 0.45 0.39 0.38 0.36 High-Trust *.80 *.62 0.58 *.67 *.64 0.55 0.42 *.75 0.55 0.48 0.43 Teacher-Learning *.68 0.56 0.59 *.78 *.71 *.73 0.58 *.75 0.59 *.62 0.47 Correlation is significant at the 0.05 level (two-tailed). *High Correlation
The Pearson correlations found in Table 60 display the correlation strength between the
three culture-related items and the five sets of leadership behaviors. The five sets of leadership
behaviors include: (a) set the focus on quality teacher and rigorous learning, (b) keep the focus
on quality teaching and rigorous learning, (c) model the ideals of trustworthiness and innovation,
(d) stimulate innovation and collaboration, and (e) support innovation with observation and
feedback.
For both types of schools, focus-setting items 2–6, demonstrated two behaviors of five
that correlated highly with the teacher-learning culture and one behavior of five that correlated
highly with the high-trust culture. Focus-keeping items 7–11, manifested two behaviors of five
that were highly correlated with the high-trust culture and one behavior of five that were highly
correlated with teacher-learning culture. Trust-building items 13–17, exhibited four behaviors of
five that displayed a high correlation with the high-trust culture and three of five that displayed a
high correlation with the teacher-learning culture. Change-stimulating items 19–22, displayed
two highly correlated items out of four with the teaching-learning culture and one highly
correlated item with the high-trust culture. Change-supporting items 23–24, exhibited one highly
correlated item out of two behaviors with the teacher-learning culture.

108
Table 60
Correlations between Culture-Related Items and the Five Sets of Leadership Behaviors
Focus-Setting Behaviors
Item 2
Item 3
Item 4
Item 5
Item 6
Mean
Student-Learning 0.50 0.58 0.43 0.45 0.50 0.49 High-Trust 0.54 0.49 0.49 0.51 *.68 0.54 Teacher-Learning *.63 0.56 0.59 *.64 0.61 0.61
Focus-Keeping Behaviors
Item 7
Item 8
Item 9
Item 10
Item 11
Mean
Student-Learning 0.34 0.50 0.46 0.40 0.42 0.42 High-Trust 0.58 *.67 0.59 *.68 0.46 0.59 Teacher-Learning 0.57 0.59 *.64 0.55 0.55 0.58
Trust-Building Behaviors
Item 13
Item 14
Item 15
Item 16
Item 17
Mean
Student-Learning 0.39 0.43 0.51 0.44 0.41 0.44 High-Trust *.80 *.62 0.58 *.67 *.64 *.66 Teacher-Learning *.68 0.56 0.59 *.78 *.71 *.66 Change-Stimulating
Behaviors Item 19
Item 20
Item 21
Item 22
Mean
Student-Learning 0.52 0.30 0.45 0.39
0.42 High-Trust 0.55 0.42 *.75 0.55
0.57
Teacher-Learning *.73 0.58 *.75 0.59
*.66 Change-Supporting
Behaviors Item 23
Item 24
Mean
Student-Learning 0.38 0.36
0.37 High-Trust 0.48 0.43
0.45
Teacher-Learning *.62 0.47 0.54 Correlation is significant at the 0.05 level (two-tailed). *High Correlation
In conclusion, this chapter includes a presentation of all the results. With the use of
descriptive statistics, the researcher calculated the differences between high-growth schools and
low-growth schools as shown in Table 7. Using the Mann–Whitney U Test for each survey item,
Table 8 presented whether any significant differences existed between both types of schools.
Moreover, the researcher presented a table of results comparing both types of schools with an
item analysis of each survey item. Coupled with the item analysis table, the researcher presented
a table of qualitative themes with their respective frequency. At the end of this chapter, tables of

109
correlations displayed the quantitative relationship between leadership behaviors and the cultures
created by those behaviors.

110
Chapter V
Discussion
This chapter reviews the significance of the study, presents a summary of the results, and
proposes interpretations of the study’s findings. The quantitative findings answer the following
research question: What differences exist in leadership behaviors between middle school
principals who lead schools of high growth in learning and those who lead schools of low
growth? The qualitative findings answer the following research question: What specific actions
performed by principals align with effective leadership behaviors found in research?
This chapter also addresses this study’s four hypotheses:
1. (H1) Effective middle school principals practice an integrated approach of
instructional leadership behaviors and transformational leadership behaviors.
2. (H2) Managerial-instructional leadership behaviors correlate highly to the building of
strong student-learning cultures of high expectations and support.
3. (H3) Transformational-instructional leadership behaviors correlate highly to the
creation of collaborative, teacher-learning cultures of innovation and support and
high-trust cultures of commitment and satisfaction.
4. (H4) Modeling ideals of trustworthiness and innovation correlate highly to a high-
trust culture of commitment and satisfaction.
Significance of the Study
When conducting the literature review for this study, the researcher was unable to locate
studies that considered the impact of school leadership on student achievement as measured by
growth models (Hallinger, 2011; Leithwood & Jantzi, 2005). Growth achievement, rather than
status achievement, minimizes the effect of student backgrounds and stands as a reliable, non-

111
biased means of measuring learning and quantifying the impact of an instructional program (Di
Carlo, 2012; Gordon, Kane, & Staiger, 2006; Lipscomb, Teh, Gill, Chiang, & Owens, 2010;
Zvoch & Stevens, 2006). Traditionally, researchers have used status achievement rather than
growth achievement as the preferred student outcome to measure the impact of school leadership
on student learning for quantitative studies (Hallinger, 2011; Leithwood & Jantzi, 2005).
Proponents of growth models assume that all students can exhibit adequate annual growth with
quality instruction—regardless of their current levels of status achievement, which is affected by
socioeconomic and other background factors (Di Carlo, 2012; Gordon et al., 2006; Lipscomb et
al., 2010; Zvoch & Stevens, 2006).
Since school leadership among principals serves as the most critical factor impacting
student achievement, second to only to quality instruction, a compelling case for additional
research exists regarding the impact of successful school leadership on academic growth (Louis
et al., 2010; Markow, Macia, & Lee, 2013). Based on prior studies, researchers have developed
comprehensive lists of effective leadership behaviors used in schools, like the example of
Marzano’s meta-analysis (2005). This researcher synthesized a comprehensive instructional
leadership model from two of the most common school leadership models used in educational
research to conduct new research. The new model includes instructional and transformational
leadership behaviors in tandem. Therefore, the researcher assumes that the newly-developed
comprehensive model of instructional leadership more accurately represents the current
leadership function of principals and more effectively measures school leadership among
principals (Marks & Printy, 2003).
Based on this new model, the researcher used the Comprehensive Instructional
Leadership Survey to measure the differences in leadership styles, including the sharing of

112
leadership. The new instrument also measures the differences in three different types of school
cultures created by the associated leadership behaviors of principals. The principal’s ability to
create school culture is widely supported in the literature (Hallinger, 2003, 2005; Leithwood &
Jantzi, 2005; Marzano, Waters, & McNulty, 2005). Research indicates that principals primarily
influence the student-learning culture within classrooms and the teacher-learning culture within
the school (Hallinger, 2005; Leithwood & Jantzi, 2005). A high-trust culture of commitment and
satisfaction also originates from a healthy and productive culture of professional learning (Bryk
& Schneider, 2002; Harchar & Hyle, 1996; Louis & Wahlstrom, 2010; Robinson, 2010).
Additionally, the Comprehensive Instructional Leadership Survey gathered themes to clarify
specific actions that practicing principals perform. The results of the study confirmed the validity
and reliability of the new model of comprehensive instructional leadership.
The researcher selected the school leadership of middle school principals as a focus, since
the leadership of secondary principals had been shown to be inadequate in raising student
achievement when compared to that of elementary schools in the wide-scale, comprehensive
research of Louis and Wahlstrom, 2010. The research indicated that this finding was primarily
attributed to the ineffective efforts of secondary principals to build teacher-learning cultures of
collaboration through shared leadership, which results in limited trust and lowered student
achievement (Louis & Wahlstrom, 2010).
Summary of Results
This section summarizes the quantitative differences, both insignificant and significant,
between high-growth middle schools and low-growth middle schools. The summarized
differences answer the first primary research question: What differences exist in leadership
behaviors between middle school principals who lead schools of high growth in learning, and

113
those who lead schools of low growth? Some of the summarized differences also address the first
hypothesis (H1). The correlation results address the remaining hypotheses: H2, H3, and H4.
Rather than answer the second research question in this section with a list of specific themes
performed by principals as found in chapter four, the researcher used some of the most frequent
themes listed in chapter four to corroborate the results related to the highest-rated leadership
behaviors and the lowest-rated leadership behaviors in the comprehensive instructional
leadership model. The second research question asks: What specific actions performed by
principals align with effective leadership behaviors found in research? Each qualitative theme
presented in this section aligns with a specific researched-based leadership behavior in the
model.
First hypothesis. Using the Comprehensive Instructional Leadership Survey, 21
leadership behaviors and three culture-related items measured the differences between middle
school principals of high-growth schools and middle school principals of low-growth schools
(see Appendix A). According to mean values of Figure 3, high-growth schools displayed higher
results on 17 items, and low-growth schools sported higher results on seven items. High-growth
schools executed nine of the items at a high-level (above 4.00 mean); low-growth schools
performed only five items at a high level. High-growth schools underperformed on two
leadership behavior, and low-growth schools underperformed on three (below 3.50 mean).

114
Figure 3
Mean Comparisons within the Comprehensive Instructional Leadership Model
The pattern of high-growth schools outperforming low-growth schools on a high majority
of the leadership behaviors confirmed the first hypothesis (H1) which states: Effective middle
school principals practice an integrated approach of instructional leadership behaviors and
transformational leadership behaviors. As displayed in Figure 3, among the ten behaviors related
to instructional leadership, high-growth schools outperformed low-growth school in eight of
them. Among the 11 transformational behaviors, high-growth schools outperformed low-growth
schools in eight. High-growth schools executed six of the ten instructional behaviors at a high
level and two of the eleven transformational behaviors at a high level. Comparing both sets of

115
leadership behaviors, the middle school principals of this study performed more instructional
leadership behaviors at a high level than transformational behaviors. The ratio of highly-
performed behaviors of instructional leadership and highly performed behaviors of
transformational leadership behaviors fell at 6:2 for high-growth schools and 2:2 for low-growth
schools (see Figure 3). These results illustrate that the effective middle school principals
approach their work with an integration of leadership behaviors to balance top-down
management with bottom-up shared leadership. Additionally, the results reveal that effective
middle school principals are stronger instructional supervisors than professional learning
facilitators.
Favorable differences for low-growth middle schools. Considering the comparisons of
means in Figure 3, middle school principals of low-growth schools surpassed middle school
principals of high-growth schools in performing five leadership behaviors. Principals of high-
growth schools do not outperform low-growth schools at utilizing representative leadership
teams and providing opportunities for staff input (see Figure 3, Item 6). The difference between
the two is minimal (p=.495). This leadership behavior is important because it involves
stakeholders in setting the focus of school improvement and provides input opportunities for the
staff, which propagates buy-in from the staff. If shared leadership were to potently impact
student learning, one would expect high-growth middle schools to outperform low-growth
schools in distributing leadership and decision-making, or one would expect this leadership
behavior to be performed at a high level compared to other leadership behaviors. Instead, both
types of schools exhibited a mean below the high level of 4.0 (x ̅h=3.91, x̅l=3.97). Research
substantially confirms, however, that when teachers are involved in leadership and decision-

116
making, their satisfaction increases (Cotton, 2003; Leithwood & Jantzi, 2005; Louis &
Wahlstrom, 2011; McCarley, 2012; Shatzer, 2009).
Likewise, high-growth schools did not surpass low-growth schools at protecting teachers
from distractions and maximizing instructional time and resources (see Figure 3, Item 7). Once
again, the difference between the two types of schools is minimal (p=.485). Both types of
schools struggle to protect teachers from distractions and “initiatives” overload as indicated by
low means when compared to other leadership behaviors (x ̅h=3.51; x̅l=3.53). As a management
task, this leadership behavior does not require shared leadership, but the performance of the task
convincingly influences the teaching and learning environment of the school and teacher
satisfaction, commitment and even trust of the school.
Continuing with the comparisons in Figure 3, principals of high-growth schools did not
outperform low-growth schools in relation to establishing collaborative structures with shared
leadership for the continuous professional learning of teachers (see Figure 3, Item 21). The
difference between the two types of schools is minimal (p=.254). Comparing this leadership
behavior, both types of schools create collaborative structures of shared leadership above the
lowest means (x ̅h=3.77, x̅l=3.88). The behavior of structured teacher collaboration is the
substance the teacher-learning culture. Again, however, one would expect that high-growth
middle schools would outperform low-growth middle school in sharing leadership or would
expect this leadership behavior to be performed at a higher level, if it profoundly impacts the
student-learning culture. The positive difference of shared leadership on learning growth appears
tenuous compared to the well-documented teacher satisfaction that originates from teacher
collaboration and shared leadership (Cotton, 2003; Leithwood & Jantzi, 2005; Louis &
Wahlstrom, 2011; McCarley, 2012; Shatzer, 2009).

117
Moreover, principals of high-growth schools did not best low-growth schools in
exhibiting strong expertise in curriculum, instruction, and assessment; the difference between the
two, however, is not significant (see Figure 3, Item 16). Compared to other leadership behaviors,
the means for both types of schools fell above the lowest means (x ̅h=3.71, x̅l=3.75). Lastly, low-
growth schools outperformed high-growth schools in taking a hands-on approach to assist
teachers with developing and aligning standards-based curriculum and assessment with a
minimal difference (see Figure 3, Item 22). Compared to other leadership behaviors, principals
taking a hands-on approach exhibited a low mean for both kinds of schools (x̅h=3.23, x̅l= 3.50).
Both of these leadership behaviors are related. Principals demonstrate their expertise in
curricular and instructional work through taking hands-on role of facilitation. Principals cannot
directly guide and facilitate curriculum work without instructional expertise or without making
their involvement a priority. The low performance of these two leadership behaviors negatively
impacts professional learning and teacher satisfaction.
Cultural differences. The researcher designed three items within the Comprehensive
Instructional Leadership Survey to measure three different kinds of cultures created by
principals. Looking at Figure 3, Item 2, principals of both high-growth and low-growth schools
create a strong student-learning culture of high expectations and support as indicated by higher
means (x ̅h=4.33, x̅l= 4.03). High growth-schools, however, create much stronger student-
learning culture with a nearly significant difference (p=.075). One would expect high-growth
schools to realize and indicate that they possess a certain prowess in creating a well-managed,
highly-productive culture of student learning because those schools actually achieve high results
with state accountability assessments. From their collective experience of success, those high-

118
growth schools develop an efficacious confidence that they can produce high results in student
learning.
Two of the three culture-related items, the high-trust culture and teacher-learning culture,
were rated higher by low-growth schools than high-growth schools. Principals of low-growth
schools outperformed principals of high-growth schools in creating a high-trust culture of
satisfaction and commitment (see Figure 3, Item 12). The difference between both kinds of
schools is nearly significant (p=.081). In relation to creating a high-trust culture, high-growth
schools exuded a mean that is nearly the lowest of means when compared to other leadership
behaviors (x ̅h=3.62), and low-growth schools exhibited a higher mean of 3.88. The researcher
assumed that high-growth schools would gain an advantage in raising student achievement
through higher levels of teacher collaboration and shared leadership. The result of high-growth
schools creating a less abundant culture of trust, satisfaction and commitment reflects the
likelihood that high-growth schools do not collaborate to learn and lead professionally as they
should. This likelihood exists because the involvement of teachers in learning and leading boosts
teacher satisfaction. The said likelihood was reflected in the results of low-growth schools
outperforming high-growth schools in creating teacher-learning. Both categories of schools
manifested fairly high means compared to other leadership behaviors in regards to the teacher-
learning culture (x ̅h=3.93, x̅l=3.97). The difference is minimal.
Similar leadership struggles. Middle school principals of both high-growth and low-
growth schools inadequately performed three common leadership behaviors. First, middle school
principals of both types of schools struggle with the leadership behavior of minimizing
distractions as shown by some of the lowest means (see Figure 3, Item 7). In alignment with the
leadership behavior that minimizes distractions for teachers, three primary themes emerged (see

119
Table 21). The most frequent theme for this leadership behavior indicated that teachers
experienced “initiatives” overload, which distracted them from their focus on teaching and
learning. Among the 15 responses regarding overload, 14 originated from educators within high-
growth schools, which corroborates the finding that high-growth schools did not outperform low-
growth school in protecting teachers from distractions. This may also suggest a reason educators
of high-growth schools rated their high-trust culture of satisfaction and commitment lower than
that of low-growth schools. The qualitative comments related to the “initiatives” overload
revealed that teachers were less than satisfied with accompanying stress-laden culture of too
many initiatives. Furthermore, qualitative comments painted high-growth principals as
ambitious, driven leaders who push their teachers to the edge of their competence and capacity
with a multiplicity of initiatives.
Secondly, principals of both categories of schools did not excel at taking a hands-on
approach with curricular development as indicated by some of the lowest means (see Figure 3,
Item 22). According to Table 49, the most frequent theme related to this leadership behavior
indicated that a principal’s hands-on approach in curricular development and instructional design
was not evident. In relation to this theme, 14 of the 19 responses originated from high-growth
schools. This qualitative result suggests one reason that low-growth schools outscored high-
growth schools on this leadership behavior and also suggests another contributing factor
regarding why high-growth schools were rated lower in creating a high-trust culture of
satisfaction and commitment. Research shows that principals who interact with teachers
regarding curriculum work and instructional issues build trust (Bryk & Schneider, 2002; Harchar
& Hyle, 1996; Louis & Wahlstrom, 2010). Principals who do not engage in such leadership
behavior lose valuable trust-building capacity. Research also confirms that principals do not take

120
a hands-on approach because they lack instructional expertise, or they lack the management
skills to make time for the priority (Hallinger, 2003; Shatzner, 2009).
Thirdly, as indicated by the low means, principals of both types of schools fall short in
providing teachers additional support with the assistance of an instructional coach (see Figure 3,
Item 24). The most frequent theme related to this leadership behavior indicated that teachers did
not receive assistance from instructional coaches (see Table 53). The second most frequent
theme indicated that assistance from an instructional coach only occurred as needed. These
results indicate that use of building-level instructional coaches is not widespread for either high-
growth or low-growth middle schools. Research indicates that instructional coaches can exert a
powerful impact on the deep implementation of previously-learned strategies through providing
follow-up support and training to teachers (Knight & Cornett, 2008).The instructional leadership
of principals could be expanded through the investment of instructional coaches. Principals of
high-growth schools provide some of this support through observation and feedback, but
principals of low-growth middle schools exhibited a low mean in frequently observing teachers
and offering them feedback (x ̅h=3.50).
Pervasive focus on teaching and learning. Middle school principals of high-growth
schools created pervasive focus on quality teaching and rigorous learning by executing four
focus-setting behaviors at a high level. Regarding the first focus-setting leadership behavior,
principals of both types of schools established a robust focus on teaching and learning with a
purposeful mission and vision as indicated by higher means (see Figure 3, Item 2). The most
frequent theme indicates that educators were able to identify a specific focus set by the school’s
principal related to teaching and learning (see Table 11). The other top themes included

121
communicating the mission and vision of the school at regular meetings and using the school
mission and vision to guide decisions and actions.
In relation to the second focus-setting behavior of utilizing specific student achievement
goals to set a concentrated focus on teaching and learning, principals of high-growth schools
performed significantly better than low-growth schools (see Figure 3, Item 3). Related to this
leadership behavior, the most frequent theme emerged as a goal of focus promoted by the
principal (see Table 13). In relation to this top theme, only two of 17 responses originated from
low-growth schools. This supports the quantitative results indicating that principals of high-
growth schools create a goal-driven culture for student learning. Other top themes included
principals continually revisiting goals, and principals using state assessments to make specific
goals for student achievement.
With respect to the third focus-setting leadership behavior, principals of both kinds of
schools effectively created a school focus through establishing high expectations for teaching
and learning as shown with high means (see Figure 3, Item 4). The most frequent theme related
to this leadership behavior entailed a specific expectation of focus expressed and promoted by
the principal (see Table 15). Other top themes included the principal communicating
expectations orally face to face, in the evaluation tool, and with the use of data. These results
suggest that principals of high and low-growth schools constantly clarify performance-
expectations for teachers.
Concerning the fourth and final focus-setting leadership behavior, high-growth middle
schools manifested a nearly significant difference over low-growth middle schools in creating
policies, procedures, and practices that support quality instruction and rigorous learning (see
Figure 3, Item 5). A specific procedure of focus emerged from the qualitative data as the most

122
frequent theme (see Table 17). Other top themes included consistent enforcement of procedures
and communication of procedures at staff meetings. These results suggest that principals of high-
growth extend above that of principals of low-growth to promote and enforce school procedures
that focus on teaching and learning.
Monitoring the focus of teaching and learning. To keep the focus on quality teaching
and rigorous learning, principals of high-growth schools perform two leadership behaviors at
high levels. With regard to the first focus-keeping leadership behavior, principals of high-growth
schools recognized the contributions and instructional successes of teachers and academic
achievements and growth of students (see Figure 3, Item 10). The most frequent theme indicated
that teachers were publicly recognized for school and individual achievements (see Table 27).
The second most frequent theme, however, indicated that the recognition of teachers needs to be
improved. Some teachers commented that praise for teachers was not adequately widespread.
Any time principals recognize teachers they run the risk of excluding teachers who feel
deserving of recognition which leads to dissatisfaction. To improve teacher satisfaction,
principals must adopt ways to distribute recognition to a broad base of teachers who execute the
priorities of the school (Marzano et al., 2007).
As for the next focus-keeping leadership behavior, principals of high-growth middle
schools monitored student progress in learning challenging standards and provided instructional
interventions as necessary (see Figure 3, Item 11). High-growth schools provided systematic
ways to intervene above that of low-growth schools with significant difference (p=.054). High-
growth schools possess the organizational management to systematically monitor student
progress and then apply interventions when students struggle. As the most frequent theme,
intervention teams, which meet regularly to discuss the progress of struggling students, apply

123
necessary interventions (see Table 29). Among the14 responses, 11 originated from high-growth
schools. The other top themes indicated that schools provided an intervention period and schools
intervened based on data. Six of the 10 responses regarding the existence of an intervention
period originated from high-growth schools. These qualitative results support the significant
difference between principals of high-growth schools and principals of low-growth schools when
monitoring student progress and intervening when necessary (p=.054). This leadership behavior
not only requires effective middle school principals to organize resources to monitor student
struggles and provide interventions; it requires functional collaboration and shared leadership.
Building trust in similar ways. The high-growth middle schools and low-growth middle
schools in this study execute two trust-building leadership behaviors at a high level. In relation to
the first trust-building leadership behavior, both types of middle school principals demonstrated
ideals of optimism by being confident and expressing confidence in the abilities of teachers to
make instructional innovations (see Figure 3, Item 14). The most frequent theme indicated that
principals optimistically express confidence in teachers when they give teachers latitude and
support to make instructional innovations (see Table 34). The second most frequent theme
indicated that teachers perceived principals as school leaders who take an optimistic approach
when seeking to improve teaching.
Regarding the second trust-building leadership behavior, the middle school principals
displayed strong beliefs of what effective teaching is and that all students can experience high
growth in learning with effective teaching (see Figure 3, Item 15). Specific beliefs regarding
effective teaching and learning emerged as the most frequent theme (see Table 36). Principals
communicated strong beliefs regarding teaching and learning through displaying examples and
modeling effective teaching strategies. For high-growth middle schools only, the principals

124
communicated beliefs regarding teaching and learning through presentations to staff and through
the evaluation process.
Significant differences. Among the 24 items in the comprehensive instructional
leadership model, this study yielded three significant differences between the middle school
leadership of high-growth schools and low-growth schools (see Figure 3). The high-growth
middle schools of this study exhibited significantly higher results than low-growth middle school
at: 1) effectively creating a strong focus with specific student-achievement goals (P=.014), 2)
providing a system to intervene when students struggle to meet challenging standards (P=.054),
and 3) frequently observing teachers with feedback that promotes instructional conversations
(P=.031). Effective principals manage a high-growth learning culture through setting the focus
with student achievement goals, keeping the focus through monitoring student progress and
intervening as needed, and through providing frequent observational feedback related to quality
teaching.

125
Figure 4
Correlation Comparison with the Comprehensive Instructional Leadership Model
The researcher hypothesized that related sets of leadership behaviors contribute to the
creation of different cultures. Correlations between the three cultures and the other 21 leadership
behaviors of the study were calculated to confirm or reject three hypotheses: H2, H3, and H4.
(H2) Managerial-instructional leadership behaviors correlate highly to the building
of strong student-learning cultures of high expectations and support.
(H3) Transformational-instructional leadership behaviors correlate highly to the creation of
collaborative, teacher-learning cultures of innovation and support and high-trust cultures of
commitment and satisfaction.

126
(H4) Modeling ideals of trustworthiness and innovation correlate highly to a high-trust culture of
commitment and satisfaction.
Second hypothesis. The Pearson Correlations between the two primary sets of leadership
behaviors and the three cultures in Table 59 assisted to evaluate the second hypothesis (H2) and
the third hypothesis (H3). In the model (Figure 4), one primary set of leadership behaviors is
classified as managerial-instructional and the other set as transformational-instructional. In Table
59, no high correlations exist between the student-learning culture and the managerial behaviors
or the transformational behaviors. The mean value of the combined correlations is greater
between the student-learning culture and the managerial behaviors over that of the
transformational behaviors, but the results do not confirm the second hypothesis (H2), which
states: Managerial-instructional leadership behaviors correlate highly to the building of strong
student-learning cultures of high expectations and support. Although a relationship exists
between the managerial behaviors that principals perform and the creation of a strong student-
learning culture, this relationship did not exhibit a high correlation as was anticipated by the
researcher.
Third hypothesis. The Pearson Correlations for each managerial behavior and each
transformational behavior exhibited a moderate level of correlation with the three different
cultures. The correlations between transformational behaviors and the teacher-learning culture
exude a high correlation. In Table 59, six transformational behaviors of 11 correlated highly with
the teacher-learning culture (55%). Moreover, the combined mean of the transformational
behaviors transcends the moderate level to a high correlation level. Only three managerial
behaviors of ten correlated highly to the teacher-learning culture (30%). One would expect this

127
result because transformational leadership involves teachers in organizational and professional
learning (Leithwood & Jantzi, 2005; Shatzer, 2009).
Likewise, the high-trust culture correlated higher with transformational-instructional
behaviors than the managerial-instructional behaviors as proposed by the comprehensive
instructional leadership model of this study. Because of the trustworthy modeling of
transformational leadership, the researcher expected a higher correlation with cultural trust. In
Table 59, five transformational behaviors of 11 correlated highly with the high-trust culture
(45%). Once again only three managerial behaviors of ten correlated highly to the high-trust
culture (30%). These combined results confirm the third hypothesis (H3): Transformational-
instructional leadership behaviors correlate highly to the creation of a collaborative, teacher-
learning cultures of innovation and support and a high-trust cultures of commitment and
satisfaction.
Fourth hypothesis. The high correlations in Figure 4 confirm the fourth hypothesis (H4):
Modeling ideals of trustworthiness and innovation correlate highly to a high-trust culture of
commitment and satisfaction. The set of transformational-instructional behaviors titled Modeling
Ideals of Trustworthiness and Innovation correlated highly with the high-trust culture as
predicted with the fourth hypothesis. As shown in Figure 4, four trust-building behaviors of five
correlated highly with the culture of trust (80%). One focus-setting behavior of five (20%), two
focus-keeping behaviors of five (40%), and two change-stimulating behaviors of four (50%)
correlated highly with the high-trust culture. These results clarify the transformational
relationship between modeling trustworthy leadership behaviors and promoting trust throughout
the culture of the school.

128
No specific hypotheses predicted which other sets of leadership behaviors would
correlate highly with the teacher-learning culture and student-learning culture. Each set of
transformational behaviors exhibit a higher percent of highly-correlated behaviors with the
teacher-learning culture than do the sets of managerial behaviors. These correlation findings
substantiate the most correlated path to increase the professional learning of a school is through
transformational leadership. One would expect this outcome because transformational behaviors
stimulate new professional learning (Leithwood & Jantzi, 2005; Shatzer, 2009).
Culture of trust and professional learning. Each of the 21 leadership behaviors of the
comprehensive instructional leadership model correlate at a moderate or high level to each of the
schools cultures of this study. Although many leadership behaviors of this study correlate highly
with the culture of trust and the culture of professional learning, no leadership behaviors
manifest a high correlation with the student-learning culture. This pattern of high correlation
with the high-trust culture and the teacher-learning culture is even more prominent for low-
growth schools. These results suggest that many of the leadership behaviors of the
comprehensive instructional leadership model manifest strong ties to transformational leadership,
which is known for creating professional learning and teacher satisfaction.
In Figure 4, eight leadership behaviors correlate highly with creating a high-trust culture
of satisfaction and commitment. The three leadership behaviors with the highest correlations
related to building a culture of high trust include: 1) principals utilizing a representative
leadership team and input from staff to set the focus for teaching and learning for continuous
school improvement, 2) principals building and maintaining relationships with teachers with
personal communication and individualized concern, and 3) principals establishing collaborative

129
structures with shared leadership to stimulate professional learning and the development of
curricular units aligned to assessments.
In Figure 4, nine leadership behaviors express high correlation in building a
collaborative, teacher-learning culture of innovation and support. The four leadership behaviors
with the highest correlation in constructing a teacher-learning culture include: 1) principals
exhibiting expertise in curriculum, instruction and assessment to support teachers in making
instructional innovations, 2) principals model ideals of innovation by questioning the status quo,
taking risk to innovate and making it safe for teachers to innovate, 3) principals using
challenging standards to set an instructional focus, goals and expectations that inspire and guide
teachers in making instructional innovations, and 4) principals utilizing collaborative structures
with shared leadership to stimulate professional learning and development of aligned curriculum
and assessment.
Discussion of Findings
Valid and reliable survey instrument. The Comprehensive Instructional Leadership
Survey represents a valid, reliable tool that accurately measures the current function of school
leadership. The findings of this study confirm that the comprehensive instructional leadership
model functions as a valid and reliable instrument that accurately measures the current role of
effective school leadership. The measurement of content validity for the Comprehensive
Instructional Leadership Survey indicated that the item-level content validity index fell at .98,
which exceeded the acceptable level of .90 (Polit & Beck, 2006). Reliability as measured by
Cronbach’s Alpha fell at .966. Hence, the reliability of the Comprehensive Instructional
Leadership Survey exceeded the .90 level of excellence (George & Mallery, 2003).

130
The model of this study was designed according to research to serve as an accurate
representation of the current function of effective school leadership (Cotton, 2003; Hallinger,
2011, Leithwood & Jantzi, 2005; Marks & Printy, 2003; Marzano et al., 2005). As expected, the
middle school principals of high-growth schools outperformed the principals of low-growth
middle schools on the majority of leadership behaviors (see Figure 3). These results, which favor
high-growth schools in the majority of cases and with a significant difference in some cases,
substantiate that the comprehensive instructional leadership model accurately represents
effective school leadership.
Effective middle school principals execute the model of research-based leadership
behaviors beyond other principals. These findings suggest that effective middle school principals
exert a greater influence on the growth of student learning, since they perform a majority of the
leadership behaviors in the Comprehensive Instructional Leadership Model at a higher level than
do other principals. The comprehensive aggregate of leadership behaviors performed seems to
possess a heavier impact on improving student learning. In Figure 3, not only did principals of
high-growth middle schools perform 17 of 24 leadership behaviors at a higher level than among
low-growth middle schools, they executed nine leadership behaviors above a high level (4.00).
Low-growth schools, on the other hand, only performed five behaviors above a high level.
Additionally, principals of high-growth middle schools executed three key leadership behaviors
significantly higher than low-growth middle schools (see Figure 3). High-growth middle school
principals manage a productive culture of student-learning through setting the focus with student
achievement goals, keeping the focus through monitoring student progress and intervening as
needed, and through providing frequent observational feedback related to quality teaching.

131
Integrated leadership with instructional emphasis. Effective middle school principals
exercise an integrated form of instructional and transformational leadership with a higher
execution of instructional leadership. The growing complexity of education requires an
integrated approach of eclectic leadership behaviors to manage the school’s instructional
program and its learning environment, while allowing time to create a professional learning
culture that generates instructional innovations necessary to implement standards-based
education (Louis et al., 2010; Louis & Wahlstrom, 2011; Marks & Printy, 2003; Southworth,
2002). Other researchers have developed some comprehensive lists of school leadership
behaviors similar to Marzano’s meta-analysis (2005), but the researcher of this study synthesized
the comprehensive instructional leadership model from two of the most common school
leadership models used in educational research to conduct new research. The model includes a
synthesis of instructional and transformational leadership behaviors (Hallinger, 2011, Leithwood
& Jantzi, 2005; Marks & Printy, 2003).
The results confirmed that comprehensive model of instructional leadership accurately
represents the complex function of school leadership and that effective middle school principals
exercise an integrated approach of instructional and transformational leadership (Marks & Printy,
2003). Principals of high-growth middle schools performed eight of ten instructional leadership
behaviors above those of low-growth schools. In Figure 3, principals of high-growth middle
schools performed eight of eleven transformational leadership behaviors above that of low-
growth schools. With a ratio of 6:2, however, effective middle school principals performed more
instructional leadership behaviors above a high level (4.00) than transformational leadership
behaviors above a high level (see Figure 3). Performing higher than low-growth schools in
carrying out the aggregate of leadership behaviors coupled with the high performance of

132
instructional leadership behaviors over transformational leadership behaviors appear to possess a
heavier impact on improving student learning (Marks & Printy, 2003).
Few empirical studies have examined the effects of integrated leadership (Marks &
Printy, 2003). The findings of this study and others offer accumulating evidence that an
integrated approach of comprehensive instructional leadership with strong leadership from the
principal and shared leadership with teachers improves student learning (Louis et al., 2010;
Louis & Wahlstrom, 2011; Marks & Printy, 2003; Southworth, 2002). Although this study’s
high-performing principals did not share leadership significantly better than the low-performing
principals, results of this study provide additional confirmation that an integrated leadership style
of instructional and transformational behaviors with strong top-down direction from the principal
produces higher impact on learning (Marks & Printy, 2003).
When comparing the effects of instructional leadership and transformational leadership
on student achievement with 23 different studies, the results indicated that instructional
leadership elevated the impact on student achievement over transformational leadership
(Robinson et al., 2008; Shatzner, 2009). Accordingly, this study’s high-performing principals
exhibited stronger instructional leadership than transformational leadership. This further
confirms that transformational leadership is not sufficient without strong instructional leadership
to manage the student-learning culture (Marks & Printy, 2003).
Pervasive focus and strong monitoring behaviors. Effective middle school principals
create extremely strong student-learning cultures of high expectations and support by setting a
pervasive focus on teaching and learning, and by keeping the focus through monitoring the
progress of teaching and learning. The findings of this study suggest that effective middle school
principals create an extremely strong student-learning culture of high expectations and support,

133
which may significantly contribute to their school’s achievement in producing high growth in
learning (see Figure 3, Item 1). As indicated by a nearly significant difference (p=.075), the
student-learning culture of high-growth middle schools exceeds the highly-rated student-learning
culture of low-growth middle schools. Individually none of the leadership behaviors found in the
comprehensive instructional leadership model correlated highly with the creation of the student-
learning culture, but the primary set of managerial-instructional behaviors correlated moderately
with the student-learning culture and correlated slightly higher than did the transformational-
instructional behaviors.
In Figure 3, principals of high-growth middle schools exceled at performing six of the ten
managerial-instructional behaviors at a high level. The collective performance of managerial-
instructional behaviors may exhibit the strongest influence on creating a robust student-learning
culture. Above all other sets of leadership behaviors, high-growth schools demonstrated high
execution of the leadership behaviors that create a pervasive focus on teaching and learning.
Creating a clear and compelling focus on teaching and learning contends as the most important
work of the principal in creating productive culture (Cotton, 2003; Hallinger, 2005, 2011;
Marzano et al., 2005). Likewise in keeping the focus on teaching and learning, high-growth
schools performed two of the five behaviors at a high level.
The findings of this study further suggest that effective middle school principals manage
a high-yield culture of student-learning through performing three key instructional management
strategies significantly higher than low-performing schools: 1) effectively creating a strong focus
with specific student-achievement goals, 2) consistently providing a system to intervene when
students struggle to meet challenging standards, and 3) frequently observing teachers with
feedback that promotes instructional conversations. All of these leadership behaviors directly

134
relate to Hallinger’s instructional leadership model (see Appendix B). Hallinger (2003) asserts
that his instructional leadership behaviors construct a high-performing culture of student-
learning. Accordingly, the results suggest that these three behaviors significantly impacted the
learning of students within the high-growth middle schools of this study.
Autocratic slant to shared leadership. Effective middle school principals are slightly
more autocratic than democratic with their approach to collaboration, shared leadership, and
decision-making compared to those of low-growth middle schools. Contrary to some existing
research (Harris et al., 2007; Lineburg, 2010; Marks & Printy, 2003), the findings of this study
suggest that effective middle school principals are slightly more autocratic and directive than
democratic and facilitative with their approach to collaboration, shared leadership, and decision-
making compared to those of low-growth middle schools . Principals of high-growth middle
schools appear less proficient in facilitating bottom-up collaboration with shared leadership,
which in turn leads to lower trust, satisfaction, and commitment, and to a slightly weaker
teacher-learning culture of innovation and support. Considering Item 6 and 21 in Figure 3,
principals of high-growth middle schools do not utilize a representative leadership team nor
solicit staff input as well as low-growth middle schools. Secondly, principals of high growth
middle schools do not establish collaborative structures with shared leadership for teachers’
continuous professional learning, and they did not facilitate the development of curricular units
with aligned assessments as well as low-growth middle schools. The correlation results of this
study indicate that both of these leadership behaviors are highly correlated with creating a high-
trust culture of satisfaction and commitment (see Figure 4, Item 6 & 21).
Table 18 presents four qualitative responses, which indicate that high-growth schools
lack representative leadership, which corroborates the above conclusion. Considering Table 44,

135
nine qualitative responses of 11 indicate teachers of high-growth schools lack satisfaction with
the collaborative structures of shared leadership. These findings align with Louis and
Wahlstrom’s finding (2010) that secondary principals struggle to share leadership and to
stimulate meaningful and functional collaboration between teachers. Louis et al. (2010) learned
from their extensive research that results appear mixed regarding the impact of distributed
leadership on student achievement. Increased influence from teachers in formal decision making
or leadership roles may have an insignificant impact on student achievement without the strong
instructional leadership of a principal (Louis et al., 2010).
This lack of shared leadership and highly functional collaboration may also imply that
principals of high-growth middle schools are first and foremost effective top-down instructional
managers who create strong student-learning culture of high expectations and support. Effective
management of a school builds the foundation for successful change (Louis et al., 2010). School
improvement efforts generate the most success when principals effectively manage the teaching
and learning environment of their schools and achieve stability and consistency (Louis et al.,
2010). In contrast, poorly-managed schools, which lack essential infrastructure create a void of
stable conditions necessary to produce deep change (Louis et al., 2010; Marzano et al., 2005).
Middle school principals of high-growth schools significantly outperformed low-growth
schools in managing their schools with specific achievement goals, with a system to monitor
student progress toward goals and intervene when necessary, and with frequent observation of
instruction with feedback. The frequent execution of observing instruction with feedback
indicates strong school management. Strong management allows principals to make time for a
priority such as consistently observing classrooms and providing feedback. May and Supovitz,
(2011) discovered that teachers experienced frequent observation and feedback from principals

136
unrelated to the size of the school and that the principal’s instructional interactions with
individual teachers significantly related to instructional changes. Hallinger (2003) confirmed a
correlation between the principal’s direct work of supervising the instruction of teachers with
teacher effectiveness and student achievement for elementary schools, which implicated that
school size or school management may serve as a limiting factor (Hallinger, 2003).
The findings of this study indicate that effective middle school principals create a less
favorable culture of trust, satisfaction, and commitment when compared to low-growth schools.
In addition to the lower levels of shared leadership, which negatively impacted the levels of trust,
satisfaction and commitment, this study provides other evidential reasons behind high-growth
middle schools incurring a low-rated culture of trust when compared to low-growth middle
schools. The difference between the two kinds of schools is nearly significant (p=.081). From
transformational leadership research, evidence suggests that sharing leadership and decision-
making with teachers through collaborative working relationships not only impacts learning
outcomes positively but also job satisfaction and organizational commitment (Leithwood &
Jantzi, 2005; Shatzer, 2009). In addition to the two leadership-sharing behaviors mentioned
previously, low-growth middle schools outperformed high-growth middle schools on two
curriculum-coordinating behaviors that influence how principals collaboratively interact with
teachers while working on curricular and instructional tasks. Effective middle school principals
lack superiority in demonstrating instructional expertise with curriculum work and through
taking on a hands-on approach to assist teacher with curriculum work.
In relation to the first curriculum-coordinating behavior, principals of low-growth middle
schools outperformed high-growth schools by a minor margin in displaying expertise in
curriculum, instruction, and assessment necessary to support teachers in making instructional

137
innovations. This type of curricular and instructional expertise allows principals to collaborate
with teachers effectively while working on curriculum and is highly correlated with a high trust
culture of satisfaction and commitment (see Figure 4, Item 21). The next curriculum-
coordinating behavior actually involves the principal taking a hands-on approach in coordinating
the curricular and instructional work. Once again principals of low-growth schools outperformed
principals of high-growth schools in this regard. Both type of principals, however, performed this
leadership behavior at a low level and it was the lowest rated behavior for high-growth schools
(see Figure 3, Item 22).
By the nature of the qualitative responses regarding the leadership behavior of protecting
teachers from distractions, the researcher contends that this low-rated behavior contributed a
culture of dissatisfaction which manifested itself in the lower than expected measurement of a
high-trust culture of satisfaction and commitment in the survey. The most frequent theme for this
leadership behavior indicated that teachers in high-growth schools experienced “initiatives”
overload, which distracted them from their focus on teaching and learning. Among the 15
responses regarding overload, 14 originated from educators within high-growth schools, which
corroborates the finding that high-growth schools did not outperform low-growth school in
protecting teachers from distractions. Even though principals of high-growth schools create an
extremely strong focus on teaching and learning, the findings reveal they take on too much too
fast with school initiatives.
Professional learning and building trust. The correlation findings of this study confirm
the relationship between a high-trust culture of commitment and satisfaction and a healthy,
productive culture of professional learning (Bryk & Schneider, 2002; Harchar & Hyle, 1996;
Louis & Wahlstrom, 2010; Robinson, 2010). Transformational-instructional behaviors in this

138
study’s model more closely correlate with the building of a high-trust culture of satisfaction,
commitment, and a culture of professional learning than the managerial-instructional behaviors
(see Figure 4). The combined performance of transformational leadership behaviors may exhibit
a stronger influence on creating trust, satisfaction, and commitment as well as stimulating
collaboration and the professional learning of teachers. The trust-building behaviors depicted in
Figure 4 correlated highly with the high-trust culture of schools (80%) and the culture of the
professional learning of teachers (60%). The other transformational behaviors inclusive of
stimulating and supporting change correlated highly to the professional learning of teachers.
Louis and Wahlstrom (2011) contend that teachers’ trust in their principal indicates the
principal’s involvement in creating a cohesive teacher-learning culture. Principals possess the
responsibility to build a functional learning community with teachers that leads to increased
commitment, satisfaction, and trust (Bryk & Schneider, 2002; Harchar & Hyle, 1996; Louis &
Wahlstrom, 2010; Robinson, 2010). Louis and Wahlstrom (2011) describe the connection
between the culture of trust and the culture of professional learning, “When principals talk about
instruction, visit classrooms, and make instructional quality a visible priority, teachers are more
likely to trust the principal” (pg. 55). The correlation findings of this study support this claim.
Effective middle school principals fell short in creating a high-trust culture by not
adequately sharing leadership, involving themselves in curriculum work, and protecting teachers
from initiatives overload, but created a solid teacher-learning culture and exceled at observing
teachers and providing feedback when compared to low-growth middle schools. Principals of
low-growth schools created higher trust through shared leadership and hands-on facilitation of
curriculum work to match their strong teacher-learning culture, but lacked in observing teachers
and providing feedback.

139
Functional teacher-learning cultures support strong student-learning cultures. Another
claim related to this study states that the school culture of how teachers collaborate, learn
together, and treat each other impacts the student-learning culture of the school (Louis &
Wahlstrom, 2011; McCarley, 2012). This claim was substantiated with finding that the middle
school principals of this study created a strong culture of teacher-learning and a strong culture of
student-learning.
Impact of Limitation
Marshall and Rossman (2011) explained that every research design possesses limitations.
One limitation of this study involved the small sample of ten Idaho schools. In spite of only
selecting ten schools to participate, the sample size of survey participants was statistically
adequate for both categories of schools (Tanner, 2012). The generalizability of this study may
not be as strong with highly urban, high-minority, high-poverty schools, but the findings are
highly applicable to the middle schools and junior high schools in Idaho specifically and highly
applicable to school leadership across the country in general.
Using the Idaho Star Rating System for schools, the researcher selected ten middle
schools and junior high schools based on learning growth as measured with the Idaho Standards
Achievement Test. Many of selected schools in Idaho reside in rural communities. Each of the
school’s populations predominantly consists of Caucasian students with Hispanics as the primary
minority. The study’s sample of schools included some Title I schools, which serve a large
portion of students on free or reduced lunch. Selecting schools based on growth, however, is
arguably the most nonbiased way to limit the effect of student background on student
achievement (Di Carlo, 2012; Gordan et al., 2006; Lipscomb et al., 2010; Zvoch & Stevens,
2006). As evidence, each category of schools, both high-growth and low-growth, included

140
middle schools and junior high schools, schools with smaller populations (250 and above) and
schools with larger student populations (750 and above), and schools with Title I status.
The researcher assumed that all students can achieve adequate annual growth regardless
of their current proficiency levels, which were affected by socioeconomic and other background
factors. The researcher assumed that using achievement growth as the selection criteria would
minimize the effects of school demographics and student backgrounds. Evidence from recent
growth models in pilot states suggests that traditional low-performing schools based on
proficiency rankings can outperform traditional high-performing schools when compared using a
growth model (Parry, 2010).
Conclusion
The newly-designed comprehensive model of instructional leadership proved valid and
reliable in measuring the complex nature of school leadership in the 21st century. These findings
confirmed that effective middle school principals perform a tandem of instructional leadership
behaviors and transformational leadership behaviors to lead their schools in achieving high
growth in learning. The principals of high-growth middle schools performed many of integrated
leadership behaviors at a high level of execution, the majority of which were performed beyond
the level of low-growth middle schools, and three leadership behaviors were performed
significantly better than low-growth middle schools.
The researcher’s newly-developed comprehensive instructional leadership survey not
only measured the differences in leadership styles, including the sharing of leadership and
decision-making, but also the differences in creating three types of school cultures that greatly
impact learning of students, professional trust, and the professional learning of teachers. The

141
study quantified the correlations between five sequenced sets of researched-based leadership
behaviors that the survey measured and three school cultures that the survey measured.
The findings of this study confirmed that effective middle school principals create a
strong teaching and learning culture of high expectations and support within the school through a
more directive, top–down, managerial focus on student achievement, intervention, and
instruction (Hallinger, 2003, 2005, 2010). Principals of high-growth middle schools
outperformed low-growth middle schools with a significant difference at 1) effectively creating a
strong focus with specific student-achievement goals, 2) providing a system to intervene when
students struggle to meet challenging standards, and 3) frequently observing teachers with
feedback that promotes instructional conversations. All three of these leadership behaviors
directly relate to Hallinger’s (1985) instructional leadership model (see Appendix B). This
finding also confirmed that transformational leadership ignites a collaborative, bottom–up
professional learning culture of shared leadership that is highly correlated to creating a high-trust
culture of teacher satisfaction and commitment (Leithwood & Jantzi, 2005; Marzano et al.,
2005).
Recommendations for Further Research
The researcher would like to apply the comprehensive instructional leadership model to
other levels of schools, which possess a variety of demographics. The research would be able to
generate results for elementary schools, middle schools, and high schools. The results would be
able ascertain differences in leadership style and cultural perception between the different levels
of schools. With enough confirmatory research, the comprehensive instructional leadership
model could become more predictive of high-growth achievement. With predictive capabilities,
142
the comprehensive instructional leadership model would serve as an effective evaluation tool
used to improve school leadership as well as create and implement school improvement plans.
Because of the research base behind the comprehensive instructional leadership survey
and model as well as the confirmatory results of the study, its findings possess high value in
extending the existing research of school leadership. Especially, the cultural correlations between
individual behaviors within a sequenced set add valuable understanding to the existing research.
The specificity of leadership practices within this new model provides clarity that other
leadership models do not provide (Louis et al., 2010; Southworth, 2002).
Implications for Professional Practice
Researchers of previous studies have developed comprehensive lists of school leadership
behaviors, such as Marzano’s 2005 meta-analysis. The researcher of this study synthesized a
comprehensive instructional leadership model from two of the most common school leadership
models used in educational research to conduct the new research. The new model includes
instructional and transformational leadership behaviors in tandem. The results of this new model
indicate that it more accurately represents the current leadership function of principals and more
effectively measures the school leadership of principals (Marks & Printy, 2003).
The newly-developed research instrument of this study holds promise as an effective tool
to guide school improvement through the improvement school leadership. Research confirms
that the improvement of school leadership contends as the most influential factor on students’
learning—second only to teachers’ classroom instruction (Louis, Leithwood, Wahlstrom, &
Anderson, 2010). By federal regulations, states are required to support schools that struggle
achieve adequate student achievement. Mandated school improvement could be effectively
guided with the use of the Comprehensive Instructional Leadership Survey and research.

143
Using the survey and research of this study, principals possess a unique position to
influence school improvement in a way that possesses the greatest impact on student learning
through improving the instruction of teachers (Hattie, 2002; Louis et al., 2010). Replete evidence
indicates school leadership bears the encompassing responsibility of implementing all initiatives
aimed at school improvement (Hallinger, 2011; Leithwood & Jantzi, 2005; Louis et al., 2010).
Effective schools cannot exist without effective principals and school leadership (Cotton, 2003;
Louis et al., 2010).

144
References
Balyer, A. (2012). Transformational leadership behaviors of school principals: A qualitative
research based on teachers’ perceptions. International Online Journal of Educational
Sciences, 4(3), 581-591.
Bas, G., & Yavuz, M. (2010). Perceptions of elementary teachers on the instructional leadership
role of school principals. US-China Education Review, 7(4), 4-65.
Bass, B. (1985). Leadership and performance beyond expectations. New York, NY: Free Press.
Bass, B. (1997). Does the transactional-transformational leadership paradigm transcend
organizational and national boundaries? American Psychologist, 52(2), 130-139.
Bass, B., & Avolio, B., (1995). The multifactor leadership questionnaire (5x). Palo Alto, LA:
Mind Garden.
Bass, B., & Riggio, R., (2006). Transformational leadership: Industrial, military and educational
impacts. Mahwah, NJ: Lawrence Erlbaum Associates, Publishers.
Beatty, B. (2007). Going through the emotions: Leadership that gets to the heart of school
renewal. Australian Journal of Education, 51(3), 328-340.
Bryk, A. S., & Schneider, B. L. (2002). Trust in schools: A core resource for improvement. New
York: Russell Sage Foundation Publications.
Butler, X.B. (2012). In what ways do principals impact school climate in ‘turnaround‘ successful
high-poverty middle schools. (Doctoral dissertation). Retrieved from ProQuest
Dissertation and Theses. (UMI 3490744)
Cornett, J., & Knight, J. (2008). Research on coaching. Retrieved
from http://www.instructionalcoach.org/images/downloads/research-
pubs/Cornett_Knight_2008.pdf

145
Cotton, K., (2003). Principals and student achievement: What the research says. Alexandria,
VA: Association for Supervision & Curriculum Development.
Creswell, J.W., (2008). Educational research: Planning, conducting, and evaluating quantitative
and qualitative research. Boston, MA: Pearson-Education, Inc.
Di Carlo, M. (2012). How to use value-added measures right. Educational Leadership, 11, 38-
42.
Doyle, M.E., & Rice, D.M. (2002). A model for instructional leadership. Principal
Leadership, 3(3), 49. Retrieved from the ProQuest database.
Ejimofor, F.O. (2007). Principals’ transformational leadership skills and their teachers’ job
satisfaction in Nigeria (Doctoral dissertation). Retrieved from Electronic Thesis and
Dissertation database. (UMI#3298282)
Fullan, M. (2008). The six secrets of change. San Francisco: Jossey-Bass.
Francera, S.F., & Bliss, J.R. (2011). Instructional leadership influence on
collective teacher efficacy to improve school achievement. Leadership and Policy in
Schools, 10, 349–370.
George, D., & Mallery, P. (2003). SPSS for Windows step by step: A simple guide and
reference. 11.0 update (4th ed.). Boston: Allyn & Bacon.
Gordon, R., Kane, T., & Staiger, D. (2006). Identifying effective teachers using performance on
the job. Washington, DC: Brookings Institution.
Greb, W. (2011). Principal leadership and student achievement: What is the effect of
transformation leadership in conjunction with instructional leadership on student
achievement? (Doctoral dissertation). (UMI No. 3468985)

146
Hallinger, P., & Murphy, J. (1985). Assessing the instructional leadership behavior of principals.
Elementary School Journal, 86, 217-248.
Hallinger, P. (2003). Leading change: Reflections on the practice of instructional
and transformational leadership. Cambridge Journal of Education, 33(3), 330-345.
Hallinger, P. (2005). Instructional leadership and the school principal: A passing fancy that
refuses to fade away. Leadership and Policy in Schools, 4, 221–239.
Hallinger, P. (2011). A review of three decades of doctoral studies using the principal
instructional management rating scale: A lens on methodological progress in educational
leadership. Educational Administration Quarterly, 47(2), 271-306.
Hechanova R.M., & Cementina-Olpoc, R. (2012). Transformational leadership, change
management, and commitment to change: A comparison of academic and business
organizations. Asia-Pacific Education Researcher, 22, 11–19.
Harchar, R.L., & Hyle, A.E. (1996) Collaborative power: A grounded theory of administrative
instructional leadership in the elementary school. Journal of Educational Administration,
34(3), 15-29.
Harris, A., Leithwood, K., Day, C., Sammons, P., & Hopkins, D. (2007). Distributed leadership
and organizational change: Reviewing the evidence. Journal of Educational Change,
8(4), 337-347.
Hattie, J. (2002). How, what, and why: Six things school leaders should know about educational
research. Principals Centre and King’s Institute. Retrieved
from http://www.education.auckland.ac.nz/uoa/hattie-papers-download

147
Hattie, J. (1999). Influences on student learning. Inaugural Lecture. Retrieved
from: http://www.education.auckland.ac.nz/uoa/home/about/staff/j.hattie/hattie-papers-
download/influences
Idaho Department of Education (2013). Star rating system. Retrieved from
http://www.sde.idaho.gov/site/assessment/starRating.htm
Jackson, K.M., & Marriot, C. (2012). The interaction of principal and teacher instructional
influence as a measure of leadership as an organizational quality. Educational
Administration Quarterly, 48(2), 230-258.
Kotter, J. P. (1996). Leading change, Boston, MA: Harvard Business School Press.
Kouzes, J.M. & Posner, B. Z. (1990). The leadership challenge. San Fransisco, CA: Jossey-Bass.
Lambert, L. (2002). Beyond instructional leadership: A framework of shared leadership.
Retrieved from http://johnwgardnertestsite.pbworks.com/f/S4%20Readings%20-
%20Lambert%20Article.doc
Lee, M., Hallinger, P., & Walker, A. (2012). A distributed perspective on instructional
leadership in international baccalaureate (IB) schools. Educational Administration
Quarterly, 48(4), 664-669.
Leithwood, K., Jantze, D., & Steinback, R., (1999). Changing leadership for changing times.
Philadelphia, PA: Open University Press.
Leithwood, K., & Jantzi, D. (2000). The effects of transformational leadership on organizational
conditions and student engagement within school. Journal of Educational
Administration, 38(2), 112-129.
Leithwood, K., Steinbach, R., & Jantzi, D. (2002). School leadership and teachers’ motivation to
implement accountability policies. Educational Administration Quarterly, 38(1), 94-119.

148
Leithwood, K., Jantzi, D., Earl, L., Watson, N., Levin, B., & Fullan, M. (2004). Strategic
leadership for large-scale reform: The case of England’s National Literacy and Numeracy
Strategy. School Leadership & Management, 2(1), 57-79.
Leithwood, K., & Jantzi, D. (2005). Review of transformational school leadership research
1996–2005. Leadership and Policy in Schools, 4, 177–199.
Leithwood, K. & Jantzi, D. (2006). Transformational school leadership for large-scale reform:
Effects on students, teachers, and their classroom practices. School Effectiveness and
School Improvement, 17(2), 201 – 227.
Louis, K.S., Leithwood, K., Wahlstrom, K.L., & Anderson, S.E. (2010). Learning from
leadership: Investigating the links to improved student learning. The Wallace Foundation.
Retrieved from http://www.wallacefoundation.org/knowledge-center/school-
leadership/key-research/Documents/Investigating-the-Links-to-Improved-Student-
Learning.pdf
Lewis, P.S., Goodman, S.H., & Fandt, P.M. (2006). Management: Challenges in the 21st
century, second edition. Cincinnati, OH: South Western College Publishing.
Lineburg, P.N. (2010). The influence of the instructional leadership of principals on change in
teachers’ instructional practices. (Doctoral dissertation). Available from ProQuest
Dissertations and Theses. (UMI No. 19095)
Lipscomb, S., Teh, B., Gill, B., Chiang, H., & Owens, A. (2010). Teacher and principal value-
added: Research findings and implementation practices. Washington, DC: Mathematica
Policy Research.
Louis, K.S., & Wahlstrom, K. (2011). Principals as cultural leaders. Phi Delta Kappan, 92(5),
52-56.

149
Markow, D, Macia, L., & Lee, H., (2013). Metlife survey of the American teacher: Challenges
for school leadership: A survey of teachers and principals conducted for Metlife, Inc.
Retrieved from https://www.metlife.com/assets/cao/foundation/MetLife-Teacher-Survey-
2012.pdf?utm_source=ascdexpress&utm_medium=email&utm_campaign=express814
Marks, H.M., & Printy, S.M. (2003). Principal leadership and school performance: An
integration of transformational and instructional leadership. Educational Administration
Quarterly, 39(3), 370-397.
Marshall, C., & Rossman, G.B. (2011). Designing qualitative research. (5th ed.). Los Angeles,
CA: Sage Publications, Inc.
Marzano, R.J., Waters, T., & McNulty, B.A. (2005). School leadership that works: From
research to results. Alexandria, VA: Association for Supervision and Curriculum
Development.
May, H. & Supovitz J.A. (2011). The scope of principal efforts to improve instruction.
Educational Administration Quarterly, 47(2), 332–352.
Minus, E.L. (2010) Leading in the middle: Leadership behaviors of middle level principals that
promote student achievement (Doctoral dissertation). Retrieved from ProQuest
Dissertation and Theses. (AAT 3397616)
McCarley, T.A. (2012). Transformational leadership related to school climate (Doctoral
dissertation). Retrieved from ProQuest database. (UMI#3535675)
McCoy J.V. (2011). A multiple case student of principal’s instructional leadership in level 5
schools of excellence for improvement (Doctoral dissertation). Retrieved from ProQuest
Dissertation and Theses. (UMI 3482388)

150
Nunnelley, J., Whaley, J., Mull, R., & Hott, G. (2003). Brain compatible secondary schools: The
visionary principal’s role. NASSP Bulletin, 87(637), 48-59.
Ohlson, M. (2009). Examining instructional leadership: A study of school culture and teacher
quality characteristics influencing student outcomes. Florida Journal of Educational
Administration & Policy, 2(2), 102-125.
Omary, A.A., Khasawneh, S.A., & Abu-Tineh, A.M. (2009). Kouzes and Posner's
transformational leadership model in practice: The case of Jordanian schools. Journal of
Leadership Education, 7(3), 265-283.
Parry, W. (2010). A new take on test scores: Some struggling schools look much better when
judged by student growth. Retrieved
from http://www.stamfordadvocate.com/news/article/A-new-take-on-test-scores-Some-
struggling-367203.php
Podsokoff, P., MacKenzie, S., Moorman, R., & Fetter, R. (1990). Transformational leader
behaviors and their effects on followers’ trust in leader satisfaction, and organizational
citizenship behaviors. The Leadership Quarterly, 1(2), 107–142.
Printy, S. M., & Marks, H.M. (2006). Shared leadership for teacher and student learning. Theory
Into Practice, 45(2), 125-132.
Prytula, M.P. (2012). Teacher metacognition within the professional learning community.
International Education Studies, 5(4), 112-121.
Robinson, V.J. (2010). From instructional leadership to leadership capabilities: Empirical
findings and methodological challenges. Leadership and Policy in Schools, 9, 1–26.
Robinson, V. M. J., Lloyd, C. A., & Rowe, K. J. (2008). The impact of leadership on student

151
outcomes: An analysis of the differential effects of leadership types. Educational
Administration Quarterly, 44(5), 635-674.
Ross, J. A., & Gray, P. (2006) Transformational leadership and teacher commitment to
organizational values: The mediating effects of collective teacher efficacy. School
Effectiveness and School Improvement, 17(2), 179-199.
Sandbakken, D.A. (2004). The factor structure of Kouzes and Posner leadership practices
inventory (LPI) revisited in a Norwegian Context. (Doctoral dissertation). Retrieved from
Electronic Thesis and Dissertation database. (UMI No. 1861811977)
Sahin, S. (2011). The relationship between instructional leadership style and school culture.
Educational Sciences: Theory & Practice, 11(4), 1920-1927.
Siegle, D. (2009). Critical values of the Pearson product-moment correlation coefficient.
Retrieved from http://www.gifted.uconn.edu/siegle/research/correlation/corrchrt.htm
Senge, P. M. (1990). The fifth discipline: The art and practice of the learning
organization. New York, NY: Currency Doubleday.
Shatzer, R. H. (2009). A comparison study between instructional and transformational
leadership theories: Effects on student achievement and teacher job satisfaction
(Doctoral Dissertation). Available from ProQuest Dissertations and Theses. (UMI No.
3399100)
Southworth, G. (2002). Instructional leadership in schools: Reflections and empirical evidence.
School Leadership and Management, 22(1), 73–91.
Stewart, J. (2006). Transformational leadership: An evolving concept examined through the
works of Burns, Bass, Avolio, and Leithwood. Canadian Journal of Educational
Administration and Policy, 54, 1-28.

152
U.S. Department of Education (2013). Guidance, fact sheets, and reports. Retrieved from
http://www2.ed.gov/admins/lead/account/growthmodel/index.html
Vodicka, D., (2006). The four elements of trust. Professional Learning. 27-30.
Youngs, P., & King, M. B. (2002). Principal leadership for professional development to build
school capacity. Educational Administration Quarterly, 38(5), 643.
Zvoch, K., & Stevens, J. J. (2006). Successive student cohorts and longitudinal
growth models: An investigation of elementary school mathematics performance.
Education Policy Analysis Archives, 14(2). Retrieved
from http://epaa.asu.edu/epaa/v14n2/

153
Appendix A
Comprehensive Instructional Leadership Survey
To participate in this study, school leaders, language arts teachers and mathematics teachers will be asked to take a one-time Comprehensive Instructional Leadership Survey. The survey may take 30 minutes. The participation of the school will be confidential and individual responses to the survey items will be anonymous. The survey will be securely administered by Qualtrics. The willful completion of the survey indicates the informed consent of the participants and their permission to use the results for this research project. All participants have the right to discontinue their participation in the study at any time. The primary researcher, Kasey Teske, can be reached at [email protected] or 208-316-7578 if any assistance is needed or if any concerns or questions about this study arise. Any questions may also be directed to the Committee Chair this study, Dr. Heidi Curtis, at [email protected] or 208-467-7612. [select agree] What is your position? Building Administrator, Language Arts Teacher,
Mathematics Teacher
How long have you been in your current position? 1-2 years, 3-5 years, 6 or more years
What is the name of your school? [school name]
Directions: 1) rate the level at which the below school leadership behaviors were exhibited the last two school years (2011-2013) by the principal or other leaders in the school, and 2) write specific actions of how the principal or other leaders in your school demonstrated each leadership behavior.
1-Strongly Disagree, 2-Disagree, 3-Undecided, 4-Agree, 5-Strongly Agree Creating a Student-Learning Culture of High Expectations and Support
Level
1. Creates a student-learning culture of high expectations and support.
1 2 3 4 5
Setting the Focus on Quality Teaching and Rigorous Learning
Level Specific Actions (Please try to give at least one example
for each.) 2. Develops and advocates a school mission and vision with associated beliefs and values focused on quality teaching and rigorous learning.
1 2 3 4 5
3. Establishes and promotes specific school-wide goals focused on high performance in student learning.
1 2 3 4 5
4. Communicates and reinforces high-performance expectations for teachers and students focused on teaching and learning.
1 2 3 4 5
5. Provides and enforces school policies, procedures and practices that are focused on quality teaching and rigorous learning.
1 2 3 4 5
6. Utilizes a representative leadership team of staff members to set the focus on the continuous improvement of teaching and learning and provides opportunities for staff input.
1 2 3 4 5
Directions: 1) rate the level at which the below school leadership behaviors were exhibited the last two school years (2011-2013) by the principal or other leaders in the school, and 2) write specific actions of how the principal or other leaders in your school demonstrated each leadership behavior.
1-Strongly Disagree, 2-Disagree, 3-Undecided, 4-Agree, 5-Strongly Agree Keeping the Focus on Quality Teaching and Rigorous Learning
Level Specific Actions (Please try to give at least one example

154
for each.) 7. Protects teachers from distractions and maximizes instructional time and resources for quality teaching and rigorous learning.
1 2 3 4 5
8. Maintains high visibility and accessibility with frequent communication to stakeholders regarding quality teaching and rigorous learning. 1 2 3 4 5
9. Maintains a keen awareness of the situational reality of the school in order to anticipate and prevent problems that may have a negative impact on quality teaching and rigorous learning.
1 2 3 4 5
10. Recognizes contributions and instructional successes of teachers and academic achievements and growth of students.
1 2 3 4 5
11. Monitors student progress in learning challenging standards and provides instructional interventions as necessary.
1 2 3 4 5
Directions: 1) rate the level at which the below school leadership behaviors were exhibited the last two school years (2011-2013) by the principal or other leaders in the school, and 2) write specific actions of how the principal or other leaders in your school demonstrated each leadership behavior.
1-Strongly Disagree, 2-Disagree, 3-Undecided, 4-Agree, 5-Strongly Agree Fostering a High-Trust Culture of Commitment and Satisfaction
Level
12. Fosters a high-trust culture of commitment and satisfaction. 1 2 3 4 5
Modeling Ideals of Trustworthiness and Innovation
Level Specific Actions (Please try to give at least one example
for each.)
13. Builds and maintains relationships with teachers through personal communication and individualized concern.
1 2 3 4 5
14. Demonstrates ideals of optimism by being confident and expressing confidence in the abilities of teachers to make instructional innovations.
1 2 3 4 5
15. Displays strong beliefs of what effective teaching is and that all students can experience high growth in learning with effective teaching.
1 2 3 4 5
16. Exhibits strong expertise in curriculum, instruction and assessment necessary to support teachers in making instructional innovations.
1 2 3 4 5
17. Models ideals of innovation by questioning the status quo, taking risks to innovate and making it safe for teachers to take risks.
1 2 3 4 5
Directions: 1) rate the level at which the below school leadership behaviors were exhibited the last two school years (2011-2013) by the principal or other leaders in the school, and 2) write specific actions of how the principal or other leaders in your school demonstrated each leadership behavior.
1-Strongly Disagree, 2-Disagree, 3-Undecided, 4-Agree, 5-Strongly Agree

155
Creating a Teacher-Learning Culture of Instructional Innovation and Support Level
18. Creates a teacher-learning culture of instructional innovation and support.
Stimulating collaboration and Instructional Innovation
Level Specific Actions (Please try to give at least one example
for each.) 19. Uses challenging standards to set an instructional vision, goals and expectations that inspire and guide teachers in making instructional innovations.
1 2 3 4 5
20. Provides training for teachers to learn best practices and empowers them to make instructional innovations within the curriculum to improve student performance on assessments.
1 2 3 4 5
21. Establishes collaborative structures with shared leadership for the continuous professional learning of teachers and the development of curricular units with aligned assessments.
1 2 3 4 5
22. Takes a hands-on approach to assist teachers with developing and aligning standards-based curriculum and assessment that allows for instructional innovations
1 2 3 4 5
Directions: 1) rate the level at which the below school leadership behaviors were exhibited the last two school years (2011-2013) by the principal or other leaders in the school, and 2) write specific actions of how the principal or other leaders in your school demonstrated each leadership behavior.
1-Strongly Disagree, 2-Disagree, 3-Undecided, 4-Agree, 5-Strongly Agree Developing Teachers and Supporting Instructional Innovation
Level Specific Actions (Please try to give at least one example
for each.) 23. Observes instruction frequently with feedback and questioning to teachers that elicits reflection and instructional conversations related to the instructional vision, goals and expectations.
1 2 3 4 5
24. Provides teachers additional support to make instructional innovations with the assistance of an instructional coach.
1 2 3 4 5
Source: Teske, K. (2014)

156
Appendix B
Comprehensive Instructional Leadership Model’s Alignment to Existing Models Instructional Leadership
Transformational Leadership
21 School Leader’s Responsibilities
Comprehensive School Leadership Model
Hallinger (1985) 1. Defining the School Mission 1.1 Frame the school goals 1.2 Communicate the school goals 2. Developing the School Learning Environment 2.1 Protect instructional time 2.2 Maintain high visibility 2.3 Provide incentives for learning 2.4 Provide incentives for teachers 3.3 Monitor student progress 3.2 Coordinate the curriculum 3. Managing the Instructional Program 3.1 Supervise & evaluate instruction 3.4 Promote professional development
Leithwood and Jantzi (2005) 1. Setting Directions 1.1 Vision (inspirational motivation) 1.2 Group goals 1.3 High-performance expectations 3.3 Building productive relations with parents and the community 4. Transactional/Managerial Aggregate 4.2 Management by exception (active) 4.1 Contingent reward 2.3 Modeling key values and practices (idealized influence) 2.2 Intellectual stimulation 3. Redesigning the Organization 3.1 Helping to build collaborative cultures 3.2 Creating structures to foster collaboration 2. Helping People 2.1 Individualized consideration & support
Marzano et al. (2005) 5. Culture 8. Focus 16. Order 10. Input 6. Discipline 19. Resources 21. Visibility 4. Communication 17. Outreach 20. Situational awareness 1. Affirmation 3. Contingent Rewards 5. Culture 18. Relationship 15. *Optimizer 9. *Ideals/beliefs 13. *Knowledge of C. I. A. 2. *Change Agent 7. *Flexibility 11. *Intellectual stimulation 12. Involvement in C.I.A. 14. *Monitor/evaluate
1. Set Focus on Teaching & Learning 1. Develop a school vision of quality teaching for challenging learning 2. Establish specific school-wide student achievement goals 3. Communicate high-performance expectations 4. Provide school procedures, practices and policies 5. Use leadership team and allow for staff input 2. Keep Focus on Teaching & Learning 6. Minimize distractions and maximize instructional time and resources 7. Maintain high visibility and accessibility with frequent communication to stakeholders 8. Anticipate and prevent problems 9. Recognize academic achievements and growth of students and contributions and instructional successes of teachers 10. Monitor student progress and provide interventions as necessary 3. Model Ideals of trust &Innovation 11. Build relationships with individualized concern for teachers 12. *Model ideals of optimism. 13. *Model strong teaching and learning beliefs 14. *Exhibit instructional expertise 15. *Model ideals of innovation. 4. Stimulate Instructional Innovation 16. Set instructional vision, goals and expectations 17. *Share best practices and empowers teachers to innovate C.I.A. 18. Establishes collaborative structures for continuous professional learning 19. Coordinate the development of aligned C.I.A. 5. Support Instructional Innovation 20. *Monitor/evaluate instruction with feedback to teachers 21. Develop teachers with training and coaching
*behaviors correlate to effecting 2nd order change. Source: Teske, K. (2014)

157
Appendix C
Critical Values of the Pearson Product-Moment Correlation Coefficient df = n -2
Level of Significance (p) for Two-Tailed Test
.10 .05 .02 .01
df 1 2 3 4 5 6 7 8 9 10 11 12 13 14 15 16 17 18 19 20 21 22 23 24 25 26 27 28 29 30 35 40 45 50 60 70 80 90 100
.988
.900
.805
.729
.669
.622
.582
.549
.521
.497
.476
.458
.441
.426
.412
.400
.389
.378
.369
.360
.352
.344
.337
.330
.323
.317
.311
.306
.301
.296
.275
.257
.243
.231
.211
.195
.183
.173
.164
.997
.950
.878
.811
.754
.707
.666
.632
.602
.576
.553
.532
.514
.497
.482
.468
.456
.444
.433
.423
.413
.404
.396
.388
.381
.374
.367
.361
.355
.349
.325
.304
.288
.273
.250
.232
.217
.205
.195
.9995
.980
.934
.882
.833
.789
.750
.716
.685
.658
.634
.612
.592
.574
.558
.542
.528
.516
.503
.492
.482
.472
.462
.453
.445
.437
.430
.423
.416
.409
.381
.358
.338
.322
.295
.274
.256
.242
.230
.9999
.990
.959
.917
.874
.834
.798
.765
.735
.708
.684
.661
.641
.623
.606
.590
.575
.561
.549
.537
.526
.515
.505
.496
.487
.479
.471
.463
.456
.449
.418
.393
.372
.354
.325
.303
.283
.267
.254 Source: Siegle, D. (2009)