Embed Size (px)
Citation preview
1
3
4
5
6
7 Q1
8 Q2
9
1 1
1213141516
17181920212223
2 4
48
49
50
51
52
53
54
55
56
Q1
Ad Hoc Networks xxx (2014) xxx–xxx
ADHOC 1083 No. of Pages 30, Model 3G
8 August 2014
Q1
Contents lists available at ScienceDirect
Ad Hoc Networks
journal homepage: www.elsevier .com/locate /adhoc
A centrality-based topology control protocol for wireless meshnetworks
http://dx.doi.org/10.1016/j.adhoc.2014.07.0261570-8705/� 2014 Published by Elsevier B.V.
⇑ Corresponding author. Tel.: +34 93 401 7027.E-mail addresses: [email protected] (A. Vázquez-Rodas),
[email protected] (L.J. de la Cruz Llopis).
Please cite this article in press as: A. Vázquez-Rodas, L.J. de la Cruz Llopis, A centrality-based topology control protocol for wirelesnetworks, Ad Hoc Netw. (2014), http://dx.doi.org/10.1016/j.adhoc.2014.07.026
Andrés Vázquez-Rodas ⇑, Luis J. de la Cruz LlopisDepartment of Telematics Engineering, Universitat Politècnica de Catalunya (UPC), C. Jordi Girona 1-3, 08034 Barcelona, Spain
252627282930313233343536
a r t i c l e i n f o
Article history:Received 28 February 2014Received in revised form 30 June 2014Accepted 28 July 2014Available online xxxx
Keywords:Topology controlWireless mesh networksSocial network analysisCentrality metricsConnected dominating set
37383940414243444546
a b s t r a c t
Nodes in wireless multi-hop networks establish links with their neighbors, which are usedfor data transmission. In general, in this kind of networks every node has the possibility ofacting as a router, forwarding the received packets when they are not the final destinationof the carried data. Due to the routing protocol procedures, when the network is quitedense the overload added by the routing management packets can be very high. To reducethe effects of this overload a topology control mechanism can be used, which can be imple-mented using different techniques. One of these techniques consists of enabling ordisabling the routing functionality in every node. Many advantages result from selectingjust a subset of nodes for routing tasks: reduction of collisions, protocol overhead, interfer-ence and energy consumption, better network organization and scalability. In this paper, anew protocol for topology control in wireless mesh networks is proposed. The protocol isbased on the centrality metrics developed by social network analysts. Our target network isa wireless mesh network created by user hand-held devices. For this kind of networks, weaim to construct a connected dominating set that includes the most central nodes. Theresulting performance using the three most common centrality measures (degree, close-ness and betweenness) is evaluated. As we are working with dynamic and decentralizednetworks, a distributed implementation is also proposed and evaluated. Some simulationshave been carried out to analyze the benefits of the proposed mechanism when reactive orproactive routing protocols are used. The results confirm that the use of the topologycontrol contributes to a better network performance.
� 2014 Published by Elsevier B.V.
47
57
58
59
60
61
62
63
64
65
1. Introduction
Smart environments, smart devices, smart interaction,computing anytime and anywhere, . . ., the accelerateddevelopment of information technologies and mobiledevices results in people and/or ‘‘things’’ increasinglydependent on the online services offered through the Inter-net. In such scenario, Wireless Mesh Networks (WMNs)have evolved as a cost effective possible solution for user
66
67
68
69
uninterrupted access to networking facilities. Valued fea-tures like robustness, reliability, easy deployment andmaintenance, self-forming and self-configuration, makeWMNs an important alternative to achieve an always-onconnectivity. Among the three typical architectures ofWMNs [1], the present work focus on the client meshingone. In this case, the end-user devices are able to simulta-neously provide application interface, routing and networkconfiguration capabilities. Nowadays, the most commonhand-held device used by an increasing number of peopleis the smart phone. The evolution of such mobile deviceswith their variety of embedded sensors results now in anot only communication equipment, but a complete
s mesh

70
71
72
73
74
75
76
77
78
79
80
81
82
83
84
85
86
87
88
89
90
91
92
93
94
95
96
97
98
99
100
101
102
103
104
105
106
107
108
109
110
111
112
113
114
115
116
117
118
119
120
121
122
123
124
125
126
127
128
129
130
131
132
133
134
135
136
137
138
139
140
141
142
143
144
145
146
147
148
149
150
151
152
153
154
155
156
157
158
159
160
161
162
163
164
165
166
167
168
169
170
171
172
173
174
175
176
177
178
179
180
181
182
183
184
185
186
187
188
189
2 A. Vázquez-RodasQ1 , L.J. de la Cruz Llopis / Ad Hoc Networks xxx (2014) xxx–xxx
ADHOC 1083 No. of Pages 30, Model 3G
8 August 2014
Q1
sensing system [2]. Numerous applications are emerging inmany fields like health, traffic, human behavior, environ-ment monitoring, social networking and commerce [2].With this perspective it is entirely feasible to consider aWMN composed by mobile phone users moving around acity as a cost-effective complement to commercial cellularnetworks. One of the major concerns in this kind of devicesis related to their energy consumption. Therefore, optimi-zation techniques that aim to reduce it are always required[3].
Topology control techniques have been developed toimprove the energy efficiency and the battery lifetime ofa variety of networks. It also aims to reduce collisions,protocol overhead, and interference by means of a bettercontrol over the network connections and redundancy[4]. In general, there are three main types of topology con-trol approaches [4]. First, power control techniques [5,6],adjust the communication range of the wireless nodes bymeans of the transmission power of their transceivers. Thisway, nodes are able to better manage their neighborhoodsize, interference level, power consumption and connectiv-ity. Secondly, power mode mechanisms [7,8] control theactive or sleep operation modes of the nodes to dispensewith redundant stations and still achieve the desiredconnectivity. Finally, hierarchical clustering approaches[9–11] aim to construct an efficient virtual backbone fordata forwarding by the selection of a connected dominat-ing set (CDS). From graph theory, a CDS of a graph is a con-nected subset in which all the nodes that does not pertainat that subset have at least one adjacent neighbor insidethe subset. Due to the reduced number of nodes develop-ing routing task, the main advantages of this CDS-basedtopology control are: collisions, protocol overhead andenergy consumption reduction, efficient network organiza-tion and scalability improvement. In this work we evaluatean alternative method for this last category of topologycontrol based on social network analysis metrics.
In this context, thanks to the increasing availability ofnetwork maps which depicts the behavior of complex sys-tems and the universality of their characteristics [12], net-work science appears as the renewed study of the structureand the dynamic behavior of a variety of networked sys-tems [13]. Accordingly, social network analysts have devel-oped an important set of measures and metrics whichallow understanding the behavior and quantify the topol-ogy features of a diversity of networks [14]. Specifically,in this work we focus on centrality metrics developed toidentify the most important actors (nodes) in a networkby means of graph theory definitions and concepts.
In summary, the purpose of this work is to present andevaluate an alternative topology control mechanism basedon centrality measures borrowed from social networkanalysis. This topology optimization has been applied toa client wireless mesh network formed with user hand-held devices.
The rest of the paper is organized as follows. In Section2 we report and analyze the related work. Section 3 pro-vides a background on centrality metrics. Section 4 pre-sents and evaluates the proposed topology controlmechanism. A performance evaluation has been carriedout by means of simulations, taking into account both
Please cite this article in press as: A. Vázquez-Rodas, L.J. de la Cruz Llopnetworks, Ad Hoc Netw. (2014), http://dx.doi.org/10.1016/j.adhoc.2014
reactive and proactive routing protocols. The results arepresented in Section 5. Finally, the conclusions and futureworks are summarized in Section 6.
2. Related work
Nowadays, the application of complex networks tech-niques and social network analysis concepts to improvethe performance of wireless ad hoc networks is growingas a fertile research area [15]. Some recent works are sum-marized in the following. [16–18] apply the small worldphenomena, re-popularized by [19], to reduce the averagepath length of the network. The basic idea of these propos-als is to modify the physical topology of the network basedon the social features of the underlying graph. The smallworld property (or low average path length) could beachieved either by the aggregation of long-ranged links[17] or by a combination of rewiring, deletion and/or addi-tion of links/nodes [16]. Authors in [18] combine centralitymeasures with directional beamforming to create long-range links between more central nodes. The same authorsextend their study to sparse highly partitioned networks in[20].
SimBet [21] is a routing protocol designed for delay-tolerant MANETs. It uses two social network analysismetrics (centrality and similarity) for message forwardingdecisions. Betweenness centrality is selected to identifymore suitable bridge nodes, and the similarity measure isused to find nodes that are closer to the destination neigh-borhood. A utility function combines the similarity and thebetweenness utilities and allows adjusting the relativeimportance of them. For performance evaluation both util-ities has been assigned the same importance. For their part,authors in [22] apply social network analysis metrics todetect critical nodes in a WMN. They show how networkreliability substantially degrades when coordinated attacksare directed to highest centrality nodes. Simulations evincethat nodes with high betweenness centrality exhibit agreater impact than nodes with high degree or closenesscentrality. Authors also propose a socially-aware TDMAchannel access scheduling algorithm. The main idea is togive higher priority (assigning more time slots) to nodeswith high closeness centrality values. Simulations showimportant throughput improvements at the expense ofincreased delay.
The time-evolution of the topological characteristics ofvehicular networks from the perspective of graph theoryand social network analysis is the subject addressed in[23]. It is confirmed that relevant and useful informationabout the behavior of the VANETs could be inferred fromthe centrality metrics. The importance of nodes with highcentrality values on the design of more efficient VANETprotocols is also discussed.
A topology control algorithm for WSN based in edgebetweenness centrality [24] is proposed in [25]. This met-ric is used to identify most relevant edges or links betweennodes, regarding energy consumption. For each node, theaim of the proposal is to select a set of logical neighborsthat minimize energy consumption and fulfill QoS require-ments. Simulation results show better performance of thisproposal in comparison with traditional topology control
is, A centrality-based topology control protocol for wireless mesh.07.026
190
191
192
193
194
195
196
197
198
199
200
201
202
203
204
205
206
207
208
209
210
211
212
213
214
215
216
217
218
219
220
221
222
223
224
225
226
227
228
229
230
231
232
233
234
235
236
237
238
239
240
241242
244244
245
246
247
248
249
250
251
252
253
254255
257257
258
259
260
261
262
263
264
265
266
267268
270270
271
272
273
274
275
276
277
A. Vázquez-RodasQ1 , L.J. de la Cruz Llopis / Ad Hoc Networks xxx (2014) xxx–xxx 3
ADHOC 1083 No. of Pages 30, Model 3G
8 August 2014
Q1
methods in terms of number of logical neighbors, energyconsumption, latency and hit-ratio (percentage of servedqueries).
Authors in [26] propose a routing protocol based on aconnected dominating set (CDS). A simple marking processis used to establish the initial CDS: a node is designed asgateway if it has at least two unconnected neighbors. Thisinitial CDS is reduced by the application of rules based onthe node IDs. An extension of the selective removal rulesare presented in [9]. In this case the degree and the energylevel of the nodes are considered to reduce the CDS and toachieve balanced energy consumption. In [27] ConnectedDominating Sets with bounded diameters are taken intoaccount. To construct these DS with the smallest size,authors propose and evaluate two centralized algorithmsand one distributed version. On the other hand, given thefact that the transmission ranges of all network nodes arenot necessarily equal, authors in [28] model the networkby means of a Directed Graph and propose two differentsolutions for the case in which all the network links arebidirectional. A recent and extensive survey on energy-aware distributed topology control algorithms is presentedin [4].
Many topology control mechanisms are intended tosensor networks in which the dominant data flow tradi-tionally goes from the sensor nodes to the sink. In thiswork we focus on mesh networks in which it is more com-mon that every node may be origin or destination of thedata flow. On the other hand, we evaluate the use of cen-trality metrics which are calculated both in a centralizedor a distributed way. Besides, we propose and evaluate adistributed implementation of the router selection mecha-nism, as well as different possibilities to achieve total net-work connectivity.
278
279
280
281
282
283
284
285
286
287
288
289
290
291
292
293
294
295
296
297
298
299
300
301
302
3. Background on centrality
Centrality is one of the most useful mathematical mea-sures developed by social network analysts to capture thestructural properties of social relationships. It aims to iden-tify the most important actors/vertices within a graph thatrepresents any physical network. Centrality metrics couldbe based mainly on the degree of a vertex (number ofedges connected to it [14]) or on the geodesic distancesbetween them [15]. In the following we present a sum-mary of the three most useful centrality metrics.
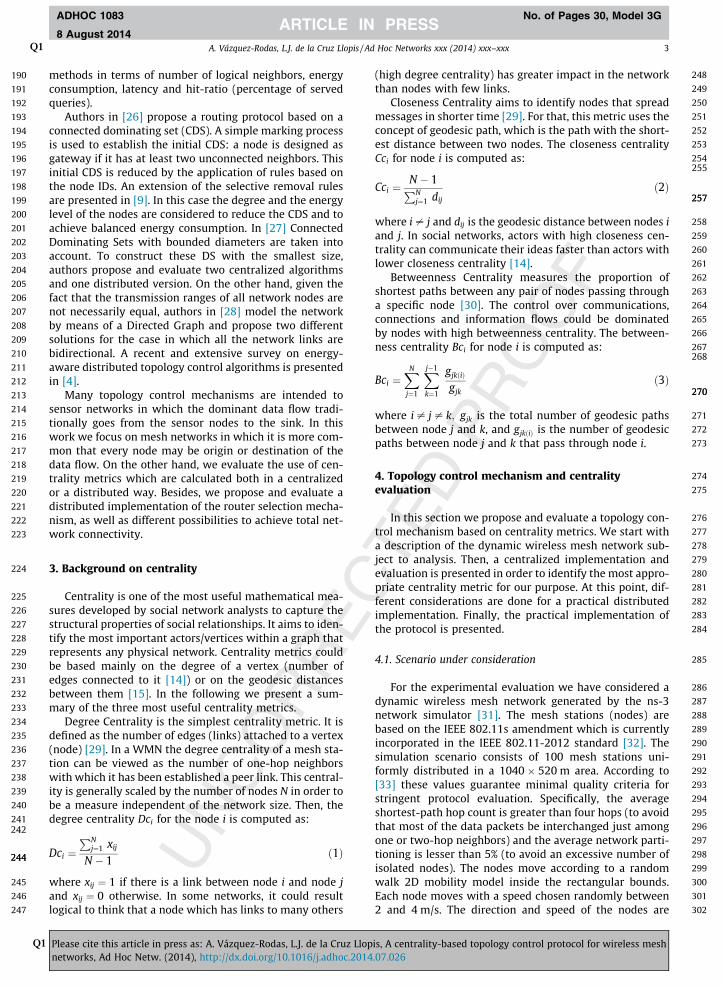
Degree Centrality is the simplest centrality metric. It isdefined as the number of edges (links) attached to a vertex(node) [29]. In a WMN the degree centrality of a mesh sta-tion can be viewed as the number of one-hop neighborswith which it has been established a peer link. This central-ity is generally scaled by the number of nodes N in order tobe a measure independent of the network size. Then, thedegree centrality Dci for the node i is computed as:
Dci ¼PN
j¼1 xij
N � 1ð1Þ
where xij ¼ 1 if there is a link between node i and node jand xij ¼ 0 otherwise. In some networks, it could resultlogical to think that a node which has links to many others
Please cite this article in press as: A. Vázquez-Rodas, L.J. de la Cruz Llopnetworks, Ad Hoc Netw. (2014), http://dx.doi.org/10.1016/j.adhoc.2014
(high degree centrality) has greater impact in the networkthan nodes with few links.
Closeness Centrality aims to identify nodes that spreadmessages in shorter time [29]. For that, this metric uses theconcept of geodesic path, which is the path with the short-est distance between two nodes. The closeness centralityCci for node i is computed as:
Cci ¼N � 1PN
j¼1 dij
ð2Þ
where i – j and dij is the geodesic distance between nodes iand j. In social networks, actors with high closeness cen-trality can communicate their ideas faster than actors withlower closeness centrality [14].
Betweenness Centrality measures the proportion ofshortest paths between any pair of nodes passing througha specific node [30]. The control over communications,connections and information flows could be dominatedby nodes with high betweenness centrality. The between-ness centrality Bci for node i is computed as:
Bci ¼XN
j¼1
Xj�1
k¼1
gjkðiÞ
gjkð3Þ
where i – j – k; gjk is the total number of geodesic pathsbetween node j and k, and gjkðiÞ is the number of geodesicpaths between node j and k that pass through node i.
4. Topology control mechanism and centralityevaluation
In this section we propose and evaluate a topology con-trol mechanism based on centrality metrics. We start witha description of the dynamic wireless mesh network sub-ject to analysis. Then, a centralized implementation andevaluation is presented in order to identify the most appro-priate centrality metric for our purpose. At this point, dif-ferent considerations are done for a practical distributedimplementation. Finally, the practical implementation ofthe protocol is presented.
4.1. Scenario under consideration
For the experimental evaluation we have considered adynamic wireless mesh network generated by the ns-3network simulator [31]. The mesh stations (nodes) arebased on the IEEE 802.11s amendment which is currentlyincorporated in the IEEE 802.11-2012 standard [32]. Thesimulation scenario consists of 100 mesh stations uni-formly distributed in a 1040 � 520 m area. According to[33] these values guarantee minimal quality criteria forstringent protocol evaluation. Specifically, the averageshortest-path hop count is greater than four hops (to avoidthat most of the data packets be interchanged just amongone or two-hop neighbors) and the average network parti-tioning is lesser than 5% (to avoid an excessive number ofisolated nodes). The nodes move according to a randomwalk 2D mobility model inside the rectangular bounds.Each node moves with a speed chosen randomly between2 and 4 m/s. The direction and speed of the nodes are
is, A centrality-based topology control protocol for wireless mesh.07.026
303
304
305
306
307
308
309
310
311
312
313
314
315
316
317
318
319
320
321
322
323
324
325
326
327
328
4 A. Vázquez-RodasQ1 , L.J. de la Cruz Llopis / Ad Hoc Networks xxx (2014) xxx–xxx
ADHOC 1083 No. of Pages 30, Model 3G
8 August 2014
Q1
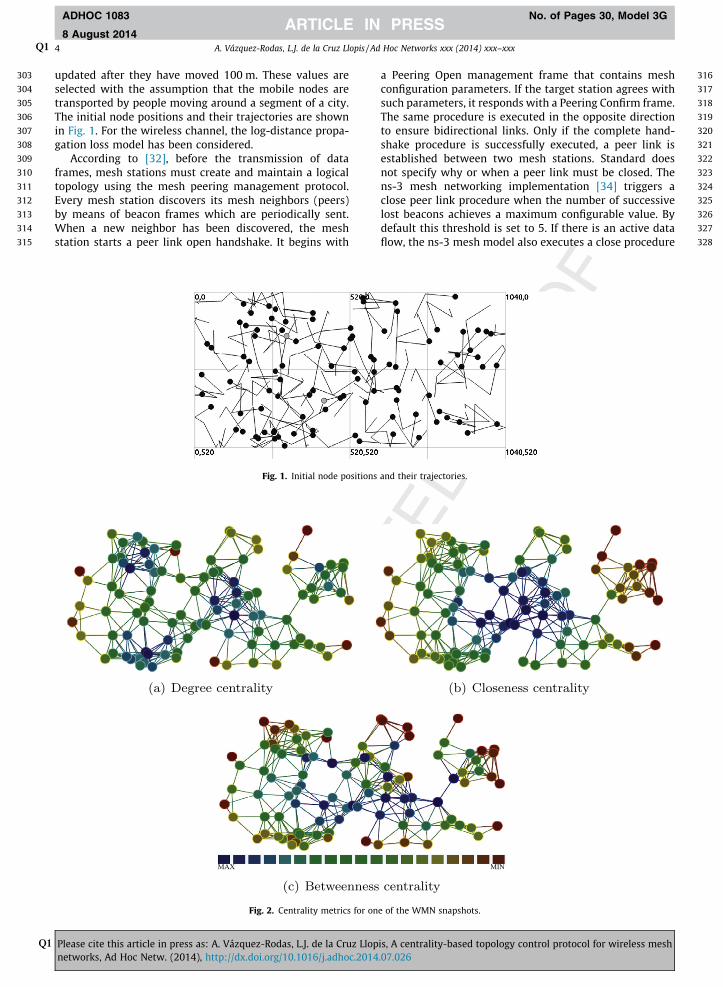
updated after they have moved 100 m. These values areselected with the assumption that the mobile nodes aretransported by people moving around a segment of a city.The initial node positions and their trajectories are shownin Fig. 1. For the wireless channel, the log-distance propa-gation loss model has been considered.
According to [32], before the transmission of dataframes, mesh stations must create and maintain a logicaltopology using the mesh peering management protocol.Every mesh station discovers its mesh neighbors (peers)by means of beacon frames which are periodically sent.When a new neighbor has been discovered, the meshstation starts a peer link open handshake. It begins with
Fig. 1. Initial node positions
Fig. 2. Centrality metrics for on
Please cite this article in press as: A. Vázquez-Rodas, L.J. de la Cruz Llopnetworks, Ad Hoc Netw. (2014), http://dx.doi.org/10.1016/j.adhoc.2014
a Peering Open management frame that contains meshconfiguration parameters. If the target station agrees withsuch parameters, it responds with a Peering Confirm frame.The same procedure is executed in the opposite directionto ensure bidirectional links. Only if the complete hand-shake procedure is successfully executed, a peer link isestablished between two mesh stations. Standard doesnot specify why or when a peer link must be closed. Thens-3 mesh networking implementation [34] triggers aclose peer link procedure when the number of successivelost beacons achieves a maximum configurable value. Bydefault this threshold is set to 5. If there is an active dataflow, the ns-3 mesh model also executes a close procedure
and their trajectories.
e of the WMN snapshots.
is, A centrality-based topology control protocol for wireless mesh.07.026
329
330
331
332
333
334
335
336
A. Vázquez-RodasQ1 , L.J. de la Cruz Llopis / Ad Hoc Networks xxx (2014) xxx–xxx 5
ADHOC 1083 No. of Pages 30, Model 3G
8 August 2014
Q1
when a station is unable to transmit to a peer a number ofsuccessive frames. This value is also set by default to 5.
337
338
339
340
341
342
4.2. Centralized implementation
Based on the presented scenario, first of all we haveanalyzed several snapshots of the mesh network datasettaken every 5 s. For each snapshot and for each node inside
Fig. 3. Resulting topology with the 40
5 10 15 20 25 300
0.1
0.2
0.3
0.4
0.5
0.6
0.7
t
Net
wor
k Fr
agm
enta
tion
Degree 40%RDegree 50%RCloseness 40%RCloseness 50%RBetweenness 40%RBetweenness 50%R
Fig. 4. Time evolution of the network fragmentation for the thre
Please cite this article in press as: A. Vázquez-Rodas, L.J. de la Cruz Llopnetworks, Ad Hoc Netw. (2014), http://dx.doi.org/10.1016/j.adhoc.2014
the network we compute its degree, closeness andbetweenness centrality metrics. ORA [35] and UCINET[36] software have been used to centrality calculations,while network graphics are done with ORA. With the cen-trality values, we are able to rank and identify the mostcentral nodes from those three points of view. Fig. 2 showsthis ranking for one specific snapshot (at time = 5 s) and forthe three metrics. Blue nodes represent the most central
% most central nodes as routers.
35 40 45 50 55 60
[s]
e centrality metrics and for 40% and 50% selected routers.
is, A centrality-based topology control protocol for wireless mesh.07.026
343
344
345
346
347
348
349
350
351
352
353
354
355
356
357
358
359
360
361
362
363
364
365
366
367
368
369
370
371
372
373
375375
376
377
378
379
380
381
382
383
384
385
386
387
388
389
390
391
392
393
394
395
396
397
398
399
400
401
402
403
404
405
406
407
408
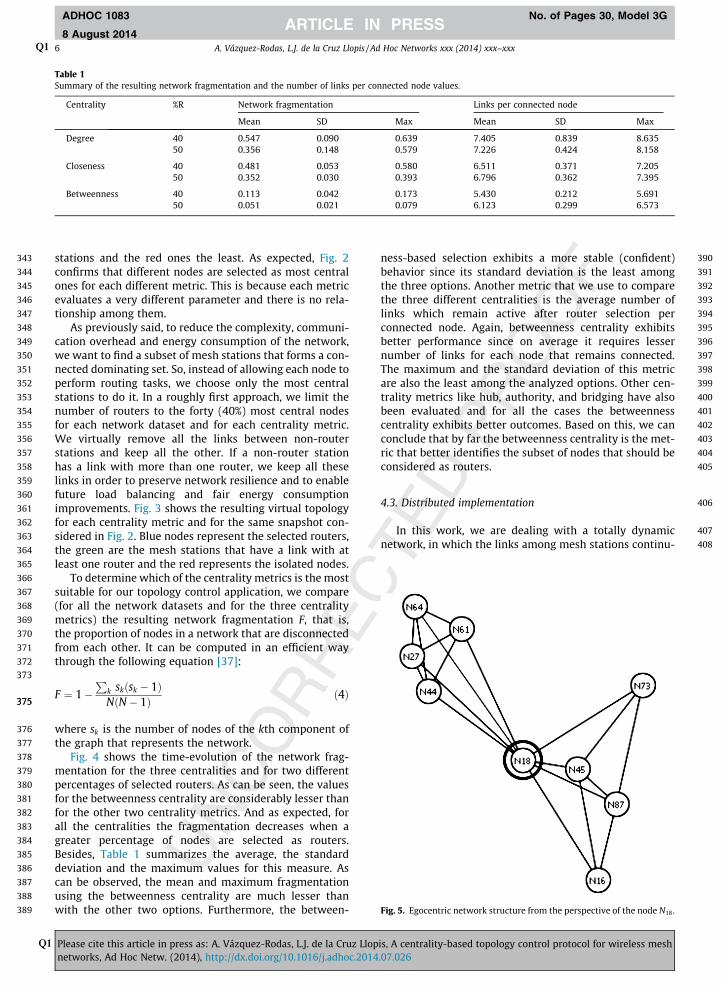
Table 1Summary of the resulting network fragmentation and the number of links per connected node values.
Centrality %R Network fragmentation Links per connected node
Mean SD Max Mean SD Max
Degree 40 0.547 0.090 0.639 7.405 0.839 8.63550 0.356 0.148 0.579 7.226 0.424 8.158
Closeness 40 0.481 0.053 0.580 6.511 0.371 7.20550 0.352 0.030 0.393 6.796 0.362 7.395
Betweenness 40 0.113 0.042 0.173 5.430 0.212 5.69150 0.051 0.021 0.079 6.123 0.299 6.573
Fig. 5. Egocentric network structure from the perspective of the node N18.
6 A. Vázquez-RodasQ1 , L.J. de la Cruz Llopis / Ad Hoc Networks xxx (2014) xxx–xxx
ADHOC 1083 No. of Pages 30, Model 3G
8 August 2014
Q1
stations and the red ones the least. As expected, Fig. 2confirms that different nodes are selected as most centralones for each different metric. This is because each metricevaluates a very different parameter and there is no rela-tionship among them.
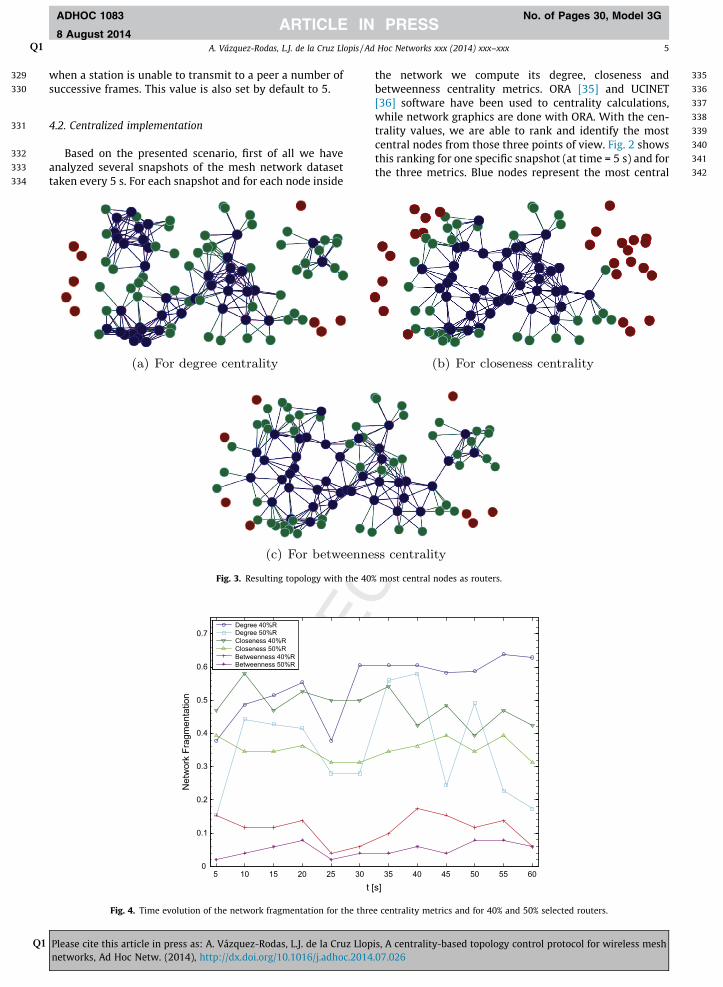
As previously said, to reduce the complexity, communi-cation overhead and energy consumption of the network,we want to find a subset of mesh stations that forms a con-nected dominating set. So, instead of allowing each node toperform routing tasks, we choose only the most centralstations to do it. In a roughly first approach, we limit thenumber of routers to the forty (40%) most central nodesfor each network dataset and for each centrality metric.We virtually remove all the links between non-routerstations and keep all the other. If a non-router stationhas a link with more than one router, we keep all theselinks in order to preserve network resilience and to enablefuture load balancing and fair energy consumptionimprovements. Fig. 3 shows the resulting virtual topologyfor each centrality metric and for the same snapshot con-sidered in Fig. 2. Blue nodes represent the selected routers,the green are the mesh stations that have a link with atleast one router and the red represents the isolated nodes.
To determine which of the centrality metrics is the mostsuitable for our topology control application, we compare(for all the network datasets and for the three centralitymetrics) the resulting network fragmentation F, that is,the proportion of nodes in a network that are disconnectedfrom each other. It can be computed in an efficient waythrough the following equation [37]:
F ¼ 1�P
k sk sk � 1ð ÞN N � 1ð Þ ð4Þ
where sk is the number of nodes of the kth component ofthe graph that represents the network.
Fig. 4 shows the time-evolution of the network frag-mentation for the three centralities and for two differentpercentages of selected routers. As can be seen, the valuesfor the betweenness centrality are considerably lesser thanfor the other two centrality metrics. And as expected, forall the centralities the fragmentation decreases when agreater percentage of nodes are selected as routers.Besides, Table 1 summarizes the average, the standarddeviation and the maximum values for this measure. Ascan be observed, the mean and maximum fragmentationusing the betweenness centrality are much lesser thanwith the other two options. Furthermore, the between-
Please cite this article in press as: A. Vázquez-Rodas, L.J. de la Cruz Llopnetworks, Ad Hoc Netw. (2014), http://dx.doi.org/10.1016/j.adhoc.2014
ness-based selection exhibits a more stable (confident)behavior since its standard deviation is the least amongthe three options. Another metric that we use to comparethe three different centralities is the average number oflinks which remain active after router selection perconnected node. Again, betweenness centrality exhibitsbetter performance since on average it requires lessernumber of links for each node that remains connected.The maximum and the standard deviation of this metricare also the least among the analyzed options. Other cen-trality metrics like hub, authority, and bridging have alsobeen evaluated and for all the cases the betweennesscentrality exhibits better outcomes. Based on this, we canconclude that by far the betweenness centrality is the met-ric that better identifies the subset of nodes that should beconsidered as routers.
4.3. Distributed implementation
In this work, we are dealing with a totally dynamicnetwork, in which the links among mesh stations continu-
is, A centrality-based topology control protocol for wireless mesh.07.026

409
410
411
412
413
414
415
416
417
418
419
420
421
422
423
424
425
426
427428
430430
431
432
433
434435
437437
438
439
440
441
442
443
A. Vázquez-RodasQ1 , L.J. de la Cruz Llopis / Ad Hoc Networks xxx (2014) xxx–xxx 7
ADHOC 1083 No. of Pages 30, Model 3G
8 August 2014
Q1
ously change due to their movements and channelconditions. This is done in an autonomous and distributedway through the mesh peering management protocol.Accordingly, our topology control algorithm must be imple-mented in a fully distributed manner. Mesh stations mustbe able to decide which nodes act as routers based onlyon their local information, and without the need of anycentral controller. In the previous section we determinedthat betweenness centrality is the best choice for our pur-pose. Therefore, we must use the egocentric version ofbetweenness centrality [38]. This version requires onlythe first order (one-hop) neighborhood information of eachnode instead of the complete network topology. Moreover,this information is available in each mesh station since theykeep an updated record of their peer links.
An efficient algorithm to compute the egocentricbetweenness is presented in [39]. Each node representsits ego network (one-hop neighbors) by means of the adja-cency matrix A. The elements of this matrix are given by:
Aij ¼1 if there is a peer link between nodes i and j
0 otherwise
�
ð5Þ
Fig. 6. Routers selection using 1-h
Fig. 7. Routers selection using 2-h
Please cite this article in press as: A. Vázquez-Rodas, L.J. de la Cruz Llopnetworks, Ad Hoc Netw. (2014), http://dx.doi.org/10.1016/j.adhoc.2014
As an example, Fig. 5 shows the egocentric network struc-ture from the perspective of the node N18 at a given timeinstant.
The adjacency matrix for this ego network is given by:
N18 N16 N27 N44 N45 N61 N64 N73 N87
N18 0 1 1 1 1 1 1 1 1N16 1 0 0 0 1 0 0 0 1N27 1 0 0 1 0 1 1 0 0N44 1 0 1 0 0 1 1 0 0N45 1 1 0 0 0 0 0 1 1N61 1 0 1 1 0 0 1 0 0N64 1 0 1 1 0 1 0 0 0N73 1 0 0 0 1 0 0 0 1N87 1 1 0 0 1 0 0 1 0
Observe in Fig. 5 that all the shortest paths between non-adjacent stations that pass through the ego (the stationwho is calculating its egocentric betweenness) have alength of two hops. Therefore, when i – j, and being 1 thematrix with all its elements equal to 1, the expressionA2½1� A�i;j gives the number of shortest paths with length
op egocentric betweenness.
op egocentric betweenness.
is, A centrality-based topology control protocol for wireless mesh.07.026
444
445
446
447
448
449
Fig. 8. Routers selection using the sociocentric betweenness.
(a) Complete topology (b) Selected routers
Fig. 9. Connectivity achieved with the probe packets approach.
Fig. 10. Resulting backbone selecting two routers per neighborhood.
8 A. Vázquez-RodasQ1 , L.J. de la Cruz Llopis / Ad Hoc Networks xxx (2014) xxx–xxx
ADHOC 1083 No. of Pages 30, Model 3G
8 August 2014
Q1
2 that links stations i and j. Thus, the egocentric between-ness is the sum of the reciprocal of the resulting non-ceroelements [39].
Please cite this article in press as: A. Vázquez-Rodas, L.J. de la Cruz Llopnetworks, Ad Hoc Netw. (2014), http://dx.doi.org/10.1016/j.adhoc.2014
Note that the peering management protocol guaranteesthat all the links are bidirectional, and then the matricesare symmetric and only the elements above the main diag-
is, A centrality-based topology control protocol for wireless mesh.07.026

Fram
eCo
ntro
l
Dur
a�on
Des
�n.
Add
ress
Sour
ceA
ddre
ss
BSS
Iden
�f.
Sequ
en.
Cont
rol
Fram
eCo
ntro
l
Dur
a�on
Des
�n.
Add
ress
Sour
ceA
ddre
ss
BSS
Iden
�f.
Sequ
en.
Cont
rol
Fram
eCo
ntro
l
Dur
a�on
Des
�n.
Add
ress
Sour
ceA
ddre
ss
BSS
Iden
�f.
Sequ
en.
Cont
rol
2 2 6 6 6 2 4
4
FCSRSF
Fram
eCo
ntro
l
Dur
a�on
Des
�n.
Add
ress
Sour
ceA
ddre
ss
BSS
Iden
�f.
Sequ
en.
Cont
rol
bytes2 2 6 6 6 2 6 6 6 4
FCS
Sour
ceA
ddre
ss
Nei
g. #
1A
ddre
ss
Nei
g. #
2A
ddre
ss …NAF
Fram
eCo
ntro
l
Dur
a�on
Des
�n.
Add
ress
Sour
ceA
ddre
ss
BSS
Iden
�f.
Sequ
en.
Cont
rol
2 2 6 6 6 2 6 4 4
FCS
Sour
ceA
ddre
ss
Egoc
ent.
Rem
ain.
Ener
gy
EAF
Fram
eCo
ntro
l
Dur
a�on
Des
�n.
Add
ress
Sour
ceA
ddre
ss
BSS
Iden
�f.
Sequ
en.
Cont
rol
2 2 6 6 6 2 4
4
FCSRSF
Fig. 11. Frames format.
05
1015
12
34
50
2
4
6
8
10
12
x 104
Neighbors
NT=100 nodes
Routers
Topo
logy
Con
trol R
ate
(bps
)
TUT = 5.12 s.
TUT = 2.56 s.
(a) 100-nodes mesh network0
510
15
12
34
50
0.5
1
1.5
2
2.5
x 105
Neighbors
NT=200 nodes
Routers
Topo
logy
Con
trol R
ate
(bps
)
TUT = 5.12 s.
TUT = 2.56 s.
(b) 200-nodes mesh network
Fig. 12. Topology control protocol bit rate for different NT and TUT values.
5 10 15 20 25 30 35 400
1
2
3
4
5
6x 10
5
Number of Data Flows
Rat
e of
Rou
ting
Man
agem
ent M
essa
ges
[bps
]
Top 40RAll R
Fig. 13. Rate of routing management messages as a function of the number of active flows.
A. Vázquez-RodasQ1 , L.J. de la Cruz Llopis / Ad Hoc Networks xxx (2014) xxx–xxx 9
ADHOC 1083 No. of Pages 30, Model 3G
8 August 2014
Please cite this article in press as: A. Vázquez-RodasQ1 , L.J. de la Cruz Llopis, A centrality-based topology control protocol for wireless meshnetworks, Ad Hoc Netw. (2014), http://dx.doi.org/10.1016/j.adhoc.2014.07.026
450
451452
454454
455
456
457
458
459
460
461
462
463
464
465
466
467
468
10 A. Vázquez-RodasQ1 , L.J. de la Cruz Llopis / Ad Hoc Networks xxx (2014) xxx–xxx
ADHOC 1083 No. of Pages 30, Model 3G
8 August 2014
Q1
onal must be taken into account. For the node N18 thisresults in:
N18 N16 N27 N44 N45 N61 N64 N73 N87
N18 � 0 0 0 0 0 0 0 0N16 � � 1 1 0 1 1 3 0N27 � � � 0 1 0 0 1 1N44 � � � � 1 0 0 1 1N45 � � � � � 1 1 0 0N61 � � � � � � 0 1 1N64 � � � � � � � 1 1N73 � � � � � � � � 0N87 � � � � � � � � �
469
470
5 10 15 200
1
2
3
4
5
6x 10⁵
Number of
Tota
l dat
a fo
rwar
ding
s [p
kts]
Fig. 14. Total data forwarding as a funct
5 10 15 201
2
3
4
5
6
7
8 x 10⁴
Number of
Succ
essf
ully
RX
pack
ets
[pkt
s]
Fig. 15. Total number of successf
Please cite this article in press as: A. Vázquez-Rodas, L.J. de la Cruz Llopnetworks, Ad Hoc Netw. (2014), http://dx.doi.org/10.1016/j.adhoc.2014
Therefore, the egocentric betweenness for the node N18 isequal to 16.333. This way, whit just local information,every node is able to calculate its egocentric betweennessvalue. This value should be updated every time a stationestablishes a new peer link or it closes a previously estab-lished one. In a practical implementation, the nodes willrefresh this value at predetermined time intervals.
Once selected a distributed way to obtain the centralityvalues, we also need a distributed way to select the nodesthat will act as routers. Note that in this case there is not acentral control with all the information needed to selectthe nodes with higher centralities. Our proposal here isthat every node selects as router the node (or nodes) withhigher egocentric betweenness in its neighborhood. Notethat with this way of proceeding, the same node can beselected as the router for different neighborhoods. This
25 30 35 40
Data Flows
Top 40RAll R
ion of the number of active flows.
25 30 35 40
Data Flows
Top 40RAll R
ully received data packets.
is, A centrality-based topology control protocol for wireless mesh.07.026

471
472
473
474
475
476
477
478
479
480
481
482
483
484
485
486
487
488
489
490
491
492
493
494
495
496
497
498
499
500
501
502
503
504
A. Vázquez-RodasQ1 , L.J. de la Cruz Llopis / Ad Hoc Networks xxx (2014) xxx–xxx 11
ADHOC 1083 No. of Pages 30, Model 3G
8 August 2014
Q1
way, the total number of routers is reduced, and this num-ber is determined by the procedure itself. Of course, thissimple method guaranties that every station is connectedto a router, but it does not assure that all the routers areinterconnected between them. Therefore, some furtheractions will be needed. On the other hand, the main advan-tage is that it is a very simple and implementable method.
With this background, the procedure to select the meshstations that will develop routing tasks can be summarizedas follows: first, each station calculates and broadcasts itsegocentric betweenness centrality value, and second, inits respective ego network, each station selects the neigh-bor (or neighbors) with the highest betweenness to beused as routers. The details and practical implementationof the protocol are exposed in Section 4.4.
In the following we present the evaluation of this topol-ogy control algorithm for the network dataset previously
5 10 15 203
4
5
6
7
8
9
10
11
12
13
Number of
Tota
l For
war
ding
s pe
r RX
Pack
et
Fig. 16. Total data forwardings per
5 10 15 200.1
0.15
0.2
0.25
0.3
0.35
0.4
0.45
0.5
Number o
Net
wor
k Ef
ficie
ncy
Fig. 17. Network efficiency in terms of packet de
Please cite this article in press as: A. Vázquez-Rodas, L.J. de la Cruz Llopnetworks, Ad Hoc Netw. (2014), http://dx.doi.org/10.1016/j.adhoc.2014
described. We analyze different alternatives to create aconnected dominating set in a distributed way. In firstplace, we consider that each station computes its egocen-tric betweenness with the first-order (one-hop) neighbor-hood information and selects as router just the one withthe highest egocentric betweenness. As expected due tothe distributed router selection, instead of a connectedbackbone, this procedure generates a set of isolatedclusters that have no common routers among them.Fig. 6 presents the worst case obtained in the simulations,that is, the time instant with the higher number of isolatedclusters. For this specific case, 25% of stations have beenselected as routers. Although this is the worst case, it isworth to mention that the 8.33% of the network snapshotsanalyzed construct a fully connected backbone with thismost simple procedure, and with 30% of stations selectedas routers on average.
25 30 35 40
Data Flows
Top 40RAll R
successfully received packet.
25 30 35 40
f Data Flows
Top 40RAll R
livery ratio as a function of the traffic load.
is, A centrality-based topology control protocol for wireless mesh.07.026
505
506
507
508
509
510
511
512
513
514
515
516
517
518
519
520
521
522
523
524
525
526
527
528
529
530
531
532
0 2 6 10 14 18 22 26 30 34 38 42 46 50 54 58 62 66 700
5
10
15
20
25
30
35
40
45
50
Energy Consumption [J]
(a) Histogram
No.
of n
odes
0 10 20 30 40 50 60 700
0.1
0.2
0.3
0.4
0.5
0.6
0.7
0.8
0.9
1
Energy Consumption [J]
(b) Cdf
Cum
mul
ativ
e pr
obab
ility
All RTop 40R
Top 40RAll R
Fig. 18. Energy consumption statistics for the 15-flows reactive mode case.
12 A. Vázquez-RodasQ1 , L.J. de la Cruz Llopis / Ad Hoc Networks xxx (2014) xxx–xxx
ADHOC 1083 No. of Pages 30, Model 3G
8 August 2014
Q1
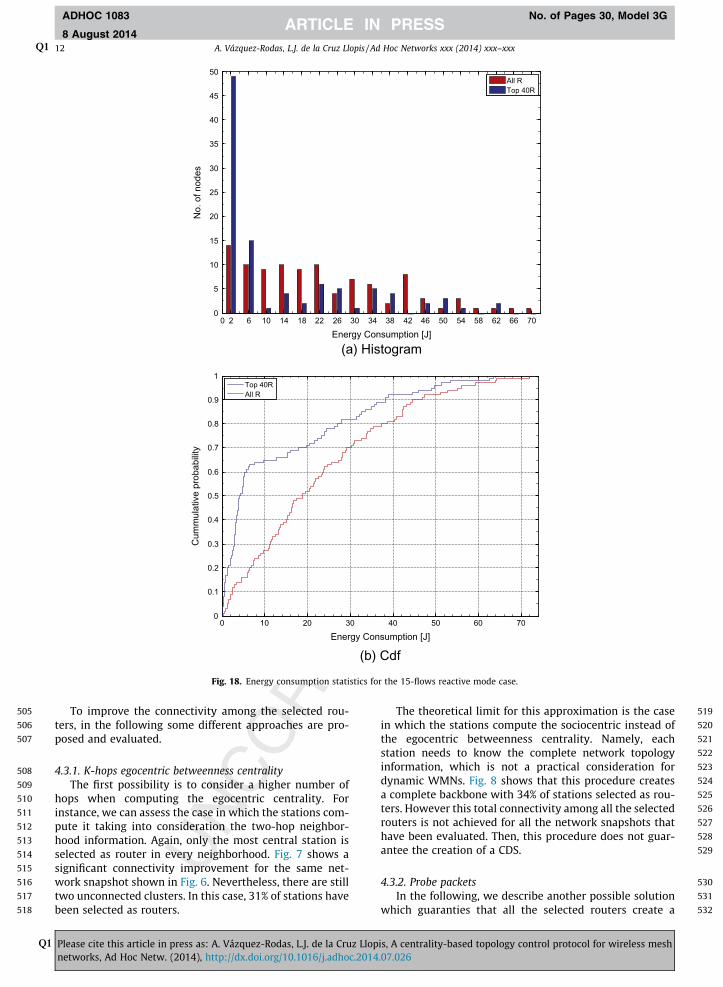
To improve the connectivity among the selected rou-ters, in the following some different approaches are pro-posed and evaluated.
4.3.1. K-hops egocentric betweenness centralityThe first possibility is to consider a higher number of
hops when computing the egocentric centrality. Forinstance, we can assess the case in which the stations com-pute it taking into consideration the two-hop neighbor-hood information. Again, only the most central station isselected as router in every neighborhood. Fig. 7 shows asignificant connectivity improvement for the same net-work snapshot shown in Fig. 6. Nevertheless, there are stilltwo unconnected clusters. In this case, 31% of stations havebeen selected as routers.
Please cite this article in press as: A. Vázquez-Rodas, L.J. de la Cruz Llopnetworks, Ad Hoc Netw. (2014), http://dx.doi.org/10.1016/j.adhoc.2014
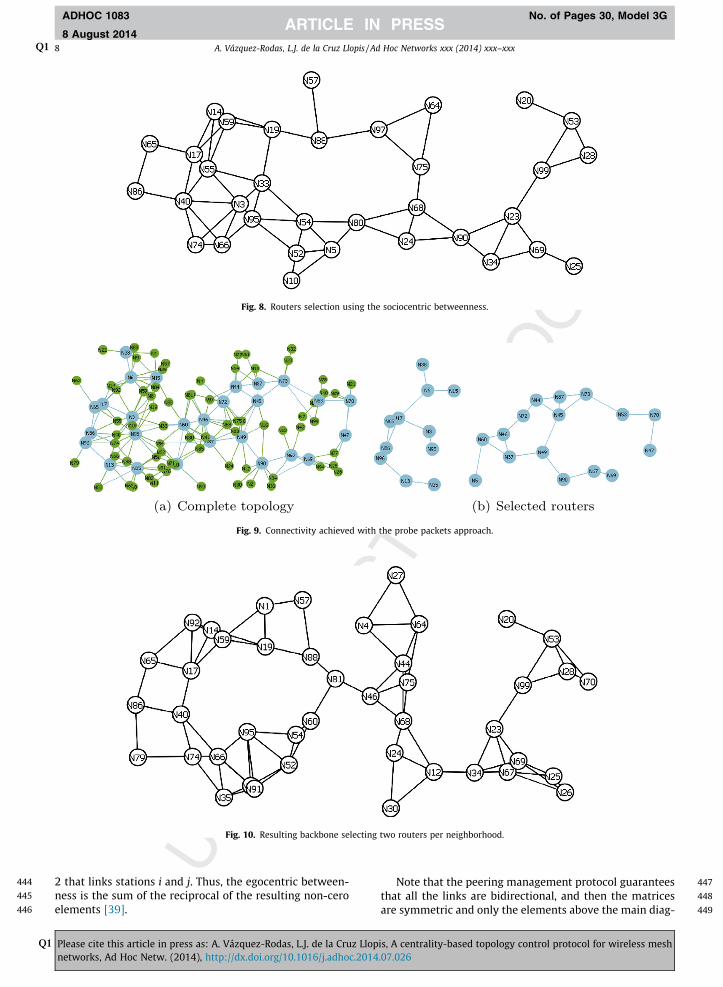
The theoretical limit for this approximation is the casein which the stations compute the sociocentric instead ofthe egocentric betweenness centrality. Namely, eachstation needs to know the complete network topologyinformation, which is not a practical consideration fordynamic WMNs. Fig. 8 shows that this procedure createsa complete backbone with 34% of stations selected as rou-ters. However this total connectivity among all the selectedrouters is not achieved for all the network snapshots thathave been evaluated. Then, this procedure does not guar-antee the creation of a CDS.
4.3.2. Probe packetsIn the following, we describe another possible solution
which guaranties that all the selected routers create a
is, A centrality-based topology control protocol for wireless mesh.07.026

533
534
535
536
537
538
539
540
541
542
543
544
545
546
547
548
549
550
551
552
553
554
555
556
557
558
559
560
561
562
563
564
565
566
567
568
569
570
571
572
573
574
575
576
577
578
579
580
581
582
583
584
585
586
587
588
589
590
A. Vázquez-RodasQ1 , L.J. de la Cruz Llopis / Ad Hoc Networks xxx (2014) xxx–xxx 13
ADHOC 1083 No. of Pages 30, Model 3G
8 August 2014
Q1
single connected backbone at the expense of increasing thesignaling overhead. After a first router selection round,based on egocentric betweenness, the non-router stationsvirtually linked to at least two routers verify the connectiv-ity between them. If there is no path between any tworouters connected to a non-router station, that stationmust be marked as router. To this end, the station trans-mits a probe message through one (and only one) of itslinks. This special message must be retransmitted by therouters and, if connectivity exists, it will be received bythe sending station through the other links. If the messageis not received before a predetermined time, the stationmarks itself as router and communicates this decision toits neighborhood. To illustrate this, Fig. 9(a) shows a differ-ent network snapshot. The cyan bigger nodes represent thestations that have been selected as routers based on one-hop egocentric betweenness and a selection with just onerouter per station. As it can be seen, selected routers formstwo components (Fig. 9(b)) that can be linked througheither of stations N88; N33; N54; N52; N51; N91, N82 andN11. These nodes will be marked as routers according tothe proposed procedure.
4.3.3. Higher number of routers per neighborhoodWe have evaluated another procedure in which the sta-
tions, instead of selecting only the most central node, markas routers the two nodes with the higher one-hop egobetweenness values in each neighborhood. Fig. 10 showsthe resultant backbone for the same mesh network dataset.In this case, 43% of stations have been selected as routers.This process generates a fully connected backbone for the
0 2 4 6 8 100
0.1
0.2
0.3
0.4
0.5
0.6
0.7
0.8
0.9
1
Delay [s]
(a)
Cum
ulat
ive
prob
abilit
y
0 2 40
0.1
0.2
0.3
0.4
0.5
0.6
0.7
0.8
0.9
1
Delay
(b
Cum
ulat
ive
prob
abilit
y
0 2 4 6 8 100
0.1
0.2
0.3
0.4
0.5
0.6
0.7
0.8
0.9
1
Delay [s]
(d)
Cum
ulat
ive
prob
abilit
y
0 2 40
0.1
0.2
0.3
0.4
0.5
0.6
0.7
0.8
0.9
1
Delay
(e
Cum
ulat
ive
prob
abilit
y
Top40R-5FlowsAllR-5FlowsTop40R-10FlowsAllR-10FlowsTop40-15FlowsAllR-15Flows
Top40R-30FlowsAllR-30Flows
Fig. 19. Cumulative distribution function
Please cite this article in press as: A. Vázquez-Rodas, L.J. de la Cruz Llopnetworks, Ad Hoc Netw. (2014), http://dx.doi.org/10.1016/j.adhoc.2014
83.33% of the network snapshots tested. The increase inthe number of redundant routers can be exploited by loadbalancing techniques, and it is also valuable from a net-work resilience perspective. Due to the fact that thisapproach is the one with a lower amount of overload, wehave chosen it to propose a practical implementation inthe next section. Obviously, incrementing the number ofrouters selected by each station will ensure a fully com-plete backbone for all the scenarios at the expense of ahigher router redundancy. As a future line of work we willstudy the minimum number of routers per neighborhoodneeded to guaranty a desired connectivity (expressed asa percentage of the total connectivity).
4.4. Practical implementation
Energy efficiency and fair energy consumption are con-sider for the practical implementation of the protocol. It iscarried out in three steps:
– Step 1: Every node broadcast its own neighbors list bymeans of a Neighborhood Advertising Frame (NAF). Thisis a special management frame where every neighbor isidentified by its MAC address.– Step 2: Every node receives the NAFs from its neigh-bors. With this information, they are able to computetheir own egocentric value. Once computed, theybroadcast that value in the Egocentric AdvertisingFrame (EAF). In order to allow fair energy consumptionin the network, the nodes remaining energy is alsoincluded in the frame.
6 8 10 [s]
)
0 2 4 6 8 100
0.1
0.2
0.3
0.4
0.5
0.6
0.7
0.8
0.9
1
Delay [s]
(c)
Cum
ulat
ive
prob
abilit
y
6 8 10 [s]
)
0 2 4 6 8 10Delay [s]
(f)
Cum
ulat
ive
prob
abilit
y
Top40R-20FlowsAllR-20Flows
Top40R-25FlowsAllR-25Flows
Top40R-35FlowsAllR-35Flows
Top40R-40FlowsAllR-40Flows
0
0.1
0.2
0.3
0.4
0.5
0.6
0.7
0.8
0.9
1
of data packets end-to-end delay.
is, A centrality-based topology control protocol for wireless mesh.07.026

591
592
593
594
595
596
597
598
599
600
601
602
603
604
605
606
607
608
609
610
611
612
613
614
615
616
617
618
619
620
621
622
623
624
625
626
14 A. Vázquez-RodasQ1 , L.J. de la Cruz Llopis / Ad Hoc Networks xxx (2014) xxx–xxx
ADHOC 1083 No. of Pages 30, Model 3G
8 August 2014
Q1
– Step 3: Every node receives the egocentric value of allof its neighbors and selects the one with the highervalue as its router. If different options are available(i.e., different neighbors with the same centralityvalue), the node with the higher value of remainingenergy is chosen. A multi-metric protocol, assigning dif-ferent weights to the centrality and energy remainingvalues, is one of the targets of a future work. The deci-sion is communicated to the new router with the Rou-ter Selection Frame (RSF). When the new routerreceives the RSF, it switches to the router mode (or rou-ter state) and activates its routing functionality. As saidin the previous section, in order to guarantee obtaininga connected topology, a bigger number of routers can bechosen by every node.
Due to the network variability, this three steps proce-dure must be repeated every certain interval time, called
5 4 30
1
2
3
4
5
6
7x 10⁵
Lifetime of reactive ro
Rat
e of
Rou
ting
Man
agem
ent M
essa
ges
[bps
]
Fig. 20. Rate of routing management messages
5 44
4.5
5
5.5
6
6.5
7 x 10⁴
Lifetime of reactive r
Succ
essf
ully
RX
pack
ets
[pkt
s]
Fig. 21. Total number of successfully received pac
Please cite this article in press as: A. Vázquez-Rodas, L.J. de la Cruz Llopnetworks, Ad Hoc Netw. (2014), http://dx.doi.org/10.1016/j.adhoc.2014
the Topology Updating Time (TUT). Besides, the routerstate must be seen as a soft state. That is, to keep the rout-ing functionality activated, a node must receive at least aRSF every TUT seconds. Otherwise the node understandsthat its routing functionality is not needed anymore andswitches it off.
Fig. 11 shows the specific frame format for the newthree management frames needed by this protocol. TheNAF and EAF frames can be included into the mesh-specificmanagement frames. They are broadcast frames and there-fore they do not need to be acknowledged by the receiver.The RSF frame is also a mesh-specific management framebut in this case it is a unicast frame and therefore it mustbe acknowledged by the receiver. The three frames canbe identified by the sub-type code in the Frame Controlfield.
Calling NT the total number of nodes in the networkand NR the number of routers that every node selects,
2 1
uting information [s]
Top 40RAll R
as a function of the reactive path lifetime.
3 2 1outing information [s]
Top 40RAll R
kets as a function of reactive path lifetime.
is, A centrality-based topology control protocol for wireless mesh.07.026
627
628629
631631
632
633
634
635
636
637
638
639
641641
642
643
644
645
647647
648
649
650
651
652
653
654
655
656
A. Vázquez-RodasQ1 , L.J. de la Cruz Llopis / Ad Hoc Networks xxx (2014) xxx–xxx 15
ADHOC 1083 No. of Pages 30, Model 3G
8 August 2014
Q1
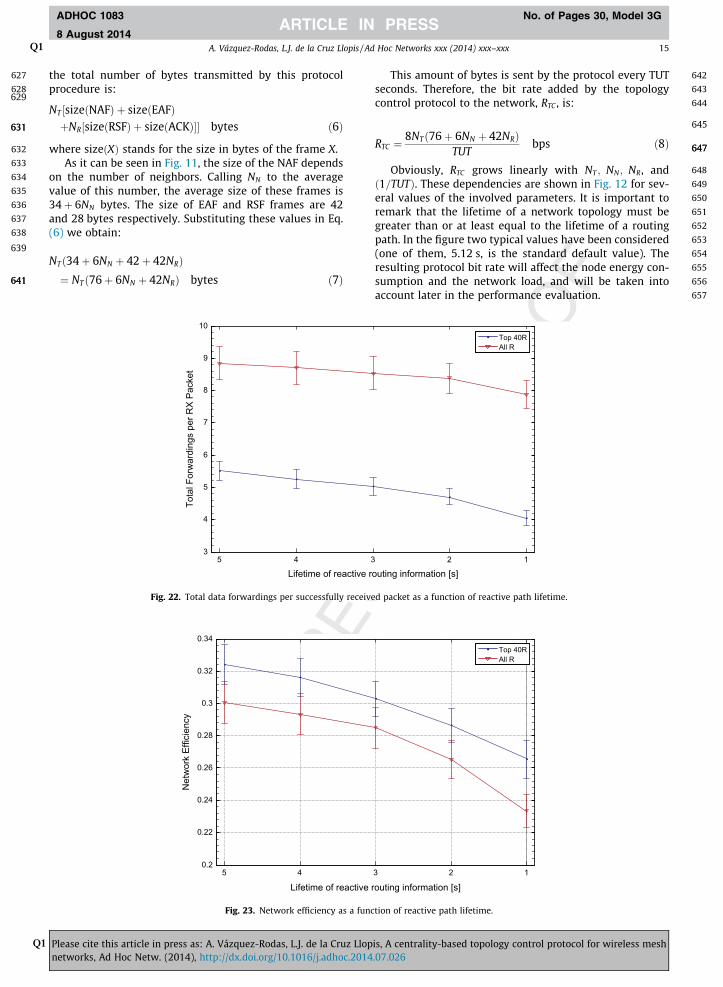
the total number of bytes transmitted by this protocolprocedure is:
NT size NAFð Þ þ size EAFð Þ½þNR size RSFð Þ þ size ACKð Þ½ �� bytes ð6Þ
where sizeðXÞ stands for the size in bytes of the frame X.As it can be seen in Fig. 11, the size of the NAF depends
on the number of neighbors. Calling NN to the averagevalue of this number, the average size of these frames is34þ 6NN bytes. The size of EAF and RSF frames are 42and 28 bytes respectively. Substituting these values in Eq.(6) we obtain:
NT 34þ 6NN þ 42þ 42NRð Þ¼ NT 76þ 6NN þ 42NRð Þ bytes ð7Þ
5 4 33
4
5
6
7
8
9
10
Lifetime of reactive r
Tota
l For
war
ding
s pe
r RX
Pack
et
Fig. 22. Total data forwardings per successfully receive
5 40.2
0.22
0.24
0.26
0.28
0.3
0.32
0.34
Lifetime of reactive
Net
wor
k Ef
ficie
ncy
Fig. 23. Network efficiency as a func
Please cite this article in press as: A. Vázquez-Rodas, L.J. de la Cruz Llopnetworks, Ad Hoc Netw. (2014), http://dx.doi.org/10.1016/j.adhoc.2014
This amount of bytes is sent by the protocol every TUTseconds. Therefore, the bit rate added by the topologycontrol protocol to the network, RTC , is:
657
RTC ¼8NT 76þ 6NN þ 42NRð Þ
TUTbps ð8Þ
Obviously, RTC grows linearly with NT ; NN; NR, andð1=TUTÞ. These dependencies are shown in Fig. 12 for sev-eral values of the involved parameters. It is important toremark that the lifetime of a network topology must begreater than or at least equal to the lifetime of a routingpath. In the figure two typical values have been considered(one of them, 5.12 s, is the standard default value). Theresulting protocol bit rate will affect the node energy con-sumption and the network load, and will be taken intoaccount later in the performance evaluation.
2 1
outing information [s]
Top 40RAll R
d packet as a function of reactive path lifetime.
3 2 1
routing information [s]
Top 40RAll R
tion of reactive path lifetime.
is, A centrality-based topology control protocol for wireless mesh.07.026

658
659
660
661
662
663
664
665
666
667
668
669
670
671
672
673
674
675
676
677
678
679
680
681
682
683
0 10 20 30 40 50 60 70 800
0.1
0.2
0.3
0.4
0.5
0.6
0.7
0.8
0.9
1
Energy Consumption [J]
(b) Cdf
Cum
mul
ativ
e pr
obab
ility
Top R pathTAll R pathT
2.5 7.5 12.5 17.5 22.5 27.5 32.5 37.5 42.5 47.5 52.5 57.5 62.5 67.5 72.5 77.50
5
10
15
20
25
30
35
40
45
Energy Consumption [J]
(a) Histogram
No.
of n
odes
Top 40RAll R
Fig. 24. Energy consumption statistics for the nodes working with the reactive mode, 20 peer-to-peer data flows and reactive routing information lifetimeof 3 s.
16 A. Vázquez-RodasQ1 , L.J. de la Cruz Llopis / Ad Hoc Networks xxx (2014) xxx–xxx
ADHOC 1083 No. of Pages 30, Model 3G
8 August 2014
Q1
5. Performance evaluation
In this section, extensive simulations have been carriedout to evaluate the performance of WMNs with the pro-posed centrality based topology control mechanism. Forthe evaluation, we consider the following metrics andparameters:
– The rate of routing management messages.– The total number of forwardings per successfully
received packet.– The network efficiency in terms of packet delivery
ratio.– The energy consumed on a node by node basis.
Please cite this article in press as: A. Vázquez-Rodas, L.J. de la Cruz Llopnetworks, Ad Hoc Netw. (2014), http://dx.doi.org/10.1016/j.adhoc.2014
– The end-to-end packet delay.– The transmission bit-rate savings taking into account
the overload added by the topology control protocol.
We take into account the two routing modes of thehybrid wireless mesh protocol (HWMP). In the reactiveon-demand mode, a source mesh station starts a pathdiscovery procedure only when it has a data packet to sendto any destination. This operation mode is more suitablefor peer to peer communication inside the mesh network.On the other hand, proactive mode is more appropriatewhen a single or a few mesh stations are configured asgateways for external communications and therefore theyare the targets of most of data connections. In this mode, a
is, A centrality-based topology control protocol for wireless mesh.07.026
684
685
686
687
688
689
690
691
692
693
694
695
696
697
698
699
700
701
702
703
704
705
706
707
708
709
710
711
712
713
A. Vázquez-RodasQ1 , L.J. de la Cruz Llopis / Ad Hoc Networks xxx (2014) xxx–xxx 17
ADHOC 1083 No. of Pages 30, Model 3G
8 August 2014
Q1
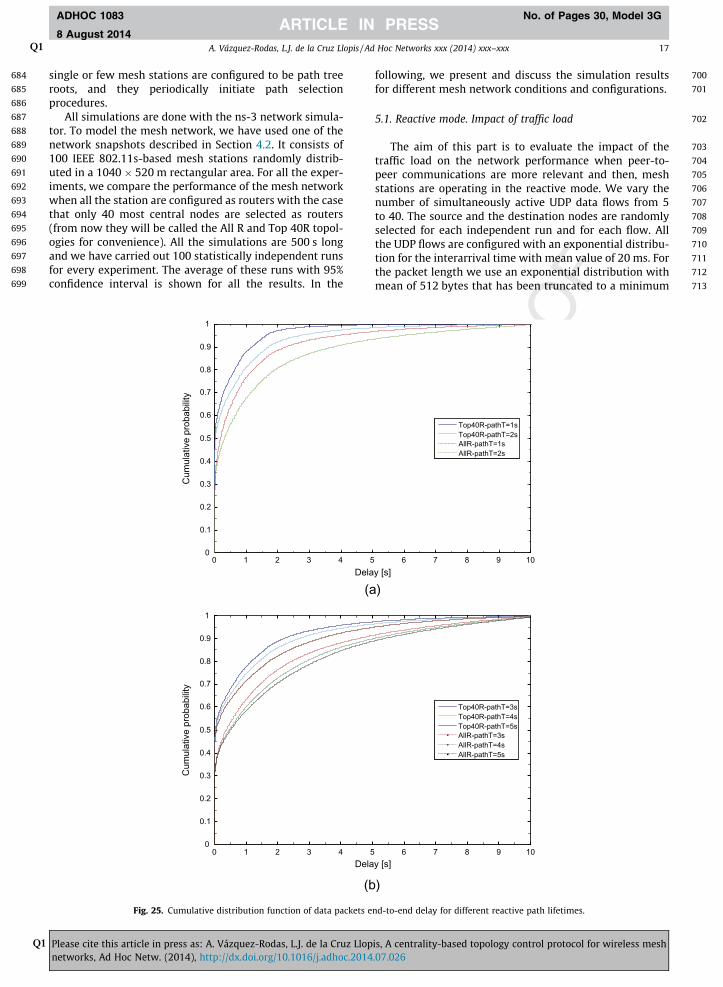
single or few mesh stations are configured to be path treeroots, and they periodically initiate path selectionprocedures.
All simulations are done with the ns-3 network simula-tor. To model the mesh network, we have used one of thenetwork snapshots described in Section 4.2. It consists of100 IEEE 802.11s-based mesh stations randomly distrib-uted in a 1040 � 520 m rectangular area. For all the exper-iments, we compare the performance of the mesh networkwhen all the station are configured as routers with the casethat only 40 most central nodes are selected as routers(from now they will be called the All R and Top 40R topol-ogies for convenience). All the simulations are 500 s longand we have carried out 100 statistically independent runsfor every experiment. The average of these runs with 95%confidence interval is shown for all the results. In the
0 1 2 3 4 50
0.1
0.2
0.3
0.4
0.5
0.6
0.7
0.8
0.9
1
Dela
(a
Cum
ulat
ive
prob
abilit
y
0 1 2 3 4 50
0.1
0.2
0.3
0.4
0.5
0.6
0.7
0.8
0.9
1
Dela
(b
Cum
ulat
ive
prob
abilit
y
Fig. 25. Cumulative distribution function of data packets e
Please cite this article in press as: A. Vázquez-Rodas, L.J. de la Cruz Llopnetworks, Ad Hoc Netw. (2014), http://dx.doi.org/10.1016/j.adhoc.2014
following, we present and discuss the simulation resultsfor different mesh network conditions and configurations.
5.1. Reactive mode. Impact of traffic load
The aim of this part is to evaluate the impact of thetraffic load on the network performance when peer-to-peer communications are more relevant and then, meshstations are operating in the reactive mode. We vary thenumber of simultaneously active UDP data flows from 5to 40. The source and the destination nodes are randomlyselected for each independent run and for each flow. Allthe UDP flows are configured with an exponential distribu-tion for the interarrival time with mean value of 20 ms. Forthe packet length we use an exponential distribution withmean of 512 bytes that has been truncated to a minimum
6 7 8 9 10y [s]
)
6 7 8 9 10y [s]
)
Top40R-pathT=1sTop40R-pathT=2sAllR-pathT=1sAllR-pathT=2s
Top40R-pathT=3sTop40R-pathT=4sTop40R-pathT=5sAllR-pathT=3sAllR-pathT=4sAllR-pathT=5s
nd-to-end delay for different reactive path lifetimes.
is, A centrality-based topology control protocol for wireless mesh.07.026

714
715
716
717
718
719
720
721
722
723
724
725
726
727
728
729
730
731
732
733
734
735
736
737
738
739
740
741
742
743
744
745
746
747
748
749
750
751
752
753
754
755
756
757
758
759
760
761
762
763
764
765
766
767
768
769
770
771
772
773
774
775
776
777
778
779
780
781
782
783
784
785
786
787
788
789
18 A. Vázquez-RodasQ1 , L.J. de la Cruz Llopis / Ad Hoc Networks xxx (2014) xxx–xxx
ADHOC 1083 No. of Pages 30, Model 3G
8 August 2014
Q1
of 12 bytes (header size), and a maximum of 1500 bytes.Mesh stations are configured with the default value of5.12 s for the lifetime of reactive routing information.
First of all, Fig. 13 shows the evolution of the mean rateof routing management messages as a function of the num-ber of data flows. Evidently, since mesh stations are usingthe on-demand path selection mode, a greater number ofsources demand a greater number of path selection proce-dures. Therefore, the rate of routing management mes-sages increases when the number of data flows increases.As expected because of the lower number of mesh stationswith path selection functionality, a significant reductionoccurs (76.14% on average) when the mesh network oper-ates with the topology control mechanism. Observe thatthis reduction directly impacts on the total energy con-sumed by the network.
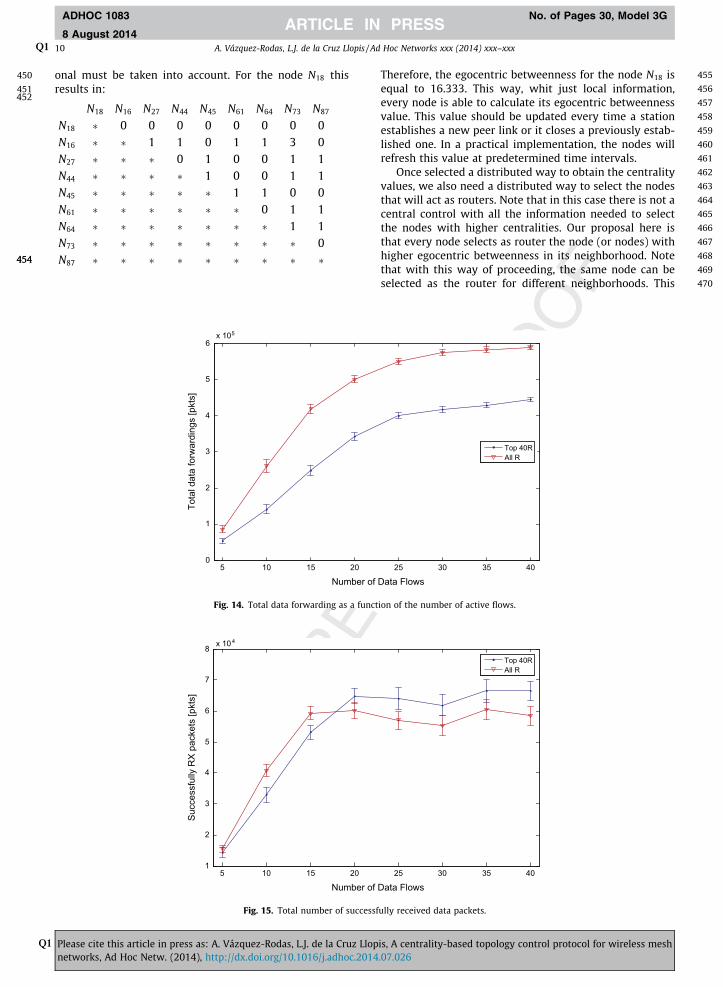
The next parameter that we consider is the total num-ber of unicast data packets forwarded by all the stationsin the network (Fig. 14)). We can clearly identify two dif-ferent trends of this parameter. For low traffic loads, upto 15 concurrent flows for the network without topologycontrol and up to 20 flows when topology control isapplied, the data forwardings growth linearly with thenumber of flows. Beyond these values the network startsto exhibit a saturated behavior and then the growthbecomes less significant. This is also verified when westudy the total number of successfully received packets(Fig. 15)). This figure confirms that the network is satu-rated beyond 15 data flows for the All R topology andbeyond 20 flows for the Top 40R case. Over these values,although there are more sources generating data packets,there is practically no increase in the number of success-fully received data packets. The topology control mecha-nism produces a savings of the total data forwardings of32.77% on the average. This is another important reductionof the total amount of energy consumed by the network. Itis important to remark that this is not in detriment of thenumber of received packets. In fact, when the topology
20.48/8.192 10.24/4.096 5.12/2.0480
0.5
1
1.5
2
2.5
3
3.5
4 x 10⁶
Active path to root time
Rat
e of
Rou
ting
Man
agem
ent M
essa
ges
[bps
]
Fig. 26. Rate of proactive routing managemen
Please cite this article in press as: A. Vázquez-Rodas, L.J. de la Cruz Llopnetworks, Ad Hoc Netw. (2014), http://dx.doi.org/10.1016/j.adhoc.2014
control is applied, the stations get on average 2.3% moredata packets than without topology control. Precisely, tobetter analyze this relation we compute the total numberof data forwardings per successfully received packet.Fig. 16 shows the evolution of this measure and it can beobserved that for all the cases the network with topologycontrol is more efficient. Namely, the number of forwar-dings is reduced a 33.43% on average. We also verify thatan increase of traffic sources causes more collisions andtherefore a greater number of retransmissions and forwar-dings are required to deliver each data packet. This grow-ing trend continues until the network reaches thesaturated state.
The next parameter that has been evaluated is the net-work efficiency in terms of packet delivery ratio. Fig. 17shows that the network with the topology control becomesmore efficient when the number of sources is equal orgreater than 20. This is because the impact of the signalingrequired for path selection is not so important when a fewnumber of stations are generating data traffic. Neverthe-less, in more practical situations, the routing overhead ismore relevant and then the advantage of reducing thenumber of stations involved in routing is evident. Withinthe interval of this experiment, although this is not ourmain objective, the average improvement of the networkefficiency is about 3.7% when the topology control isapplied.
This small improvement in the efficiency comestogether with a significant reduction of the global energyconsumption inside the network, which is in fact the maingoal of this proposal. To evaluate this, we consider the totalamount of energy dissipated by each node for all the trans-missions and receptions during the entire simulation time.The energy model presented in [40] has been consideredfor all the reported cases. Fig. 18(a) shows the histogramof the energy consumed by the nodes for the 15-activeflows case (which corresponds to a non-saturated situa-tion). As can be observed, the maximum energy dissipated
2.56/1.024 1.28/0.512 0.64/0.256
out / Root Interval [s]
Top 40RAll R
t messages for different update times.
is, A centrality-based topology control protocol for wireless mesh.07.026
790
791
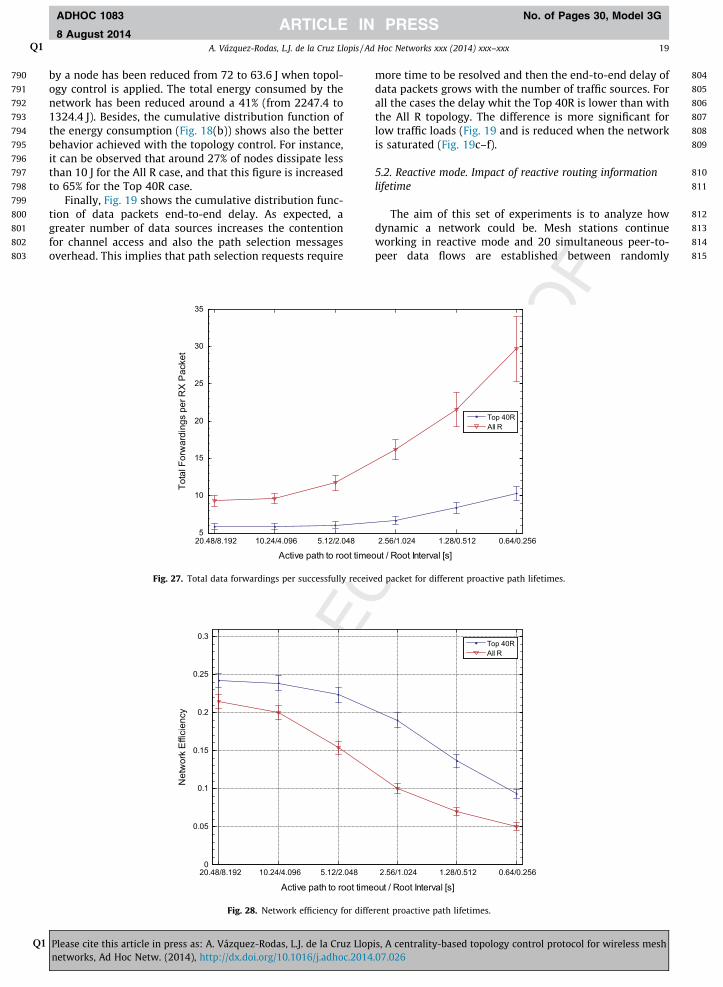
792
793
794
795
796
797
798
799
800
801
802
803
804
805
806
807
808
809
810
811
812
813
814
815
A. Vázquez-RodasQ1 , L.J. de la Cruz Llopis / Ad Hoc Networks xxx (2014) xxx–xxx 19
ADHOC 1083 No. of Pages 30, Model 3G
8 August 2014
Q1
by a node has been reduced from 72 to 63.6 J when topol-ogy control is applied. The total energy consumed by thenetwork has been reduced around a 41% (from 2247.4 to1324.4 J). Besides, the cumulative distribution function ofthe energy consumption (Fig. 18(b)) shows also the betterbehavior achieved with the topology control. For instance,it can be observed that around 27% of nodes dissipate lessthan 10 J for the All R case, and that this figure is increasedto 65% for the Top 40R case.
Finally, Fig. 19 shows the cumulative distribution func-tion of data packets end-to-end delay. As expected, agreater number of data sources increases the contentionfor channel access and also the path selection messagesoverhead. This implies that path selection requests require
20.48/8.192 10.24/4.096 5.12/2.0485
10
15
20
25
30
35
Active path to root time
Tota
l For
war
ding
s pe
r RX
Pac
ket
Fig. 27. Total data forwardings per successfully receiv
20.48/8.192 10.24/4.096 5.12/2.0480
0.05
0.1
0.15
0.2
0.25
0.3
Active path to root time
Net
wor
k E
ffici
ency
Fig. 28. Network efficiency for diffe
Please cite this article in press as: A. Vázquez-Rodas, L.J. de la Cruz Llopnetworks, Ad Hoc Netw. (2014), http://dx.doi.org/10.1016/j.adhoc.2014
more time to be resolved and then the end-to-end delay ofdata packets grows with the number of traffic sources. Forall the cases the delay whit the Top 40R is lower than withthe All R topology. The difference is more significant forlow traffic loads (Fig. 19 and is reduced when the networkis saturated (Fig. 19c–f).
5.2. Reactive mode. Impact of reactive routing informationlifetime
The aim of this set of experiments is to analyze howdynamic a network could be. Mesh stations continueworking in reactive mode and 20 simultaneous peer-to-peer data flows are established between randomly
2.56/1.024 1.28/0.512 0.64/0.256
out / Root Interval [s]
Top 40RAll R
ed packet for different proactive path lifetimes.
2.56/1.024 1.28/0.512 0.64/0.256
out / Root Interval [s]
Top 40RAll R
rent proactive path lifetimes.
is, A centrality-based topology control protocol for wireless mesh.07.026

816
817
818
819
820
821
822
823
824
825
826
827
828
829
830
831
832
833
834
835
836
837
838
839
840
841
842
843
844
845
846
847
0 100 200 300 400 500 600 7000
10
20
30
40
50
60
70
Energy Consumption [J]
(a) Histogram
No.
of n
odes
0 100 200 300 400 500 600 700 8000
0.1
0.2
0.3
0.4
0.5
0.6
0.7
0.8
0.9
1
Energy Consumption [J](b) Cdf
Cum
mul
ativ
e pr
obab
ility
Top 40RAll R
Top 40RAll R
Fig. 29. Energy consumption statistics for the network working in the proactive mode with one root station. The root node is included and the proactiverouting information lifetime is set to the default value of 5.12 s.
20 A. Vázquez-RodasQ1 , L.J. de la Cruz Llopis / Ad Hoc Networks xxx (2014) xxx–xxx
ADHOC 1083 No. of Pages 30, Model 3G
8 August 2014
Q1
selected sources and destinations. A more dynamic andvariable network requires a more frequent activation ofthe mesh path selection mechanism in order to keepthe paths updated. As stated in the IEEE 802.11-2012standard [32], we can control the time for which meshstations consider the forwarding information to be validby means of the dot11MeshHWMPactivePathTimeout con-trol variable. Therefore, in this section we evaluate theperformance of the network when this lifetime variesfrom 5.12 to 1 s. The evolution of the mean rate of rout-ing management messages is shown in Fig. 20. Of coursewe can observe that, although the traffic load is equiva-lent for all the cases, the rate of path selection relatedmessages grows as lifetime of reactive routing informa-tion decreases. As expected, topology control producesan important reduction of around 83.43% because of
Please cite this article in press as: A. Vázquez-Rodas, L.J. de la Cruz Llopnetworks, Ad Hoc Netw. (2014), http://dx.doi.org/10.1016/j.adhoc.2014
the reduced number of mesh stations involved in rout-ing. This directly corresponds to the same significantlyenergy consumption savings due to the lower amountof routing messages exchanged by the mesh stations.We verify that the limitation in the number of routershas no negative impact in the total number of success-fully received packets. In fact, as can be seen in Fig. 21,topology control produces an average increase of around8.75% in the number of successfully received packetswith regard to the All R configuration. The decreasingbehavior is explained as follows: lower duration ofestablished paths implies a greater number of path dis-covery messages which in turn increases the collisionsand the contention inside the network. Thus, data pack-ets have less transmissions opportunities and then thereare less successfully received packets.
is, A centrality-based topology control protocol for wireless mesh.07.026

848
849
850
851
852
853
854
855
856
857
858
859
860
861
862
863
864
865
866
867
868
869
870
871
872
873
874
875
876
877
878
879
0 20 40 60 80 100 120 140 1600
10
20
30
40
50
60
70
Energy Consumption [J]
(a) Histogram
No.
of n
odes
0 20 40 60 80 100 120 140 1600
0.1
0.2
0.3
0.4
0.5
0.6
0.7
0.8
0.9
1
Energy Consumption [J]
(b) Cdf
Cum
mul
ativ
e pr
obab
ility
Top 40RAll R
Top 40RAll R
Fig. 30. Energy consumption statistics for the network working in the proactive mode with one root station. Only common mesh nodes are included andthe proactive routing information lifetime is set to the default value of 5.12 s.
A. Vázquez-RodasQ1 , L.J. de la Cruz Llopis / Ad Hoc Networks xxx (2014) xxx–xxx 21
ADHOC 1083 No. of Pages 30, Model 3G
8 August 2014
Q1
This behavior is also confirmed when we analyze thetotal number of data forwardings per successfully receivedpacket (Fig. 22)). We can observe that, although the trafficload remains equivalent for all the cases and even theincreasing number of collisions requires more data packetretransmissions, the high network contention caused bythe routing messages overhead reduces the transmissionopportunities of data packets and then the number of for-wardings decreases instead of remain constant or growdue to collisions. Nevertheless, it is important to remarkthat the topology control contributes with an averagereduction in the number of data forwardings of about42.19%. This represents again a considerably energyconsumption savings.
The network efficiency in terms of packet delivery ratioalso exhibits a decreasing tendency when the lifetime or
Please cite this article in press as: A. Vázquez-Rodas, L.J. de la Cruz Llopnetworks, Ad Hoc Netw. (2014), http://dx.doi.org/10.1016/j.adhoc.2014
reactive routing information decreases (Fig. 23). Aspreviously said, this is due to the big amount of routingmanagement messages overhead required for a fasterupdate of the established paths. An important observationis that, for a given network efficiency value, the topologycontrol allows almost twice routing information updatescompared with the network operating with all routers.For example, the efficiency reached by the All R networkwith the default active path timeout value of 5.12 s couldbe achieved with the Top 40R topology even if the pathupdates are done approximately every 2.7 s. In summary,topology control also improves the scalability when moredynamism and variability is required.
With the same criteria of the previous section, Fig. 24shows the energy consumption statistics for the networkconfigured with a reactive path lifetime of 3 s. The
is, A centrality-based topology control protocol for wireless mesh.07.026

880
881
882
883
884
885
886
887
888
889
890
891
892
893
894
895
896
897
898
899
900
901
902
903
904
905
906
907
0 2 4 6 8 100
0.1
0.2
0.3
0.4
0.5
0.6
0.7
0.8
0.9
1
Delay [s]
(b)C
umul
ativ
e pr
obab
ility
0 2 4 6 8 100
0.1
0.2
0.3
0.4
0.5
0.6
0.7
0.8
0.9
1
Delay [s]
(c)
Cum
ulat
ive
prob
abilit
y
0 2 4 6 8 100
0.1
0.2
0.3
0.4
0.5
0.6
0.7
0.8
0.9
1
Delay [s]
(a)
Cum
ulat
ive
prob
abilit
y
Top40R-ActivePath=20.48s-Interv=8.192sAllR-ActivePath=20.48s-Interv=8.192s
AllR-ActivePath=10.24s-Interv=4.096sTop40R-ActivePath=10.24s-Interv=4.096s
Top40R-ActivePath=5.12s-Interv=2.048sAllR-ActivePath=5.12s-Interv=2.048s
Fig. 31. Cumulative distribution function of data packets end-to-end delay for different proactive path lifetimes.
22 A. Vázquez-RodasQ1 , L.J. de la Cruz Llopis / Ad Hoc Networks xxx (2014) xxx–xxx
ADHOC 1083 No. of Pages 30, Model 3G
8 August 2014
Q1
histogram (Fig. 24(a)) shows that the maximum energydissipated by a node in the network reduces from 79.3 to71.3 J when topology control is applied. The total energydissipated in the network reduces around a 38.44% (from2655.8 to 1635 J). The cdf (Fig. 24(b)) shows that whileonly 23% of nodes consumes less than 10 J in the All R con-figuration, this percentage increases to 67 in the Top 40Rnetwork.
The data packets end-to-end delay analysis (Fig. 25))reveals that the delay decreases when the path updatesare more frequents. This is due to the fact that the networkreacts earlier to link failures and to paths that should nolonger be valid for data forwarding. But it is also becausethere is a lesser number of data packets forwarded by
Please cite this article in press as: A. Vázquez-Rodas, L.J. de la Cruz Llopnetworks, Ad Hoc Netw. (2014), http://dx.doi.org/10.1016/j.adhoc.2014
intermediate stations and a lesser number of successfullyreceived packets. When the level of routing overheadincreases, most of the packets that finally arrives to thedestination are those that traverse a few number of inter-mediate nodes. Therefore, those packets arrives in shortertime. On the other hand, it is important to remark thatthe application of topology control improves the perfor-mance of the network regarding end-to-end delay for allthe simulation cases. Even the worst case results for thenetwork with topology control (Lifetime = 5.12 s) are bet-ter than the results for network with all routers and life-time greater than or equal to 2 s. The reason for this isthat the paths are established faster when a lesser numberof stations are involved in the path discovery procedure.
is, A centrality-based topology control protocol for wireless mesh.07.026

908
909
910
911
912
913
914
915
916
917
918
919
920
921
922
923
924
925
926
927
928
1 2 30
0.2
0.4
0.6
0.8
1
1.2
1.4
1.6
1.8
2
x 106
Number of Roots
(a)
Rat
e of
Rou
ting
Man
agem
ent M
essa
ges
[bps
]
1 2 30.1
0.15
0.2
0.25
0.3
0.35
0.4
0.45
0.5
0.55
0.6
Number of Rooots
(b)
Net
wor
k Ef
ficie
ncy
Top 40RAll R
All RTop 40R
Fig. 32. Proactive mode, variable number of root stations and constant traffic load: (a) rate of routing management messages and (b) network efficiency.
A. Vázquez-RodasQ1 , L.J. de la Cruz Llopis / Ad Hoc Networks xxx (2014) xxx–xxx 23
ADHOC 1083 No. of Pages 30, Model 3G
8 August 2014
Q1
5.3. Proactive mode. Impact of proactive routing informationlifetime
Proactive mode of HWMP protocol is more suitablewhen the target of data communications is mainly outsideof the mesh basic service set. The most common use casesare mesh stations accessing to Internet or the internet-working with other network technologies. In these cases,one or more mesh stations are configured to be the rootmesh station(s) and they play the role of gateways. Eachroot periodically sends path request (PREQ) messages in
Please cite this article in press as: A. Vázquez-Rodas, L.J. de la Cruz Llopnetworks, Ad Hoc Netw. (2014), http://dx.doi.org/10.1016/j.adhoc.2014
order to build a proactive tree, and thus, create paths fromall the mesh stations to the root.
As in the previous section, we begin evaluating how fastproactive data forwarding paths could be updated. A fasterroute update is required by more dynamic networks inwhich stations continuously vary their established peerlinks. Obviously, this implies a greater path selectionmanagement messages overhead. As stated in the IEEE802.11-2012 standard [32], the lifetime of the proactiverouting information is configured by the dot11Mesh-HWMPactivePathToRootTimeout control variable. This
is, A centrality-based topology control protocol for wireless mesh.07.026

929
930
931
932
933
934
935
936
937
938
939
940
941
942
943
944
945
946
947
948
949
950
951
952
953
954
1GW - 25Flows 2GW - 50Flows 3GW -75Flows0
0.2
0.4
0.6
0.8
1
1.2
1.4
1.6
1.8
2
x 106
Num. Roots - Num. Flows
(a)
Rat
e of
Rou
ting
Man
agem
ent M
essa
ges
[bps
]
1GW - 25Flows 2GW - 50Flows 3GW - 75Flows
0.16
0.18
0.2
0.22
0.24
0.26
0.28
Num. Roots - Num. Flows
(b)
Net
wor
k Ef
ficie
ncy
All RTop 40R
Top 40RAll R
Fig. 33. Proactive mode, variable number of root stations and traffic load: (a) rate of routing management messages and (b) network efficiency.
24 A. Vázquez-RodasQ1 , L.J. de la Cruz Llopis / Ad Hoc Networks xxx (2014) xxx–xxx
ADHOC 1083 No. of Pages 30, Model 3G
8 August 2014
Q1
variable should be greater than dot11MeshHWMProotInter-val which in turn controls the frequency of proactive PREQframes sent by the root. For the evaluation we configureone station as the root and then we vary the values of thesepair of variables from 20.48 to 0.64 s for the active path toroot timeout and from 8.192 to 0.256 s for the root inter-val. As it can be seen, we maintain constant the defaultratio between these variables in all the reported cases.For each independent run, the traffic load consists of 25simultaneously active data flows, five uploads fromrandomly selected mesh stations to the root and 20 down-loads from the root to randomly selected stations. Theexpected growth of routing management messages rate
Please cite this article in press as: A. Vázquez-Rodas, L.J. de la Cruz Llopnetworks, Ad Hoc Netw. (2014), http://dx.doi.org/10.1016/j.adhoc.2014
as the lifetime of routing information decreases is verifiedin Fig. 26. We also confirm that proactive routing overheadis greater than the reactive one. For instance, when thedefault routing lifetime values are used and for the 25flows case, the routing management rate increases fromaround 432 Kbps (Fig. 13)) to 1.1 Mbps for the All R config-uration, and from around 97 Kbps to 190 Kbps for thenetwork with topology control. The application of topologycontrol produces an average reduction of around 78.87% inthe routing management messages overhead.
The increase of routing overhead due to faster pathupdates causes more collisions and then data packets needto be retransmitted a greater number of times. This is
is, A centrality-based topology control protocol for wireless mesh.07.026
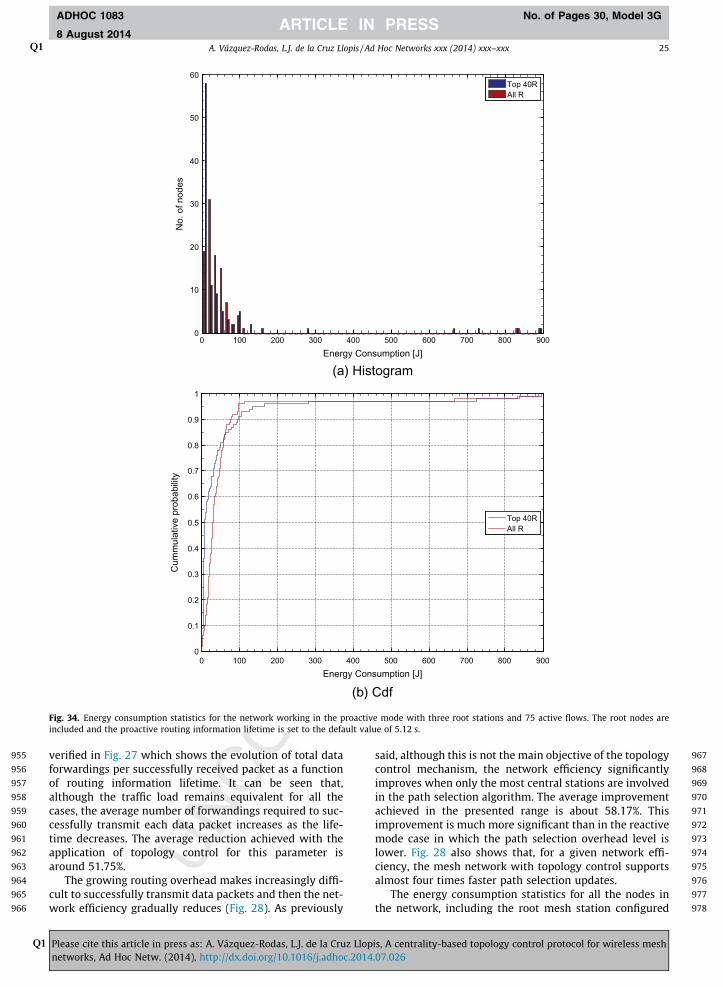
955
956
957
958
959
960
961
962
963
964
965
966
967
968
969
970
971
972
973
974
975
976
977
978
0 100 200 300 400 500 600 700 800 9000
10
20
30
40
50
60
Energy Consumption [J]
(a) Histogram
No.
of n
odes
0 100 200 300 400 500 600 700 800 9000
0.1
0.2
0.3
0.4
0.5
0.6
0.7
0.8
0.9
1
Energy Consumption [J]
(b) Cdf
Cum
mul
ativ
e pr
obab
ility
Top 40RAll R
Top 40RAll R
Fig. 34. Energy consumption statistics for the network working in the proactive mode with three root stations and 75 active flows. The root nodes areincluded and the proactive routing information lifetime is set to the default value of 5.12 s.
A. Vázquez-RodasQ1 , L.J. de la Cruz Llopis / Ad Hoc Networks xxx (2014) xxx–xxx 25
ADHOC 1083 No. of Pages 30, Model 3G
8 August 2014
Q1
verified in Fig. 27 which shows the evolution of total dataforwardings per successfully received packet as a functionof routing information lifetime. It can be seen that,although the traffic load remains equivalent for all thecases, the average number of forwandings required to suc-cessfully transmit each data packet increases as the life-time decreases. The average reduction achieved with theapplication of topology control for this parameter isaround 51.75%.
The growing routing overhead makes increasingly diffi-cult to successfully transmit data packets and then the net-work efficiency gradually reduces (Fig. 28). As previously
Please cite this article in press as: A. Vázquez-Rodas, L.J. de la Cruz Llopnetworks, Ad Hoc Netw. (2014), http://dx.doi.org/10.1016/j.adhoc.2014
said, although this is not the main objective of the topologycontrol mechanism, the network efficiency significantlyimproves when only the most central stations are involvedin the path selection algorithm. The average improvementachieved in the presented range is about 58.17%. Thisimprovement is much more significant than in the reactivemode case in which the path selection overhead level islower. Fig. 28 also shows that, for a given network effi-ciency, the mesh network with topology control supportsalmost four times faster path selection updates.
The energy consumption statistics for all the nodes inthe network, including the root mesh station configured
is, A centrality-based topology control protocol for wireless mesh.07.026
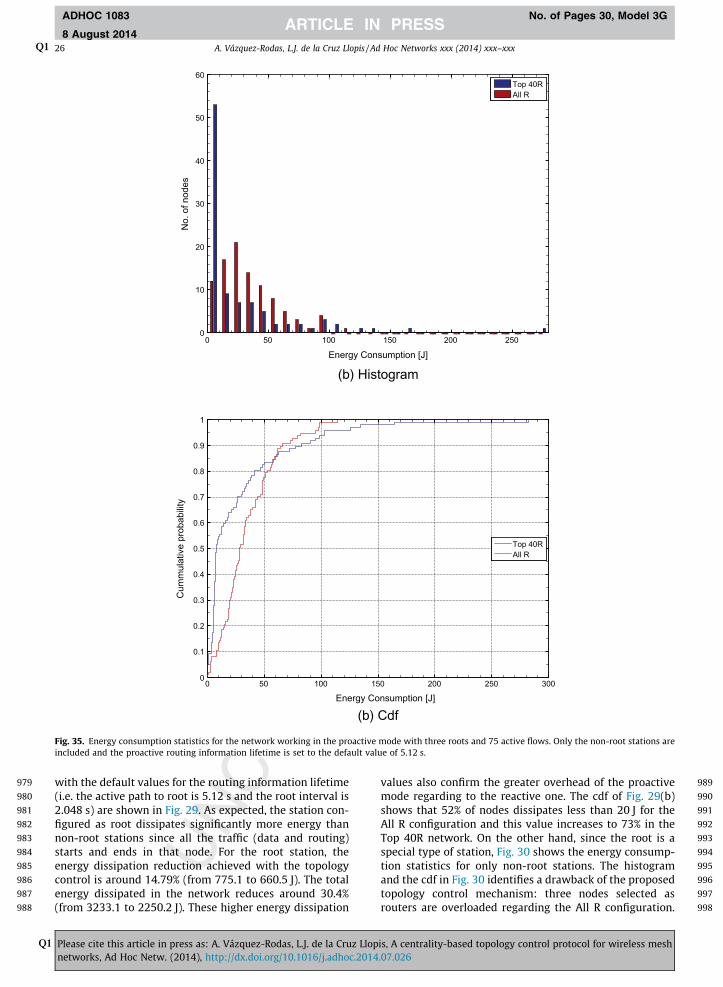
979
980
981
982
983
984
985
986
987
988
989
990
991
992
993
994
995
996
997
998
0 50 100 150 200 2500
10
20
30
40
50
60
Energy Consumption [J]
(b) Histogram
No.
of n
odes
0 50 100 150 200 250 3000
0.1
0.2
0.3
0.4
0.5
0.6
0.7
0.8
0.9
1
Energy Consumption [J]
(b) Cdf
Cum
mul
ativ
e pr
obab
ility
Top 40RAll R
Top 40RAll R
Fig. 35. Energy consumption statistics for the network working in the proactive mode with three roots and 75 active flows. Only the non-root stations areincluded and the proactive routing information lifetime is set to the default value of 5.12 s.
26 A. Vázquez-RodasQ1 , L.J. de la Cruz Llopis / Ad Hoc Networks xxx (2014) xxx–xxx
ADHOC 1083 No. of Pages 30, Model 3G
8 August 2014
Q1
with the default values for the routing information lifetime(i.e. the active path to root is 5.12 s and the root interval is2.048 s) are shown in Fig. 29. As expected, the station con-figured as root dissipates significantly more energy thannon-root stations since all the traffic (data and routing)starts and ends in that node. For the root station, theenergy dissipation reduction achieved with the topologycontrol is around 14.79% (from 775.1 to 660.5 J). The totalenergy dissipated in the network reduces around 30.4%(from 3233.1 to 2250.2 J). These higher energy dissipation
Please cite this article in press as: A. Vázquez-Rodas, L.J. de la Cruz Llopnetworks, Ad Hoc Netw. (2014), http://dx.doi.org/10.1016/j.adhoc.2014
values also confirm the greater overhead of the proactivemode regarding to the reactive one. The cdf of Fig. 29(b)shows that 52% of nodes dissipates less than 20 J for theAll R configuration and this value increases to 73% in theTop 40R network. On the other hand, since the root is aspecial type of station, Fig. 30 shows the energy consump-tion statistics for only non-root stations. The histogramand the cdf in Fig. 30 identifies a drawback of the proposedtopology control mechanism: three nodes selected asrouters are overloaded regarding the All R configuration.
is, A centrality-based topology control protocol for wireless mesh.07.026
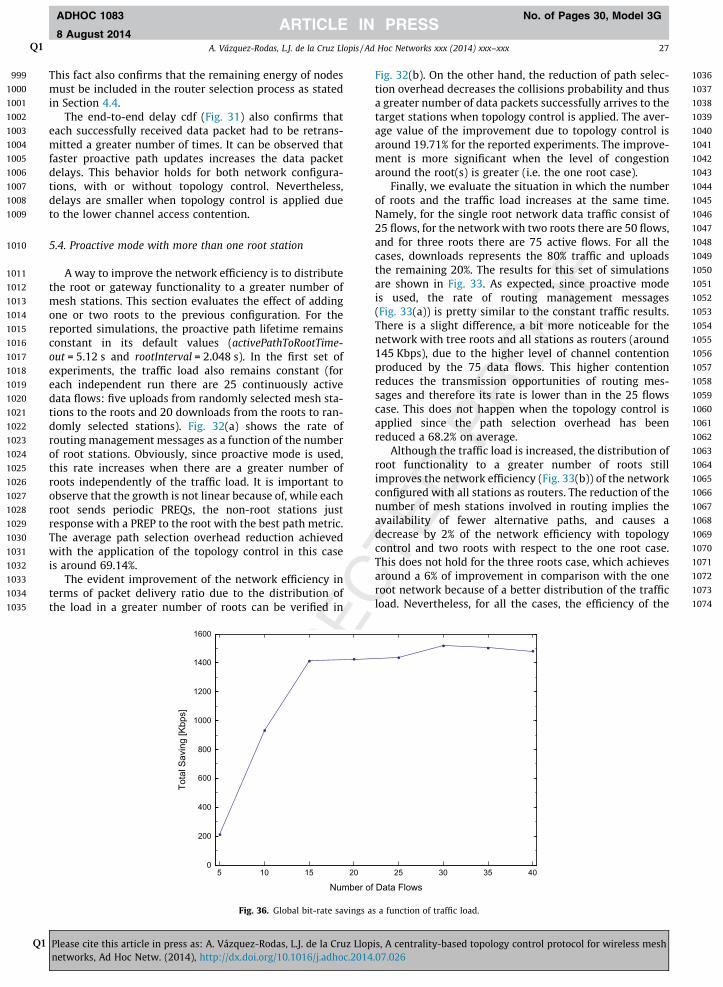
999
1000
1001
1002
1003
1004
1005
1006
1007
1008
1009
1010
1011
1012
1013
1014
1015
1016
1017
1018
1019
1020
1021
1022
1023
1024
1025
1026
1027
1028
1029
1030
1031
1032
1033
1034
1035
1036
1037
1038
1039
1040
1041
1042
1043
1044
1045
1046
1047
1048
1049
1050
1051
1052
1053
1054
1055
1056
1057
1058
1059
1060
1061
1062
1063
1064
1065
1066
1067
1068
1069
1070
1071
1072
1073
1074
A. Vázquez-RodasQ1 , L.J. de la Cruz Llopis / Ad Hoc Networks xxx (2014) xxx–xxx 27
ADHOC 1083 No. of Pages 30, Model 3G
8 August 2014
Q1
This fact also confirms that the remaining energy of nodesmust be included in the router selection process as statedin Section 4.4.
The end-to-end delay cdf (Fig. 31) also confirms thateach successfully received data packet had to be retrans-mitted a greater number of times. It can be observed thatfaster proactive path updates increases the data packetdelays. This behavior holds for both network configura-tions, with or without topology control. Nevertheless,delays are smaller when topology control is applied dueto the lower channel access contention.
5.4. Proactive mode with more than one root station
A way to improve the network efficiency is to distributethe root or gateway functionality to a greater number ofmesh stations. This section evaluates the effect of addingone or two roots to the previous configuration. For thereported simulations, the proactive path lifetime remainsconstant in its default values (activePathToRootTime-out = 5.12 s and rootInterval = 2.048 s). In the first set ofexperiments, the traffic load also remains constant (foreach independent run there are 25 continuously activedata flows: five uploads from randomly selected mesh sta-tions to the roots and 20 downloads from the roots to ran-domly selected stations). Fig. 32(a) shows the rate ofrouting management messages as a function of the numberof root stations. Obviously, since proactive mode is used,this rate increases when there are a greater number ofroots independently of the traffic load. It is important toobserve that the growth is not linear because of, while eachroot sends periodic PREQs, the non-root stations justresponse with a PREP to the root with the best path metric.The average path selection overhead reduction achievedwith the application of the topology control in this caseis around 69.14%.
The evident improvement of the network efficiency interms of packet delivery ratio due to the distribution ofthe load in a greater number of roots can be verified in
5 10 15 200
200
400
600
800
1000
1200
1400
1600
Number of
Tota
l Sav
ing
[Kbp
s]
Fig. 36. Global bit-rate savings a
Please cite this article in press as: A. Vázquez-Rodas, L.J. de la Cruz Llopnetworks, Ad Hoc Netw. (2014), http://dx.doi.org/10.1016/j.adhoc.2014
Fig. 32(b). On the other hand, the reduction of path selec-tion overhead decreases the collisions probability and thusa greater number of data packets successfully arrives to thetarget stations when topology control is applied. The aver-age value of the improvement due to topology control isaround 19.71% for the reported experiments. The improve-ment is more significant when the level of congestionaround the root(s) is greater (i.e. the one root case).
Finally, we evaluate the situation in which the numberof roots and the traffic load increases at the same time.Namely, for the single root network data traffic consist of25 flows, for the network with two roots there are 50 flows,and for three roots there are 75 active flows. For all thecases, downloads represents the 80% traffic and uploadsthe remaining 20%. The results for this set of simulationsare shown in Fig. 33. As expected, since proactive modeis used, the rate of routing management messages(Fig. 33(a)) is pretty similar to the constant traffic results.There is a slight difference, a bit more noticeable for thenetwork with tree roots and all stations as routers (around145 Kbps), due to the higher level of channel contentionproduced by the 75 data flows. This higher contentionreduces the transmission opportunities of routing mes-sages and therefore its rate is lower than in the 25 flowscase. This does not happen when the topology control isapplied since the path selection overhead has beenreduced a 68.2% on average.
Although the traffic load is increased, the distribution ofroot functionality to a greater number of roots stillimproves the network efficiency (Fig. 33(b)) of the networkconfigured with all stations as routers. The reduction of thenumber of mesh stations involved in routing implies theavailability of fewer alternative paths, and causes adecrease by 2% of the network efficiency with topologycontrol and two roots with respect to the one root case.This does not hold for the three roots case, which achievesaround a 6% of improvement in comparison with the oneroot network because of a better distribution of the trafficload. Nevertheless, for all the cases, the efficiency of the
25 30 35 40
Data Flows
s a function of traffic load.
is, A centrality-based topology control protocol for wireless mesh.07.026

1075
1076
1077
1078
1079
1080
1081
1082
1083
1084
1085
1086
1087
1088
1089
1090
1091
1092
1093
1094
1095
1096
1097
1098
1099
1100
1101
1102
1103
1104
1105
1106
1107
1108
28 A. Vázquez-RodasQ1 , L.J. de la Cruz Llopis / Ad Hoc Networks xxx (2014) xxx–xxx
ADHOC 1083 No. of Pages 30, Model 3G
8 August 2014
Q1
network with topology control is better than the all routersnetwork even though consuming less energy. The averageimprovement is about 19.54%.
The energy consumption statistics for the three rootsand 75 active flows configuration are shown in Fig. 34 forall the nodes in the network and in Fig. 35 for only non-root stations. Again, the three root stations can be easilyidentified. Although the global energy dissipation isreduced around a 10.25% (from 5782.9 to 5190.3 J) withthe topology control, we can recognize, as in the previoussection, four overloaded non-root stations regarding theAll R network. However, the nodes that dissipate less than20 J increases from 30% to 64% in the Top 40R case.
5.5. Total bit rate savings for the distributed implementation
This section includes a first approximation to the eval-uation of the proposed distributed implementation. We
5 40
200
400
600
800
1000
1200
1400
1600
Lifetime of reactive
Tota
l Sav
ing
[Kbp
s]
Fig. 37. Global bit-rate savings as a fu
20.48/8.192 10.24/4.096 5.12/2.0481200
1400
1600
1800
2000
2200
2400
2600
2800
Active path to root time
Tota
l Sav
ing
[Kbp
s]
Fig. 38. Global bit-rate savings as a fun
Please cite this article in press as: A. Vázquez-Rodas, L.J. de la Cruz Llopnetworks, Ad Hoc Netw. (2014), http://dx.doi.org/10.1016/j.adhoc.2014
analyze the total bit-rate savings achieved with the appli-cation of the topology control mechanism. The computa-tions include the reduction of data forwardings, thereduction of path selection related messages and also thecost of the router selection protocol (Eq. (8)). For all thereported cases, in order to compute the bit rate added bythe topology control we make the following consider-ations: NT ¼ 100 nodes, NN ¼ 8 (i.e. NN equal to the averagedegree of all the nodes in the network), NR ¼ 2 whichresults on average in around 40% of nodes selected as rou-ters, and the periodicity (TUT) of the required topologycontrol related messages is the same that the routing infor-mation lifetime. Remember from Section 4.4 that TUT Pdot11MeshHWMPactivePathTimeout.
For the first set of experiments, reported in Section5.1, Fig. 36 shows the total bit-rate savings achievedwith the topology control application as a function ofthe number of data flows. In this case TUT = 5.12 s and
3 2 1
routing information [s]
nction of reactive path lifetime.
2.56/1.024 1.28/0.512 0.64/0.256
out / Root Interval [s]
ction of proactive path lifetimes.
is, A centrality-based topology control protocol for wireless mesh.07.026

1109
1110
1111
1112
1113
1114
1115
1116
1117
1118
1119
1120
1121
1122
1123
1124
1125
1126
1127
1128
1129
1130
1131
1132
1133
1134
1135
1136
1137
1138
1139
1140
1141
1142
1143
1144
1145
1146
1147
1148
1149
1150
1151
1152
1153
1154
1155
1156
1157
1158
1159
1160
1161
1162
1163
1164
1165
1166
1167
1168
1169
1170
1171
1172
1173
1174
1175
1176
1177
1178
1179
1180
1181
1182
1183
1184
1185
1186
1187
1188
1189
1190
1191
1192
1193
1194
1195
1196
1197
1198
119912001201120212031204120512061207120812091210121112121213121412151216121712181219122012211222122312241225122612271228122912301231
A. Vázquez-RodasQ1 , L.J. de la Cruz Llopis / Ad Hoc Networks xxx (2014) xxx–xxx 29
ADHOC 1083 No. of Pages 30, Model 3G
8 August 2014
Q1
remains constant for all the different traffic loads. Anaverage savings of 1.24 Mbps is reached with thetopology control and the previously mentioned networksaturation is also verified in this figure. It is importantto remark that the transmission/reception energy savingsof the mesh stations is directly proportional to thisreported quantity.
On the other hand, Fig. 37 shows the evolution of thisglobal traffic reduction as a function of the lifetime of thereactive routing information (experiments reported in Sec-tion 5.2). As previously justified, in these experiments theperiodicity of topology control updates is again the samethan the path lifetime. The average reduction for thereported cases is around 1.46 Mbps.
Finally, the global bit-rate reduction for the proactiveone-root case (experiments reported in Section 5.3) isshown in Fig. 38. The average value of the savings is around1.86 Mbps and as it was expected this is greater than in thereactive mode configuration.
6. Conclusions
In this paper we have evaluated the feasibility of usingthe centrality metrics from social network analysis to cre-ate a topology control mechanism based on a connecteddominating set. Specifically, for a dynamic wireless meshnetwork formed by user hand-held devices, we have pro-posed and evaluated some mechanisms to select whichof those devices must act as routers, forwarding the pack-ets received from other hand-held to their destination. Themechanism implementation has been proposed in twoways, centralized and distributed. For the centralizedapproach, we have evaluated the three most common cen-trality measures: degree, closeness and betweenness cen-trality. In all those cases, the more central nodes havebeen selected to form the backbone. The experimentalanalysis has shown that the network fragmentation usingthe betweenness centrality is considerably lesser thanthe resultant with degree or closeness centralities. Thus,it is possible to conclude that by far the betweenness cen-trality is the metric that better identifies the stations thatshould be considered for routing tasks. In the second place,taking into consideration that a centralized implementa-tion could be unfeasible in most scenarios, a distributedimplementation has been proposed. In this case only thebetweenness centrality has been considered. To distributethe responsibility, the concept of the egocentric networkperspective of each station is needed. That is, every stationcomputes its own centrality knowing only its own estab-lished links (neighbors). Besides, due to the dynamic andtime evolving nature of the network with which we aredealing, we also discuss and evaluate different distributedmechanisms to select the central stations that will act asrouters. First of all, every station selects the node in itsneighborhood with the highest centrality. This mechanismworks well in most cases if a minimum density of nodesexists. Then again, the complete connectivity is notassured. To guarantee that connectivity, some approacheshave been proposed and compared in terms of overloadand effectiveness. As a future line of work, the minimumnumber of routers per neighborhood needed to guaranty
Please cite this article in press as: A. Vázquez-Rodas, L.J. de la Cruz Llopnetworks, Ad Hoc Netw. (2014), http://dx.doi.org/10.1016/j.adhoc.2014
a desired connectivity in the distributed implementationwill be studied.
The effectiveness of this centrality-aware topology con-trol protocol has been verified through extensive simula-tions. The evaluation has been carried out for bothreactive and proactive path selection modes. For all thestudied cases the efficiency of the network was improvedor at least remain equal but always with a considerablylower amount of transmission/reception energy consump-tion. Another common factor in all the simulation results isthe reduction of the packet end-to-end delays. This is adirect consequence of the global bit-rate savings whichimplies lower channel contention. The reduction of thenumber of mesh stations involved in the path selectionprocedure also improves the scalability when the variabil-ity of the network demands faster path updates. Finally, weconfirm that greater energy savings are obtained in theproactive path selection case because of the greater over-head present with this operation mode.
As current and future lines of work we are carrying outperformance evaluations considering human mobilitymodels. Besides, we are designing and evaluating amulti-metric protocol which assigns different weights tothe egocentric betweenness centrality and the noderemaining energy values.
Acknowledgments
This work was supported by the Spanish ResearchCouncil under project COPPI (TEC2011-26491), and bythe Ecuadorian SENESCYT (2010) and Salesian PolytechnicUniversity grant programs.
References
[1] I.F. Akyildiz, X. Wang, W. Wang, Wireless mesh networks: a survey,Comput. Netw. 47 (4) (2005) 445–487. http://dx.doi.org/10.1016/j.comnet.2004.12.001. <http://www.sciencedirect.com/science/article/pii/S1389128604003457>.
[2] W. Khan, Y. Xiang, M. Aalsalem, Q. Arshad, Mobile phone sensingsystems: a survey, Commun. Surv. Tutorials, IEEE 15 (1) (2013) 402–427, http://dx.doi.org/10.1109/SURV.2012.031412.00077.
[3] Y. Jiang, A. Jaiantilal, X. Pan, M. Al-Mutawa, S. Mishra, L. Shi,Personalized energy consumption modeling on smartphones, in: D.Uhler, K. Mehta, J. Wong (Eds.), Mobile Computing, Applications, andServices, Lecture Notes of the Institute for Computer Sciences, SocialInformatics and Telecommunications Engineering, vol. 110, Springer,Berlin Heidelberg, 2013, pp. 343–354. http://dx.doi.org/10.1007/978-3-642-36632-1_20.
[4] A. Aziz, Y. Sekercioglu, P. Fitzpatrick, M. Ivanovich, A survey ondistributed topology control techniques for extending the lifetime ofbattery powered wireless sensor networks, Commun. Surv. Tutorials,IEEE 15 (1) (2013) 121–144, http://dx.doi.org/10.1109/SURV.2012.031612.00124.
[5] S. Narayanaswamy, V. Kawadia, R.S. Sreenivas, P.R. Kumar, Powercontrol in ad-hoc networks: theory, architecture, algorithm andimplementation of the COMPOW protocol, in: European WirelessConference, 2002, pp. 156–162.
[6] N. Li, J. Hou, L. Sha, Design and analysis of an MST-based topologycontrol algorithm, IEEE Trans. Wirel. Commun. 4 (3) (2005) 1195–1206, http://dx.doi.org/10.1109/TWC.2005.846971.
[7] Y. Xu, J. Heidemann, D. Estrin, Geography-informed energyconservation for ad hoc routing, in: Proceedings of the 7th AnnualInternational Conference on Mobile Computing and Networking,MobiCom ’01, ACM, New York, NY, USA, 2001, pp. 70–84. http://dx.doi.org/10.1145/381677.381685.
[8] F. Ye, G. Zhong, J. Cheng, S. Lu, L. Zhang, Peas: a robust energyconserving protocol for long-lived sensor networks, in: Proceedings.
is, A centrality-based topology control protocol for wireless mesh.07.026
12321233123412351236123712381239124012411242124312441245124612471248124912501251125212531254125512561257125812591260126112621263126412651266126712681269127012711272 Q312731274127512761277127812791280128112821283128412851286128712881289129012911292129312941295129612971298129913001301130213031304130513061307130813091310
13111312131313141315131613171318131913201321132213231324132513261327132813291330133113321333133413351336Q4133713381339134013411342134313441345134613471348134913501351135213531354
1355
13571357
13581359136013611362136313641365136613671368136913701371
13731373
13741375137613771378137913801381138213831384
30 A. Vázquez-RodasQ1 , L.J. de la Cruz Llopis / Ad Hoc Networks xxx (2014) xxx–xxx
ADHOC 1083 No. of Pages 30, Model 3G
8 August 2014
Q1
23rd International Conference on Distributed Computing Systems,2003, pp. 28–37. http://dx.doi.org/10.1109/ICDCS.2003.1203449.
[9] J. Wu, F. Dai, M. Gao, I. Stojmenovic, On calculating power-awareconnected dominating sets for efficient routing in ad hoc wirelessnetworks, J. Commun. Netw. 4 (1) (2002) 59–70, http://dx.doi.org/10.1109/JCN.2002.6596934.
[10] R. Misra, C. Mandal, Minimum connected dominating set using acollaborative cover heuristic for ad hoc sensor networks, IEEE Trans.Parall. Distrib. Syst. 21 (3) (2010) 292–302, http://dx.doi.org/10.1109/TPDS.2009.78.
[11] Z. Yuanyuan, X. Jia, H. Yanxiang, Energy efficient distributedconnected dominating sets construction in wireless sensornetworks, in: Proceedings of the 2006 International Conference onWireless Communications and Mobile Computing, IWCMC ’06, ACM,New York, NY, USA, 2006, pp. 797–802. http://dx.doi.org/10.1145/1143549.1143709.
[12] A.-L. Barabási, Network Science, 2012. <http://barabasilab.neu.edu/networksciencebook/>.
[13] T.G. Lewis, Network Science: Theory and Applications, WileyPublishing, 2009.
[14] M. Newman, Networks: An Introduction, Oxford University Press,Inc., New York, NY, USA, 2010.
[15] D. Katsaros, N. Dimokas, L. Tassiulas, Social network analysisconcepts in the design of wireless ad hoc network protocols,Netw., IEEE 24 (6) (2010) 23–29, http://dx.doi.org/10.1109/MNET.2010.5634439.
[16] E. Stai, V. Karyotis, S. Papavassiliou, Topology enhancements inwireless multihop networks: a top-down approach, IEEE Trans.Parall. Distrib. Syst. 23 (7) (2012) 1344–1357, http://dx.doi.org/10.1109/TPDS.2011.250.
[17] C. Verma, B. Tamma, B.S. Manoj, R. Rao, A realistic small-world modelfor wireless mesh networks, Commun. Lett., IEEE 15 (4) (2011) 455–457, http://dx.doi.org/10.1109/LCOMM.2011.020111. 100266.
[18] A. Banerjee, R. Agarwal, V. Gauthier, C.K. Yeo, H. Afifi, F. Lee, A self-organization framework for wireless ad hoc networks as smallworlds, IEEE Trans. Veh. Technol. 61 (6) (2012) 2659–2673, http://dx.doi.org/10.1109/TVT.2012.2197768.
[19] D.J. Watts, S.H. Strogatz, Collective dynamics of ‘small-world’networks, Nature 393 (6684) (1998) 409–410.
[20] R. Agarwal, A. Banerjee, V. Gauthier, M. Becker, C.K. Yeo, B.S. Lee,Achieving small-world properties using bio-inspired techniques inwireless networks, Comput. J. http://dx.doi.org/10.1093/comjnl/bxs024. <http://comjnl.oxfordjournals.org/content/early/2012/03/28/comjnl.bxs024.abstract>.
[21] E.M. Daly, M. Haahr, Social network analysis for routing indisconnected delay-tolerant manets, in: Proceedings of the 8thACM International Symposium on Mobile Ad Hoc Networking andComputing, MobiHoc ’07, ACM, New York, NY, USA, 2007, pp. 32–40.http://dx.doi.org/10.1145/1288107.1288113.
[22] M. Kas, S. Appala, C. Wang, K. Carley, L. Carley, O. Tonguz, What ifwireless routers were social? Approaching wireless mesh networksfrom a social networks perspective, Wirel. Commun., IEEE 19 (6)(2012) 36–43, http://dx.doi.org/10.1109/MWC.2012.6393516.
[23] G. Pallis, D. Katsaros, M. Dikaiakos, N. Loulloudes, L. Tassiulas, On thestructure and evolution of vehicular networks, in: IEEE InternationalSymposium on Modeling, Analysis Simulation of Computer andTelecommunication Systems, MASCOTS ’09, 2009, pp. 1–10. http://dx.doi.org/10.1109/MASCOT.2009.5366230.
[24] M. Girvan, M.E.J. Newman, Community structure in social andbiological networks, Proc. Nat. Acad. Sci. 99 (12) (2002) 7821–7826,http://dx.doi.org/10.1073/pnas.122653799. <http://www.pnas.org/content/99/12/7821.abstract>.
[25] A. Cuzzocrea, A. Papadimitriou, D. Katsaros, Y. Manolopoulos, Edgebetweenness centrality: a novel algorithm for QoS-based topologycontrol over wireless sensor networks, J. Netw. Comput. Appl. 35 (4)(2012) 1210–1217. http://dx.doi.org/10.1016/j.jnca.2011.06.001.<http://www.sciencedirect.com/science/article/pii/S1084804511001135>.
[26] J. Wu, H. Li, On calculating connected dominating set for efficientrouting in ad hoc wireless networks, in: Proceedings of the 3rdInternational Workshop on Discrete Algorithms and Methods forMobile Computing and Communications, DIALM ’99, ACM, New York,NY, USA, 1999, pp. 7–14. http://dx.doi.org/10.1145/313239.313261.
[27] D. Kim, Y. Wu, Y. Li, F. Zou, D.-Z. Du, Constructing minimumconnected dominating sets with bounded diameters in wirelessnetworks, IEEE Trans. Parall. Distrib. Syst. 20 (2) (2009) 147–157,http://dx.doi.org/10.1109/TPDS.2008.74.
[28] M. Thai, F. Wang, D. Liu, S. Zhu, D.-Z. Du, Connected dominating setsin wireless networks with different transmission ranges, IEEE Trans.
Please cite this article in press as: A. Vázquez-Rodas, L.J. de la Cruz Llopnetworks, Ad Hoc Netw. (2014), http://dx.doi.org/10.1016/j.adhoc.2014
Mobile Comput. 6 (7) (2007) 721–730, http://dx.doi.org/10.1109/TMC.2007.1034.
[29] L.C. Freeman, Centrality in social networks conceptual clarification,Soc. Netw. 1 (3) (1978–1979) 215–239. http://dx.doi.org/10.1016/0378-8733(78)90021-7. <http://www.sciencedirect.com/science/article/pii/0378873378900217>.
[30] L.C. Freeman, A set of measures of centrality based on betweenness,Sociometry 40 (1) (1977) 35–41. <http://links.jstor.org/sici?sici= 0038-0431%28197703%2940%3A1%3C35%3AASOMOC%3E2.0.CO%3B2-H>.
[31] ns-3 Network Simulator. <http://www.nsnam.org/>.[32] IEEE Standard for Information Technology–Telecommunications and
Information Exchange between Systems Local and Metropolitan AreaNetworks–Specific Requirements Part 11: Wireless LAN MediumAccess Control (MAC) and Physical Layer (PHY) Specifications, IEEE Std802.11-2012 (Revision of IEEE Std 802.11-2007) (2012) 1–2793 http://dx.doi.org/10.1109/IEEESTD.2012. 6178212.
[33] S. Kurkowski, W. Navidi, T. Camp, Constructing manet simulationscenarios that meet standards, in: IEEE Internatonal Conference onMobile Adhoc and Sensor Systems, MASS, 2007, pp. 1–9. http://dx.doi.org/10.1109/MOBHOC.2007.4428640.
[34] K. Andreev, P. Boyko, IEEE 802.11s mesh networking NS-3 model, in:Workshop on ns3, 2010, p. 43.
[35] K.M. Carley, J. Pfeffer, J. Reminga, J. Storrick, D. Columbus, ORA User’sGuide 2012, Tech. Rep., DTIC Document, 2012.
[36] S.P. Borgatti, M.G. Everett, L.C. Freeman, UCINET for windows:software for social network analysis (2002).
[37] S.P. Borgatti, Identifying sets of key players in a social network,Comput. Math. Org. Theory 12 (1) (2006) 21–34, http://dx.doi.org/10.1007/s10588-006-7084-x. <http://dx.doi.org/10.1007/s10588-006-7084-x>.
[38] P.V. Marsden, Egocentric and sociocentric measures of networkcentrality, Soc. Netw. 24 (4) (2002) 407–422. doi:http://dx.doi.org/10.1016/S0378-8733(02)00016-3. URL http://www.sciencedirect.com/science/article/pii/S0378873302000163.
[39] M. Everett, S.P. Borgatti, Ego network betweenness, Social Networks27 (1) (2005) 31–38. http://dx.doi.org/10.1016/j.socnet.2004.11.007.<http://www.sciencedirect.com/science/article/pii/S037887330400067X>.
[40] W. Heinzelman, A. Chandrakasan, H. Balakrishnan, Energy-efficientcommunication protocol for wireless microsensor networks, in:Proceedings of the 33rd Annual Hawaii International Conference onSystem Sciences, vol. 2, 2000, p. 10. http://dx.doi.org/10.1109/HICSS.2000.926982.
Andrés Vázquez Rodas received the Elec-tronics Engineering degree (Honors) in 2004from the Salesian Polytechnic University,Cuenca, Ecuador and the M.Sc. (Honors) fromthe University of Cuenca, Ecuador in 2010. Hewas also an assistant professor at the SalesianPolytechnic University until 2010. He is cur-rently pursuing his Ph.D. at the Department ofTelematic Engineering at the UniversitatPolitècnica de Catalunya BarcelonaTech (UPC),Barcelona, Spain. His research interestsinclude wireless mesh networks, wireless
sensor networks, multimedia services and complex networks.
Luis J. de la Cruz Llopis received the tele-communication engineering degree in 1994and the Ph.D. in telecommunications engi-neering in 1999, both from the UniversitatPolitècnica de Catalunya BarcelonaTech (UPC),Barcelona, Spain. He is currently an AssociateProfessor at the Department of TelematicEngineering of the UPC. His current researchinterests include multimedia service trans-mission with QoS and network security.
is, A centrality-based topology control protocol for wireless mesh.07.026


![Topology-Adaptive Mesh Deformation for Surface Evolution, … · Topology-Adaptive Mesh Deformation for Surface Evolution, Morphing, and Multi-View Reconstruction. [Research Report]](https://img.dokumen.tips/doc/110x75/5f785df833d37a1d7d2d6044/topology-adaptive-mesh-deformation-for-surface-evolution-topology-adaptive-mesh.jpg)