Embed Size (px)
Citation preview

A brief history of articulatory-acoustic vowel
representation
Coriandre Vilain, Frederic Berthommier, Louis-Jean Boe
To cite this version:
Coriandre Vilain, Frederic Berthommier, Louis-Jean Boe. A brief history of articulatory-acoustic vowel representation. 1st Internation Workshop on the History of Speech Commu-nication Research (HSCR 2015), Sep 2015, Dresede, France. proceedings of the 1st InternationWorkshop on the History of Speech Communication Research, 2015. <hal-01197460>
HAL Id: hal-01197460
https://hal.archives-ouvertes.fr/hal-01197460
Submitted on 11 Sep 2015
HAL is a multi-disciplinary open accessarchive for the deposit and dissemination of sci-entific research documents, whether they are pub-lished or not. The documents may come fromteaching and research institutions in France orabroad, or from public or private research centers.
L’archive ouverte pluridisciplinaire HAL, estdestinee au depot et a la diffusion de documentsscientifiques de niveau recherche, publies ou non,emanant des etablissements d’enseignement et derecherche francais ou etrangers, des laboratoirespublics ou prives.
CORE Metadata, citation and similar papers at core.ac.uk
Provided by Hal - Université Grenoble Alpes

1
A brief history of articulatory-acoustic vowel representation
Coriandre Vilain*, Frédéric Berthommier, Louis-Jean Boë
- Univ. Grenoble Alpes, GIPSA-Lab, F-38000 Grenoble, France! - CNRS, GIPSA-Lab, F-38000 Grenoble, France !
(*) corresponding author: [email protected]
Abstract: This paper aims at following the concept of vowel space across history. It shows that even with very poor experimental means, researchers from the 17th century started to organize the vowel systems along perceptual dimensions, either articulatory, by means of proprioceptive introspection, or auditory. With the development of experimental devices, and the increasing knowledge in acoustic and articulatory theories in the 19th century, it is shown how the relationship between the two dimensions tended to tighten. At the mid 20th century, the link between articulatory parameters such as jaw opening, position of the constriction of the tongue, or lip rounding, and the acoustical values of formants was clear. At this period, with the increasing amount of phonological descriptions of the languages of the world, and the power of the computer database analysis allowing extracting universal tendencies, the question of how the vowel systems are organized arose. The paper discusses this important question, focusing on two points: (1) how the auditory constraints shape the positioning of a specific set of vowel within the acoustic space, and (2) how the articulatory constraints shape the maximal extension of the vowel systems, the so-called maximal vowel space (MVS).
1. Introduction: articulatory or auditory representation of vowels?
In the past centuries, the vowel space representation evolved along two main dimensions: articulatory and auditory. One of the first articulatory representations of vowels was proposed by Robinson in 1617. By capturing the position of his tongue positions during vowel production, he proposed to categorize the vowels along the anterior-posterior position of the tongue (see [1] for details). More than a hundred years later, Hellwag proposed in turn, one of the first triangle representations of the German vowel space with its degrees and its order relations ([2: §57], see fig. 1 left). Now, the auditory perception seemed to be of importance in this description. As quoted by Nearey: « Hellwag is partly interested in anatomical descriptions of speech production. However, his introduction of the triangle seems to be motivated primarily by concern for some type of auditory, rather than articulatory relationship» ([3: 41]). Indeed, Hellwag was much influenced by Reyher’s 1679 works on “tone heights”, defined from whispered vowels and that relied on the timbre of the vowels independently of any fundamental frequency (see [1]).
At the same period, the German physicist Chladni ([4]) proposed another representation of the 10 vowels, that he claimed to be the whole set of vowels, sorted into 3 series according to articulatory considerations1 ([4: § 52], see fig. 1 right). From the vowel /a/, he derived a 1st branch with “open outside and slowly narrowing inside” (/a ɔ o u/), a 2nd branch with an
1 It is interesting to note that this description of vowels is absent from the original 1802 German edition, but it is present in the 1809 French expanded edition.

2
identical “open outside and slowly narrowing inside”2 (/a ɛ e i/), and the 3rd branch with “slowly narrowing outside and inside” (/a œ ∅ y/). However, at this time, these articulatory descriptions remained quite qualitative.
Figure 1. First vowel triangle representations. On the left, Hellwag ([2: § 57); on the right, Chladni
([4: §52]) A formalization of the vowels classification in terms of more quantitative horizontal and
vertical tongue position has been proposed in 1867 by A.M. Bell in his famous Visible Speech ([5]). In Bell’s system, specific graphical symbols coding for the positions of the speech articulators were defined. These symbols were used as supports to help deaf people in learning to speak. H. Sweet further developed Bell system to give rise to the Bell & Sweet model ([6]). In this model, the explicit link between articulatory configurations and vowel classification was made, using introspective sensations of the tongue position instead of auditory assessment. Indeed, as quoted by Catford, Sweet gave more credit to articulatory than auditory skills to classify vowels: “there can be no question that flexible organs well trained together with only an average ear, can yield better results than even an exceptionally good ear without organic training”. ([7: 22]).
Following Bell & Sweet, Passy, founder of the IPA in 1886, explicitly arranged the natural language vowels along two articulatory dimensions: (1) front-back, with three degrees of articulation (palatal, mixed and velar) and (2) open-close, with four degrees of opening ([8],[9], see fig. 2).
Figure 2. Natural vowels representation by Passy in 1888 (extract from [8])
2 No reference was given to the lip position in the first 2 branches, which would allow distinguishing between them.

3
It is noteworthy that in Passy’s description, the arrangement along the front-back dimension seems to be associated with the acoustical dimension of « clarity », as attested by the vicinity of /i y/, /i u/, and /ɯ u/ [3: 53]).
In the continuation of Passy’s work, Jones introduced in 1917 his primary cardinal vowels containing 4 front unrounded vowels /i/, /e/, /ɛ/, /a/ and 4 back vowels, the unrounded /ɑ/, and the 3 rounded /u/, /o/, /ɔ/ ([10], [11]). These cardinal vowels were defined as a set of references to be compared with the vowels of the actual languages of the world. They were supposed to limit the extension of these vocalic systems. In Jones’s view, the 1st (/i/) and the 5th (/ɑ/) vowels were the only ones that could be articulatory defined; the others were just auditorily defined in perceptually equidistant steps. The secondary cardinal vowels were defined with an opposite rounding feature: the 4 front rounded vowels /y/, /∅/, /œ/ /ɶ/, the 3 back unrounded vowels /ɯ/, /Ɣ/, /Ʌ/, and the back rounded vowels /ɒ/. It is worth noting that in Jones, and more generally in the IPA view, taking into account the lips rounding explicitly allowed discriminating vowels with the same place of articulation and the same aperture (fig. 2).
To summarize, up to the early 20th century, the articulatory representation tended to be the primary means to organize and classify the vowels in a convenient way. Even if the acoustical dimension was not completely absent, it remained of poor importance since the human ear was the sole means of analysis of the speech sounds. This changed at the end of the 19th century with the development of acoustic theories, and of devices dedicated to record, measure and analyse these speech sounds.
2/ The acoustic measurements of formants The notion of formants is intrinsically connected to the notion of acoustic resonance in tubes. A large amount of research in acoustics had been performed in the early 19th century. Chladni, for instance, is an icon in this field of research, with his pioneer work on vibrations of plates and the famous Chladni figures they are associated with. But interestingly, not much was carried out to understand sound propagation in the vocal tract. Willis was one of the first to consider this question ([12]). 2.1/ Emergence of the notion of formant In 1830, Willis proposed that the vocal tract could be modelled as an acoustical tube with a natural frequency, directly given by its length. It led him to arrange the vowels as a function of their corresponding tube length in a /i e a o u/ sequence ([12], cited in [13: 46]). Then, Wheatstone, in 1837, detailed how the acoustic resonator modifies the spectral properties of the sound emitted by a vibrator: « when an air resonator is approached by a vibrator, the sound of the latter is considerably reinforced if the natural frequency of the resonator coincides with the frequency of one of the harmonics of the vibrator » (13: 47). Helmholtz, in 1863, systematized the idea that harmonics of the glottis source are reinforced by the vocal tract resonances and he assigned to each vowel one or two particular frequencies that characterize them: the vocables ([14]). These vocables corresponded, according to him, to the natural frequencies of the mouth cavities. In his approach, the back vowels /u/, /o/, /a/ were characterized by one vocable only (indeed, for these vowels the first two formants are too close to be separated by Helmholtz’s measurement apparatuses). The front vowels /i/, /œ/, /e/, /æ/, at the contrary, were characterized by two vocables. Interestingly, Hermann was the first to propose the term of formant to describe the resonance frequencies of the vocal tract in 1894 ([15]). But he failed to accurately compute formant values, due to his misunderstanding of the relationship between the harmonics produced by

4
the glottal source and the resonance frequencies of the vocal tract. This issue has been solved lately when the acoustic measurements were able of discriminating all the speech signal frequencies and not only the reinforced harmonics as in Hermann’s time. For instance, the development of electrical synthesis devices capable of reproducing vowel sounds has been of great help for better understanding their structural properties. In this domain, the first full electrical synthesis device was proposed by Stewart in 1922 ([16]). His synthesizer had a buzzer for the excitation and two resonant circuits to model the acoustic resonances of the vocal tract (see fig. 3). The apparatus was only able to generate single static vowel sounds with their two lowest formants. With a similar, albeit upgraded four resonant circuits apparatus, Obata & Teshima discovered the third formant in vowels in 1932 ([17]).
Figure 3. Stewart's electrical analogue of the vocal tract with two resonant circuits corresponding to the two formants (from [16]). With the definition of the first three formants, the vowels could be acoustically classified in a convenient way, due to the matching between the perceptive distance in the auditory domain and the spectral distance in the F1-F2-F3 space. The main concern, in the late 19th and early 20th century was to develop experimental devices, capable of precisely measuring the formant values. 2.2/ Emergence of the links between formant and articulatory measurements Helmholtz was the first to propose reliable measurements of the reinforced harmonics in an acoustical tract ([14]). In France, Kœnig developed his “Analyseur à flammes manometriques” (manometric flames analyser) based on a bench of Helmholtz resonators connected with manometric valves, allowing for the visualization of the air vibrations by use of visible “dancing flames” (see fig. 4). By this means, he was able to grossly describe the spectral content musical instrument sounds, as well as sung French vowels ([18: 61], cited in [19]).

5
Figure 4. Kœnig’s manometric flames analyser (left) and graphical inscription of the French vowels (/u/, /o/, /a/, /e/, /i/) “dancing flames” (right). In 1926, Stumpf found the vowel resonances given by Helmholtz with oscillographic measurements ([20]). Independently, Crandall & Sacia ([21]) followed by Paget ([22]) used a photo-mechanic device to compute the vowel spectra and succeeded in measuring the first two formants of each vowel (except for /a/). Essner ([23]) analytically computed the vocal tract resonances and presented once again (more than a century after Hellwag), the vowels in the F1-F2 space. However, he did not explicitly link the acoustical and the articulatory representations. Joos ([24]) and Delattre ([25]) are the ones who bound together, for the first time in 1948, these two representations into a common framework as they associated the IPA articulatory quadrangle with the acoustic F1-F2 space. As Joos remarked: “the correlation between articulation and vowel color is […] astonishly simple. Although the vowel samples have here been placed on the chart strictly according to acoustical measurements (made from a phonograph record!) the diagram is practically identical with the ‘tongue position chart” (24: 53). In Delattre’s paper, the horizontal axis corresponds to F2 value and it is explicitely associated with the front-back position of the tongue and with the labialisation. The vertical axis corresponds to the F1 value, associated with the aperture of the vocal tract (See fig. 5). For these two cases, it has to be noted that the emergence of spectrographic measurements, allowing for direct measurements of formant was of crucial importance.
Figure 5. Vocalic triangle of the french vowels with F1 and F2 values measured from spectrograms (from [25]).

6
3/ The modern era: towards a better comprehension of the relationship between articulatory and acoustical representations 3.1/ The development of articulatory synthesis As previously mentioned, Stewart proposed in 1922 the very first electrical device allowing synthesizing vowels ([16]). In his apparatus, the electrical analogue of the vocal source was a simple buzzer and the vocal tract is modelled by two resonant circuits in parallel, each of them being tuned independently to correspond to the first two formants (see fig. 3). The main issue pointed by the author was not the construction of the device itself but « the manipulation of the apparatus to imitate the manifold variations in tone which are so important in securing naturalness » ([16]). Indeed, there was no real articulatory model in this very first apparatus, just an ad hoc control of the electrical characteristics allowing to produce « realistic » sounds to the most possible extent, while exploring the acoustic space. Chiba & Kajiyama ([13: §10]) elaborated the first articulatory model from the area function of the vocal tract. Moreover, they synthesized vowel sounds using replicas of the vocal tract and a larynx-tone emitter, and they compared the spectra of synthetic and natural vowels. Given this articulatory model, they considered the problem of affiliation, i.e. the identification of the articulatory configuration yielding a given formant value for vowels. In this period, the development of transmission line theory that model the vocal tract as a succession of elementary electrical cells, that match the acoustical properties of the elementary acoustical tube, made rapid progress and “provided an opportunity to reproduce and to control the many articulatory positions and movements that occur in speech” ([26: 741]). Dunn ([27]) proposed in 1950, a 4-tubes analogue of the vocal tract that allowed him computing analytically the first three acoustical formants (fig. 6). He demonstrated then his electrical vocal tract (EVT) composed of 25 cells, each representing a cylinder 0.5 cm long and 6 cm3 in cross section plus a variable inductance that can be inserted at any position between 2 sections of the line, representing the “tongue hump constriction”. Only, the tongue hump characteristics could be controlled in this EVT, by means of 3 parameters: Constriction Place (“position of the tongue hump”), Constriction Area (“magnitude of the tongue hump”) and Lip Area (“magnitude of the lip constriction”). Indeed, the limitations of such a device were important as pointed by the author himself: ”the whole series of English vowels can be produced by this apparatus – not perfectly, but distinctly better than we were able to make with three independent tuned circuits without additional suppression between and above the resonances“ ([27: 751]). Stevens et al. added: “ Only a limited number of positions of the vocal tract can be simulated accurately by this small number of controls” and “the approximation of two cylinders of uniform cross-sectional area with lumped tongue and lip constriction is likely to be an error in considerable margin” ([26:734-735]).
a)
b) c)
7
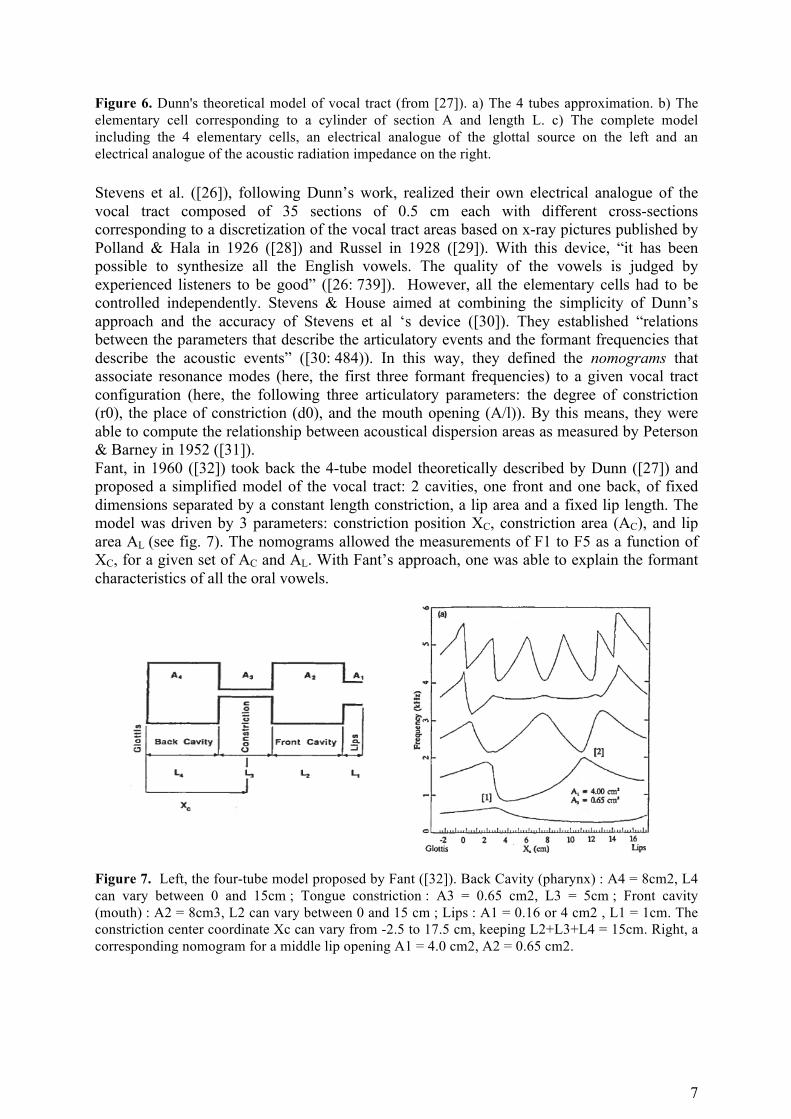
Figure 6. Dunn's theoretical model of vocal tract (from [27]). a) The 4 tubes approximation. b) The elementary cell corresponding to a cylinder of section A and length L. c) The complete model including the 4 elementary cells, an electrical analogue of the glottal source on the left and an electrical analogue of the acoustic radiation impedance on the right. Stevens et al. ([26]), following Dunn’s work, realized their own electrical analogue of the vocal tract composed of 35 sections of 0.5 cm each with different cross-sections corresponding to a discretization of the vocal tract areas based on x-ray pictures published by Polland & Hala in 1926 ([28]) and Russel in 1928 ([29]). With this device, “it has been possible to synthesize all the English vowels. The quality of the vowels is judged by experienced listeners to be good” ([26: 739]). However, all the elementary cells had to be controlled independently. Stevens & House aimed at combining the simplicity of Dunn’s approach and the accuracy of Stevens et al ‘s device ([30]). They established “relations between the parameters that describe the articulatory events and the formant frequencies that describe the acoustic events” ([30: 484)). In this way, they defined the nomograms that associate resonance modes (here, the first three formant frequencies) to a given vocal tract configuration (here, the following three articulatory parameters: the degree of constriction (r0), the place of constriction (d0), and the mouth opening (A/l)). By this means, they were able to compute the relationship between acoustical dispersion areas as measured by Peterson & Barney in 1952 ([31]). Fant, in 1960 ([32]) took back the 4-tube model theoretically described by Dunn ([27]) and proposed a simplified model of the vocal tract: 2 cavities, one front and one back, of fixed dimensions separated by a constant length constriction, a lip area and a fixed lip length. The model was driven by 3 parameters: constriction position XC, constriction area (AC), and lip area AL (see fig. 7). The nomograms allowed the measurements of F1 to F5 as a function of XC, for a given set of AC and AL. With Fant’s approach, one was able to explain the formant characteristics of all the oral vowels.
Figure 7. Left, the four-tube model proposed by Fant ([32]). Back Cavity (pharynx) : A4 = 8cm2, L4 can vary between 0 and 15cm ; Tongue constriction : A3 = 0.65 cm2, L3 = 5cm ; Front cavity (mouth) : A2 = 8cm3, L2 can vary between 0 and 15 cm ; Lips : A1 = 0.16 or 4 cm2 , L1 = 1cm. The constriction center coordinate Xc can vary from -2.5 to 17.5 cm, keeping L2+L3+L4 = 15cm. Right, a corresponding nomogram for a middle lip opening A1 = 4.0 cm2, A2 = 0.65 cm2.

8
Using Fant’s nomograms, Gunnilstam ([33]) in 1974, followed by Badin et al. in 1988 ([34]) detailed a method to affiliate formants to the vocal tract cavities. Finally, with the matching between articulatory and acoustic parameters, the phonetic description of the languages of the world was then greatly facilitated.
3.2/ The vowel system categorization and the maximal vowel space Beyond an apparent diversity, the phonological typologies of the vowel systems have been shown for a long time to exhibit strong regularities (see [35]): /i a u/ for 3-vowel systems, /i e o a u/ for 5-vowel systems or /i e ɛ o ɔ a u/ for 7-vowel system for instance. In studies on large corpora, such as the UPSID database ([36]), allowed extracting universal tendencies in the vowel systems (see [37] for 209 languages, or [38] for the 417 languages described in UPSID). As stated by Liljencrants & Lindblom, it appeared there that “only a subset of all logically possible combinations of those formant frequencies is associated with formant vowels” ([41: 839]). The question of how the vowel systems are defined, on which bases, articulatory or auditory, was thus a question of importance in the late 20th century. To answer this question, the principle of distinctiveness has long been claimed to be the correct criterion for vowel systems organization as it makes them easy to produce and to perceive. The formalisation of this principle in the perceptual domain has been carried out in the dispersion theory (DT), proposed by Liljencrants & Lindblom ([39]). The DT was the first quantitative simulation of vowel inventories. It was based on the maximization of the perceptual distances in the (M1, M2, M3) space, where Mi is the ith formant expressed in the Mel scale, to account for perceptual representations. The boundaries of the frequency domain in which the dispersion can occur, the maximal vowel space (MVS) is set empirically by computing from the phonological databases. By minimizing the criterion , where r is the distance between the ith pair of vowels and N is the number of pairs in the considered system, the DT proposes an organization of the vocalic systems of variable size ranging from 3 to 12. Schwartz et al. ([40]) further developed the seminal proposal of Liljencrants & Lindblom ([39]) and propose a second criterion to define the dispersion of the vocalic systems. Their dispersion-focalization theory (DFT) attempted to predict vowel systems based on the minimization of an energy function summing two perceptual components: global dispersion, which is based on inter-vowel distances (as in the DT); and local focalization, which is based on intra-vowel spectral salience related to the proximity of formants. It has to be noted that none of these theory account for any “articulatory cost” that could also determine the vowel dispersions. They were, indeed, purely auditory. To go deeper into the vocalic system modelling, the question of the MVS was of importance too. Liljencrants & Lindblom ([39]) chose an empirical definition of the MVS from typological studies, but other researchers tried to compute it with acoustical simulations of vocal tract systems. A first attempt, in this latter direction, was proposed by Bonder ([41], [42]) who described an analytical method to compute the MVS for a 4-tubes-of-equal-length model. With this model, he proposed to solve the inverse problem, i.e. to get the vocal tract shape from the formant values, by using the minimal articulatory difference (MAD) method ([43]). He computed the relationship between the (F1, F2) values and the geometrical shapes of the vocal tracts within the MVS (see fig. 8).

9
-17-_ .... 11. AQplication of the minimum criterion to the vowel triangle
Onde we have scaled avowel triangle by means of the normalization transformation (20) we can apply the MAD model- expressed as the minimum criterion (19)- to this normalized vowel triangle. In order to preserve tbe character öfthe application, we will not focus our attention to a specific language. Our aim is to show how -in the case of voiced vowelilke sounds- gradual changes in global articulation induce gradual changes in formant frequencies. To this end we cover the formant spa ce of Fl,F2 by a hexagonal grid of points (Fl,F,). The choice of hexagonal grid is not arestriction to the generality of the application; the main reason for this choice is that a point in the plane has a maximum number of neighbours at the same distance, namely six. As we have said, we wil 1 are not referring to a specific language. This implies that we have to cover the Fl,F2 plane in such a way that we will include the vowel triangles of all languages. This leads to an area in the formant space as shown in Fig. 12. It should be emphasized that the area in the Fl,F2 plane is obtained by means of the normillization transformation (20), so each vowel triangle area -to bellmöre précise: an enclosing area of the part ic-ular system- can be reconstructed by means of the inverse of trans-formation (20) using the aotual values of the vocal tract length. Pointwise application of the minimum criterion (191 to the points of the hexagonal grid in the Fl,F, plane inside the normalized vowel triangle yield the 4-tube snapes which are shown in Fig. 12a. Each 4-tube shape has been computed from the formant frequencies Fl,F2 by means of the (13), the overall length t bêing 17.5 cm, and the velocity of sound c 35000cm/sec. All 4-tubes in Fig. 12 are located in such a way glottis side of the vocal tract at the left side of the tube. Besides, the'ctoss-seetJrnal areas of the tubes have been scaled such that the areas at the glottis are equal for all tubes. The right part of Fig. 12 shows the location of the éomputed 4-tube shapes in the 3-dimensional articulation space. All these sbapes- represented by points- are situated in the plahe k l k3 , as has been demonstrated in paragrapb 8 •
2.11
269
326
384
442
500
557
615
673
730
183
700
c:JoooC:Iw
o=C=
...... .... . .......... _-
800 1600
oe- c:==- D==- c::::- e::::::=- c:::>-C=:=.l- e:=- e=- r::::::== c::8=
C=C= 0=0= c::;:::::,: C==o c::.::=:= C=C= c::== C::::::::: c=:: r::::==:. ..
e=C= c:::::::::= c= c:::::::= e:::::: c:c: c::;:C:: t:::!::: c:::= c:::.::::::
c:C: c:C= r.:::c:: .'. F c:::::: cC. c:e: c::::::
c:=C c:;:: . c:::::: . cC
: .•. '. 'r.:::c:. 846 <1,.
'1 (lIa) .. _.,-_'_' L.o':;...". _-: . .....L._-L._-L._-L._-'-_......J
F'rg (1. &. .. ca)
Figure 8. The solution of the inverse problem by means of the MAD model. Each tube has an overall length of 17.5 cm. The glottis is situated at the left side of the tubes (from [43]).
Finally, following Bonder and benefiting from the exponential growth of computer capacities, Boë et al. ([44]) proposed a stochastic approach to characterize the MVS with a n-tube model, with each tube having random dimensions, provided a constant global length. This geometrical/acoustic modelling of all the possible acoustical outputs as a function of the number of tubes allowed showing that, as long as n>3, all the MVS have a triangular shape in the F1-F2 plane. However, in the F2-F3 plane, the modelled MVS was much bigger than the one observed with real articulatory models of the vocal tract. So, whereas it is not the case in the F1-F2 plane, the articulatory constraints are of importance for defining F3. To define a somewhat realistic acoustic representation in the F1-F2-F3 plane, a numerical simulation based on an anthropological model is needed. Using the Maeda model ([45]), Boë et al. ([44]) succeeded in obtaining a realistic “horse-shoe” shaped MVS with accurate formant relationship for its boundaries (see fig. 9).
Figure 9. The F1–F2–F3 Maximal Vowel Space defined with an anthropological model. The four corner-point vowels in this space are [i y a u] (from [46]).

10
Conclusion In this paper, we looked at the evolution of the vowels representations across history. If nowadays, the vocalic space is of common use, and easily taught as the common representation of articulatory and acoustic properties of vowels, its development had been far from trivial. From a historical standpoint, starting at the 17th century, we followed the building of the vocalic space, based on both the auditory and the articulatory dimensions. The major milestones in this evolution have been recalled, from the pioneers with their sole auditory and articulatory “impressions” as methods of investigation, to the very recent works benefiting from devices able to precisely measure acoustical and articulatory configurations of the vocal tract during vowel productions. We discussed how the acoustic measurements slowly emerged across history and how both acoustic and articulatory representations were unified in the mid 20th century. Given this unified view, some important questions on vowel systems organization arose. On this very topic, we focused on the two following: (1) how the auditory constraints shape the positioning of a specific set of vowel within the acoustic space, and (2) how the articulatory constraints shape the maximal vowel space. From the pioneer article of Liljencrants & Lindblom ([39]) to recent work including one of us ([44]), we showed that this question is still a matter of debate, and a major field of research in the current speech studies. References [1] Pfitzinger H. & Niebuhr O. (2011) Historical development of phonetic vowel systems
- The last 400 years. Proceedings of the 17th ICPhS, Hong Kong, China,160-163. [2] Hellwag C.F. (1781). Dissertatio de Formatione Loquelae. Heilbronn 1886 (French
translation by Monin M.-P. available in Bulletin de la Communication Parlée, 1991). [3] Nearey T. M. (1977). Phonetic Feature Systems for Vowels. Indiana University
Linguistics Club, 1978 [4] Chladni E. F. F. (1809). Traité d’acoustique. Courcier, Paris.
[5] Bell A.M. (1867). Visible Speech: The Science of Universal Alphabetics. Londres, Simkin, Marshall & CO.
[6] Sweet H. (1877). A Handbook of Phonetics. Clarendon Press, Oxford. [7] Catford J.C. (1981). Observations of the recent history of vowel classification. In
Asher, Henderson (eds.). Towards a history of phonetics. Edinburgh: The University Press, 19-32.
[8] Passy P. (1888). Our revised alphabet. The Phonetic Teacher, 7–8: 57–60 [9] Passy P. (1890). Étude sur les changements phonétiques et leurs caractères généraux,
Paris, Librairie Firmin-Didot, 1890 [10] Jones D. (1917). An English Pronouncing Dictionary. London: Dent.
[11] Jones D. (1917). Speech Sounds — Cardinal Vowels (Short and Long). England, Hayes, Middlesex: The Gramophone.
[12] Willis, R. (1830). On vowel sounds, and on reed organ pipes. Transactions of the Cambridge philosophical Society, III, 231-276.
[13] Chiba T. & Kajiyama M. (1941). The vowel, its nature and structure. Tokyo-Kaiseikan Publishing Company. Ltd, Tokyo.

11
[14] Helmholtz H. (1863). Die Lehre von den Tonempfindungen als physiologische Grundlage für die Theorie der Musik. Braunschweig, Vieweg.
[15] Obata J. & Teshima T. (1932). On the properties of Japanese vowels, Jap. J. Physics, Vol. 8.
[16] Hermann L. (1894). Beiträge zur Lehre von der Klangwahrnehmung. Pflügers Arch. 56, 467-499
[17] Stewart J. Q. (1922). An electrical analog of the vocal organs. Nature, 110, 311-312.
[18] Kœnig R. (1882). Quelques expériences d’acoustique, Imprimerie Lahure. Paris. [19] Vilain C., Arnal A., Boë L.-J. (2011). L'analyseur de Koenig : un premier
spectromètre pour l'étude de la parole, In Boë LJ & Vilain C. (Ed.) Un siècle de phonétique expérimentale : fondation et éléments de développement, ENS Editions.
[20] Stumpf C. (1926). Die Sprachlaute: Experimentell-phonetische Untersuchungen nebst einem Anhang über Instrumental-Klänge, Springer, Berlin.
[21] Crandall I.B. & Sacia C.F. (1924). A dynamical study of the vowel sounds. Bell system technical journal, 3(2).
[22] Paget R. (1930). Human Speech: Some Observations, Experiments, and Conclusions as to the Nature, Origin, Purpose and Possible Improvement of Human Speech, International Library of Psychology, Routledge and Kegan Paul.
[23] Essner C. (1947). Recherche sur la structure des voyelles orales. Archives néerlandaises de phonétique expérimentale, 20, 40-77.
[24] Joos M. (1948). Acoustic phonetics. Supplement to Language, 24(2), the linguistic society of America, Baltimore.
[25] Delattre P. (1948). Un Triangle Acoustique des Voyelles Orales du Français. The French Review, 21(6), 477-484.
[26] Stevens K.N., Kasowski S., Fant C. G. M. (1953). An electrical analog of the vocal tract. Journal of the Acoustical Society of America, 25 (4): 734–42.
[27] Dunn H. K. (1950). The calculation of vowel resonances, and an electrical vocal tract. Journal of the Acoustical Society of America, 22, 740-753.
[28] Polland P. & Hala B. (1926). Les radiographies de l’articulation des sons tchèques. (Artikulace českých zvuků v roentgenových obrazech), Praha.
[29] Russell G. O. (1928). The vowel, its psychological mechanism, as shown by x-ray. Columbus, OH: Ohio State University Press.
[30] Stevens K. N., & House A. S. (1955). Development of a quantitative description of vowel articulation. Journal of the Acoustical Society of America, 27, 401-493.
[31] Peterson G.E. & Barney H.L. (1952). Control Methods Used in a Study of the Vowels. Journal of the Acoustical Society of America, 24, 175–184.
[32] Fant G. (1960). Acoustic theory of speech production. Mouton, The Hague.
[33] Gunnilstam O. (1974). The theory of local linearity. Journal of Phonetics 2, 91–108. [34] Badin P., Boë L.J., Perrier P., Abry C. (1988). Vocalic nomograms: Acoustic
considerations upon formant convergence. Bulletin de la Communication Parlée, 2, 65-94.

12
[35] Troubetzkoy N. S., (1939), « Grundzüge des Phonologie », Travaux du Cercle Linguistique de Prague, Vol. 7, traduit en français par Cantineau J. en 1970, Principes de phonologie. Klincksieck, Paris.
[36] Maddieson, I. 1984. Patterns of Sounds. Cambridge University Press, Cambridge. Paperback reprint 2009.
[37] Crothers J. (1978). Typology and universals in vowel systems. In Universals of human language, (J. H. Greenberg, C. A. Ferguson & E. A. Moravcsik, editors) pp. 93–152. Stanford: Stanford University Press.
[38] Schwartz J.-L., Boe L.-J., Vallée N., and Abry C. (1997). Major trends in vowel system inventories. Journal of Phonetics 25, 233–253
[39] Liljencrants J. & Lindblom B. (1972). Numerical simulations of vowel quality systems: The role of perceptual contrast. Language, 48:839–862.
[40] Schwartz J.-L., Boe L.-J., Vallée N., and Abry C. (1997). The dispersion-focalization theory of vowel systems. Journal of Phonetics, 25:255–286.
[41] Bonder, L. J. (1983). The n-tube formula and some of its consequences. Acustica, vol. 52, no. 4, March, pp. 216–226.
[42] Bonder, L. J. (1983). Equivalency of lossless n-tubes. Acustica, vol. 53, no. 4, August, pp. 193–200.
[43] Bonder L.J. (1987). From formant space to articulation space by means of the mad model (personal communication)
[44] Boë L.J., Badin P., Ménard L., Captier G., Davis B., MacNeilage P., Sawallis T.R., Schwartz J.L. (2013). Anatomy and control of the developing human vocal tract: A response to Lieberman, Journal of Phonetics, 41 (5), September 2013, 379-392.
[45] Maeda S. (1979). An articulatory model of the tongue based on a statistical analysis. J. Acoust. Soc. Am. 65, S22.
[46] Schwartz J.L., Boë L.J., and Abry C. (2007). Linking the Dispersion-‹Focalization Theory (DFT) and the Maximum Utilization of the Available Distinctive Features (MUAF) principle in a Perception-for-Action-Control Theory (PACT). M.J. Solé, P.S. Beddor, M. Ohala. Experimental Approaches to Phonology, Oxford University Press, pp.104-124.