Embed Size (px)
Citation preview

-93-
8. MINITAB COMMANDS WEEK-BY-WEEK
In this section of the Study Guide, we give brief information about the Minitab commands
that are needed to apply the statistical methods in each week’s study. They arenumbered by weeks in the same way as the Study Schedule in Chapter 2.
Minitab instructions
We have not attempted to write a full manual about using Minitab to analyse your data –
we would need to write a second Study Guide for that! However Minitab has so manydifferent commands in its menus (and sub-menus) and each has so many options thatsome guidance is necessary to point you in the right direction each week.
Instead of writing full notes about the commands for each graphical display and
statistical analysis in the course, we have therefore only specified the name of thecommand (and the menu and sub-menu where it can be found) and a list of the optionsfrom the command’s dialog box that are relevant to this course. (The dialog boxes oftenhave many other options but, if they are not mentioned here, you are strongly advised to
leave them alone!)
This guide is not intended for reading on its own. Only use it when you have Minitabrunning and have opened some worksheet containing variables of the type that are beinganalysed that week. (Minitab comes with many data sets that can be used or you cantype in your own data.) Try out the command that is described, and investigate the
various options that we mention. This experimental approach is the best way to learn.
We believe that you should be able to pick up enough from this guide (and a bit ofcommon sense) to use Minitab perform all the analyses in this course. However if youfind difficulty with any command, Minitab’s help system provides a more wordy and
extensive description. Remember that you can’t hurt Minitab (or your data files ifyou don’t save changes) by experimenting with its commands and options.

-94-
Shorthand
For most statistical methods, we therefore simply specify the menu command, followedby a list of the options that you will need to specify or alter in the resulting dialog box.
Occasionally we make a brief comment about the options, but they are usually self-explanatory. (See Minitab’s help if you do not agree!)
We use a shorthand to describe the commands and dialog box options. In each case, weassume that you already have the data that you want to analyse in one or more columns
of a Minitab worksheet. Select the relevant command from a Minitab menu (or, moreoften, a sub-menu or sub-sub-menu) and specify the details of the analysis in a dialogbox using check boxes, radio buttons or pop-up menus to select options, typing values orvariable names in text-edit boxes and clicking buttons.
Select a command from a sub-sub-menu Menu Sub-menu Sub-menu
Select an option in a dialog box using a radiobutton
Option
Type a value or variable name in a text editbox. You can often double-click variablenames on a list elsewhere in the dialog boxinstead of typing their names.
Type something :
Click a button to display further options.
Turn on an option using a check box Option
Select an option from a list in a pop-up menu. Pop-up menu :
The instructions in the study guide are those for Minitab version 14.

-95-
Week 1
Introduction
Install Minitab on your computer (or make sure that you have access to it). Read theprevious chapter to familiarise yourself with the overall structure of Minitab.
Exploring Categorical Data: Pie charts and Bar charts
Bar charts and pie charts for a single data set can be produced from data in twodifferent formats. The first is a ‘raw data’ format in which each Minitab rowcorresponds to a single ‘individual’. For example,
Individual Hair
John Black
Mary Blonde
Nicole Black
Philip Red
The alternative format is a frequency table – a summarised form of the raw data.Many data sets are provided in this form. It has the category names in one Minitabcolumn and the frequencies in a second column:
Hair Frequency
Black 53
Blonde 23
Brunette 75
Red 17
Graph Pie Chart...
Chart raw data
Categorical variables: Name of a variablecontaining categorical values(e.g. ‘Black, ‘Blonde, ‘Red’, …)
Chart values from a table
Categorical variable: Minitab columncontaining the distinctcategory names
Summary variable: Minitab column containingthe frequenciesassociated with thesecategory names
Investigate the other options in this dialog box

-96-
Graph Bar chart...
Bars represent:
One column of values:
Graph variables: Minitab column containingthe frequencies
Categorical variable: Minitab column containingthe distinct categorynames
Bars represent:
One column of values:
Graph variables: Minitab column containingthe frequencies
Categorical variable: Minitab column containingthe distinct categorynames
-97-
Week 2
Exploring Univariate Data: Stem-and-leaf Plots
Graph Stem-and-Leaf...
Variables: specify the Minitab variable name
Exploring Univariate Data: Histograms, Transformations & Discrete Data
Graph Histogram...
Variables: specify the Minitab variable
To transform a variable (and put the result in a new variable):
Calc Calculator...
Store result in variable: name of new variable to becreated
Expression: use list of variables and list offunctions to write the expression
Minitab will not produce back-to-back stem and leaf plots or histograms.
Exploring Univariate Data: Dot Plots
For a dot plot of a single variable,
Graph Dotplot...
One Y:
Variables: Note that Minitab will not drawjittered dot plots.
For dot plots to compare two or more groups, there are two ways that the data maybe stored. If the groups are in separate Minitab columns,
Graph Dotplot...
Multiple Y’s:
Variables: Enter names for the differentcolumns (groups)
-98-
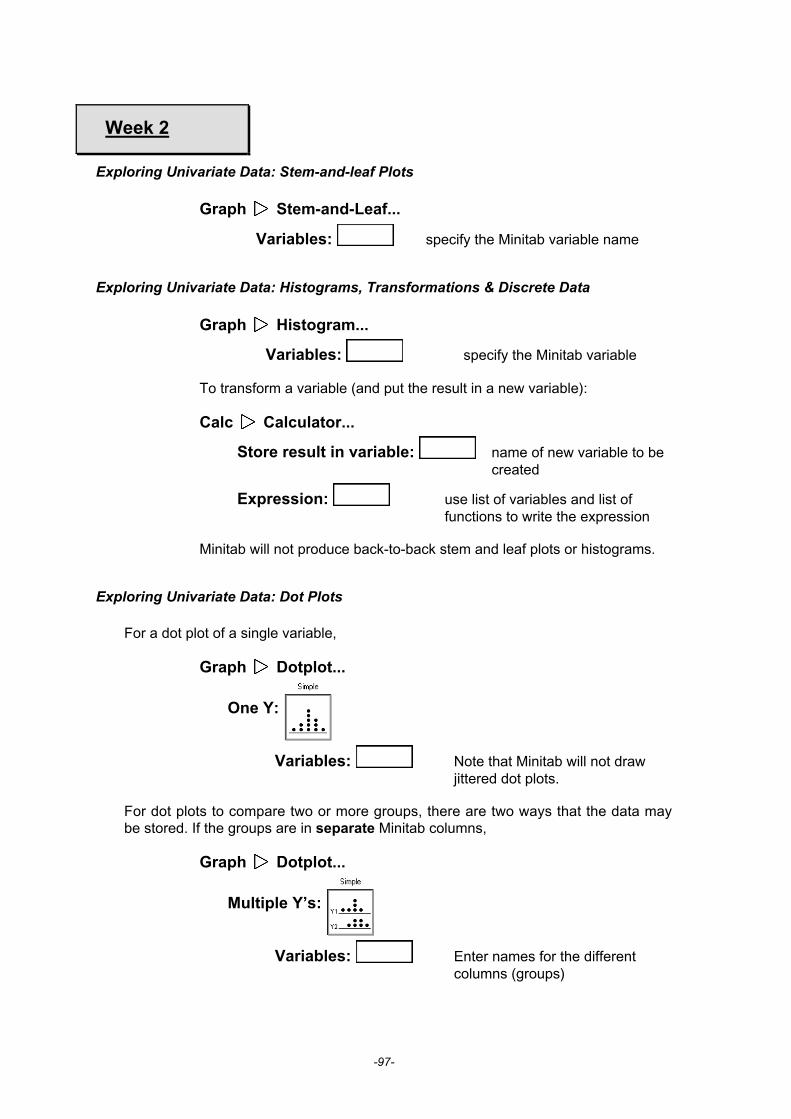
If the values are stored in a single Minitab columns and a second columndistinguishes between the groups,
Graph Dotplot...
One Y:
Variables: Enter name of single columncontaining values
By variable: The variable here should be aMinitab column that distinguishesbetween the groups (e.g. withvalues ‘male’ and ‘female’)
Exploratory Univariate Data: Box plot
A single box plot can be drawn, but we only recommend box plots for comparinggroups. As for dot plots, the method depends on whether the groups are stored asdifferent columns in Minitab.
Graph Boxplot...
Multiple Y’s:
Graph variables: Names for the differentcolumns (groups)
Or... Graph Boxplot...
One Y:
Graph variables: Single column containing values
Categorical variable: Column distinguishing groups
Exploratory Univariate Data: Quartiles and Summary Statistics
Stat Basic Statistics Display Descriptive Statistics...
Variables: enter the name of a variable
Various summary statistics for the variable are output. If there are two ormore groups in the data, use the following option in the dialog box:
By variable: enter the name of a variable thatdistinguishes between the groups (e.g. values ‘male’ and ‘female’)

-99-
Week 3
Exploring Bivariate Data: Scatterplots
Graph Scatterplot...
Option
Y variable: variable displayed on verticalaxis (response)
X variable: variable on horizontal axis(explanatory)
Exploring Bivariate Data: Least squares and Nonlinear relationshipa
Stat Regression Fitted Line Plot...
Response [Y]:
Predictors [X]:
Type of Regression Model
Linear fits a least squares straight line to the data
Quadratic fits a quadratic curve by least squares
the resulting dialog box lets you saveresiduals and fitted values as new Minitabcolumns. You can then plot the residuals.
Exploring Bivariate Data: Correlation
Stat Basic Statistics Correlation...
Variables: enter the names of 2 or moreMinitab variables
Display p-values you can’t interpret p-values yet, sodon’t ask for them!

-100-
Multivariate data
Graph Matrix Plot...
Matrix of plots:
Graph Variables: if you enter the names of 3 ormore variables, a scatterplotmatrix will be drawn
Editor Brush
If you select this option, you can then click on points in graphs (ordrag over a group of points) and they will be highlighted in allgraphs.
Editor Set ID Variables…
This lets you specify what Minitab column should be used as a‘name’ to identify the brushed points on a scatterhplot matrix –they are printed on the brushing palette.
Graph 3D Scatterplot...
Option:
Graph Variables: Z Y X
This produces a 3-dimensional scatterplot of the threevariables. (Rotation is not particularly intuitive though.)
-101-
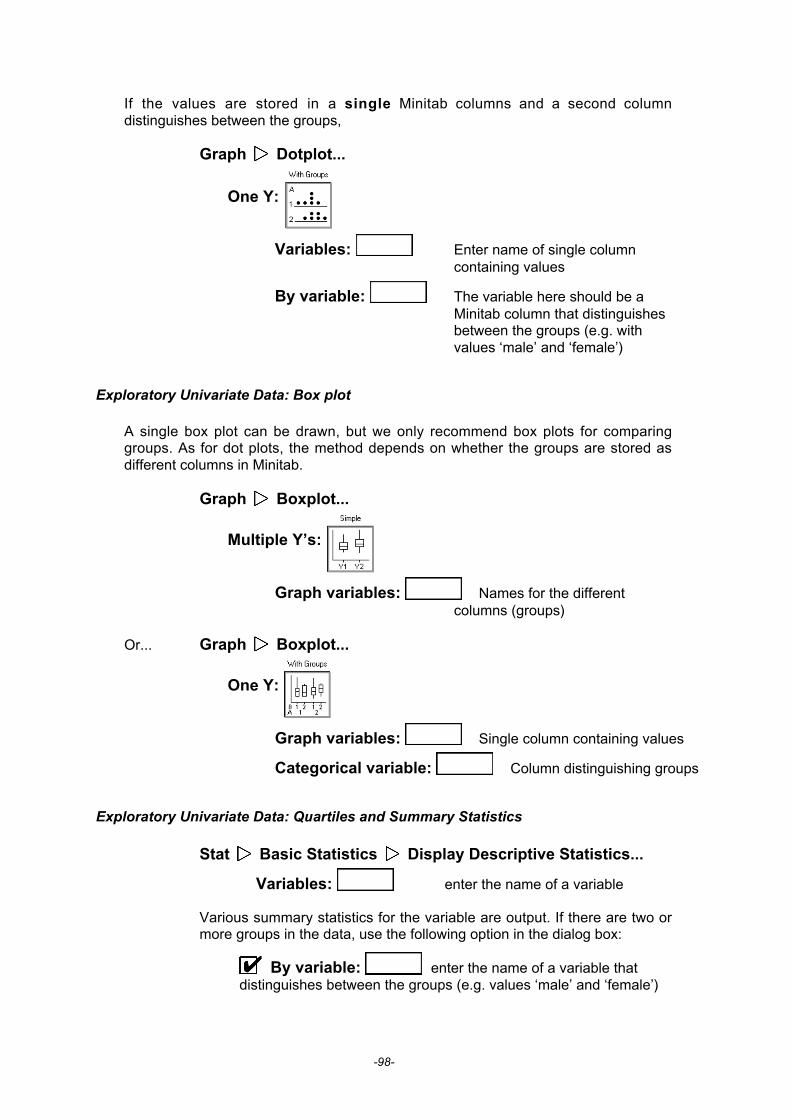
Week 4
Exploring Time Series
Graph Time Series Plot...
Option:
Graph variables: enter the name of a variable
Time Scale
Index the time axis just shows the ordernumber
or
Calendar: allows you to label the axiswith days, months, quarters,etc.
the options in the resultingdialog box let you choose theinitial date that is displayed onthe time axis (see the helpbutton in the dialog box)
-102-
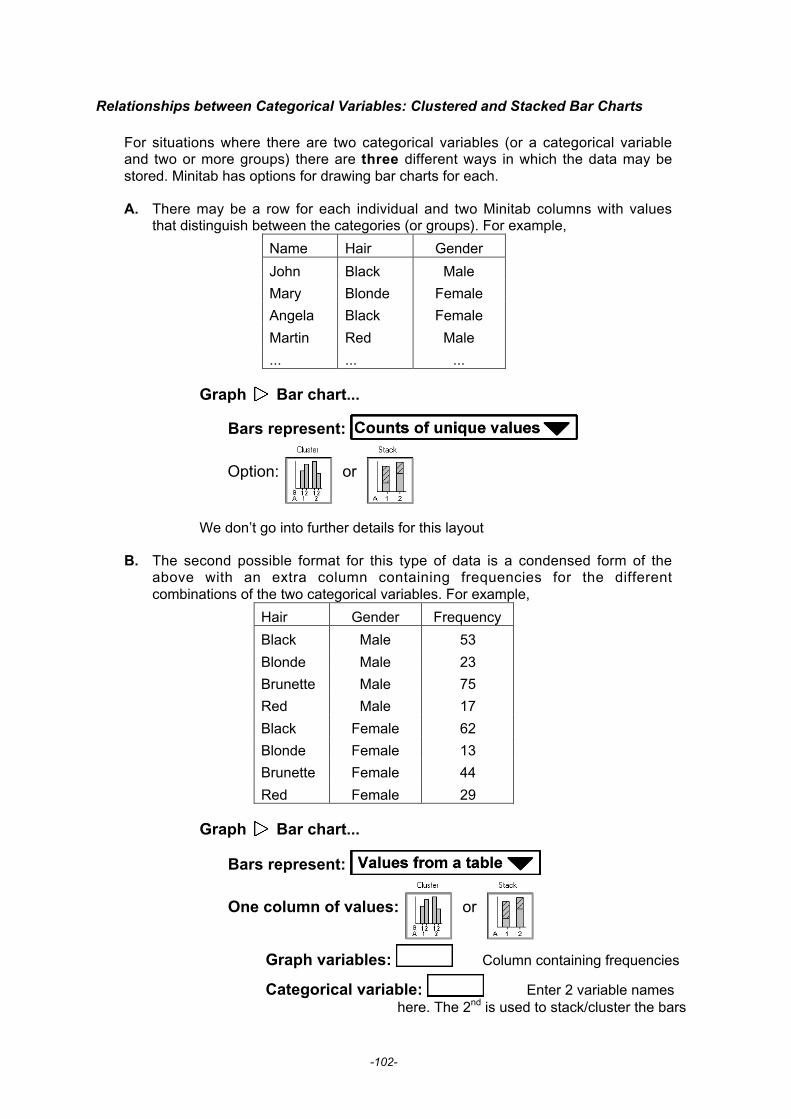
Relationships between Categorical Variables: Clustered and Stacked Bar Charts
For situations where there are two categorical variables (or a categorical variableand two or more groups) there are three different ways in which the data may bestored. Minitab has options for drawing bar charts for each.
A. There may be a row for each individual and two Minitab columns with valuesthat distinguish between the categories (or groups). For example,
Name Hair Gender
John Black Male
Mary Blonde Female
Angela Black Female
Martin Red Male
... ... ...
Graph Bar chart...
Bars represent:
Option: or
We don’t go into further details for this layout
B. The second possible format for this type of data is a condensed form of theabove with an extra column containing frequencies for the differentcombinations of the two categorical variables. For example,
Hair Gender Frequency
Black Male 53
Blonde Male 23
Brunette Male 75
Red Male 17
Black Female 62
Blonde Female 13
Brunette Female 44
Red Female 29
Graph Bar chart...
Bars represent:
One column of values: or
Graph variables: Column containing frequencies
Categorical variable: Enter 2 variable nameshere. The 2nd is used to stack/cluster the bars
-103-
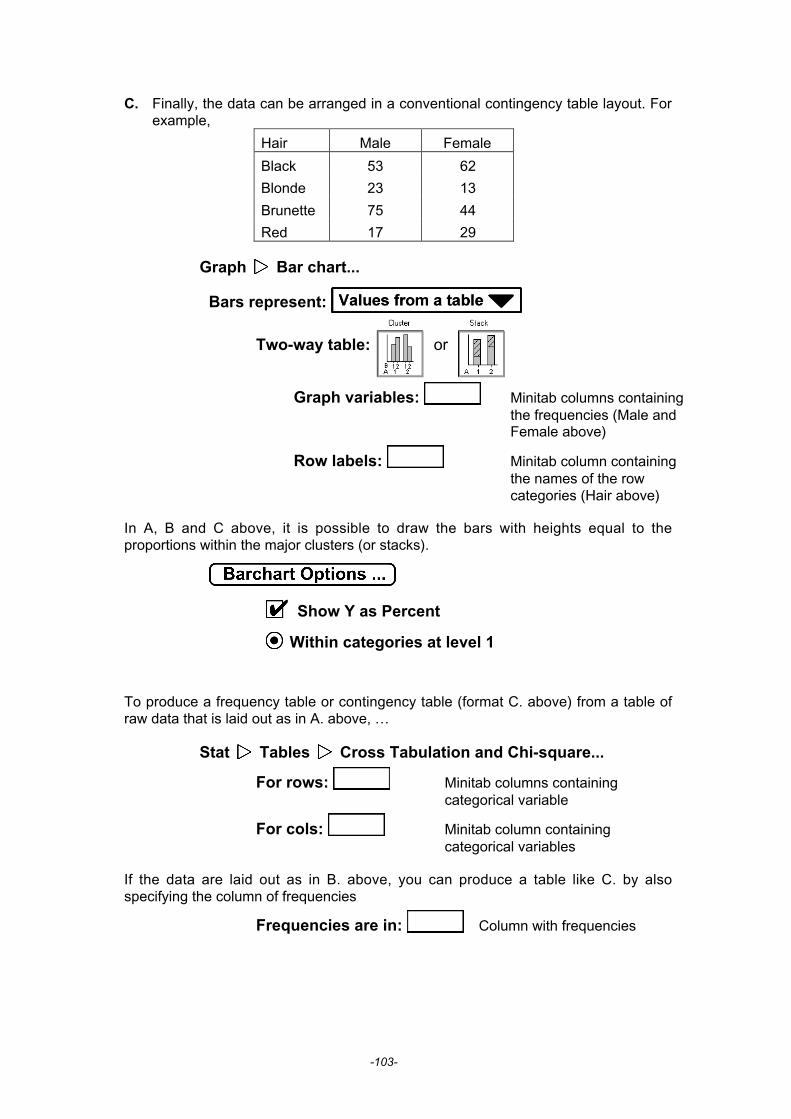
C. Finally, the data can be arranged in a conventional contingency table layout. Forexample,
Hair Male Female
Black 53 62
Blonde 23 13
Brunette 75 44
Red 17 29
Graph Bar chart...
Bars represent:
Two-way table: or
Graph variables: Minitab columns containingthe frequencies (Male andFemale above)
Row labels: Minitab column containingthe names of the rowcategories (Hair above)
In A, B and C above, it is possible to draw the bars with heights equal to theproportions within the major clusters (or stacks).
Show Y as Percent
Within categories at level 1
To produce a frequency table or contingency table (format C. above) from a table ofraw data that is laid out as in A. above, …
Stat Tables Cross Tabulation and Chi-square...
For rows: Minitab columns containingcategorical variable
For cols: Minitab column containingcategorical variables
If the data are laid out as in B. above, you can produce a table like C. by alsospecifying the column of frequencies
Frequencies are in: Column with frequencies

-104-
Data Presentation
There are no new MINITAB commands for this section of the course.
Week 5
About Relationships
Again, there are no new MINITAB commands to learn for this section
Sample Surveys and Experiments
Again, there is nothing new in MINITAB
Week 6
Probability and Random Variables
Again, there is nothing new in MINITAB
-105-
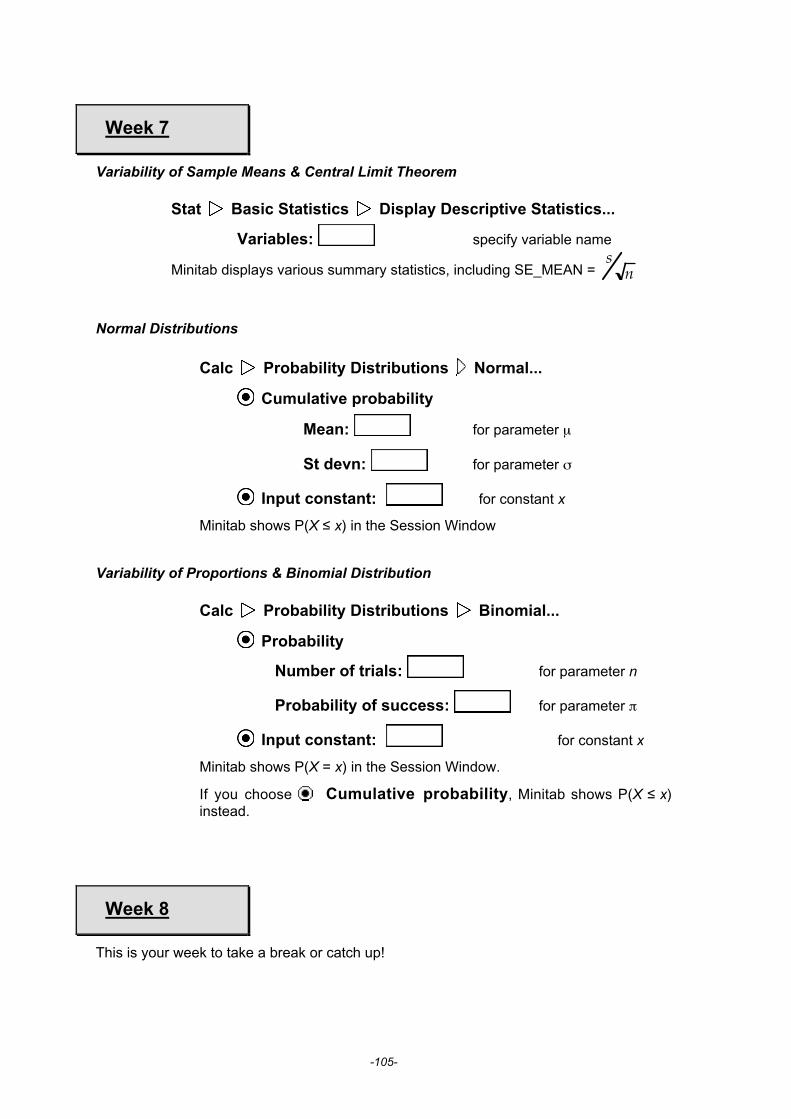
Week 7
Variability of Sample Means & Central Limit Theorem
Stat Basic Statistics Display Descriptive Statistics...
Variables: specify variable name
Minitab displays various summary statistics, including SE_MEAN = s
n
Normal Distributions
Calc Probability Distributions Normal...
Cumulative probability
Mean: for parameter µ
St devn: for parameter σ
Input constant: for constant x
Minitab shows P(X ≤ x) in the Session Window
Variability of Proportions & Binomial Distribution
Calc Probability Distributions Binomial...
Probability
Number of trials: for parameter n
Probability of success: for parameter π
Input constant: for constant x
Minitab shows P(X = x) in the Session Window.
If you choose Cumulative probability, Minitab shows P(X ≤ x)instead.
Week 8
This is your week to take a break or catch up!

-106-
Week 9
Inference: Confidence Intervals for the Mean
Stat Basic Statistics 1-Sample t...
Sample in columns: specify variable name
Minitab displays the confidence interval in the Session Window
Inference: Confidence Intervals for a Proportion
Stat Basic Statistics 1 Proportion...
Summarized Data
Number of trials: for parameter n
Number of events: for observed count, x
Use test and interval based on normal dist
Minitab displays the confidence interval in the Session Window.
It is actually better not to set the checkbox for basing the confidenceinterval on the normal distribution — the normal approximation on whichit is based is not valid for small n and Minitab can work out a confidenceinterval using a more accurate method — but the textbook and CASTonly describe confidence intervals based on the normal approximationso you will need to set the option in order to get an interval that is thesame as you would have calculated by hand.
-107-
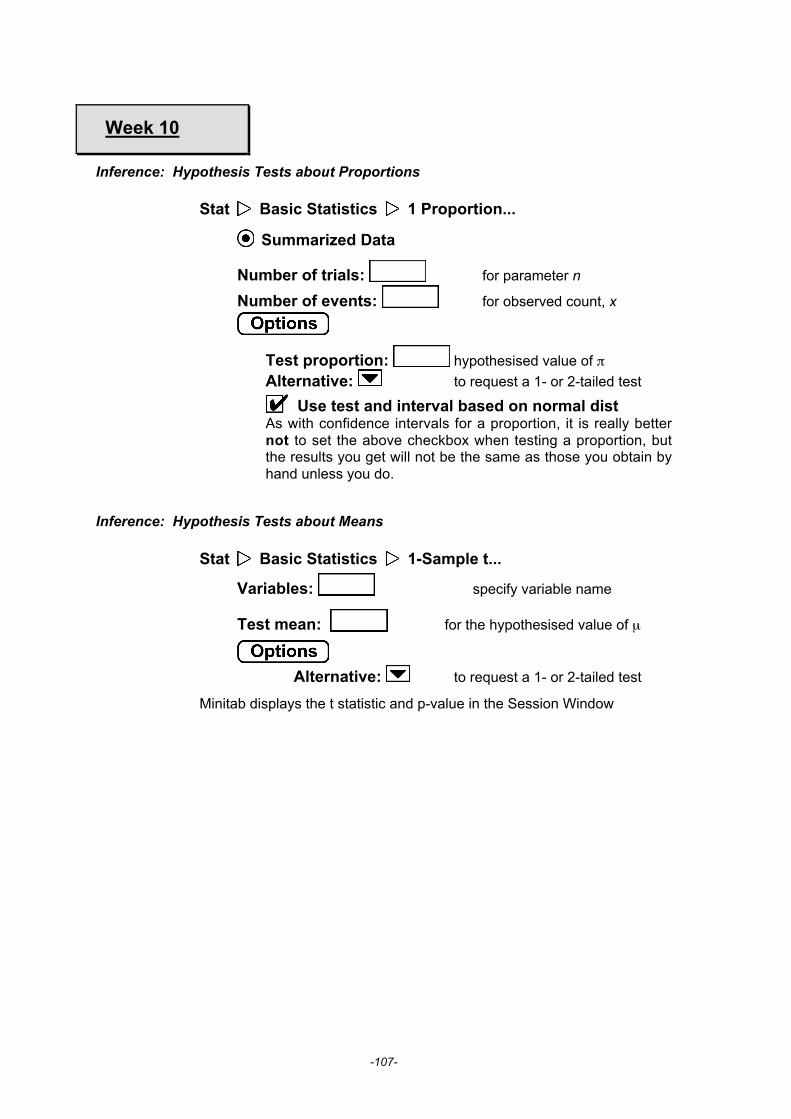
Week 10
Inference: Hypothesis Tests about Proportions
Stat Basic Statistics 1 Proportion...
Summarized Data
Number of trials: for parameter n
Number of events: for observed count, x
Test proportion: hypothesised value of π
Alternative: to request a 1- or 2-tailed test
Use test and interval based on normal distAs with confidence intervals for a proportion, it is really betternot to set the above checkbox when testing a proportion, butthe results you get will not be the same as those you obtain byhand unless you do.
Inference: Hypothesis Tests about Means
Stat Basic Statistics 1-Sample t...
Variables: specify variable name
Test mean: for the hypothesised value of µ
Alternative: to request a 1- or 2-tailed test
Minitab displays the t statistic and p-value in the Session Window

-108-
Week 11
Inference: Comparing Two Means or Proportions
To test whether the means of two groups are the same, based on twoindependent samples, you can use a single Minitab column to hold allvalues and a second column to hold either “1” or “2” to distinguishbetween the groups. To do inference on the difference between the twomeans,
Stat Basic Statistics 2-Sample t...
Samples in one column
Samples: specify variable with the data
Subscripts: specify variable distinguishingthe groups
Alternative: to request a 1- or 2-tailed test
Minitab displays a 95% confidence interval and the p-value for testingwhether the means are the same. (It is also possible to do the test withthe two samples in different Minitab columns and no column ofsubscripts with the option Samples in different columns.)
Stat Basic Statistics 2 Proportions..
Summarized dataTrials: Events:
First:
Second:
Minitab gives the p-value for testing whether the population proportions(probabilities) are the same, and a 95% confidence interval for theirdifference.
-109-
Week 12
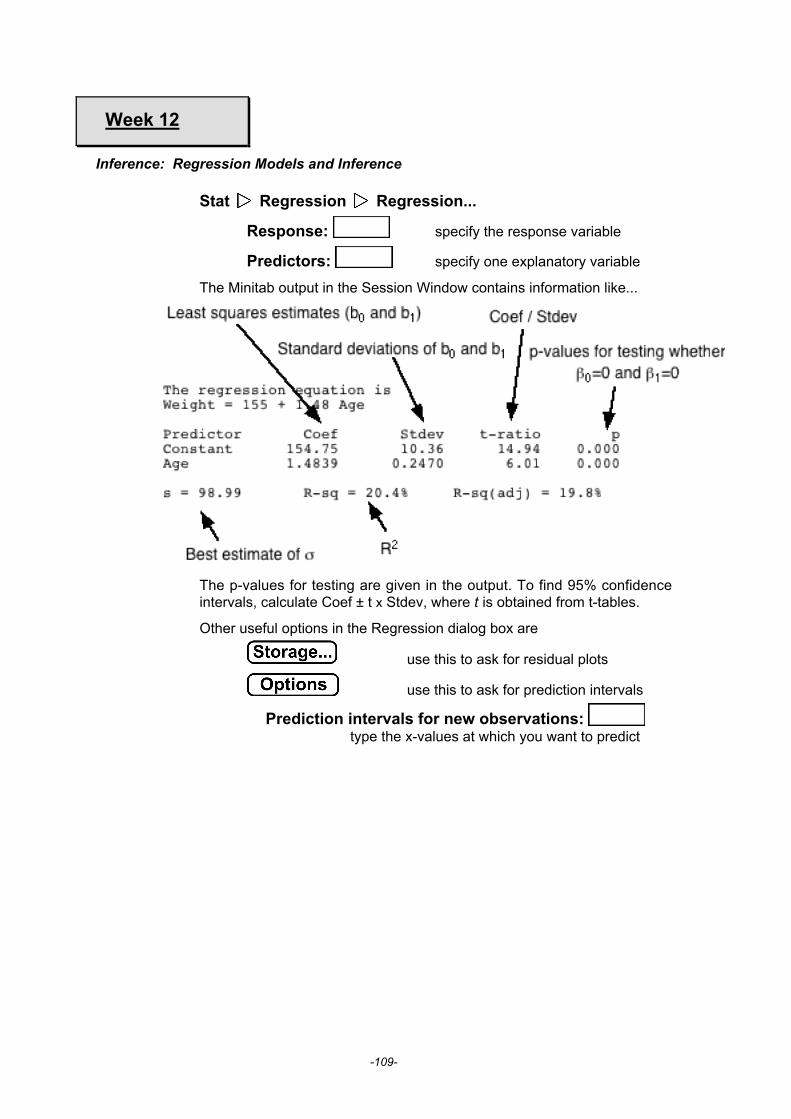
Inference: Regression Models and Inference
Stat Regression Regression...
Response: specify the response variable
Predictors: specify one explanatory variable
The Minitab output in the Session Window contains information like...
The p-values for testing are given in the output. To find 95% confidenceintervals, calculate Coef ± t x Stdev, where t is obtained from t-tables.
Other useful options in the Regression dialog box are
use this to ask for residual plots
use this to ask for prediction intervals
Prediction intervals for new observations: type the x-values at which you want to predict
-110-
Week 13
Testing Independence in Contingency Tables
To test for independence in a contingency table with r rows and ccolumns, the counts must first be entered into the first r rows of c Minitabcolumns (i.e. in format C. that was described in Week 4).
Stat Tables Chi-Square Test...
Columns containing the table: specify the names of the columns containing the counts.
The Minitab output contains the estimated cell counts (assumingindependence) and the chi-squared statistic and p-value for the test.
Comparing the Means of Several Groups
To test whether the means of several groups are the same, all values ofthe response must be stored in a single Minitab column and a secondcolumn should hold a number (1, 2, …) to distinguish between thegroups.
Stat ANOVA One-way...
Response: specify the response variable
Factor: specify variable distinguishing the groups
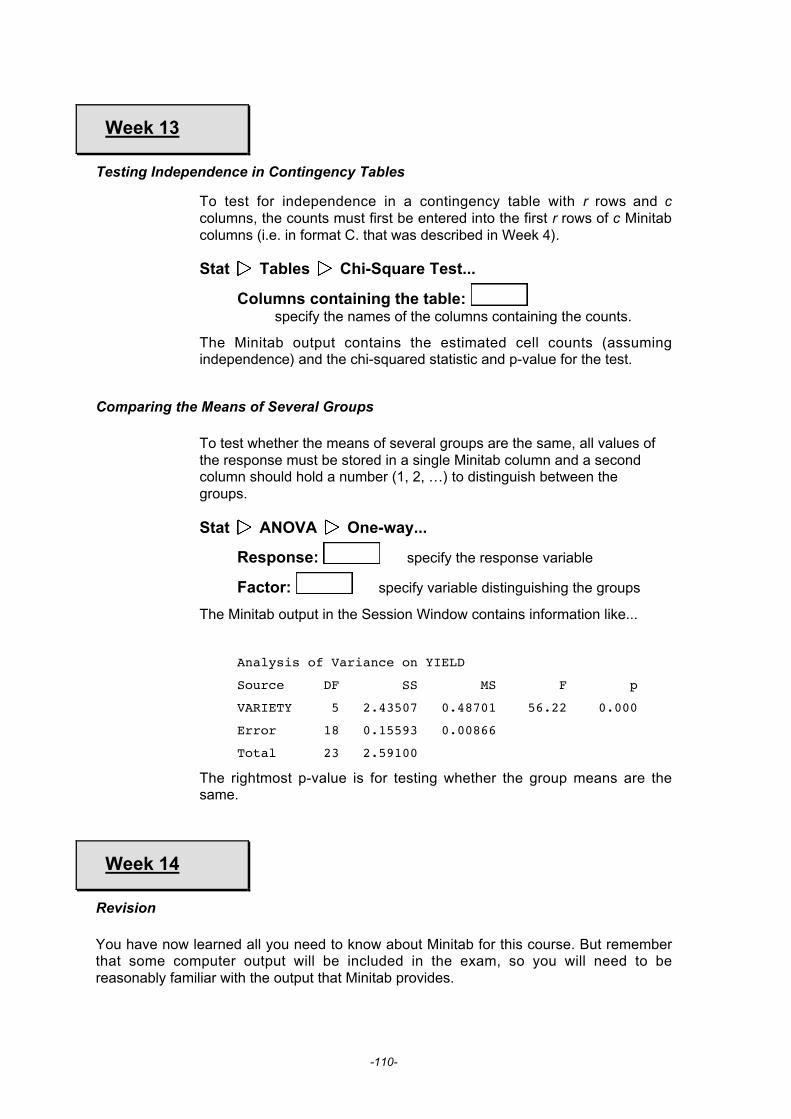
The Minitab output in the Session Window contains information like...
Analysis of Variance on YIELD
Source DF SS MS F p
VARIETY 5 2.43507 0.48701 56.22 0.000
Error 18 0.15593 0.00866
Total 23 2.59100
The rightmost p-value is for testing whether the group means are thesame.
Week 14
Revision
You have now learned all you need to know about Minitab for this course. But rememberthat some computer output will be included in the exam, so you will need to bereasonably familiar with the output that Minitab provides.