Embed Size (px)
Citation preview

Guide to MINITAB Commands
Srinivas R. ChakravarthyProfessor of Mathematics and Statistics
Department of Science and MathematicsKETTERING UNIVERSITY
Phone 810.762.7906 • Fax 810.762.9796• [email protected]

M I N I T A B C O M M A N D S
11
IntroductionMinitab for Windows is a statistical software package that provides a broad range of basic and
advanced data analysis capabilities. This software is provided for Math602 students along with thetextbook(s). Please follow the instructions in the package for the system requirement as well forinstallation instructions. For on-campus students, if you prefer you can access this software through theApplied Mathematics Laboratory (located in Room 3-335AB). In this handout you will be given a briefintroduction to Minitab. You have to try yourself to get familiar with Minitab. We will be using thissoftware extensively in our course. Minitab has an online help and feel free to use this whenever you needmore information on any specific command. What you are seeing is only the tip of the iceberg and youhave to explore at your leisure to get the full benefit. We will discuss other commands in the class/lab. Butyou should definitely know at a minimum the commands listed in this handout.
BASIC RULES (for those who will be using Applied Mathematics Laboratory):
1. Follow the procedures listed in the laboratory to log on to the computer.
2. Bring your own diskette to save your files.
3. Do not save your work on the hard drive.
4. As a courtesy to fellow users, please logout from Minitab before you exit the lab.
5. Feel free to use the lab whenever you have to and when the lab is not being used by other classes.Classroom usage has the highest priority and when instructed (by the professor) to leave the lab,please log out immediately. The classroom schedule is usually posted outside the room and check thatbefore you enter the lab.
Chapter
1

M I N I T A B C O M M A N D S
22
Getting Started on MinitabIn this chapter, we will briefly discuss the basic commands to get started on Minitab. In the
following the commands that are indicated in boldfaced characters indicate the option that you need tohighlight using the mouse. The symbol “'” will indicate the subcommand that follows the previous one.
First activate Minitab. To do this, from the taskbar, choose Start '' Programs '' Minitab 12 forWindows.
When you are successful, your screen shouldlook like the one shown on the right side. There aretwo windows: Session and Data. The Session windowdisplays text output such as worksheet size, tables ofstatistics, etc. The Data window is where youenter/edit the data. There are other windows too,which we will talk when we get to those.
The Menu Bar, Status Bar and Toolbar: Themenu bar is where the commands are chosen. Inthe figure to the right, you see
Edit '' Save Preferences …
commands were chosen (and so are highlighted).
The Toolbar appears immediately below the Menubar. The Status bar is at the bottom and shows thetext for the current menu selection.
Chapter
2

M I N I T A B C O M M A N D S
33
Issue Commands: There are basically two ways of issuing commands in Minitab; using menucommands and session commands. The Toolbar can also be used to issue commands such as movingcolumns, inserting columns, executing the last command, etc.
In order to activate the session window toaccept commands for Minitab to execute, you have tochoose
Edit '' Save Preferences '' SessionWindow
and click on “Enable” option under CommandLanguage and press OK. See the figure on the rightside. After this, you will see the prompt “>MTB”indicating that your session window is now active. Any(legal) command you type in this window will beexecuted.
CONVENTION OF THE VARIABLES: Minitab stores columns of data in variables labeled C1, C2,and so on. Constants are stored in K1, K2, and so on. Matrices are stored under M1, M2, etc. Names canbe assigned to these variables.
ENTERING DATA: Data can be typed into the columns directly in the DATA session. Data can beimported from a file (plain text, Excel type, etc). Data can also be entered using “cut and paste” method;data can be generated randomly or using patterned option. See the following figures.

M I N I T A B C O M M A N D S
44
The following figures illustrate how to generate random samples from normal distribution. In thisexample, the experiment is conducted 5 times and the data is stored in columns C1-C5.
TYPES OF FILES IN MINITAB: The files saved in Minitab are categorized into one of the followingtypes. Suppose we call the filename as Example. Note that Minitab is not case sensitive.
Example.MTW: Worksheet file. Only Minitab can read this file. Worksheet file contains all your data:columns, constants, and matrices.
Example.MPJ: Project file. Only Minitab can read this file. This contains Session window output,graphs, and worksheets.
Example.TXT: Text file. The information stored in this file is in ASCII form.
Example.MGF: Graphics file. Only Minitab can read this file.

M I N I T A B C O M M A N D S
55
RETRIEVING A WORKSHEET FILE: To retrieve a worksheet file that was saved earlier, performFile '' Open Worksheet and open the worksheet file from the directory where it is residing. In theexample below, we will open the worksheet 93CAR.MTW that is located in the folder“N:\DEPT\SCHAKRAV\MATH408”. To get into this folder,follow the instructions highlighted in thefigures below.

M I N I T A B C O M M A N D S
66
Analyzing the DataWe will use the data set stored in 93CAR.MTW to illustrate some of the basic commands to do statisticalanalysis.
BASIC DESCRIPTIVE STATISTICS:
Choose
Stat '' Basic Statistics '' Descriptive Statistics.
After executing the above command you will see theoutput that is shown on the right ( except for theentries in the windows labeled Variables and Byvariable.
In Variables enter one or more variables listed on theleft side. In our case, we have chosen MPG_C andMPG_H. The window labeled By variable is anoptional one, which is useful if the data is to bedescribed according to some characteristic. For ourexample, that characteristic is the SIZE of the car.After pressing OK in that window, Minitab displaysthe output in the Session window.
That window is shown on the right. Note the types ofstatistics displayed in that window. Also, you will seethat these statistics are displayed according to the sixsizes. Discussion, interpretation and computation ofthese statistics will be presented in the class.
Chapter
3

M I N I T A B C O M M A N D S
77
NORMALITY TEST: Normality assumption plays an important role in Probability and Statistics. Thetest for normality is carried out as follows: Choose
Stat '' Basic Statistics '' Normality Test.
In Variable window, choose a variable (here it is MPG_C) and type in the Title (an option) and pressOK. The Minitab output is displayed below on the right.
To UNSTACK the data according to specific criteria,choose
Manip '' Stack/Unstack '' Unstack.
In the “Unstack the data in” enter a variable (here weentered MPG_C ); type in the columns where theunstacked data will be stored (the number ofcolumns should be equal to the number ofcategories); in “Using subscripts in” window, enterthe variable that contains the different categories.
CONFIDENCE INTERVALS and TESTS OF HYPOTHESES: These are the two pillars ofinferential statistics. To perform these, choose
Stat '' Basic Statistics '' 1-Sample z.
Enter the variable in Variables (here we have C35,that corresponds to Size 3 car – Why? ). By defaultthe level of confidence is taken as 95%. You canenter a different number depending on the levelyou are interested in. For 1-Sample z, you also needto enter a value in Sigma window (here it is 2).

M I N I T A B C O M M A N D S
88
Graphing the DataAs the Chinese adage says, “One picture says thousand words”, it is very important to describe
the data using graphical methods. There are a variety of graphs available and here we will give a smallsample of these. Again, we will use the data in 93CAR.MTW.
Chapter
4

M I N I T A B C O M M A N D S
99
GRAPHS USING DESCRIPTIVE STATISTICS: Interesting summary statistics in the form ofgraphical display can be obtained by choosing
Stat '' Basic Statistics '' Graphs.
In the graphs option, you have several options (see the figure above on the right). In our case, we havechosen “Graphical summary”. Since we are looking at graphical summary of MPG_C by Size, this willproduce six graphs, one for each size. To get all six in one frame, we used the option “Manage graphs”which is shown in the Toolbar. This will produce the window that is displayed in the left below. Highlightin that window, the ones you want to manage and click on Tile option. In our case we chose all six ofthem and that produced the figure shown on the right below.
M I N I T A B C O M M A N D S
1010
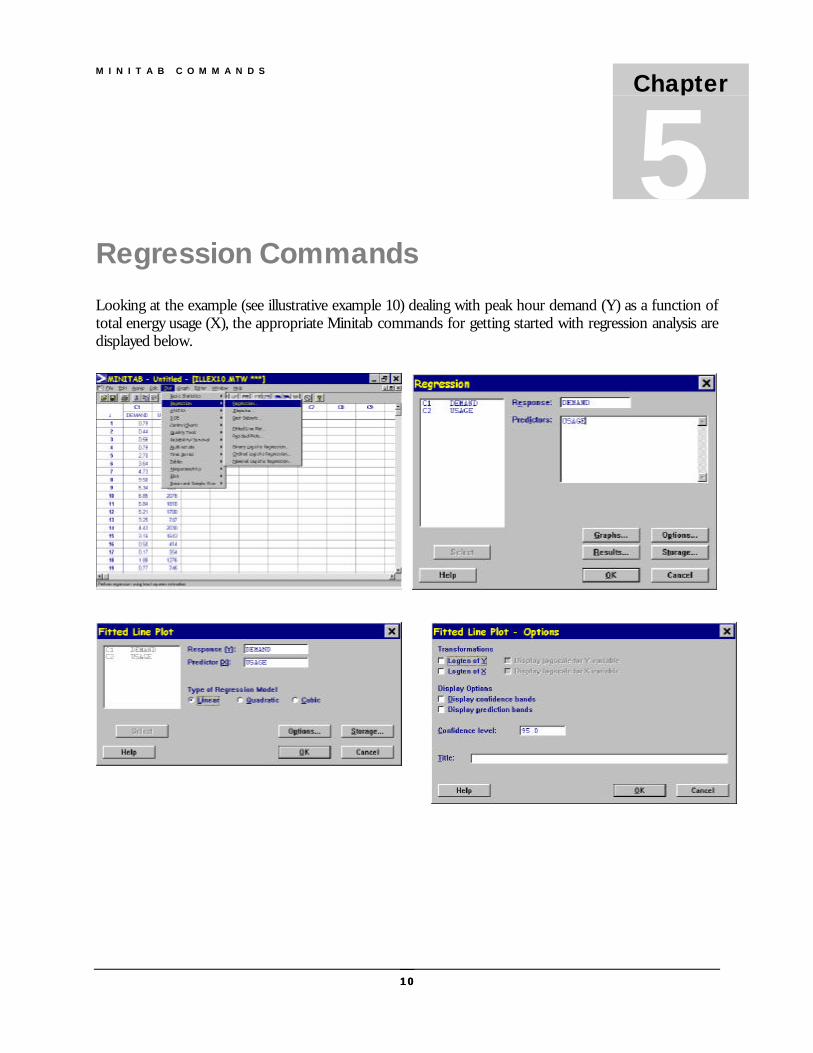
Regression CommandsLooking at the example (see illustrative example 10) dealing with peak hour demand (Y) as a function oftotal energy usage (X), the appropriate Minitab commands for getting started with regression analysis aredisplayed below.
Chapter
5

M I N I T A B C O M M A N D S
1111
Design of Experiments CommandsThe following figures will help you to get started on DOE commands.
Chapter
66
M I N I T A B C O M M A N D S
1212
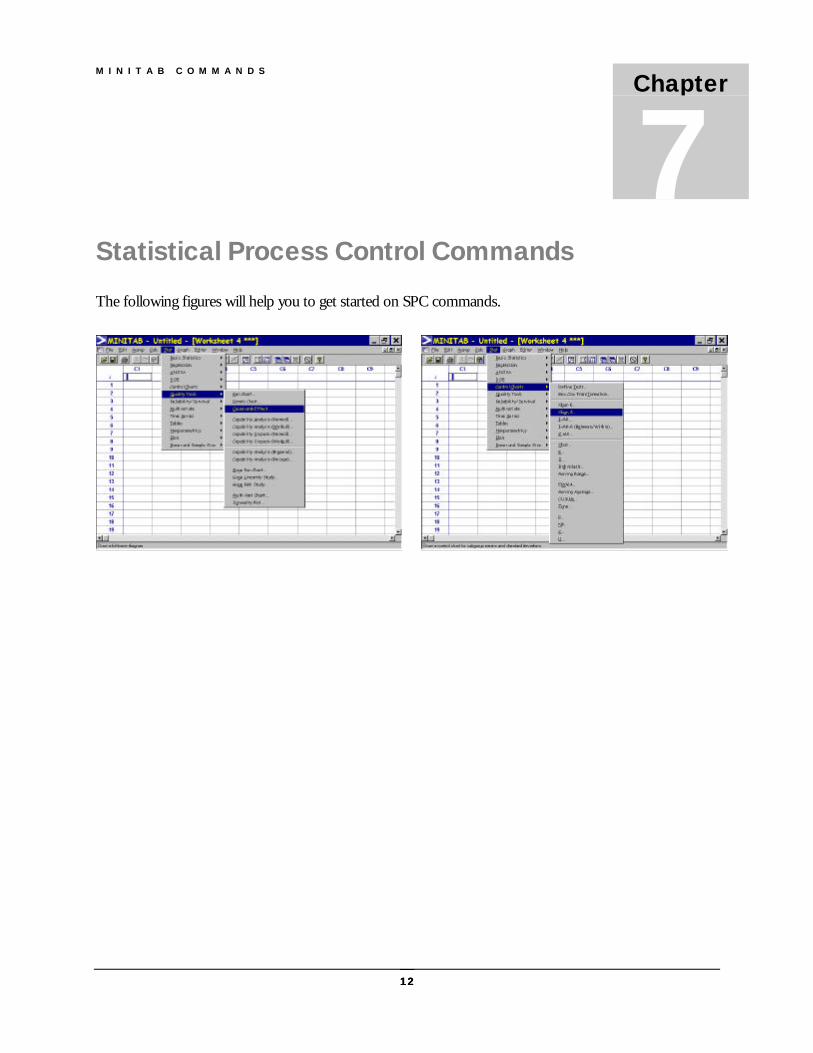
Statistical Process Control CommandsThe following figures will help you to get started on SPC commands.
Chapter
7

M I N I T A B C O M M A N D S
1313
Getting Online HelpMinitab has an online help that can be used to get help on various commands. To invoke this
option, choose Help from the Menu bar You will see six options, of which you can use the first five to getvarious forms of help (see figure below on the left). The option “Search for Help on” produces thewindow that is displayed on the right below. In this window help is sought for Graph command.
CONCLUDING REMARKS: In this brief introduction you are given just a few tips to get started onMINITAB. We will be going over these with several examples related to class projects and the textbook(s)examples. You should bring this handout to the classes so that you can follow the demonstration veryeasily. Again, you have to get into Minitab and explore with various examples. That is the only way, youwill get familiarized with the basic commands.
Chapter
8