Embed Size (px)
Citation preview
1
1 Supplementary for:
2 Enhancing Multifunctional Properties of Renewable Lignin Carbon Fiber via Defining
3 Structure-Property Relationship Using Different Biomass Feedstock
4 Qiang Li1,2, Cheng Hu1,2, Mengjie Li1,2, Phuc Truong3, Jinghao Li1,2, Hao-Sheng Lin1,4, Mandar
5 T. Naik5, Sisi Xiang6, Brian E. Jackson7, Winson Kuo6, Wenhao Wu8, Yunqiao Pu9, Arthur J.
6 Ragauskas9,10,11, Joshua S. Yuan1,2*
7 1Synthetic and Systems Biology Innovation Hub, Department of Plant Pathology and
8 Microbiology, Texas A&M University, College Station, TX 77843, USA
9 2Department of Chemical Engineering, Texas A&M University, College Station, TX 77843,
10 USA
11 3Soft Matter Facility, Texas A&M University, College Station, TX 77843, USA
12 4Department of Soil and Crop Science, Texas A&M University, College Station, TX 77843,
13 USA
14 5Department of Molecular Pharmacology, Physiology and Biotechnology,
15 Brown University, Providence, RI 02903, USA
16 6Materials Characterization Facility, Texas A&M University, College Station, TX 77843, USA
17 7Department of Horticultural Science, North Carolina State University, Raleigh, NC 27695, USA
18 8Department of Physics and Astronomy, Texas A&M University, College Station, TX 77843,
19 USA
20 9Joint Institute for Biological Sciences, Biosciences Division, Oak Ridge National Laboratory,
21 Oak Ridge, TN 37831, USA
22 10Department of Chemical and Biomolecular Engineering, The University of Tennessee,
23 Knoxville, TN 37996-2200, USA
Electronic Supplementary Material (ESI) for Green Chemistry.This journal is © The Royal Society of Chemistry 2021
2
24 11Department of Forestry, Wildlife and Fisheries, Center for Renewable Carbon, Institute of
25 Agriculture, The University of Tennessee, Knoxville, TN 37996-2200, USA
26 *For correspondence: Joshua S. Yuan: [email protected]
27
28
29
30 Fig S1. Aromatic region of 2D HSQC NMR spectra of lignin. S/G/H ratios were semi-quantified
31 from the volume integration. The chemical structures of S, G, H, pCA and FA are in panel B.
32 The chemical shifts of these structures were in Table S1.
33
3
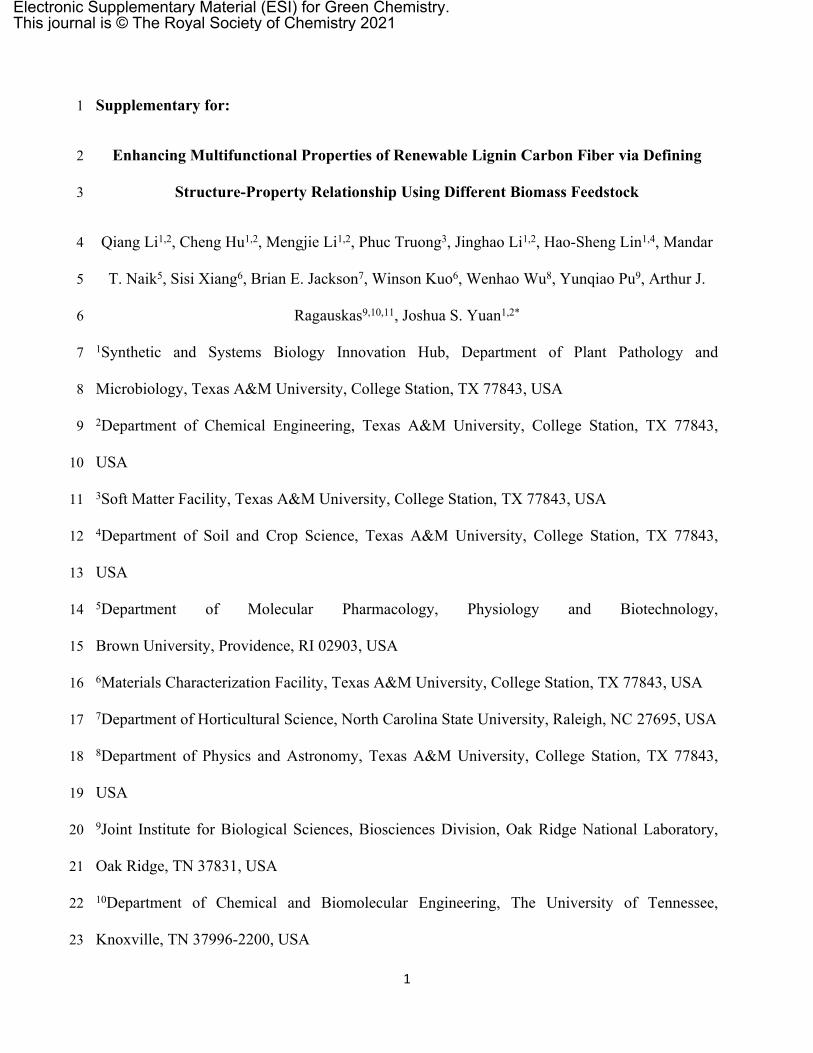
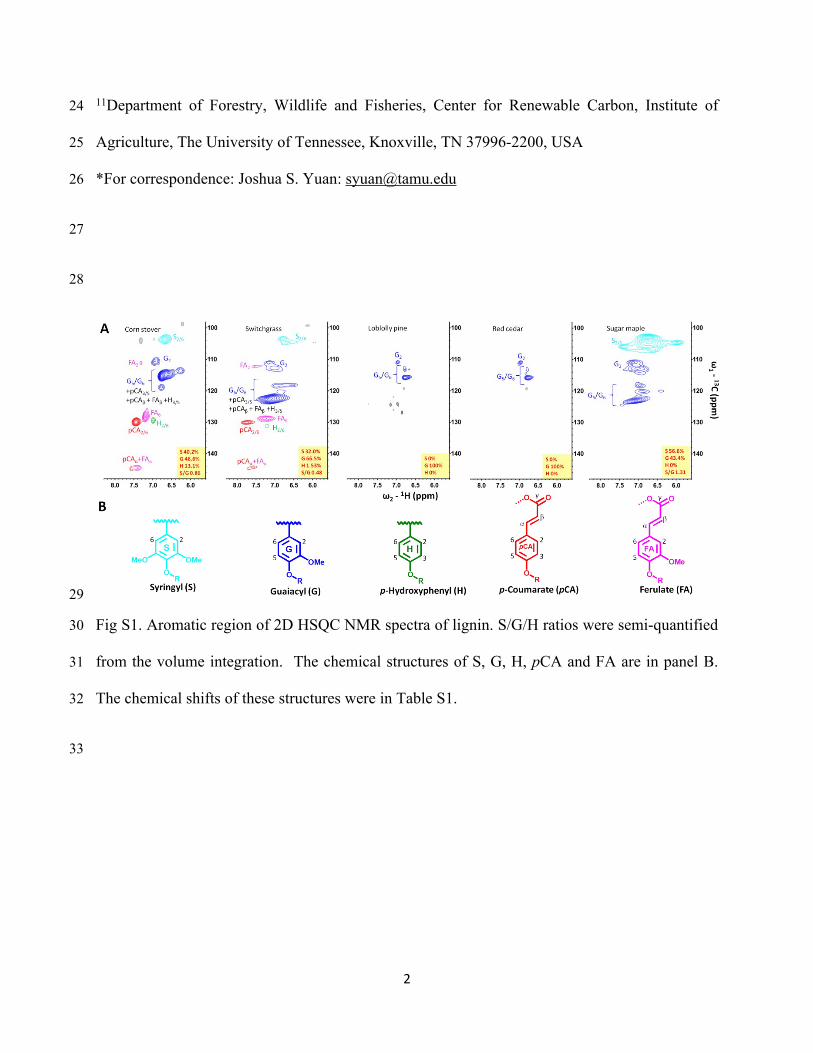
34 Table S1. Assignments of lignin chemical structures in 2D HSQC NMR.1,2
Lignin structures*F2
(ppm)
F1
(ppm)
Iα (α position in β–O–4’) 5.0 74.5
IIα (α position in β–5’) 5.5 87.7
IIIα (α position in β–β’) 4.7 85.0
C2/H2 in guaiacyl units (G2) 6.8 111.3
C2,6/H2,6 in ρ-hydroxyphenyl units (H2/6) 7.3 127.2
C2,6/H2,6 in syringyl units (S2/6) 6.7 103.8
C2,6/H2,6 in p-Coumarate (pCA2,6) 7.6 130.0
Cα/Hα in p-Coumarate (pCAα) 7.6 145.0
C2/H2 in Ferulate (FA2) 7.5 111.5
C6/H6 in Ferulate (FA6) 7.3 128.3
Cα/Hα in Ferulate (FAα) 7.5 144.5
35 *Lignin linkages and units are shown in Fig. S1 and Fig. 7, respectively.
36
37 Table S2. Ash content of lignin samples.
Lignin samples Ash content (%)
Corn stover 0.52
Switchgrass 0.10
Loblolly pine 0.10
Red cedar 0.11
Sugar maple 0.10
38

4
39
40 Fig. S2. FTIR spectra of lignin (3800-800 cm-1). The peaks at about 1720 cm-1 were assigned to
41 the stretching vibrations of carbonyl groups in lignin.
42
43
44 Fig. S3. GPC spectra of lignin from different biomass.
5
45
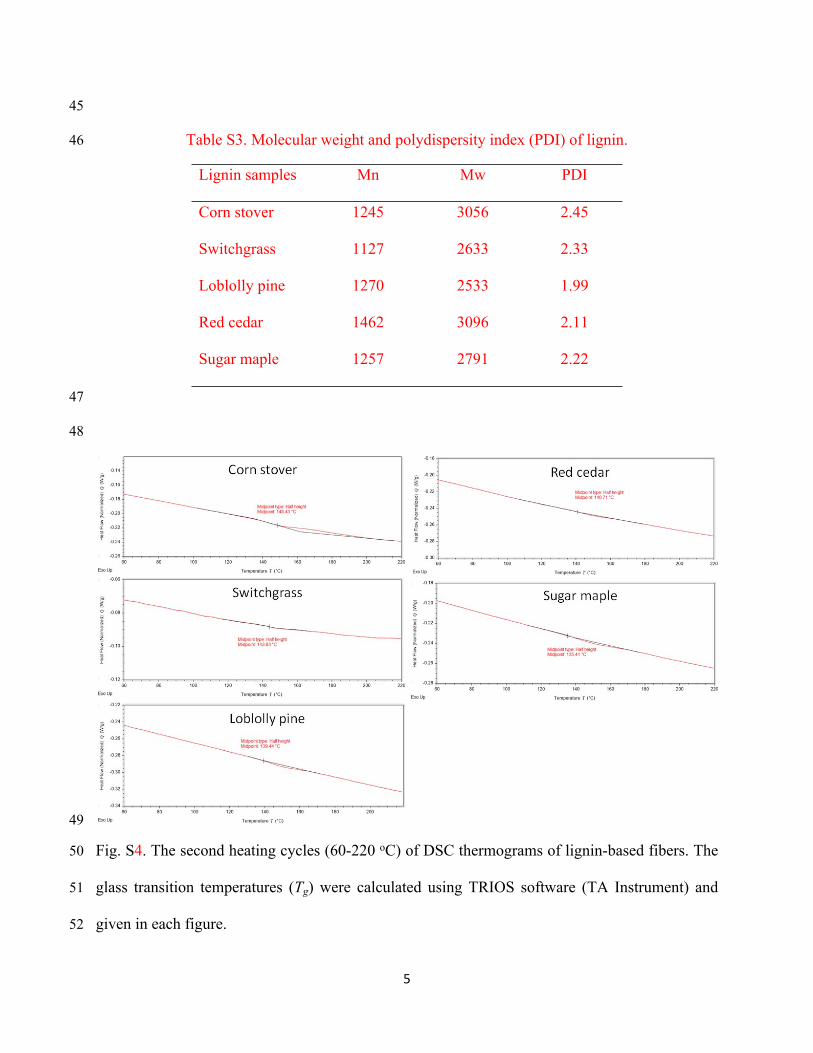
46 Table S3. Molecular weight and polydispersity index (PDI) of lignin.
Lignin samples Mn Mw PDI
Corn stover 1245 3056 2.45
Switchgrass 1127 2633 2.33
Loblolly pine 1270 2533 1.99
Red cedar 1462 3096 2.11
Sugar maple 1257 2791 2.22
47
48
49
50 Fig. S4. The second heating cycles (60-220 oC) of DSC thermograms of lignin-based fibers. The
51 glass transition temperatures (Tg) were calculated using TRIOS software (TA Instrument) and
52 given in each figure.
6
53
54
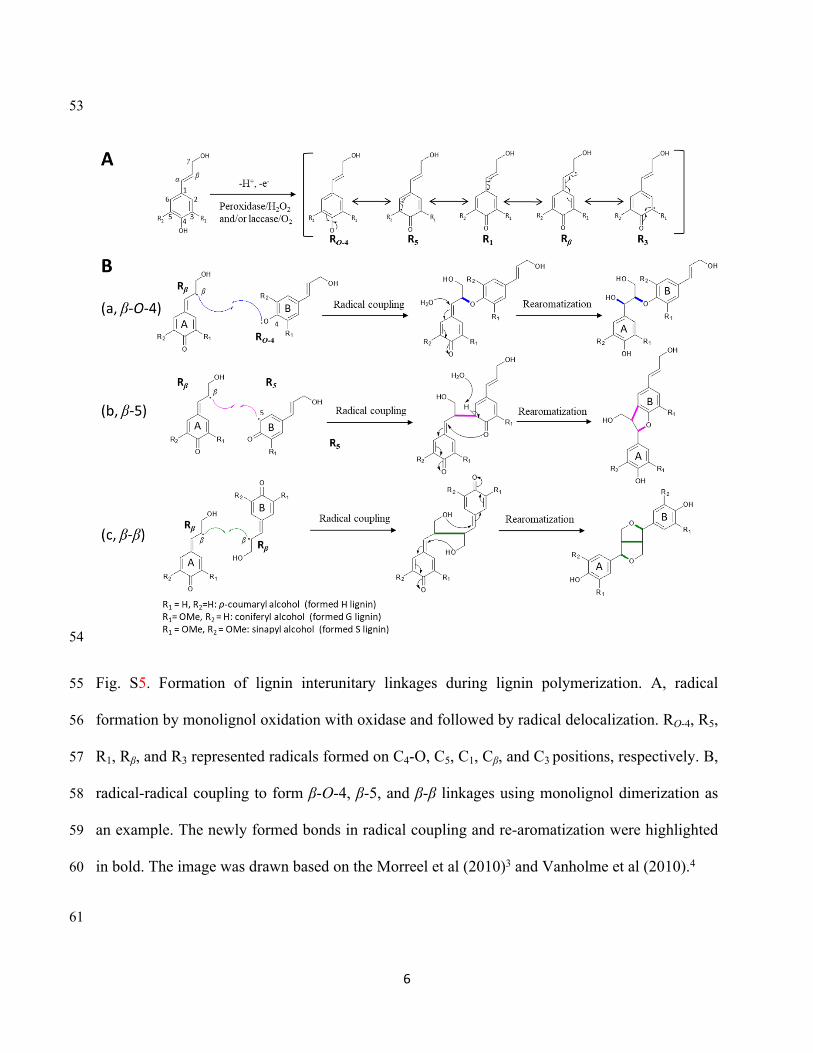
55 Fig. S5. Formation of lignin interunitary linkages during lignin polymerization. A, radical
56 formation by monolignol oxidation with oxidase and followed by radical delocalization. RO-4, R5,
57 R1, Rβ, and R3 represented radicals formed on C4-O, C5, C1, Cβ, and C3 positions, respectively. B,
58 radical-radical coupling to form β-O-4, β-5, and β-β linkages using monolignol dimerization as
59 an example. The newly formed bonds in radical coupling and re-aromatization were highlighted
60 in bold. The image was drawn based on the Morreel et al (2010)3 and Vanholme et al (2010).4
61

7
62
63 Table S4. The yields of carbon fibers made from different biomass.
Lignin samples Carbonization (%)a
Corn stover 51.3
Switchgrass 52.6
Loblolly pine 56.6
Red cedar 57/0
Sugar maple 59.4
64 a % is based on as-spun fibers.
65
50:50 65:35 75:2530
40
50
60
70
80
90
100
Tensile strength (MPa) MOE (GPa)
Weight ratio of lignin to PAN
Tens
ile s
tren
gth
(MPa
)
4.4
4.8
5.2
5.6
6.0
4.74
5.22
70.0
59.9
MO
E (G
Pa)
81.8
5.92
66 Fig. S6. Mechanical properties of the as-spun fibers made of lignin/PAN at different weight
67 ratios of 50:50, 65:35, and 75:25.
68
8
69
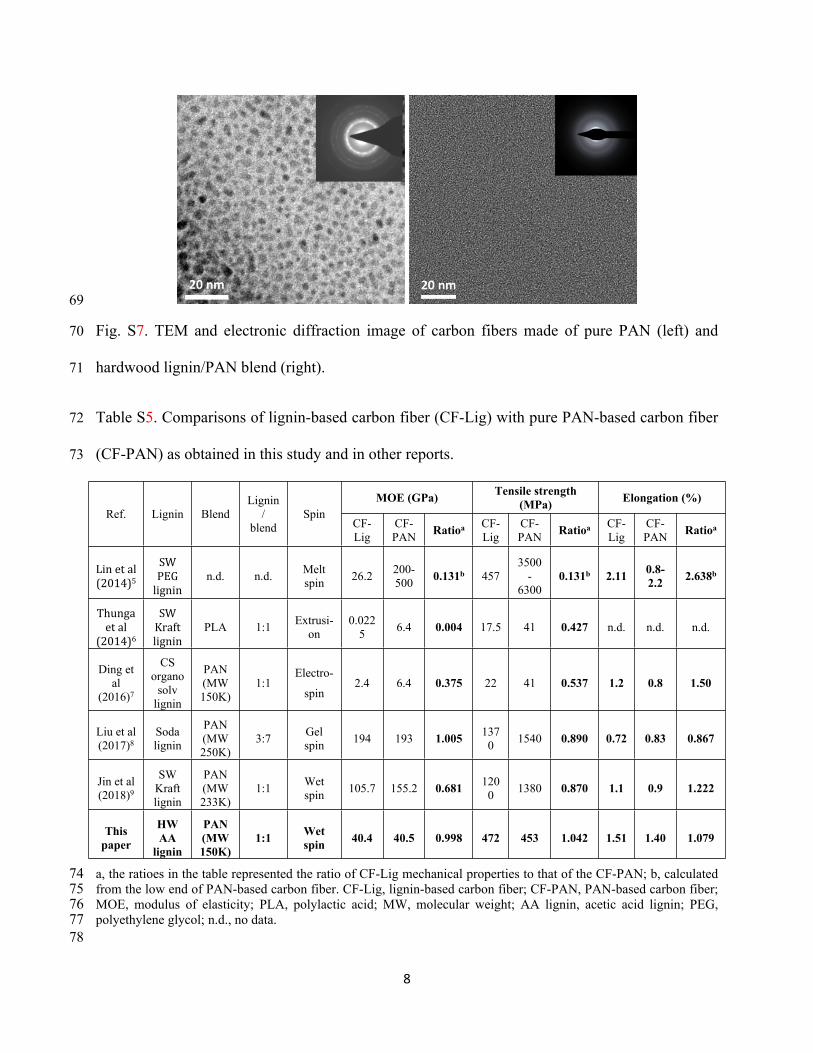
70 Fig. S7. TEM and electronic diffraction image of carbon fibers made of pure PAN (left) and
71 hardwood lignin/PAN blend (right).
72 Table S5. Comparisons of lignin-based carbon fiber (CF-Lig) with pure PAN-based carbon fiber
73 (CF-PAN) as obtained in this study and in other reports.
MOE (GPa) Tensile strength (MPa) Elongation (%)
Ref. Lignin BlendLignin
/blend
SpinCF-Lig
CF-PAN Ratioa CF-
LigCF-PAN Ratioa CF-
LigCF-PAN Ratioa
Lin et al (2014)5
SW PEG
ligninn.d. n.d. Melt
spin 26.2 200-500 0.131b 457
3500-
63000.131b 2.11 0.8-
2.2 2.638b
Thunga et al
(2014)6
SW Kraft lignin
PLA 1:1 Extrusi-on
0.0225 6.4 0.004 17.5 41 0.427 n.d. n.d. n.d.
Ding et al
(2016)7
CS organo
solv lignin
PAN (MW 150K)
1:1Electro-
spin2.4 6.4 0.375 22 41 0.537 1.2 0.8 1.50
Liu et al (2017)8
Soda lignin
PAN (MW 250K)
3:7 Gel spin 194 193 1.005 137
0 1540 0.890 0.72 0.83 0.867
Jin et al (2018)9
SW Kraft lignin
PAN (MW 233K)
1:1 Wet spin 105.7 155.2 0.681 120
0 1380 0.870 1.1 0.9 1.222
This paper
HW AA
lignin
PAN (MW 150K)
1:1 Wet spin 40.4 40.5 0.998 472 453 1.042 1.51 1.40 1.079
74 a, the ratioes in the table represented the ratio of CF-Lig mechanical properties to that of the CF-PAN; b, calculated 75 from the low end of PAN-based carbon fiber. CF-Lig, lignin-based carbon fiber; CF-PAN, PAN-based carbon fiber; 76 MOE, modulus of elasticity; PLA, polylactic acid; MW, molecular weight; AA lignin, acetic acid lignin; PEG, 77 polyethylene glycol; n.d., no data.78
9
79 Reference
80 1 Mansfield, S. D., Kim, H., Lu, F. & Ralph, J. Whole plant cell wall characterization using
81 solution-state 2D NMR. Nat. Protocols 7, 1579-1589 (2012).
82 2 Li, Q. et al. Quality carbon fibers from fractionated lignin. Green Chem. 19, 1628-1634
83 (2017).
84 3 Morreel, K. et al. Mass Spectrometry-Based Sequencing of Lignin Oligomers. Plant
85 Physiol.153, 1464-1478 (2010).
86 4 Vanholme, R., Demedts, B., Morreel, K., Ralph, J. & Boerjan, W. Lignin Biosynthesis
87 and Structure. Plant Physiol. 153, 895-905 (2010).
88 5 Lin, J. et al. Improvement of Mechanical Properties of Softwood Lignin-Based Carbon
89 Fibers. J. Wood Chem. Technol. 34, 111-121 (2014).
90 6 Thunga, M., Chen, K., Grewell, D. & Kessler, M.R. Bio-renewable precursor fibers from
91 lignin/polylactide blends for conversion to carbon fibers. Carbon 68, 159-166 (2014).
92 7 Ding, R., Wu, H., Thunga, M., Bowler, N. & Kessler, M.R. Processing and
93 characterization of low-cost electrospun carbon fibers from organosolv
94 lignin/polyacrylonitrile blends. Carbon 100, 126-136, (2016).
95 8 Liu, H.C., Chien, A.-T., Newcomb, B.A., Liu, Y. & Kumar, S. Processing, structure, and
96 properties of lignin- and cnt-incorporated polyacrylonitrile-based carbon fibers. ACS
97 Sustain. Chem. Eng. 3, 1943-1954 (2015).
98 9 Jin, J. & Ogale, A.A. Carbon fibers derived from wet-spinning of equi-component
99 lignin/polyacrylonitrile blends. J. Appl. Polym. Sci. 135, 45903 (2018).
100