Embed Size (px)
Citation preview

Risk Taking during a Global Crisis: Evidence from Wuhan*
Di Bu Macquarie University
Tobin Hanspal WU Vienna University of Economics and Business
Yin Liao Macquarie University [email protected]
Yong Liu
Wuhan University of Science and Technology [email protected]
April 4th, 2020
First version: March 24th, 2020
Abstract:
We conducted a repeated survey on risk taking behavior across a panel of subjects in Wuhan, China – ground zero of the Coronavirus pandemic – before and after the outbreak began. Our baseline survey was administered on October 16th, 2019 among graduate students in Wuhan prior to the COVID-19 outbreak. 47% of the students in our sample returned home to other provinces in China for semester break in early January before the province of Hubei and the city of Wuhan was locked down with strict quarantine orders on January 23rd, 2020. We administered a follow up survey to the same subjects, capturing their geolocation information on February 28th. We use variation in exposure across different Chinese cities and provinces to measure the impact of the Coronavirus pandemic on subjects’ willingness to take risk. We find that subjects’ allocations of wealth to hypothetical risky investments decrease monotonically based on the strength of their exposure to the pandemic. However, subjects uniformly report substantially lower general preferences for risk regardless of their exposure. Higher levels of exposure leads subjects to reduce beliefs in their own luck and sense of control and in turn, form more pessimistic beliefs on the economy and social conditions. We provide evidence that short-term changes in risk taking may stem more so from changes in beliefs and optimism than from general risk preferences. Our results suggest that more closely held formative experiences have large, negative, and acute effects on economic preferences during a crisis. JEL Classifications: G50, G51, G11, D14, G41
Keywords: Coronavirus, COVID-19, Risk taking, Formative experiences, Economic preferences, China
* We are thankful to many for their suggestions, comments, and advice including Steffen Andersen, Claes Bäckman, Stefan Bogner, Martin Brown, Ray Fisman, Rawley Heimer, Matti Keloharju, Vesa Pursiainen, Michael Weber, and Christian Wagner. This project is supported by the Major Philosophy and Social Sciences Research Program of Hubei Province Higher Education Committee (Grant No.:19ZD016). Contact details: Bu: [email protected]. Department of Applied Finance, Macquarie University, Australia. Hanspal: [email protected]. WU Vienna University of Economics and Business. Institute for Finance, Banking and Insurance. Department of Finance, Accounting and Statistics. Liao: [email protected]. Department of Applied Finance, Macquarie University, Australia. Liu: [email protected]. Wuhan University of Science and Technology
1
1. Introduction
A number of studies have provided evidence that formative experiences stemming from large
shocks (e.g., financial crises, natural disasters, violence and trauma) may have long-term
effects on economic preferences and risk taking behavior (Malmendier and Nagel, 2011;
Kaustia and Knüpfer, 2008, 2012; Giannetti and Wang, 2016; Knüpfer, Rantapuska, and
Sarvimäki, 2017; Guiso, Sapienza, and Zingales, 2018; Andersen, Hanspal, and Nielsen, 2019;
and Brown, Cookson, Heimer, 2019). Most studies that investigate how these shocks affect
behavior use observational data on field outcomes and posit through which channels
behavior may have been affected. One missing aspect of these studies is how individual
preferences may acutely change, in the midst of the experience or crisis itself. To that end, we
know little about how the preferences and beliefs of individuals change during hard times.
Understanding how and why household risk taking and other preferences may
change during a crisis is crucial for determining appropriate policy responses, particularly
when the persistence of a downturn or crisis is unknown. If, for example, households’
tolerance for risk decreases through time-varying beliefs and expectations, it may imply that
observed changes in risk taking are temporary (e.g., financial market volatility and the
business cycle). At the same time, an expectations-driven shock to risk taking may impact
more strongly on consumption and consumer behavior. On the other hand, if changes in
observed risk taking come from a more general shift in preferences, policy responses may
need to be more structural in nature and may impact long term economic growth.
In this study, we examine how risk tolerance evolves from normal times, to the peak
of a worldwide health-crisis.1 We survey a large sample of subjects in Wuhan, China – ground
zero of the COVID-19 novel Coronavirus pandemic. Our first survey wave took place on
October 16th 2019, several weeks before initial reports of the virus in mainland China in
December 2019 (Holshue et al., 2020). By January 23rd, 2020 all incoming and outgoing public
transportation to and from the Hubei province (where Wuhan is the capital) was halted.
Gatherings and events inside Wuhan were banned, and quarantine and isolation were
established. By February 15th, 2020 Wuhan was in a state of complete and total quarantine
with more than 56,000 reported cases of COVID-19 infections and 1,600 deaths. On
February 28th 2020, we administered an online follow up survey to the same group of subjects
with an 88% retention rate (N = 225/257).
1 We plan to continue this study into the future, and further understand how risk taking and economic preferences continue to change or revert back to pre-crisis levels.

2
Our main sample consists of graduate students from Wuhan University of Science
and Technology.2 Winter break for the semester started at WUST on January 11th 2020 and
most students from other provinces were able to return to their homes as planned for the
Chinese Lunar New Year celebrations. As the province of Hubei became quarantined and
effectively locked down shortly after, students from other provinces continued their study
programs via distance learning (alongside their Wuhan-based peers) and we administered
follow up online surveys on WeChat, capturing precise geolocation information from
subjects. This source of geographical variation across China allows us to measure the
intensity of exposure to the Coronavirus pandemic on our outcome measures of interest.
Wave one of our survey holds constant all subjects in the city of Wuhan, while in wave two,
47% of subjects (N = 106) are in provinces outside of Hubei, in parts of China with
substantially lower exposure to COVID-19. In fact, by the time our follow up study was
administered, February 28th, the province of Hubei had 66,300 infection cases, while all other
provinces across China had 12,600 in total. This variation allows us to explore if individuals
who are more closely impacted by the Coronavirus pandemic, as proxied by the province
and city of their quarantine location, differ in their preferences and beliefs as the crisis
evolves.
Our study examines if individuals’ tolerance for risk is affected due to their exposure
to the pandemic. We first document that subjects who become quarantined in Wuhan hold
subjective beliefs consistent with a higher level of exposure to the pandemic. These subjects
believe that they have a higher exposure risk to the Coronavirus than those elsewhere.
Subjects located in Wuhan during the quarantine state higher probabilities that they
themselves are likely to be infected, as well as higher exposure to infections and deaths within
their families and communities.3 Subjects across the province of Hubei also show higher
levels of fear in the pandemic in general.
We examine how varying exposure affects allocations to risk via a hypothetical
gamble elicited during the quarantine and peak of the Coronavirus pandemic in China during
the first week of March 2020. Subjects are asked to provide an allocation to a risky investment
(0-1000 RMB) invested with an equal probability of higher returns or a loss. Subjects
quarantined in Wuhan, with greater subjective (and arguably objective) exposure to the virus
2 As part of a separate project, we obtained additional survey data on perceptions of climate risk from both Wuhan and Guizhou, a province of China approximately 1,000 kilometers from Wuhan and one of the least affected areas from the Corona virus pandemic. This survey data was also collected in pre, and during-crisis waves similar to our main sample but is outside the scope of this particular paper. 3 We refer to these exposures to the virus as subjective perceptions about exposure because we can confirm that no individuals in our sample contracted the virus during our study period.

3
allocate significantly less to the risky investment option relative to those in other cities within
the Hubei province (-67.0 RMB), and those in other provinces of China (-149.8 RMB). This
represents an economically significant difference given a mean investment of 287.6 RMB,
and constitutes a 45% smaller investment compared to subjects in other provinces.
We then attempt to disentangle the mechanism behind this observed difference in
risk taking by analyzing repeat-measures from our survey waves across a number of
outcomes. We find that on average all subjects surveyed first in Wuhan in October 2019, and
later at their place of quarantine show a large and significant decrease in general preferences
for risk. The decrease amounts to -0.63 on a 5 point scale and is highly significant at standard
levels (t-stat = -13.09). While the decrease in risk preferences for those in Wuhan, with higher
exposure to the pandemic, is slightly greater, the effect is economically and statistically small.
This suggests that the observed differences in risk taking from heterogeneous experiences
may not be entirely driven from the uniform decrease in general risk preferences.
We then examine several measures of optimism and beliefs in individuals’ own luck
and fortune prior to and during the Coronavirus pandemic and how they relate to risk taking.
Compared to other subjects, those in Wuhan, with higher exposure to the pandemic, show
a 10.2 percentage point decrease in Wuhan-based subjects in their belief about their own
personal luck. An index based on questions that ask about the percentage of investors which
would have better luck or higher returns in financial investments shows a similar pre-
pandemic value, while subjects quarantined in Wuhan submit a substantial increase in the
fraction of investors they believe are better than the subject him or herself (6.8 percentage
points). For subjects with higher exposure, measures about individuals’ sense of control are
similarly negatively affected. In general, we find that exposure strongly affects individuals’
optimism about their own outcomes.
The observed change in risk taking and in beliefs about self also affects broader
beliefs about the future economy and social conditions. We find that subjects with higher
exposure to the pandemic form more pessimistic beliefs on the economy in general, the stock
market, their own health, and on the environment, relative to subjects in further removed
provinces. A number of recent studies have focused on the importance of subjective beliefs
on economic outcomes (e.g., Kuhnen and Miu, 2017; Ameriks et al., 2018; Giglio et al., 2019;
Kuchler and Zafar, 2019; Das, Kuhnen, and Nagel, 2019; Andersen et al., 2020). Our findings
suggest that experiences may affect risk taking acutely through time-varying subjective
beliefs. What is not yet clear in our setting, is if the higher exposure led individuals to form

4
more or less precise forecasts, although recent evidence suggests experience affects in the
opposite direction (Goldfayn-Frank and Wohlfart, 2019; Kuchler and Zafar, 2019).
Our paper contributes to the literature in economics and finance which examines
how events and experiences can shape behavior. In a seminal paper, Malmendier and Nagel
(2011) show that experiences with macroeconomic shocks affect financial risk taking well
into the future. A further literature has shown that personal experiences make individuals
refrain from opportunities to take risk (Knüpfer, Rantapuska, and Sarvimäki, 2017; Guiso,
Sapienza, and Zingales, 2018; Giannetti and Wang, 2016; Kaustia and Knüpfer, 2008, 2012;
Choi, Laibson, Madrian, and Metrick, 2009; Chiang, Hirshleifer, Qian, and Sherman, 2011;
Bucher-Koenen and Ziegelmeyer, 2014; Hoffmann and Post, 2017). Andersen, Hanspal, and
Nielsen (2019) highlight the importance of the degree to which individuals make experiences
and show that personal first-hand experiences can make individuals actively change their
attitudes toward risk. We contribute to this literature by providing evidence that closely
experienced shocks, in the midst of a crisis, can acutely affect risk taking at least partially
through a channel of beliefs and expectations. Relatedly, our findings contribute to a
literature on time-varying risk aversion (e.g., Campbell and Cochrane, 1999; Brandt and
Wang, 2003; Chetty and Szeidl, 2016; Brunnermeier and Nagel, 2008). We provide micro-
level evidence of changing attitudes towards risk. We document that general risk preferences
are uniformly negatively affected by the Coronavirus pandemic, while active risk taking
decisions may be more affected by individual level experiences through changing beliefs and
optimism.
We also contribute to a literature which uses survey or experimental data to measure
preferences and how heterogeneity in experiences affect these measures. For example, Callen
et al. (2013) find that risk aversion is exacerbated by violent wartime experiences, particularly
when these memories are made salient with priming. In contrast, Voors et al. (2012) and
Eckel et al. (2009) large shocks decrease risk aversion in their settings. Similarly, Fisman,
Jakiela, and Kariv (2015) find individuals exposed to the recession exhibit higher levels of
selfishness and in general that distributional preferences changed during the financial crisis
of 2007-09. We contribute to this literature by using repeated survey measures of economic
preferences and beliefs, and studying how risk taking is affected during times of crisis.
Finally, we contribute to a handful of recent studies which look at the effects of the
COVID-19 pandemic on households’ expectations.4 Binder (2020) surveys US households
4 Undoubtedly related to the Coronavirus pandemic is a number of studies which examine how beliefs about mortality affect economic decision making. The findings from this literature are mixed and use both individual surveys and life-cycle models (e.g., Hamermesh, 1985; Hurd and McGarry, 2002; Gan et al., 2015; Puri and

5
relatively early during the course of the pandemic’s effects in the United States (March 3rd,
2020) and finds that subjects update their inflation and unemployment forecasts when
provided information about the Federal Reserve’s interest rates cuts. Fetzer et al., (2020) elicit
beliefs about mortality with two different information treatments and find that subjects
overestimate mortality and contagiousness of the virus. We contribute to this literature by
providing evidence of individuals’ updating of beliefs and preferences around the
Coronavirus pandemic, by using survey data on a repeat panel of subjects. Furthermore, our
subjects are under strict quarantine conditions and in the midst of the crisis.
Our study proceeds as follows: the second section provides additional background
on the Coronavirus setting in China. In Section 3 we detail our experimental setting,
discussing the baseline and follow-up survey along with information about participant
selection and the timing of events. In Section 4, we present our main findings along with
various other empirical results. We discuss the ramifications of our findings and conclude in
the final section.
2. Background
Our study focuses on how differences in exposure to the Coronavirus pandemic affect risk
taking and other economic outcomes. An implicit assumption about our empirical approach
and identification is that individuals located in different geolocations, i.e., the city of Wuhan,
the province of Hubei, and other provinces across China, differ in their exposure to the
Coronavirus pandemic. There are two, related, sources of variation by location which are
important to discuss. The first is spatial heterogeneity in rates of infection and death caused
by the COVID-19 Coronavirus. Figure 1 plots the cumulative infections (blue, left axis) and
deaths (red, right axis) in the Hubei province of China, where the city of Wuhan is located.
The dashed red and blue lines represent the cumulative sum of infections and deaths from
all other provinces in China and are plotted on the same axes. We note that other provinces
experienced significantly fewer infection cases and deaths compared to Hubei, and Wuhan,
the epicenter of the pandemic, over time. This variation implies that individuals in some
provinces of China will not have come into first-hand contact with the virus and are less
likely to know people who have been infected or died. On the other hand, individuals in the
city of Wuhan or the Hubei province are much more likely to experience the Coronavirus
either first-hand, or indirectly through family and friends.
Robinson, 2007; Cocco and Gomes, 2012; Elder, 2013; Post and Hanewald, 2013; Heimer, Myrseth, and Schoenle, 2019).

6
Second, and related to the rates of infections and deaths, individuals across provinces
and cities in China experienced stark differences in regulations and quarantine conditions
during the Coronavirus pandemic. For example at the epicenter of the pandemic, in all cities
across the Hubei province, citizens were not permitted to go outside and leave their living
spaces under normal circumstances. Supermarkets, grocery stores, and pharmacies were not
open to serve individuals. Rather, the government organized special personnel to purchase
living materials for residents and distributed and delivered them throughout communities.
All public transportation was completely shut down. Furthermore, the local police patrolled
cities vigilantly and individuals found outside without permission were placed in government
assigned quarantine stations for 14 days.5
For individuals in other provinces across China, the quarantine conditions differed
substantially. In most areas, each household could assign a family member allowed to make
purchases for basic food and living materials every two days. Supermarkets, grocery stores,
and pharmacies remained open for individuals. Public transportation was only partially shut
down or disrupted for short periods of time in most cities. Finally, citizens were still
permitted to leave their communities for limited, necessary, activities. These differences in
quarantine conditions are directly related to the severity of the pandemic, however it is likely
that individuals experiencing the first-hand effects of the pandemic and the harshest
quarantine conditions will be significantly affected compared to those with lower exposure
to the virus itself as well as substantially more flexible living conditions.
3. Experimental design
a. Participant selection
In many universities across China students are grouped into cohorts in order to better
supervise and manage the large number of incoming students. The size of these cohorts
varies at different universities but are normally between 30 and 60 students. Once a cohort
is formed, the students generally remain within the same cohort for the entire study period
at their respective university. Cohorts differ from classes, and students from the same cohort
do not always attend the same lectures or study programs. Each cohort is managed by a
supervisor. This supervisor uses social networking apps and tools such as WeChat as a daily
communication and management platform for the students. Specifically, supervisors create
5 Firsthand accounts suggest that the quarantine measures in the city of Wuhan were a strong deterrent. Video clips circulating on social networking sites display police in Hubei arresting citizens and placing them into forced quarantine.
7
a WeChat group for each class that they manage where students must join such that everyone
can be informed about announcements made by their supervisors. We use these cohorts and
WeChat groups to recruit and segment samples for participation in our study. To encourage
students to complete the survey, we offered students a small participation incentive (5 to 10
RMB).
b. Baseline surveys
From October 16, 2019 to October 18, 2019 we conducted a survey based experiment with
master students at Wuhan University of Science and Technology (WUST). The survey was
conducted primarily for a study on how beliefs about luck and superstition affect risk taking
and investment behavior.6 We administered the paper and pencil survey among 257 master’s
students in a classroom setting. Each postgraduate cohort at WUST typically comprises 30
to 40 postgraduate students. We randomly selected 8 postgraduate cohorts from a pool of
more than 90. We collaborated with the cohort supervisors who organized that their students
attend our survey sessions.
The survey consisted of several parts. First, students provided demographic
information such as age, gender, date of birth, and birth province. After this information
students were asked to answer a set of questions aimed to measure individual confidence (or
over-confidence). Specifically, subjects answered 10 trivia, fact-based questions and were
asked to provide a lower and upper bound for the 90 percent confidence interval of each
provided answer. Following these questions, subjects were asked to provide answers to five
standard and simple financial literacy questions on compounding interest, inflation, bond
and mortgage markets, and diversification.7
We then asked 13 questions on beliefs in good luck following Darke and Freedman
(1997). We then presented subjects a miscalibration exercise where we asked individuals to
provide probabilities over the last 12 months of Shenzhen Stock exchange index, the Chinese
top 300 stock index (CSI300), the S&P500 index, and GDP growth in China. We asked
individuals how confident they were of their answers. This was coupled with survey questions
asking how the subject would rank him or herself compared to others in their investment
performance. We then asked subjects about gambling and luck behavior with a 10 item
questionnaire (Wood and Clapham, 2005). Finally, we questioned subjects on their general
6 Work in progress by Bu et al., “Unlucky Beliefs: The Zodiac Birth Year Effect and Individual Investor Performance.” 7 Refer to Online Appendix A for an English translation of they survey questions.

8
preferences for risk following (Dohmen et al., 2018). Photos of students taking the paper and
pencil survey are provided in Appendix Figure 1.8
From November 25, 2019 to December 3, 2019 we conducted a separate survey
among master students at WUST focused on beliefs and preferences related to climate
change. Similar to our main survey above, we administered this climate risk paper and pencil
survey among 12 randomly selected post graduate classes comprising 466 participants. The
sessions were administered with course counselors similar to described above. The focus of
this survey was on perceived climate change risk and pro-environmental behavior. This
sample is not included in our analysis and we plan to study this in a separate paper.
c. Follow up surveys
Shortly following the administration of our baseline survey, the city of Wuhan became the
epicenter for a worldwide health-crisis, the COVID-19 Coronavirus pandemic. Reports
suggest that the Coronavirus began in December 2019 in the Huanan seafood market in
downtown Wuhan (WHO, 2020). Winter break for the semester started at WUST on January
11th, 2020. Wuhan was locked down on January 23rd, 2020, and by then most students from
regions outside of Wuhan had left the city for holidays to celebrate China’s Lunar New Year.
From February 28, 2020 to March 3, 2020, we administered an online follow up
survey to the same subject pool as our first survey. The follow up was administered to 225
students from the original 257 student sample.9 All teaching activities were moved to online
distance learning initiatives. We were therefore able to create an online version of our initial
survey and students submitted their survey responses similar to their other course work.
Again, we collaborated with the managers of the student cohorts, this time to share the survey
link to the WeChat groups. The online survey tool allows us to capture precise information
about subjects’ location. We map the provided geolocation coordinates to cities and
provinces across China. A translated screenshot of the online survey is provided in Appendix
Figure 2.
8 In our experiment 130 students (51%) received a simple treatment while the other half acted as our control sample. The treated group of students were asked to read a short (approximately five-minute) excerpt from an article about the “Zodiac birth year” superstition, while the control group read a similar length article excerpt with content about the historical origin of Chinese New Year. This was for our original project on beliefs in luck and investment behavior. Controlling for, or studying sub-groups of within-sample have no economic or statistical effect on our results 9 At the same time, we randomly selected 25 new postgraduate cohorts from WUST for additional survey responses that we can follow into the future for related and follow up work. This sample is currently not part of our analysis. We also conducted follow up studies on our sample focused on beliefs and preferences related to climate change, however these subjects are not included in our main sample.

9
In addition to the questions from our baseline survey, we also included questions on
generalized trust as found in the World Values Survey and Kosse et al. (2020) and Falk et al.
(2018). In addition to the miscalibration exercise from the first wave, we also asked
individuals to provide their probability assessment of future returns, i.e., their return
expectations, of the same indexes listed previously. We also included questions on general
uncertainty and subjects’ experiences with the Coronavirus.
Table 1 provides descriptive statistics on the subjects in our main sample. Panel B
shows the mean values of age, gender and financial literacy score for subjects from Wuhan
and those from other provinces in wave one of our survey. We note that the sample is highly
balanced along these variables.
4. Main results
a. Perceptions of exposure to the Coronavirus pandemic
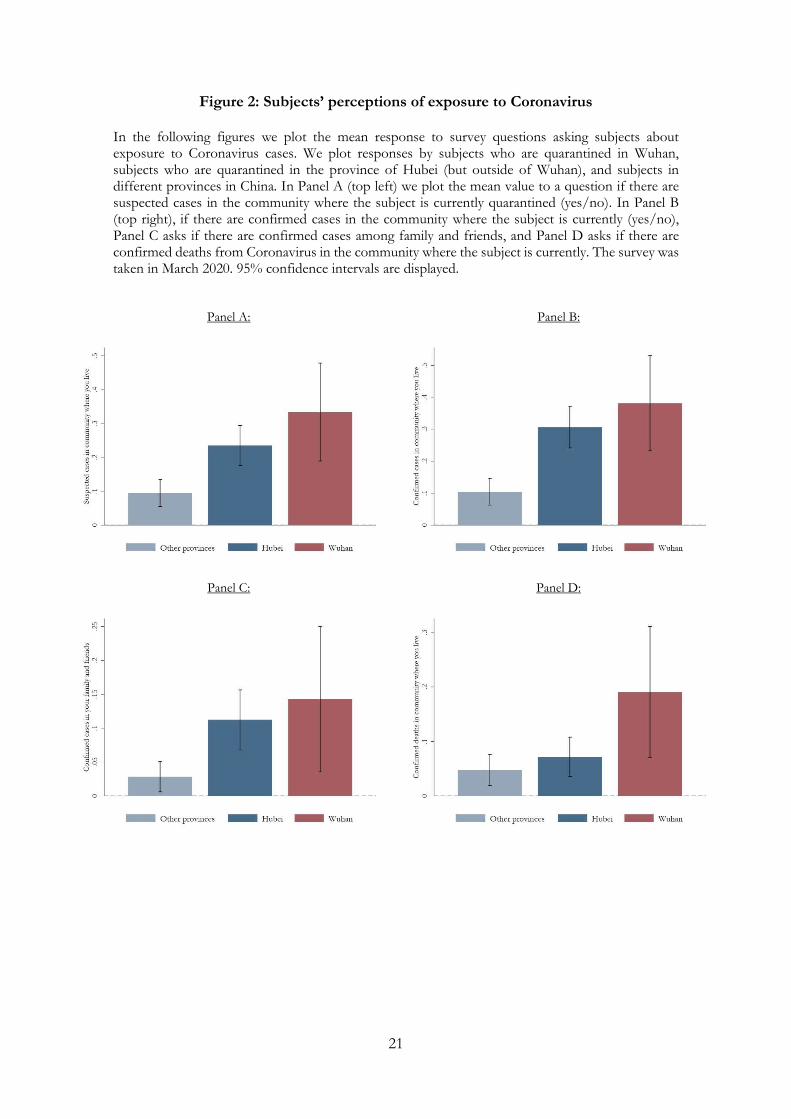
The starting point of our study is to measure how individuals in our sample perceive their
exposure to COVID-19. In Figure 2, we plot the mean response to survey questions asking
subjects about exposure to infection cases. We compare the mean responses from students
who are quarantined in Wuhan with students who are quarantined in the province of Hubei,
outside of Wuhan, and with WUST students who returned to other provinces during
semester and are quarantined in other, less effected, provinces of China. We largely find that
students in Wuhan believe that they have a higher exposure to the Corona virus than students
located elsewhere. Figure 2 plots this result across panels for suspected cases in the
community where the subject is currently quarantined, confirmed cases in the community
where the subject is currently, confirmed cases among family and friends, and confirmed
deaths from Coronavirus in the community where the subject is currently. Table 2 presents
this results in a regression framework. We note that our main analyses uses OLS linear
regressions however our results are robust to nonlinear methods or ordered logit regressions
(as many of the survey questions are on ordinal scales).
The differences in subjective beliefs individuals have about their exposure to
Coronavirus are likely to be realistic. As noted, Figure 1 plots the cumulative infections (blue,
left axis) and deaths (red, right axis) in the Hubei province of China, where Wuhan is located.
The dashed red and blue lines represent the cumulative sum of infections and deaths from
all other provinces in China and are plotted on the same axes. The dashed gray line states the
timing of our follow up survey wave. We note that other provinces experienced a significantly

10
fewer infection cases and deaths compared to Hubei, and Wuhan, the epicenter of the
pandemic, at the time of our follow up survey.
b. Fear of the Coronavirus pandemic
Given that subjects in our sample have varying levels of exposure to the pandemic, we expect
this to result in differences in perceived fear and risk of the virus itself. We test this in Table
3 and plot the results in Figure 3. Panel A displays the mean values of the question ‘do you
think you are likely to become infected with COVID-19?’ Responses are on a scale between
(1) and (5) for ‘very unlikely to ‘very likely.’ Panel B plots the mean values of a question
asking if the subject is afraid of the Coronavirus pandemic. Responses are on a scale between
(1) and (5) for ‘not afraid at all’ to ‘very afraid.’ We find that subjects located in Wuhan during
the quarantine state that they are more likely to be infected with COVID-19, and subjects in
the provinces of Hubei and Wuhan are equally more afraid of the virus in general compared
to those in other provinces.
c. Risk perceptions during the Coronavirus pandemic
Having established that individuals quarantined in Wuhan have higher exposure and more
fear of the pandemic, the natural next step is to examine how subjects perceive risk, and if
their tolerance to risk is affected due to varying exposure and experiences made during the
pandemic.
We first study how differences in exposure affects financial risk taking by eliciting
subjects’ allocation to a risky investment from a hypothetical gamble. This measure of
financial risk taking was elicited in our survey during the Coronavirus pandemic in March
2020. Subjects can chose an amount (0-1000 RMB) to be invested with 50% probability of
a higher return (3000 RMB if all invested) or 50% probability of a loss (0 RMB if all invested).
The alternative investment is a risk free payment (1000 RMB if all invested). We differentiate
between students who are quarantined in Wuhan, versus those who are quarantined at home
in Hubei, and those in different provinces in China. Panel A of Figure 4 shows that subjects
in Wuhan, with greater exposure to the pandemic, allocate significantly less to the risky
gamble. The mean (median) investment across the entire sample is 287.6 (200) RMB. Panel
A of Table 4 highlights cross-sectional differences in exposure in the amount invested. The
variables of interest are indicators for where the subjects are located during March 2020. In
Columns 1 and 3, Hubei is defined as individuals in Hubei and Wuhan (anyone in the

11
province), while in Columns 2, 4, 5, 6 we code the variable as 1 for individuals in Hubei, but
outside of Wuhan. Therefore, Column 1 provides an estimate of the difference in the risky
allocation of subjects in Wuhan relative to those in Hubei. In Columns 2, 4, 5 and 6, we then
quantify the difference between individuals in Wuhan and those in other provinces.10 In
Columns 3-4 we add control variables (gender, age, financial literacy score), and in Column
5 (6) we analyze sub-samples of men (women). We note across the table, subjects in Wuhan
allocate a significant less wealth to the risky financial lottery option. The effect is
economically and statistically significant and represents a 45% decrease in investment relative
to subjects in other provinces. We note that women with greater exposure to the pandemic
in our sample allocate even less to the risky investment compared to those with further
removed experiences. The heterogeneity in risk taking by gender is in line with previous
findings (Croson and Gneezy, 2009; Charness and Gneezy, 2012; Andersen et al., 2020), and
complements recent findings about how gender norms and experiences affect economic
outcomes and forecasts (D’Acunto et al., 2019; D’Acunto, Malmendier and Weber, 2020).
One question which arises is through which mechanism do contemporaneous
experiences affect risk taking? A body of work has documented heterogeneity over the life-
cycle and stability in general preferences (Dohmen et al., 2017; Falk et al., 2018). Recent
literature has focused on potential explanations for changing observed measures of risk
taking. Time-varying risk aversion may be a function of changing emotions, e.g., fear
(Loewenstein et al., 2001; Goetzmann, Kim, and Shiller, 2016; Guiso, Sapienza, and Zingales,
2019), and potentially time-varying beliefs or expectations. The latter has been discussed
broadly, (e.g. Malmendier and Nagel, 2011), however are difficult to pinpoint empirically.
We therefore first investigate how general preferences for risk evolved through the
Coronavirus pandemic. In Panels B and C of Figure 4, we plot the risk preference index
score from two established survey questions on general attitudes to risk. The first question
is a direct translation of the general risk preference question validated by Falk et al., (2016,
2018), ‘In general, how willing are you to take risks?’ The second question is ‘Will you take
more risk this year compared to last year.’ Both questions ask subjects to respond on a scale
of 1 to 5. We combine the answers of both questions into an equally weighted scale which
ranges from 1 (low willingness to take risk) to 5 (high willingness to take risk). These risk
questions are elicited in October 2019, and repeated in March 2020 amongst our panel of
10 In Appendix Table 1, we present all regressions using our Column 1-definition of Hubei and note the relationship is statistically and economically significant. Across columns we also vary the definition of the risky allocation by dropping outliers and removing potential misinterpreted responses. The table shows that excluding these observations, and alternative specifications, have no quantitative effect on our results.

12
subjects. Panel B shows that the total sample of subjects elicited first in Wuhan and later at
the place of the quarantine show a large and significant decrease in risk appetite (an increase
to risk aversion). The decrease amounts to -0.64 on the 5 point scale and is significant at
standard levels (t-stat = -13.09). Given a mean value in wave one of 2.54, this constitutes a
substantial 25.2% decrease. When we consider if subjects in Wuhan compared to those in
other regions further removed from the pandemic, reduce preferences for risk as measured
by our general risk index, we find that all groups seem to decrease equally in their preferences
of risk (Panel C). Our generalized measures of risk do not seem to vary more for subjects
with higher exposure to the pandemic compared to those outside of the most affected
province. This suggests that the observed differences in risk taking, as measured by allocation
decisions, may not be driven solely by changes in general risk preferences. In Panel B of
Table 4 we present these results in a traditional regression framework. Hubei subjects is an
indictor variable which takes the value of one if subjects are quarantined in the Hubei
province, while Wuhan subjects takes the value of one if subjects are quarantined within the
city of Wuhan. Wave two indicates the timing of March 2020 from our second survey wave
and the variables of interest are the interaction of the two location variables with the time
trend. In Columns 3 and 7 the interaction term of Wuhan and Wave two is relative to Hubei
subjects, while in Columns 4 and 8 it is relative to other provinces. We note that while the
coefficients on our variable of interest, Wuhan subjects x wave two, is negative it is not
statistically different from zero. As mentioned, the time trend indicator, wave two, is highly
negative and statistically significant across specifications.
Our results show a large increase in risk aversion from before the Coronavirus
pandemic to its peak in Wuhan. It is plausible that this effect is partially driven by an increase
in fear as attributed to risk taking following the financial crisis of 2007-2009 (Guiso, Sapienza,
and Zingales, 2018). However, as shown in Figures 2 and 3, higher fear and second-hand
experiences (exposure to COVID-19 via family and community) are concentrated among
individuals with higher levels of exposure.11 Two additional, and related channels which we
wish to examine are how optimism, beliefs about luck and fortune, and beliefs about the
economy can influence risk taking. We explore these two channels in the following sections.
11 We note that when we analyze changes in general risk taking by geolocation and second-hand experiences we find complementary evidence that all subjects reduce risk taking, regardless if they have experienced deaths or illnesses within their family and community, within Wuhan as well as in other provinces, however as the sample sizes are smaller the standard errors become large.

13
d. Optimism and beliefs about luck and fortune
As our initial study was formulated to study optimism, beliefs in individuals’ own luck, and
investment decisions, we elicited several measures of these behavioral traits prior to and
during the Coronavirus pandemic. In Table 5 we explore how these measures evolved over
time, and how experience with the pandemic may affect them. Figure 5 presents the results
visually. In Panel A we plot the mean values of an index of optimism created based on
individuals’ belief in good luck from Darke and Freedman (1997),12 which ranges from 0 (low
belief in their own personal luck) to 1 (high belief in their own personal luck). The score was
elicited in October 2019, and repeated in March 2020. As previously, we plot the values for
both periods based on subjects’ exposure, proxied by location in March. We examine the
differences quantitatively in Table 5. As previous, the variables of interest are Hubei subjects,
an indictor variable which takes the value of one if subjects are quarantined in the Hubei
province, Wuhan subjects, which takes the value of one if subjects are quarantined in the city
of Wuhan, and the interaction of the two location variables with the time trend. Across
panels, in Column 3 the interaction term of Wuhan and wave two is relative to Hubei subjects,
while in Column 4 it is relative to other provinces. In Column 2, we note a large decrease for
subjects in Wuhan in their beliefs about how lucky they are personally (7.2 percentage points,
p-value 0.003), while prior to the pandemic their belief in luck was statistically equivalent to
subjects from other provinces. Note that this effect in Column 2 relates the difference to the
average individual across other provinces as well as Hubei. Column 3 relates the difference
to other subjects in Hubei outside of the city of Wuhan. The coefficient here is negative as
expected, but not significant. In Column 4 the coefficient relates the difference in Wuhan to
those in other provinces and outside of Hubei. The effect is -10.2 percentage points with a
p-value < 0.0001.
Panel B similarly plots an index based on questions that ask about the percentage of
investors who would have better luck or higher returns in financial investments. Again, we
note a similar pre-pandemic value for all subjects, for those quarantined in Wuhan we
observe a substantial increase from pre- to the midst of the pandemic, in the fraction of
investors better than the subject (6.8 percentage points, p-value < 0.0001).
Finally, in Panel C we plot the mean value of an index on beliefs about subjects’
control over their own outcomes and luck. The survey questions are based on the Drake
12 The index is created based on statements that subjects agree or disagree with such as ‘I consider myself to be a lucky person;’ ‘I believe in luck;’ and ‘I often feel like it’s my lucky day.’ Further information about the survey can be found in Online Appendix A.

14
Beliefs about Chance (DRC) Inventory (Wood and Clapham, 2005) and contain a battery of
statements such as ‘If I concentrate hard enough I might be able to influence whether I win
when I play (game),’ and ‘If I am well prepared, I have very large likelihood to win a gamble.’
We note that subjects from Wuhan show lower beliefs in their individual sense of control as
measured by the DRC survey statements from pre-pandemic to its peak, relative to subjects
in other provinces. The economic magnitude of the mean effect is significant, -6.9 percentage
points, and is highly statistically significant, p-value = 0.003.
In general, our findings suggest that higher exposure to the Coronavirus pandemic,
and therefore more direct and acute experiences, have a strong negative effect on individuals’
beliefs, optimism, and sense of individual control. We argue that these beliefs are an
important component of risk taking.13 In the following section we examine how exposure to
the pandemic may affect broader beliefs about future economic activity and social
conditions.
e. Beliefs and expectations on economic indicators
Our findings thus far suggest that experiences may affect risk taking acutely through
pessimistic subjective beliefs. A number of recent studies have focused on the importance
of subjective beliefs on economic outcomes (Kuhnen and Miu, 2017; Ameriks et al., 2018;
Giglio et al., 2019; Kuchler and Zafar, 2019; Das, Kuhnen, and Nagel, 2019; Andersen et al.,
2020). In Table 6, we study how subjects in our setting vary in their future expectations on
economic indicators based on their exposure to the Coronavirus pandemic.
We study expectations in two ways: first we measure scale-based survey questions on
future economic outcomes, i.e., ‘compared to last year, China’s economy (your health;
China’s natural environment) will become better in the next 12 months.’ The scale ranges
from (1) to (5) for ‘strongly disagree’ to ‘strongly agree.’ Secondly we ask subjects to assign
probabilities to market returns from 6 scenarios and form a probability distribution. We
create a measure of expected returns using the midpoints of these probability bins for the
Shanghai Stock Exchange index (SSE). All measures were elicited in our March 2020 survey
wave.
13 In Appendix Table 2 we examine to what extent changes in general risk taking and changes in beliefs explain lower risk allocations. Across the table the coefficient on decreases in optimism (and reduced general risk taking) largely correlate with lower risk allocations, however the standard errors are large and the coefficients are not precisely estimated. We do note that the coefficients on our exposure measures, subjects from Hubei and Wuhan, remain economically and statistically significant and absorb the variation from the more pessimistic belief variables confirming that those who reduce their optimism are indeed those with higher exposure.

15
In Figure 7 we plot the mean values of these two types of expectation measures for
subjects quarantined in Wuhan, subjects in Hubei outside of the city of Wuhan, and for
subjects in other provinces of China. We note that subjects currently in Wuhan and therefore
arguably more closely experiencing the Coronavirus pandemic largely form more pessimistic
beliefs in the general economy, social conditions, and financial market indices, relative to
subjects in provinces further removed from the pandemic. Table 7 presents these results. As
these expectations are forward looking, we cannot ascertain if individuals with more acute
experiences provide more accurate responses, perhaps because they have more local and
relevant information, or if they are more likely to provide biased forecasts. In the first wave
of our survey we elicited miscalibration estimates of financial indices rather than forecasts
and found that individuals from different geolocations (prior to their exposure and
experience to the pandemic) did not differ statistically in their responses. Recent evidence
suggests experience may cause subjects to provide more imprecise forecasts (Goldfayn-Frank
and Wohlfart, 2019; Kuchler and Zafar, 2019). However, it is a research area which is
understudied and we hope to revisit this question in future survey waves. In general, our
results show that subjects with higher exposure to the pandemic form more pessimistic
beliefs on the economy, the stock market, their own health, and on the environment, relative
to subjects in further removed provinces.
5. Conclusion
In this paper, we study how risk taking and economic preferences evolve from normal times
to the peak of a worldwide health-crisis. We use repeated survey data from a panel of subjects
based in Wuhan, China. Our identification strategy exploits the fact that winter break for the
semester started on January 11th 2020 and students from other provinces were able to return
to their homes as planned for the Chinese Lunar New Year celebrations, providing quasi-
random variation in the exposure to the pandemic and quarantine conditions individuals
experience across China.
We find that subjects in Wuhan, with objectively higher exposure to the Coronavirus
pandemic, also believe that they have a higher exposure risk to the virus than those elsewhere.
They state higher probabilities that they are likely to be infected, and show higher levels of
fear in the pandemic in general. We then show that subjects more closely experiencing the
pandemic in Wuhan, reduce risk taking in an investment allocation task. At the same time,
experience does not differentially affect general preferences for risk – instead, on average, all
subjects surveyed first in Wuhan and later at their place of quarantine show a large and

16
significant decrease in general risk appetite. We argue that this can be partially explained by
changes in optimism and beliefs about their own luck and sense of control. Furthermore,
higher exposure leads individuals to form more pessimistic beliefs on the economy, their
health, and the environment in general.
Our results present an important contribution to a large literature on risk taking
behavior after large shocks and formative experiences. While we provide confirmatory
evidence that risk taking behavior is indeed an artifact of experiences, we also show that
changes in risk taking seem to be more linked to time-varying beliefs and optimism than
general preferences for risk. In general our results help explain why individual level
experiences have a more pronounced effect on behavior than further removed experiences.
At the same time, our findings provide important supporting evidence for policy decision
making. If observed risk taking of households changes via time-varying beliefs and
expectations, the effects may only be temporary. On the other hand, changes in household
risk taking from more of a general shift in preferences may require policy that are larger, and
more structural, and may reflect a larger impact on long term economic growth.
Our work is an early study on the large consequences we expect to occur from the
global Coronavirus pandemic. Future work in our field and within our own research agenda
will study how these beliefs and preferences further evolve over time, link these measures to
field behavior, and exploit further heterogeneity in personal experiences.

17
References:
Andersen, Steffen, Tobin Hanspal, and Kasper Meisner Nielsen. "Once bitten, twice shy:
The power of personal experiences in risk taking." Journal of Financial Economics 132.3 (2019): 97-117.
Andersen, S., Hanspal, T., Martinez-Correa, J. and Nielsen, K.M., 2020. Beliefs and Behavioral Biases. Working Paper.
Ameriks, J., G. Kézdi, M. Lee, and M.D. Shapiro. 2018. Heterogeneity in expectations, risk tolerance, and household stock shares: The attenuation puzzle. NBER Working Paper, 25269
Binder, C., 2020. Coronavirus Fears and Macroeconomic Expectations. Available at SSRN 3550858.
Bucher-Koenen, T., Ziegelmeyer, M., 2014. Once burned, twice shy? Financial literacy and wealth losses during the financial crisis. Review of Finance 18 (6), 2215-2246.
Brandt, M.W. and Wang, K.Q., 2003. Time-varying risk aversion and unexpected inflation. Journal of Monetary Economics, 50(7), pp.1457-1498.
Brown, J.R., Cookson, J.A. and Heimer, R.Z., 2019. Growing up without finance. Journal of Financial Economics, 134(3), pp.591-616.
Brunnermeier, M.K. and Nagel, S., 2008. Do wealth fluctuations generate time-varying risk aversion? Micro-evidence on individuals. American Economic Review, 98(3), pp.713-36.
Campbell, J.Y. and Cochrane, J.H., 1999. By force of habit: A consumption-based explanation of aggregate stock market behavior. Journal of Political Economy, 107(2), pp.205-251.
Chetty, R. and Szeidl, A., 2016. Consumption commitments and habit formation. Econometrica, 84(2), pp.855-890.
Choi, J. J., Laibson, D., Madrian, B. C., Metrick, A., 2009. Reinforcement learning and savings behavior. Journal of Finance 64 (6), 2515-2534.
Cocco, J.F. and Gomes, F.J., 2012. Longevity risk, retirement savings, and financial innovation. Journal of Financial Economics, 103(3), pp.507-529.
D’Acunto, F., Malmendier, U., Ospina, J. and Weber, M., 2019. Exposure to daily price changes and inflation expectations (No. w26237). National Bureau of Economic Research.
D’Acunto, F., Malmendier, U. and Weber, M., 2020. Gender Roles and the Gender Expectations Gap (No. w26837). National Bureau of Economic Research.
Darke, P.R. and Freedman, J.L., 1997. The belief in good luck scale. Journal of research in personality, 31(4), pp.486-511.
Das, S., C.M. Kuhnen, and S. Nagel. 2019. Socioeconomic status and macroeconomic expectations. The Review of Financial Studies 32 (3), 1148-1187.
Dohmen, T., Falk, A., Golsteyn, B.H., Huffman, D. and Sunde, U., 2017. Risk attitudes across the life course. The Economic Journal.
Elder, T.E., 2013. The predictive validity of subjective mortality expectations: Evidence from the health and retirement study. Demography, 50(2), pp.569-589.
Falk, A., Becker, A., Dohmen, T.J., Huffman, D. and Sunde, U., 2016. The preference survey module: A validated instrument for measuring risk, time, and social preferences. Working Paper
Falk, A., Becker, A., Dohmen, T., Enke, B., Huffman, D. and Sunde, U., 2018. Global evidence on economic preferences. The Quarterly Journal of Economics, 133(4), pp.1645-1692.
Fetzer, T., Hensel, L., Hermle, J. and Roth, C., 2020. Perceptions of Coronavirus Mortality and Contagiousness Weaken Economic Sentiment. arXiv preprint arXiv:2003.03848.

18
Gan, L., Gong, G., Hurd, M. and McFadden, D., 2015. Subjective mortality risk and bequests. Journal of Econometrics, 188(2), pp.514-525.
Giannetti, M., Wang, T. Y., 2016. Corporate scandals and household stock market participation. Journal of Finance 71 (6), 2591-2636.
Giglio, S., M. Maggiori, J. Stroebel, and S. Utkus. 2019. Five facts about beliefs and portfolios. NBER Working Paper, 25744.
Goetzmann, W.N., Kim, D. and Shiller, R.J., 2016. Crash beliefs from investor surveys (No. w22143). National Bureau of Economic Research.
Goldfayn-Frank, O. and Wohlfart, J., 2019. Expectation formation in a new environment: Evidence from the German reunification. Journal of Monetary Economics.
Guiso, L., Sapienza, P., Zingales, L., 2008. Trusting the stock market. Journal of Finance 63 (6), 2557-2600.
Guiso, L., Sapienza, P., Zingales, L., 2018. Time-varying risk aversion. Journal of Financial Economics 128 (3), 403-421.
Hamermesh, D.S., 1985. Expectations, life expectancy, and economic behavior. The Quarterly Journal of Economics, 100(2), pp.389-408.
Heimer, R.Z., Myrseth, K.O.R. and Schoenle, R.S., 2019. YOLO: Mortality beliefs and household finance puzzles. The Journal of Finance, 74(6), pp.2957-2996
Hurd, M.D. and McGarry, K., 2002. The predictive validity of subjective probabilities of survival. The Economic Journal, 112(482), pp.966-985.
Holshue, M.L., DeBolt, C., Lindquist, S., Lofy, K.H., Wiesman, J., Bruce, H., Spitters, C., Ericson, K., Wilkerson, S., Tural, A. and Diaz, G., 2020. First case of 2019 novel coronavirus in the United States. New England Journal of Medicine.
Hoffmann, A., Post, T., 2017. How return and risk experiences shape investor beliefs and preferences. Accounting and Finance 57 (3), 759-788.
Kuchler, T., and B. Zafar. 2019. Personal experiences and expectations about aggregate outcomes. The Journal of Finance 74 (5), 2491-2542.
Kaustia, M., Knüpfer, S., 2008. Do investors overweight personal experience? Evidence from IPO subscriptions. Journal of Finance 63 (6), 2679-2702.
Knüpfer, S., Rantapuska, E. H., Sarvimäki, M., 2017. Formative experiences and portfolio choice: evidence from the Finnish Great Depression. Journal of Finance 72 (1), 133-166.
Kosse, F., Deckers, T., Pinger, P., Schildberg-Hörisch, H. and Falk, A., 2020. The formation of prosociality: causal evidence on the role of social environment. Journal of Political Economy, 128(2), pp.000-000.
Kuhnen, C. M. 2015. Asymmetric learning from financial information. The Journal of Finance 70(5), 2029–2062.
Kuhnen, C. M., and A.C. Miu. 2017. Socioeconomic status and learning from financial information. Journal of Financial Economics 124(2), 349–372.
Kuhnen, C.M., Sarah Rudorf, and Bernd Weber. 2017. The effect of prior choices on expectations and subsequent portfolio decisions. NBER Working Paper, 23438.
Loewenstein, G.F., Weber, E.U., Hsee, C.K. and Welch, N., 2001. Risk as feelings. Psychological bulletin, 127(2), p.267.
Malmendier, U., Nagel, S., 2011. Depression babies: do macroeconomic experiences affect risk taking? Quarterly Journal of Economics 126 (1), 373-416.
Post, T. and Hanewald, K., 2013. Longevity risk, subjective survival expectations, and individual saving behavior. Journal of Economic Behavior & Organization, 86, pp.200-220.
Puri, M. and Robinson, D.T., 2007. Optimism and economic choice. Journal of Financial Economics, 86(1), pp.71-99.
“Novel Coronavirus – China.” World Health Organization, World Health Organization, 13

19
Jan. 2020, www.who.int/csr/don/12-january-2020-novel-coronavirus-china/en/. Wood, W.S. and Clapham, M.M., 2005. Development of the drake beliefs about chance
inventory. Journal of Gambling Studies, 21(4), pp.411-430.

20
Figure 1: Coronavirus infection cases and deaths in the Hubei province and across China
In the following figure we plot the cumulative infections (blue, left axis) and deaths (red, right axis) in the Hubei province of China, where Wuhan is located. The dashed red and blue lines represent the cumulative sum of infections and deaths from all other provinces in China and are plotted on the same axes. The dashed gray line states the timing of our follow up survey wave.
21
Figure 2: Subjects’ perceptions of exposure to Coronavirus In the following figures we plot the mean response to survey questions asking subjects about exposure to Coronavirus cases. We plot responses by subjects who are quarantined in Wuhan, subjects who are quarantined in the province of Hubei (but outside of Wuhan), and subjects in different provinces in China. In Panel A (top left) we plot the mean value to a question if there are suspected cases in the community where the subject is currently quarantined (yes/no). In Panel B (top right), if there are confirmed cases in the community where the subject is currently (yes/no), Panel C asks if there are confirmed cases among family and friends, and Panel D asks if there are confirmed deaths from Coronavirus in the community where the subject is currently. The survey was taken in March 2020. 95% confidence intervals are displayed.
Panel A:
Panel B:
Panel C:
Panel D:

22
Figure 3: Subjects’ self-perceived fear of the Coronavirus pandemic In the following figure we plot subjects’ self-perceived fear of Coronavirus. We plot responses by subjects who are quarantined in Wuhan, subjects who are quarantined in the province of Hubei (but outside of Wuhan), and subjects in different provinces in China In Panel A we plot the mean values of the question ‘do you think you are likely to be infected with COVID-19?’ Responses are on a scale between (1) and (5) for ‘very unlikely to ‘very likely.’ Panel B plots the mean values of a question asking if the subject is afraid of the Coronavirus pandemic. Responses are on a scale between (1) and (5) for ‘not afraid at all’ to ‘very afraid.’ 95% confidence intervals are displayed.
Panel A:
Panel B:

23
Figure 4: Risk taking during the Coronavirus pandemic In the following figures we plot survey measures of risk tolerance. We plot responses by subjects who are quarantined in Wuhan, subjects who are quarantined in the province of Hubei (but outside of Wuhan), and subjects in different provinces in China. In Panel A, we plot the allocation to a risky investment from a hypothetical gamble (0-1000 RMB) elicited in March 2020. In Panel B we plot the mean general risk preferences index score from two survey questions on risk preferences based on survey questions on risk motivated by Falk et al. (2018). The score ranges from 1 (low willingness to take risk) to 5 (high willingness to take risk) and were elicited in October 2019, and repeated in March 2020 amongst a panel of subjects. Panel C plots the mean index of general risk score for all subjects in October 2019, and March 2020, by their exposure to the pandemic proxied by location. 95% confidence intervals are displayed.
Panel A:
Panel B:

24
Panel C:

25
Figure 5: Subjects’ beliefs in optimism during the Coronavirus pandemic
In the following figure we plot subjects’ beliefs about their own luck and relative fortune. We plot responses by subjects who are quarantined in Wuhan, subjects who are quarantined in the province of Hubei (but outside of Wuhan), and subjects in different provinces in China. In Panel A we plot the mean values of an index of belief in individual good luck based on Darke and Freedman (1997), which ranges from 0 (low belief in individual luck) to 1 (high belief in individual luck). The score was elicited in October 2019, and repeated in March 2020 amongst a panel of subjects. Panel B plots an index based on questions that ask about the percentage of investors which have better luck or higher returns than you. Panel C plots mean values of an index on beliefs about subjects’ sense of control based on the Drake Beliefs about Chance Inventory (Wood and Clapham, 2005). 95% confidence intervals are displayed.
Panel A:
Panel B:

26
Panel C:

27
Figure 6: Expectations and beliefs during the Coronavirus pandemic In the following figures we plot survey measures of beliefs and expectations on financial and economic indicators. We plot responses by subjects who are quarantined in Wuhan, subjects who are quarantined in the province of Hubei (but outside of Wuhan), and subjects in different provinces in China. Expectations were elicited in March 2020 amongst a panel of student participants. We measure Panels A, B, and C with scale based survey questions, i.e., ‘compared to last year, China’s economy (your health; China’s natural environment) will become better in the next 12 months.’ The scale ranges from (1) to (5) for ‘strongly disagree’ to ‘strongly agree.’ In Panel D we ask subjects to assign probabilities to market returns from 6 scenarios and form a probability distribution. We create a measure of expected returns using the midpoints of these probability bins and plot the mean values for the Shanghai Stock Exchange index (SSE) (S&P500 and China’s GDP growth are unreported). Expected returns are for November 2019 to November 2020.
Panel A:
Panel B:
Panel C:
Panel D:

28
Table 1: Summary statistics In Panel A, we report descriptive statistics: mean, median, min, and max for all subjects in wave one of the survey questionnaire and who also participate in wave two of the survey (225/257 subjects.). For each individual, we observe demographic characteristics detailed below from October 2019. Panel B reports characteristics by subjects who are quarantined in Wuhan (4), subjects who are quarantined in the province of Hubei (but outside of Wuhan) (3), subjects in different provinces in China (2), and a t-test of differences between subjects in Wuhan and other provinces in China (5). Panel A:
Mean Median Min Max (1) (2) (3) (4) Age 23.24 23.0 22.0 25.0 Male 0.64 1.0 0.0 1.0 Financial literacy score 2.89 3.0 0.0 5.0 Hubei Subjects 0.53 1.0 0.0 1.0 Wuhan subjects 0.09 0.0 0.0 1.0 Subjects 225
Panel B:
Full sample Other provinces Hubei Wuhan t-test (1) (2) (3) (4) (4)-(1) Age 23.24 23.19 23.30 23.24 0.00 (0.93) (0.94) (0.92) (0.94) [0.01] Male 0.64 0.63 0.64 0.71 -0.08 (0.48) (0.48) (0.48) (0.46) [-0.70] Financial literacy score 2.89 2.94 2.83 2.95 -0.07 (1.21) (1.23) (1.19) (1.24) [-0.23] Hubei subjects 0.53 0.00 1.00 1.00 - (0.50) (0.00) (0.00) (0.00) - Wuhan subjects 0.09 0.00 0.00 1.00 - (0.29) (0.00) (0.00) (0.00) - Subjects 225 106 98 21 225

29
Table 2: Subjects’ perceptions of exposure to Coronavirus The following table reports regression results analyzing how subjects’ perceptions of exposure to Coronavirus differ by experience. Hubei subjects is an indictor variable which takes the value of one if subjects are quarantined in the Hubei province, outside of the city of Wuhan. Wuhan subjects takes the value of one if subjects are quarantined in Wuhan. The dependent variable in Column 1 an indicator variable for a survey question if there are suspected cases in the community where the subject is currently quarantined (yes/no). In Column 2 it indicates if there are confirmed cases in the community where the subject is currently (yes/no), Column 3, if there are confirmed cases among family and friends, and Column 4, if there are confirmed deaths from Coronavirus in the community where the subject is currently. The survey was taken in March 2020. Standard errors are clustered at the individual level. * p < .1, ** p < .05, *** p < .01
Dependent variable: Suspected Confirmed Family Deaths (1) (2) (3) (4) Hubei subjects 0.08** 0.14*** 0.20*** 0.02 (0.04) (0.05) (0.06) (0.03) Wuhan subjects 0.11 0.24** 0.28** 0.14 (0.08) (0.11) (0.11) (0.09) R2 0.03 0.05 0.07 0.02 Observations 225 225 225 225
Table 3: Subjects’ self-perceived fear of the Coronavirus pandemic The following table reports regression results analyzing how subjects’ perceptions of exposure to Coronavirus differ by experience. Hubei subjects is an indictor variable which takes the value of one if subjects are quarantined in the Hubei province, outside of the city of Wuhan. Wuhan subjects takes the value of one if subjects are quarantined in Wuhan. The dependent variable in Column 1 an ordinal variable for the survey question ‘do you think you are likely to be infected with COVID-19?’ Responses are on a scale between (1) and (5) for ‘very unlikely to ‘very likely.’ In Column 2 it is a question asking if the subject is afraid of the Coronavirus pandemic. Responses are on a scale between (1) and (5) for ‘not afraid at all’ to ‘very afraid.’ The survey was taken in March 2020. Standard errors are clustered at the individual level. * p < .1, ** p < .05, *** p < .01
Dependent variable: Infected Fear (1) (2) Hubei subjects 0.27 0.30* (0.17) (0.17) Wuhan subjects 0.60** 0.23 (0.28) (0.24) R2 0.02 0.01 Observations 225 225

30
Table 4: Risk taking during the Coronavirus pandemic The following table reports regression results analyzing how risk tolerance is affected by experiencing the Coronavirus pandemic in Wuhan. In Panel A, the dependent variable is the allocation to a risky investment from a hypothetical gamble (0-1000 RMB). In Columns 1 and 3, Hubei is defined as individuals in Hubei and Wuhan (anyone in the province). In Columns 2, 4, 5, 6 it takes the value of 1 for individuals in Hubei, but outside of Wuhan. Column 1 therefore provides an estimate of the difference in the risky allocation between subjects in Wuhan and those in Hubei, whereas in Columns 2, 4, 5, 6 it is the difference between individuals in Wuhan and those in other provinces. Columns 3-4 include controls for gender, age, and financial literacy score. Column 5 (6) focuses on sub-samples of men (women). In Panel B, the explanatory variables are Hubei subjects, an indictor variable which takes the value of one if subjects are quarantined in the Hubei province. Wuhan subjects takes the value of one if subjects are quarantined in the city of Wuhan. Wave two indicates the timing of March 2020 from our second survey wave and the variables of interest are the interaction of the two location variables with the time trend. The dependent variable is a general preferences for risk index score from two survey questions on risk preferences motivated by Falk et al., (2018). The score ranges from 1 (low willingness to take risk) to 5 (high willingness to take risk) and were elicited in October 2019, and repeated in March 2020 amongst a panel of subjects in Wuhan. In Columns 3 and 7 the interaction term of Wuhan and Wave two is relative to Hubei subjects, while in Columns 4 and 8 it is relative to Other provinces. Columns 5-8 include control variables. Standard errors are clustered at the individual level. * p < .1, ** p < .05, *** p < .01
Panel A: Dependent variable: Risky allocation: March 2020 All subjects Men Women (1) (2) (3) (4) (5) (6) Hubei subjects -67.03* -67.03* -64.85 -64.85 -50.40 -88.75 (39.10) (39.10) (39.39) (39.39) (50.84) (65.61) Wuhan subjects -82.74* -149.77*** -84.99* -149.83*** -128.56** -212.24** (42.40) (45.67) (43.40) (46.34) (49.93) (102.22) Financial literacy score 7.76 7.76 13.19 -7.35 (14.85) (14.85) (20.63) (21.32) Male 7.54 7.54 - - (38.13) (38.13) Age -12.63 -12.63 -28.95 20.33 (18.91) (18.91) (22.49) (33.48) R2 0.03 0.03 0.03 0.03 0.04 0.05 Observations 225 225 225 225 145 80
Panel B:
Dependent variable: General risk preferences (1) (2) (3) (4) (5) (6) (7) (8) Wave two -0.64*** -0.59*** -0.59*** -0.59*** -0.64*** -0.60*** -0.60*** -0.60*** (0.05) (0.07) (0.07) (0.07) (0.05) (0.07) (0.07) (0.07) Hubei subjects 0.07 0.13 0.13 0.07 0.13 0.13 (0.11) (0.11) (0.11) (0.11) (0.11) (0.11) Hubei subjects x Wave two -0.09 -0.08 -0.08 -0.09 -0.08 -0.08 (0.10) (0.10) (0.10) (0.10) (0.10) (0.10) Wuhan subjects -0.35* -0.22 -0.35* -0.22 (0.19) (0.19) (0.19) (0.19) Wuhan subjects x Wave two -0.05 -0.12 -0.04 -0.12 (0.20) (0.19) (0.20) (0.19) Controls No No No No Yes Yes Yes Yes R2 0.16 0.16 0.18 0.18 0.17 0.17 0.18 0.18 Observations 450 450 450 450 450 450 450 450

31
Table 5: Beliefs in optimism and sense of control during the Coronavirus pandemic The following table reports regression results analyzing how beliefs in individual luck are affected by experiencing the Coronavirus pandemic in Wuhan. The explanatory variables are Hubei subjects, an indictor variable which takes the value of one if subjects are quarantined in the Hubei province. Wuhan subjects takes the value of one if subjects are quarantined in the city of Wuhan. Wave two indicates the timing of March 2020 from our second survey wave and the variables of interest are the interaction of the two location variables with the time trend. The dependent variable in Panel A is an index of belief in good luck based on Darke and Freedman (1997), which ranges from 0 (low belief in personal luck) to 1 (high belief in luck). In Panel B it is an index based on questions that ask about the percentage of investors which have better luck or higher returns than you, and in Panel C an index on beliefs about subjects’ sense of control based on the Drake Beliefs about Chance Inventory (Wood and Clapham, 2005). Scores was elicited in October 2019, and repeated in March 2020 amongst a panel of student participants in Wuhan. Across panels, in Column 3 the interaction term of Wuhan and Wave two is relative to Hubei subjects, while in Column 4 it is relative to Other provinces.
Standard errors are clustered at the individual level. * p < .1, ** p < .05, *** p < .01
Panel A:
Dependent variable: Good luck (1) (2) (3) (4) Wave two -0.02*** -0.05*** -0.02*** -0.02*** (0.01) (0.01) (0.01) (0.01) Hubei subjects 0.00 -0.00 -0.00 (0.02) (0.02) (0.02) Hubei subjects x Wave two -0.07*** -0.06*** -0.06*** (0.01) (0.01) (0.01) Wuhan subjects 0.01 0.02 0.01 (0.03) (0.03) (0.03) Wuhan subjects x Wave two -0.07*** -0.04 -0.10*** (0.02) (0.03) (0.02) Controls Yes Yes Yes Yes R2 0.09 0.06 0.09 0.09 Observations 450 450 450 450
Panel B: Dependent variable: Worse luck (1) (2) (3) (4) Wave two 0.02*** 0.05*** 0.02*** 0.02*** (0.01) (0.01) (0.01) (0.01) Hubei subjects 0.01 0.01 0.01 (0.02) (0.02) (0.02) Hubei subjects x Wave two 0.06*** 0.06*** 0.06*** (0.01) (0.01) (0.01) Wuhan subjects 0.03 0.03 0.04 (0.04) (0.05) (0.04) Wuhan subjects x Wave two 0.04** 0.00 0.07*** (0.02) (0.02) (0.02) Controls Yes Yes Yes Yes R2 0.07 0.06 0.07 0.07 Observations 450 450 450 450

32
Panel C:
Dependent variable: Sense of control (1) (2) (3) (4) Wave two 0.01 -0.02*** 0.01 0.01 (0.01) (0.01) (0.01) (0.01) Hubei subjects -0.00 0.01 0.01 (0.02) (0.02) (0.02) Hubei subjects x Wave two -0.06*** -0.06*** -0.06*** (0.01) (0.01) (0.01) Wuhan subjects -0.06 -0.06* -0.05 (0.04) (0.04) (0.04) Wuhan subjects x Wave two -0.04* -0.01 -0.07*** (0.02) (0.02) (0.02) Controls Yes Yes Yes Yes R2 0.06 0.06 0.07 0.07 Observations 450 450 450 450

33
Table 6: Expectations and beliefs during the Coronavirus pandemic The following table reports regression results analyzing how expectations and beliefs on aggregate outcomes differ by experience. Hubei subjects is an indictor variable which takes the value of one if subjects are quarantined in the Hubei province, outside of the city of Wuhan. Wuhan subjects takes the value of one if subjects are quarantined in Wuhan. Expectations were elicited in March 2020 amongst a panel of student participants in Wuhan. The dependent variable in Column 1 (2) (3) are scale-based survey questions, i.e., ‘compared to last year, China’s economy (your health; China’s natural environment) will become better in the next 12 months.’ The scale ranges from (1) to (5) for ‘strongly disagree’ to ‘strongly agree.’ Column 4 asks subjects to assign probabilities to market returns from 6 scenarios and form a probability distribution. We create a measure of expected returns using the midpoints of these probability bins and plot the mean values for the Shanghai Stock Exchange index (SSE). Expected returns are for November 2019 to November 2020. Standard errors are clustered at the individual level. * p < .1, ** p < .05, *** p < .01
Dependent variable: Economy Health Environment SSE (1) (2) (3) (4) Hubei subjects -0.30* -0.48*** -0.43*** -0.02 (0.16) (0.17) (0.16) (0.02) Wuhan subjects -0.47** -0.62** -0.84*** -0.03 (0.22) (0.28) (0.23) (0.02) Controls Yes Yes Yes Yes R2 0.03 0.06 0.07 0.02 Observations 225 225 225 225

34
Appendix for
“Risk Taking during a Global Crisis: Evidence from Wuhan”
Appendix Figure 1: October 2019 survey sessions in Wuhan, China The figures below show pencil and paper survey wave one sessions at WUST in October 2019.

35

36
Appendix Figure 2: Online survey conducted in March 2020 The figures below shows an example screen from the online wave two survey (translated into English) while subjects are in quarantined.

37
Appendix Table 1: Risk allocation during the Coronavirus pandemic The following table reports regression results analyzing how risk tolerance is affected by experiencing the Coronavirus pandemic in Wuhan. The dependent variable is the allocation to a risky investment from a hypothetical gamble (0-1000 RMB). In Columns 1, 3, 5, and 7 Hubei is defined as individuals in Hubei and Wuhan (anyone in the province). In Columns 2, 4, 6, and 8 the variable Hubei takes the value of 1 for individuals in Hubei, but outside of Wuhan. In Columns 1-2 the risky allocation variable is our baseline measure where we recode 13 observations with missing values in the risky lottery, but 1000 allocated to the safe lottery as zero. In Columns 3-4 we omit 4 observations where the risky allocation was stated as greater than 1000 (these are top coded to 1000 in Columns 1-2). In Columns 5-6 we omit these top coded observations. In Columns 7-8 we omit all of the previous mentioned observations. Standard errors are clustered at the individual level. * p < .1, ** p < .05, *** p < .01
Dependent variable: Risky allocation: March 2020 (1) (2) (3) (4) (5) (6) (7) (8) Hubei subjects -64.85 -64.85 -55.37 -55.37 -66.37* -66.37* -62.52 -62.52 (39.39) (39.39) (35.58) (35.58) (37.38) (37.38) (39.99) (39.99) Wuhan subjects -84.99* -149.83*** -69.99* -125.36*** -79.28* -145.65*** -89.11* -151.63*** (43.40) (46.34) (41.58) (45.11) (42.07) (45.81) (45.80) (48.07) Controls Yes Yes Yes Yes Yes Yes Yes Yes R2 0.03 0.03 0.03 0.03 0.03 0.03 0.03 0.03 Observations 225 225 221 221 225 225 212 212

38
Appendix Table 2: Risk allocation during the Coronavirus pandemic The following table reports regression results analyzing how risk tolerance is affected by experiencing the Coronavirus pandemic in Wuhan. The dependent variable is the allocation to a risky investment from a hypothetical gamble (0-1000 RMB). We control for the October 2019 to March 2020 change in general risk preference score as well as changes in optimism and beliefs in luck. In Columns 4-6 the variable Hubei takes the value of 1 for individuals in Hubei, but outside of Wuhan. Standard errors are clustered at the individual level. * p < .1, ** p < .05, *** p < .01
Dependent variable: Risky allocation: March 2020 (1) (2) (3) (4) (5) (6) Decrease in risk tolerance score -61.49 -66.24 -66.22 -61.09 -63.58 -64.83 (45.96) (44.34) (44.04) (45.16) (43.54) (43.57) Decrease in beliefs in good luck -33.41 -4.06 (40.27) (40.20) Increase in beliefs of worse luck -7.19 41.42 (38.14) (40.50) Decrease in control over luck -4.07 29.65 (36.77) (39.28) Hubei subjects -62.02 -82.01** -73.64* (39.15) (41.50) (42.37) Wuhan subjects -142.84*** -166.97*** -156.32*** (48.17) (50.01) (48.17) Control variables Yes Yes Yes Yes Yes Yes R2 0.02 0.02 0.02 0.04 0.05 0.05 Observations 225 225 225 225 225 225

39
Online Appendix A: Sample survey questions translated into English
Belief on good luck Darke and Freedman (1997)
Likert-scale which ranges from strongly disagree (1) … strongly agree (5).
Some people are consistently lucky, and others are unlucky. I consider myself to be a lucky person. I believe in luck. I often feel like it’s my lucky day. Nobody can win at games of chance in the long-run. I consistently have good luck. It’s a mistake to base any decisions on how lucky you feel. Luck works in my favour, especially this year. I don’t mind leaving things to chance because I’m a lucky person. Even the things in life I can’t control tend to go my way because I’m lucky. In general I am lucky. There is such a thing as luck that favours some people, but not others. Luck is nothing more than random chance.
Beliefs about luck
If you make investment on stocks this year, what percentage of other investors have better luck than you at investing stocks with above average performance? (Please give a number between 0% and 100%)
If you make investment on stocks this year, what percentage of other investors had higher returns than you? (Please give a number between 0% and 100%)
Control over luck Drake Beliefs about Chance Inventory; Wood and Clapham (2005)
Participants indicate the extent of their agreement using Likert-scale which ranges from strongly disagree (1) … strongly agree (5).
If I well prepared, I would have very large likelihood to win a gamble. Some gamblers are just born lucky. The longer I’ve been losing, the more likely I am to win. The chances of winning a substantial amount of money at the Casino are quite high I think I’ll win a good prize in sport lottery (over $10,000) one day One day I’m going to strike it lucky at gambling If I concentrated hard enough I might be able to influence whether I win when I play the pokies I can/could stick to a budget when/if I gamble
Risk taking Falk et al., (2018)
Risk measures were elicited through two qualitative questions and one quantitative question:
In general, how willing are you to take risks? On a scale of 1(not willing at all) - 5(very willing to)
Will you take more risk this year compared to last year? On a scale of 1(less risk) - 5 (more risk)
Imagine you have an extra 1,000 yuan in your pocket, and you have to options with how to use it:

40
a. Use an amount of the money to invest in a lottery (with a 50% chance that you can win up to 2,000 yuan (including the principal of 1,000 yuan), and a 50% chance of zero additional winnings)
b. Don’t make any investment.
Please fill in the following boxes how you will allocate the 1,000 yuan in these two options:
_____Yuan in lottery investments _____ Yuan in keep in cash
Economy expectations
All questions on scale of strongly disagree (1) … strongly agree (5). Compared to last year, China’s economy will become better in the next 12 months Compared with last year, my health will be better in the next 12 months Compared with last year, China’s natural environment will become better in the next 12 months
Stock market expectations
Stock market expectations: in the following we present you with 6 scenarios of how the annual percentage change of stock indices could be during this year (between Nov 2020-Nov 2021). Please indicate how likely you think the individual scenarios are. Assign a probability to each of the scenarios, and make sure the sum of the probability to be 100%. Shanghai Stock exchange index
-20% -10-20% 0-10% 0 +10 % 10-20% +20%
Questions on trust WVS; Kosse et al., (2020) All questions on scale of strongly disagree (1) … strongly agree (5).
In general, the vast majority of people in the society can be trusted In general, no one else can be trusted, I can only rely on myself We’d better stay vigilant when dealing with strangers Others treat me with good intentions Additional questions Are there confirmed COVID-19 cases among your family member and friends? Yes/no Are there any confirmed COVID-19 cases in the community where you currently live? Yes/no Are there any suspected cases in the community where you currently live? Yes/no Has anyone in your community died from the COVID-19? Yes/no Are you afraid of this epidemic?
1)Not afraid at all …… 5)Very afraid Do you think you are likely to be infected with COVID-19?
1)Very unlikely …… 5)Very likely
![Market Declines and Volatility - Unbranded (7) [Read-Only] Management... · 2020-07-01 · 7kh 0dunhw¶v 5hvsrqvh wr &ulvlv ,q 86 grooduv 5hsuhvhqwv fxpxodwlyh wrwdo uhwxuqv ri d](https://img.dokumen.tips/doc/110x75/5f465ca83d97ff2ec730aade/market-declines-and-volatility-unbranded-7-read-only-management-2020-07-01.jpg)

![$QGUHZ 3 )HLQEHUJ 0 ' 0 3 + '(02*5$3+,& $1' 3(5621$/ ,1 ... · 7uhqw - 0how]hu 3 5rvhqeoxp 0 +duvk * .lq]ohu . 0dvkdo 5 )hlqehuj $3 dqg 9rjhovwhlq % (ylghqfh iru uhduudqjhphqw dpsolilfdwlrq](https://img.dokumen.tips/doc/110x75/600a4226c936db609a729aac/qguhz-3-hlqehuj-0-0-3-0253-1-35621-1-7uhqw-0howhu.jpg)


![¢&ULVLV ¿QDQFLHUD R GH JHVWLyQ Evolución … · GHQ D OR PHUDPHQWH ¿QDQFLHUR Para comprender el problema desde ... competencias en materia de salud, fa-FXOWiQGRORV SDUD RUJDQL]DU](https://img.dokumen.tips/doc/110x75/5ba3e8e709d3f2c0278c6ad6/ulvlv-qdqflhud-r-gh-jhvwlyq-evolucion-ghq-d-or-phudphqwh-qdqflhur-para.jpg)


