Embed Size (px)
Citation preview

© 1999 Macmillan Magazines Ltd
letters to nature
344 NATURE | VOL 397 | 28 JANUARY 1999 | www.nature.com
failure of mantle rocks at the site where slab pull (as indicated byfocal mechanism analysis27) results in fracturing at the stressmaximum near the expected oceanic brittle±ductile transition(500±700 8C).
Our seismic images of the central Andes show striking similaritieswith re¯ection data obtained by the LITHOPROBE group6,7 at theplate boundary between the oceanic Juan de Fuca plate and theNorth American continent, although our study penetrates to largerdepths. Deep re¯ections from the Vancouver island experiment at30±40 km depth were initially interpreted as the image of the shearzone at the top of the relatively young oceanic plate beneath theNorth American continent6. Subsequent discussion that integratednewly acquired offshore re¯ection data and magnetotelluric datahas equally included the possibility of ¯uids trapped at the base ofaccreted terranes28 or within the subduction boundary itself 29.
The Nazca re¯ector and the active seismicity image differentparts of the northern Chilean subduction zone. They are transientfeatures that are probably due to the ¯uid-associated petrologicalprocesses that are driven by continuing subduction and the relatedthermal regime. M
Received 16 January; accepted 4 November 1998.
1. Isacks, B., Oliver, J. & Sykes, L. R. Seismology and the new global tectonics. J. Geophys. Res. 73, 5855±
5899 (1968).2. Dewey, J. F. & Bird, J. M. Mountain belts and the new global tectonics. J. Geophys. Res. 75, 2625±2647
(1970).
3. Davey, F. J. & Stern, T. A. Crustal seismic observations across the convergent plate boundary, North
Island, New Zealand. Tectonophysics 173, 283±296 (1990).4. Lundberg, N., Reed, D. L., Liu, C.-S. & Lieske, J. Jr Forearc-basin closure and arc accretion in the
submarine suture zone south of Taiwan. Tectonophysics 274, 5±23 (1997).
5. Snyder, D. B. et al. A dual doubly vergent orogen in the Banda Arc continent-arc collision zone as
observed on deep seismic re¯ection pro®les. Tectonics 5, 34±53 (1996).
6. Green, A. G. et al. Seismic re¯ection imaging of the subducting Juan de Fuca plate. Nature 319, 210±213 (1986).
7. Clowes, R. M., Yorath, C. J. & Hyndman, R. D. Re¯ection mapping across the convergent margin of
western Canada. Geophys. J .R. Astron. Soc. 89, 79±84 (1987).
8. Kirby, S., Engdahl, E. R. & Denlinger, R. in Subduction Top to Bottom 195±214 (eds Bebout, G. E.,
Scholl, D. W., Kirby, S. H. & Platt, J. P.) (Geophys. Monogr. 96, Am. Geophys. Union, Washington DC,1996).
9. Wigger, P. J. et al. in Tectonics of the Southern Central Andes (eds Reutter, K.-J., Scheuber, E. & Wigger,
P. J.) (Springer, Berlin, 1994).
10. CINCA Working Group in Abstr. Vol. III, VIII, Congreso Geologico Chileno 1818±1822 (Universidad
Catolica del Norte, Antofagasta, 1997).11. v. Huene, R., Weinrebe, W. & Heeren, F. Subduction erosion along the northern Chile margin.
J. Geodyn. (in the press).
12. Rutland, R. W. R. Andean orogeny and ocean ¯oor spreading. Nature 233, 252±255 (1971).
13. Lamb, S., Hoke, L., Kennan, L. & Dewey, J. in Orogeny through Time (eds Burg, J. P. & Ford, M.) 237±
264 (Spec. Publ. 121, Geol. Soc., London, 1997).14. DeMets, C., Gordon, R. G., Argus, D. F. & Stein, S. Current plate motions. Geophys. J. Int. 101, 425±
478 (1990).
15. Cahill, T. & Isacks, B. L. Seismicity and shape of the subducted Nazca plate. J. Geophys. Res. 97, 17503±
17529 (1992).
16. Beck, S. L. et al. Crustal-thickness variation in the central Andes. Geology 24, 407±410 (1996).17. Comte, D., Roecker, S. W. & SuaÂrez, G. Velocity structure in northern Chile: evidence of subducted
oceanic crust in the Nazca Plate. Geophys. J. Int. 117, 625±639 (1994).
18. Engdahl, E. R., Van der Hilst, R. D. & Buland, R. P. Global teleseismic earthquake relocation with
improved travel times and procedures for depth determination. Bull. Seismol. Soc. Am. 88, 722±743
(1998).19. Poli, S. & Schmidt, M. W. H2O transport and release in subduction zones: experimental constraints on
basaltic and andesitic systems. J. Geophys. Res. B 100(11), 22299±22314 (1995).
20. Peacock, S. M. Thermal effect of metamorphic ¯uids in subduction zones. Geology 15, 1057±1060
(1987).
21. ToksoÈz, M. N., Minear, J. W. & Julian, B. R. Temperature ®eld and geophysical effects of a downgoingslab. J. Geophys. Res. 76, 1113±1138 (1971).
22. Springer, M. Heat ¯ow density pattern and implications for the thermal structure of the Central
Andean crust. Tectonophysics (submitted).
23. Ulmer, P. & Trommsdorff, V. Serpentine stability to mantle depths and subduction-related magma-tism. Science 268, 858±861 (1995).
24. Echternacht, F. et al. Electromagnetic study of the active continental margin in northern Chile. Phys.
Earth Planet. Inter. 102, 69±88 (1997).
25. Liu, J., Bohlen, S. R. & Ernst, W. G. Stability of hydrous phases in subducting oceanic crust. Earth
Planet. Sci. Lett. 143, 161±171 (1996).26. Pawley, A. R. & Holloway, J. R. Water sources for subduction zone volcanism: new experimental
constraints. Science 260, 664±667 (1993).
27. Comte, D. & SuaÂrez, G. Stress distribution and geometry of the subducting Nazca plate in northern
Chile using teleseismically recorded earthquakes. Geophys. J. Int. 122, 419±440 (1995).
28. Hyndman, R. D. Dipping seismic re¯ectors, electrically conductive zones, and trapped water in thecrust over a subducting plate. J. Geophys. Res. B 93(11), 13391±13405 (1988).
29. Calvert, A. J. & Clowes, R. M. Deep, high-amplitude re¯ections from a major shear zone above the
subducting Juan de Fuca plate. Geology 118, 1091±1094 (1990).
30. Dietz, L. D. & Ellsworth, W. L. The October 17, 1989, Loma Prieta, California, earthquake and its
aftershocks: geometry of the sequence from high-resolution locations. Geophys. Res. Lett. 17, 1417±1420 (1990).
Acknowledgements. We thank the Chilean Navy for providing a vessel for ®ring the marine shots. We alsothank the following for logistical support: the mining companies CompanÄia Minera Punta de Lobos SA,
CompanÄia Minera DonÄa IneÂs de Collahuasi and CompanÄia Quebrada Blanca, and the local authoritiesCarabineros de Chile, Zona de Tarapaca y Antofagasta (Retenes de OllaguÈe, Ujina), Instituto Geogra®coMilitar La Paz and Ministerio de Hacienda y Desarrollo Econo mico, Secretaia Nacional de Minera,Bolivia. A great deal of the success of this project is due to the more than 100 helpers and ®eld operatorsfrom all three countries. This Letter bene®ted substantially from constructive criticism by R. Clowes. TheANCORP '96 project was funded by the Bundesministerium fuÈr Bildung, Wissenschaft, Forschung undTechnologie (BMBF, Bonn) within the DEKORP programme (Deutsches Kontinentales Re¯exionsseis-misches Program) and by the Deutsche Forschungsgemeinschaft (DFG, Bonn) within the CollaborativeResearch Center 267 (SFB 267ÐDeformationsprozesse in den Anden).
Correspondence and requests for materials should be addressed to O.O. (e-mail: [email protected]).
Highgenomicdeleteriousmutation rates inhominidsAdam Eyre-Walker* & Peter D. Keightley²
* Centre for the Study of Evolution and School of Biological Sciences,University of Sussex, Brighton, West Sussex BN1 9QG, UK² Institute of Cell, Animal and Population Biology, University of Edinburgh,
West Mains Road, Edinburgh EH9 3JT, UK. . . . . . . . . . . . . . . . . . . . . . . . . . . . . . . . . . . . . . . . . . . . . . . . . . . . . . . . . . . . . . . . . . . . . . . . . . . . . . . . . . . . . . . . . . . . . . . . . . . . . . . . . . . . . . . . . . . . . . . . .
It has been suggested that humans may suffer a high genomicdeleterious mutation rate1,2. Here we test this hypothesis byapplying a variant of a molecular approach3 to estimate thedeleterious mutation rate in hominids from the level of selectiveconstraint in DNA sequences. Under conservative assumptions,we estimate that an average of 4.2 amino-acid-altering mutationsper diploid per generation have occurred in the human lineagesince humans separated from chimpanzees. Of these mutations,we estimate that at least 38% have been eliminated by naturalselection, indicating that there have been more than 1.6 newdeleterious mutations per diploid genome per generation. Thus,the deleterious mutation rate speci®c to protein-coding sequencesalone is close to the upper limit tolerable by a species such ashumans that has a low reproductive rate4, indicating that theeffects of deleterious mutations may have combined synergistically.Furthermore, the level of selective constraint in hominid protein-coding sequences is atypically low. A large number of slightlydeleterious mutations may therefore have become ®xed inhominid lineages.
It has been estimated that there are as many as 100 new mutationsin the genome of each individual human1. If even a small fraction ofthese mutations are deleterious and removed by selection, it isdif®cult to explain how human populations could have survived. Ifthe effects of mutations act in a multiplicative manner, the propor-tion of individuals that become selectively eliminated from thepopulation (proportion of `genetic deaths'5) is 1 2 e 2 U (ref. 4),where U is the deleterious mutation rate per diploid, so a high rateof deleterious mutation (U q 1) is paradoxical in a species with alow reproductive rate. Furthermore, if a signi®cant fraction of newmutations is mildly deleterious, these may accumulate in popula-tions with small effective sizes, or in populations in which selectionhas been relaxed, leading to a gradual decline in ®tness2,6. It has beenargued that an accumulation of mildly deleterious mutant allelescould have long-term consequences for human health2.For inbreeding plants, indirect estimates for U approach 1 (ref. 7),but these estimates assume that variation is maintained solely by abalance between mutation and selection. Results of studiesof mutation accumulation in Drosophila also suggest values for Uapproaching or exceeding 1 (ref. 8), but mutations with smalleffects, perhaps crucial for evolution, cannot be detected on thebasis of measured phenotypic differences, and the validity of theexperimental controls has been challenged9. There are no directestimates of U for mammals or other vertebrates.
Here we use a variation of a molecular method3 to estimate U inhominids. By using related species, whose time of divergence from acommon ancestor is known, one can, in theory, estimate U by
© 1999 Macmillan Magazines Ltd
letters to nature
NATURE | VOL 397 | 28 JANUARY 1999 | www.nature.com 345
measuring the level of divergence between DNA sequences of relatedspecies for a random sample of DNA sequences, and comparing thiswith divergence of non-functional sequences. In non-functionalregions of the genome, the rate of nucleotide substitution is equal tothe mutation rate10. Random samples of the genome will includefunctionally important regions under selective constraint (forexample, protein-coding sequences), and will show slower evolu-tion, as a proportion of mutations in these regions will be rejectedby selection. U is estimated from the difference between thedivergences in a non-functional region and a random DNAsample. For example, zero divergence for the random DNAsample would imply complete constraint, and a deleterious muta-tion rate equal to the neutral mutation rate. The method thereforehas its roots in the neutral theory of molecular evolution10. Adif®culty with this approach is that mutation rates may differacross the genome11. However, we can apply a modi®ed approachto estimate the deleterious mutation rate in protein-codingsequences alone. We assume, conservatively, that synonymousmutations are neutral in hominids; the synonymous substitutionrate can therefore be used as an estimate of the mutation rate foreach gene.
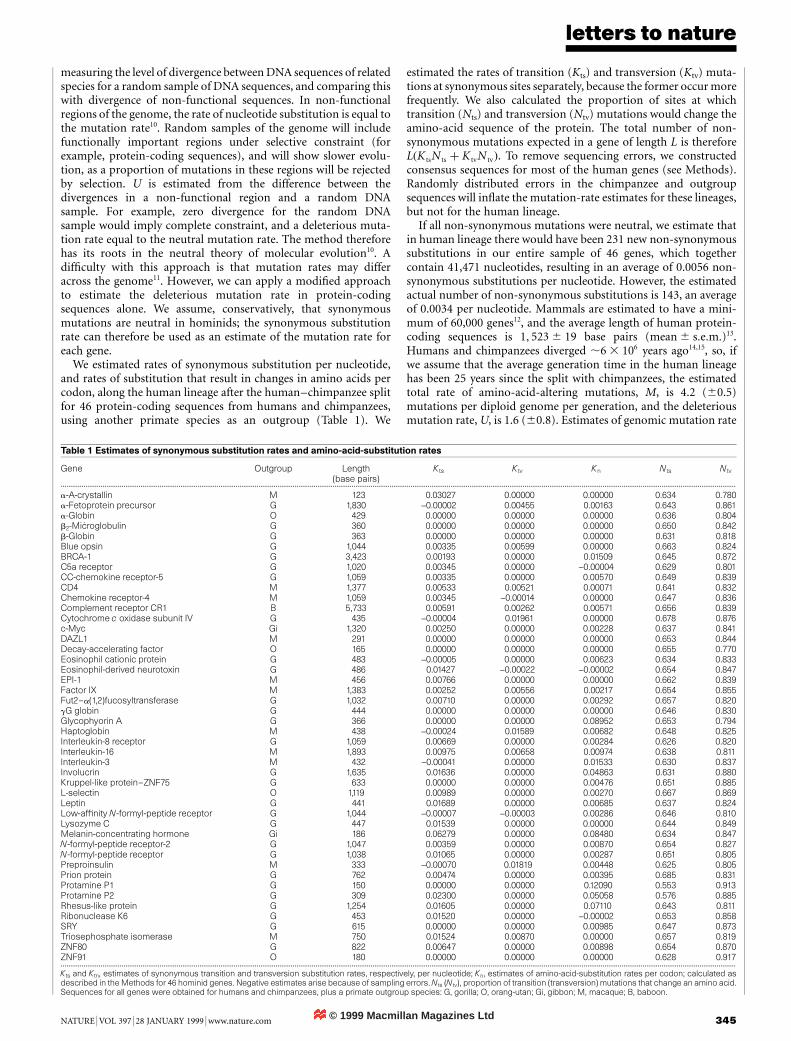
We estimated rates of synonymous substitution per nucleotide,and rates of substitution that result in changes in amino acids percodon, along the human lineage after the human±chimpanzee splitfor 46 protein-coding sequences from humans and chimpanzees,using another primate species as an outgroup (Table 1). We
estimated the rates of transition (Kts) and transversion (Ktv) muta-tions at synonymous sites separately, because the former occur morefrequently. We also calculated the proportion of sites at whichtransition (Nts) and transversion (Ntv) mutations would change theamino-acid sequence of the protein. The total number of non-synonymous mutations expected in a gene of length L is thereforeL�K tsN ts � K tvN tv�. To remove sequencing errors, we constructedconsensus sequences for most of the human genes (see Methods).Randomly distributed errors in the chimpanzee and outgroupsequences will in¯ate the mutation-rate estimates for these lineages,but not for the human lineage.
If all non-synonymous mutations were neutral, we estimate thatin human lineage there would have been 231 new non-synonymoussubstitutions in our entire sample of 46 genes, which togethercontain 41,471 nucleotides, resulting in an average of 0.0056 non-synonymous substitutions per nucleotide. However, the estimatedactual number of non-synonymous substitutions is 143, an averageof 0.0034 per nucleotide. Mammals are estimated to have a mini-mum of 60,000 genes12, and the average length of human protein-coding sequences is 1; 523 6 19 base pairs (mean 6 s:e:m:)13.Humans and chimpanzees diverged ,6 3 106 years ago14,15, so, ifwe assume that the average generation time in the human lineagehas been 25 years since the split with chimpanzees, the estimatedtotal rate of amino-acid-altering mutations, M, is 4.2 (60.5)mutations per diploid genome per generation, and the deleteriousmutation rate, U, is 1.6 (60.8). Estimates of genomic mutation rate
Table 1 Estimates of synonymous substitution rates and amino-acid-substitution rates
Gene Outgroup Length(base pairs)
Kts Ktv Kn Nts Ntv
...................................................................................................................................................................................................................................................................................................................................................................
a-A-crystallin M 123 0.03027 0.00000 0.00000 0.634 0.780a-Fetoprotein precursor G 1,830 -0.00002 0.00455 0.00163 0.643 0.861a-Globin O 429 0.00000 0.00000 0.00000 0.636 0.804b2-MicÇ roglobulin G 360 0.00000 0.00000 0.00000 0.650 0.842b-Globin G 363 0.00000 0.00000 0.00000 0.631 0.818Blue opsin G 1,044 0.00335 0.00599 0.00000 0.663 0.824BRCA-1 G 3,423 0.00193 0.00000 0.01509 0.645 0.872C5a receptor G 1,020 0.00345 0.00000 -0.00004 0.629 0.801CC-chemokine receptor-5 G 1,059 0.00335 0.00000 0.00570 0.649 0.839CD4 M 1,377 0.00533 0.00521 0.00071 0.641 0.832Chemokine receptor-4 M 1,059 0.00345 -0.00014 0.00000 0.647 0.836Complement receptor CR1 B 5,733 0.00591 0.00262 0.00571 0.656 0.839Cytochrome c oxidase subunit IV G 435 -0.00004 0.01961 0.00000 0.678 0.876c-Myc Gi 1,320 0.00250 0.00000 0.00228 0.637 0.841DAZL1 M 291 0.00000 0.00000 0.00000 0.653 0.844Decay-accelerating factor O 165 0.00000 0.00000 0.00000 0.655 0.770Eosinophil cationic protein G 483 -0.00005 0.00000 0.00623 0.634 0.833Eosinophil-derived neurotoxin G 486 0.01427 -0.00022 -0.00002 0.654 0.847EPI-1 M 456 0.00766 0.00000 0.00000 0.662 0.839Factor IX M 1,383 0.00252 0.00556 0.00217 0.654 0.855Fut2Ða(1,2)fucosyltransferase G 1,032 0.00710 0.00000 0.00292 0.657 0.820gG globin G 444 0.00000 0.00000 0.00000 0.646 0.830Glycophyorin A G 366 0.00000 0.00000 0.08952 0.653 0.794Haptoglobin M 438 -0.00024 0.01589 0.00682 0.648 0.825Interleukin-8 receptor G 1,059 0.00669 0.00000 0.00284 0.626 0.820Interleukin-16 M 1,893 0.00975 0.00658 0.00974 0.638 0.811Interleukin-3 M 432 -0.00041 0.00000 0.01533 0.630 0.837Involucrin G 1,635 0.01636 0.00000 0.04863 0.631 0.880Kruppel-like proteinÐZNF75 G 633 0.00000 0.00000 0.00476 0.651 0.885L-selectin O 1,119 0.00989 0.00000 0.00270 0.667 0.869Leptin G 441 0.01689 0.00000 0.00685 0.637 0.824Low-af®nity N-formyl-peptide receptor G 1,044 -0.00007 -0.00003 0.00286 0.646 0.810Lysozyme C G 447 0.01539 0.00000 0.00000 0.644 0.849Melanin-concentrating hormone Gi 186 0.06279 0.00000 0.08480 0.634 0.847N-formyl-peptide receptor-2 G 1,047 0.00359 0.00000 0.00870 0.654 0.827N-formyl-peptide receptor G 1,038 0.01065 0.00000 0.00287 0.651 0.805Preproinsulin M 333 -0.00070 0.01819 0.00448 0.625 0.805Prion protein G 762 0.00474 0.00000 0.00395 0.685 0.831Protamine P1 G 150 0.00000 0.00000 0.12090 0.553 0.913Protamine P2 G 309 0.02300 0.00000 0.05058 0.576 0.885Rhesus-like protein G 1,254 0.01605 0.00000 0.07110 0.643 0.811Ribonuclease K6 G 453 0.01520 0.00000 -0.00002 0.653 0.858SRY G 615 0.00000 0.00000 0.00985 0.647 0.873Triosephosphate isomerase M 750 0.01524 0.00870 0.00000 0.657 0.819ZNF80 G 822 0.00647 0.00000 0.00898 0.654 0.870ZNF91 O 180 0.00000 0.00000 0.00000 0.628 0.917...................................................................................................................................................................................................................................................................................................................................................................
Kts and Ktn, estimates of synonymous transition and transversion substitution rates, respectively, per nucleotide; Kn, estimates of amino-acid-substitution rates per codon; calculated asdescribed in the Methods for 46 hominid genes. Negative estimates arise because of sampling errors. Nts (Ntv), proportion of transition (transversion) mutations that change an amino acid.Sequences for all genes were obtained for humans and chimpanzees, plus a primate outgroup species: G, gorilla; O, orang-utan; Gi, gibbon; M, macaque; B, baboon.

© 1999 Macmillan Magazines Ltd
letters to nature
346 NATURE | VOL 397 | 28 JANUARY 1999 | www.nature.com
for our closest hominid relatives are similar to those that we haveobtained for humans (Table 2). These are conservative estimates, asdata on exon abundance12 and the frequency of CpG islands16
indicate that there may be as many as 70,000±80,000 genes in thehuman genome. Furthermore, 25 years may be an underestimate ofthe generation time. From studies of modern hunter-gathererhuman societies, three estimates for the mean age at reproductionfor mothers are 27 years (60.3)17, 28 years (60.5)18 and 28 years(60:5)19; for fathers, three estimates are 32 years (60.4)17, 35 years�60:5)18 and 34 years (60.5)19. In wild common chimpanzees, theaverage age of mothers giving birth to offspring that survive infancyis estimated to be 23 years (61.1) (data in ref. 20), whereas maleshave more extended reproductive pro®les than females20.
Three further factors may indicate that we have underestimatedM and U. First, insertions and deletions also contribute to thegenomic mutation rate. In human pseudogenes, estimated rates ofdeletions and insertions are only 2.5% and 1%, respectively, of thepoint mutation rate21, but insertions and deletions in codingsequences are likely to be unconditionally deleterious, indicatingthat they might increase our estimate of U for hominids by about10%.
Second, we have estimated the rate of deleterious mutation onlywithin protein-coding sequences, but there are elements importantfor gene expression that are found upstream and downstream ofgenes and within introns. Rates of substitution in 39 and 59untranslated regions are lower than those for synonymous sites,suggesting moderate selective constraint22. Our data do not allowreliable estimation of the level of constraint for hominids intranscribed untranslated regions, but data in ref. 22 indicate thatmutations in these regions might contribute an extra ,10% toour estimate of U. However, sequences controlling gene expressionthat can be some distance from coding sequences may be a moreimportant source of selective constraint.
Third, our sample of genes may be unrepresentative. The averagelevel of constraint in our gene sample is remarkably low. Constraint(C) as determined by U/M is 0.38, 0.53 and 0.38 in humans,chimpanzees and gorillas, respectively, and a joint estimate forconstraint in hominids is 0.45 (60.09). However, C values,measured as 1 2 Ka=K s, where Ka and Ks are non-synonymous andsynonymous substitute rates, respectively, typically exceed 0.7. Forexample, in primate, artiodactyl and rodent lineages, C has beenreported to be 0.73, 0.74 and 0.83, respectively23. To determinewhether the low level of constraint is speci®c to our sample, wecompiled the 34 available pairs of mouse and rat gene sequences thatare homologous to genes present in humans and chimpanzees. Theconstraint in the subset of hominid genes for which we havehomologous rodent sequences is 0.44 (60.16), whereas it is 0.68�60:04� for the rodent genes; these values are nearly signi®cantlydifferent (P , 0:06). However, the average constraint for these 34rodent genes is signi®cantly lower than the average from 363 rodentgenes (0:82 6 0:01)24, so our constraint level for hominid genes maybe underestimated. A corrected constraint level is 0.46 (that is,
�0:38 3 0:82�=0:68). The low level of constraint is partly attribut-able, therefore, to an effect speci®c to the hominid clade (this effectcontributes about two-thirds of the low level of constraint), whereasthe remaining third is due to the nature of the genes in our sample.We may therefore have underestimated the deleterious mutationrate in protein-coding sequences by an extra ,20%.
An independent estimate of the non-synonymous mutation ratecan be obtained from the frequency at which new electrophoreticalleles appear in human pedigrees. The analysis of 30 loci in childrenof the Hiroshima and Nagasaki atomic-bomb survivors, and in acontrol cohort whose parents were not close to the bombings, issummarized in ref. 25. In the control cohort, three band-morphmutations were detected in ,4:7 3 105 allele tests, giving anestimate for the band-morph-mutation rate of 6:4 3 10 2 6 (95%con®dence interval 1:3 3 10 2 6 to 19 3 10 2 6). The band-morph-mutation rate in the exposed cohort was similar. About one-third ofamino-acid-altering mutations lead to a change in electrophoreticmobility25,26, giving a genomic non-synonymous mutation rate of2.3, an estimate that is about one-half of that obtained here fromDNA-sequence data.
Although calculations of mutation rates in humans have beenmade previously3,27, our study is, to our knowledge, the ®rst detailedanalysis of molecular constraint in hominid lineages. With con-servative assumptions, we estimate that there have been about 1.5new deleterious mutations per generation in hominid protein-coding sequences. Assuming less conservative values for genenumber (80,000), generation interval (30 years), and constraint(0.46), estimates of M and U for humans become 6.7 and 3.1,respectively. However, these remarkably high rates cannot be gen-eralized because U appears to vary widely across taxa. For example,similar calculations for rodent lineages give estimates of U speci®cto protein-coding sequences that are about one order of magnitudelower than our estimates of U for humans (our unpublishedresults).
The deleterious mutation rate appears to be so high in humansand our close relatives that it is doubtful that such species, whichhave low reproductive rates, could survive if mutational effects on®tness were to combine in a multiplicative way. Our results insteadindicate that synergistic epistasis may occur between deleteriousmutations, in hominids at least. However, the level of constraint inhominid protein-coding sequences is very low; roughly half of allnew non-synonymous mutations appear to have been accepted.Low constraint could result from the ®xation of slightly deleteriousmutations in species with small long-term effective population sizes(Ne), from the relaxation of selection, or from a high rate of adaptivesubstitution. The ®rst of these explanations seems the most plaus-ible, because Ne in hominids is expected to be atypically low. Ifdeleterious new mutations are accumulating at present, this couldhave damaging consequences for human health3, but this woulddepend critically on the frequency distribution of ®tness effects ofmutant alleles, about which we know little. M. . . . . . . . . . . . . . . . . . . . . . . . . . . . . . . . . . . . . . . . . . . . . . . . . . . . . . . . . . . . . . . . . . . . . . . . . . . . . . . . . . . . . . . . . . . . . . . . . . . . . . . . . . . . . . . . . . . . . . . . .
Methods
Nucleotide sequences of genes from humans, chimpanzees and the closest
available primate species were extracted from GenBank. The third primate was
chosen on the basis of its proximity to humans and chimpanzees, for example
gorilla sequences were used in preference to orang-utan sequences. All genes
were checked for paralogy using HOVERGEN13 and by BLAST searches. Major
histocompatibility complex genes were excluded because many of the poly-
morphisms segregating in humans pre-date the human/chimpanzee split22.
Multiple sequences were obtained for 40 of the 46 human genes (90% of the
total sequence length) and were used to construct consensus sequences, thereby
reducing the impact of sequencing errors. Where only two human sequences
were available, the chimpanzee sequence was used to resolve differences.
Sequences were aligned using ClustalX28 and corrected by hand. Synonymous
and non-synonymous substitution rates were calculated by two different
methods. In both methods, the calculation of the synonymous substitution
Table 2 Estimates of genomic mutation rates
Species u (´10-9)(s.e.m.)
M (s.e.m.) U (s.e.m.) Constraint(s.e.m.)
.............................................................................................................................................................................
Human 1.33 (0.18) 4.2 (0.5) 1.6 (0.8) 0.38 (0.17)Chimpanzee 1.22 (0.31) 3.2 (0.8) 1.7 (0.8) 0.53 (0.16)Gorilla 1.23 (0.19) 3.1 (0.5) 1.2 (0.6) 0.38 (0.17).............................................................................................................................................................................
Estimatesof per nucleotidemutation rates,u (per site per year; the sum of estimates for ratesof transition and transversion mutations averaged over genes, weighted by gene length),genomic rates of mutation in amino-acid-coding sequences, M (per diploid), genomicdeleterious mutation rates, U (per diploid), and levels of constraint in protein-codingsequences (see Methods). We assumed that humans have a generation time of 25 years,that chimpanzees and gorillas have generation times of 20 years, and that humans diverged6 million and 7 million years ago from chimpanzees and gorillas, respectively14,15. Thecalculations are based on a weighting by sequence length (Table 1), although similarestimates are obtained if the mutation rates are calculated with unweighted averages; forexample, M � 4:7� 6 0:8� and U � 1:4� 6 1:1� in humans. Estimates of u are consistent withprevious estimates of divergence between humans and chimpanzees30.
© 1999 Macmillan Magazines Ltd
letters to nature
NATURE | VOL 397 | 28 JANUARY 1999 | www.nature.com 347
rate was restricted to codons that code for the same amino acid in all three taxa.
Method (1). For each pair of sequences (i and j), the rates of synonymous
transition (Kts4(i,j)) and transversion (Ktv(i,j)) mutations were estimated
separately at fourfold degenerate sites using the equations of Ina29 for Kimura's
two-parameter method22. The rate of transition substitution at twofold
degenerate sites (Kts2(i,j)) was estimated as K ts2�i;j� � 2 12ln�1 2 2Ps�i;j ��, where
Ps(i,j) is the proportion of sites that show a difference between sites. The overall
synonymous transition rate (Kts) was calculated as a weighted (by number of
sites) average of the twofold and fourfold rates. The non-synonymous sub-
stitution rate per codon was calculated as Kn�i;j � � 2 ln�1 2 Pn�i;j ��, where Pn(i,j)
is the proportion of amino acids that differed between sequences. The distances
along each branch were calculated using Fitch and Margoliash's method; for
example, K ts�i � � �K ts�i;j � � K ts�i;k� 2 K ts�j;k��=2.
Method (2). Primate sequences are suf®ciently similar that parsimony can also
be used to estimate substitution rates. We estimated the numbers of
synonymous transition and transversion and amino-acid substitutions for
the human and chimpanzee lineages. Dividing these numbers by the relevant
number of sites gave the substitution rate per site (as above). By reconstructing
the sequence ancestral to the human/chimpanzee divide, we could also
separately estimate the transition rate at CpG dinucleotides and incorporate
this rate into the calculation of mutation rates. All methods gave quantitatively
similar results.
Estimates of non-synonymous and deleterious mutation rates and
constraint. Rates of non-synonymous (M) and deleterious (U) mutation
were estimated using weighted (by length) and unweighted substitution-rate
estimates. Weighted method: M � ZS�L�K tsN ts � K tvN tv��=SL, U �
M 2 ZS�LKn=3�=SL; unweighted: M � Z�K tsN ts � K tvN tv�, U � M 2 ZKn=3;
where Z is a constant that incorporates the number and length of genes and
the generation time; for example, for humans Z � 2�genomes� 3
60; 000�genes� 3 1; 523�base pairs� 3 25�years�=6 3 106 (years), and all sum-
mations were across genes.
As the estimate of constraint is subject to large sampling error, we produced
a joint estimate of the level of constraint in hominid protein-coding genes in
the following manner. Data sets for all genes with homologues in humans and
chimpanzees (n � 53), humans and gorillas (30), chimpanzees and gorillas
(28), humans and orang-utans (25) and chimpanzees and orang-utans (25)
were compiled and rates of substitution were measured as in method (1). We
then estimated the number of non-synonymous substitutions predicted to
occur in all sequences should all non-synonymous mutations be neutral from:
X � ^data sets genes
L�K tsN ts � K tvN tv�
and the number of non-synonymous substitutions that have occurred from:
Y � ^data sets genes
LKn=3:
Constraint was then estimated as C � 1 2 Y =X.
All estimates of standard error were obtained by bootstrapping the data, by
gene, 1,000 times.
Received 16 October; accepted 1 December 1998.
1. Kondrashov, A. S. Contamination of the genomes by very slightly deleterious mutations. Why have we
not died 100 times over? J. Theor. Biol. 175, 583±594 (1995).
2. Crow, J. F. The high spontaneous mutation rate: is it a health risk? Proc. Natl Acad. Sci. USA 94, 8380±
8386 (1997).
3. Kondrashov, A. S. & Crow, J. F. A molecular approach to estimating the human deleterious mutationrate. Hum. Mutat. 2, 229±234 (1993).
4. Kimura, M. & Maruyama, T. The mutational load with episatic gene interactions in ®tness. Genetics
54, 1337±1351 (1966).
5. Muller, H. J. Our load of mutations. Am. J. Hum. Genet. 2, 111±176 (1950).
6. Lande, R. Risk of population extinction from ®xation of new deleterious mutations. Evolution 48,1460±1469 (1994).
7. Charlesworth, B., Charlesworth, D. & Morgan, M. T. Genetic loads and estimates of mutation rates in
highly inbred plant populations. Nature 347, 380±382 (1990).
8. Simmons, M. J. & Crow, J. F. Mutations affecting ®tness in Drosophila populations. Annu. Rev. Genet.
11, 49±78 (1977).9. Keightley, P. D. Nature of deleterious mutation load in Drosophila. Genetics 144, 1993±1999 (1996).
10. Kimura, M. The Neutral Theory of Molecular Evolution (Cambridge Univ. Press, Cambridge, 1983).
11. Wolfe, K. H., Sharp, P. M. & Li, W.-H. Mutation rates differ among regions of the mammalian
genome. Nature 337, 283±285 (1989).
12. Fields, C., Adams, M. D. & Venter, J. C. How many genes in the human genome? Nature Genet. 7, 345±346 (1994).
13. Duret, L., Mouchiroud, D. & Gouy, M. HOVERGENÐa database of homologous vertebrate genes.
Nucleic Acids Res. 22, 2360±2365 (1994).
14. Goodman, M. et al. Toward a phylogenetic classi®cation of primates based on DNA evidence
complemented by fossil evidence. Mol. Phylogenet. Evol. 9, 585±598 (1998).15. Kumar, S. & Blair Hedges, S. A molecular timescale for vertebrate evolution. Nature 392, 917±920
(1998).
16. Antequera, F. & Bird, A. Number of CpG islands and genes in human and mouse. Proc. Natl Acad. Sci.
USA 90, 11995±11999 (1993).
17. Hill, K. & Hurtado, A. M. Ache Life History: The Ecology and Demography of a Foraging People (Aldonede Gruyter, New York, 1996).
18. Howell, N. Demography of the Dobe Kung (Academic, New York, 1979).
19. Melancon, T. F. Marriage and Reproduction among the Yanomamo Indians of Venezuela. Thesis,
Pennsylvania State Univ. (1982).
20. Nishida, T., Takasaki, H. & Takahata, Y. in The Chimpanzees of the Mahale Mountains (ed. Nishida, T.)63±97 (Tokyo Univ. Press, Tokyo, 1990).
21. Ophir, R. & Graur, D. Patterns and rates of indel evolution in processed pseudogenes from humans
and murids. Gene 205, 191±202 (1997).
22. Li, W.-H. Molecular Evolution (Sinauer, Sunderland, Massachusetts, 1997).
23. Ohta, T. Synonymous and nonsynonymous substitutions in mammalian genes and the nearly neutraltheory. J. Mol. Evol. 40, 56±63 (1995).
24. Wolfe, K. H. & Sharp, P. M. Mammalian gene evolutionÐnucleotide-sequence divergence between
mouse and rat. J. Mol. Evol. 37, 441±456 (1993).
25. Neel, J. V. et al. Search for mutations altering protein charge and/or function in children of atomic-bomb survivorsЮnal report. Am. J. Hum. Genet. 42, 663±676 (1988).
26. Mohrenweiser, H. W. & Neel, J. V. Frequency of thermostability variantsÐestimation of total rare
variant frequency in human populations. Proc. Natl Acad. Sci. USA 78, 5729±5733 (1981).
27. Drake, J. W. et al. Rates of spontaneous mutation. Genetics 148, 1667±1686 (1998).
28. Thompson, J. D. et al. The ClustalX windows interface: ¯exible strategies for multiple sequencealignment aided by quality analysis tools. Nucleic Acids Res. 24, 4876±4882 (1997).
29. Ina, Y. Estimation of the transition/transversion ratio. J. Mol. Evolv. 46, 521±533 (1998).
30. Hammer, M. F. A recent common ancestry for human Y chromosomes. Nature 378, 376±378 (1995).
Acknowledgements. We thank B. Charlesworth, J. F. Crow, E. K. Davies, W. G. Hill, T. Johnson, A. S.Kondrashov, G. McVean, J. R. Peck, A. D. Peters, M. W. Simmen, D. B. Smith and H. B. Trotter forcomments and helpful discussions; K. H. Wolfe for a database of rodent gene sequences; and the RoyalSociety for support.
Correspondence and requests for materials should be addressed to A.E.-W. (e-mail: [email protected]).
Monoculardeprivationinduceshomosynapticlong-termdepression invisual cortexCynthia D. Rittenhouse*², Harel Z. Shouval²,Michael A. Paradiso² & Mark F. Bear*²
* Howard Hughes Medical Institute and ² Department of Neuroscience, BrownUniversity, Providence, Rhode Island 02912, USA. . . . . . . . . . . . . . . . . . . . . . . . . . . . . . . . . . . . . . . . . . . . . . . . . . . . . . . . . . . . . . . . . . . . . . . . . . . . . . . . . . . . . . . . . . . . . . . . . . . . . . . . . . . . . . . . . . . . . . . . .
Brief monocular deprivation during early postnatal developmentcan lead to a depression of synaptic transmission that rendersvisual cortical neurons unresponsive to subsequent visual stimu-lation through the deprived eye. The Bienenstock±Cooper±Munro (BCM) theory1 proposes that homosynaptic mechanismsof long-term depression (LTD) account for the deprivationeffects2,3. Homosynaptic depression, by de®nition, occurs only atactive synapses. Thus, in contrast to the commonly held view thatthe synaptic depression caused by monocular deprivation issimply a result of retinal inactivity, this theoretical frameworkindicates that the synaptic depression may actually be driven bythe residual activity in the visually deprived retina4. Here weexamine the validity of this idea by comparing the consequencesof brief monocular deprivation by lid suture with those ofmonocular inactivation by intra-ocular treatment with tetrodo-toxin. Lid suture leaves the retina spontaneously active, whereastetrodotoxin eliminates all activity. In agreement with the BCMtheory, our results show that monocular lid suture causes asigni®cantly greater depression of deprived-eye responses inkitten visual cortex than does treatment with tetrodotoxin.These ®ndings have important implications for mechanisms ofexperience-dependent plasticity in the neocortex.
Previous work has shown that monocular inactivation withtetrodotoxin (TTX), like monocular lid suture, shifts the oculardominance of cortical neurons strongly towards the non-deprivedeye5,6. However, those studies used prolonged TTX treatment


![Integrating the Healthcare Enterprise€¦ · Document Source Document ConsumerOn Entry [ITI Document Registry Document Repository Provide&Register Document Set – b [ITI-41] →](https://img.dokumen.tips/doc/110x75/5f08a1eb7e708231d422f7c5/integrating-the-healthcare-enterprise-document-source-document-consumeron-entry.jpg)