Embed Size (px)
Citation preview

LosAngelesCountyDepartmentofPublicWorks Harbor‐UCLAMedicalCenterCampusMasterPlanProjectSCH#2014111004 4.L‐1
4. ENVIRONMENTAL IMPACT ANALYSIS L. TRANSPORTATION AND TRAFFIC
1. INTRODUCTION
This section describes potential impacts associatedwith construction and operational transportation andtraffic. The section provides an analysis of construction traffic; intersection capacity; the regionaltransportation system; public transit and alternative transportation; vehicular access and circulation; andparking supply. The evaluation of intersection capacity examines the impact of the Project relative toexistingandfutureconditions.ThissectionisbasedontheTrafficImpactAnalysis(TrafficStudy)preparedbyFehr&Peers, Inc.datedFebruary2016. TheTrafficStudy,whichprovidesmoredetailed information,data, and analyses, is included asAppendix I of thisDraftEIR. TheTraffic Studywasprepared followingextensivecoordinationwithstafffromLosAngelesCounty,Caltrans,CityofLosAngeles,CityofCarsonandCityofTorrance.Further,theTrafficStudyforthisCountyprojectwaspreparedpursuanttoaMemorandumof Understanding (MOU)with the County of Los Angeles Department of PublicWorks (DPW) Traffic andLightingDivision(TLD),whichisappendedtotheTrafficStudyprovidedinAppendixIofthisDraftEIR.
2. ENVIRONMENTAL SETTING
a. Existing Conditions
(1) Study Area Street System
TheProject Site is located at 1000West Carson Street in the unincorporated community ofWest Carson,California. The study area includes intersections located in or bordering LosAngeles County, City of LosAngeles,CityofCarsonandCityofTorrance.CarsonStreet,VermontAvenue,NormandieAvenueand220thStreetcurrentlyprovideaccesstothesitevia11driveways.Inaddition,aparkinglotforstaffislocatedonthe southeast cornerofVermontAvenue&220th Street,withaccessprovidedby fourdrivewayson220thStreet.ThestudyareaforthisanalysisisboundedbyTorranceBoulevardonthenorth,223rdStreetonthesouth,FigueroaStreetontheeast,andWesternAvenueonthewest.Figure4.L‐1,StudyAreaIntersections,depicts the Project’s Traffic Study area and the intersections analyzed for potential Project impacts. Asdescribed in further detail below, the study area is well served by a network of freeways and streets.1FreewaysareunderthejurisdictionoftheCaliforniaDepartmentofTransportation(Caltrans).
(a) Freeways
PrimaryregionalaccesstothesiteisprovidedbyCarsonStreet,I‐110,I‐405andStateRoute91.Followingisabriefdescriptionofthefreewaysthatservethesite.
SanDiegoFreeway(I‐405)–TheSanDiegoFreewayrunseast/westapproximatelytwomilesnorthoftheProject Site and southeast/northwest approximately twomiles east of the Project Site. Access from the
1 MoredetailedinformationregardingthemajorarterialsinthestudyareaandlaneconfigurationsispresentedintheTrafficImpact
Analysis,whichisincludedasAppendixIofthisDraftEIR.

4.l. Transportation and Traffic August 2016
LosAngelesCountyDepartmentofPublicWorks Harbor‐UCLAMedicalCenterCampusMasterPlanProjectSCH#2014111004 4.L‐2
ProjectSitetotheSanDiegoFreewayisprovidedbyinterchangesatWesternAvenue,NormandieAvenue,VermontAvenue(westboundvehiclesonly),CarsonStreet,andWilmingtonAvenue.
HarborFreeway(I‐110)–TheHarborFreewayrunsnorth/southapproximately¼mileeastoftheProjectSite.AccessfromtheProjectSitetotheHarborFreewayisprovidedbyviainterchangesatCarsonStreetand223rdStreetforsouthboundvehiclesandat220thStreetfornorthboundvehicles.
GardenaFreeway/ArtesiaFreeway(StateRoute91)–StateRoute91(SR91)runseast/westapproximatelythreemilesnorthoftheProjectSite.EastoftheHarborFreeway,SR91isknownastheGardenaFreeway.WestoftheHarborFreeway,SR91isknownastheArtesiaFreeway.AccessfromtheProjectSitetoSR91isprovidedbythe110FreewayandVermontAvenue.
ThefollowingthreetypesofanalyseswereconductedonCaltransfacilities:1)freewaymainlinesegments,2)Caltransintersections,and3)off‐rampqueuing.Morespecifically,thefollowingfacilitieswereanalyzed:twofreewaymainlinesegmentsonI‐110,threesegmentsonI‐405andonesegmentonSR‐91todeterminedensity andLOS;one intersection (WesternAve. (StateRoute213)&CarsonStreet); and six freewayoff‐rampstoestimatequeues.
Withregardto the freewaymainlinesegments, levelofservice(LOS) isameasureusedtodescribetrafficflowconditionsor the freedom tomaneuverwithin traffic stream. TheLOS ranges fromnearly free‐flowtrafficatLOSAtobreakdownandoversaturationatLOSF. ThedefinitionsoftheLOSlevelsareshowninTable4.L‐1,HighwayCapacityManualLevelofServiceDefinitions forFreewaySegments. The six freewaysegmentsandrespectiveLOSaresummarizedinTable4.L‐2,ExistingConditionsFreewaySegmentLevelsofService. As shown inTable4.L‐2, the I‐110at228th Streetand the I‐110atEl Segundooperates at aLOSrangingfromCtoEduringtheAMandPMpeakhours.TheI‐405FreewayatI‐710,I‐405southofI‐110,andI‐405 north of Western Ave/Van Ness Ave operates at a LOS ranging from LOS C to LOS F, with LOS Foccurring during the AM peak hour at the I‐405 at I‐710 segment. The SR‐91 at Avalon BoulevardinterchangeoperatesataLOSrangingfromLOSCtoD.
Withregardtointersectionswiththefreeways,LOSprovidesaqualitativemeasuretodescribetheflowoftrafficthroughtheintersection.TheLOSrangesfromLOSA,whichisexcellenttoLOSF,whichisfailureoftheintersection. Table4.L‐3,HighwayCapacityManualLevelofServiceDefinitionsforIntersections,showstheLOSforsignalizedintersections.TheonestudyintersectionatWesternAve.(StateRoute213)&CarsonStreet(IntersectionID3)anditsrespectiveLOSissummarizedinTable4.L‐4,ExistingConditionsCaltrans’IntersectionLevelofService ImpactAnalysis. As shown inTable4.L‐4, Signalized Intersection3 ‐WesternAve.(StateRoute213)&CarsonStreetoperatesatLOSEduringthemorningandafternoonpeakhours.
Withregardto freewayramps,Caltrans’primaryconcernatoff‐ramps is thatqueuedvehiclesmayextendpastthebackoftherampontothemainline.Thesixoff‐rampsanalyzedinclude:I‐110SBrampsatCarsonStreet;220thStreet/I‐210NBrampsatFigueroaStreet;1‐110SBrampsat223rdStreet; I‐405SBrampsatCarsonStreet; I‐405NB rampsatCarsonStreet; and I‐405NBrampsatWilmingtonAvenue. Table17 inTrafficStudyincludesthepeakhouroff‐rampintersection95thpercentilequeuesfortheanalyzedramps.Asshowntherein,theAMandPMpeakhourqueuesatallramplocationsdonotexceedtheramplengthunderexistingconditions.

FIGUREStudy Area Intersec ons
Harbor-UCLA Medical Center Master Plan 4.L-1Source: Fehr & Peers, 2016.
0 0.4 Miles
N
P C R

4.l. Transportation and Traffic August 2016
LosAngelesCountyDepartmentofPublicWorks Harbor‐UCLAMedicalCenterCampusMasterPlanProjectSCH#2014111004 4.L‐4
Thispageintentionallyblank.

August 2016 4.I Transportation and Traffic
LosAngelesCountyDepartmentofPublicWorks Harbor‐UCLAMedicalCenterCampusMasterPlanProjectSCH#2014111004 4.L‐5
(b) Roadways
The Project Site is served by a grid of streets that are oriented toward the north‐south and east‐westdirections. Themajor arterials providing regional and sub‐regional access to the Project vicinity includeVermontAvenue,NormandieAvenue,andCarsonStreet. WithintheCityofLosAngeles, theMobilityPlan2035,whichwas adopted inAugust 2015 and is a comprehensive update of the Transportation Element,providesaclassificationsystemforroadwayswithintheCityboundaries.
RoadwaydescriptionsarealsodescribedpertheCounty’sGeneralPlanandtheCityofCarsonGeneralPlan,as applicable. The following is a brief description of themajor roadways in the study area including theclassificationsunderpertheapplicableplanningdocumentsreferencedabove:
Table 4.L‐1
Highway Capacity Manual Level of Service Definitions for Freeway Segments
Level of Service Description Densitya
A Free‐flowspeedsprevail.Vehiclesarealmostcompletelyunimpededintheirabilitytomaneuverwithinthetrafficstream. 11
B Free‐flowspeedsaremaintained.Theabilitytomaneuverwiththetrafficstreamisonlyslightlyrestricted. 11and 18
CFlowwithspeedsatornearfree‐flowspeeds.Freedomtomaneuverwithinthetrafficstreamisnoticeablyrestricted,andlanechanges
requiremorecareandvigilanceonthepartofthedriver. 18and 26
DSpeedsdeclineslightlywithincreasingflows.Freedomtomaneuverwiththetrafficstreamismorenoticeablylimited,andthedriver
experiencesreducedphysicalandpsychologicalcomfort. 26and 35
EOperationatcapacity.Therearevirtuallynousablegapswithinthetrafficstream,leavinglittleroomtomaneuver.Anydisruptioncanbe
expectedtoproduceabreakdownwithqueuing. 35and 45
F Representsabreakdowninflowandoversaturatedconditions. >45
a Density is defined in vehicles per mile per lane and describes the proximity to other vehicles and is related to the freedom to maneuver within the traffic stream (2010 Highway Capacity Manual, Transportation Research Board, 2010).
Source: 2010 Highway Capacity Manual (Transportation Research Board, 2010) and Caltrans.
4.l. Transportation and Traffic August 2016
LosAngelesCountyDepartmentofPublicWorks Harbor‐UCLAMedicalCenterCampusMasterPlanProjectSCH#2014111004 4.L‐6
(i) North/South Roadways
VermontAvenue–VermontAvenue isdesignatedas aMajorHighway in theLosAngelesCountyGeneralPlanthatrunsnorth/southontheeastsideof theProjectSiteandprovidestwotravel lanesandabicyclelaneineachdirection.Thestreetalsohasacenterturnlane.Parallelparkingisavailableonbothsidesofthestreet.Thepostedspeedlimitis40milesperhour(mph).
Table 4.L‐2
Existing Conditions Freeway Segment Levels of Service
ID Freeway Segment Peak Hour Direction
Existing Conditions
Density a LOS
FS‐1 I‐110at228thStreetA.M.
NB 37.0 ESB 22.9 C
P.M.NB 23.1 CSB 33.7 D
FS‐2 I‐110atElSegundoBoulevard
A.M.NB 27.0 DSB 36.9 E
P.M.NB 26.1 DSB 37.4 E
FS‐3 I‐405atI‐710A.M.
NB 47.5 FSB 27.4 D
P.M.NB 28.5 DSB 43.8 E
FS‐4 I‐405southofI‐110/CarsonScales
A.M.NB 33.9 DSB 28.2 D
P.M.NB 26.0 CSB 37.9 E
FS‐5I‐405northof
WesternAve/VanNessAve.
A.M.NB 30.8 DSB 29.0 D
P.M.NB 27.5 DSB 31.8 D
FS‐6 SR91atAvalonBlvd.A.M.
EB 21.9 CWB 28.7 D
P.M.EB 26.1 DWB 19.9 C
a Measured in passenger cars per mile per lane (pc/mi/ln) for freeways assuming a free‐flow speed of 55 mph per Caltrans request.
Source: Fehr & Peers, 2016.

August 2016 4.I Transportation and Traffic
LosAngelesCountyDepartmentofPublicWorks Harbor‐UCLAMedicalCenterCampusMasterPlanProjectSCH#2014111004 4.L‐7
Table 4.L‐3
Highway Capacity Manual Level of Service Definitions for Intersections
Level of Service Description
Seconds of Delay
Signalized Intersections
A EXCELLENT.Novehiclewaitslongerthanoneredlightandnoapproachphaseisfullyused. 10
B VERYGOOD.Anoccasionalapproachphaseisfullyutilized;manydriversbegintofeelsomewhatrestrictedwithingroupsofvehicles.
>10and20
C GOOD.Occasionallydriversmayhavetowaitthroughmorethanoneredlight;backupsmaydevelopbehindturningvehicles. >20and35
DFAIR.Delaysmaybesubstantialduringportionsoftherushhours,butenoughlowervolumeperiodsoccurtopermitclearingofdevelopinglines,preventingexcessivebackups.
>35and55
EPOOR.Representsthemostvehiclesintersectionapproachescanaccommodate;maybelonglinesofwaitingvehiclesthroughseveralsignalcycles.
>55and80
F
FAILURE.Backupsfromnearbylocationsoroncrossstreetsmayrestrictorpreventmovementofvehiclesoutoftheintersectionapproaches.Tremendousdelayswithcontinuouslyincreasingqueuelengths.
>80
Source: 2010 Highway Capacity Manual (Transportation Research Board, 2010) and Caltrans.
Table 4.L‐4
Existing Conditions Caltrans’ Intersection Level of Service Impact Analysis
ID Intersection Peak Hour
Existing
Delay LOS
SignalizedIntersections 3. WesternAve.(StateRoute213)&CarsonStreet A.M. 61.4 E P.M. 61.4 E
Delay is measured in average seconds per vehicle; LOS = Level of service
Source: Fehr & Peers, 2016.

4.l. Transportation and Traffic August 2016
LosAngelesCountyDepartmentofPublicWorks Harbor‐UCLAMedicalCenterCampusMasterPlanProjectSCH#2014111004 4.L‐8
NormandieAvenue–NormandieAvenue isdesignatedasaSecondaryHighwayintheLosAngelesCountyGeneralPlanthatrunsnorth/southonthewestsideoftheProjectSiteandprovidestwotravellanesineachdirection. ThisroadwayispartoftheCityofLosAngelesBicycleLaneNetworkintheCityofLosAngelesMobilityPlan.Restrictedandunrestrictedparkingisavailableonbothsidesofthestreet.Thepostedspeedlimit is 35mph. Within the study area, Normandie Avenue forms the boundary between the City of LosAngelesandtheunincorporatedcommunityofWestCarson.
WesternAvenue(StateRoute213)–WesternAvenueisdesignatedasaMajorHighwayintheLosAngelesCountyGeneralPlanthatrunsnorth/southtothewestoftheProjectSite.Theroadwayprovidestwotravellanesineachdirectionandcontainsaraisedmedianwithintersectionturnlanesonportionsoftheroadway.WesternAvenueispartoftheCityofLosAngelesMobilityPlan’sBicycleEnhancedNetwork.RestrictedandunrestrictedparkingisavailableonbothsidesofthestreetneartheProjectSite.Thepostedspeedlimitis40mph.Withinthestudyarea,NormandieAvenueformstheboundarybetweentheCityofLosAngelesandtheCityofTorrance.
FigueroaStreet–FigueroaStreet isdesignatedasaMajorHighwayintheCityofCarsonGeneralPlanthatrunsnorth/southtotheeastoftheProjectSite.Theroadwayprovidestwotravellanesineachdirectionandcontains a raised median with intersection turn lanes on portions of the roadway. Restricted andunrestrictedparkingisavailableonbothsidesofthestreetneartheProjectSite.Thepostedspeedlimitis40mph.
MeylerStreet–MeylerStreetisalocalstreetthatrunsnorth/southsouthoftheProjectSite. UnrestrictedparkingisavailableonbothsidesofthestreetneartheProjectSite.
BerendoAvenue–BerendoStreetisalocalstreetthatrunsnorth/southnorthoftheProjectSite.RestrictedandunrestrictedparkingisavailableonbothsidesofthestreetneartheProjectSite.
Budlong Avenue – Budlong Avenue is a local street that runs north/south north of the Project Site.RestrictedandunrestrictedparkingisavailableonbothsidesofthestreetneartheProjectSite.
(ii) East/West Roadways
CarsonStreet–CarsonStreetisdesignatedasaMajorHighwayintheLosAngelesCountyGeneralPlanthatrunseast/weston thenorth sideof theProject Site andprovides two travel lanes in eachdirection. Theportions of the roadway within the City of Los Angeles are part of the City of Los Angeles Bicycle LaneNetwork. Restricted and unrestricted parking is available on either side of the street on portions of theroadway.Thepostedspeedlimitis35mph.
220th Street – 220th Street is a local street that runs east/west on the south side of theProject Site andprovidesfourvehicletravellanes,twoineachdirection.ThisroadwayispartoftheCountyofLosAngelesproposedBicycleNetwork. Restrictedandunrestrictedparkingisavailableoneithersideof thestreetonportionsoftheroadwayneartheProjectSite.Thepostedspeedlimitis30mph.
223rdStreet–223rdStreet isdesignatedasaSecondaryHighwayintheLosAngelesCountyGeneralPlanthat runs east/west to the southof theProject Site andprovides two travel lanes in eachdirection. This

August 2016 4.I Transportation and Traffic
LosAngelesCountyDepartmentofPublicWorks Harbor‐UCLAMedicalCenterCampusMasterPlanProjectSCH#2014111004 4.L‐9
roadway is part of the County of Los Angeles proposed Bicycle Network. The majority of parking isunrestrictedoneithersideofthestreet.Thepostedspeedlimitisbetween35and40mph.
TorranceBoulevard–TorranceBoulevardisdesignatedasaSecondaryHighwayintheLosAngelesCountyGeneralPlanthatrunseast/westnorthof theProjectSiteandprovides twotravel lanes ineachdirection.Parkingisavailableonmostblockswithinthestudyareaforpassengervehicles. Commercialvehiclesarenotallowedtoparkontheroadway.Thepostedspeedlimitis35mph.
SepulvedaBoulevard– SepulvedaBoulevard isdesignatedas aMajorHighway in theLosAngelesCountyGeneralPlanthatrunseast/westsouthoftheProjectSiteandprovidesthreetravellanesineachdirection,witharaisedmedianonportionsoftheroadway.Parkingisnotavailableoneithersideofthestreet.Thepostedspeedlimitis40mph.
(2) Existing Intersection Service Levels
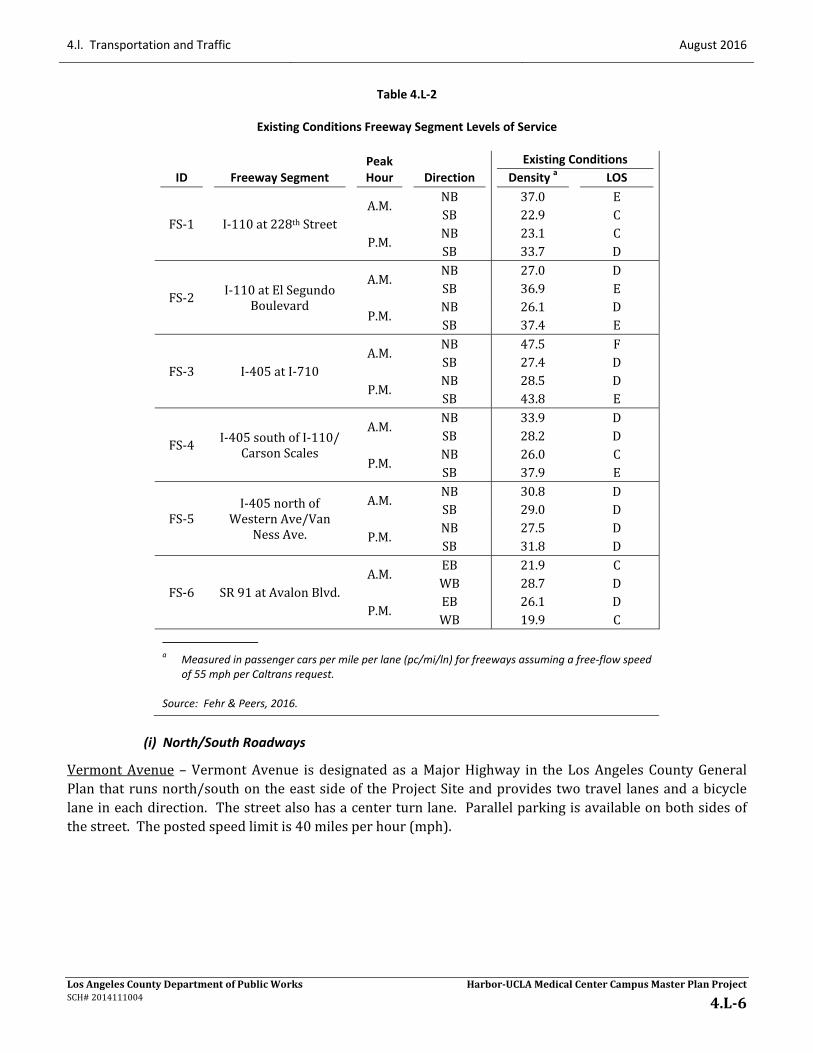
Twenty‐twostudyintersections,21signalizedandone(1)unsignalized,wereselectedfortheProjecttrafficanalysis(SeeFigure4.L‐1forintersectionlocations).Levelofservice(LOS)isaqualitativemeasureusedtodescribe the condition of traffic flow on the street system, ranging from excellent conditions at LOSA tooverloadedconditionsatLOSF. LOSDistypicallyrecognizedastheminimumdesirablelevelofserviceinurban areas. Levels of service definitions are provided in Table 4.L‐5, Level of Service Definitions forSignalizedIntersections.
Per the requirements of Los Angeles County, City of Torrance and City of Carson, Intersection CapacityUtilization (ICU)methodologywasused to determine the intersection volume‐to‐capacity (V/C) ratio andcorrespondingLOSforthe21signalizedstudyintersectionswhollyorpartlyinthesejurisdictions.TheICUmethodof intersectioncapacityanalysisdetermines the intersectionV/CratioandcorrespondingLOS forthe turningmovements and intersection characteristics at signalized intersections. “Capacity” representsthemaximumvolumeofvehiclesinthecriticallanesthathaveareasonableexpectationofpassingthroughan intersection in onehourunderprevailing roadwayand traffic conditions. The ICUwere calculatedbydividing critical trafficmovement volumes at an intersection by the capacity per number of lanes for themovement.
The one unsignalized study intersection, Meyler Street & 220th Street, is located in unincorporated LosAngelesCounty. TheCounty’s ImpactAnalysisReportGuidelinesdonotspecifyaspecificmethodologyorthresholdsofsignificancewhenanalyzingunsignalizedintersections.ConsistentwithCountypractices,thisintersections is evaluatedas if itwere signalized,using the ICUmethodology. TheCountyofLosAngelesthresholdsofsignificanceforasignalizedintersectionarealsoappliedtothisintersection(describedbelow).
TheCityofLosAngelesrequirestheuseofCriticalMovementAnalysis(CMA)methodologytoevaluatetheoperationsofintersectionsandthismethodologywasusedtoanalyzethestudylocationsintheCityofLosAngeles. The CMA method of intersection capacity analysis determines the intersection V/C ratio andcorrespondingLOS for the turningmovements and intersection characteristics at signalized intersections.TheCALCADBsoftwarepackagedevelopedbyLosAngelesDepartmentofTransportation(LADOT)wasusedto implement the CMA methodology at the eight study intersections wholly or partly under City of LosAngelesjurisdiction.
4.l. Transportation and Traffic August 2016
LosAngelesCountyDepartmentofPublicWorks Harbor‐UCLAMedicalCenterCampusMasterPlanProjectSCH#2014111004 4.L‐10
TheCityofLosAngeles’AutomatedTrafficSurveillanceandControl (ATSAC) system isa computer‐basedtraffic signal control system that monitors traffic conditions and system performance to allow ATSAC‐operations to manage signal timing to improve traffic flow conditions. All eight signalized studyintersectionsunderCityofLosAngelesjurisdictionarecurrentlyoperatingundertheCity’sATSACsystem.In accordancewith establishedCity of LosAngeles procedures, a 0.07V/C reductionwas applied at eachintersectionwhereATSACis implemented. PerdirectionfromLADOT,thebenefitsof theAdaptiveTrafficControlSystem(ATCS)inplaceattheseintersections(normallyestimatedat0.03V/C)arenotreflectedinthisanalysisduetothelimitedareaoftheCity’ssystem.
Table 4.L‐5
Level of Service Definitions for Signalized Intersections
Level of Service Intersection Capacity
Utilizationa Definition
A 0.000‐0.600 EXCELLENT.Novehiclewaitslongerthanoneredlightandnoapproachphaseisfullyused.
B 0.601‐0.700VERYGOOD.Anoccasionalapproachphaseisfullyutilized;manydriversbegintofeelsomewhatrestrictedwithingroupsofvehicles.
C 0.701‐0.800GOOD.Occasionallydriversmayhavetowaitthroughmorethanoneredlight;backupsmaydevelopbehindturningvehicles.
D 0.801‐0.900
FAIR.Delaysmaybesubstantialduringportionsoftherushhours,butenoughlowervolumeperiodsoccurtopermitclearingofdevelopinglines,preventingexcessivebackups.
E 0.901‐1.000POOR.Representsthemostvehiclesintersectionapproachescanaccommodate;maybelonglinesofwaitingvehiclesthroughseveralsignalcycles.
F >1.000
FAILURE.Backupsfromnearbylocationsoroncrossstreetsmayrestrictorpreventmovementofvehiclesoutoftheintersectionapproaches.Tremendousdelayswithcontinuouslyincreasingqueuelengths.
a Transportation Research Circular No. 212, Interim Materials on Highway Capacity, Transportation Research Board, 1980.
Source: Fehr & Peers, 2016.

August 2016 4.I Transportation and Traffic
LosAngelesCountyDepartmentofPublicWorks Harbor‐UCLAMedicalCenterCampusMasterPlanProjectSCH#2014111004 4.L‐11
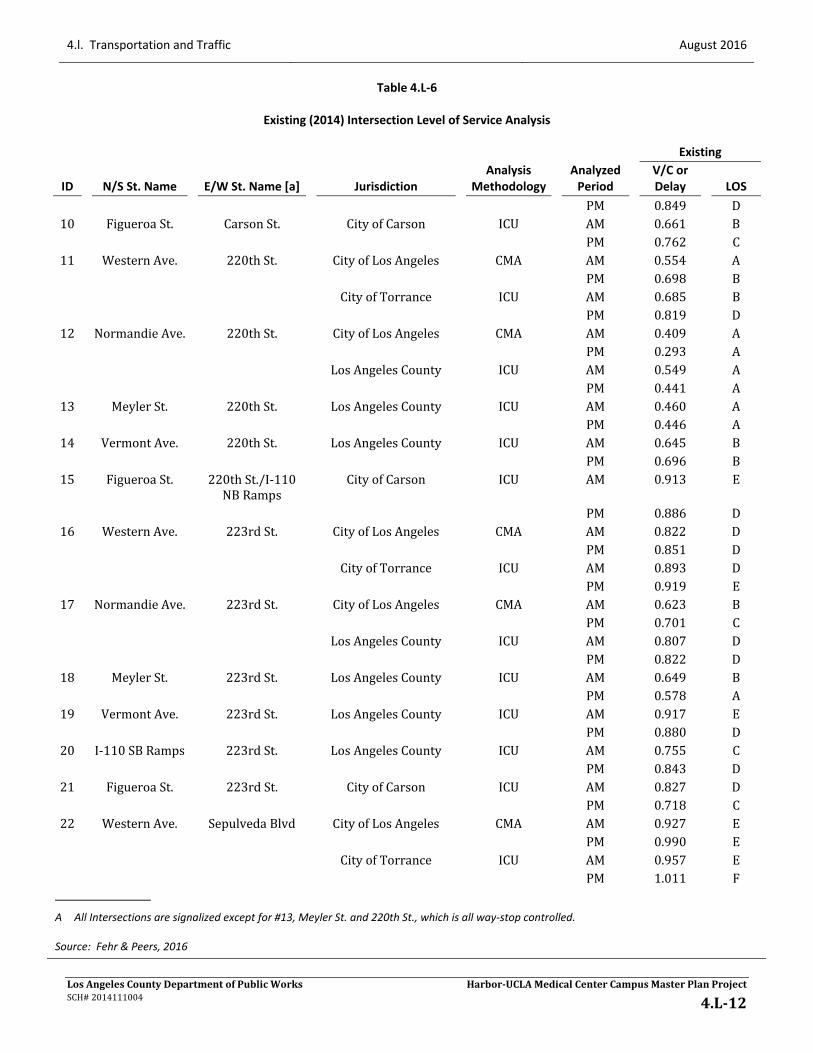
Table4.L‐6,ExistingIntersectionLevelsofServiceAnalysis,summarizestheexistingLOSanalysisresults.Asshowninthetable,thefollowingnineintersectionsarecurrentlyoperatingatpoorlevelsofservice,i.e.,LOSEorF,duringoneorbothoftheanalyzedpeakhours:
1. NormandieAvenue&TorranceBoulevard2. VermontAvenue&TorranceBoulevard3. WesternAvenue&CarsonStreet4. NormandieAvenue&CarsonStreet8. VermontAvenue&CarsonStreet15. FigueroaStreetand220thStreet/I‐110NorthboundRamps16. WesternAvenue&223rdStreet19. VermontAvenue&223rdStreet22. WesternAvenue&SepulvedaBoulevard
DetailedLOScalculationworksheetsarepresentedinAppendixCoftheTrafficStudy.
Table 4.L‐6
Existing Intersection Level of Service Analysis
ID N/S St. Name E/W St. Name [a] Jurisdiction Analysis
Methodology Analyzed
Period
Existing
V/C or Delay LOS
1 NormandieAve. TorranceBlvd. CityofLosAngeles CMA AM 0.902 E PM 0.904 E LosAngelesCounty ICU AM 0.935 E PM 0.936 E2 VermontAve. TorranceBlvd. LosAngelesCounty ICU AM 0.927 E PM 0.880 D3 WesternAve. CarsonSt. CityofLosAngeles CMA AM 0.877 D PM 0.948 E CityofTorrance ICU AM 0.943 E PM 1.006 F4 NormandieAve. CarsonSt. CityofLosAngeles CMA AM 0.763 C PM 0.837 D LosAngelesCounty ICU AM 0.904 E PM 0.930 E5 BudlongAve. CarsonSt. LosAngelesCounty ICU AM 0.570 A PM 0.539 A6 BerendoAve. CarsonSt. LosAngelesCounty ICU AM 0.575 A PM 0.569 A7 MedicalCtrDr. CarsonSt. LosAngelesCounty ICU AM 0.628 B PM 0.611 B8 VermontAve. CarsonSt. LosAngelesCounty ICU AM 0.905 E PM 0.917 E9 I‐110SBRamps CarsonSt. LosAngelesCounty ICU AM 0.814 D
4.l. Transportation and Traffic August 2016
Table 4.L‐6
Existing (2014) Intersection Level of Service Analysis
LosAngelesCountyDepartmentofPublicWorks Harbor‐UCLAMedicalCenterCampusMasterPlanProjectSCH#2014111004 4.L‐12
ID N/S St. Name E/W St. Name [a] Jurisdiction Analysis
Methodology Analyzed
Period
Existing
V/C or Delay LOS
PM 0.849 D10 FigueroaSt. CarsonSt. CityofCarson ICU AM 0.661 B PM 0.762 C11 WesternAve. 220thSt. CityofLosAngeles CMA AM 0.554 A PM 0.698 B CityofTorrance ICU AM 0.685 B PM 0.819 D12 NormandieAve. 220thSt. CityofLosAngeles CMA AM 0.409 A PM 0.293 A LosAngelesCounty ICU AM 0.549 A PM 0.441 A13 MeylerSt. 220thSt. LosAngelesCounty ICU AM 0.460 A PM 0.446 A14 VermontAve. 220thSt. LosAngelesCounty ICU AM 0.645 B PM 0.696 B15 FigueroaSt. 220thSt./I‐110
NBRampsCityofCarson ICU AM 0.913 E
PM 0.886 D16 WesternAve. 223rdSt. CityofLosAngeles CMA AM 0.822 D PM 0.851 D CityofTorrance ICU AM 0.893 D PM 0.919 E17 NormandieAve. 223rdSt. CityofLosAngeles CMA AM 0.623 B PM 0.701 C LosAngelesCounty ICU AM 0.807 D PM 0.822 D18 MeylerSt. 223rdSt. LosAngelesCounty ICU AM 0.649 B PM 0.578 A19 VermontAve. 223rdSt. LosAngelesCounty ICU AM 0.917 E PM 0.880 D20 I‐110SBRamps 223rdSt. LosAngelesCounty ICU AM 0.755 C PM 0.843 D21 FigueroaSt. 223rdSt. CityofCarson ICU AM 0.827 D PM 0.718 C22 WesternAve. SepulvedaBlvd CityofLosAngeles CMA AM 0.927 E PM 0.990 E CityofTorrance ICU AM 0.957 E PM 1.011 F
A All Intersections are signalized except for #13, Meyler St. and 220th St., which is all way‐stop controlled. Source: Fehr & Peers, 2016

August 2016 4.I Transportation and Traffic
LosAngelesCountyDepartmentofPublicWorks Harbor‐UCLAMedicalCenterCampusMasterPlanProjectSCH#2014111004 4.L‐13
(3) CMP Monitoring Stations
Thefollowingsix(6)CongestionManagementProgram(CMP)arterialmonitoringintersectionsarelocatednearesttotheProjectstudyarea:
WesternAvenue&CarsonStreet(CityofTorrance)
WesternAvenue&190thStreet(CityofTorrance)
WesternAvenue&SepulvedaBoulevard(CityofTorrance)
PacificCoastHighway&WesternAvenue(CityofLosAngeles)
PacificCoastHighway&FigueroaStreet(CityofLosAngeles)
ArtesiaBoulevard&VermontAvenue(CityofGardena)
TheCMPProgramisdiscussedfurtherbelow.
(4) Public Transit and Alternative Transportation Facilities
(a) Public Transit Service
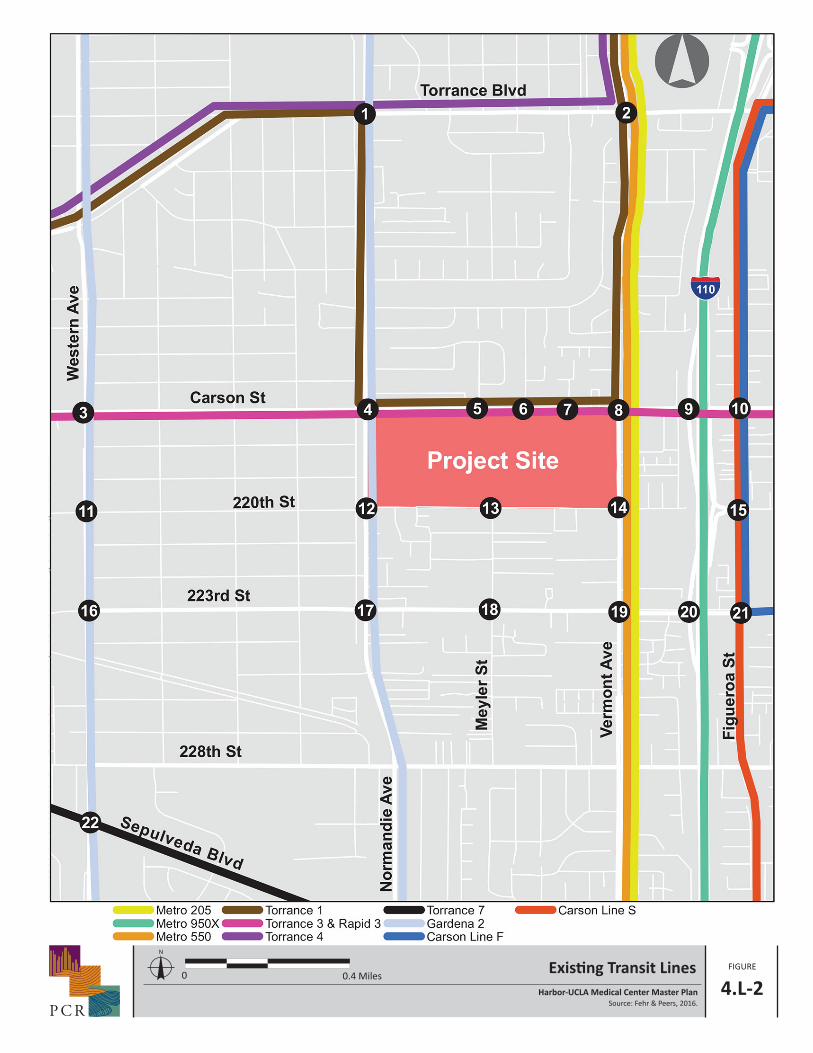
The Project area is served by bus lines operated by Los Angeles County Metropolitan TransportationAuthority (Metro), Torrance Transit, Carson Circuit and Gardena Municipal Bus. Figure 4.L‐2, ExistingTransitLines, illustrates the existing transit service in the study area. The following is a summary of thetransitservicesintheProjectvicinity:
MetroLine205–Line205isanorth/southlinethatrunsfromtheWillowbrook/RosaParksStationtoSanPedro. The linehas30‐ to35‐minuteheadwaysduringAM/PMpeakhoursandrunsonVermontAvenuewithin the study area, with stops every few blocks. Project site access is provided via stops at theintersectionsofVermontAvenue&CarsonStreetandVermontAvenue&220thStreet.
MetroLine950X–Line950Xisanorth/southlinethatrunsfromdowntownLosAngelestoSanPedroviatheHarborFreewayandprovideslimitedservice. Thelinehas12‐to30‐minuteheadwaysduringAM/PMpeakperiodsandrunsontheHarborFreewaywithin thestudyarea. Projectsiteaccess isprovidedviaastopatCarsonStreet.
MetroLine550–Line550isanorth/southlinethatrunsfromtheUniversityofSouthernCaliforniatoSanPedro. The linehas30‐ to35‐minuteheadwaysduringAM/PMpeakhoursandrunsonVermontAvenuewithinthestudyarea,withstopsatTorranceBoulevardandCarsonStreet. ProjectsiteaccessisprovidedviaastopattheintersectionofVermontAvenue&CarsonStreet.
CarsonCircuitLineF–LineFtravelsonalooproutethatrunsprimarilyalong223rdStreet,FigueroaStreet,213thStreetandMartinStreet.Thelinehas40‐minuteheadwaysduringAMandPMpeakperiodsandrunson 223rd Street and Figueroa Streetwithin the study area,with stops at Figueroa Street& 223rd Street,FigueroaStreet&220thStreet,FigueroaStreet&CarsonStreet,CarsonTownCenter,andFigueroaStreet&TorranceBoulevard.

4.l. Transportation and Traffic August 2016
LosAngelesCountyDepartmentofPublicWorks Harbor‐UCLAMedicalCenterCampusMasterPlanProjectSCH#2014111004 4.L‐14
CarsonNorth/SouthShuttleLineS–LineS isanorth/southlinethatrunsfromWilmingtontotheHarborGateway Transit Center and providesmorning and afternoon peak period service only. The line has 50‐minuteheadwaysandrunsonFigueroaStreetwithinthestudyarea,withstopsatFigueroaStreet&223rdStreet,FigueroaStreet&220thStreet,FigueroaStreet&CarsonStreet,CarsonTownCenter,andFigueroaStreet&TorranceBoulevard.
TorranceTransitLine1–Line1runsfromDelAmoFashionCentertotheHarborGatewayCenter.Thelinerunseast/westalongTorranceBoulevard,north/southalongNormandieAvenueandVermontAvenueandeast/west along Carson Streetwithin the study area,with stops at every few blocks. The Project Site isserved by two stops along Carson Street with 40‐ to 45‐minute headways during the AM and PM peakperiods.
TorranceTransitLine3–Line3isaneast/westlinethatrunsfromtheRedondoBeachPiertodowntownLongBeach.ThelinerunsalongCarsonStreetwithinthestudyareawith20‐to25‐minuteheadwaysduringtheAMandPMpeakperiodsandstopsateveryfewofblocks.
TorranceTransitLineRapid3–LineRapid3isaneast/westlinethatrunsfromtheSouthBayGalleriatodowntownLongBeachand travelsmuchof thesamerouteasLine3adding frequentservice to thestudyareabetween6:30and8:30AMandbetween2:30and6:00PM.ThelinerunsalongCarsonStreetwithinthestudy area andprovides servicewithheadwaysbetween10 and20minutesduring theAMandPMpeakperiods. StopsareprovidedatCarsonStreet&WesternAvenue,CarsonStreet&NormandieAvenue,andCarsonStreet&VermontAvenuewithinthestudyarea.
TorranceTransitLine4–Line4isanorth/southexpresslinethatrunsfromtheintersectionofHawthorneBoulevardandthePacificCoastHighwaytodowntownLosAngeles.Thelinetravelseast/westonTorranceBoulevard and north/south on Vermont Boulevardwithin the study areawith stops located at TorranceBoulevard & Western Avenue, Torrance Boulevard & Normandie Avenue, and Torrance Boulevard &VermontAvenue. The lineoperates between5:30 and8:50AMandbetween3:30 and7:00PMwith40‐minuteheadways.
TorranceTransit Line7 – Line7 is an east/west line that runs from the intersection of Catalina Street&TorranceBoulevard to the intersection of SepulvedaBoulevard&AvalonBoulevard. The line runs alongSepulvedaBoulevardwithinthestudyareawith60‐minuteAMandPMpeakperiodheadwaysandprovidesastopatWesternAvenue&SepulvedaBoulevard.
GardenaMunicipalBusLines2–Line2isanorth/southlinethatrunsfromtheMetroGreenLineVermontStationtotheintersectionofthePacificCoastHighway&NormandieAvenue.ThelinerunsalongWesternAvenue and Normandie Avenue within the study area and provides stops every few blocks. The lineprovidesservicewithheadwaysof15minutesduringAMandPMpeakperiods.
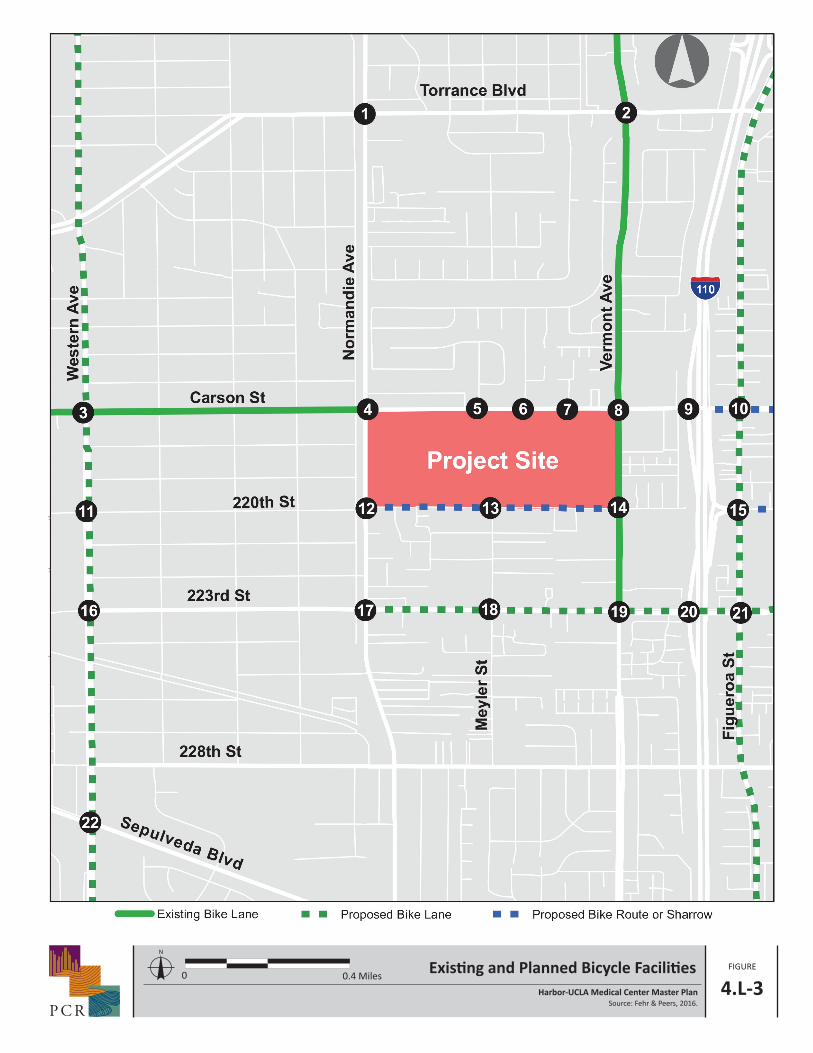
(b) Bicycle and Pedestrian Facilities
Currently,thereislimiteddedicatedbicycleinfrastructureinthestudyarea.EastoftheProjectSite,bicyclelanes (Class II facilities) extend north/south on Vermont Avenue from 223rd Street through the northernedgeofthestudyarea.Aneast/westClassIIfacilityexistsonCarsonStreetbetweenNormandieAvenueand
P C R
FIGUREExis ng Transit Lines
Harbor-UCLA Medical Center Master Plan 4.L-2Source: Fehr & Peers, 2016.
0 0.4 Miles
N

4.l. Transportation and Traffic August 2016
LosAngelesCountyDepartmentofPublicWorks Harbor‐UCLAMedicalCenterCampusMasterPlanProjectSCH#2014111004 4.L‐16
Thispageintentionallyblank.

August 2016 4.l. Transportation and Traffic
LosAngelesCountyDepartmentofPublicWorks Harbor‐UCLAMedicalCenterCampusMasterPlanProjectSCH#2014111004 4.L‐17
Western Avenue. The City of Los Angeles Mobility Plan includes a proposed protected bicycle lane onWesternAvenuewithin the studyarea. TheLosAngelesCountyBicycleMasterPlan includesaproposedClass II bicycle laneon223rdStreetbetweenNormandieAvenue and theHarborFreewayand aClass IIIbicyclerouteon220thStreetbetweenNormandieAvenueandVermontAvenue.TheCityofCarsonMasterPlan of Bikeways includes proposed buffered bicycle lanes on Figueroa Street south of 223rd Street andbicyclelanesnorthof223rdStreetwithinthestudyarea.Theplanalsocallsforbufferedbikelaneson223rdStreet,sharrows2onCarsonStreetandbicyclelaneson220thStreetintheCityofCarsonportionofthestudyarea. Existing and planned bicycle facilities are illustrated in Figure 4.L‐3, Existing and Planned BicycleFacilities.PedestriantraffictypicallyenterstheMedicalCenterCampusfromoneoftheparkingstructures,parking lots or from the nearby transit stops. The Medical Center Campus is located in an establishedneighborhoodwith amoderate population density. All of the streets immediately bordering theMedicalCenter Campus andnearly all of theother streets in the vicinity include sidewalks, facilitatingpedestrianmovement.Markedcrosswalksarepresentatmostintersectionsinthestudyarea.Pedestrianwalkphasesareeitherautomaticallyprovidedattheintersectionsorareactuatedbypedestrianpush‐buttons.
(5) Existing Project Site Vehicular Circulation
VehicularaccesstotheHarbor‐UCLAMedicalCenterCampus,asillustratedbelowinFigure4.L‐4,ExistingSiteCirculation,isprovidedbyaprimarydrivewayonCarsonStreet,neartheExistingHospitalandaseconddriveway west of the primary driveway; two driveways on Vermont Avenue; five driveways along 220thStreet;andonedrivewayonNormandieAvenue.OnlytheCarsonStreetdrivewaysaresignalized.Internalcirculationon‐sitefollowstheoriginalgridlayoutestablishedontheproperty,withfoureast‐westroadwaysandnumerousshortnorth‐southconnectorroadways.Mostinteriorintersectionsoftworoadwaysordriveaisles are stop‐sign controlled. To aidwayfinding,most of the internal roadways are named and displaystreetnamesignsatintersections.Inaddition,mostbuildingsormodularstructureshaveabuildingnumber(consistingofaletterandanumber)orabuildingname,orboth,visibletodrivers.However,fewdirectoryboardsarelocatedwithintheMedicalCenterCampus,andwayfindingformotoristsaswellaspedestrianscanbeconfusing.ContributingtothisconfusionisthelackofdistinctionsbetweenMedicalCenterCampusentrancesandparkingareasforHarbor‐UCLAstaffandthoseforthegeneralpublic.
(6) Parking Facilities
Existing parking facilities consist primarily of on‐site surface parking lots and one multi‐level parkingstructure located at the southeast corner of theMedical Center Campus, aswell as three off‐site surfaceparking lots. On‐siteparking facilities at theMedicalCampusare illustrated inFigure2‐5 inChapter2.0,ProjectDescription,ofthisDraft.ThelargerparkinglotsaregenerallydistributedalongtheMedicalCenterCampusperimeter,withsmallerlotsthroughouttheMedicalCenterCampusinterior;parkingisallowedononeorbothsidesofinternalroadways,thoughincidentalon‐streetparkingalsooccursinareasnotofficiallydesignatedasparkingareas,asdiscussedbelow.
The on‐site parking supply totals 2,905 spaces,which exceeds the County’s parking code requirement of2,709spaces.Specifically,asdiscussedinfurtherdetailbelowunderRegulatoryFrameworkSummary,LosAngelesCountyCode,Section22.52.1120,Hospitals,ConvalescentHospitals,AdultResidentialFacilities,and
2 Sharrowsarechevronscombinedwithbicyclestencilsplaced in thecenterofa travel lane.They indicate thatbicyclesandmotor
vehiclessharethelane.Theseareoftentimesaccompaniedbysignagesuchas“bicyclistscanusefulllane”.

4.l. Transportation and Traffic August 2016
LosAngelesCountyDepartmentofPublicWorks Harbor‐UCLAMedicalCenterCampusMasterPlanProjectSCH#2014111004 4.L‐18
GroupHomesforChildren,requires2spacesperbed,1spaceper250squarefeet foroutpatient facilities,and 1 space per 400 square feet for research use. This supply includes 2,168 standard spaces and 124American with Disabilities Act (ADA) spaces in designated surface parking lots and the new parkingstructureinthesoutheasterncorneroftheHarbor‐UCLAMedicalCenterCampus,and596standardspacesand17ADAspacesalongtheinternalstreets.Anadditional281spaces(278standardspacesandthreeADAspaces)areprovidedinoff‐siteparkingfacilities,andstreetparkingispermittedalongallorportionsofthefourpublicstreetssurroundingtheMedicalCenterCampus.However,parkingisnotuniformlyutilized,withparking for the Existing Hospital Tower and other facilities near the eastern end of the Medical CenterCampusandalongthenorthernperimeterexperiencingseverelocalizedshortfalls,whileinotherlocations,designated parking for specific facilities is underutilized. A considerable number of makeshift parkingspaceshavebeencreatedalonginternalroadwaystoaccommodatelocalizeddemand,thoughmanyoftheseareas are not designated for on‐street parking. Moreover,most of the interior roadways do not providesidewalksorcurbsandpedestriansmustsharetheroadwayswithvehicletraffic,adverselyaffectingaccess,includingdisabledaccess,tofacilitiesthroughouttheHarbor‐UCLAMedicalCenterCampus.
b. Regulatory Framework Summary
(1) Federal
Nofederaltraffic/transportationregulationsapplytotheProject.
(2) State
(a) Statewide Transportation Improvement Program
Caltrans administers transportation programming, which is the public decision‐making process that setspriorities and funds projects envisioned in long‐range transportation plans. Caltrans commits expectedrevenuesoveramulti‐yearperiodtotransportationprojects. TheStatewideTransportationImprovementProgram(STIP)isamultiyearcapitalimprovementprogramoftransportationprojectsonandofftheStateHighwaySystem,fundedwithrevenuesfromtheStateHighwayAccountandothersources.
(b) Congestion Management Program
TheCongestionManagementProgram(CMP)isastate‐mandatedprogramenactedbytheStatelegislaturetoaddress the increasing concern that urban congestion is affecting the economic vitality of the state anddiminishing the quality of life in some communities. The 2010 CMP is the eighth CMP adopted for LosAngelesCountysincetherequirementbecameeffectivewiththepassageofProposition111in1990. Thehallmark of theCMPprogram is that it is intended to address the impact of local growth on the regionaltransportationsystem.StatutoryrequirementsoftheCMPincludemonitoringLOSontheCMPHighwayandRoadway network, measuring frequency and routing of public transit, implementing the TransportationDemand Management and Land Use Analysis Program and helping local jurisdictions meet theirresponsibilities under the CMP. Metro, the local CMP agency, has established a countywide approach toimplement the statutory requirements of the CMP in their governing 2010 CMP for Los Angeles County.Pleaseseediscussionbelow.
P C R
FIGUREExis ng and Planned Bicycle Facili es
Harbor-UCLA Medical Center Master Plan 4.L-3Source: Fehr & Peers, 2016.
0 0.4 Miles
N
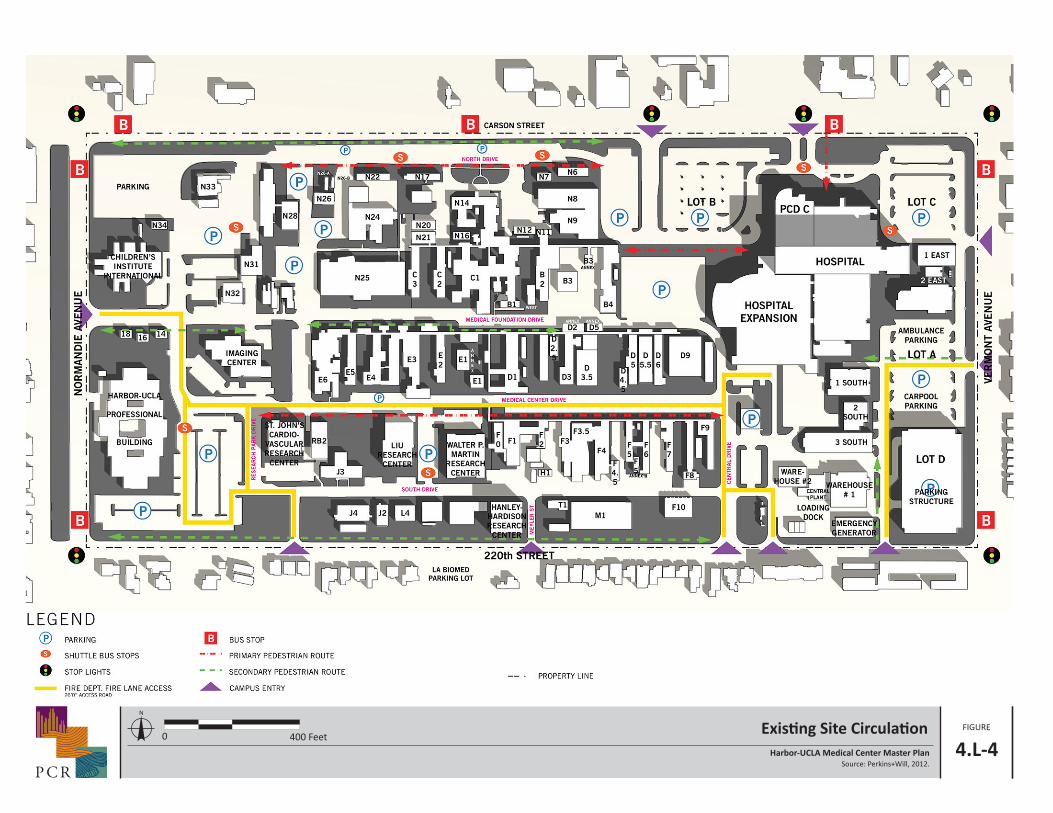
FIGUREExis ng Site Circula on
Harbor-UCLA Medical Center Master Plan 4.L-4Source: Perkins+Will, 2012.
P C R
0 400 Feet
N
August 2016 4.l. Transportation and Traffic
LosAngelesCountyDepartmentofPublicWorks Harbor‐UCLAMedicalCenterCampusMasterPlanProjectSCH#2014111004 4.L‐21
(c) Senate Bill No. 743
OnSeptember27,2013,GovernorBrownsignedSenateBill(SB)743,whichbecameeffectiveonJanuary1,2014.ThepurposeofSB743istostreamlinethereviewunderCEQAforseveralcategoriesofdevelopmentprojects including the development of infill projects in transit priority areas. The bill adds to the CEQAStatute,CaliforniaPublicResourcesCodeChapter2.7,ModernizationofTransportationAnalysisforTransit‐OrientedInfillProjects,Section21099.PursuanttoSection21099(d)(1)“Aestheticandparkingimpactsofaresidential,mixed‐useresidential,oremploymentcenterprojectonaninfillsitewithinatransitpriorityareashallnotbeconsideredsignificantimpactsontheenvironment.”3TheprovisionsofSB743applytoprojectslocatedona“lotwithinanurbanareathathasbeenpreviouslydeveloped,oronavacantsitewhereatleast75percentoftheperimeterofthesiteadjoins,orisseparatedonlyby,animprovedpublicright‐of‐wayfrom,parcelsthataredevelopedwithqualifiedurbanuses….anditislocatedwithinone‐halfmileofamajortransitstop.”4 The Projectwouldmeet the criteria set forth in SB743because it (1) is locatedwithin a transitpriority area less than one‐halfmile from theHarbor Freeway/Carson Station TOD (connection toMetroSilverLine)and(2)comprisesanemploymentcenterwithinanestablishedurbanarea.UnderSB743,theProjectwouldbeexemptfromfindingsofsignificancerelatedtoparkingeffects.However,forthepurposeofthisEIR,parkingeffectsareevaluatedforinformationalanddisclosurepurposes.
(3) Regional
(a) Southern California Association of Governments’ Regional Transportation Plan
The Southern California Association of Governments’ (SCAG) Regional Transportation Plan (RTP) is afederal‐andState‐mandatedtransportationplanthatenvisionsthefuturemultimodaltransportationsystemfor the region and provides the basic framework for coordinated, long‐term investment in the regionaltransportation system over the RTP planning horizon of 2035. In compliance with State and federalrequirements, SCAG prepares the RTIP to implement projects and programs listed in the RTP. Updatedevery other year, theRTP lists all transportationprojects proposed for the region over a six‐year period.Transportation projects proposed in the region are required to be consistentwith the RTP and includedwithintheRTIPtobeeligibleforStateorfederalfunding.
The 2016‐2040 Regional Transportation Plan/Sustainable Communities Strategy (2016 RTP/SCS) wasadoptedbySCAGonApril7,2016. The2016RTP/SCSidentifiesmobilityasanimportantcomponentofamuch larger picture with added emphasis on sustainability and integrated planning. In addition, theRTP/SCS includes goals and policies that pertain to mobility, accessibility, safety, productivity of thetransportation system, protection of the environment and energy efficiency, and land use and growthpatternsthatcomplementtheStateandregion'stransportationinvestments.AnintegralcomponentoftheRTP/SCSisastrongcommitmenttoreduceemissionsfromtransportationsourcesinordertocomplywithSenateBill375,improvepublichealth,andmeettheNationalAmbientAirQualityStandardsassetforthbytheCleanAirAct. For furtherdiscussionofairqualityandgreenhousegasemissions, seeSection4.B,AirQuality,andSection4.E,GreenhouseGasEmissions,respectively,ofthisDraftEIR.
3 Section21009(2)(B)clarifies that “For thepurposesof this subdivision,aesthetic impactsdonot include impactsonhistoricalor
culturalresources.”4 PerdefinitionsincludedinSection21099(a).

4.l. Transportation and Traffic August 2016
LosAngelesCountyDepartmentofPublicWorks Harbor‐UCLAMedicalCenterCampusMasterPlanProjectSCH#2014111004 4.L‐22
(b) Los Angeles County Congestion Management Program
TheCMPisaState‐mandatedprogramenactedbytheStatelegislaturetoaddresstheincreasingconcernthaturbancongestion isaffecting theeconomicvitalityof theStateanddiminishing thequalityof life in somecommunities. The 2010 CMP is the eighth CMP adopted for Los Angeles County since the requirementbecameeffectivewiththepassageofProposition111in1990.ThehallmarkoftheCMPprogramisthatitisintended to address the impact of local growth on the regional transportation system. Statutoryrequirements of the CMP includemonitoring LOS on the CMPhighway and roadway network,measuringfrequencyand routingofpublic transit, implementing theTransportationDemandManagement andLandUseAnalysisProgram,andhelpinglocaljurisdictionsmeettheirresponsibilitiesundertheCMP.
LosAngelesCountyMetropolitanTransportationAuthority(Metro),thelocalCMPagency,hasestablishedacountywideapproach to implement thestatutoryrequirementsof theCMP in itsgoverning2010CMP forLos Angeles County. The CMP identifies a system of highways and roadways with minimum levels ofservice performance measurements designated at LOS E (unless exceeded in base year conditions) forhighwaysegmentsandkeyroadway intersectionson thissystem. IfLOSstandardsdeteriorate, then localjurisdictionsmustprepareadeficiencyplantobeinconformancewiththecountywideplan.
TheCMPrequiresthat,whenanEIRispreparedforaproject,trafficandpublictransit impactanalysesbeconductedforselectregionalfacilitiesbasedonthequantityofprojecttrafficexpectedtousethosefacilities.Mixed‐use developments that meet minimum density requirements and that are located within a one‐quartermileradiusofafixedrailstationareexemptfromCMPanalysis.TheCMPguidelinesstatethatareasselectedforanalysisshouldbethosethatincludethefollowinglocations:
AllCMParterialmonitoringintersections,includingmonitoredon‐oroff‐rampintersections,wheretheproposedprojectwilladd50ormoretripsduringeitherthemorningorafternoonweekdaypeakhoursofadjacentstreettraffic;and
Mainline freewaymonitoring locationswhere the proposed projectwill add 150 ormore trips, ineitherdirection,duringeitherthemorningorafternoonweekdaypeakhours.
Ifaprojectaddsmoretrafficthantheminimumthresholdamounttoanintersection,thenthatintersectionhas to be analyzed for deficiencies. The analysis must investigate measures which will mitigate thesignificantCMPsystemimpacts;developcostestimates,includingthefairsharecoststomitigateimpactsoftheproposedproject;andindicatetheresponsibleagency.InLosAngelesCounty,animpactisconsideredsignificantiftheprojectrelatedincreaseintheV/CratioequalsorexceedsthethresholdsnotedbelowunderThresholdsofSignificance.
(4) Local
(a) County of Los Angeles
(i) Los Angeles County General Plan 2035
The Mobility Element, included as Chapter 7 of the Los Angeles County General Plan 2035, provides anoverview of the transportation infrastructure and strategies for developing an efficient and multimodaltransportationnetwork.TheElementassessesthechallengesandconstraintsoftheCountytransportationsystemandofferspolicyguidancetoreachtheCounty’slong‐termmobilitygoals.TheElementincludestwosub‐elements,theHighwayPlanandtheBicycleMasterPlan.Theseplansestablishpoliciesfortheroadway

August 2016 4.l. Transportation and Traffic
LosAngelesCountyDepartmentofPublicWorks Harbor‐UCLAMedicalCenterCampusMasterPlanProjectSCH#2014111004 4.L‐23
andbikewaysystemsintheunincorporatedareas,whicharecoordinatedwiththenetworksinthe88citiesin theCounty. TheGeneralPlanalsoestablishedaprogramtopreparecommunitypedestrianplans,withguidelinesandstandardstopromotewalkabilityandconnectivitythroughouttheunincorporatedareas.
(ii) West Carson Transit Oriented District (TOD) Specific Plan
TheLosAngelesCountyDepartment ofRegionalPlanning is currentlypreparing theWestCarsonTransitOrientedDistrict(TOD)SpecificPlan. ThePlanaimsto improveaccesstotransit,housing,andjobs,whilecreating a healthier, safer environment for walking and biking. The final document will be based oncollaborativeeffortswithresidents,otherCountyagencies,adjacentcities,andotherstakeholders,andwillcontainstandardsforzoningandlanduseaswellasamobilitystrategy,aneconomicdevelopmentstrategy,acapitalimprovementplan,andurbandesignguidelinesfortheWestCarsonTODarea,whichincludestheHarbor‐UCLAMedicalCenterCampus.
(iii) Parking Requirements
Section 22.52.1120 of the County Code applies to parking for hospitals, convalescent hospitals, adultresidentialfacilitiesandgrouphomesforchildren.AccordingtoSection22.52.1120:
a. Everyhospitalshallhavetwoautomobileparkingspaces,plusadequateaccessthereto,foreachpatientbed. Theparkingmaybewithin500feetoftheexteriorboundaryofthe lotorparcelcontaining themain use. At least 25 percent of the required parking shall be reserved andmarkedfortheuseofemployeesonly.
b. Outpatientclinics,laboratories,pharmaciesandothersimilarusesshallhaveoneparkingspaceforeach250squarefeetoffloorareawhenestablishedinconjunctionwithahospital.
c. Everyconvalescenthospitalshallhaveanamountofautomobileparkingspacesnot less thanthenumberof residentspermittedbyany licenseorpermitwhichallows themaintenanceofsuchfacility.Ifemployeedwellingunitsareprovidedonthepremisesthereshallbe,inadditionto the automobile parking spaces required for the principal use, the number of automobileparkingspacesrequiredbythisPart11forresidentialuses.
d. Everyadultresidentialfacilityandgrouphomeforchildrenshallhaveoneautomobileparkingspace foreach staffmemberon the largest shiftandoneparking space foreachvehicleuseddirectlyinconductingsuchuse.
With regard tobicycleparking, Section22.52.1225of theCountyCode applies to theprovision of bicycleparking and related facilities. According to Section 22.52.1225, theminimum number of short‐term andlong‐termbicycleparkingspacesforaparticularuseshallbeprovidedinaccordancewiththerequirementsforeachparticulartypeoflanduse.Foracombinationofusesonasinglelot,thenumberofrequiredbicycleparkingspacesshallbeequal to thecombined totalof therequiredbicycleparkingspaces foreachof theindividualuses.Forpurposesofthiscalculation,whenfloorareaisused,allcalculationsforthespecificuseshallbebasedongross floorarea, including thegross floorareaofanyproposedaddition to the involvedstructureorsite.ThefollowingrequirementsprovidedinSection22.52.1225applytoexistingandproposedusesontheMedicalCenterCampus.

4.l. Transportation and Traffic August 2016
LosAngelesCountyDepartmentofPublicWorks Harbor‐UCLAMedicalCenterCampusMasterPlanProjectSCH#2014111004 4.L‐24
Institutionaluses, includinghospitals, convalescenthospitals, adult residential facilities, andgrouphomes for children: Short‐term ‐ One space per each 20,000 square feet of gross floor area (twospaceminimum);Long‐term‐Onespacepereach10,000squarefeetofgrossfloorarea(twospaceminimum)
(b) City of Los Angeles
(i) Mobility Plan 2035
TheCityofLosAngelesMobilityPlan2035,whichwasapprovedbyLosAngelesCityCouncilonAugust11,2015, isacomprehensiveupdateoftheCity’sTransportationElementandincorporates“completestreets”principles. GovernmentCodeSections65302(b)(2)(A)and(B)requireacirculationelement(i.e.,MobilityPlan) to provide for a balanced,multimodal transportation network that meets the needs of all users ofstreet, roads, and highways. “All users” by definition in the statute is “bicyclists, children, persons withdisabilities,motorists,moversofcommercialgoods,pedestrians,usersofpublictransportation,andseniors.”This requirement was established as part of Assembly Bill 1358, which is referred to as the CaliforniaComplete Streets Act, as well as Caltrans Deputy Directive DD‐64‐R1, Complete Streets: Integrating theTransportationSystem.
TheMobility Plan 2035 addresses the expanded definition of streets that has fundamentally changed therelationshipofpeoplewithstreets.ThePlanalsorespondstochangingdemographicsintheCity,includingpeoplewantingsafeandaccessibleactivetransportationoptionsandalternativestotheautomobileaswellasanagingpopulationneedingtorelyonalternativestotheautomobile. TheMobilityPlanalsoaddressestheroleof transportation intheCity’seconomicvitality. ThePlanservestomeetthegoal intheRegionalTransportationPlantodecreasethevehiclemilestraveled(VMT)percapitabyfivepercenteveryfiveyears,to20percentby2035and tomeetaninepercentpercapitagreenhousegas reductionby2020anda16percentpercapitareductionby2035.
The Mobility Plan 2035 identifies Transit Enhanced Network (TEN), a Neighborhood Enhanced Network(NEN) to support pedestrian activity, and an expanded Bicycle Enhanced Network (BEN). Among otherprovisionstheMobilityPlan2035includesroadwaydesignationspursuanttoupdatedpoliciesandcurrenttransportationneedsintheCity.
MobilityPlan2035includesgoalsthatdefinetheCity’sfivemainpriorities:1)SafetyFirst;2)WorldClassInfrastructure;3)AccessforAllAngelenos;4)Collaboration,CommunicationandInformedChoices;and5)CleanEnvironmental&HealthyCommunities.
The2010BicyclePlan,whichispartoftheMobilityPlan2035,guidesthedevelopmentofacitywidebicycletransportation system. TheBicycle Plan recognizes the growing needs of the cycling public and seeks tofurther reduce the barriers to greater utilization of bicycles for both personal transportation and forrecreation.Particularemphasisisplacedonbicyclingasacommuteoption.Theoverallintentistoexpandbicycleusagethroughfurtherdevelopmentofbicycleridingfacilitiesandimprovementofexistingfacilitiesalongwithappropriatesupportprograms.TheBicyclePlanestablishesstandardsfordevelopmentofthesefacilities,aswellascriteriaforprioritizationofdevelopmentofdesignatedroutes.

August 2016 4.l. Transportation and Traffic
LosAngelesCountyDepartmentofPublicWorks Harbor‐UCLAMedicalCenterCampusMasterPlanProjectSCH#2014111004 4.L‐25
Witha statedpolicy to reduceautomobile trips andgreenhousegas emissionsbymaking5percentof alldaily trips and 3 percent of commute trips bicycle trips by 2020, the 2010 Bicycle Plan establishes aBackboneNetworkandNeighborhoodNetworklinkingRegionalCenterstopromotebicycleusage.
(c) City of Carson
(i) Carson General Plan Transportation and Infrastructure Element
Thepurposeof theCityofCarsonGeneralPlanTransportationandInfrastructureElement is todocumentthemethodsandresultsoftheanalysisoftheexistingandprojectedfuturecirculationconditionsintheCityof Carson. As part of theGeneral Plan, this document outlines Transportation and Infrastructure SystempoliciesanddescribesthefuturecirculationsystemneededtosupporttheLandUseElement. Inaddition,thisElementaddressespublicutilitiesandinfrastructure.
(d) City of Torrance
(i) Torrance General Plan Circulation and Infrastructure Element
The Torrance General Plan Circulation and Infrastructure Element plans for the efficient and effectivemovementofpeople andgoodsbetweendestinationswithinTorranceand throughout the region.Awell‐plannedcirculationsystemisahighpriority,giventhatTorranceplaysauniqueroleinthegeographyoftheSouthBayRegion. Creative solutions, technology, right‐of‐wayacquisition, andcooperationwithadjacentcities are keys to addressing circulation issues and managing growth. While the Circulation andInfrastructureElementrecognizesthatautomobileswillremaintheleadingmodeoftransportationformostTorrance residents and visitors, the objectives and policies included in this Element also stress theimportanceofaccommodatingandencouragingalternativestoautomobiletravel.Theprovisionoffacilitiesfor pedestrians and bicycles and a comprehensive transit system will ensure that non‐automobiletransportation isaconvenientalternative. Inadditiontoplanning for theCity’s long‐termmobilityneeds,thisElementalsoaddressesthecirculationofenergy,water,sewage,stormdrainage,andcommunications.
3. ENVIRONMENTAL IMPACTS
a. Methodology
The analysisofpotential transportationandparking impacts considerspotentialproject effects related toconstruction, intersection service levels, roadway segments, the regional transportation system (i.e., CMPanalysis), Caltrans facilities (freeway mainline segments, Caltrans intersections, and off‐ramp queuing),public transit and other alternative transportation modes, vehicular access and circulation, and parkingsupply.
(1) Construction Traffic Impacts
Theanalysisofconstructiontrafficincludesadeterminationofthenumberofconstruction‐relatedtrips(i.e.,construction worker trips and construction truck trips) that would occur as a result of the Project, thecontributions of those trips to the local traffic system, and an analysis of the potential conflicts betweenconstruction activity and on‐going activity in the Project vicinity. The potential impact of constructiontraffic,includinghaultrucks,wouldbealesseningofthecapacitiesofaccessstreetsandhaulroutesduetoslowermovementsandlargerturningradiioftrucks.

4.l. Transportation and Traffic August 2016
LosAngelesCountyDepartmentofPublicWorks Harbor‐UCLAMedicalCenterCampusMasterPlanProjectSCH#2014111004 4.L‐26
(2) Operational Traffic Impacts
(a) Intersection Service Levels
Themethodologyforevaluatingoperationalintersectiontrafficimpactsinvolvesseveralsteps,includingtheidentificationofexistingtrafficconditionsatallProjectstudyintersectionsandthedeterminationofexistingconditionswith the Project traffic, Interim Year baseline conditionswithout andwith Project traffic, andfuturecumulativeFullBuildoutoperatingyearbaselineconditionswithoutandwithProjecttrafficatthe22studyintersections.
Weekdaymorningandeveningpeakhourtrafficcountswereconductedatthe22analyzedintersectionsinOctober2014,May2015,November2015andDecember2015.ExistingpeakhourweekdaytrafficvolumesareillustratedinFigure5oftheTrafficStudy.
(i) Trip Generation
Vehicletripgeneration fortheProjectwasestimatedusingacombinationof:standardratesdevelopedbythe ITEandpublished inTripGeneration,9thEdition and tripgeneration reduction rates for similar sites.FortheHospital’sinpatientfacilities(ITECode610),theanalysisusedthenumberofbedstoestimatetripgeneration. The proposed new hospital tower would provide more spacious facilities consistent withcurrentbestpractices,meaningthatthenewfacilitywillrequiremorefloorareaperbed.
Asthissite is locatedadjacenttotransit,mixeduses,andfallswithintheLosAngelesCountyWestCarsonTransitOrientedDistrictSpecificPlan,itstripgenerationpatternislikelytodeviatefromthedatacollectionsiteswhereratesfromITEweredrawn. Internaltripcredits,definedasareductionthatcanbeappliedtothetripgenerationestimatesduetotripsmadewithinthesitebetweenlanduses,arealsoappliedatarateof20%ofthedailyandpeakhourtripstoalllandusesonthesite.Manyofthebuildingsandactivitiesonthe Harbor‐UCLA Medical Center Campus are related to one another, and this will continue as the sitecontinuestoaddcomplementaryuses.TheinternaltripcreditswereestimatedbasedontherecommendedfactorsprovidedinTripGeneration,9thEdition;reviewof trafficstudies forprojects located intheregion;andconsultationwithcountystaffaspartoftheMOUprocess.
A7%transitcreditanda2%walkcreditwereappliedtothealllandusesonthesite.Thesecreditsaccountfor trips toand fromtheProjectSiteusingmodesother thanautomobiles. These include tripson transit,bicycle,walk,etc. Thesiteis locatedwithinwalkingdistancetotheseveralMetroandmunicipalbuslinesincluding two express lines, and is in close proximity to awide diversity of land useswithin reasonablewalkingdistance.
(ii) Trip Distribution
The geographic distribution of the traffic generated by the proposed Project depends on several factors.Thesefactorsincludethetypeanddensityoftheproposedlanduses,thegeographicdistributionfromwhichpatientsandstaffaredrawn,andthelocationoftheProjectinrelationtothesurroundingstreetsystem.Thegeneraldistributionpatternusedinthistrafficstudywasdevelopedinconsultationwithcountystaffandisillustrated in Figure 6 of the Traffic Study. Aggregateddata on existing staff home zip codes andpatienthomezipcodeswasusedtodetermineexistingoriginsfortripscomingtoandleavingfromtheProject.

August 2016 4.l. Transportation and Traffic
LosAngelesCountyDepartmentofPublicWorks Harbor‐UCLAMedicalCenterCampusMasterPlanProjectSCH#2014111004 4.L‐27
(iii) Traffic Assignment
ThetrafficexpectedtobegeneratedbytheproposedProjectwasassignedtothestreetnetworkusingthedistribution pattern described in Figure 6 of the Traffic Study. Project trafficwas assigned based on thevehicleaccessandcirculationdiagramfromtheHarbor‐UCLAMasterPlan,asseeninFigure4.L‐5,ProposedVehicularAccessandCirculation.Figure8intheTrafficStudyillustratestheassignmentofProjecttrafficfortheInterimDevelopmentscenarioateachofthe22intersectionsanalyzedinthisstudy,andFigure9oftheTrafficStudyillustratestheassignmentofFullBuildoutProjecttraffic.
(iv) Future Cumulative Analysis (Interim Year and Full Buildout Year Conditions)
Future Street Network Changes
TheexistingtrafficsignalattheintersectionofWesternAvenueandCarsonStreetwillbemodifiedtoincludeaprotected/permittedleftturnphaseattheeastandwestapproaches.Theexistingsignalisbeinginstalledby the City of Los Angeles in consultationwith Caltrans and the City of Torrance using funding from theHighway Safety Improvement Program (HSIP). As part of the proposed project, the southern leg of theintersection of Carson Street &Medical Center Drive,which serves as an entrance point toHarbor‐UCLAMedical Center, would be closed and a new entrance will be opened on Carson Street between BudlongAvenueandNormandieAvenue.
Interim Year and Full Buildout Year Base Traffic Generation
InordertoevaluatethepotentialimpactoftheProjectinthefutureonthesurroundingstreetsystem,itwasnecessarytodevelopestimatesoffuturetrafficconditionsbothwithandwithouttheProject.Futuretrafficvolumes without the Project were first estimated, representing the Interim base conditions and theCumulativebaseconditions.ThetripsgeneratedbytheProjectarethenestimatedandseparatelyassignedtothesurroundingstreetsystem.
The Interim and Cumulative base traffic projections reflect growth in traffic from two primary sources:backgroundorambientgrowthintheexistingtrafficvolumestoreflecttheeffectsofoverallregionalgrowthbothinandoutsideofthestudyarea,andtrafficgeneratedbytherelatedprojectsin,orinthevicinityof,thestudyarea.Thesefactorsaredescribedbelow.
Ultimately,theProject’saddedincrementiscomparedtothesignificancethresholdstodeterminewhetherthe Project‐generated traffic would result in a significant impact in the Future (Year 2023 and 2030)scenarios.
Areawide Traffic Growth
AspartoftheMOUprocesswithCountystaff,anareawidetrafficgrowthof0.73%peryearwasagreeduponfor the study area. Future increases in the background traffic volumes due to regional growth anddevelopmentareexpectedtocontinueat thisrate,at least through2030. Forthe Interimanalysisperiod,existing baseline traffic volumes were adjusted upward by a factor of 6.8% to reflect areawide regionalgrowthupto2023.Withtheprojectedcompletiondateof2030fortheMedicalCenter,theexistingbaselinetraffic volumeswere adjustedupwardby a factor of 12.3% to reflect areawide regional growthup to theCumulativeperiod. ThemethodologyprescribedbyLosAngelesCountydoesnotincludeaddingareawidetrafficgrowthtoexistingvolumes.

4.l. Transportation and Traffic August 2016
LosAngelesCountyDepartmentofPublicWorks Harbor‐UCLAMedicalCenterCampusMasterPlanProjectSCH#2014111004 4.L‐28
Cumulative Projects Traffic Generation
Asindicatedabove,thesecondmajorsourceoftrafficgrowthinthestudyareais fromspecificcumulativedevelopmentprojects,alsocalledrelatedprojects,expectedtobebuiltinthevicinityoftheProjectSitepriortotheproposedbuildout.DatadescribingcumulativeprojectsintheareawasdevelopedusinginformationobtainedfromLosAngelesCountyDepartmentofRegionalPlanning,LADOT,CityofCarsonDepartmentofPlanningandCityofTorranceDepartmentofPlanning.Atotalof26relatedprojectswereidentifiedinthesurroundingareaandarelistedinChapter3.0,GeneralDescriptionofEnvironmentalSetting,ofthisDraftEIR.ThelocationsoftherelatedprojectsareillustratedinFigure3‐1,RelatedProjectsMap.
TripgenerationestimatesforrelatedprojectswithintheCityofLosAngeleswereobtainedfromtheLADOT.All other trip generation estimates were determined using standard rates developed by the ITE andpublishedinTripGeneration,9thEdition,orfromdatainthetrafficstudiespreparedfortheprojects.Table6in the Traffic Study presents the resulting trip generation estimates for these related projects. Theseprojections are conservative in that they do not in every case account for either the existing uses to beremovedorthepossibleuseofnon‐motorizedtravelmodes(transit,walking,etc.).Thecumulativeprojectsareexpected togenerateapproximately85,391daily trips, including3,684 tripsduring themorningpeakhourand7,316tripsduringtheeveningpeakhour.
Cumulative Projects Trip Distribution and Traffic Assignment
The geographic distribution of the traffic generated by the cumulative projects is dependent on severalfactors.Thesefactorsincludethetypeanddensityoftheproposedlanduses,thegeographicdistributionofpopulationfromwhichtheemployeesandpotentialpatronsoftheproposeddevelopmentsaredrawn,andthelocationoftheemploymentandcommercialcenterstowhichresidentsofresidentialprojectswouldbedrawn, and the location of the projects in relation to the surrounding street system. If available, tripdistributionfromarelatedproject’strafficstudywasusedinthisanalysis. Whentripdistributionwasnotavailable forarelatedproject, itwasestimatedbasedonthe factorsdescribedabove. Thetripgenerationestimates were assigned to the local street system using the trip distribution pattern described above.Figure 13 of the Traffic Study shows the traffic generated from the cumulative projects at the studyintersections.
(3) Regional Transportation System
(a) Congestion Management Program Analysis
Inaccordancewiththe2010CMP,theimpactsatallCMParterialmonitoringstationstowhichtheProjectwouldadd50ormore tripsduringeither themorningorafternoonweekdaypeakhours,or150ormoretripstoamainlinefreewaymonitoringstation,requiredtobeexamined.TheCMPanalysisevaluatessix(6)arterialmonitoringstationsandsix(6)freewaymainlinemonitoringstationsinthestudyarea.
(b) Caltrans Facilities Analysis
ImpactstoCaltrans’StateHighwayfacilitieswereevaluatedaccordingtotheguidelinesfoundintheGuidefor the Preparation of Traffic Impact Studies (Caltrans, 2002) (Caltrans TIS Guide). The analysis of theCaltransfacilitieswasbasedontheCaltranscommentlettersontheProjectdatedNovember20,2014andJuly20,2015,submittedinresponsetotheNoticeofPreparationfortheDraftEIR(seeAppendixAofthisDraftEIRforacopyofthecommentletter),aswellassubsequentconversationswithCaltransstaff.
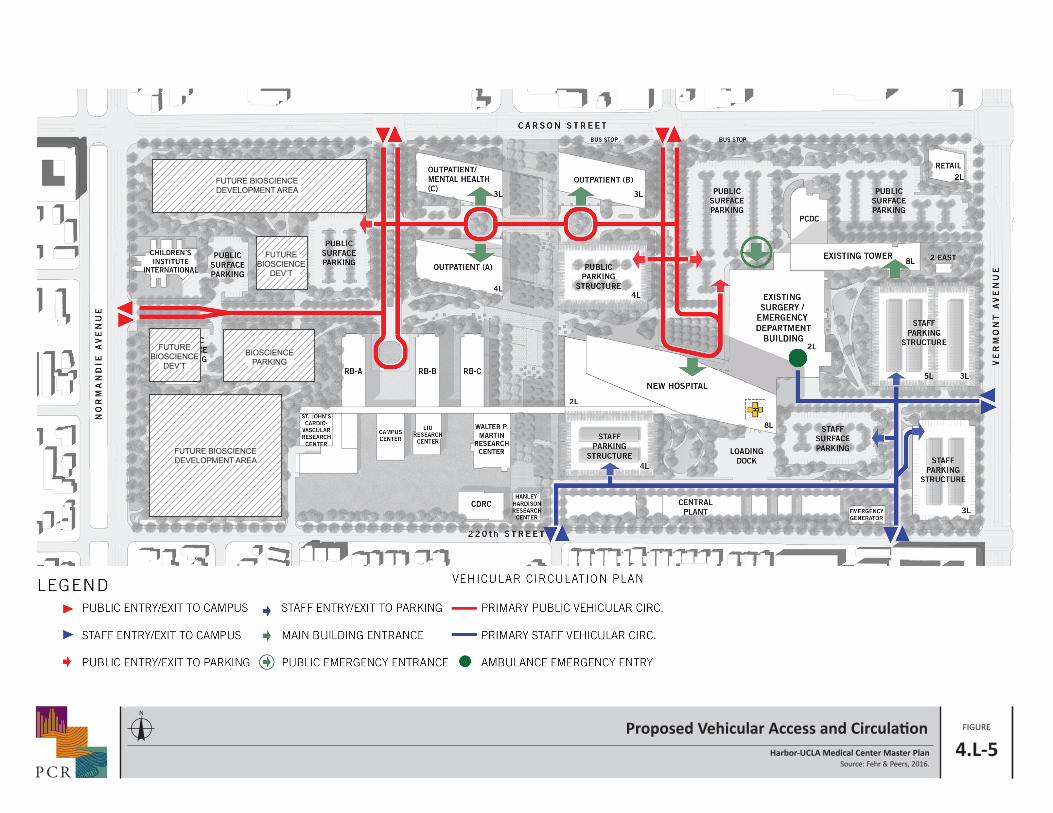
FIGUREProposed Vehicular Access and Circula on
Harbor-UCLA Medical Center Master Plan 4.L-5Source: Fehr & Peers, 2016.
P C R
N
FUTURE BIOSCIENCEDEVELOPMENT AREA
FUTUREBIOSCIENCE
DEV’T
BIOSCIENCEPARKING
FUTURE BIOSCIENCE
DEV’T
FUTURE BIOSCIENCEDEVELOPMENT AREA
4.l. Transportation and Traffic August 2016
LosAngelesCountyDepartmentofPublicWorks Harbor‐UCLAMedicalCenterCampusMasterPlanProjectSCH#2014111004 4.L‐30
Thispageintentionallyblank.
August 2016 4.l. Transportation and Traffic
LosAngelesCountyDepartmentofPublicWorks Harbor‐UCLAMedicalCenterCampusMasterPlanProjectSCH#2014111004 4.L‐31
ThefollowingthreetypesofanalyseswereconductedonCaltransfacilities:1)freewaymainlinesegments,2) Caltrans intersections, and 3) off‐ramp queuing. Two freeway mainline segments on I‐110, threesegmentson I‐405andonesegmentonSR‐91todeterminedensityandLOS. BecausePeMSdatawasnotavailableforsomenearbysegments,existingtrafficvolumedatawasobtainedfromthe2013CaltransTrafficCensus Program, themost recent year when data was available for all relevant segments (http://traffic‐counts.dot.ca.gov/), and increased by 0.73%/year to represent future conditions. Project‐generated tripswereassignedtotheregionalfreewaysystemasdescribedabove.Thefreewaylevelofservicemethodologydescribed in the Highway Capacity Manual was used to determine the vehicle density on each analyzedsegment(passengercarspermileperlane)bydirectionandthecorrespondinglevelofservice.ThelevelofservicedefinitionsusedforfreewaymainlinesegmentsareshowninTable4.L‐1.
One intersection (Western Avenue [State Route 213] at Carson Street) was analyzed using HCM 2010methodology to identify average vehicle delay andLOS. For this signalized intersection, the traffic signaltimingplanprovidedbyLADOTwasalsoused in thisanalysis. Caltrans,LADOTand theCityofTorrancehavejointlyagreedtomodifythesignalintheneartermatthislocationbyimplementingprotectedleft‐turnphasing on the eastbound andwestbound approaches. The Caltrans analysis uses the same intersectionvolumesthatareusedfortheintersectionanalysisdescribedabove.
With regard to ramps, six freeway off‐rampswere analyzed for ramp queue lengths. The Synchro trafficanalysis softwarewasused to implement theHCMmethodology to calculate the85thpercentilequeuesatandcomparethemwiththeavailablevehiclestorageontheseramps.Trafficsignal‐relatedinformationsuchasphasingandtimingplans(minimumgreen,maximumgreen,gap,etc.)wereobtainedforeachlocationandthemorningandeveningpeakhourtrafficvolumesfromthisstudywereused.Additionaldetailsuchasturnpocket lengths and ramp lengths was coded based on scaled distances from on‐line aerial photographs.Caltrans’primaryconcernofoff‐rampsisthatqueuedvehiclesdonotextendpastthebackoftherampontothemainline.Thequeuinganalysislooksattwoseparatecomponentsoframpcapacity:1)thelengthofeachapproach lane to the intersection and 2) the remaining length of the ramp, behind any approach lanedelineation lines, to the core pointwhere the rampdiverges from the freewaymainline. The queuemayexceed the striped length of a given approach lane, but as long as there is sufficient additional queuingcapacityontheramp,itwillnotspilloverontothemainline.
(4) Public Transit and Alternative Transportation
SectionD.8.4of theLosAngelesCountyCMPprovidesamethodologyforestimatingthenumberof transittripsexpected to result fromaproposedprojectbasedon thenumberofvehicle trips. Thismethodologyassumesanaveragevehicleridership(AVR)factorof1.4inordertoestimatethenumberofpersontripstoandfromtheProjectSiteandthenprovidesguidelinesregardingthepercentageofpersontripsassignedtopublic transit depending on the type of use (commercial versus residential) and the proximity to transitservices. Since the Project Site is located within ¼ mile of a designated CMP transit corridor, the CMPguidelinesprovidethatapproximately7%oftotalpersontripsgeneratedmightusepublictransittotraveltoand from the site. With regard tonon‐motorized transportation, theProject is also evaluated in termsofwhether its implementation would conflict with various plans, policies, or regulations supportive ofalternative transportation including the provision of pedestrian‐ and bicycle‐friendly facilities andimprovements.

4.l. Transportation and Traffic August 2016
LosAngelesCountyDepartmentofPublicWorks Harbor‐UCLAMedicalCenterCampusMasterPlanProjectSCH#2014111004 4.L‐32
(5) Access and Circulation
Vehicularaccessto/fromandwithintheProjectSiteisevaluatedtoensurethatconflictswouldnotariseandthaton‐sitecirculationwouldbeadequate. RegardingvehicularaccessfortheproposednewdrivewayonCarsonStreet,Synchrotrafficanalysissoftwarewasusedto implement theHCMmethodologytocalculatethe95thpercentilequeuesandcomparethemwiththeavailablevehiclestorageforwestboundleftturnsintotheMedicalCenterCampus.Trafficsignal‐relatedinformationsuchasphasingandtimingplans(minimumgreen,maximumgreen,etc.)weredevelopedforeachscenarioinSynchroandinformedbyvolumesforeachscenario and existing signal timing information for other intersections on Carson Street in this area. Inaddition, access forpedestrians andbicyclists are evaluated. TheProject’s access and circulation schemewas evaluated to determine whether the Project would substantially increase the potential for conflictsbetweenvehiclesandpedestriansandcyclists.
(6) Parking Supply
ParkingsupplyimpactsareevaluatedbycomparingtheprojectedparkingdemandsofthevariouslandusestobedevelopedundertheMasterPlanProjectatbuildoutwiththeproposedparkingsupplyontheMedicalCenter Campus. At a minimum, parking supply would meet parking requirements of the County Code;however, adverse parking‐related impacts could still occur if demands exceed available supply. TheprovisionofparkingsupplyontheMedicalCampusisevaluatedinlightoftheanticipatedmaximumparkingdemandsoftheProjectratherthanthenumberofspacesrequiredbytheCode.
b. Thresholds of Significance
ThepotentialfortransportationandtrafficimpactsisbasedonthresholdsderivedfromtheCounty’sInitialStudy Checklist questions, which are based in part on Appendix G of the State CEQA Guidelines. Thesequestionsareasfollows:
(XVI) Transportation and Traffic. Would the project:
a) Conflictwithanapplicableplan,ordinanceorpolicyestablishingmeasuresof effectiveness for theperformance of the circulation system, taking into account all modes of transportation includingmasstransitandnon‐motorizedtravelandrelevantcomponentsofthecirculationsystem,includingbutnot limited to intersections, streets,highwaysand freeways,pedestrianandbicyclepaths, andmasstransit?
b) Conflictwith an applicable congestionmanagement program, including, but not limited to level ofservice standards and travel demand measures, or other standards established by the countycongestionmanagementagencyfordesignatedroadsorhighways?
c) Resultinachangeinairtrafficpatterns,includingeitheranincreaseintrafficlevelsorachangeinlocationthatresultsinsubstantialsafetyrisks?
d) Substantiallyincreasehazardsduetoadesignfeature(e.g.,sharpcurvesordangerousintersections)orincompatibleuses(e.g.,farmequipment)?
e) Resultininadequateemergencyaccess?

August 2016 4.l. Transportation and Traffic
LosAngelesCountyDepartmentofPublicWorks Harbor‐UCLAMedicalCenterCampusMasterPlanProjectSCH#2014111004 4.L‐33
f) Conflict with adopted policies, plans, or programs regarding public transit, bicycle, or pedestrianfacilities,orotherwisedecreasetheperformanceorsafetyofsuchfacilities.
WithrespecttoThreshold(c),resultinachangeinairtrafficpatterns,includingeitheranincreaseintrafficlevelsorachangeinlocationthatresultsinsubstantialsafetyrisks,pleaserefertoSection4.F,HazardsandHazardousMaterials, of this Draft EIR for further discussion of aircraft‐related hazards associated withoperationoftheproposedhelistopontheProjectSite.
In consideration of the above CEQA Guidelines, the thresholds to determine if the Project would have apotentially significant impact on traffic, transportation, and parking are described below. A number ofthresholds presented below address question a) above, regarding conflicting with an applicable plan,ordinanceorpolicyestablishingmeasuresofeffectivenessfortheperformanceofthecirculationsystem,butare tailored to reflect the specific numerical thresholds for level of service for a specific facility (e.g.,intersection) in a given jurisdiction. Thus, the thresholds presented below may not reflect the specificlanguageofthequestionsabove,butareintendedtoestablishspecificlimitsbywhichtogaugetheimpactoftheProject‐related traffic at affected facilities, taking intoaccount the locationandagency responsible foreachfacility.
(1) Construction Traffic and Parking
Construction‐relatedtrafficistypicallyexpectedtocauseadversebutnotsignificantimpactsbecause,whilesometimesinconvenient,construction‐relatedtrafficeffectsaretemporary.Nevertheless,thedeterminationofsignificanceismadeonacasebycasebasis,consideringthetemporarytrafficimpacts,temporarylossofaccess,temporarylossofbusstopsorreroutingofbuslines,andtemporarylossofon‐streetparking.Basedontheseconsiderations,Projectconstructionwouldhaveasignificantimpactontrafficandcirculationifthefollowingweretooccur:
TRAF‐1 Would construction of the Project (1) cause substantial delays and disruption of existing trafficflow; (2) require temporary relocation of existing bus stops to more than one‐quarter mile from theirexisting stops; (3) result in impacts based on the operational thresholds at intersections during peakperiods;or(4)resultinthesubstantiallossofon‐streetparkingsuchthattheparkingneedsoftheProjectareawouldnotbemet?
(2) Intersection Service Levels
As discussed above, the study area intersections are located under the jurisdictions of the County of LosAngeles,CityofLosAngeles,CityofTorranceorCityofCarson.
ForintersectionsintheLosAngelesCountyandCityofLosAngeles,inaccordancewithLosAngelesCountycriteriadefinedintheirTrafficImpactAnalysisReportGuidelinesandperLADOTguidelines,anintersectionwouldbesignificantly impactedif itexperiencedanincreaseinV/Cratioequaltoorgreaterthan0.04forintersectionsoperatingatLOSC,equaltoorgreaterthan0.02forintersectionsoperatingatLOSD,andequalto or greater than 0.01 for intersections operating at LOS E or F after the addition of Project traffic.IntersectionsoperatingatLOSAorBaftertheadditionoftheProjecttrafficarenotconsideredsignificantlyimpactedregardlessoftheincreaseinV/Cratio.Thefollowingsummarizestheimpactcriteria:

4.l. Transportation and Traffic August 2016
LosAngelesCountyDepartmentofPublicWorks Harbor‐UCLAMedicalCenterCampusMasterPlanProjectSCH#2014111004 4.L‐34
Intersection Conditions with Project Traffic Relative Baseline Increase in V/C Ratio LOS Final V/C Ratio
C 0.701to0.800 Equaltoorgreaterthan0.04
D 0.801to0.900 Equaltoorgreaterthan0.02E,F 0.901ormore Equaltoorgreaterthan0.01
Source: Fehr & Peers, 2016.
TheCityofCarsonhascreatedthresholdcriteriatodeterminewhethertheadditionofProject‐generatedtripsresults in a significant impact at a study intersection, and thus requires mitigation. The thresholds ofsignificancehavetosatisfythefollowingtwocriteria:
Theadditionofproject‐generatedtripscausesanintersectionV/Cratioincreaseof0.020ormore;and
Underfutureplusprojectconditions,theintersectionisprojectedtooperateatLOSEorF(representedbyaV/Cratioof0.901orgreater).
TheCityofTorranceusesthefollowingthresholdsofsignificancetoassessprojectimpactsbasedontheICUanalysismethodology:
TheprojectcausesachangefromLOSDorbettertoLOSEorF;or
TheprojectcausesachangefromLOSEtoLOSF;or
Theproject increases traffic at the intersectionby2%of capacity (ICU increase≥0.020), causingorworseningLOSEorF(ICU>0.901).
Basedontheabove,thefollowingisthethresholdforsignalizedintersections:
TRAF‐2 WouldtheProjectincreaseV/CratiosordelayaboveLOSstandardssetforthunderCounty,LADOT,CityofCarson,orCityofTorranceguidelines,asapplicable?
(3) Regional Transportation System
BasedontheCMP,aprojectwouldnormallyhaveasignificantimpactonCMParterialmonitoringstationsorfreewaymainlinemonitoringstationsif:
TRAF‐3 Would theProject result in a changeat aCMP facility inV/Cof0.02orgreater andcauseLOSFconditions,orifitwouldresultinachangeinV/Cof0.02orgreaterataCMPfacilitythatisalreadyatLOSF?
WithregardtotheCaltransfacilities,aprojectwouldresultinasignificantimpactonCaltransfacilitiesif:
TRAF‐4 Would theProject result in trafficwhere the analyzed freewaymainline segment or intersectionwere found tooperate atLOSFwith theadditionofProject‐related traffic and the increase is equal toorgreaterthan50trips?
August 2016 4.l. Transportation and Traffic
LosAngelesCountyDepartmentofPublicWorks Harbor‐UCLAMedicalCenterCampusMasterPlanProjectSCH#2014111004 4.L‐35
or
TRAF‐5 WouldtheProjectresultintrafficwheretheoff‐rampqueueextendsbeyondthelengthoftherampitselfontothemainlineofthefreewayduringthepeakarrivalperiod?
(4) Public Transit and Alternative Transportation
TheCountyandtheCMPdonotspecifyathresholdofsignificanceforaproject’s impactontransitsystemcapacity.Thedeterminationofsignificanceforpublictransitismadeonacasebycasebasis,consideringtheprojectednumberofadditionaltransitpassengersexpectedwithimplementationoftheProjectandavailabletransitcapacity.Forpurposesofthisanalysis,theProjectwouldhaveasignificantimpactif:
TRAF‐6 Would the Project add substantial new ridership to the transit lines operating in excess of theircapacity or if the Projectwould conflictwith adopted policies, plans, or programs supporting alternativetransportation?
(5) Access and Circulation
Impacts of a project regarding accessibility on evaluatedon a caseby casebasis, basedon the amountofpedestrianactivityatprojectaccesspoints;designfeatures/physicalconfigurationsthataffectthevisibilityofpedestriansandbicycliststodriversenteringandexitingthesite,andthevisibilityofcarstopedestriansandbicyclists; the typeof facility theprojectdriveway(s) crosses and the level ofutilization; thephysicalconditionsof thesurroundingarea, suchascurves, slopes,walls, landscapingorotherbarriers, thatcouldresultinvehicle/pedestrian,vehicle/bicycle,orvehicle/vehicleimpacts.Basedontheabove,aprojectwouldhaveasignificantimpactif:
TRAF‐7 Would the Project increase roadway hazards resulting from a conflict of movement betweenvehiclesandpedestriansorbicyclesbecauseofdrivewaydesign, the locationofparkingfacilities,orotherProjectcharacteristicsaffectingvisibilityandturningmovements?
(6) Parking Supply
The County does not specify a threshold of significance for a project’s impact parking supply. Thedeterminationofsignificanceforparkingsupplyismadeonacasebycasebasis,consideringtheprojectednumberofadditionalparkingspacesrequiredbytheCountyCodeandtheproposedparkingsupplyontheMedicalCampus.Itshouldbenotedthat,asnotedaboveunderRegulatoryFrameworkSummary,pursuanttoSenateBill743,parking‐relatedeffectsof infillprojects like theMasterPlanProjectarenotconsideredsignificant environmental impacts on the environment. However, for purposes of this analysis, which isprovidedforinformationalanddisclosurepurposes,theProjectwouldhaveasignificantimpactonparkingifitwouldresultinthefollowing:
TRAF‐8 WouldtheProjectprovidelessparkingthantheprojecteddemand?
4.l. Transportation and Traffic August 2016
LosAngelesCountyDepartmentofPublicWorks Harbor‐UCLAMedicalCenterCampusMasterPlanProjectSCH#2014111004 4.L‐36
c. Project Characteristics and Design Features
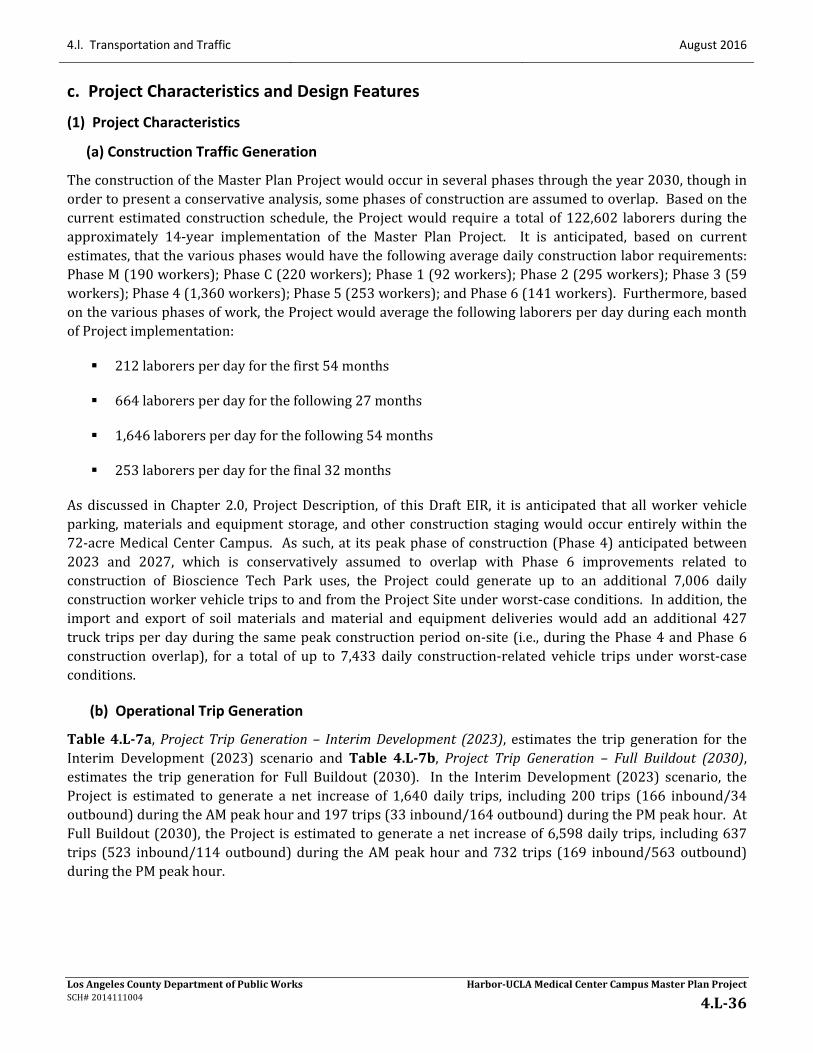
(1) Project Characteristics
(a) Construction Traffic Generation
TheconstructionoftheMasterPlanProjectwouldoccurinseveralphasesthroughtheyear2030,thoughinordertopresentaconservativeanalysis,somephasesofconstructionareassumedtooverlap.Basedonthecurrentestimatedconstruction schedule, theProjectwould requirea totalof122,602 laborersduring theapproximately 14‐year implementation of the Master Plan Project. It is anticipated, based on currentestimates,thatthevariousphaseswouldhavethefollowingaveragedailyconstructionlaborrequirements:PhaseM(190workers);PhaseC(220workers);Phase1(92workers);Phase2(295workers);Phase3(59workers);Phase4(1,360workers);Phase5(253workers);andPhase6(141workers).Furthermore,basedonthevariousphasesofwork,theProjectwouldaveragethefollowinglaborersperdayduringeachmonthofProjectimplementation:
212laborersperdayforthefirst54months
664laborersperdayforthefollowing27months
1,646laborersperdayforthefollowing54months
253laborersperdayforthefinal32months
Asdiscussed inChapter2.0,ProjectDescription, of thisDraftEIR, it is anticipated that allworker vehicleparking,materialsandequipmentstorage,andotherconstructionstagingwouldoccurentirelywithin the72‐acreMedicalCenterCampus. Assuch,at itspeakphaseofconstruction(Phase4)anticipatedbetween2023 and 2027, which is conservatively assumed to overlap with Phase 6 improvements related toconstruction of Bioscience Tech Park uses, the Project could generate up to an additional 7,006 dailyconstructionworkervehicletripstoandfromtheProjectSiteunderworst‐caseconditions.Inaddition,theimport and export of soil materials andmaterial and equipment deliveries would add an additional 427trucktripsperdayduringthesamepeakconstructionperiodon‐site(i.e.,duringthePhase4andPhase6construction overlap), for a total of up to 7,433 daily construction‐related vehicle trips underworst‐caseconditions.
(b) Operational Trip Generation
Table4.L‐7a,ProjectTripGeneration– InterimDevelopment (2023), estimates the trip generation for theInterim Development (2023) scenario and Table 4.L‐7b, Project Trip Generation – Full Buildout (2030),estimates the trip generation for Full Buildout (2030). In the InterimDevelopment (2023) scenario, theProject is estimated to generate a net increase of 1,640 daily trips, including 200 trips (166 inbound/34outbound)duringtheAMpeakhourand197trips(33inbound/164outbound)duringthePMpeakhour.AtFullBuildout(2030),theProject isestimatedtogenerateanet increaseof6,598dailytrips, including637trips (523 inbound/114outbound)during theAMpeakhourand732 trips (169 inbound/563outbound)duringthePMpeakhour.

August 2016 4.l. Transportation and Traffic
LosAngelesCountyDepartmentofPublicWorks Harbor‐UCLAMedicalCenterCampusMasterPlanProjectSCH#2014111004 4.L‐37
Table 4.L‐7a
Project Trip Generation – Interim Development (2023)
Land Use ITE Land Use
Code Size a
Trip Generation Rates b Estimated Trip Generation Daily AM Peak Hour PM Peak Hour Daily AM Peak Hour Trips PM Peak Hour Trips Rate Rate % In % Out Rate % In % Out Trips In Out Total In Out Total
Existing
EXISTINGUSE
AdministrativeOffice 710 23.435 ksf c c 88% 12% c 17% 83% 436 53 7 60 18 87 105
CentralUtilities/Industrial[d] 120 112.719 ksf 1.5 0.51 88% 12% 0.68 12% 88% 169 50 7 57 9 68 77
Hospital/Inpatient 610 373 Beds 12.94 1.32 72% 28% 1.42 33% 67% 4,827 354 138 492 175 355 530
Library 590 22.500 ksf 56.24 1.04 71% 29% 7.3 48% 52% 1,265 16 7 23 79 85 164
MedicalOffice/Outpatient 720 327.304 ksf 36.13 2.39 79% 21% 3.57 28% 72% 11,825 618 164 782 327 841 1,168
Warehouse/Storage 150 45.402 ksf 3.56 0.3 79% 21% 0.32 25% 75% 162 11 3 14 4 11 15
LABioMed 760 94.754 ksf e e 83% 17% e 15% 85% 961 103 21 124 19 107 126
ProjectSiteSubtotal 19,644 1,206 347 1,553 630 1,554 2,184
InternalCapturef ‐3,737 ‐221 ‐65 ‐286 ‐122 ‐290 ‐412
TransitCreditg ‐1,375 ‐84 ‐25 ‐109 ‐44 ‐109 ‐153
Walk/BikeCredith ‐393 ‐24 ‐7 ‐31 ‐13 ‐31 ‐44
TotalExistingTrips 14,139 877 250 1,127 451 1,124 1,575
Proposed
PROPOSEDPROJECT
AdministrativeOffice 710 52.635 ksf c c 88% 12% c 17% 83% 806 101 14 115 23 114 137
CentralUtilities/Industrial[d] 120 129.205 ksf 1.5 0.51 88% 12% 0.68 12% 88% 194 58 8 66 10 78 88
Hospital/Inpatient 610 379 Beds 12.94 1.32 72% 28% 1.42 33% 67% 4,904 360 140 500 177 361 538
Library 590 22.500 ksf 56.24 1.04 71% 29% 7.3 48% 52% 1,265 16 7 23 79 85 164
MedicalOffice/Outpatient 720 338.700 ksf 36.13 2.39 79% 21% 3.57 28% 72% 12,237 639 170 809 338 871 1,209
Warehouse/Storage 150 45.402 ksf 3.56 0.3 79% 21% 0.32 25% 75% 162 11 3 14 4 11 15
BioSciences 760 125.000 ksf e e 83% 17% e 15% 85% 1,209 131 27 158 24 135 159
LABioMed 760 112.500 ksf e e 83% 17% e 15% 85% 1,108 120 24 144 21 124 145
ProjectSiteSubtotal 21,885 1,436 393 1,829 677 1,779 2,456
InternalCapturef ‐4,155 ‐263 ‐74 ‐337 ‐131 ‐331 ‐462
TransitCreditg ‐1,532 ‐101 ‐27 ‐128 ‐47 ‐125 ‐172
Walk/BikeCredith ‐438 ‐29 ‐8 ‐37 ‐14 ‐35 ‐49
TotalProposedTrips 15,760 1,043 284 1,327 485 1,288 1,773

4.l. Transportation and Traffic August 2016
Table 4.L‐7a (Continued)
Project Trip Generation – Interim Development (2023)
LosAngelesCountyDepartmentofPublicWorks Harbor‐UCLAMedicalCenterCampusMasterPlanProjectSCH#2014111004 4.L‐38
Land Use ITE Land Use
Code Size a
Trip Generation Rates b Estimated Trip Generation Daily AM Peak Hour PM Peak Hour Daily AM Peak Hour Trips PM Peak Hour Trips Rate Rate % In % Out Rate % In % Out Trips In Out Total In Out Total
Net
Change
TotalNetTrips 1,620 166 34 200 33 164 197
a Size in thousand square feet (ksf) unless otherwise noted. b Source: Institute of Transportation Engineers (ITE), Trip Generation, 9th Edition, 2012. c ITE administrative office trip generation equations used rather than linear trip generation rate: Daily: Ln(T) = 0.76 * Ln(A) + 3.68, where T = trips, A = area in ksf AM Peak Hour: Ln(T) = 0.8 * Ln(A) + 1.57, where T = trips, A = area in ksf PM Peak Hour: T = 1.12 * Ln(A) + 78.45, where T = trips, A = area in ksf d Peak hour direction distribution not provided by ITE for code 120. Directional distribution taken from ITE code 110, General Light Industrial. e ITE research and development trip generation equations used rather than linear trip generation rate: Daily: Ln(T) = 0.83 * Ln(A) + 3.09, where T = trips, A = area in ksf AM Peak Hour: Ln(T) = 0.87 * Ln(A) + 0.86, where T = trips, A = area in ksf PM Peak Hour: Ln(T) = 0.83 * Ln(A) + 1.06, where T = trips, A = area in ksf f Internal capture represents the percentage of trips between land uses that occur within the site. Internal capture was used for all land uses within the site with the exception of LA BioMed. This percentage (20%) is informed by MXD 2.0 Mixed Use Trip Generation Methodology,
which incorporated the findings of NCHRP Project 8‐51 as described in "Improved Estimation for Internal Trip Capture for Mixed‐use Developments," ITE Journal, August 2010. Internal capture is taken for all land uses except LA Biomed. g Transit credit of 7% informed by MXD 2.0 Mixed Use Trip Generation Methodology h Walk/Bike credit of 2% informed by MXD 2.0 Mixed Use Trip Generation Methodology. Source: Fehr & Peers, 2016

August 2016 4.l. Transportation and Traffic
LosAngelesCountyDepartmentofPublicWorks Harbor‐UCLAMedicalCenterCampusMasterPlanProjectSCH#2014111004 4.L‐39
Table 4.L‐7b
Project Trip Generation – Full Buildout (2030)
Land Use ITE Land Use
Code Size a
Trip Generation Rates b Estimated Trip Generation Daily AM Peak Hour PM Peak Hour Daily AM Peak Hour Trips PM Peak Hour Trips Rate Rate % In % Out Rate % In % Out Trips In Out Total In Out Total
Existing
EXISTINGUSE
AdministrativeOffice 710 23.435 ksf c c 88% 12% c 17% 83% 436 53 7 60 18 87 105
CentralUtilities/Industrial[d] 120 112.719 ksf 1.5 0.51 88% 12% 0.68 12% 88% 169 50 7 57 9 68 77
Hospital/Inpatient 610 373 Beds 12.94 1.32 72% 28% 1.42 33% 67% 4,827 354 138 492 175 355 530
Library 590 22.500 ksf 56.24 1.04 71% 29% 7.3 48% 52% 1,265 16 7 23 79 85 164MedicalOffice/Outpatient 720 327.304 ksf 36.13 2.39 79% 21% 3.57 28% 72% 11,825 618 164 782 327 841 1,168
Warehouse/Storage 150 45.402 ksf 3.56 0.3 79% 21% 0.32 25% 75% 162 11 3 14 4 11 15
LABioMed 760 94.754 ksf e e 83% 17% e 15% 85% 961 103 21 124 19 107 126
ProjectSiteSubtotal 19,644 1,206 347 1,553 630 1,554 2,184
InternalCapturef ‐3,737 ‐221 ‐65 ‐286 ‐122 ‐290 ‐412
TransitCreditg ‐1,375 ‐84 ‐25 ‐109 ‐44 ‐109 ‐153
Walk/BikeCredith ‐393 ‐24 ‐7 ‐31 ‐13 ‐31 ‐44
TotalExistingTrips 14,139 877 250 1,127 451 1,124 1,575
Proposed
PROPOSEDPROJECT
AdministrativeOffice 710 52.635 ksf c c 88% 12% c 17% 83% 1,608 209 28 237 38 187 225
CentralUtilities/Industriald 120 129.205 ksf 1.5 0.51 88% 12% 0.68 12% 88% 194 58 8 66 10 78 88
Hospital/Inpatient 610 379 Beds 12.94 1.32 72% 28% 1.42 33% 67% 4,904 360 140 500 177 361 538
Library 590 22.500 ksf 56.24 1.04 71% 29% 7.3 48% 52% 1,265 16 7 23 79 85 164
MedicalOffice/Outpatient 720 338.700 ksf 36.13 2.39 79% 21% 3.57 28% 72% 14,907 779 207 986 412 1,061 1,473
Warehouse/Storage 150 45.402 ksf 3.56 0.3 79% 21% 0.32 25% 75% 162 11 3 14 4 11 15
Retail 820 35.000 ksf 42.7 0.96 62% 38% 3.71 48% 52% 1,495 21 13 34 62 68 130
BioSciences 760 125.000 ksf e e 83% 17% e 15% 85% 2,149 239 49 288 42 240 282
LABioMed 760 112.500 ksf e e 83% 17% e 15% 85% 1,969 218 45 263 39 220 259
ProjectSiteSubtotal 28,654 1,911 500 2,411 862 2,311 3,173
InternalCapturef ‐5,337 ‐339 ‐91 ‐430 ‐165 ‐418 ‐583
TransitCreditg ‐2,006 ‐134 ‐35 ‐169 ‐60 ‐161 ‐221
Walk/BikeCredith ‐573 ‐38 ‐10 ‐48 ‐17 ‐45 ‐62
TotalProposedTrips 20,738 1,400 364 1,764 620 1,687 2,307

4.l. Transportation and Traffic August 2016
Table 4.L‐7b (Continued)
Project Trip Generation – Full Buildout (2030)
LosAngelesCountyDepartmentofPublicWorks Harbor‐UCLAMedicalCenterCampusMasterPlanProjectSCH#2014111004 4.L‐40
Land Use ITE Land Use
Code Size a
Trip Generation Rates b Estimated Trip Generation Daily AM Peak Hour PM Peak Hour Daily AM Peak Hour Trips PM Peak Hour Trips Rate Rate % In % Out Rate % In % Out Trips In Out Total In Out Total
NetChange
TotalNetTrips 6,598 523 114 637 169 563 732
a Size in thousand square feet (ksf) unless otherwise noted. b Source: Institute of Transportation Engineers (ITE), Trip Generation, 9th Edition, 2012. c ITE administrative office trip generation equations used rather than linear trip generation rate: Daily: Ln(T) = 0.76 * Ln(A) + 3.68, where T = trips, A = area in ksf AM Peak Hour: Ln(T) = 0.8 * Ln(A) + 1.57, where T = trips, A = area in ksf PM Peak Hour: T = 1.12 * Ln(A) + 78.45, where T = trips, A = area in ksf d Peak hour direction distribution not provided by ITE for code 120. Directional distribution taken from ITE code 110, General Light Industrial. e ITE research and development trip generation equations used rather than linear trip generation rate: Daily: Ln(T) = 0.83 * Ln(A) + 3.09, where T = trips, A = area in ksf AM Peak Hour: Ln(T) = 0.87 * Ln(A) + 0.86, where T = trips, A = area in ksf PM Peak Hour: Ln(T) = 0.83 * Ln(A) + 1.06, where T = trips, A = area in ksf f Internal capture represents the percentage of trips between land uses that occur within the site. Internal capture was used for all land uses within the site with the exception of LA BioMed. This percentage (20%) is informed by MXD 2.0 Mixed Use Trip Generation Methodology,
which incorporated the findings of NCHRP Project 8‐51 as described in "Improved Estimation for Internal Trip Capture for Mixed‐use Developments," ITE Journal, August 2010. Internal capture is taken for all land uses except LA Biomed. g Transit credit of 7% informed by MXD 2.0 Mixed Use Trip Generation Methodology h Walk/Bike credit of 2% informed by MXD 2.0 Mixed Use Trip Generation Methodology. Source: Fehr & Peers, 2016

August 2016 4.l. Transportation and Traffic
LosAngelesCountyDepartmentofPublicWorks Harbor‐UCLAMedicalCenterCampusMasterPlanProjectSCH#2014111004 4.L‐41
(2) Project Design Features
(a) Construction Traffic Management
The following Project Design Features are proposed to reduce temporary construction‐related traffic andparkingimpacts:
PDF‐TRAF‐1: Construction Traffic Management Plan: A detailed Construction TrafficManagement Plan including street closure information, detour plans, haul routes, andstaging planswould be prepared by the construction contractor for each developmentphaseorindividualimprovement,asappropriate,andsubmittedtotheCountyforreviewandapproval.Thisrequirementwouldbeincludedintheconstructionbiddocumentsforeach future development phase or individual improvement as part of theMaster PlanProject. The Construction TrafficManagement Planwould formalize how constructionwouldbecarriedoutandidentifyspecificactionsthatwouldberequiredtoreduceeffectson the surrounding community. The Construction Traffic Management Plan shall bebasedonthenatureandtimingofthespecificconstructionactivitiesandotherprojectsinthe vicinity of the Project Site, and shall include, but not be limited to, the followingelementsasappropriate:
Prohibitionofconstructionworkerparkingonnearbyresidentialstreets.
Prohibitionofconstruction‐relatedvehiclesparkingorstagingonsurroundingpublicstreets.
Temporary pedestrian and vehicular traffic controls (i.e., flag persons) during allconstruction activities adjacent to public rights‐of‐way to improve traffic flow onpublicroadways.
Safetyprecautionsforpedestriansandbicycliststhroughsuchmeasuresasalternateroutingandprotectionbarriersshallbeimplementedasappropriate.
Scheduling of construction‐relateddeliveries, haul trips, etc., so as to occur outsidethecommuterpeakhourstotheextentfeasible.
PDF‐TRAF‐2:PedestrianSafety: The construction contractor(s), as requiredby constructionbiddocuments for each development phase or individual improvement, would planconstruction and construction staging as to maintain pedestrian access on adjacentsidewalks throughout all construction phases. The contractor(s) would maintainadequate and safe pedestrian protection, including physical separation (includingutilizationofbarrierssuchasK‐Railsorscaffolding,etc.)fromworkspaceandvehiculartraffic and overhead protection, due to sidewalk closure or blockage, at all times.Temporarypedestrian facilitieswouldbe adjacent to theProject Site andprovide safe,accessibleroutesthatreplicateasnearlyaspracticalthemostdesirablecharacteristicsofthe existing facility. Covered walkways would be provided where pedestrians areexposed to potential injury from falling objects. The contractorwould keep sidewalksopen during construction except when it is absolutely required to close or block thesidewalks for construction staging. Sidewalks shallbe reopenedas soonas reasonablyfeasibletakingconstructionandconstructionstagingintoaccount.
4.l. Transportation and Traffic August 2016
LosAngelesCountyDepartmentofPublicWorks Harbor‐UCLAMedicalCenterCampusMasterPlanProjectSCH#2014111004 4.L‐42
(b) Travel Demand Management
Also, theexistingHarbor‐UCLAMedicalCenter, likeother largeemploymentsites,maintainsaprogramofemployee travel behavior monitoring and incentives to reduce single‐occupant vehicle commute trips.CollectivelyknownasTravelDemandManagement(TDM),theseprogramsaimtoreducetrafficcongestionand the impacts associated with heavy traffic by providing incentives and other measures to encouragealternativetravelarrangementsbetweenworkandhome.AmongthemeasuresnowinplaceattheMedicalCenterCampusare:
• Transitinformationcenter
• Ridesharematchingservices
• Guaranteedridehome/Guaranteedreturntrip
• Commuterchoiceprogram
• Bi‐monthlynewsletters,flyersorannouncementstoemployees
• Newhireorientationandperiodicevents
• Compressedworkweekandflextimeschedules
• Off‐peakrideshareprogram
• Bicycleracks,lockersandshowers
• Telecommuting
• Vanpoolprogram
• Preferentialparkingforthosewhorideshare
Expandingthecurrentmenuofincentivesanddisincentivescouldreducevehicletripsduringthepeakhoursand thus reduce the severity of the impacts identified. The County‐owned medical facility is somewhatdifferentfrommanyotherlandusesinthatitoperatesona24‐hourscheduleandemployeeshaveshiftsthatbeginandendthroughouttheday,includingmanythatareoutsideofthetypicalpeakperiodswhentransitserviceismostextensive.Becausetheeffectivenessofthesemeasurescannotbeguaranteed,however,TDMcannot ensure impactswould be below applicable thresholds. Among the additional TDMmeasures thatcouldbeconsideredforimplementationasdevelopmentoftheMasterPlanProjectproceedsare:
Parkingpricing
• Transitpasssubsidy
• On‐sitesalesoftransitpassesandtokens
• Directfinancialawardsforridesharing
d. Project Impacts
(1) Construction Impacts
Threshold TRAF‐1: Would construction of the Project (1) cause substantial delays and disruption ofexisting traffic flow; (2)require temporaryrelocationofexistingbusstops tomore thanone‐quartermile

August 2016 4.l. Transportation and Traffic
LosAngelesCountyDepartmentofPublicWorks Harbor‐UCLAMedicalCenterCampusMasterPlanProjectSCH#2014111004 4.L‐43
fromtheirexistingstops;(3)result in impactsbasedontheoperational thresholdsat intersectionsduringpeakperiods; or (4) result in the substantial loss of on‐street parking such that the parking needs of theProjectareawouldnotbemet?
ImpactStatementTRAF‐1:WiththeimplementationofPDFTRAF‐1,ConstructionTrafficManagementPlan,andPDFTRAF‐2,PedestrianSafety,potentialconstruction impactsassociatedwithhauling,deliveriesandworkervehicleswouldbereduced. Schedulingofconstruction‐relatedtraffictoavoidpeakhours,prohibited on‐street parking, temporary traffic controls, and the use of safety precautions, such asalternate routingandprotectionbarriers inaccordancewith the twoProjectDesignFeatureswouldminimize the potential for the Project to result in substantial disruption of traffic flow, intersectionoperational impacts, conflictswith pedestrians and/or bicyclists, or loss of on‐street parking in theProjectarea’scommercialzonesandresidentialneighborhoods.However,giventhepotentialadditionof construction‐related vehicle trips during peak construction periods, transportation and parkingimpactsrelatedtoconstructionwouldbeconsideredsignificantandunavoidable,thoughsuchimpactswouldonlyoccuronatemporarybasiswhileconstructionactivitiesareoccurringon‐site.
Constructionof theProject isanticipated tooccur intermittently inphasesoveranapproximately14‐yeartime period. Construction activities would be governed by Chapter 12.12 of the County Code includingSection12.12.30whichgenerallylimitsconstructiontothehoursof6:30A.M.to8:00P.M.onweekdaysandSaturdays. Phases of construction would include grading, excavation, concrete pouring, buildingconstruction,architecturalcoating,andpaving.Projectconstructionwouldaddhaultrucks,equipmentanddeliverytrucksandtripsgeneratedbytheconstructionworkerstothelocalroadwaynetwork.
As noted above under Project Characteristics, the constructionof theMaster Plan Projectwould occur inseveralphases through theyear2030, though inorder topresentaconservativeanalysis, somephasesofconstruction are assumed to overlap. Based on the current estimated construction schedule, the Projectwouldrequireatotalof122,602laborersduringtheapproximately14‐year implementationof theMasterPlanProject. TheProject,at itspeakphaseofconstruction(Phase4)anticipatedbetween2023and2027,which is conservatively assumed to overlap with Phase 6 improvements related to construction ofBioscienceTechParkuses,couldgenerateuptoanadditional7,006dailyconstructionworkervehicletripstoandfromtheProjectSiteonaworst‐casebasis. Inaddition,theimportandexportofsoilmaterialsandmaterialandequipmentdeliverieswouldaddanadditional427 truck tripsperdayduring thesamepeakconstructionperiodon‐site(i.e.,duringthePhase4andPhase6constructionoverlap), fora totalofupto7,433dailyconstruction‐relatedvehicletripsunderworst‐caseconditions.Itislikely,however,thatmanyoftheconstructionworkerswouldarriveanddeparttheProjectSiteoutsideofthepeaktrafficperiodsgiventypicalconstructionworkhours.Morespecifically,thehoursofconstructiontypicallyrequireworkerstobeon‐site before the weekday A.M. commuter peak period and allow them to leave before or after the P.M.commuterpeakperiod(i.e.,arriveatthesitepriorto6:30AManddepartbefore4:00PMorafter6:00PM).Therefore, many, if not most, construction worker trips would occur outside of the typical weekdaycommuterpeakperiods. WiththeimplementationoftheConstructionManagementPlan,requiredbyPDFTRAF‐1,itisanticipatedthatasubstantialportionofhaultruckactivitytoandfromtheProjectSitewouldoccur outside of the peak traffic hours. However, haul truck activity was assumed to occur during themorning and afternoon peak periods for the purposes of providing a conservative analysis of potentialconstruction traffic impacts. Haul trucks would travel on approved truck routes designated within theProjectarea,andwouldaccess the I‐110HarborFreeway for regionalaccess. Although it ispossible thatmanyoftheProject‐relatedworkervehicleandhaultrucktripswouldoccuroutsideofpeaktrafficperiods

4.l. Transportation and Traffic August 2016
LosAngelesCountyDepartmentofPublicWorks Harbor‐UCLAMedicalCenterCampusMasterPlanProjectSCH#2014111004 4.L‐44
throughout construction phases, given the number of potential vehicle trips generated during peakconstructionperiods,itispossiblethatconstruction‐relatedtrafficcouldresultinsignificantimpactstobothlocalintersectionsandCaltransfacilitiesintheProjectarea.Whiletheconstruction‐relatedtrafficimpactsofthe Project have not been quantified in terms of LOS, it is conservatively concluded that constructionactivitieswouldresultinunavoidablesignificanttrafficimpacts,thoughsuchimpactswouldbetemporary.
With regard to construction‐related impacts to localized and on‐site circulation, construction activitieswould be generally contained within the Project Site boundaries and therefore access points fromsurroundingroadwayswouldnotvarysubstantiallyfromexistingconditions.However,constructionfencesortemporaryoff‐siteutilityworkmayencroach intothepublicright‐of‐way(e.g.,sidewalkandroadways)adjacent toornear theProjectSite. Insuchcases, temporary trafficcontrolswouldbeprovided todirecttrafficaroundanyclosuresasrequiredintheProject’sConstructionTrafficManagementPlan.Travellaneswouldbemaintainedineachdirectiononbothstreetsthroughouttheconstructionperiod,andemergencyaccess would not be impeded. Similarly, as required by the Construction Traffic Management Plan,prohibitionof construction‐related vehicleson surrounding residential streets, aswell as theprovisionoftemporary pedestrian and vehicular traffic controls (i.e., flag persons) during all construction activitiesadjacent topublic rights‐of‐way,would improve traffic flowonpublic roadwaysandmaximizepedestrianand bicycle safety. Safety precautions for pedestrians and bicyclists through suchmeasures as alternateroutingandprotectionbarrierswouldalsobeimplementedasappropriate.Inaddition,asrequiredbyPDF‐TRAF‐2,pedestrianaccessnearconstructionactivitieswouldbemaintainedinsuchamannerastoprecludesafetyhazardsoraccesslimitationstonon‐vehicularcirculationontheMedicalCenterCampus.Therefore,impacts related to vehicular, pedestrian, and bicycle access and circulation in the Project vicinity duringconstructionactivitieswouldbelessthansignificant.
Withregardtoconstruction‐relatedimpactsontransitfacilitiesandtheexistingparkingsupply,thecurbsidelanesonCarsonStreet,VermontAvenue,220thStreet,andNormandieAvenue,allofwhichprovideon‐streetparking insomeareas,wouldnotbeused foractivities suchasequipmentstagingandconcretepumping.GiventhattheProjectwouldnotrequirethesustainedclosureoftravellanesorsidewalksalonganyofthesurroundingroadways,andtheProjectalsodoesnotproposeorotherwiserequirerelocationofanyexistingpublictransitstopsorotherfacilities,itisexpectedthatconstructionofthevariousProjectphaseswouldnotsubstantially affect public transit service. Likewise, as all constructionworker vehicle parking and truckdeliverieswouldoccurwithintheMedicalCenterCampus,andsincePDFTRAF‐1wouldprohibitparkingbyconstructionworkersonsurroundingresidentialstreets, impactsrelatedtoconstructionparkingwouldbeconsideredlessthansignificant.
In summary, theProjectwould implement aConstructionTrafficManagementPlanandPedestrianSafetyplan as described in PDF TRAF‐1 and PDF TRAF‐2, which would ensure the scheduling of construction‐related traffic to avoid peak hours, require the use of temporary traffic controls, prohibit constructionvehicleactivitiesandparkinginsurroundingoff‐siteareas,aswellasrequirevarioussafetyprecautionssuchas alternate routing and protection barriers. With the implementation of the Project Design Features,impacts to traffic flow, vehicular access, pedestrian and bicycle access and safety, public transit, andconstruction parking would be less than significant. However, construction impacts on study areaintersectionsareconservativelyconcludedtobepotentiallysignificantandunavoidable.

August 2016 4.l. Transportation and Traffic
LosAngelesCountyDepartmentofPublicWorks Harbor‐UCLAMedicalCenterCampusMasterPlanProjectSCH#2014111004 4.L‐45
(2) Intersection Service Levels
ThresholdTRAF‐2: Would theProject increaseV/CratiosordelayaboveLOSstandardsset forthunderCounty,LADOT,CityofCarson,orCityofTorranceguidelines,asapplicable?
ImpactStatementTRAF‐2:ImplementationoftheMasterPlanProjectwouldresultinanetincreaseintrafficgenerationontheProjectSiteof1,640dailytripsunderInterimYear(2023)conditionsand6,598dailytripsatFullBuildout (2030). Project‐relatedoperational traffic impactson studyarea intersectionswouldbeconsideredpotentiallysignificantunderExistingWithProjectConditions,FutureInterimYear(2023)conditions,andFullBuildout(2030)conditions.
(a) Existing With Project Conditions
ExistingplusProjecttrafficvolumes(usingInterimDevelopmentProjectvolumes),presentedinFigure10ofthe Traffic Study, were analyzed to determine the projected V/C ratios and LOS for each intersection.Table4.L‐8,Existing(2014)Plus InterimDevelopmentProject IntersectionLevelofService, summarizes theExistingplusProjectLOSusingInterimDevelopmentProjecttrips.Thefollowingten(10)intersectionsareprojectedtooperateatLOSEorFduringoneorbothpeakhours:
1. NormandieAvenue&TorranceBoulevard
2. VermontAvenue&TorranceBoulevard
3. WesternAvenue&CarsonStreet
4. NormandieAvenue&CarsonStreet
8. VermontAvenue&CarsonStreet
9. I‐110SouthboundRamps&CarsonStreet
15. FigueroaStreet&220thStreet/I‐110NorthboundRamps
16. WesternAvenue&223rdStreet
19. VermontAvenue&223rdStreet
22. WesternAvenue&SepulvedaBoulevard
Additionally,ExistingplusProjecttrafficvolumes(usingFullBuildoutProjecttrips),presentedinFigure11of the Traffic Study, were analyzed to determine the projected V/C ratios and LOS for each intersection.Table4.L‐9,Existing(2014)PlusFullBuildoutProjectIntersectionLevelofService,summarizestheExistingplus Project LOS using the Full Buildout Project trips. The following 10 intersections are projected tooperateatLOSEorFduringoneorbothpeakhours:

August 2016 4.l. Transportation and Traffic
LosAngelesCountyDepartmentofPublicWorks Harbor‐UCLAMedicalCenterCampusMasterPlanProjectSCH#2014111004 4.L‐46
Table 4.L‐8
Existing (2014) Plus Interim Development Project Intersection Level of Service
ID N/S Street Name E/W Street Name [a] Jurisdiction
Analysis Method
ology
Analyzed
Period
Existing Existing+Project Project
Increase
Significant Impacts
V/C or Delay LOS
V/C or Delay LOS In V/C
1 NormandieAvenue TorranceBoulevard CityofLosAngeles CMA AM 0.902 E 0.904 E 0.002 NO PM 0.904 E 0.906 E 0.002 NO LosAngelesCounty ICU AM 0.935 E 0.936 E 0.001 NO PM 0.936 E 0.938 E 0.002 NO2 VermontAvenue TorranceBoulevard LosAngelesCounty ICU AM 0.927 E 0.928 E 0.001 NO PM 0.880 D 0.881 D 0.001 NO3 WesternAvenue CarsonStreet CityofLosAngeles CMA AM 0.877 D 0.878 D 0.001 NO PM 0.948 E 0.949 E 0.001 NO CityofTorrance ICU AM 0.943 E 0.944 E 0.001 NO PM 1.006 F 1.008 F 0.002 NO4 NormandieAvenue CarsonStreet CityofLosAngeles CMA AM 0.763 C 0.769 C 0.006 NO PM 0.837 D 0.846 D 0.009 NO LosAngelesCounty ICU AM 0.904 E 0.910 E 0.006 NO PM 0.930 E 0.938 F 0.008 NO5 BudlongAvenue CarsonStreet LosAngelesCounty ICU AM 0.570 A 0.624 B 0.054 NO PM 0.539 A 0.572 B 0.033 NO6 BerendoAvenue CarsonStreet LosAngelesCounty ICU AM 0.575 A 0.629 B 0.054 NO PM 0.569 A 0.629 B 0.060 NO7 MedicalCenterDrive CarsonStreet LosAngelesCounty ICU AM 0.628 B 0.682 B 0.054 NO PM 0.611 B 0.576 B -0.035 NO8 VermontAvenue CarsonStreet LosAngelesCounty ICU AM 0.905 E 0.917 E 0.012 YES PM 0.917 E 0.945 F 0.028 YES9 I‐110SBRamps CarsonStreet LosAngelesCounty ICU AM 0.814 D 0.844 D 0.030 YES PM 0.849 D 0.867 E 0.018 NO

August 2016 4.l. Transportation and Traffic
Table 4.L‐8 (Continued)
Existing (2014) Plus Interim Development Project Intersection Level of Service
LosAngelesCountyDepartmentofPublicWorks Harbor‐UCLAMedicalCenterCampusMasterPlanProjectSCH#2014111004 4.L‐47
ID N/S Street Name E/W Street Name [a] Jurisdiction
Analysis Method
ology
Analyzed
Period
Existing Existing+Project Project
Increase
Significant Impacts
V/C or Delay LOS
V/C or Delay LOS In V/C
10 FigueroaStreet CarsonStreet CityofCarson ICU AM 0.661 B 0.670 B 0.009 NO PM 0.762 C 0.767 D 0.005 NO11 WesternAvenue 220thStreet CityofLosAngeles CMA AM 0.554 A 0.559 A 0.005 NO PM 0.698 B 0.698 B 0.000 NO CityofTorrance ICU AM 0.685 B 0.689 B 0.004 NO PM 0.819 D 0.819 D 0.000 NO12 NormandieAvenue 220thStreet CityofLosAngeles CMA AM 0.409 A 0.425 A 0.016 NO PM 0.293 A 0.297 A 0.004 NO LosAngelesCounty ICU AM 0.549 A 0.564 A 0.015 NO PM 0.441 A 0.444 A 0.003 NO13 MeylerStreet 220thStreet LosAngelesCounty ICU AM 0.460 A 0.483 A 0.023 NO PM 0.446 A 0.455 A 0.009 NO14 VermontAvenue 220thStreet LosAngelesCounty ICU AM 0.645 B 0.660 B 0.015 NO PM 0.696 B 0.726 C 0.030 NO15 FigueroaStreet 220thStreet/I‐110NB
RampsCityofCarson ICU AM 0.913 E 0.922 E 0.009 NO
PM 0.886 D 0.919 E 0.033 YES16 WesternAvenue 223rdStreet CityofLosAngeles CMA AM 0.822 D 0.822 D 0.000 NO PM 0.851 D 0.853 D 0.002 NO CityofTorrance ICU AM 0.893 D 0.893 D 0.000 NO PM 0.919 E 0.921 E 0.002 NO17 NormandieAvenue 223rdStreet CityofLosAngeles CMA AM 0.623 B 0.627 B 0.004 NO PM 0.701 C 0.705 C 0.004 NO LosAngelesCounty ICU AM 0.807 D 0.813 D 0.006 NO

4.l. Transportation and Traffic August 2016
Table 4.L‐8 (Continued)
Existing (2014) Plus Interim Development Project Intersection Level of Service
LosAngelesCountyDepartmentofPublicWorks Harbor‐UCLAMedicalCenterCampusMasterPlanProjectSCH#2014111004 4.L‐48
ID N/S Street Name E/W Street Name [a] Jurisdiction
Analysis Method
ology
Analyzed
Period
Existing Existing+Project Project
Increase
Significant Impacts
V/C or Delay LOS
V/C or Delay LOS In V/C
PM 0.822 D 0.826 D 0.004 NO18 MeylerStreet 223rdStreet LosAngelesCounty ICU AM 0.649 B 0.658 B 0.009 NO PM 0.578 A 0.585 A 0.007 NO19 VermontAvenue 223rdStreet LosAngelesCounty ICU AM 0.917 E 0.936 E 0.019 YES PM 0.880 D 0.886 E 0.006 NO20 I‐110SBRamps 223rdStreet LosAngelesCounty ICU AM 0.755 C 0.768 C 0.013 NO PM 0.843 D 0.852 D 0.009 NO21 FigueroaStreet 223rdStreet CityofCarson ICU AM 0.827 D 0.833 D 0.006 NO PM 0.718 C 0.722 C 0.004 NO22 WesternAvenue SepulvedaBlvd CityofLosAngeles CMA AM 0.927 E 0.927 E 0.000 NO PM 0.990 E 0.991 E 0.001 NO CityofTorrance ICU AM 0.957 E 0.957 E 0.000 NO PM 1.011 F 1.012 F 0.001 NO
a All Intersections are signalized except for #13, Meyler Street and 220th Street, which is all way‐stop controlled. Source: Fehr & Peers, 2016
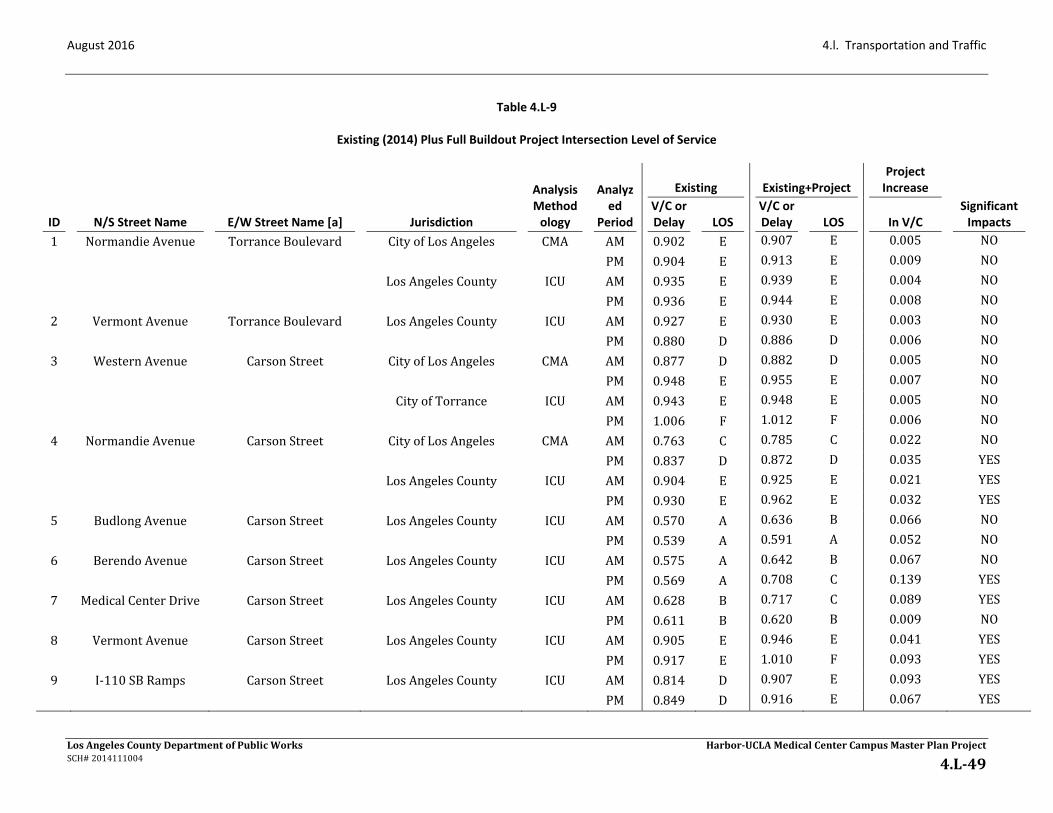
August 2016 4.l. Transportation and Traffic
LosAngelesCountyDepartmentofPublicWorks Harbor‐UCLAMedicalCenterCampusMasterPlanProjectSCH#2014111004 4.L‐49
Table 4.L‐9
Existing (2014) Plus Full Buildout Project Intersection Level of Service
ID N/S Street Name E/W Street Name [a] Jurisdiction
Analysis Method
ology
Analyzed
Period
Existing Existing+Project Project
Increase
Significant Impacts
V/C or Delay LOS
V/C or Delay LOS In V/C
1 NormandieAvenue TorranceBoulevard CityofLosAngeles CMA AM 0.902 E 0.907 E 0.005 NO
PM 0.904 E 0.913 E 0.009 NO
LosAngelesCounty ICU AM 0.935 E 0.939 E 0.004 NO
PM 0.936 E 0.944 E 0.008 NO
2 VermontAvenue TorranceBoulevard LosAngelesCounty ICU AM 0.927 E 0.930 E 0.003 NO
PM 0.880 D 0.886 D 0.006 NO
3 WesternAvenue CarsonStreet CityofLosAngeles CMA AM 0.877 D 0.882 D 0.005 NO
PM 0.948 E 0.955 E 0.007 NO
CityofTorrance ICU AM 0.943 E 0.948 E 0.005 NO
PM 1.006 F 1.012 F 0.006 NO
4 NormandieAvenue CarsonStreet CityofLosAngeles CMA AM 0.763 C 0.785 C 0.022 NO
PM 0.837 D 0.872 D 0.035 YES
LosAngelesCounty ICU AM 0.904 E 0.925 E 0.021 YES
PM 0.930 E 0.962 E 0.032 YES
5 BudlongAvenue CarsonStreet LosAngelesCounty ICU AM 0.570 A 0.636 B 0.066 NO
PM 0.539 A 0.591 A 0.052 NO
6 BerendoAvenue CarsonStreet LosAngelesCounty ICU AM 0.575 A 0.642 B 0.067 NO
PM 0.569 A 0.708 C 0.139 YES
7 MedicalCenterDrive CarsonStreet LosAngelesCounty ICU AM 0.628 B 0.717 C 0.089 YES
PM 0.611 B 0.620 B 0.009 NO
8 VermontAvenue CarsonStreet LosAngelesCounty ICU AM 0.905 E 0.946 E 0.041 YES
PM 0.917 E 1.010 F 0.093 YES
9 I‐110SBRamps CarsonStreet LosAngelesCounty ICU AM 0.814 D 0.907 E 0.093 YES
PM 0.849 D 0.916 E 0.067 YES
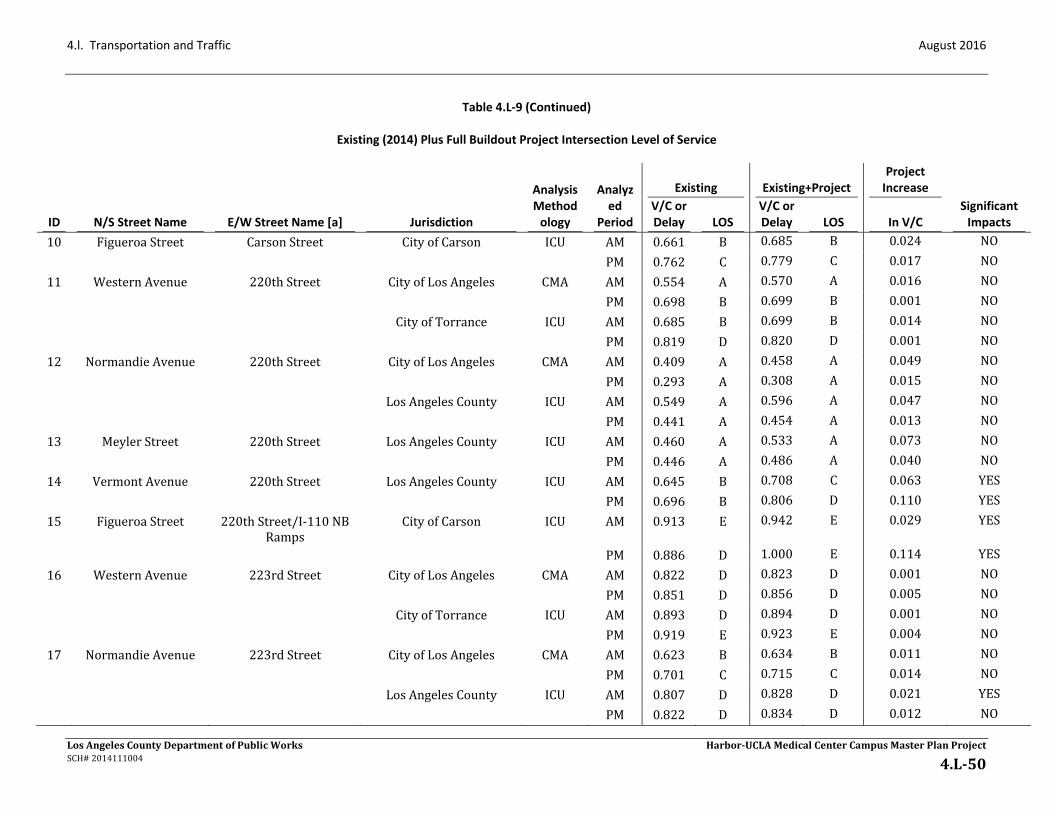
4.l. Transportation and Traffic August 2016
Table 4.L‐9 (Continued)
Existing (2014) Plus Full Buildout Project Intersection Level of Service
LosAngelesCountyDepartmentofPublicWorks Harbor‐UCLAMedicalCenterCampusMasterPlanProjectSCH#2014111004 4.L‐50
ID N/S Street Name E/W Street Name [a] Jurisdiction
Analysis Method
ology
Analyzed
Period
Existing Existing+Project Project
Increase
Significant Impacts
V/C or Delay LOS
V/C or Delay LOS In V/C
10 FigueroaStreet CarsonStreet CityofCarson ICU AM 0.661 B 0.685 B 0.024 NO
PM 0.762 C 0.779 C 0.017 NO
11 WesternAvenue 220thStreet CityofLosAngeles CMA AM 0.554 A 0.570 A 0.016 NO
PM 0.698 B 0.699 B 0.001 NO
CityofTorrance ICU AM 0.685 B 0.699 B 0.014 NO
PM 0.819 D 0.820 D 0.001 NO
12 NormandieAvenue 220thStreet CityofLosAngeles CMA AM 0.409 A 0.458 A 0.049 NO
PM 0.293 A 0.308 A 0.015 NO
LosAngelesCounty ICU AM 0.549 A 0.596 A 0.047 NO
PM 0.441 A 0.454 A 0.013 NO
13 MeylerStreet 220thStreet LosAngelesCounty ICU AM 0.460 A 0.533 A 0.073 NO
PM 0.446 A 0.486 A 0.040 NO
14 VermontAvenue 220thStreet LosAngelesCounty ICU AM 0.645 B 0.708 C 0.063 YES
PM 0.696 B 0.806 D 0.110 YES
15 FigueroaStreet 220thStreet/I‐110NBRamps
CityofCarson ICU AM 0.913 E 0.942 E 0.029 YES
PM 0.886 D 1.000 E 0.114 YES
16 WesternAvenue 223rdStreet CityofLosAngeles CMA AM 0.822 D 0.823 D 0.001 NO
PM 0.851 D 0.856 D 0.005 NO
CityofTorrance ICU AM 0.893 D 0.894 D 0.001 NO
PM 0.919 E 0.923 E 0.004 NO
17 NormandieAvenue 223rdStreet CityofLosAngeles CMA AM 0.623 B 0.634 B 0.011 NO
PM 0.701 C 0.715 C 0.014 NO
LosAngelesCounty ICU AM 0.807 D 0.828 D 0.021 YES
PM 0.822 D 0.834 D 0.012 NO
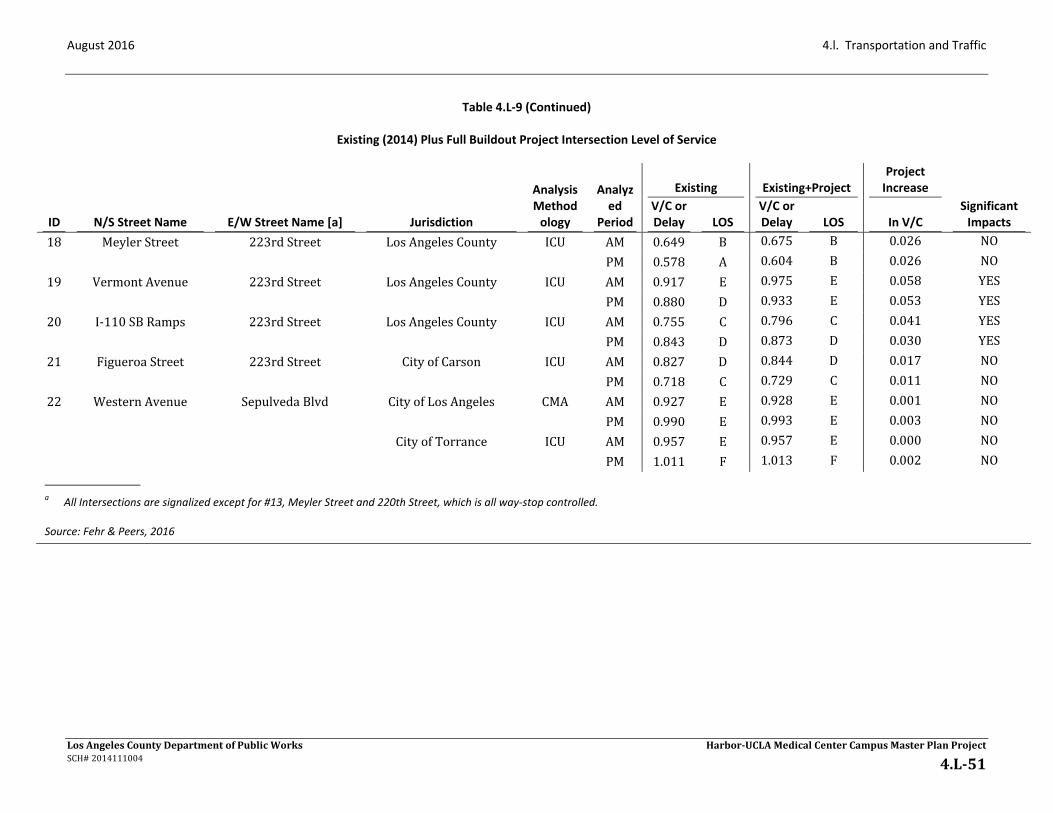
August 2016 4.l. Transportation and Traffic
Table 4.L‐9 (Continued)
Existing (2014) Plus Full Buildout Project Intersection Level of Service
LosAngelesCountyDepartmentofPublicWorks Harbor‐UCLAMedicalCenterCampusMasterPlanProjectSCH#2014111004 4.L‐51
ID N/S Street Name E/W Street Name [a] Jurisdiction
Analysis Method
ology
Analyzed
Period
Existing Existing+Project Project
Increase
Significant Impacts
V/C or Delay LOS
V/C or Delay LOS In V/C
18 MeylerStreet 223rdStreet LosAngelesCounty ICU AM 0.649 B 0.675 B 0.026 NO
PM 0.578 A 0.604 B 0.026 NO
19 VermontAvenue 223rdStreet LosAngelesCounty ICU AM 0.917 E 0.975 E 0.058 YES
PM 0.880 D 0.933 E 0.053 YES
20 I‐110SBRamps 223rdStreet LosAngelesCounty ICU AM 0.755 C 0.796 C 0.041 YES
PM 0.843 D 0.873 D 0.030 YES
21 FigueroaStreet 223rdStreet CityofCarson ICU AM 0.827 D 0.844 D 0.017 NO
PM 0.718 C 0.729 C 0.011 NO
22 WesternAvenue SepulvedaBlvd CityofLosAngeles CMA AM 0.927 E 0.928 E 0.001 NO
PM 0.990 E 0.993 E 0.003 NO
CityofTorrance ICU AM 0.957 E 0.957 E 0.000 NO
PM 1.011 F 1.013 F 0.002 NO
a All Intersections are signalized except for #13, Meyler Street and 220th Street, which is all way‐stop controlled. Source: Fehr & Peers, 2016

August 2016 4.l. Transportation and Traffic
LosAngelesCountyDepartmentofPublicWorks Harbor‐UCLAMedicalCenterCampusMasterPlanProjectSCH#2014111004 4.L‐52
1. NormandieAvenue&TorranceBoulevard
2. VermontAvenue&TorranceBoulevard
3. WesternAvenue&CarsonStreet
4. NormandieAvenue&CarsonStreet
8. VermontAvenue&CarsonStreet
9. I‐110SouthboundRamps&CarsonStreet
15. FigueroaStreet&220thStreet/I‐110NorthboundRamps
16. WesternAvenue&223rdStreet
19. VermontAvenue&223rdStreet
22. WesternAvenue&SepulvedaBoulevard
As shown inTable 4.L‐8, after applying the aforementioned significant impact criteria, itwas determinedthat the proposed Project would result in potentially significant impacts to the following four (4) studyintersectionsunderExisting(2014)plusInterimDevelopmentProjectconditions:
8. VermontAvenue&CarsonStreet
9. I‐110SouthboundRamps&CarsonStreet
15. FigueroaStreet&220thStreet/I‐110NorthboundRamps
19. VermontAvenue&223rdStreet
As shown in Table 4.L‐9,when examining Existing (2014) plus Full Buildout Project conditions using thesignificantimpactcriteria,potentiallysignificantimpactswouldresultatthefollowingnine(9)intersections:
4. NormandieAvenue&CarsonStreet
7. MedicalCenterDrive&CarsonStreet
8. VermontAvenue&CarsonStreet
9. I‐110SouthboundRamps&CarsonStreet
14. VermontAvenue&220thStreet
15. FigueroaStreet&220thStreet/I‐110NorthboundRamps
17. NormandieAvenue&223rdStreet
19. VermontAvenue&223rdStreet
20. I‐110SouthboundRamps&223rdStreet
(b) Interim Year (2023) Without and With Project Conditions
Cumulative Project volumeswere added to the existing traffic volumes to create the InterimYear (2023)volumesforLosAngelesCounty,illustratedinFigure14oftheTrafficStudy.Fortheincorporatedcitiesof

August 2016 4.l. Transportation and Traffic
LosAngelesCountyDepartmentofPublicWorks Harbor‐UCLAMedicalCenterCampusMasterPlanProjectSCH#2014111004 4.L‐53
Los Angeles, Torrance and Carson, existing traffic volumes were increased, based on the previouslydiscussedrates, to2023andthenaddedtocumulativeprojectsvolumestocreatetheInterimYear(2023)volumes,showninFigure15oftheTrafficStudy.
(i) Unincorporated Los Angeles County Interim Year (2023) Traffic Conditions
Table4.L‐10, InterimYear(2023)Plus InterimDevelopmentProject forUnincorporatedLosAngelesCountyIntersection Level of Service Analysis, summarizes the levels of service during the Interim Year (2023)conditions. Poor operating conditions (LOSE or F) are projected at six (6) of the 15 study intersectionswithinLosAngelesCounty’sjurisdictionundertheWithandWithoutProjectscenariosduringatleastoneoftheanalyzedpeakhours,including:
1. NormandieAvenue&TorranceBoulevard
2. VermontAvenue&TorranceBoulevard
4. NormandieAvenue&CarsonStreet
8. VermontAvenue&CarsonStreet
9. I‐110SouthboundRamps&CarsonStreet
19. VermontAvenue&223rdStreet
The results of the Interim Year (2023) (without an area‐wide growth factor) plus Interim DevelopmentProjectpeakhourtrafficvolumesarealsopresentedinTable4.L‐10forintersectionswithinunincorporatedLosAngelesCounty.Table4.L‐10indicatesthatpooroperatingconditions(LOSEorF)areprojectedateight(8) of the 15 study intersectionswithin LosAngeles County’s jurisdiction. The intersections projected tooperateatpoorlevelsofservice(LOSEorF)inoneorbothpeakhoursinclude:
1. NormandieAvenue&TorranceBoulevard
2. VermontAvenue&TorranceBoulevard
4. NormandieAvenue&CarsonStreet
7. MedicalCenterDrive&CarsonStreet
8. VermontAvenue&CarsonStreet
9. I‐110SouthboundRamps&CarsonStreet
19. VermontAvenue&223rdStreet20. I‐110SouthboundRamps&223rdStreet

August 2016 4.l. Transportation and Traffic
LosAngelesCountyDepartmentofPublicWorks Harbor‐UCLAMedicalCenterCampusMasterPlanProjectSCH#2014111004 4.L‐54
Table 4.L‐10
Interim Year (2023) Plus Interim Development Project for Unincorporated Los Angeles County Intersection Level of Service Analysis
ID N/S St. Name E/W St. Name [a] Jurisdiction Analysis
Methodology Analyzed
Period
Interim (2023) Base
Interim (2023) Base+Project
Project Increase
Significant Impacts
V/C or Delay LOS
V/C or Delay LOS In V/C
1 NormandieAve. TorranceBlvd. LosAngelesCounty ICU AM 0.962 E 0.963 E 0.028 YES PM 0.993 E 0.994 E 0.058 YES2 VermontAve. TorranceBlvd. LosAngelesCounty ICU AM 0.968 E 0.969 E 0.042 YES PM 0.895 D 0.896 D 0.016 NO4 NormandieAve. CarsonSt. LosAngelesCounty ICU AM 0.946 E 0.952 E 0.048 YES PM 1.007 F 1.016 F 0.086 YES5 BudlongAve. CarsonSt. LosAngelesCounty ICU AM 0.603 B 0.657 B 0.087 NO PM 0.608 B 0.639 B 0.100 NO6 BerendoAve. CarsonSt. LosAngelesCounty ICU AM 0.609 B 0.663 B 0.088 NO PM 0.636 B 0.696 B 0.127 NO7 MedicalCenterDr. CarsonSt. LosAngelesCounty ICU AM 0.661 B 0.715 C 0.087 YES PM 0.678 B 0.643 B 0.032 NO8 VermontAve. CarsonSt. LosAngelesCounty ICU AM 0.939 E 0.953 E 0.048 YES PM 0.982 E 1.010 F 0.093 YES9 I‐110SBRamps CarsonSt. LosAngelesCounty ICU AM 0.848 D 0.878 D 0.064 YES PM 0.906 E 0.925 E 0.076 YES12 NormandieAve. 220thSt. LosAngelesCounty ICU AM 0.550 A 0.565 A 0.016 NO PM 0.448 A 0.451 A 0.010 NO13 MeylerSt. 220thSt. LosAngelesCounty ICU AM 0.460 A 0.483 A 0.023 NO PM 0.446 A 0.455 A 0.009 NO14 VermontAve. 220thSt. LosAngelesCounty ICU AM 0.647 B 0.668 B 0.023 NO PM 0.703 C 0.733 C 0.037 NO17 NormandieAve. 223rdSt. LosAngelesCounty ICU AM 0.811 D 0.820 D 0.013 NO PM 0.830 D 0.834 D 0.012 NO18 MeylerSt. 223rdSt. LosAngelesCounty ICU AM 0.653 B 0.662 B 0.013 NO PM 0.582 A 0.589 A 0.011 NO

August 2016 4.l. Transportation and Traffic
Table 4.L‐10 (Continued)
Interim Year (2023) Plus Interim Development Project for Unincorporated Los Angeles County Intersection Level of Service Analysis
LosAngelesCountyDepartmentofPublicWorks Harbor‐UCLAMedicalCenterCampusMasterPlanProjectSCH#2014111004 4.L‐55
ID N/S St. Name E/W St. Name [a] Jurisdiction Analysis
Methodology Analyzed
Period
Interim (2023) Base
Interim (2023) Base+Project
Project Increase
Significant Impacts
V/C or Delay LOS
V/C or Delay LOS In V/C
19 VermontAve. 223rdSt. LosAngelesCounty ICU AM 0.927 E 0.945 E 0.028 YES PM 0.899 D 0.905 E 0.025 YES20 I‐110SBRamps 223rdSt. LosAngelesCounty ICU AM 0.765 C 0.779 C 0.024 NO PM 0.864 D 0.873 D 0.030 YES
a All Intersections are signalized except for #13, Meyler St. and 220th St., which is all way‐stop controlled. Source: Fehr & Peers, 2016

August 2016 4.l. Transportation and Traffic
LosAngelesCountyDepartmentofPublicWorks Harbor‐UCLAMedicalCenterCampusMasterPlanProjectSCH#2014111004 4.L‐56
(ii) Incorporated Cities Interim Year (2023) Traffic Conditions
Table4.L‐11,InterimYear(2023)PlusInterimDevelopmentProjectforIncorporatedCitiesIntersectionLevelofServiceAnalysis, summarizes the levelsof serviceduring the InterimYear (2023) conditionswithin thecitiesofLosAngeles,CarsonandTorrance.Pooroperatingconditions(LOSEorF)areprojectedinoneorbothofthepeakhoursateight(8)ofthe11studyintersectionsincluding:
1. NormandieAvenue&TorranceBoulevard
3. WesternAvenue&CarsonStreet
4. NormandieAvenue&CarsonStreet
10. FigueroaStreet&CarsonStreet
15. FigueroaStreetand220thStreet/I‐110NorthboundRamps
16. WesternAvenue&223rdStreet
21. FigueroaStreet&223rdStreet
22. WesternAvenue&SepulvedaBoulevard
TheInterimpeakhourtrafficvolumeswereanalyzedtodeterminetheprojectedV/CratioandLOSforeachoftheanalyzedintersectionsduringtheprojectedoperatingconditionswiththeadditionofProjecttraffic.Table4.L‐11summarizestheInterimandInterimplus2023ProjectLOSusingtheappropriatemethodologyasprescribedbythelocalcity.AsshowninTable4.L‐11,usingthecriteriafordeterminationofsignificantimpacts, theProjectwouldcreateasignificant traffic impactsat the followinganalyzed intersectionunderInterimplus2023Projectconditions:
15. FigueroaStreetand220thStreet/I‐110NorthboundRamps
(c) Full Buildout (2030) Without and With Project Conditions
Cumulative project volumes were added to the existing traffic volumes to create the cumulative (2030)volumesforLosAngelesCounty,illustratedinFigure17oftheTrafficStudy.NotethatInterimDevelopmentBasevolumesandCumulative(2030)basevolumesarethesameunderLosAngelesCounty’smethodologybecausenoareawidegrowthrateisused.FortheincorporatedCitiesofLosAngeles,TorranceandCarson,which require an areawide growth rate, existing traffic volumes were grown based on the previouslydiscussed rates for the Cumulative (2030) base scenario and then added to cumulative project volumes,showninFigure18oftheTrafficStudy.
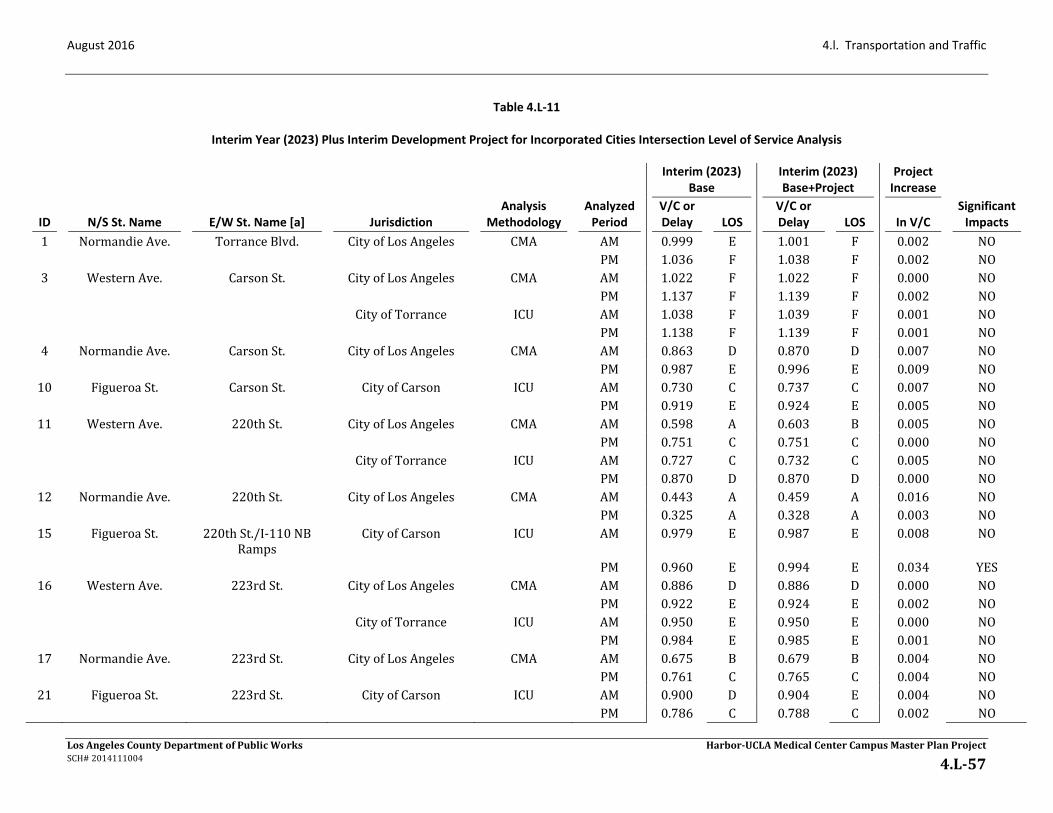
August 2016 4.l. Transportation and Traffic
LosAngelesCountyDepartmentofPublicWorks Harbor‐UCLAMedicalCenterCampusMasterPlanProjectSCH#2014111004 4.L‐57
Table 4.L‐11
Interim Year (2023) Plus Interim Development Project for Incorporated Cities Intersection Level of Service Analysis
ID N/S St. Name E/W St. Name [a] Jurisdiction Analysis
Methodology Analyzed
Period
Interim (2023) Base
Interim (2023) Base+Project
Project Increase
Significant Impacts
V/C or Delay LOS
V/C or Delay LOS In V/C
1 NormandieAve. TorranceBlvd. CityofLosAngeles CMA AM 0.999 E 1.001 F 0.002 NO PM 1.036 F 1.038 F 0.002 NO3 WesternAve. CarsonSt. CityofLosAngeles CMA AM 1.022 F 1.022 F 0.000 NO PM 1.137 F 1.139 F 0.002 NO CityofTorrance ICU AM 1.038 F 1.039 F 0.001 NO PM 1.138 F 1.139 F 0.001 NO4 NormandieAve. CarsonSt. CityofLosAngeles CMA AM 0.863 D 0.870 D 0.007 NO PM 0.987 E 0.996 E 0.009 NO10 FigueroaSt. CarsonSt. CityofCarson ICU AM 0.730 C 0.737 C 0.007 NO PM 0.919 E 0.924 E 0.005 NO11 WesternAve. 220thSt. CityofLosAngeles CMA AM 0.598 A 0.603 B 0.005 NO PM 0.751 C 0.751 C 0.000 NO CityofTorrance ICU AM 0.727 C 0.732 C 0.005 NO PM 0.870 D 0.870 D 0.000 NO12 NormandieAve. 220thSt. CityofLosAngeles CMA AM 0.443 A 0.459 A 0.016 NO PM 0.325 A 0.328 A 0.003 NO15 FigueroaSt. 220thSt./I‐110NB
RampsCityofCarson ICU AM 0.979 E 0.987 E 0.008 NO
PM 0.960 E 0.994 E 0.034 YES16 WesternAve. 223rdSt. CityofLosAngeles CMA AM 0.886 D 0.886 D 0.000 NO PM 0.922 E 0.924 E 0.002 NO CityofTorrance ICU AM 0.950 E 0.950 E 0.000 NO PM 0.984 E 0.985 E 0.001 NO17 NormandieAve. 223rdSt. CityofLosAngeles CMA AM 0.675 B 0.679 B 0.004 NO PM 0.761 C 0.765 C 0.004 NO21 FigueroaSt. 223rdSt. CityofCarson ICU AM 0.900 D 0.904 E 0.004 NO PM 0.786 C 0.788 C 0.002 NO

August 2016 4.l. Transportation and Traffic
Table 4.L‐11 (Continued)
Interim Year (2023) Plus Interim Development Project for Incorporated Cities Intersection Level of Service Analysis
LosAngelesCountyDepartmentofPublicWorks Harbor‐UCLAMedicalCenterCampusMasterPlanProjectSCH#2014111004 4.L‐58
ID N/S St. Name E/W St. Name [a] Jurisdiction Analysis
Methodology Analyzed
Period
Interim (2023) Base
Interim (2023) Base+Project
Project Increase
Significant Impacts
V/C or Delay LOS
V/C or Delay LOS In V/C
22 WesternAve. SepulvedaBlvd CityofLosAngeles CMA AM 0.998 E 0.998 E 0.000 NO PM 1.063 F 1.064 F 0.001 NO CityofTorrance ICU AM 1.017 F 1.017 F 0.000 NO PM 1.074 F 1.074 F 0.000 NO
a All Intersections are signalized except for #13, Meyler St. and 220th St., which is all way‐stop controlled. Source: Fehr & Peers, 2016

August 2016 4.l. Transportation and Traffic
LosAngelesCountyDepartmentofPublicWorks Harbor‐UCLAMedicalCenterCampusMasterPlanProjectSCH#2014111004 4.L‐59
(i) Unincorporated Los Angeles County Cumulative Buildout (2030) Traffic Conditions
Table 4.L‐12, Cumulative (2030) Plus Project forUnincorporated Los Angeles County Intersection Level ofServiceAnalysis, summarize the levels of serviceduring theCumulativeBuildout (2030) conditions. Pooroperating conditions (LOS E or F) are projected at six (6) of the 15 study intersectionswholly or partlywithinLosAngelesCounty’sjurisdictionundertheWithandWithoutProjectscenariosduringatleastoneoftheanalyzedpeakhours,including:
1. NormandieAvenue&TorranceBoulevard
2. VermontAvenue&TorranceBoulevard
4. NormandieAvenue&CarsonStreet
8. VermontAvenue&CarsonStreet
9. I‐110SouthboundRamps&CarsonStreet
19. VermontAvenue&223rdStreet
AsshowninTable4.L‐12,whenexaminingCumulativeBuildout(2030)PlusProjectconditions(withoutanarea‐widegrowthfactor)usingthesignificantimpactcriteria,potentiallysignificantimpactswouldresultatthefollowingeleven(11)intersectionsinunincorporatedLosAngelesCounty:
1. NormandieAvenue&TorranceBoulevard
2. VermontAvenue&TorranceBoulevard
4. NormandieAvenue&CarsonStreet
6. BerendoAvenue&CarsonStreet
7. MedicalCenterDrive&CarsonStreet
8. VermontAvenue&CarsonStreet
9. I‐110SouthboundRamps&CarsonStreet
14. VermontAvenue&220thStreet
17. NormandieAvenue&223rdStreet
19. VermontAvenue&223rdStreet
20. I‐110SouthboundRamps&223rdStreet
MitigationMeasuresareprescribedbelowforpotentiallysignificantimpactedintersections,wherefeasible,in unincorporated Los Angeles County, which address both Interim (2023) and Buildout (2030) trafficconditions.

August 2016 4.l. Transportation and Traffic
LosAngelesCountyDepartmentofPublicWorks Harbor‐UCLAMedicalCenterCampusMasterPlanProjectSCH#2014111004 4.L‐60
Table 4.L‐12
Cumulative (2030) Plus Project for Unincorporated Los Angeles County Intersection Level of Service Analysis
ID N/S St. Name E/W St. Name [a] Jurisdiction Analysis
Methodology Analyzed
Period
Cumulative 2030 Cumulative
2030+Project Project
Increase
Significant Impacts
V/C or Delay LOS
V/C or Delay LOS In V/C
1 NormandieAve. TorranceBlvd. LosAngelesCounty ICU AM 0.962 E 0.966 E 0.031 YES PM 0.993 E 1.000 E 0.064 YES2 VermontAve. TorranceBlvd. LosAngelesCounty ICU AM 0.968 E 0.972 E 0.045 YES PM 0.895 D 0.900 D 0.020 YES4 NormandieAve. CarsonSt. LosAngelesCounty ICU AM 0.946 E 0.967 E 0.063 YES PM 1.007 F 1.038 F 0.108 YES5 BudlongAve. CarsonSt. LosAngelesCounty ICU AM 0.603 B 0.669 B 0.099 NO PM 0.608 B 0.634 B 0.095 NO6 BerendoAve. CarsonSt. LosAngelesCounty ICU AM 0.609 B 0.675 B 0.100 NO PM 0.636 B 0.747 C 0.178 YES7 MedicalCenterDr. CarsonSt. LosAngelesCounty ICU AM 0.661 B 0.751 C 0.123 YES PM 0.678 B 0.722 C 0.111 YES8 VermontAve. CarsonSt. LosAngelesCounty ICU AM 0.939 E 0.982 E 0.077 YES PM 0.982 E 1.075 F 0.158 YES9 I‐110SBRamps CarsonSt. LosAngelesCounty ICU AM 0.848 D 0.941 E 0.127 YES PM 0.906 E 0.974 E 0.125 YES12 NormandieAve. 220thSt. LosAngelesCounty ICU AM 0.550 A 0.596 A 0.047 NO PM 0.448 A 0.461 A 0.020 NO13 MeylerSt. 220thSt. LosAngelesCounty ICU AM 0.460 A 0.533 A 0.073 NO PM 0.446 A 0.486 A 0.040 NO14 VermontAve. 220thSt. LosAngelesCounty ICU AM 0.647 B 0.717 C 0.072 YES PM 0.703 C 0.813 D 0.117 YES17 NormandieAve. 223rdSt. LosAngelesCounty ICU AM 0.811 D 0.833 D 0.026 YES PM 0.830 D 0.844 D 0.022 YES18 MeylerSt. 223rdSt. LosAngelesCounty ICU AM 0.653 B 0.679 B 0.030 NO PM 0.582 A 0.608 B 0.030 NO
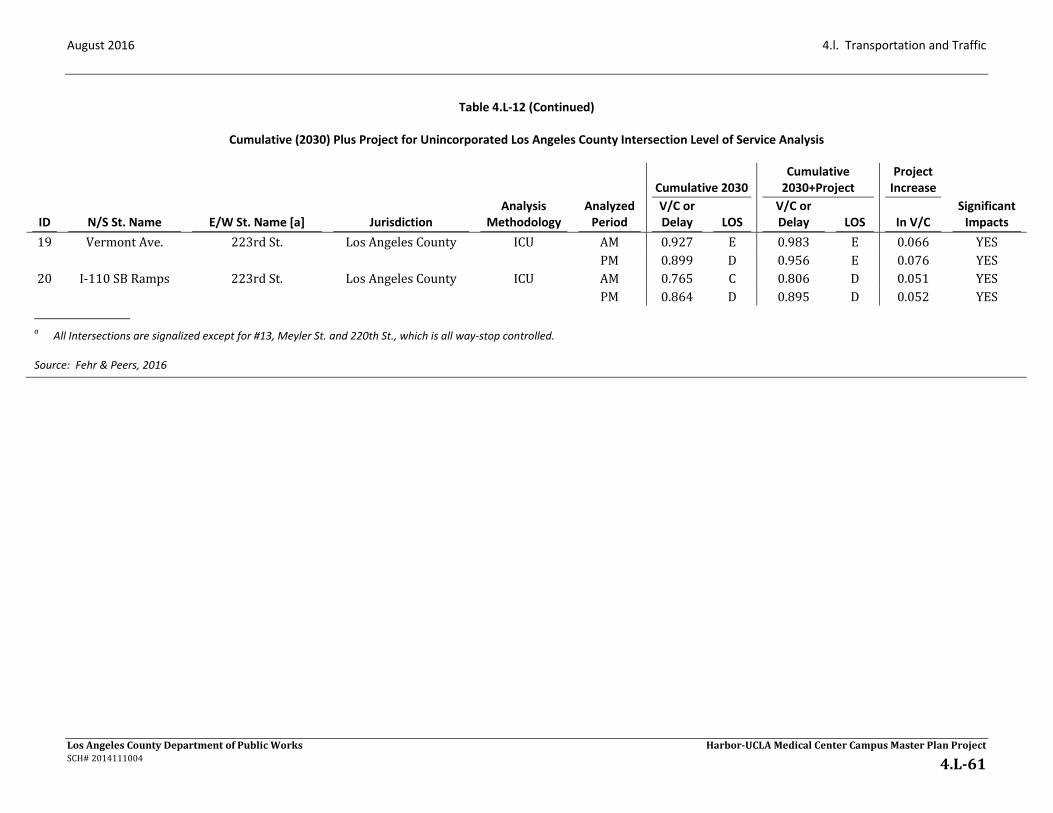
August 2016 4.l. Transportation and Traffic
Table 4.L‐12 (Continued)
Cumulative (2030) Plus Project for Unincorporated Los Angeles County Intersection Level of Service Analysis
LosAngelesCountyDepartmentofPublicWorks Harbor‐UCLAMedicalCenterCampusMasterPlanProjectSCH#2014111004 4.L‐61
ID N/S St. Name E/W St. Name [a] Jurisdiction Analysis
Methodology Analyzed
Period
Cumulative 2030 Cumulative
2030+Project Project
Increase
Significant Impacts
V/C or Delay LOS
V/C or Delay LOS In V/C
19 VermontAve. 223rdSt. LosAngelesCounty ICU AM 0.927 E 0.983 E 0.066 YES PM 0.899 D 0.956 E 0.076 YES20 I‐110SBRamps 223rdSt. LosAngelesCounty ICU AM 0.765 C 0.806 D 0.051 YES PM 0.864 D 0.895 D 0.052 YES
a All Intersections are signalized except for #13, Meyler St. and 220th St., which is all way‐stop controlled. Source: Fehr & Peers, 2016

August 2016 4.l. Transportation and Traffic
LosAngelesCountyDepartmentofPublicWorks Harbor‐UCLAMedicalCenterCampusMasterPlanProjectSCH#2014111004 4.L‐62
(ii) Incorporated Cities Cumulative Buildout Year (2030) Traffic Conditions
Table4.L‐13, Cumulative (2030)PlusProject for Incorporated Cities Intersection Level of ServiceAnalysis,summarize the levels of service during the Cumulative Buildout (2030) conditions. Poor operatingconditions(LOSEorF)areprojectedatten(10)ofthe11studyintersectionsundertheWithandWithoutProjectscenariosduringatleastoneoftheanalyzedpeakhours,including:
1. NormandieAvenue&TorranceBoulevard
3. WesternAvenue&CarsonStreet
4. NormandieAvenue&CarsonStreet
10. FigueroaStreet&CarsonStreet
11. WesternAvenue&CarsonStreet
15. FigueroaStreet&220thStreet/I‐110NorthboundRamps
16. WesternAvenue&223rdStreet
17. NormandieAvenue&223rdStreet
21. FigueroaStreet&223rdStreet
22. WesternAvenue&SepulvedaBoulevard
As shown in Table 4.L‐13, when examining Cumulative Buildout (2030) Plus Project conditions (with anarea‐widegrowthfactor)usingthesignificantimpactcriteria,potentiallysignificantimpactswouldresultatthefollowingintersections:
4. NormandieAvenue&CarsonStreet
15. FigueroaStreetand220thStreet/I‐110NorthboundRamps
Mitigation measures are prescribed below for potentially significant impacted intersections in theincorporatedcities,whichaddressbothInterim(2023)andBuildout(2030)trafficconditions.

August 2016 4.l. Transportation and Traffic
LosAngelesCountyDepartmentofPublicWorks Harbor‐UCLAMedicalCenterCampusMasterPlanProjectSCH#2014111004 4.L‐63
Table 4.L‐13
Cumulative (2030) Plus Project for Incorporated Cities Intersection Level of Service Analysis
ID N/S St. Name E/W St. Name [a] Jurisdiction Analysis
Methodology Analyzed
Period
Cumulative 2030 Cumulative
2030+Project Project
Increase
Significant Impacts
V/C or Delay LOS
V/C or Delay LOS In V/C
1 NormandieAve. TorranceBlvd. CityofLosAngeles CMA AM 1.054 F 1.059 F 0.005 NO PM 1.090 F 1.098 F 0.008 NO3 WesternAve. CarsonSt. CityofLosAngeles CMA AM 1.076 F 1.081 F 0.005 NO PM 1.196 F 1.204 F 0.008 NO CityofTorrance ICU AM 1.085 F 1.089 F 0.004 NO PM 1.188 F 1.194 F 0.006 NO4 NormandieAve. CarsonSt. CityofLosAngeles CMA AM 0.910 E 0.933 E 0.023 YES PM 1.037 F 1.073 F 0.036 YES10 FigueroaSt. CarsonSt. CityofCarson ICU AM 0.762 C 0.786 C 0.024 NO PM 0.957 E 0.974 E 0.017 NO11 WesternAve. 220thSt. CityofLosAngeles CMA AM 0.633 B 0.649 B 0.016 NO PM 0.793 C 0.794 C 0.001 NO CityofTorrance ICU AM 0.760 C 0.775 C 0.015 NO PM 0.909 E 0.910 E 0.001 NO12 NormandieAve. 220thSt. CityofLosAngeles CMA AM 0.470 A 0.519 A 0.049 NO PM 0.345 A 0.359 A 0.014 NO15 FigueroaSt. 220thSt./I‐110NB
RampsCityofCarson ICU AM 1.024 F 1.054 F 0.030 YES
PM 1.006 F 1.121 F 0.115 YES16 WesternAve. 223rdSt. CityofLosAngeles CMA AM 0.935 E 0.936 E 0.001 NO PM 0.974 E 0.978 E 0.004 NO CityofTorrance ICU AM 0.994 E 0.996 E 0.002 NO PM 1.029 F 1.034 F 0.005 NO17 NormandieAve. 223rdSt. CityofLosAngeles CMA AM 0.713 C 0.724 C 0.011 NO PM 0.805 D 0.817 D 0.012 NO21 FigueroaSt. 223rdSt. CityofCarson ICU AM 0.939 E 0.956 E 0.017 NO PM 0.820 D 0.831 D 0.011 NO

August 2016 4.l. Transportation and Traffic
Table 4.L‐13 (Continued)
Cumulative (2030) Plus Project for Incorporated Cities Intersection Level of Service Analysis
LosAngelesCountyDepartmentofPublicWorks Harbor‐UCLAMedicalCenterCampusMasterPlanProjectSCH#2014111004 4.L‐64
ID N/S St. Name E/W St. Name [a] Jurisdiction Analysis
Methodology Analyzed
Period
Cumulative 2030 Cumulative
2030+Project Project
Increase
Significant Impacts
V/C or Delay LOS
V/C or Delay LOS In V/C
22 WesternAve. SepulvedaBlvd CityofLosAngeles CMA AM 1.054 F 1.054 F 0.000 NO PM 1.122 F 1.124 F 0.002 NO CityofTorrance ICU AM 1.067 F 1.067 F 0.000 NO PM 1.124 F 1.126 F 0.002 NO
a All Intersections are signalized except for #13, Meyler St. and 220th St., which is all way‐stop controlled. Source: Fehr & Peers, 2016
August 2016 4.l. Transportation and Traffic
LosAngelesCountyDepartmentofPublicWorks Harbor‐UCLAMedicalCenterCampusMasterPlanProjectSCH#2014111004 4.L‐65
(d) Summary of Interim Year (2023) and Buildout (2030) Intersection Impacts
Table4.L‐14,PotentiallySignificantImpactsatUnincorporatedLosAngelesCountyIntersections,depictstheimpacts at all intersectionswithin unincorporated LosAngeles County using the impact criteria fromLosAngelesCounty. As shown therein, theProjectwould result inpotentially significant impacts at eight (8)intersections under Interim (2023) Plus Project Conditions and ten (10) intersections under Cumulative(2030)PlusProjectconditions.TheProjectwouldalsoresultinpotentiallysignificantimpactsateight(8)ofthe same intersections plus one additional intersection under Existing Plus Project (Full Buildout)conditions,andthree(3)ofthosesameintersectionsunderExistingPlusProject(Interim)conditions.Inall,the Project would result in potentially significant impacts at eleven (11) unincorporated Countyintersections.
Table 4.L‐15, Potentially Significant Impacts at Incorporated City Intersections, depicts the impacts at allintersectionswithinthejurisdictionsofincorporatedcities(cityofLosAngeles,cityofTorrance,andcityofCarson) using the impact criteria from the relevant city. As shown therein, the Project would result inimpactsatonlyone(1)intersectionintheCityofCarsonunderInterim(2023)PlusProjectconditionsandimpactsattwo(2)intersectionsunderCumulative(2030)PlusProjectconditions(includingtheintersectionaffectedunderInterim(2023)PlusProjectconditionsinthecityofCarsonandanadditionalintersectioninthecityofLosAngeles).TheProjectwouldalsoresultinpotentiallysignificantimpactsatthesametwo(2)intersectionsunderExistingPlusProject(FullBuildout)conditions,andone(1)ofthosesameintersectionsunderExistingPlus Project (Interim) conditions. In all, theProjectwould result in potentially significantimpactsat two(2) incorporatedcity intersections (oneofwhich, IntersectionNo.4atNormandieAvenueandCarsonStreet,isalsosignificantlyimpactedunderLosAngelesCountycriteriaasdiscussedabove).
As such, the Projectwould result in potentially significant impacts to a total of twelve (12) intersectionswithinbothunincorporatedLosAngelesCountyandincorporatedcities.
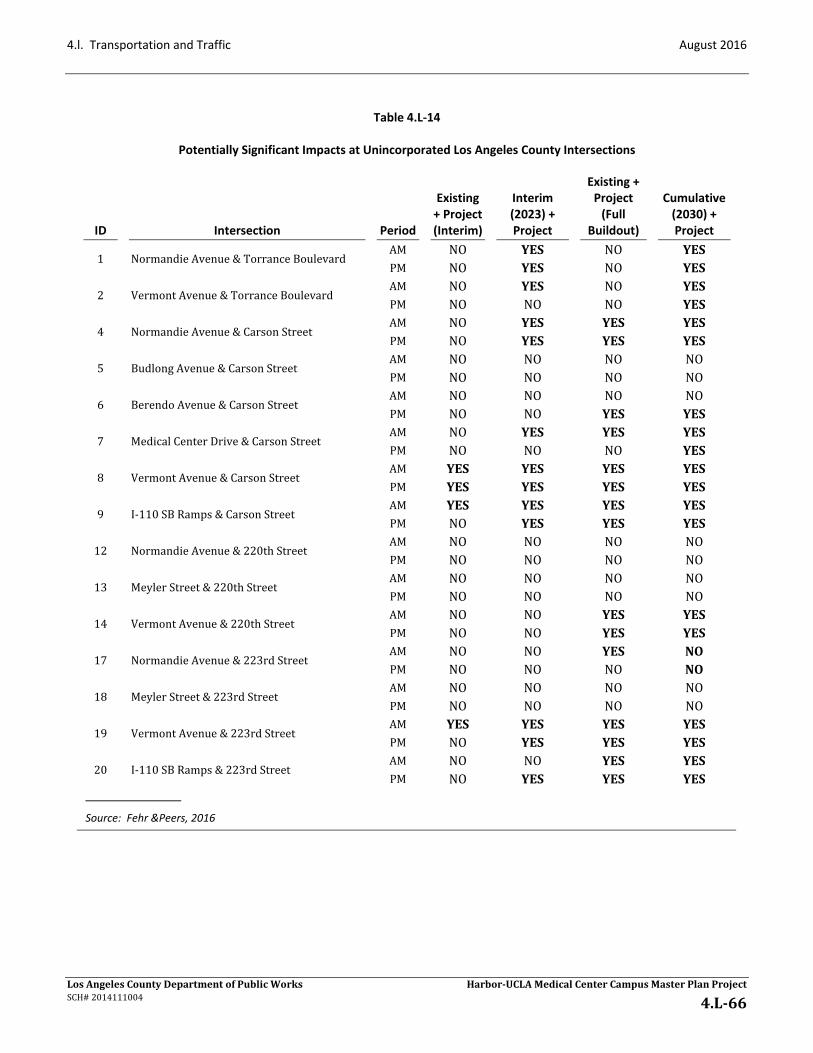
4.l. Transportation and Traffic August 2016
LosAngelesCountyDepartmentofPublicWorks Harbor‐UCLAMedicalCenterCampusMasterPlanProjectSCH#2014111004 4.L‐66
Table 4.L‐14
Potentially Significant Impacts at Unincorporated Los Angeles County Intersections
ID Intersection Period
Existing + Project (Interim)
Interim (2023) + Project
Existing + Project
(Full Buildout)
Cumulative (2030) + Project
1 NormandieAvenue&TorranceBoulevardAM NO YES NO YESPM NO YES NO YES
2 VermontAvenue&TorranceBoulevardAM NO YES NO YESPM NO NO NO YES
4 NormandieAvenue&CarsonStreetAM NO YES YES YESPM NO YES YES YES
5 BudlongAvenue&CarsonStreetAM NO NO NO NOPM NO NO NO NO
6 BerendoAvenue&CarsonStreetAM NO NO NO NOPM NO NO YES YES
7 MedicalCenterDrive&CarsonStreetAM NO YES YES YESPM NO NO NO YES
8 VermontAvenue&CarsonStreetAM YES YES YES YESPM YES YES YES YES
9 I‐110SBRamps&CarsonStreetAM YES YES YES YESPM NO YES YES YES
12 NormandieAvenue&220thStreetAM NO NO NO NOPM NO NO NO NO
13 MeylerStreet&220thStreetAM NO NO NO NOPM NO NO NO NO
14 VermontAvenue&220thStreetAM NO NO YES YESPM NO NO YES YES
17 NormandieAvenue&223rdStreetAM NO NO YES NOPM NO NO NO NO
18 MeylerStreet&223rdStreetAM NO NO NO NOPM NO NO NO NO
19 VermontAvenue&223rdStreetAM YES YES YES YESPM NO YES YES YES
20 I‐110SBRamps&223rdStreetAM NO NO YES YESPM NO YES YES YES
Source: Fehr &Peers, 2016

August 2016 4.l. Transportation and Traffic
LosAngelesCountyDepartmentofPublicWorks Harbor‐UCLAMedicalCenterCampusMasterPlanProjectSCH#2014111004 4.L‐67
(3) CMP Transportation System
ThresholdTRAF‐3: Would theProject result in a changeat aCMP facility inV/Cof 0.02or greater andcauseLOSF conditions, or result in a change inV/Cof0.02or greater at aCMP facility that is already atLOSF?
ImpactStatementTRAF‐3:TheProjectwouldnotmeettheminimumpeakhourtripnumbersatCMParterialstationsorfreewaymonitoringstationstorequirefurtheranalysisand,therefore,wouldnotresultinachange in the V/C ratio of 0.02 or greater. Impacts to regional CMP transportation systems areconsideredtobelessthansignificant.
(a) CMP Arterial Monitoring Stations
TheCMParterialmonitoringstationsnearesttotheProjectstudyareaare:
Table 4.L‐15
Potentially Significant Impacts at Incorporated City Intersections
ID Intersection Jurisdiction Period
Existing + Project
(Interim)
Interim (2023) + Project
Existing + Project
(Full Buildout)
Cumulative (2030) + Project
1 NormandieAvenue&TorranceBoulevard
CityofLosAngelesAM NO NO NO NOPM NO NO NO NO
3 WesternAvenue&CarsonStreet
CityofLosAngeles&CityofTorrance
AM NO NO NO NOPM NO NO NO NO
4 NormandieAvenue&CarsonStreet
CityofLosAngelesAM NO NO NO YESPM NO NO YES YES
10 FigueroaStreet&CarsonStreet
CityofCarsonAM NO NO NO NOPM NO NO NO NO
11 WesternAvenue&220thStreet
CityofLosAngeles&CityofTorrance
AM NO NO NO NOPM NO NO NO NO
12 NormandieAvenue&220thStreet
CityofLosAngelesAM NO NO NO NOPM NO NO NO NO
15 FigueroaStreet&220thStreet/I‐110NBRamps
CityofCarsonAM NO NO YES YESPM YES YES YES YES
16 WesternAvenue&223rdStreet
CityofLosAngeles&CityofTorrance
AM NO NO NO NOPM NO NO NO NO
17 NormandieAvenue&223rdStreet
CityofLosAngelesAM NO NO NO NOPM NO NO NO NO
21 FigueroaStreet&223rdStreet
CityofCarsonAM NO NO NO NOPM NO NO NO NO
22 WesternAvenue&SepulvedaBlvd
CityofLosAngeles&CityofTorrance
AM NO NO NO NOPM NO NO NO NO
Source: Fehr &Peers, 2016

4.l. Transportation and Traffic August 2016
LosAngelesCountyDepartmentofPublicWorks Harbor‐UCLAMedicalCenterCampusMasterPlanProjectSCH#2014111004 4.L‐68
WesternAvenue&CarsonStreet(CityofTorrance)
WesternAvenue&190thStreet(CityofTorrance)
WesternAvenue&SepulvedaBoulevard(CityofTorrance)
PacificCoastHighway&WesternAvenue(CityofLosAngeles)
PacificCoastHighway&FigueroaStreet(CityofLosAngeles)
ArtesiaBoulevard&VermontAvenue(CityofGardena)
BasedontheProjecttripgenerationestimatesandareviewofthenetProject‐generatedAMandPMpeakhour traffic volumes (shown in Figures 8 and 9 of the Traffic Study), the Project would add 50 ormorevehicletripsthroughoneoftheCMParterialmonitoringstations,WesternAvenue&CarsonStreet. Fewerthan50tripswouldbeaddedtoallotherarterialmonitoringstationsduringtheAMorPManalysisperiods.Therefore,nofurtheranalysisofisrequiredfortheCMParterialintersectionswiththeexceptionofWesternAvenue&CarsonStreet.PerCMPImpactAnalysisguidelines,intersectionLOScalculationscanbecompletedusingeitherICUorCMAmethodology.Table4.L‐13depictstheresultsofbothCMAandICUmethodologiesforWestern Avenue& Carson Street in the Full Buildout plus Project scenario. Because the incrementalchangeinV/Catthislocationwouldnotincreaseby2%,CMParterialintersectionimpactsareconsideredtobelessthansignificantfortheProject.Becausenoimpactwouldoccurunderthelongest‐termCumulative(2030) plus Project scenario, it is concluded that no impactwould occur under the InterimDevelopment(2023)plusProjectscenarioorExistingplusProjectscenarios.
(b) CMP Freeway Monitoring Stations
ThenearestCMPmainlinefreewaymonitoringlocationsnearesttotheProjectSiteare:
I‐110atWilmington,southof"C"Street(Station1045)
I‐110atManchesterBoulevard(Station1046)
I‐405atSantaFeAvenue(Station1066)
I‐405southofI‐110(Station1067)
I‐405northofInglewoodAvenue(Station1068)
SR91eastofAlamedaStreet/SantaFeAvenue(Station1033)
Results are depicted inTable4.L‐16,CMPAMPeakHourExisting (2014)andCumulative (2030)FreewayAnalysis,andTable4.L‐17,CMPAMPeakHourExisting(2014)andCumulative(2030)FreewayAnalysisforthe AM and PM peak hours, respectively, under Existing, Cumulative (2030) and Cumulative (2030) plusProject conditions. The Project would not addmore than 150 trips at any station location, and the V/Cwould not increase by 2% or more. Therefore, CMP freeway impacts are considered to be less thansignificant.

August 2016 4.l. Transportation and Traffic
LosAngelesCountyDepartmentofPublicWorks Harbor‐UCLAMedicalCenterCampusMasterPlanProjectSCH#2014111004 4.L‐69
Table 4.L‐16
CMP AM Peak Hour Existing (2014) and Cumulative (2030) Freeway Analysis
Freeway Segments Direction # of
Lanes Capacity a
Existing Cumulative (2030) with
Areawide Growth
Full Buildout Project Trips
Cumulative (2030) with Areawide Growth plus Project
Peak Hour Volume b
D/C Ratio LOS c
Peak Hour
Volume D/C
Ratio LOS c Peak Hour
Volume D/C
Ratio LOS c Project‐related
D/C change Significant Impact d
HarborFreeway(I‐110)
HarborFreeway(I‐110) NB 4 8,000 3,025 0.38 B 3,088 0.386 B 52 3,141 0.393 B 0.007 NO
atWilmington,southof"C"Street‐CMPStation1045
SB 4 8,000 4,235 0.53 B 4,323 0.54 B 11 4,334 0.542 C 0.002 NO
HarborFreeway(I‐110) NB 6 12,000 11,794 0.98 E 12,652 1.054 F(0) 12 12,664 1.055 F(0) 0.001 NO
atManchesterBl‐CMPStation1046
SB 6 12,000 11,115 0.93 D 11,924 0.994 E 78 12,002 1 E 0.006 NO
SanDiegoFreeway(I‐405) SanDiegoFreeway(I‐405) NB 5 10,000 12,549 1.26 F(1) 15,171 1.517 F(3) 52 15,223 1.522 F(3) 0.005 NO
SantaFeAve‐CMPStation1066
SB 5 10,000 9,384 0.94 E 11,345 1.135 F(0) 8 11,353 1.135 F(0) 0.000 NO
SanDiegoFreeway(I‐405) NB 5 10,000 11,227 1.12 F(0) 12,045 1.205 F(0) 0 12,045 1.205 F(0) 0.000 NO
s/oRTE110;CarsonScales‐CMPStation1067
SB 5 10,000 9,682 0.97 E 10,387 1.039 F(0) 0 10,387 1.039 F(0) 0.000 NO
SanDiegoFreeway(I‐405) NB 5 10,000 11,476 1.15 F(0) 11,917 1.192 F(0) 15 11,932 1.193 F(0) 0.001 NO
n/oInglewoodAve‐CMPStation1068
SB 5 10,000 8,551 0.86 D 8,880 0.888 D 78 8,958 0.896 D 0.008 NO
ArtesiaFreeway(SR91) ArtesiaFreeway(SR91) EB 6 12,000 8,048 0.67 C 9,669 0.806 D 13 9,682 0.807 D 0.001 NO
e/oAlamedaSt/SantaFeAve‐CMPStation1033
WB 6 12,000 10,767 0.9 D 12,935 1.078 F(0) 80 13,014 1.085 F(0) 0.007 NO
a Capacity assumes 2,000 vehicles/hour/lane based on analysis contained in 2010 Congestion Management Program, Metro, 2010. b 2015 Volume obtained from CMP 2009 Data, factored to 2015 conditions using CMP growth rate for the RSA that contains freeway census station. c Freeway Segment LOS methodology taken from 2010 CMP, Metro, 2010. d CMP defines significant freeway impact as change in D/C ratio of 0.02 or more when a freeway segment is at LOS F (D/C ratio > 1.00). Source: Fehr & Peers, 2016

4.l. Transportation and Traffic August 2016
LosAngelesCountyDepartmentofPublicWorks Harbor‐UCLAMedicalCenterCampusMasterPlanProjectSCH#2014111004 4.L‐70
Table 4.L‐17
CMP PM Peak Hour Existing (2014) and Cumulative (2030) Freeway Analysis
Freeway Segments Direction # of
Lanes Capacity a
Existing Cumulative (2030) with
Areawide Growth
Full Buildout Project Trips
Cumulative (2030) with Areawide Growth plus Project
Peak Hour Volume b
D/C Ratio LOS c
Peak Hour
Volume D/C
Ratio LOS c Peak Hour
Volume D/C
Ratio LOS c Project‐related
D/C change Significant Impact d
HarborFreeway(I‐110) HarborFreeway(I‐110) NB 4 8,000 3,090 0.39 B 3,587 0.448 B 17 3,604 0.451 B 0.003 NO
atWilmington,southof"C"Street‐CMPStation1045
SB 4 8,000 4,223 0.53 B 4,799 0.600 C 56 4,855 0.607 C 0.007 NO
HarborFreeway(I‐110) NB 6 12,000 11,781 0.98 E 12,827 1.069 F(0) 62 12,889 1.074 F(0) 0.005 NO
atManchesterBl‐CMPStation1046
SB 6 12,000 11,954 1 E 13,036 1.086 F(0) 26 13,062 1.089 F(0) 0.003 NO
SanDiegoFreeway(I‐405) SanDiegoFreeway(I‐405) NB 5 10,000 9,167 0.92 D 10,393 1.039 F(0) 16 10,409 1.041 F(0) 0.002 NO
SantaFeAve‐CMPStation1066
SB 5 10,000 11,021 1.1 F(0) 12,367 1.237 F(0) 41 12,408 1.241 F(0) 0.004 NO
SanDiegoFreeway(I‐405) NB 5 10,000 9,682 0.97 E 10,921 1.092 F(0) 0 10,921 1.092 F(0) 0.000 NO
s/oRTE110;CarsonScales‐CMPStation1067
SB 5 10,000 11,639 1.16 F(0) 13,006 1.301 F(1) 0 13,006 1.301 F(1) 0.000 NO
SanDiegoFreeway(I‐405) NB 5 10,000 8,734 0.87 D 9,518 0.952 E 78 9,596 0.96 E 0.008 NO
n/oInglewoodAve‐CMPStation1068
SB 5 10,000 10,562 1.06 F(0) 11,476 1.148 F(0) 24 11,500 1.15 F(0) 0.002 NO
ArtesiaFreeway(SR91) ArtesiaFreeway(SR91) EB 6 12,000 16,532 1.38 F(2) 19,893 1.658 F(3) 65 19,958 1.663 F(3) 0.005 NO
e/oAlamedaSt/SantaFeAve‐CMPStation1033
WB 6 12,000 6,526 0.54 C 7,887 0.657 C 25 7,912 0.659 C 0.002 NO
a Capacity assumes 2,000 vehicles/hour/lane based on analysis contained in 2010 Congestion Management Program, Metro, 2010. b 2015 Volume obtained from CMP 2009 Data, factored to 2015 conditions using CMP growth rate for the RSA that contains freeway census station. c Freeway Segment LOS methodology taken from 2010 CMP, Metro, 2010. d CMP defines significant freeway impact as change in D/C ratio of 0.02 or more when a freeway segment is at LOS F (D/C ratio > 1.00). Source: Fehr & Peers, 2016

August 2016 4.l. Transportation and Traffic
LosAngelesCountyDepartmentofPublicWorks Harbor‐UCLAMedicalCenterCampusMasterPlanProjectSCH#2014111004 4.L‐71
(4) Caltrans Facilities
(a) Freeway Mainlines and Intersections
ThresholdTRAF‐4: Would the Project result in traffic thatwould extend onto the freewaymainline orintersectionwere foundtooperateatLOSFwith theadditionofProject‐relatedtrafficandthe increase isequaltoorgreaterthan50trips?
Impact Statement TRAF‐4: The Projectwould increase traffic on the Caltrans facilities. With regard tofreeway segmentsand intersections,while theCountywouldmakea fair‐sharecontribution tooffsetincreases in trips thatwouldoccurasa resultofProject traffic, theProject couldhavea significantimpactonCaltrans facilities. While theCountywouldcontributea fair‐sharecontribution for futureimprovements,thisimpactisconsideredpotentiallysignificant.
(i) Freeway Mainlines
MorningandafternoonpeakhouranalysisofsixselectedfreewaymainlinesegmentsintheProjectvicinitywasconductedinresponsetoarequestfromCaltrans:
I‐110at228thStreet
I‐110atElSegundoBoulevard
I‐405atI‐710
I‐405southofI‐110
I‐405northofWesternAvenue
SR‐91atAvalonBoulevard
Asdiscussedabove,thelevelofservicedefinitionsusedforfreewaymainlinesegmentsareshownaboveinTable4.L‐1.Caltrans’GuideforthePreparationofTrafficImpactStudies(December2002)statesthat:
“Thelevelofservice(LOS)foroperatingStatehighwayfacilitiesisbaseduponmeasuresofeffectiveness (MOEs). Caltrans endeavors to maintain a target LOS at the transitionbetweenLOS‘C’andLOS‘D’onStatehighwayfacilities.IfanexistingStatehighwayfacilityis operating at less than the appropriate target LOS, the existing MOE should bemaintained.”
Thesurroundingfreeways(I‐405,I‐710,SR‐91,andI‐110)areoperatingatornearcapacityduringthepeakperiod.Whenadditionaltraffictripsareassignedtothosefreeways,existingLOSshouldbemaintained.
FollowingconsultationbetweenCountystaffandCaltransstaff, itwasagreedthat for thepurposesof thisstudyforthisProject,animpactwouldbeconsideredadverseiftheanalyzedfreewaysegmentwerefoundtooperateatLOSFwiththeadditionofProject‐relatedtrafficandiftheincreasewereequaltoorgreaterthan50trips.

4.l. Transportation and Traffic August 2016
LosAngelesCountyDepartmentofPublicWorks Harbor‐UCLAMedicalCenterCampusMasterPlanProjectSCH#2014111004 4.L‐72
Existing (2014)andExistingplusProject freewaysegment analysis ispresented inTable4.L‐18,Existing(2014)PeakHour Freeway SegmentAnalysis, and Cumulative (2030) and Cumulative (2030) plus Projectfreeway segment analysis is presented in Table 4.L‐19, Cumulative (2030) Peak Hour Freeway SegmentAnalysis. Asshown,usingthismethodology,adverseimpactsareidentifiedonthefollowingthreefreewaysegments:
Existing(2014)plusProjectatFullBuildout
I‐405atI‐710–northboundintheAMpeakhour(52Project‐addedtrips)
Cumulative(2030)plusProjectatFullBuildout
I‐110at228thStreet–northboundintheAMpeakhour(52Project‐addedtrips)
I‐110atElSegundoBoulevard–southboundintheAMpeakhour(78Project‐addedtrips)
I‐405atI‐710–northboundintheAMpeakhour(52Project‐addedtrips)
Toaddresstheseadverseimpactsthreepotentialmeasureswereinvestigated:
ReduceProject‐generated trafficbyreducing thebuildingprogramorby implementingamoreeffectiveTDMprogramsufficient to reduceestimated tripsby1% to avoid twoof theadverseimpactsidentifiedor6%toavoidallthreeoftheadverseimpactsidentified.Theeffectivenessoftheongoingprogramsvariesfromyeartoyear,however,anditisnotpossibletoguaranteethatspecificmeasureswouldbeeffectiveinperpetuity.
Addmainline freeway capacity to address existing and cumulative conditions. Thiswould bebeyond theabilityofany individualproject to implement,due to thepotentialneed toacquireright‐of‐wayandthemagnitudeofthecost.
ContributetoimplementationofCaltrans’projectstoaddresscongestioninthestudyarea,whichwould contribute to minimizing the impact associated with the proposed development.However,therearenospecificimprovementsidentifiedforimplementation.Thus,nofair‐sharecontributioncanbecalculatedormade.
Becausethepotentialmeasuresdescribedabovewereeachfoundtobeinfeasible,theProject’sincrementalimpacts on poor cumulative conditions on identified segments would be considered significant andunavoidable.

August 2016 4.l. Transportation and Traffic
LosAngelesCountyDepartmentofPublicWorks Harbor‐UCLAMedicalCenterCampusMasterPlanProjectSCH#2014111004 4.L‐73
Table 4.L‐18
Existing (2014) Peak Hour Freeway Segment Analysis
Name a Peak Hour
Existing
Full Buildout Project Trips
Existing plus Project
Change in Density Project Impact? b Northbound Southbound Northbound Southbound
Density (pc/mi/ln)* LOS
Density (pc/mi/ln)* LOS Northbound Southbound
Density (pc/mi/ln)* LOS
Density (pc/mi/ln)* LOS Northbound Southbound Northbound Southbound
I‐110at228thStreet AM 37.0 E 22.9 C 52 11 37.5 E 22.9 C 0.5 0.0 NO NOI‐110228thStreet PM 23.1 C 33.7 D 17 56 23.2 C 34.1 D 0.1 0.4 NO NO I‐110atElSegundoBlvd AM 27.0 D 36.9 E 12 78 27.0 D 37.5 E 0.0 0.6 NO NOI‐110ElSegundoBlvd PM 26.1 D 37.4 E 62 26 26.4 D 37.6 E 0.3 0.2 NO NO I‐405JCT.RTE710 AM 47.5 F 27.4 D 52 8 48.0 F 27.4 D 0.5 0.0 YES NOI‐405JCT.RTE710 PM 28.5 D 43.8 E 16 41 28.5 D 44.2 E 0.0 0.4 NO NO I‐405S/OJCTRTE110,CarsonScales AM 33.9 D 28.2 D 0 0 33.9 D 28.2 D 0.0 0.0 NO NOI‐405SOJCTRTE110,CarsonScales PM 26.0 C 37.9 E 0 0 26.0 C 37.9 E 0.0 0.0 NO NO I‐405N/OWesternAvenue;VanNessAvenue AM 30.8 D 29.0 D 15 78 30.8 D 29.3 D 0.0 0.3 NO NOI‐405NOWesternAvenue;VanNessAvenue PM 27.5 D 31.8 D 78 24 27.9 D 31.9 D 0.4 0.1 NO NO
Name a Peak Hour
Existing
Full Buildout Project Trips
Existing plus Project
Change in Density Project Impact? b Eastbound Westbound Eastbound Westbound
Density (pc/mi/ln)* LOS
Density (pc/mi/ln)
* LOS Eastbound Westbound Density
(pc/mi/ln)* LOS
Density (pc/mi/ln)
* LOS Eastbound Westbound Northbound Westbound
SR91atAvalonBoulevardInterchange AM 21.9 C 28.7 D 13 80 21.9 C 29.1 D 0.0 0.4 NO NOSR91AvalonBoulevardInterchange PM 26.1 D 19.9 C 65 25 26.4 D 20.0 C 0.3 0.1 NO NO
:
* pc/mi/ln denotes passenger cars per mile per lane a Analyzed using Freeway methodology from Highway Capacity Manual, Transportation Research Board, 2010. b After discussion with Caltrans staff, Impact Criteria was defined as mainline LOS F and more than 50 project trips. Source: Fehr & Peers, 2016
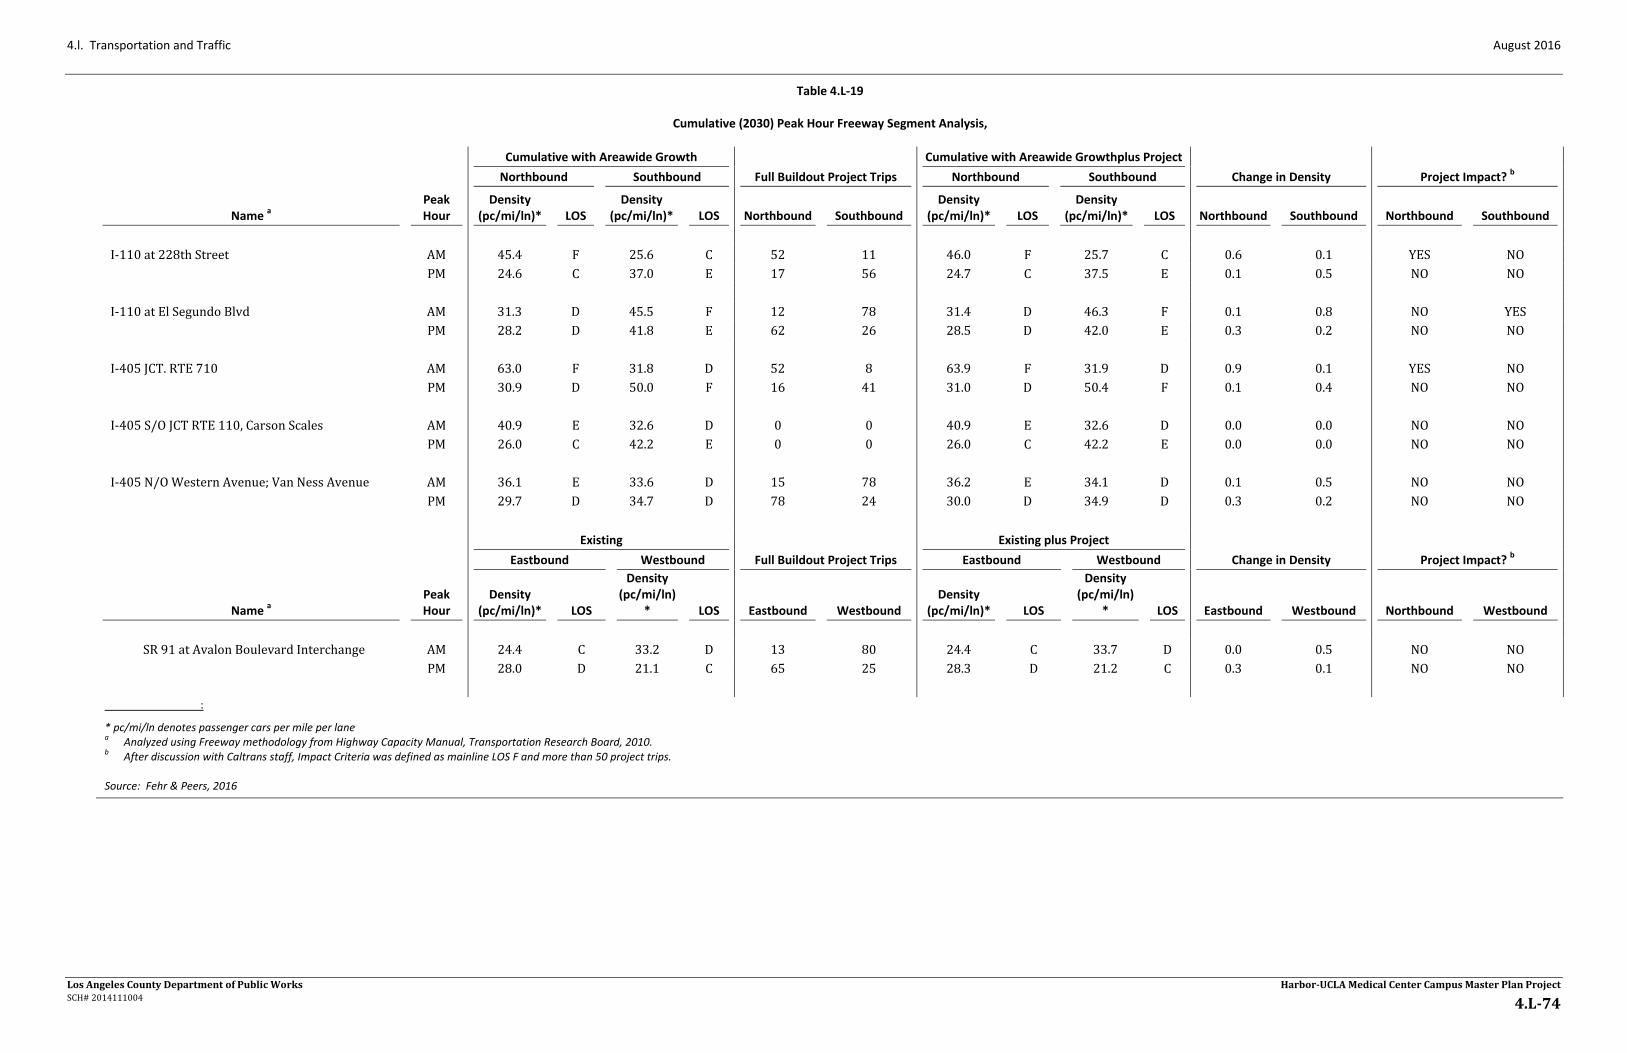
4.l. Transportation and Traffic August 2016
LosAngelesCountyDepartmentofPublicWorks Harbor‐UCLAMedicalCenterCampusMasterPlanProjectSCH#2014111004 4.L‐74
Table 4.L‐19
Cumulative (2030) Peak Hour Freeway Segment Analysis,
Name a Peak Hour
Cumulative with Areawide Growth
Full Buildout Project Trips
Cumulative with Areawide Growthplus Project
Change in Density Project Impact? b Northbound Southbound Northbound Southbound
Density (pc/mi/ln)* LOS
Density (pc/mi/ln)* LOS Northbound Southbound
Density (pc/mi/ln)* LOS
Density (pc/mi/ln)* LOS Northbound Southbound Northbound Southbound
I‐110at228thStreet AM 45.4 F 25.6 C 52 11 46.0 F 25.7 C 0.6 0.1 YES NOI‐110228thStreet PM 24.6 C 37.0 E 17 56 24.7 C 37.5 E 0.1 0.5 NO NO I‐110atElSegundoBlvd AM 31.3 D 45.5 F 12 78 31.4 D 46.3 F 0.1 0.8 NO YESI‐110ElSegundoBlvd PM 28.2 D 41.8 E 62 26 28.5 D 42.0 E 0.3 0.2 NO NO I‐405JCT.RTE710 AM 63.0 F 31.8 D 52 8 63.9 F 31.9 D 0.9 0.1 YES NOI‐405JCT.RTE710 PM 30.9 D 50.0 F 16 41 31.0 D 50.4 F 0.1 0.4 NO NO I‐405S/OJCTRTE110,CarsonScales AM 40.9 E 32.6 D 0 0 40.9 E 32.6 D 0.0 0.0 NO NOI‐405SOJCTRTE110,CarsonScales PM 26.0 C 42.2 E 0 0 26.0 C 42.2 E 0.0 0.0 NO NO I‐405N/OWesternAvenue;VanNessAvenue AM 36.1 E 33.6 D 15 78 36.2 E 34.1 D 0.1 0.5 NO NOI‐405NOWesternAvenue;VanNessAvenue PM 29.7 D 34.7 D 78 24 30.0 D 34.9 D 0.3 0.2 NO NO
Name a Peak Hour
Existing
Full Buildout Project Trips
Existing plus Project
Change in Density Project Impact? b Eastbound Westbound Eastbound Westbound
Density (pc/mi/ln)* LOS
Density (pc/mi/ln)
* LOS Eastbound Westbound Density
(pc/mi/ln)* LOS
Density (pc/mi/ln)
* LOS Eastbound Westbound Northbound Westbound
SR91atAvalonBoulevardInterchange AM 24.4 C 33.2 D 13 80 24.4 C 33.7 D 0.0 0.5 NO NOSR91AvalonBoulevardInterchange PM 28.0 D 21.1 C 65 25 28.3 D 21.2 C 0.3 0.1 NO NO
:
* pc/mi/ln denotes passenger cars per mile per lane a Analyzed using Freeway methodology from Highway Capacity Manual, Transportation Research Board, 2010. b After discussion with Caltrans staff, Impact Criteria was defined as mainline LOS F and more than 50 project trips. Source: Fehr & Peers, 2016

August 2016 4.l. Transportation and Traffic
LosAngelesCountyDepartmentofPublicWorks Harbor‐UCLAMedicalCenterCampusMasterPlanProjectSCH#2014111004 4.L‐75
(ii) Intersections
Analysisof the arterial intersectionofWesternAvenue (StateRoute213)&CarsonStreetwas conductedusingtheHighwayCapacityManual(HCM)methodology inresponsetoarequest fromCaltrans. Caltrans,LADOTandtheCityofTorrancehavejointlyagreedtomodifythesignalintheneartermatthislocationbyimplementingprotectedleft‐turnphasingontheeastboundandwestboundapproaches.
The discussion above regarding Caltrans’ MOEs for freeway mainline segments also applies to arterialintersections.However,followingconsultationbetweencountystaffandCaltransstaff,itwasagreedthatforthepurposesofthisstudyofthisProject,animpactwouldbeconsideredadverseiftheanalyzedintersectionwerefoundtooperateatLOSFwiththeadditionofProject‐relatedtrafficandiftheincreasewereequaltoorgreaterthan50trips.TheresultsofthisanalysisunderExistingconditionswithoutandwiththeProject,InterimYear(2023)withoutandwiththeProject,andCumulativeYear(2030)withoutandwiththeProjectarepresentedinTable4.L‐20,PeakHourHighwayCapacityManualIntersectionAnalysis–WesternAvenue(StateRoute213)&CarsonStreet. Detailed levelofserviceworksheetsareprovided inAppendixCof theTraffic Study. The intersection is operating at LOSE under Existing andExisting plus Project conditions.UnderInterimDevelopment(2023)andCumulative(2030)conditionsinboththeAMandPMpeakhours,theintersectionisprojectedtodeclinetoLOSFwithoutorwiththeadditionofProjecttraffic.BecausetheProjectwould addmore than 50 trips in both the AM and PMpeak hours during the Cumulative (2030)condition,theimpactwouldbeapotentiallysignificantimpact.
Table 4.L‐20
Peak Hour Highway Capacity Manual Intersection Analysis – Western Avenue (State Route 213) & Carson Street
Scenario Time
Period
Without Project Plus Project b Project
Trips Project Delay
Adverse Impact c Delay LOS Delay LOS
Existing AM 66.4 E 67.8 E 55 1.4 NOPM 65.8 E 69.9 E 73 4.1 NO
Interim (2023) with Areawide Growth d
AM 93.6 F 93.7 F 17 0.1 NOPM 116.4 F 117.5 F 20 1.1 NO
Cumulative (2030) with Areawide Growth d
AM 105.7 F 106.9 F 55 1.2 YESPM 133.6 F 138.2 F 73 4.6 YES
a Analyzed using Freeway methodology from Highway Capacity Manual, Transportation Research Board, 2010. b Project trips for Existing and Cumulative (2030) with areawide growth are for Full Buildout. Project Trips for Interim (2023) with areawide
growth are for Interim Development. c After discussion with Caltrans staff, Impact Criteria was defined as intersection operating at LOS F and more than 50 project trips. d Includes protected left‐turn phases for eastbound and westbound approaches. Source: Fehr & Peers, 2016

4.l. Transportation and Traffic August 2016
LosAngelesCountyDepartmentofPublicWorks Harbor‐UCLAMedicalCenterCampusMasterPlanProjectSCH#2014111004 4.L‐76
(b) Freeway Off‐Ramps
ThresholdTRAF‐5:WouldtheProjectresultintrafficwheretheoff‐rampqueueextendsbeyondthelengthoftherampitselfontothemainlineofthefreewayduringthepeakarrivalperiod?
ImpactStatementTRAF‐5:TheProjectwouldincreasetrafficontheCaltransfacilities.However,withregardtooff‐ramps,theProjectwouldnotcontributetrafficsuchthatoff‐rampqueueswouldextendbeyondthelengthoftherampitselfontothemainlineofafreewayduringpeakarrivalperiods.Thus,impactswouldbelessthansignificant.
Afreewayrampqueuinganalysiswasconductedatsix freewayrampterminal intersections intheProjectvicinityinresponsetoarequestfromCaltrans:
I‐110NorthboundOff‐Rampat220thStreet/FigueroaStreet(Exit7)
I‐110SouthboundOff‐RampatCarsonStreet(Exist7B)
I‐110SouthboundOff‐Rampat223rdStreet(Exit7B)
I‐405NorthboundOff‐RampatCarsonStreet(Exit34)
I‐405NorthboundOff‐RampatWilmingtonAvenue(Exit33B)
I‐405SouthboundOff‐RampatEastCarsonStreet(Exit34)
FollowingconsultationbetweenCountystaffandCaltransstaff, itwasagreedthat for thepurposesof thisstudy for this Project, an impactwould be considered adverse if the off‐ramp queue extends beyond thelengthoftherampitselfontothemainlineofthefreewayduringthepeakarrivalperiod.Table4.L‐21,PeakHourOff‐Ramp Intersection95thPercentileQueues, presents a summary of the ramp queuing analysis forExisting,Cumulative(2030)andCumulative(2030)plusProjectconditions.Thequeuedoesnotexceedtheramplengthinanyofthescenarios;therefore,lessthansignificantimpactswouldoccur.

August 2016 4.l. Transportation and Traffic
LosAngelesCountyDepartmentofPublicWorks Harbor‐UCLAMedicalCenterCampusMasterPlanProjectSCH#2014111004 4.L‐77
Table 4.L‐21
Peak Hour Off‐Ramp Intersection 95th Percentile Queues
Ramp Cross Street Ramp Length
Ramp Turn Lanes at Intersection Existing (2014) Cumulative (2030) with Areawide Growth Cumulative (2030) with Areawide Growth plus
Project Queue
Exceeds Storage? # of Lanes Move Length
AM Queue PM Queue AM Queue PM Queue AM Queue PM Queue
Lane (ft) Max (ft) Lane (ft) Max (ft) Lane (ft) Max (ft) Lane (ft) Max (ft) Lane (ft) Max (ft) Lane (ft) Max (ft)
I‐110SBRamps CarsonStreet 980 2Left 980 130
640a250
350150
770a280
520a150
970a280
580a NORight 380 640 350 770 520 970 580
220thStreet/I‐110NBRamps
FigueroaStreet 1,150 2Through/Left 1,150 570
570a710
710a640
640a790
790a680
680a810
810a NORight 525 0 30 0 50 20 60
I‐110SBRamps 223rdStreet 930 2Through/Left 930 360
360340
340440
440a440
440530
530a480
480a NOThrough/Right 390 b b b b b b
I‐405SBRamps CarsonStreet 1,120 2Left 1,120 40
5040
4050
6040
5050
6040
50 NORight 660 50 40 60 50 60 50
I‐405NBRamps CarsonStreet 1,200 2Through/Left 630 30
3040
4030
3040
4030
3040
40 NORight 1,200 0 0 0 0 0 0
I‐405NBRamps WilmingtonAvenue
1,350 3
Left 900 440
440
400
400
530
530
480
480
550
550
490
490 NOLeft 1,350 b b b b b b
Right 450 360 60 490 120 490 120
a: 95th percentile volume exceeds capacity, queue may be longer. b Queue same as in adjacent lane. Source: Fehr & Peers, 2016

4.l. Transportation and Traffic August 2016
LosAngelesCountyDepartmentofPublicWorks Harbor‐UCLAMedicalCenterCampusMasterPlanProjectSCH#2014111004 4.L‐78
Thispageintentionallyblank.
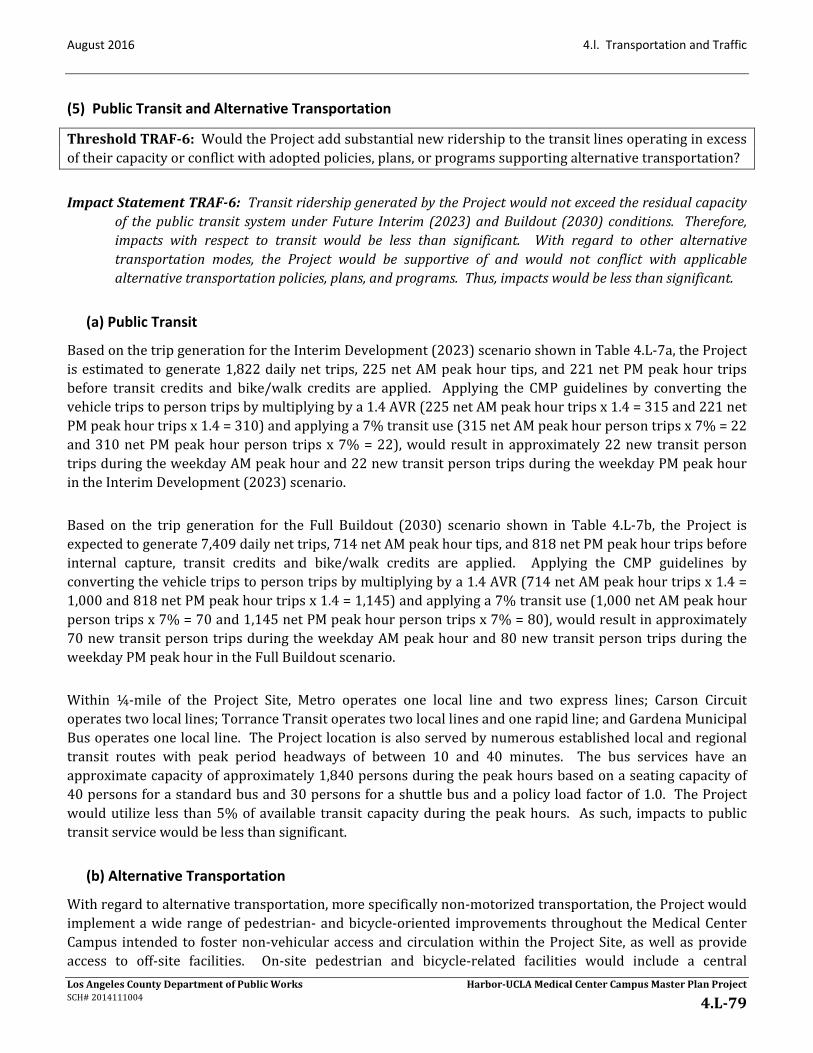
August 2016 4.l. Transportation and Traffic
LosAngelesCountyDepartmentofPublicWorks Harbor‐UCLAMedicalCenterCampusMasterPlanProjectSCH#2014111004 4.L‐79
(5) Public Transit and Alternative Transportation
ThresholdTRAF‐6:WouldtheProjectaddsubstantialnewridershiptothetransitlinesoperatinginexcessoftheircapacityorconflictwithadoptedpolicies,plans,orprogramssupportingalternativetransportation?
ImpactStatementTRAF‐6:TransitridershipgeneratedbytheProjectwouldnotexceedtheresidualcapacityof thepublic transit systemunderFuture Interim (2023)andBuildout (2030)conditions. Therefore,impacts with respect to transit would be less than significant. With regard to other alternativetransportation modes, the Project would be supportive of and would not conflict with applicablealternativetransportationpolicies,plans,andprograms.Thus,impactswouldbelessthansignificant.
(a) Public Transit
BasedonthetripgenerationfortheInterimDevelopment(2023)scenarioshowninTable4.L‐7a,theProjectisestimatedtogenerate1,822dailynettrips,225netAMpeakhourtips,and221netPMpeakhourtripsbefore transit credits and bike/walk credits are applied. Applying the CMP guidelines by converting thevehicletripstopersontripsbymultiplyingbya1.4AVR(225netAMpeakhourtripsx1.4=315and221netPMpeakhourtripsx1.4=310)andapplyinga7%transituse(315netAMpeakhourpersontripsx7%=22and310netPMpeakhourperson tripsx7%=22),wouldresult inapproximately22newtransitpersontripsduringtheweekdayAMpeakhourand22newtransitpersontripsduringtheweekdayPMpeakhourintheInterimDevelopment(2023)scenario.
Based on the trip generation for the Full Buildout (2030) scenario shown in Table 4.L‐7b, the Project isexpectedtogenerate7,409dailynettrips,714netAMpeakhourtips,and818netPMpeakhourtripsbeforeinternal capture, transit credits and bike/walk credits are applied. Applying the CMP guidelines byconvertingthevehicletripstopersontripsbymultiplyingbya1.4AVR(714netAMpeakhourtripsx1.4=1,000and818netPMpeakhourtripsx1.4=1,145)andapplyinga7%transituse(1,000netAMpeakhourpersontripsx7%=70and1,145netPMpeakhourpersontripsx7%=80),wouldresultinapproximately70newtransitpersontripsduringtheweekdayAMpeakhourand80newtransitpersontripsduringtheweekdayPMpeakhourintheFullBuildoutscenario.
Within ¼‐mile of the Project Site, Metro operates one local line and two express lines; Carson Circuitoperatestwolocallines;TorranceTransitoperatestwolocallinesandonerapidline;andGardenaMunicipalBusoperatesonelocalline.TheProjectlocationisalsoservedbynumerousestablishedlocalandregionaltransit routes with peak period headways of between 10 and 40 minutes. The bus services have anapproximatecapacityofapproximately1,840personsduringthepeakhoursbasedonaseatingcapacityof40personsforastandardbusand30personsforashuttlebusandapolicyloadfactorof1.0. TheProjectwouldutilize less than5%ofavailable transit capacityduring thepeakhours. Assuch, impacts topublictransitservicewouldbelessthansignificant.
(b) Alternative Transportation
Withregardtoalternativetransportation,morespecificallynon‐motorizedtransportation,theProjectwouldimplementawiderangeofpedestrian‐andbicycle‐oriented improvements throughout theMedicalCenterCampus intended to fosternon‐vehicularaccessandcirculationwithin theProjectSite, aswell asprovideaccess to off‐site facilities. On‐site pedestrian and bicycle‐related facilities would include a central
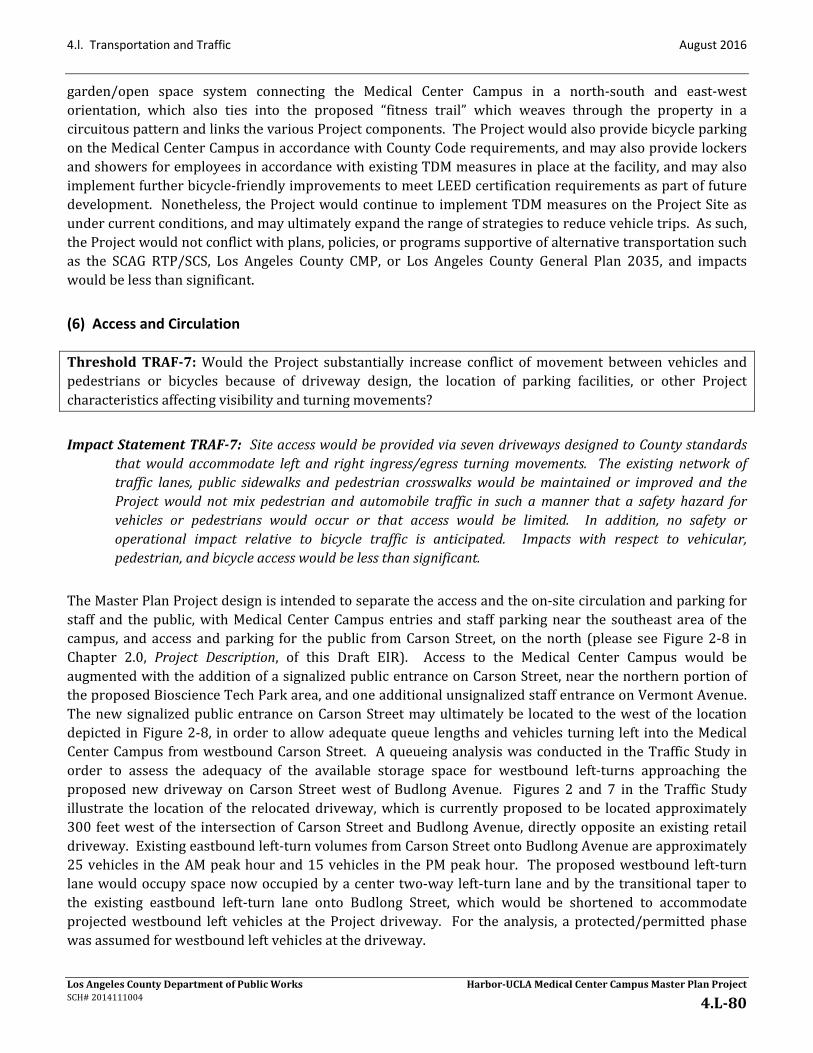
4.l. Transportation and Traffic August 2016
LosAngelesCountyDepartmentofPublicWorks Harbor‐UCLAMedicalCenterCampusMasterPlanProjectSCH#2014111004 4.L‐80
garden/open space system connecting the Medical Center Campus in a north‐south and east‐westorientation, which also ties into the proposed “fitness trail” which weaves through the property in acircuitouspatternandlinksthevariousProjectcomponents.TheProjectwouldalsoprovidebicycleparkingontheMedicalCenterCampusinaccordancewithCountyCoderequirements,andmayalsoprovidelockersandshowersforemployeesinaccordancewithexistingTDMmeasuresinplaceatthefacility,andmayalsoimplementfurtherbicycle‐friendlyimprovementstomeetLEEDcertificationrequirementsaspartoffuturedevelopment. Nonetheless,theProjectwouldcontinuetoimplementTDMmeasuresontheProjectSiteasundercurrentconditions,andmayultimatelyexpandtherangeofstrategiestoreducevehicletrips.Assuch,theProjectwouldnotconflictwithplans,policies,orprogramssupportiveofalternativetransportationsuchas the SCAG RTP/SCS, Los Angeles County CMP, or Los Angeles County General Plan 2035, and impactswouldbelessthansignificant.
(6) Access and Circulation
ThresholdTRAF‐7:Would the Project substantially increase conflict ofmovement between vehicles andpedestrians or bicycles because of driveway design, the location of parking facilities, or other Projectcharacteristicsaffectingvisibilityandturningmovements?
ImpactStatementTRAF‐7: SiteaccesswouldbeprovidedviasevendrivewaysdesignedtoCountystandardsthatwouldaccommodate leftand right ingress/egress turningmovements. The existingnetworkoftraffic lanes, public sidewalks and pedestrian crosswalkswould bemaintained or improved and theProjectwould notmix pedestrian and automobile traffic in such amanner that a safety hazard forvehicles or pedestrians would occur or that access would be limited. In addition, no safety oroperational impact relative to bicycle traffic is anticipated. Impacts with respect to vehicular,pedestrian,andbicycleaccesswouldbelessthansignificant.
TheMasterPlanProjectdesignisintendedtoseparatetheaccessandtheon‐sitecirculationandparkingforstaff and thepublic,withMedical CenterCampus entries and staff parkingnear the southeast areaof thecampus, andaccess andparking for thepublic fromCarsonStreet, on thenorth (please seeFigure2‐8 inChapter 2.0, Project Description, of this Draft EIR). Access to the Medical Center Campus would beaugmentedwiththeadditionofasignalizedpublicentranceonCarsonStreet,nearthenorthernportionoftheproposedBioscienceTechParkarea,andoneadditionalunsignalizedstaffentranceonVermontAvenue.ThenewsignalizedpublicentranceonCarsonStreetmayultimatelybe locatedtothewestof the locationdepictedinFigure2‐8, inordertoallowadequatequeuelengthsandvehiclesturning left intotheMedicalCenterCampus fromwestboundCarsonStreet. Aqueueinganalysiswasconducted in theTrafficStudy inorder to assess the adequacy of the available storage space for westbound left‐turns approaching theproposed new driveway on Carson Streetwest of Budlong Avenue. Figures 2 and 7 in the Traffic Studyillustrate the locationof the relocateddriveway,which is currentlyproposed tobe locatedapproximately300 feetwestof the intersectionofCarsonStreetandBudlongAvenue,directlyoppositeanexistingretaildriveway.Existingeastboundleft‐turnvolumesfromCarsonStreetontoBudlongAvenueareapproximately25vehicles intheAMpeakhourand15vehicles inthePMpeakhour. Theproposedwestboundleft‐turnlanewouldoccupyspacenowoccupiedbyacentertwo‐wayleft‐turnlaneandbythetransitionaltapertothe existing eastbound left‐turn lane onto Budlong Street, which would be shortened to accommodateprojectedwestbound left vehicles at theProject driveway. For the analysis, a protected/permittedphasewasassumedforwestboundleftvehiclesatthedriveway.

August 2016 4.l. Transportation and Traffic
LosAngelesCountyDepartmentofPublicWorks Harbor‐UCLAMedicalCenterCampusMasterPlanProjectSCH#2014111004 4.L‐81
Table 17 in the Traffic Study presents a summary of the queuing analysis for Existing plus Project andCumulative (2030) plus Project conditions at build‐out for the AM and PM peak hours. The longestwestboundqueueisestimatedtobesixvehicles,requiringapproximately150feetofstorage. Providingawestbound left‐turn lane of sufficient lengthwould require shortening the eastbound left‐turn lane ontoBudlongAvenue,whichappearsfeasibleduetothemodestleft‐turnvolumesthatitserves.Assuch,accesstoandfromthisdrivewaywouldbeconsideredadequateandthusaccessimpactsatthislocationwouldbelessthansignificant.DetailedqueuecalculationsareprovidedinAppendixDoftheProjectTrafficStudy.
Sidewalk connections to the public transit systemwould continue to be provided, and on‐site sidewalkswouldbeaddedalongtheprimaryroutesbetweenthemainparkingareasandtheNewHospitalTowerandOutpatient buildings. Circular pick‐up and drop‐off loading zones would also be provided at the mainentrances to each of the New Hospital Tower and Outpatient buildings. Loading and trash collectionactivities would continue to occur within the existing location on the south side of the Surgery andEmergencybuilding,accessedviaeitherVermontAvenueor220thStreet.
Theproposed circulation improvements at theMedical CenterCampus, both vehicular andnon‐vehicular,wouldbedesigned,asnotedabove,toprovideseparationbetweenpedestrians/bicyclistandmotorvehiclesinordertominimizepotentialconflictsandassociatedhazards.GivenimplementationofMasterPlandesignprinciplesandproposedcirculationplancomponents,itisanticipatedthatvehicularcirculation,bicycleandpedestrian safety, and both vehicular and non‐vehicular access and circulation on‐site would not onlymaintained but substantially improved relative to existing conditions as no unified, comprehensivecirculationsystemcurrentlyexistsontheMedicalCenterCampus.Furthermore,allaccesspointsandon‐sitecirculation improvements would be designed in accordance with County standards under the review ofCountystaff.Therefore,impactsregardingaccessandcirculationwouldbelessthansignificant.
(7) Parking Supply
ThresholdTRAF‐8:WouldtheProjectprovidelessparkingthantheprojecteddemand?
ImpactStatementTRAF‐8: TheProjectwouldprovidevehicleparkingsufficienttomeetprojecteddemand.Therefore,impactsrelatedtoparkingwouldbelessthansignificant.
Asnotedabove,theMedicalCenterCampuscurrentlyprovides2,905totalparkingspaces,whichexceedstheCounty’sparkingcoderequirementof2,709spaces.Parkingforproposedfutureuseswouldbeprovidedasneeded throughout Master Plan Project implementation phases, which is planned to provide sufficientparkinginexcessofbothCountyCoderequirementsandprojecteddemands.BasedonparkingratiosforthevariouslandusesproposedundertheMedicalCenterCampus,includingtheproposedBioscienceTechPark,theCountyCode requirement foron‐siteparkingatProjectbuildout inyear2030wouldbe2,772spaces,while the projected demand for parking is estimated to be 3,424 parking spaces based on application ofadjusted ITE parking generation rates shown on page 59 of theHarbor‐UCLAMaster Plan. According toinformation provided by County staff, the Project would provide a total of 3,240 parking spaces on theMedical CenterCampus, not inclusiveof parking tobeprovided for theBioscienceTechParkuses,whichwouldaddanother1,000spacestoon‐siteparkingcapacity. Assuch, totalon‐siteparkingtoservefuturelandusesattheMedicalCenterCampusatbuildoutwouldbe4,240spaces,whichwouldbe816spacesmorethanthetotalprojecteddemandand1,468spacesmorethanrequiredbytheCountyCode.

4.l. Transportation and Traffic August 2016
LosAngelesCountyDepartmentofPublicWorks Harbor‐UCLAMedicalCenterCampusMasterPlanProjectSCH#2014111004 4.L‐82
Withregardtobicycleparking,theCountyCoderequiresshort‐termbicycleparkingatarateof1spaceforevery10,000gross square feet of building space and long‐termbicycleparking at a rate of one space forevery20,000grosssquarefeet,whichresultsinarequirementof246short‐termspacesand123long‐termspaces. It is anticipated that the Project, in accordance with existing and proposed TDM measures orpotentialLEEDrequirementsforfuturebuildings,wouldprovideadditionalbicycleparkingfacilitiesontheMedicalCenterCampusbeyondwhatisrequiredbytheCountyCode.
As discussed previously, the Projectwouldmeet the criteria set forth in SB 743 because it (1) is locatedwithin a transit priority area less than one‐half mile from the Harbor Freeway/Carson Station TOD(connectiontoMetroSilverLine)and(2)comprisesanemploymentcenterwithinanestablishedurbanarea.UnderSB743,theProjectwouldbeexemptfromfindingsofsignificancerelatedtoparkingeffects.However,for the purpose of this EIR, parking effects have been evaluated herein for informational and disclosurepurposes.Overall,astheProjectwouldprovideparkingforproposedusesinanamountgreaterthanbothCountyCoderequirementsandtheprojectedparkingdemand,impactsrelatedtoparkingsupplywouldbelessthansignificant.
e. Cumulative Impacts
(1) Construction
Impacts on traffic associated with construction (e.g., an intermittent reduction in street and intersectionoperatingcapacity)aretypicallyconsideredshort‐termadverseimpacts.Asdiscussedabove,theProjectisconservatively concluded to result in a significant traffic impact during construction associated withconstructionworkervehicleandtrucktripsduringpeakconstructionperiods,althoughimplementationofbothaConstructionTrafficManagementPlanandPedestrianSafetyPlan(PDFTRAF‐1andPDFTRAF‐2)thatwouldincorporatenotificationandsafetyproceduresandcontrolswouldreduceimpactsinthisregardtoacertain extent. Although details regarding the timing and location of future development projects in theProject area are currently unknown, it is possible that other construction activities in theProject vicinitycould occur concurrently with Project‐related construction activities given the approximately 14‐yearimplementation schedule for theMasterPlanProject, and thus theProject could contribute to cumulativetraffic impacts. Nonetheless,eachrelatedProjectwouldberequired tocomplywithCountyor respectiveCityrequirementsregardinghaulroutesandwouldimplementmitigationmeasuresand/orincludeProjectDesign Features, such as traffic controls and safety procedures, to reducepotential traffic impacts duringconstruction. However, even though theProject Site is locatedwithin closeproximity to the freewayandwould implement Project Design Features, due to the Project’s assumed significant construction trafficimpact,thenumberofrelatedprojectsinthevicinityandtheuncertaintyintermsoftimingforeachrelatedProject and the potential overlap of development, it is determined that the Project could contribute to acumulativelysignificantconstructionimpact.
(2) Operation
TheTrafficStudywasdevelopedtoaddressProjectimpactsinthecontextofexistingbaselineconditionsandfutureInterimYear(2023)andFullBuildout(2030)conditions.Thelattertwoscenariostakeintoaccounttraffic caused by the 26 related projects identified in Chapter 3.0, General Description of EnvironmentalSetting, of thisDraft EIR aswell as a growth factor to account for other ambient growthoccurring in theregion. Therefore, the analysis of future traffic conditions in 2023 and 2030 provides the cumulative

August 2016 4.l. Transportation and Traffic
LosAngelesCountyDepartmentofPublicWorks Harbor‐UCLAMedicalCenterCampusMasterPlanProjectSCH#2014111004 4.L‐83
analysis in that it considers traffic generatedby future planned landuses. The above analyses of Projectimpactshavetakenintoaccountthecumulativeimpactsassociatedwithfuturegrowth.
The Traffic Study analyzed seven scenarios: Existing (2014), Existing (2014) plus Interim DevelopmentProject, Existing (2014) plus Full Buildout Project, Interim (2023) without Project, Cumulative (2030)without Project, Interim (2023) plus Project, Cumulative (2030) plus Project. The LOS analysis for theCumulative (2030)plusProject scenariodetermined that theproposedProjectwould significantly impacttraffic ateight intersections. After theproposedmitigation, theproposedProjectwouldcreatesignificanttraffic impacts at one of the analyzed intersections. Thus, the Project would contribute to a significantcumulativeimpactatthislocation.
The regional transportationanalysis, includingpublic transit, isbasedonCMPprocedures thathavebeendevelopedtoaddresscountywidecumulativegrowthimpactsonregionaltransportationfacilities.TheCMPGuidelinescontainproceduresformonitoringlandusedevelopmentlevelsandtransitsystemperformanceby local jurisdictions andMetro and areused to informplanningof infrastructure improvements tomeetfuture needs, including development of the CMPCIP,Metro’s LRTP, and SCAG’sRTP. As indicated in thediscussionofProjectimpactsabove,theProjectwouldnothaveasignificantimpactonpublictransitandtheincrementalimpactsontheregionalpublictransitsystemwouldnotbecumulativelyconsiderable.AnalysesofpotentialimpactsontheregionaltransportationsystemconductedinaccordancewithCMPrequirementsdeterminedthattheProjectwouldnothaveasignificantimpactonCMPmonitoringintersections.Analysesofpotential impactson theregional transportation inaccordancewithCaltrans foundaProject impactonInterstate405northboundintheAMpeakhour,andcumulativeimpactsonInterstate110northboundandsouthboundintheAMpeakhour.OptionsforaddressingtheimpactswereidentifiedthatcanfullymitigateProject‐related impacts; however, given uncertainties regarding the timing of implementation of suchimprovements, impacts are conservatively concluded to be significant and unavoidable. Therefore, theProjectwouldcontributetoasignificantcumulativeimpactinthisregard.
Noimpactswerefoundatfreewayoff‐ramps.Thus,giventhattheanalysisofProject‐relatedtrafficimpactsunderfuturedevelopmentscenariosaccountsforambientgrowthandgrowthassociatedwiththe26relatedprojects,andProject‐relatedimpactswouldbelessthansignificant,theProject’scontributiontocumulativeeffectswouldnotbeconsiderable.
Withregardtopedestrianandbicycleaccessandfacilities,vehicularaccessandcirculation,andparking,theProjectwouldnotresult inasignificant impact. EachrelatedprojectwouldbereviewedbytheCountyorrespectiveCity toensurecompliancewith that jurisdiction’srequirementsrelative to theprovisionofsafeaccess for vehicles,pedestrianandcyclists. Access toeach sitewouldbeassessedduring theCounty’sorrespectiveCity’sreviewprocesstoensurecompliancewithapplicablerequirements,whichareestablishedto minimize potential impacts. With regard to parking, the related projects would be subject to theapplicable County or City parking requirements for vehicle and bicycle parking. Therefore, cumulativeimpacts on parking would be less than significant. Therefore, the Project would not contribute to asignificantcumulativeimpactwithregardtotheseissues.

4.l. Transportation and Traffic August 2016
LosAngelesCountyDepartmentofPublicWorks Harbor‐UCLAMedicalCenterCampusMasterPlanProjectSCH#2014111004 4.L‐84
4. MITIGATION MEASURES
a. Construction
(1) Temporary Construction Traffic and Parking (Threshold TRAF‐1)
WiththeincorporationofProjectDesignFeaturesPDF‐TRAF‐1,ConstructionTrafficManagementPlan,andPDFTRAF‐2,PedestrianSafety,constructiontrafficimpactswouldbelessthansignificant. However,giventheamountofdevelopment intheProjectarea, theuncertainty intermsof timing foreachrelatedProjectand the potential for overlap of development, the Project could contribute to a cumulatively significantconstruction impact. Beyond compliance with County requirements regarding haul routes andimplementationof trafficcontrolsandsafetyprocedures,noother feasiblemitigationmeasureshavebeenidentified.
b. Operation
(1) Intersection Service Levels (Threshold TRAF‐2)
The traffic impact analysis determined that the proposed development would generate significant trafficimpactsattwelve(12)ofthe22analyzedintersectionsunderfutureplusProjectconditions.Thefollowingmitigationmeasuresareprescribedtoaddressanumberoftheseimpacts,whereimprovementstoaddresssuchimpactsareconsideredfeasible.
I‐110SouthboundRamps&CarsonStreet(Intersection#9)–TheProjectwouldresult inapotentiallysignificantimpactattheintersectionofInterstate110SouthboundRamps&CarsonStreet(Intersection#9)intheAMandPMpeakhoursintheFullBuildoutscenariousingitscurrentlaneconfiguration.
MitigationMeasureTRAF‐1:I‐110SouthboundRamps&CarsonStreet(Intersection#9)‐Theexisting southbound approach on the Interstate I‐110 off‐ramp shall be restriped toconverttheexistingleft‐turnlanetoaleft‐/right‐turnlane.
ThisimprovementwouldrequirecoordinationwithandapprovalbyCaltrans.
220thStreet/I‐110NorthboundRamps&FigueroaStreet(Intersection#15)‐TheProjectwouldresultinapotentiallysignificant impactat the intersectionof220thStreet/I‐110NorthboundRamps&FigueroaStreet(Intersection#15)intheAMandPMpeakhoursintheFullBuildoutscenariousingitscurrentlaneconfiguration.
Mitigation Measure TRAF‐2: 220th Street/I‐110 Northbound Ramps & Figueroa Street(Intersection#15) ‐ An additional northbound through lane shall be striped and theexisting through lane shall be restriped as a through/right‐turn lane. The eastboundapproachshallbe restriped from theexisting through/left‐turn laneand right toa left‐turnlaneandthrough/right‐turnlane.
As stated in the Transportation and Infrastructure Element of the Carson General Plan, Figueroa Streetbetween 223rd Street and Carson Street is planned to bewidened to three lanes in each direction. Theproposedmitigation/improvementwouldrequirecoordinationwithandapprovalbyCaltransandtheCityofCarson.

August 2016 4.l. Transportation and Traffic
LosAngelesCountyDepartmentofPublicWorks Harbor‐UCLAMedicalCenterCampusMasterPlanProjectSCH#2014111004 4.L‐85
A mitigation involving modifying the existing raised median and restriping the northbound approach toaccommodate a second left‐turn lane was also considered. However, this mitigation was deemed to beinconsistentwiththeexistingon‐rampconfiguration,whichprovidesonegenerallaneandoneHOVlane.
I‐110SouthboundRamps&223rdStreet(Intersection#20) ‐TheProjectwouldresult inapotentiallysignificantimpactattheintersectionofInterstate110SouthboundRamps&223rdStreet(Intersection#20)intheAMandPMpeakhoursintheFullBuildoutscenariousingitscurrentlaneconfiguration.
MitigationMeasureTRAF‐3:I‐110SouthboundRamps&223rdStreet(Intersection#20)‐Thesouthboundapproachwouldberestripedfromtheexistingleft‐turn/throughandright‐turn/through lanes to a right‐turn lane and left‐turn/through/right‐turn lane. Theeastbound approach shall be restriped to change the existing right‐turn lane to athrough/right‐turn lane. Under this mitigation, parking shall be removed on 223rdbetween the Interstate I‐110 bridge and Figueroa Street and converted to a dedicatedright‐turnlane.
ThisimprovementwouldrequirecoordinationwithandapprovalbyCaltrans.
(2) CMP Transportation System (Threshold TRAF‐3)
Impacts to regional CMP transportation systems would be less than significant. Thus, no mitigationmeasuresarenecessary.
(3) Caltrans Facilities
(a) Freeway Mainlines and Intersections (Threshold TRAF‐4)
SignificantimpactshavebeenidentifiedwithregardtofreewaysegmentsandintersectionsunderCaltransjurisdiction.Assuch,mitigationmeasuresarerecommended.AlthoughtheProjectwouldincreasetrafficonthe freeway mainline segments, in light of the nature of regional nature of the freeway system,improvements to Caltrans freeway facilities tend to be beyond the feasibility of any individual Project toimplement. Thus, Caltrans allows development projects to pay a fair share or an equitable percentagecontributiontowardtheestimatedcostofanimprovement.
ThefollowingmitigationmeasureisrecommendedtoaddressthepotentiallysignificantimpactsthatwereidentifiedonthefreewaymainlinesegmentsandtheintersectionsthatareunderCaltrans’jurisdiction:
MitigationMeasureTRAF‐4: Thedevelopershall contributea fairsharecontribution toCaltranstowardananalysisorimprovementsonI‐110(HarborFreeway)intheProjectvicinitytooffset the additional Project‐generated trips thatwould result on the freewaymainlinesegmentsandthatwouldpassthroughtheaffectedCaltransintersections.
The fair share is calculated as the Project’s percentage of the total projected traffic growth on a freewaymainline segment over a 25‐year period. The fair share is a contribution toward the improvement andmaintenanceofasharedfacilitythatbenefitstheProjectandtheregion.

4.l. Transportation and Traffic August 2016
LosAngelesCountyDepartmentofPublicWorks Harbor‐UCLAMedicalCenterCampusMasterPlanProjectSCH#2014111004 4.L‐86
(b) Freeway Off‐Ramps (Threshold TRAF‐5)
Impactstofreewayoff‐rampswouldbelessthansignificant.Thus,nomitigationmeasuresarenecessary.
(4) Public Transit and Alternative Transportation (Threshold TRAF‐6)
Impactstopublictransitandalternativetransportationwouldbelessthansignificant. Thus,nomitigationmeasuresarenecessary.
(5) Access and Circulation (Threshold TRAF‐7)
Impacts regarding vehicular access and circulation would be less than significant. Thus, no mitigationmeasuresarenecessary.
(6) Parking Supply (Threshold TRAF‐8)
Impacts regarding parking supply would be less than significant. Thus, no mitigation measures arenecessary.
5. LEVEL OF SIGNIFICANCE AFTER MITIGATION
a. Construction
(1) Construction Traffic, Access, Transit and Parking (Threshold TRAF‐1)
Despite the incorporationofProjectDesignFeaturesPDF‐TRAF‐1, ConstructionTrafficManagementPlan,construction traffic impacts from constructionworker vehicles and truck trips, for both Project‐level andcumulativeconditions,areconservativelyconcludedtobesignificantandunavoidable.
With implementation of PDF‐TRAF‐1 and PDF‐TRAF‐2, impacts related to construction‐related vehicleaccess,pedestrianandbicycleaccessandsafety,public transit service,andconstructionparkingwouldbelessthansignificant.
b. Operation
(1) Intersections Levels of Service (Threshold TRAF‐2)
Table4.L‐22,ExistingPlusProjectwithMitigationforUnincorporatedLosAngelesCountyIntersectionLevelofServiceAnalysis, andTable4.L‐23,Cumulative (2030)PlusProjectwithMitigation forUnincorporatedLosAngelesCounty IntersectionLevelofServiceAnalysis, summarizemitigationmeasures at intersectionswithpotentially significant impacts using Los Angeles County’s impact criteria at intersections located withinunincorporated Los Angeles County. Table4.L‐24,ExistingPlusProjectwithMitigation for IncorporatedCities Intersection Level of Service Analysis, and Table 4.L‐25, Existing Plus Project with Mitigation forIncorporated Cities Intersection Level of Service Analysis, summarize mitigation measures at intersectionswith potentially significant impacts located in incorporated cities using the impact criteria from therespective city. Below is a summary of the intersection impacts after implementation of the mitigationmeasures.

August 2016 4.l. Transportation and Traffic
LosAngelesCountyDepartmentofPublicWorks Harbor‐UCLAMedicalCenterCampusMasterPlanProjectSCH#2014111004 4.L‐87
NormandieAvenue&TorranceBoulevard(Intersection#1) ‐TheProjectwouldresult inasignificantimpactatthisintersectionintheInterimExistingplus2023ProjectplusCumulative(2023)andExistingplus2030 Project plus Cumulative (2030) scenarios using its current lane configuration. Intersectionimprovementstoincreasethecapacityoftheroadwaysystemandtoreduceimpactsatthisintersectiontoalevelbelowsignificancewereinvestigated,suchastheadditionofseparateright‐turnlanesattheeastboundorwestbound approaches, butwere deemed infeasible due to insufficient street right‐of‐way. Thus, thisimpactwouldremainsignificantandunavoidable.
VermontAvenue&TorranceBoulevard (Intersection#2) ‐ The Project would result in a significantimpactatthisintersectionintheExistingplus2023ProjectplusCumulativeandExistingplus2030Projectplus Cumulative Interim (2023) and Cumulative (2030) scenarios using its current lane configuration.Intersection improvements to increase the capacity of the roadway system and to reduce impacts at thisintersection toa levelbelowsignificancewere investigated, suchasadditionalnorthboundorsouthboundthrough lanes,butweredeemed infeasibledue to insufficientstreetright‐of‐way.Thus, this impactwouldremainsignificantandunavoidable.
NormandieAvenue&CarsonStreet(Intersection#4)‐TheProjectwouldresultinasignificantimpactatthisintersectionundertheExisting,Interim(2023)andCumulative(2030)scenariosusingitscurrentlaneconfiguration.Intersectionimprovementstoincreasethecapacityand/orefficiencyoftheroadwaysystemand to reduce impacts at this intersection to a level below significance were investigated, such asreconfiguring the eastbound andwestbound approaches to provide an additional through lane, butweredetermined to conflict with preliminary concepts from the West Carson Transit Oriented DevelopmentSpecificPlan.Preliminaryconceptscallfortheadditionofbikelanesineachdirection.Thestreetdoesnothavesufficientright‐of‐waytoaccommodatebothnewbikelanesandanadditionalthroughlanes.Thus,thisimpactwouldremainsignificantandunavoidable.
BerendoAvenue&CarsonStreet(Intersection#6)–TheProjectwouldresultinasignificantimpactatthis intersectionunder theExisting andCumulative (2030) scenariosusing its current lane configuration.Intersectionimprovementstoincreasethecapacityand/orefficiencyoftheroadwaysystemandtoreduceimpacts at this intersection to a level below significance were investigated, such as reconfiguring theeastbound and westbound approaches to provide an additional through lane, but were determined toconflict with preliminary concepts from the West Carson Transit Oriented Development Specific Plan.Preliminaryconceptscallfortheadditionofbikelanesineachdirection.Thestreetdoesnothavesufficientright‐of‐waytoaccommodatebothnewbikelanesandanadditionalthroughlanes.Thus,thisimpactwouldremainsignificantandunavoidable.
MedicalCenterDrive&CarsonStreet(Intersection#7)‐TheProjectwouldresultinasignificantimpactatthisintersectionintheExistingplus2030Project,Existingplus2023ProjectplusCumulative,andExistingplus2030ProjectplusCumulativescenariosusingitscurrentlaneconfiguration.Intersectionimprovementstoincreasethecapacityand/orefficiencyoftheroadwaysystemandtoreduceimpactsatthisintersectiontoa level below significance were investigated, such as reconfiguring the eastbound and westboundapproaches toprovideanadditional through lane,butweredeemed toconflictwithpreliminaryconceptsfromtheWestCarsonTransitOrientedDevelopmentSpecificPlan.Preliminaryconceptscallfortheadditionofbikelanesineachdirection. Thestreetdoesnothavesufficientright‐of‐waytoaccommodatebothnewbikelanesandanadditionalthroughlanes.Thus,thisimpactwouldremainsignificantandunavoidable.

4.l. Transportation and Traffic August 2016
LosAngelesCountyDepartmentofPublicWorks Harbor‐UCLAMedicalCenterCampusMasterPlanProjectSCH#2014111004 4.L‐88
VermontAvenue&CarsonStreet(Intersection#8)–TheProjectwouldresultinasignificantimpactatthisintersectionundertheExisting,Interim(2023)andCumulative(2030)scenariosusingitscurrentlaneconfiguration.Intersectionimprovementstoincreasethecapacityand/orefficiencyoftheroadwaysystemand to reduce impacts at this intersection to a level below significance were investigated, such asreconfiguring the eastbound andwestbound approaches to provide an additional through lane, butweredetermined to conflict with preliminary concepts from the West Carson Transit Oriented DevelopmentSpecificPlan.Preliminaryconceptscallfortheadditionofbikelanesineachdirection.Thestreetdoesnothavesufficientright‐of‐waytoaccommodatebothnewbikelanesandanadditionalthroughlanes.Thus,thisimpactwouldremainsignificantandunavoidable.
I‐110SouthboundRamps&CarsonStreet(Intersection#9)–TheProjectwouldresultinasignificantimpact at this intersection under the Existing, Interim (2023) and Cumulative (2030) scenarios. TheimplementationofthismitigationmeasurewouldreducetheProject‐relatedimpacttoalessthansignificantlevel andwould reduce the cumulative impact to a less than significant level in the AM peak hour. TheimpactduringthePMpeakhourwouldalsobereduced,butnotbelowasignificantlevel.ThisimprovementwouldrequirecoordinationwithandapprovalbyCaltrans.Becauseimplementationofthisimprovementisnotentirelywithinthecontroloftheleadagency,andbecausetheimprovementwouldnotfullymitigatetheidentifiedimpactsinallscenarios,thisimpactwouldbeconsideredsignificantandunavoidable.
VermontAvenue&220thStreet(Intersection#14)–TheProjectwouldresultinasignificantimpactatthis intersectionunder theExisting andCumulative (2030) scenariosusing its current lane configuration.Intersectionimprovementstoincreasethecapacityand/orefficiencyoftheroadwaysystemandtoreduceimpacts at this intersection to a level below significance were investigated, such as reconfiguring theeastbound approaches to provide a dedicated left turn‐lane butweredetermined to conflictwith the LosAngeles County Transit Oriented Districts Access Study. The Study calls for curb extensions at all fourcrossings to shorten the pedestrian crossing distance. The intersection approaches do not have sufficientspace to accommodate both curb extensions and additional lanes. Thus, this impact would remainsignificantandunavoidable.
220thStreet/I‐110NorthboundRamps&FigueroaStreet(Intersection#15)‐AsshowninTables4.L‐24and4.L‐25, the implementationofMitigationMeasureTRAF‐2would reduce theProject‐related impactatthis intersection to a less than significant level. However, this improvementwould require coordinationwith and approval by Caltrans. Because implementation of this improvement is not entirely within thecontroloftheleadagency,thisimpactisconsideredsignificantandunavoidable.
NormandieAvenue&223rdStreet(Intersection#17)‐TheProjectwouldresultinasignificantimpactatthis intersection in theCumulative (2030)Existingplus 2030Project andExistingplus2030Project plusCumulative scenarios using its current lane configuration. Intersection improvements to increase thecapacityand/orefficiencyoftheroadwaysystemandtoreduceimpactsatthisintersectiontoalevelbelowsignificancewereinvestigated,suchasreconfiguringtheeastboundandwestboundapproachestoprovidean additional through lane,butweredeemed to conflictwithpreliminary concepts from theWestCarsonTransitOrientedDevelopmentSpecificPlan.Preliminaryconceptscallfortheadditionofbikelanesineachdirection. The street does not have sufficient right‐of‐way to accommodate both new bike lanes and anadditionalthroughlanes.Thus,thisimpactwouldremainsignificantandunavoidable.

August 2016 4.l. Transportation and Traffic
LosAngelesCountyDepartmentofPublicWorks Harbor‐UCLAMedicalCenterCampusMasterPlanProjectSCH#2014111004 4.L‐89
VermontAvenue&223rdStreet(Intersection#19)‐TheProjectwouldresultinasignificantimpactatthisintersectionundertheExisting,Interim(2023)andCumulative(2030)scenariosusingitscurrentlaneconfiguration.Intersectionimprovementstoincreasethecapacityand/orefficiencyoftheroadwaysystemand to reduce impacts at this intersection to a level below significance were investigated, such asreconfiguring the eastbound andwestbound approaches to provide an additional through lane, butweredetermined to conflict with preliminary concepts from the West Carson Transit Oriented DevelopmentSpecificPlan.Thus,thisimpactwouldremainsignificantandunavoidable.
I‐110SouthboundRamps&223rdStreet(Intersection#20)‐AsshowninTables4.L‐22and4.L‐23,theimplementationofMitigationMeasureTRAF‐3wouldreducetheProject‐relatedimpactatthisintersectiontoalessthansignificantlevel. However,thisimprovementwouldrequirecoordinationwithandapprovalby Caltrans. Because implementation of this improvement is not entirely within the control of the leadagency,thisimpactisconsideredsignificantandunavoidable.
Overall, the Project would result in twelve (12) significant and unavoidable impacts to study areaintersections,eventhoughTables4.L‐22through4.L‐25showthatproposedimprovements,ifimplemented,wouldreduceimpactsattheseintersections,becauseimplementationoftheproposedimprovementsisnotentirelywithinthecontroloftheleadagency.
(2) CMP Transportation System (Threshold TRAF‐3)
Notapplicable.ImpactstoregionalCMPtransportationsystemswouldbelessthansignificant.
(3) Caltrans Facilities
(a) Freeway Mainlines and Intersections (Threshold TRAF‐4)
MitigationMeasureTRAF‐4requiresthatthedevelopermakeafair‐sharecontributiontoaddresspotentiallysignificantimpactsonfreewaymainlinesegments,intersectionsunderCaltransjurisdiction,andoff‐ramps.Caltransgenerallyconsidersfairsharecontributionstoconstitutefullmitigationofasignificantimpact. Inaddition,underCEQAGuidelinesSection15130(a)(3)fairsharecontributioncouldbeconsideredadequatemitigation forcumulative traffic impacts. Options foraddressing the impactswere identified,butbecausetherearenoexistingprojectsthatidentifiedbyCaltransthatwouldlowertheimpactbelowthesignificancethreshold,thesignificantimpactsidentifiedabovetoCaltransfacilitiesareconservativelydeterminedtobesignificantandunavoidable.
(b) Freeway Off‐Ramps (Threshold TRAF‐5)
Notapplicable.Impactstofreewayoff‐rampswouldbelessthansignificant.
(4) Public Transit and Alternative Transportation (Threshold TRAF‐6)
Notapplicable.Impactstopublictransitwouldbelessthansignificant.
(5) Access and Circulation (Threshold TRAF‐7)
Notapplicable.Impactsregardingvehicularaccessandcirculationwouldbelessthansignificant.

4.l. Transportation and Traffic August 2016
LosAngelesCountyDepartmentofPublicWorks Harbor‐UCLAMedicalCenterCampusMasterPlanProjectSCH#2014111004 4.L‐90
(6) Parking Supply (Threshold TRAF‐8)
Notapplicable.Impactsregardingparkingsupplywouldbelessthansignificant.

August 2016 4.l. Transportation and Traffic
LosAngelesCountyDepartmentofPublicWorks Harbor‐UCLAMedicalCenterCampusMasterPlanProjectSCH#2014111004 4.L‐91
Table 4.L‐22
Existing Plus Project with Mitigation for Unincorporated Los Angeles County Intersection Level of Service Analysis
ID N/S Street Name E/W Street Name
[a] Jurisdiction
Analysis Methodology
Analyzed Period
Existing Existing+Project Total Increase Significant Impacts
C+P plus Mitigation Project Increase Significant Impacts V/C or Delay LOS V/C or Delay LOS In V/C V/C or Delay LOS In V/C
4 NormandieAvenue CarsonStreet LosAngelesCounty ICU AM 0.904 E 0.925 E 0.021 YESNoFeasibleMitigation
PM 0.93 E 0.962 E 0.032 YES
6 BerendoAvenue CarsonStreet LosAngelesCounty ICU AM 0.575 A 0.642 B 0.067 NONoFeasibleMitigation
PM 0.569 A 0.708 C 0.139 YES
8 VermontAvenue CarsonStreet LosAngelesCounty ICU AM 0.628 B 0.717 C 0.089 YESNoFeasibleMitigation
PM 0.611 B 0.620 B 0.009 NO
9 I‐110SBRamps CarsonStreet LosAngelesCounty ICU AM 0.905 E 0.946 E 0.041 YES 0.745 C ‐0.069 NO
PM 0.917 E 1.010 F 0.093 YES 0.862 F 0.013 NO
14 VermontAvenue 220thStreet LosAngelesCounty ICU AM 0.814 D 0.907 E 0.093 YESNoFeasibleMitigation
PM 0.849 D 0.916 E 0.067 YES
19 VermontAvenue 223rdStreet LosAngelesCounty ICU AM 0.645 B 0.708 C 0.063 YESNoFeasibleMitigation
PM 0.696 B 0.806 D 0.11 YES
20 I‐110SBRamps 223rdStreet LosAngelesCounty ICU AM 0.807 D 0.828 D 0.021 YES 0.713 C ‐0.042 NO
PM 0.822 D 0.834 D 0.012 NO 0.779 E ‐0.064 NO
Source: Fehr & Peers, 2016

4.l. Transportation and Traffic August 2016
LosAngelesCountyDepartmentofPublicWorks Harbor‐UCLAMedicalCenterCampusMasterPlanProjectSCH#2014111004 4.L‐92
Table 4.L‐23
Cumulative (2030) Plus Project with Mitigation for Unincorporated Los Angeles County Intersection Level of Service Analysis
ID N/S Street Name E/W Street Name
[a] Jurisdiction
Analysis Methodology Analyzed
Period
Cumulative (2030) Cumulative
(2030)+Project Project Increase Significant Impacts
C+P plus Mitigation Project Increase Significant Impacts V/C or Delay LOS V/C or Delay LOS In V/C V/C or Delay LOS In V/C
1 NormandieAvenue TorranceBoulevard LosAngelesCounty ICU AM 0.962 E 0.966 E 0.031 YESNoFeasibleMitigation
PM 0.993 E 1.000 E 0.064 YES
2 VermontAvenue TorranceBoulevard LosAngelesCounty ICU AM 0.968 E 0.972 E 0.045 YESNoFeasibleMitigation
PM 0.895 D 0.900 D 0.020 YES
4 NormandieAvenue CarsonStreet LosAngelesCounty ICU AM 0.946 E 0.967 E 0.063 YESNoFeasibleMitigation
PM 1.007 F 1.038 F 0.108 YES
6 BerendoAvenue CarsonStreet LosAngelesCounty ICU AM 0.609 B 0.675 B 0.100 NONoFeasibleMitigation
PM 0.636 B 0.747 C 0.178 YES
8 VermontAvenue CarsonStreet LosAngelesCounty ICU AM 0.661 B 0.751 C 0.123 YESNoFeasibleMitigation
PM 0.678 B 0.722 C 0.111 YES
9 I‐110SBRamps CarsonStreet LosAngelesCounty ICU AM 0.939 E 0.982 E 0.077 YES 0.780 C ‐0.034 NO
PM 0.982 E 1.075 F 0.158 YES 0.915 E 0.066 YES
14 VermontAvenue 220thStreet LosAngelesCounty ICU AM 0.848 D 0.941 E 0.127 YESNoFeasibleMitigation
PM 0.906 E 0.974 E 0.125 YES
19 VermontAvenue 223rdStreet LosAngelesCounty ICU AM 0.647 B 0.717 C 0.072 YESNoFeasibleMitigation
PM 0.703 C 0.813 D 0.117 YES
20 I‐110SBRamps 223rdStreet LosAngelesCounty ICU AM 0.811 D 0.833 D 0.026 YES 0.719 C ‐0.036 NO
PM 0.830 D 0.844 D 0.022 YES 0.797 C ‐0.046 NO
Source: Fehr & Peers, 2016
Table 4.L‐24
Existing Plus Project with Mitigation for Incorporated Cities Intersection Level of Service Analysis
ID N/S Street Name E/W Street Name Jurisdiction Analysis
Methodology Analyzed
Period
Existing Existing+Project Project Increase Significant Impacts
C+P plus Mitigation Project Increase Significant Impacts V/C or Delay LOS V/C or Delay LOS In V/C V/C or Delay LOS In V/C
4 NormandieAvenue CarsonStreet CityofLosAngeles CMA AM 0.763 C 0.785 C 0.022 NONoFeasibleMitigation
PM 0.837 D 0.872 D 0.035 YES
15 FigueroaStreet 220thStreet/I‐110NBRamps
CityofCarson ICU AM 0.913 E 0.942 E 0.029 YES 0.907 E ‐0.006 NO
PM 0.886 D 1.000 E 0.114 YES 0.881 D ‐0.005 NO
Source: Fehr & Peers, 2016

August 2016 4.l. Transportation and Traffic
LosAngelesCountyDepartmentofPublicWorks Harbor‐UCLAMedicalCenterCampusMasterPlanProjectSCH#2014111004 4.L‐93
Table 4.L‐25
Cumulative (2030) Plus Project with Mitigation for Incorporated Cities Intersection Level of Service Analysis
ID N/S Street Name E/W Street Name Jurisdiction Analysis
Methodology Analyzed Period
Cumulative (2030) Cumulative
(2030)+Project Project Increase Significant Impacts
C+P plus Mitigation Project Increase Significant Impacts V/C or Delay LOS V/C or Delay LOS In V/C V/C or Delay LOS In V/C
4 NormandieAvenue CarsonStreet CityofLosAngeles CMA AM 0.910 E 0.933 E 0.023 YESNoFeasibleMitigation
PM 1.037 F 1.073 F 0.036 YES
15 FigueroaStreet 220thStreet/I‐110NBRamps
CityofCarson ICU AM 1.024 F 1.054 F 0.030 YES 1.017 F ‐0.007 NO
PM 1.006 F 1.121 F 0.115 YES 0.998 E ‐0.008 NO
Source: Fehr & Peers, 2016