Embed Size (px)
Citation preview

Risk Based Verification –Cambodia cook stove project
www.dnv.com/certification/climatechange
Version Slide 224 January 2008
Contents
1. Introduction of Det Norske Veritas AS
2. Risk Based Validation/Verification Approach
3. Key steps in validation process (CDM & Non CDM)
4. Key steps in verification and certification process
5. Cambodia GERES Cook Stove project –experience feedback
6. Mistakes to avoid and Lessons to be learnt

Introduction of Det Norske Veritas AS
Version Slide 424 January 2008
DNV – an independent foundation
Version Slide 524 January 2008
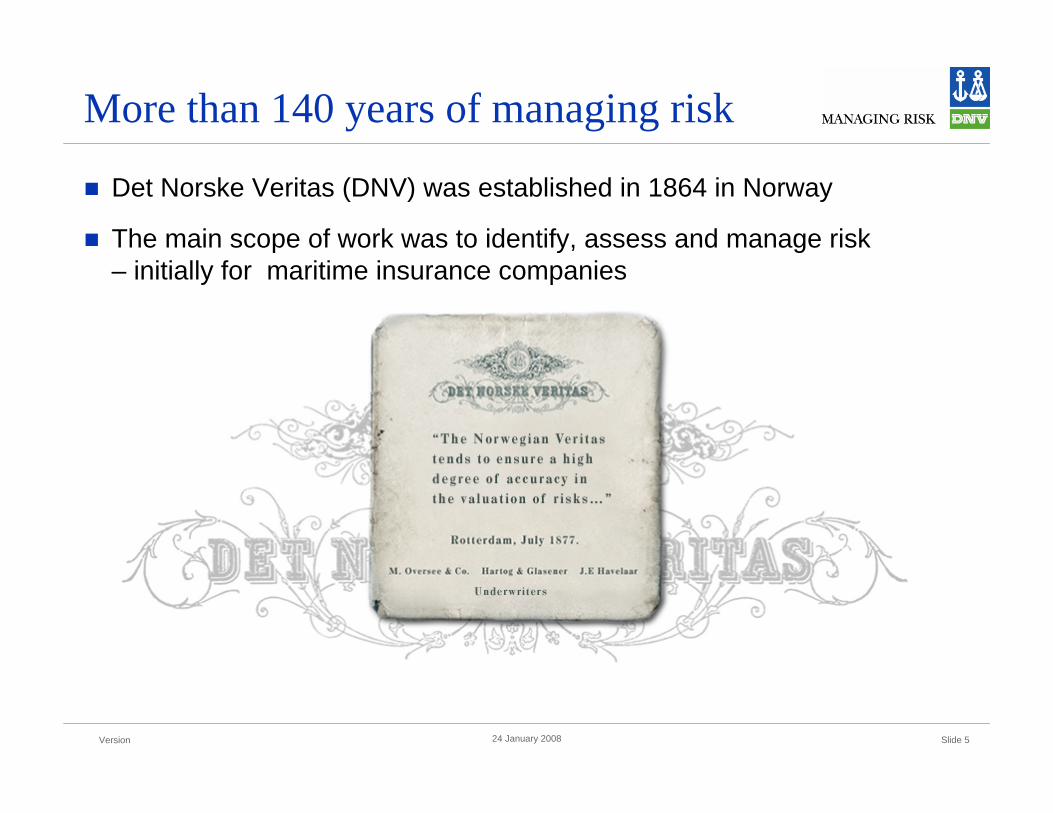
More than 140 years of managing risk
Det Norske Veritas (DNV) was established in 1864 in Norway
The main scope of work was to identify, assess and manage risk – initially for maritime insurance companies

Version Slide 624 January 2008
300 offices in 100 countries
Head office Local offices

Version Slide 724 January 2008
DNV Services
Leading CDM validation/verification bodywith 50% market share
Chair of the DOE group upon the CDM Executive Board
Over 100 trained GHG auditors
300 offices worldwide
Version Slide 824 January 2008
Accredited For All Major Scopes
DNV is accredited for 14/15 of the Scopes !http://cdm.unfccc.int/DOE/list/index.html

Version Slide 924 January 2008
DNV along your value chain
Assessment of GHG reductions
Identification and evaluation of reduction opportunities
Project design
Validation & Registration
Implementationand
operationVerification
CERs forsale or
compliance
DNV’s technology andR&D centre have long
experience with risk-basedmonitoring systems
DNV has validatedover 150 projects
in 15 industry sectorsand over 35 nations during
the last years
DNV is the first DesignatedOperational Entity to be accredited
for all major sectors under theClean Development
Mechanism.
DNV was instrumental in the development of PCF’s
and IETA’s Validation andVerification Manual
DNV is perceived bybrokers, project developers,
governments andother potential buyers
as guaranteeing highintegrity of verified
emission reductions
DNV validates corporateemissions for large European
clients under the EUemissions trading scheme
DNV was instrumental indeveloping monitoring
and reporting principles for theUNFCCC, the World Bank PCF
and the Dutch programmes
DNV staff are acquainted withthe latest developments in the
your sector, state-of-the-artTechnologies and (inter-)national
climate change and sector-specific policies

Version Slide 1024 January 2008
Reference List

Risk Based Validation/Verification
Approach

Version Slide 1224 January 2008
Risk-Based Validation Approach
Identify risks associated with assumptions made and data sources used
Review risk areas for completeness, conservativeness and accuracy
Detailed investigation of remaining areas of material uncertainty
Validation scope
Validation Report & Opinion
Project Design Document (PDD):Project designBaselineMonitoring PlanEmission reduction estimates Environmental impactsComments by local stakeholders
Comments by Parties, stakeholders and NGOs

Version Slide 1324 January 2008
The Risk Based Verification Approach
Monitoring Plan Monitoringrecords
GHG emissionreduction data
Understand control systems in place to manage risks
Identify areas of residual risk
Detailed audit testing of residualrisk areas and random testing of
other areas
Verification Statement
Forward Action Requests
Understanding the Project
Identify key reporting risks

Key steps in validation process
(CDM & Non CDM)

Version Slide 1524 January 2008
The Validation Process (CDM project)
SubmitDocumentation
Preliminary check
Identify risks associated
with assumptions
made and data sources
used
List of issues to be
discussed during follow-up interviews and site visit
schedule
• Initial clarifications• Assistance with logistics
Interviews with relevant stakeholders
Customized draft
determination report
• Clarifications• Corrective Actions
Final determination
report and opinion
Publication of determination
report
DNV
Phase 1Desk review
Phase 2Interviews
Phase 3Draft report
Phase 4Final report
Host country and donor country can request review for 45 days
StakeholdersStakeholder comment period of 30 days
Approval from host country
Project Developer

Version Slide 1624 January 2008
An Ideal Validation Timeline
Final determination report
Resolution of outstanding issues
Draft determination report
Follow-up interviews
PDD Desk review
30 days of public stakeholder process (CDM project only)
87654321Week

Version Slide 1724 January 2008
A realistic validation timeline
Final determination report
Resolution of outstanding issues
Draft determination report
Follow-up interviews
PDD Desk review
30 days of public stakeholder process (CDM Project only)
13121110987654321Week

Version Slide 1824 January 2008
Validation process
An Efficient Validation Process- Adding Value- Access to sufficiently accurate data and sources - Check additionality- Capacity to measure and document- Good project management- Communicate, communicate, communicate

Version Slide 1924 January 2008
Main differences between CDM and non-CDM project
CDM project will have to go through the followings:
- web-hosting of PDD at DOE’s website for stakeholders to comment;
- Letter of Approval from Host country DNA
- Letter of Approval from Annex 1 country (for bilateral projects, i.e. Malaysia)
- Modalities of communication (MOC)
- Registration with UNFCCC
A non CDM (i.e. VCS) project will not need to do All the aboveA non CDM (i.e. VCS) project will not need to do All the above

CDM Verification Process

Version Slide 2124 January 2008
Verification
Review and confirmation of project or operational performance as described in monitoring plans or reporting protocols.Confirmation by examination and provision of objective evidence that real, measurable and long-term emission reductions have been achieved, in accordance with pre-determined criteria.
Version Slide 2224 January 2008
Compliance with Audit Criteria
Kyoto Protocol criteria
Marrakech Accords modalities
Host country criteria
Project Specific criteria
Approved methodology
EB Decisions

Version Slide 2324 January 2008
Verification Actors
VerifierProjectProponent
Verification Contract Parties
Project Entity
CDM Executive Board/
JI Supervisory Committee
Solid lines indicate contractual relationships. Dashed lines indicate possible communication channels during validation.Note: Other relationships are possible.

Version Slide 2424 January 2008
The Risk Based Verification Approach
Monitoring Plan Monitoringrecords
GHG emissionreduction data
Understand control systems in place to manage risks
Identify areas of residual risk
Detailed audit testing of residualrisk areas and random testing of
other areas
Verification Statement
Forward Action Requests
Understanding the Project
Identify key reporting risks

Version Slide 2524 January 2008
Desk Review
The verification team should become familiar with the project
Latest revision of the PDD
CER spreadsheet
Monitoring plan
Monitoring report (to be web-hosted for CDM projects)
validation report
initial verification report,
previous periodic verification report (as applicable),
the written management manual, operating licenses of local authorities (as applicable).
Other documents, such as process flow diagrams, technical drawings, manuals of equipment suppliers, performance records
Version Slide 2624 January 2008
On-site Verification (I)
ensure that the project has been implemented as planned
verify that actual monitoring systems and procedures are in compliance with the monitoring systems and proceduresdescribed in the monitoring plan
approve adjustments and amendments to the monitoring planthat may have become necessary during the detailed design and construction of the project
verify that the local ability and capacity to monitor and report project progress over the project lifetime is in place
= Initial verification or (optional) Validation Plus service

Version Slide 2724 January 2008
On-site Verification (II)
establish that an audit trail of project performance records is present and sustains the claimed ERU/CER
verify that necessary quality assurance and quality controlactivities are established to evaluate the GHG emission reduction data and
express a conclusion with a high, but not absolute, level of assurance about whether the reported GHG emission reduction data is “free” of material misstatements

Version Slide 2824 January 2008
Audit trail – GHG emission reduction calculations
Check the line of consistency and accuracy
Check compliance with approved methodology
Our statement says something about the reliability of the ER number
Emission Reduction
Data source
Conversion factors
Calibration of meters
Aggregation of data
Correctformula
Review/ QA ofaggregation
Audit trail
Etc…

Version Slide 2924 January 2008
Key verification points
Check for inconsistencies
Check start date of project/crediting time/last monitoring period
Check for any anomaly
Cross-check numbers
Perform reasonableness checks (Load factors/generation capacity/days in operation/downtime….)

Version Slide 3024 January 2008
The Result….
Verification Statement“Based on the information that was presented to DNV and evaluated by DNV, it is our opinion that 498 710 tons of CO2-equivalents have been abated by the project during the years Sept. 2005 – August 2006“

Version Slide 3124 January 2008
Certification
Written assurance that a process or project conforms to specified requirements and/or have achieved certain results. Certification is documented by the issue of a certificate.Certificate describes the achievement of real, measurable, additional and long-term emission reductions from a CDM project, which results in Certified Emission Reductions (CERs) or VERs for Voluntary Carbon Standard.

Cambodia GERES Cook Stove project-experience
feedback

Version Slide 3324 January 2008
Cook stove project as a case study (VCS) – validation phaseDetermine compliance with VCS and other relevant criteria:
Assess the completeness and appropriateness of the submitted project design document (PDD)
Verify the project’s contribution to sustainable development in the host country
Assess the soundness of the project baseline
Assess the completeness and appropriateness of the project monitoring plan
Assess the planned operational management and technical/ engineering practices as well as quality assurance procedures to be applied by project operators
Assess the methodology and the assumptions made to estimate the emission reductions produced over the project’s selected crediting time
Assess whether social and environmental impacts of the project are sufficiently addressed

Version Slide 3424 January 2008
Cook stove project as a case study (VCS) – validation phase
Baseline
Methodology
Additionality
Assumptions (ex-ante and ex-post)
Monitoring challenges
Version Slide 3524 January 2008
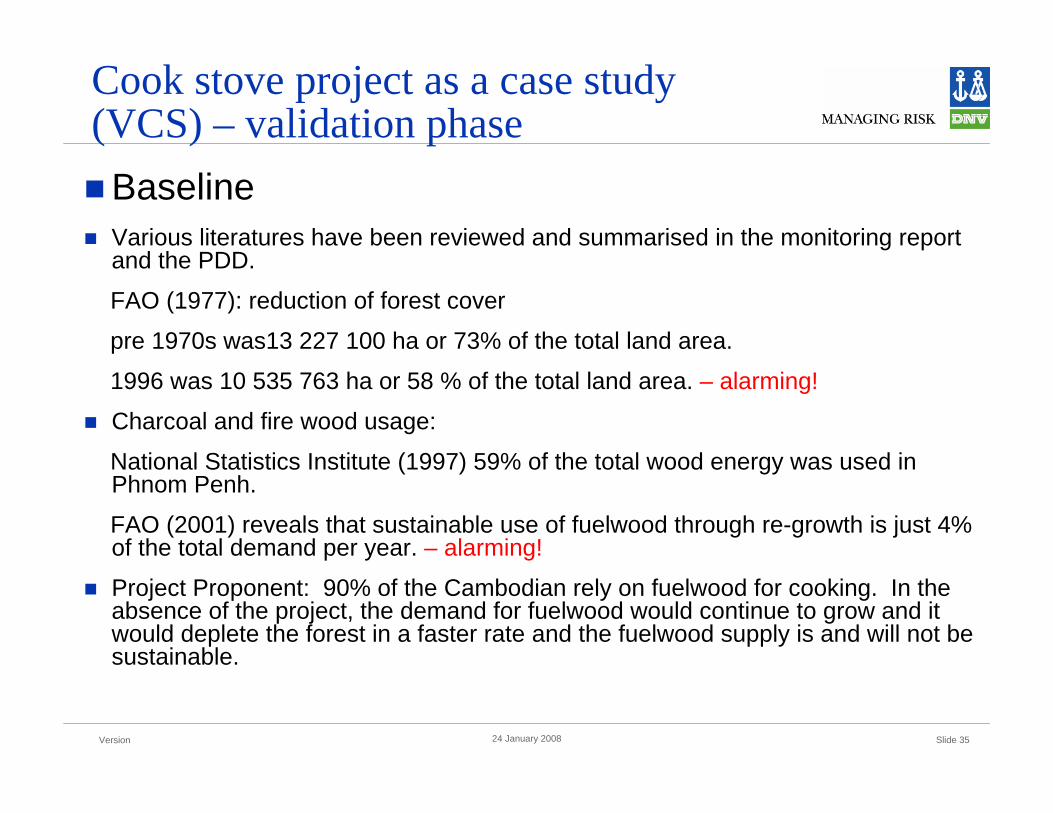
Cook stove project as a case study (VCS) – validation phaseBaselineVarious literatures have been reviewed and summarised in the monitoring report and the PDD.
FAO (1977): reduction of forest cover
pre 1970s was13 227 100 ha or 73% of the total land area.
1996 was 10 535 763 ha or 58 % of the total land area. – alarming!
Charcoal and fire wood usage:
National Statistics Institute (1997) 59% of the total wood energy was used in Phnom Penh.
FAO (2001) reveals that sustainable use of fuelwood through re-growth is just 4% of the total demand per year. – alarming!
Project Proponent: 90% of the Cambodian rely on fuelwood for cooking. In the absence of the project, the demand for fuelwood would continue to grow and it would deplete the forest in a faster rate and the fuelwood supply is and will not be sustainable.

Version Slide 3624 January 2008
Cook stove project as a case study (VCS) – validation phase
Methodology“Voluntary Emission Reductions - Improved Efficiency in Use of Non-Renewable Biomass” developed by the Climate Care Trust, derived from CDM methodology AMSII.G., and amended by the Joanneum Institute and approved by the community of practice (HEDON, Stove and Carbon Special).
Not an approved CDM methodology, but its application is justified to be the best available methodology at the time of PDD preparation.
The methodology has included a 15% of leakage reduction, which was deemed to be conservative, and in line with CDM methodologies that also apply the same 15% discount factor where the leakage is hard to assess.
Version Slide 3724 January 2008
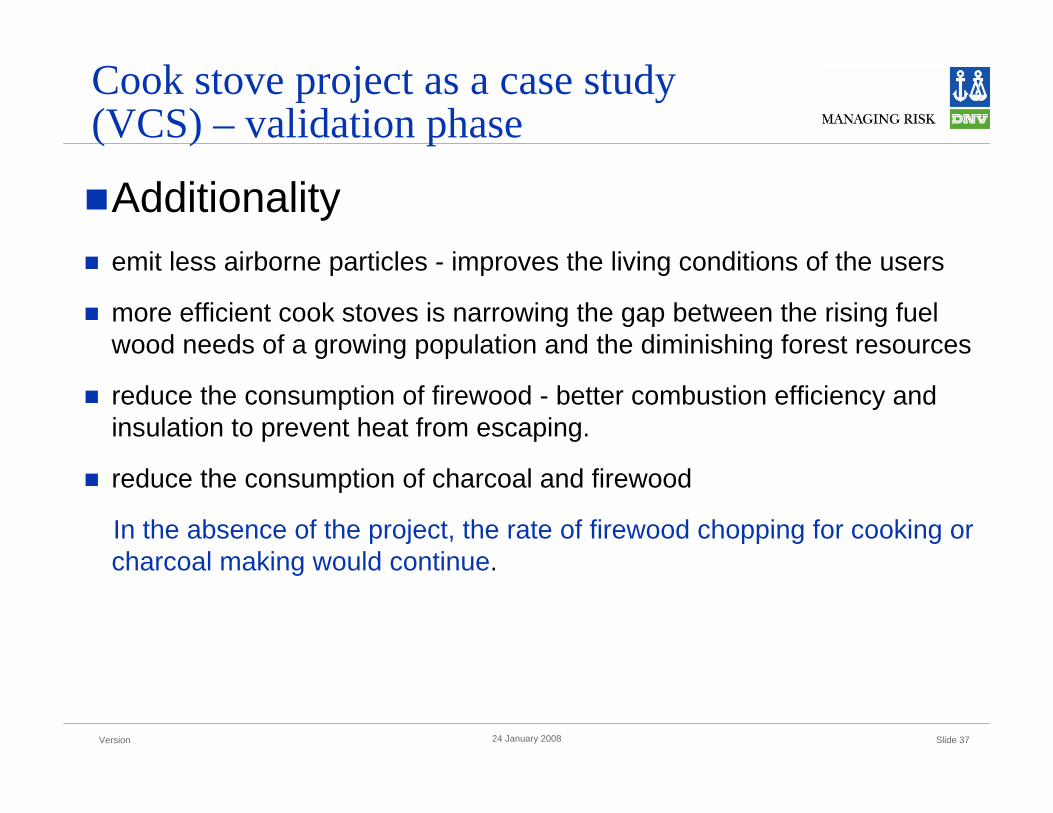
Cook stove project as a case study (VCS) – validation phase
Additionalityemit less airborne particles - improves the living conditions of the users
more efficient cook stoves is narrowing the gap between the rising fuel wood needs of a growing population and the diminishing forest resources
reduce the consumption of firewood - better combustion efficiency and insulation to prevent heat from escaping.
reduce the consumption of charcoal and firewood
In the absence of the project, the rate of firewood chopping for cooking or charcoal making would continue.

Version Slide 3824 January 2008
Cook stove project as a case study (VCS) – validation phase
Assumptions (Ex-ante parameters) Equipment ratio per family
The assumption of equipment ratio per family in version 5 of PDD was 1.27. However, the figure has been adjusted to 1.28 based on the recent survey. This is still conservative as the field visit has confirmed that most families have at least two NLS stoves. - OK
Fuel saving test -NLS (laboratory and actual testing);
Values reported in the PDD were the dry season stove efficiency (higher value), 21.76% and 21.49% for charcoal and wood saving when switched to NLS respectively in version of 5 of the PDD. ---risk
The average efficiency value of charcoal and firewood is 21.2% and 20.89%, respectively (average of both dry and wet seasons) OK

Version Slide 3924 January 2008
Cook stove project as a case study (VCS) – validation phase
Assumptions (Ex-ante parameters) Wood to charcoal conversion
6.45 kg vs IPCC default value of 6 kg wood /kg charcoal; ---risk
Stove lifespan
It was concluded that the life span of NLS for heavy users is about 4195.87 hours. The average use of NLS by domestic users is 3.5 hours. This would give an estimation of 3.28 years of lifespan. The project has assumed 3.0 years of lifespan. OK
NCV of biomass and EFCO2, biomass
The earlier calculation has utilised default values of IPCC 1996, i.e. NCV biomass and EFCO2, biomass. A FAR was raised to request that the latest IPCC 2006 values to be used. ---risk

Version Slide 4024 January 2008
Cook stove project as a case study (VCS) – validation phase
Monitoring challenges (Ex-post parameters)
1. Sales of New Lao Stoves to distributors,
2. Stoves produced by respective producers.This amount is reported on a routine basis when the complete NLS is produced. The total quantity of each stove type (7 types) produced is summed-up on a monthly basis. This data is collected by the monitoringstaff and in turn keyed into the spreadsheet for calculation. – Risk
accuracy of data collected from the manufacturers;
manual transfer of data;
stoves sold are not in use (transit in the distributors premises)

Version Slide 4124 January 2008
Cook stove project as a case study (VCS) – verification phase
Confirm that the principles of GHG management are being implemented:• Accuracy• Transparency• Completeness• Comparability• Consistency
15% deduction from the calculated VERs was a safety net !!

Version Slide 4224 January 2008
Audit trail – GHG emission reduction calculations
Check the line of consistency and accuracy
Check compliance with approved methodology
Our statement says something about the reliability of the ER number
Emission Reduction
Data source
Conversion factors
Calibration of meters
Aggregation of data
Correctformula
Review/ QA ofaggregation
Audit trail
Etc…
Main causes of delay

Version Slide 4424 January 2008
Most imporant causes of delay
Lack of assurance in default values used
Lack of clarity in usage of IPCC default values and local / project specific values
Lack of transparency and conservativeness in CERs calculations

Mistakes to avoid andLessons to be learnt

Version Slide 4624 January 2008
Mistakes to avoid
Ensure that project uses published default values (IPCC values)
If possible, use approved methodologies (i.e. CDM)
References should be made in PDD and monitoring report to substantiate statement or argumentation
Ensure internal check is done effectively to prevent losing VERs

Version Slide 4724 January 2008
Lessons to be learnt
Ensure that the project baseline, additionality is sound
Most project chose to use higher values to have higher CERs – conservativeness id the key
Respond promptly to outstanding issues (FARs)
Internal checking to prevent data transfer or calculation errors
Communicate frequently with your DOE

Version Slide 4824 January 2008
THANK YOU !