Embed Size (px)
Citation preview
44Chapt
er
Chapt
er The Management of
Working CapitalThe Management of
Working Capital
Slides Developed by:
Terry FegartySeneca College
© 2006 by Nelson, a division of Thomson Canada Limited 2
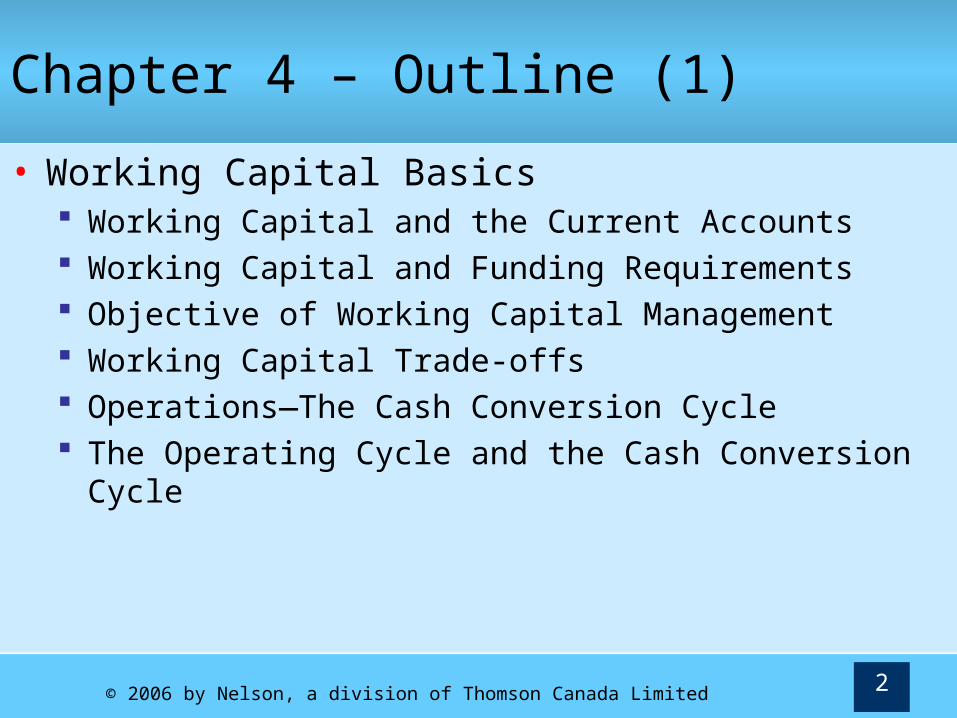
Chapter 4 – Outline (1)
• Working Capital Basics Working Capital and the Current Accounts Working Capital and Funding Requirements Objective of Working Capital Management Working Capital Trade-offs Operations—The Cash Conversion Cycle The Operating Cycle and the Cash Conversion Cycle
© 2006 by Nelson, a division of Thomson Canada Limited 3
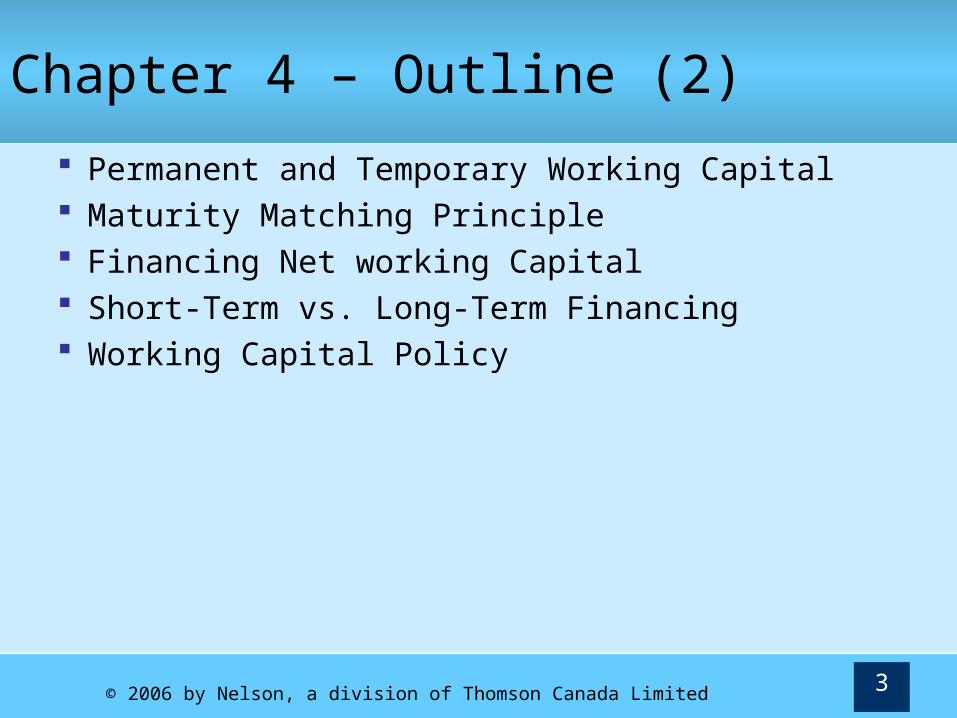
Chapter 4 – Outline (2)
Permanent and Temporary Working Capital Maturity Matching Principle Financing Net working Capital Short-Term vs. Long-Term Financing Working Capital Policy
© 2006 by Nelson, a division of Thomson Canada Limited 4
Chapter 4 – Outline (3)
• Cash Management Objectives of Cash Management Marketable Securities Yield on a Discounted Money Market Security Components of Float Cheque Disbursement and the Cheque Clearing
process Accelerating Cash Receipts Electronic Funds Transfer Managing Cash Outflow Evaluating Cash Management Services
© 2006 by Nelson, a division of Thomson Canada Limited 5
Chapter 4 – Outline (4)
• Managing Accounts Receivable Tradeoffs in Managing Accounts Receivable Credit Policy Terms of Sale Collections policy
© 2006 by Nelson, a division of Thomson Canada Limited 6
Chapter 4 – Outline (5)
• Inventory Management Benefits and Costs of Carrying Adequate Inventory Inventory Ordering Costs Inventory Control and Management Economic Order Quantity Model Safety Stocks, Reorder Points and Lead Times Inventory on Hand Including Safety Stock Tracking Inventories—The ABC System Just In Time (JIT) Inventory System

© 2006 by Nelson, a division of Thomson Canada Limited 7
Working Capital Basics
• Working Capital Assets/liabilities required to operate business
on day-to-day basis• Cash• Accounts Receivable• Inventory• Accounts Payable• Accruals
Short-term in nature—turn over regularly
© 2006 by Nelson, a division of Thomson Canada Limited 8
Working Capital and the Current Accounts
• Gross working capital = Current assets Gross Working Capital (GWC) represents
investment in current assets
• (Net) working capital = Current assets – Current liabilities
© 2006 by Nelson, a division of Thomson Canada Limited 9
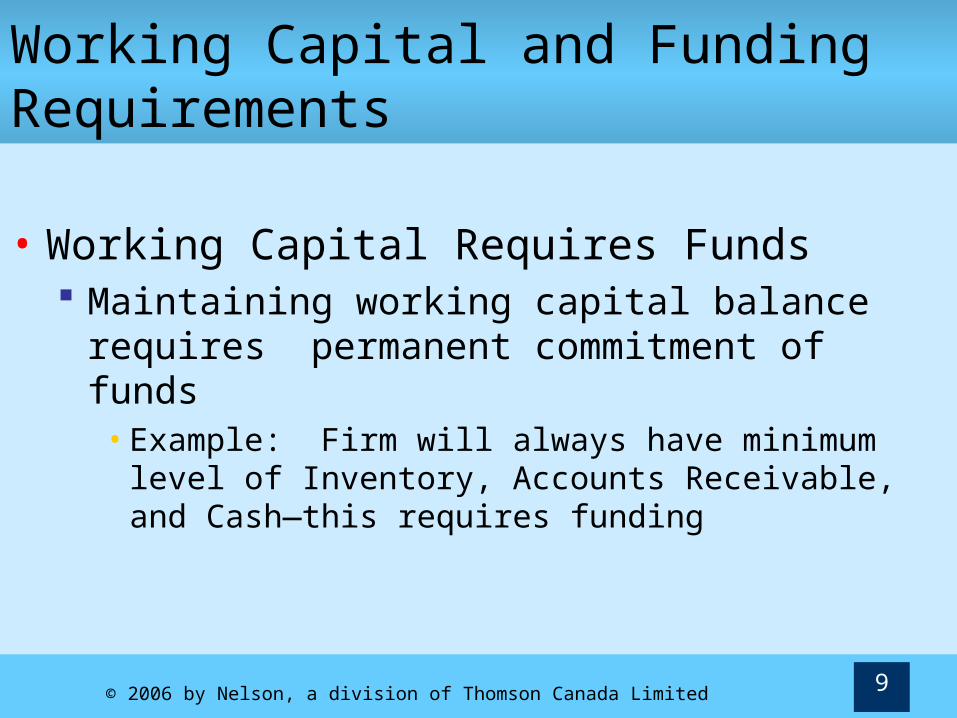
Working Capital and Funding Requirements
• Working Capital Requires Funds Maintaining working capital balance requires
permanent commitment of funds• Example: Firm will always have minimum level of
Inventory, Accounts Receivable, and Cash—this requires funding
© 2006 by Nelson, a division of Thomson Canada Limited 10
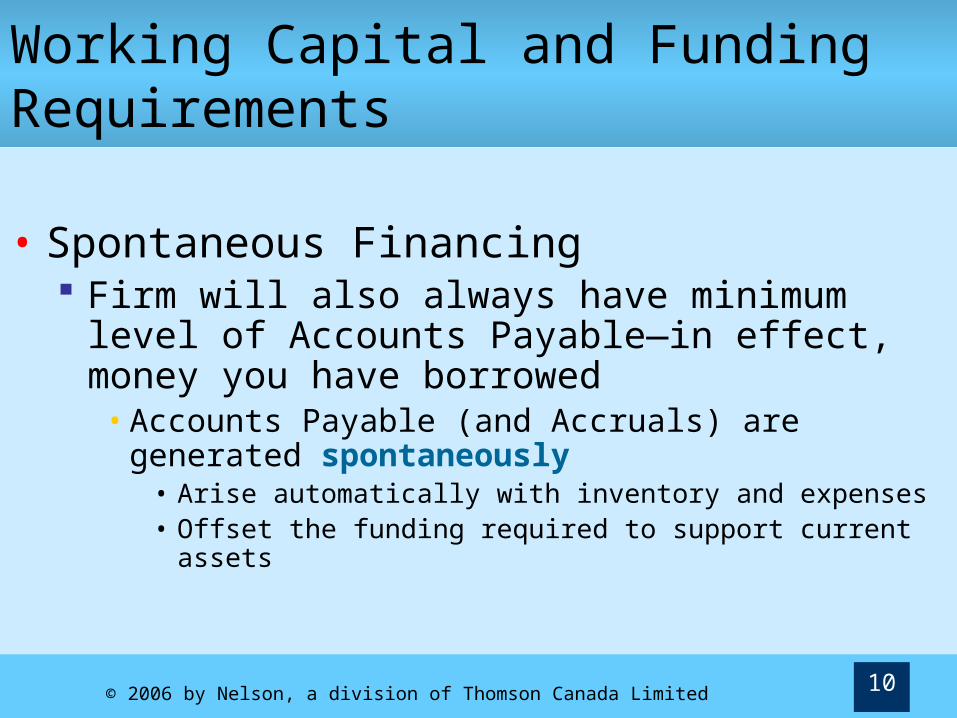
Working Capital and Funding Requirements
• Spontaneous Financing Firm will also always have minimum level of
Accounts Payable—in effect, money you have borrowed• Accounts Payable (and Accruals) are generated
spontaneously• Arise automatically with inventory and expenses • Offset the funding required to support current assets

© 2006 by Nelson, a division of Thomson Canada Limited 11
Working Capital and Funding Requirements
• Net working capital is Gross Working Capital – Current Liabilities (including spontaneous financing)
Reflects net amount of funds needed to support routine operations
© 2006 by Nelson, a division of Thomson Canada Limited 12
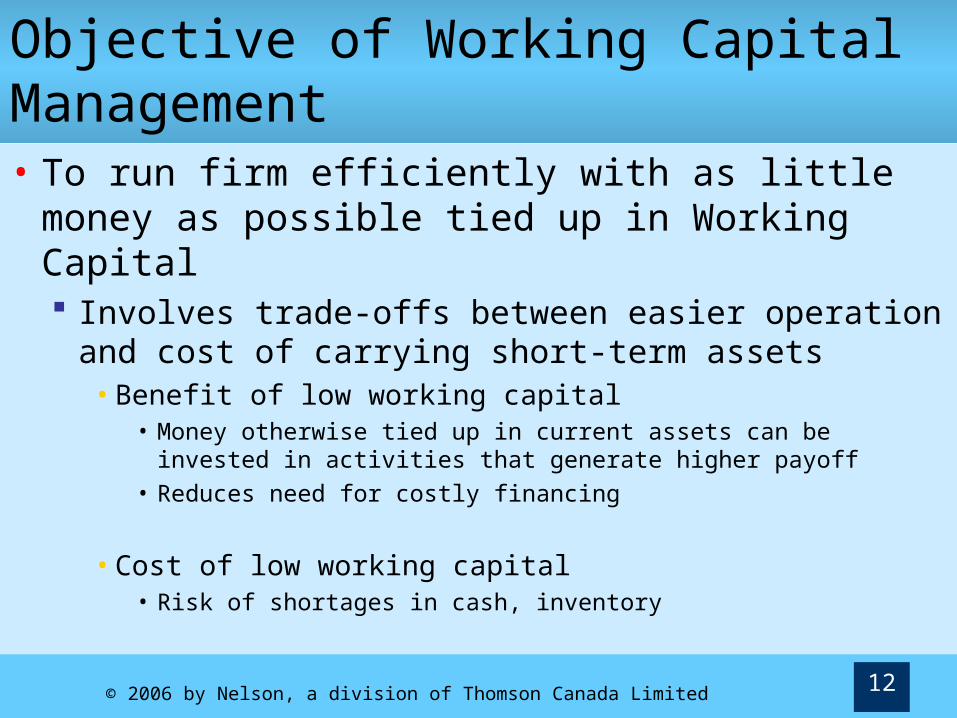
Objective of Working Capital Management• To run firm efficiently with as little money
as possible tied up in Working Capital Involves trade-offs between easier operation
and cost of carrying short-term assets• Benefit of low working capital
• Money otherwise tied up in current assets can be invested in activities that generate higher payoff
• Reduces need for costly financing
• Cost of low working capital• Risk of shortages in cash, inventory

© 2006 by Nelson, a division of Thomson Canada Limited 13
Working Capital Trade-offs
InventoryHigh Levels Low Levels
Benefit: • Happy customers• Few production delays (always have needed
parts on hand)Cost: • Expensive• High storage costs• Risk of obsolescence
Cost: • Shortages• Dissatisfied customersBenefit: • Low storage costs• Less risk of obsolescence
CashHigh Levels Low Levels
Benefit:• Reduces riskCost:• Increases financing costs
Benefit:• Reduces financing costsCost:• Increases risk
© 2006 by Nelson, a division of Thomson Canada Limited 14
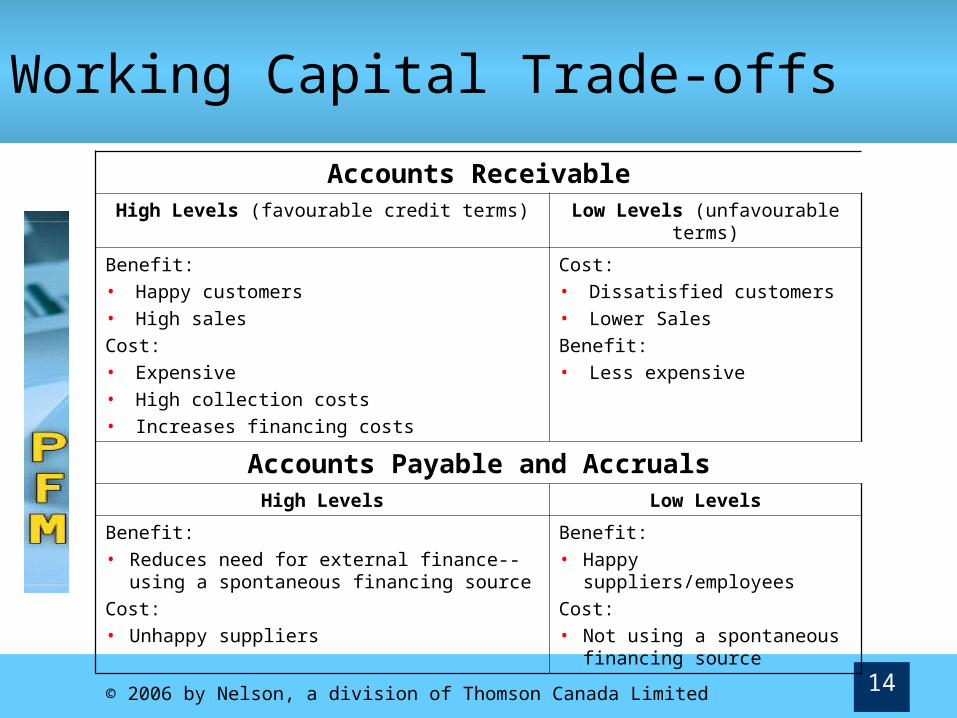
Working Capital Trade-offs
Accounts ReceivableHigh Levels (favourable credit terms) Low Levels (unfavourable
terms)
Benefit: • Happy customers• High salesCost: • Expensive• High collection costs• Increases financing costs
Cost: • Dissatisfied customers• Lower SalesBenefit: • Less expensive
Accounts Payable and AccrualsHigh Levels Low Levels
Benefit:• Reduces need for external finance--using a
spontaneous financing sourceCost:• Unhappy suppliers
Benefit:• Happy suppliers/employeesCost:• Not using a spontaneous
financing source
© 2006 by Nelson, a division of Thomson Canada Limited 15
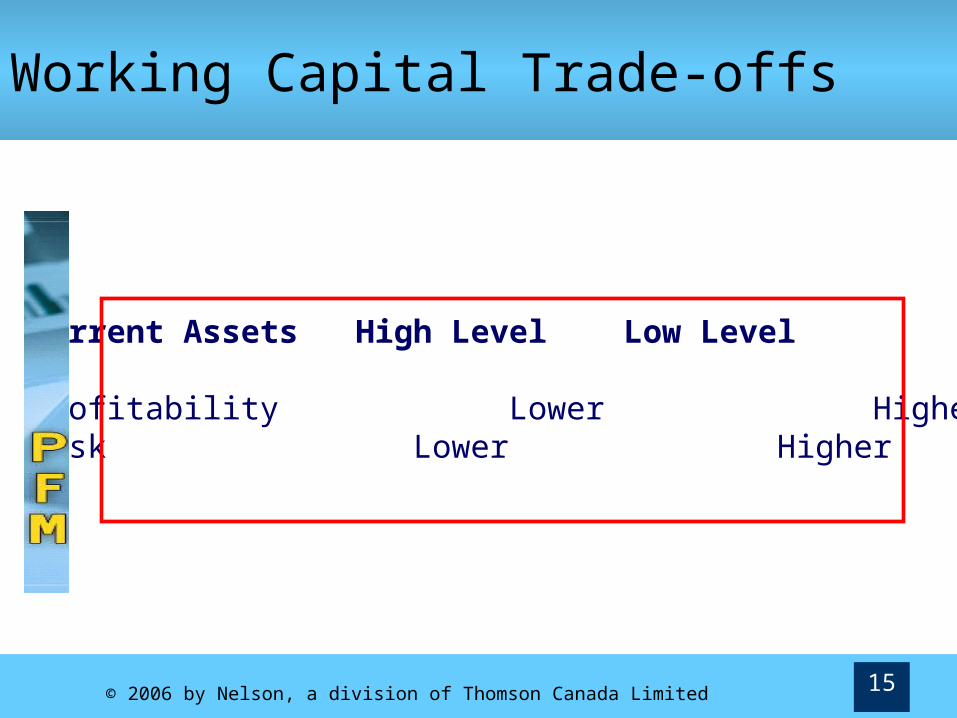
Current Assets High Level Low Level
Profitability Lower HigherRisk Lower Higher
Working Capital Trade-offs

© 2006 by Nelson, a division of Thomson Canada Limited 16
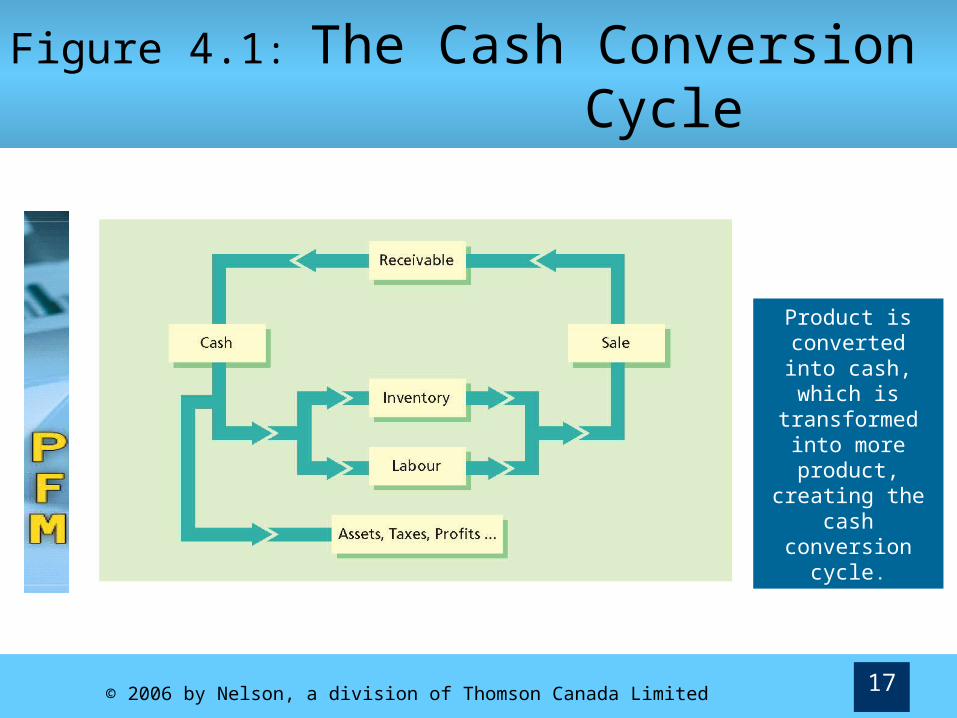
Operations—The Cash Conversion Cycle
• Firm begins with cash which then “becomes” inventory and labour Which then becomes product for sale Eventually this will turn into cash again
• Firm’s operating cycle is time from acquisition of inventory until cash is collected from product sales
© 2006 by Nelson, a division of Thomson Canada Limited 17
Figure 4.1: The Cash Conversion Cycle
Product is converted into cash, which is
transformed into more product,
creating the cash conversion cycle.

© 2006 by Nelson, a division of Thomson Canada Limited 18
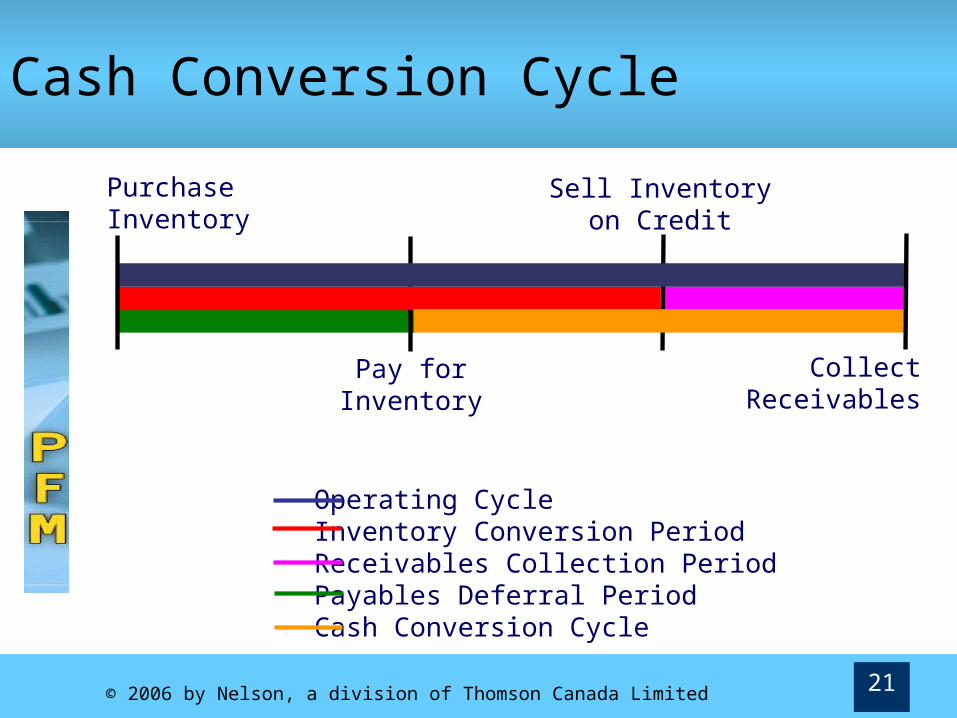
Figure 4.2: Time Line Representation of the Cash Conversion
Cycle
© 2006 by Nelson, a division of Thomson Canada Limited 19
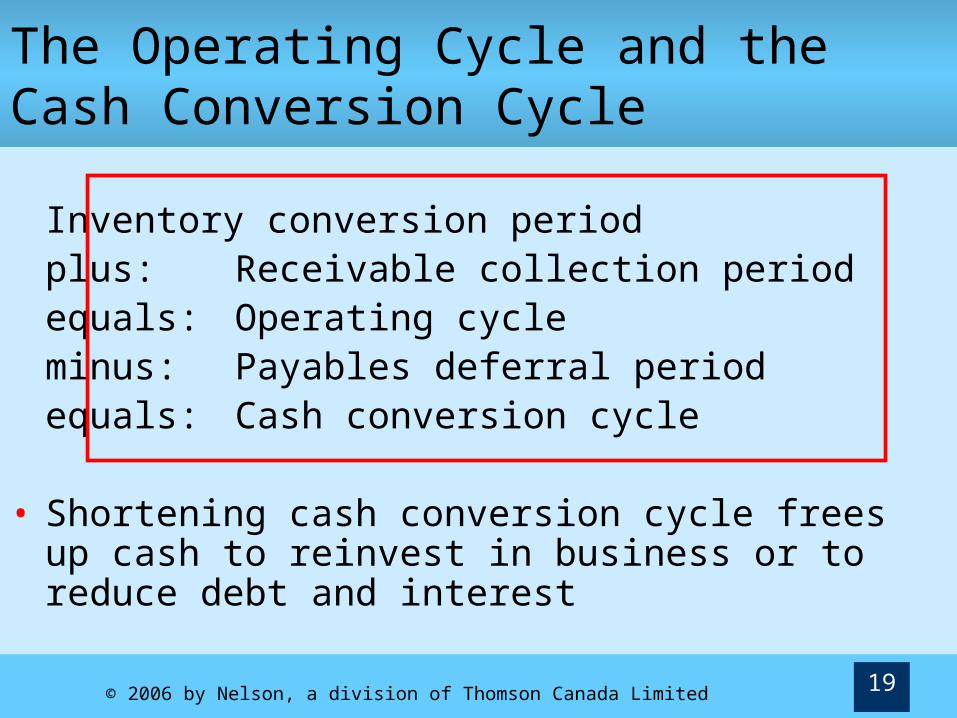
The Operating Cycle and the Cash Conversion Cycle
Inventory conversion periodplus: Receivable collection periodequals: Operating cycleminus: Payables deferral periodequals: Cash conversion cycle
• Shortening cash conversion cycle frees up cash to reinvest in business or to reduce debt and interest
© 2006 by Nelson, a division of Thomson Canada Limited 20
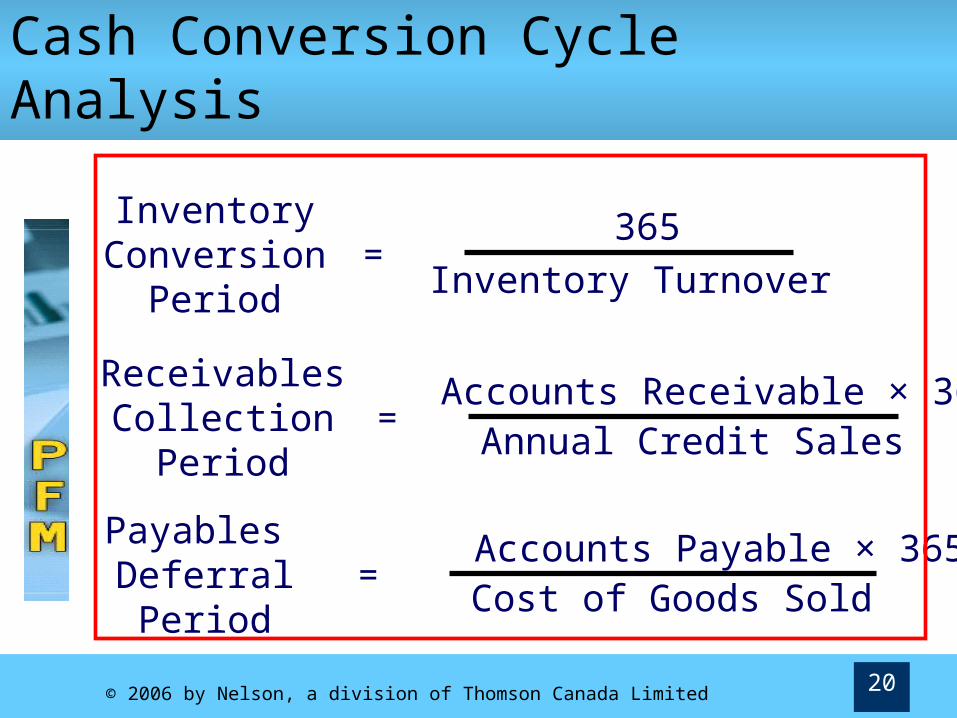
InventoryConversion
Period= 365
Inventory Turnover
ReceivablesCollection
Period=
Accounts Receivable × 365 Annual Credit Sales
Cash Conversion Cycle Analysis
Payables DeferralPeriod
= Accounts Payable × 365
Cost of Goods Sold
© 2006 by Nelson, a division of Thomson Canada Limited 21
Cash Conversion Cycle
PurchaseInventory
Pay forInventory
Sell Inventoryon Credit
CollectReceivables
Operating CycleInventory Conversion PeriodReceivables Collection PeriodPayables Deferral PeriodCash Conversion Cycle
© 2006 by Nelson, a division of Thomson Canada Limited 22
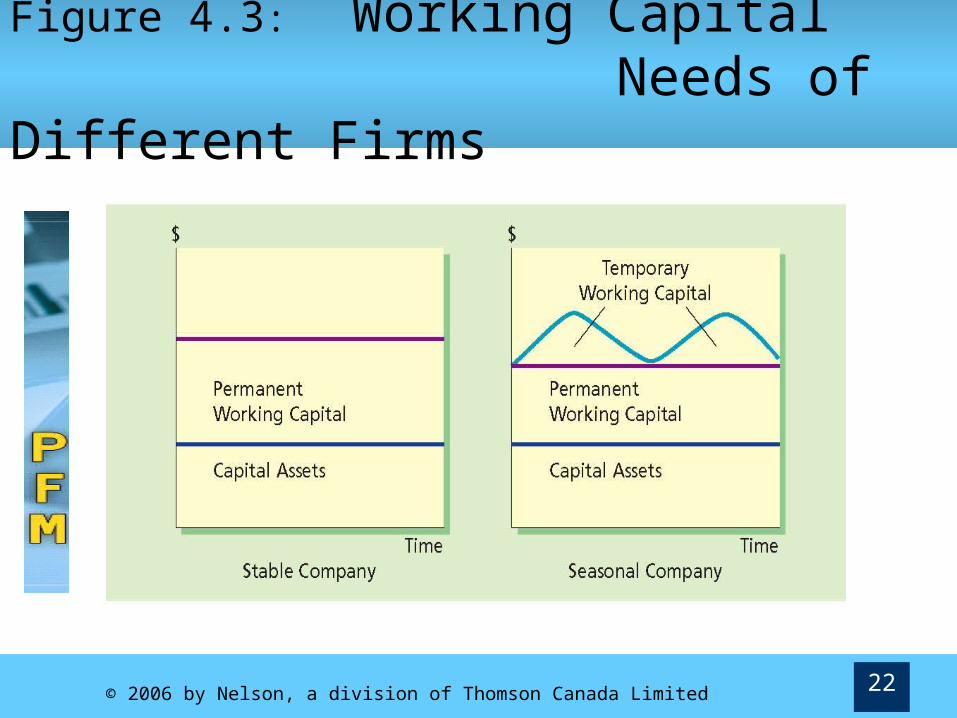
Figure 4.3: Working Capital Needs of Different Firms
© 2006 by Nelson, a division of Thomson Canada Limited 23
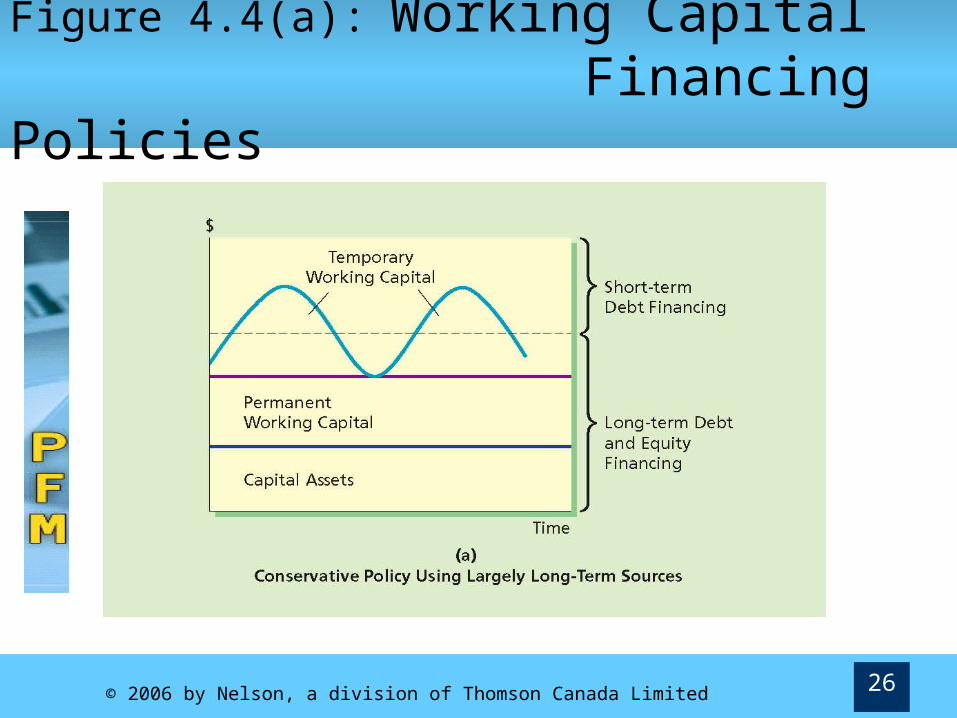
Permanent and Temporary Working Capital
• Working capital is permanent to the extent that it supports constant or minimum level of sales
• Temporary working capital supports seasonal peaks in business

© 2006 by Nelson, a division of Thomson Canada Limited 24
Maturity Matching Principle
• Maturity (due date) of financing should roughly match duration (life) of asset being financed Then financing /asset combination becomes
self-liquidating• Cash inflows from asset can be used to pay off
loan
© 2006 by Nelson, a division of Thomson Canada Limited 25
Financing Net Working Capital
• According to maturity matching principle Temporary (seasonal) should be financed
with short-term borrowing Permanent working capital should be
financed with long-term sources, such as long-term debt and/or equity
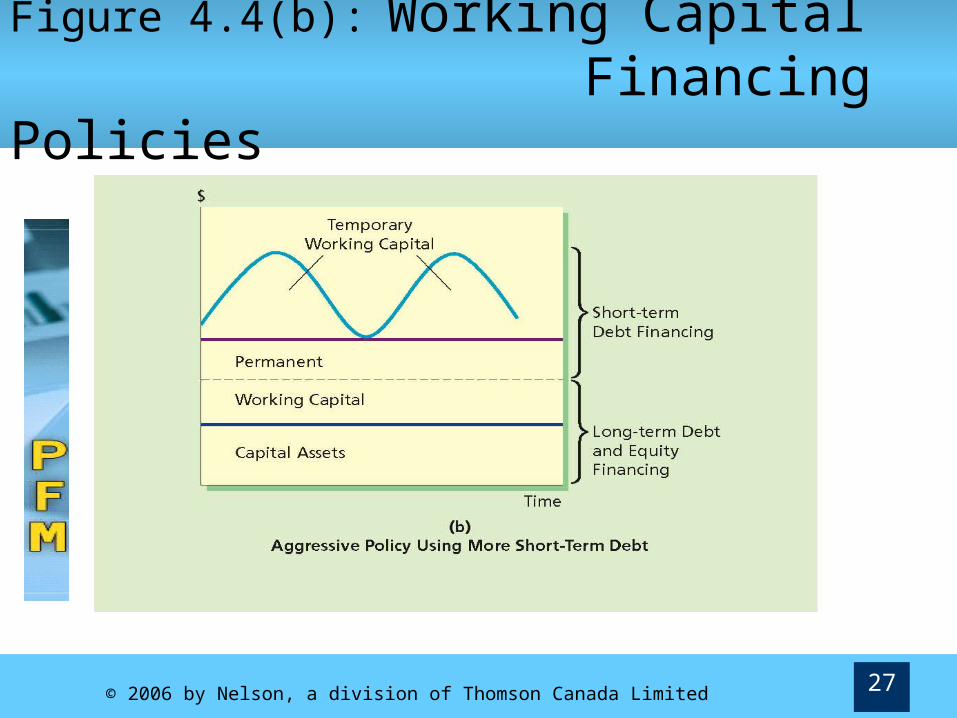
• In practice, firms may use more or less short-term funds to finance working capital
© 2006 by Nelson, a division of Thomson Canada Limited 26
Figure 4.4(a): Working Capital Financing Policies
© 2006 by Nelson, a division of Thomson Canada Limited 27
Figure 4.4(b): Working Capital Financing Policies
© 2006 by Nelson, a division of Thomson Canada Limited 28
Short-Term vs. Long-Term Financing
• The mix of short- or long-term working capital financing is a matter of policy
Use of long-term funds is a conservative policy
Use of short-term funds is an aggressive policy
© 2006 by Nelson, a division of Thomson Canada Limited 29
Short-Term vs. Long-Term Financing
• Short-term financing Cheap but risky
•Cheap—short-term rates generally lower than long-term rates
•Risky—because you are continually entering marketplace to borrow
• Borrower will face changing conditions (ex; higher interest rates and tight money)

© 2006 by Nelson, a division of Thomson Canada Limited 30
Short-Term vs. Long-Term Financing
• Long-term financing Safe but expensive
•Safe—you can secure the required capital
•Expensive—long-term rates generally higher than short-term rates

© 2006 by Nelson, a division of Thomson Canada Limited 31
Working Capital Policy
• Firm must set policy on following issues: How much working capital is used Extent to which working capital is supported
by short- vs. long-term financing How each component of working capital is
managed The nature/source of any short-term financing
used

© 2006 by Nelson, a division of Thomson Canada Limited 32
Cash Management
• Cash management—determining: Optimal size of firm’s liquid asset balance Appropriate types and amounts of
short-term investments Most efficient methods of controlling
collection and disbursement of cash
© 2006 by Nelson, a division of Thomson Canada Limited 33
Cash Management
• Why have cash on hand? Transactions demand: need money to pay bills
(employees, suppliers, utility/phone, etc.)
Precautionary demand: to handle emergencies (unforeseen expenses)
Speculative demand: to take advantage of unexpected opportunities (purchase of raw materials that are on sale)
© 2006 by Nelson, a division of Thomson Canada Limited 34
Objectives of Cash Management
• Cash doesn’t earn a return• Want to maintain liquidity
Take cash discounts Maintain firm’s credit rating Minimize interest costs Avoid insolvency
• Good cash management implies maintaining adequate liquidity with minimum cash in bank Can place portion of cash balance into marketable
securities (AKA: near cash or cash equivalents)
© 2006 by Nelson, a division of Thomson Canada Limited 35
Marketable Securities
• Liquid investments that can be held instead of cash and earn a modest return
Examples include Treasury bills, commercial paper, bankers’ acceptances
Many are bought and sold at a discount in money market
© 2006 by Nelson, a division of Thomson Canada Limited 36
Examples of Marketable Securities
• Treasury Bills Short-term government notes issued at a
discount with principal repaid at maturity
• Commercial Paper Short-term unsecured promissory notes
issued by corporations with good credit
• Bankers’ Acceptances Short-term promissory notes issued by a firm
and accepted (or guaranteed) by a bank
© 2006 by Nelson, a division of Thomson Canada Limited 37
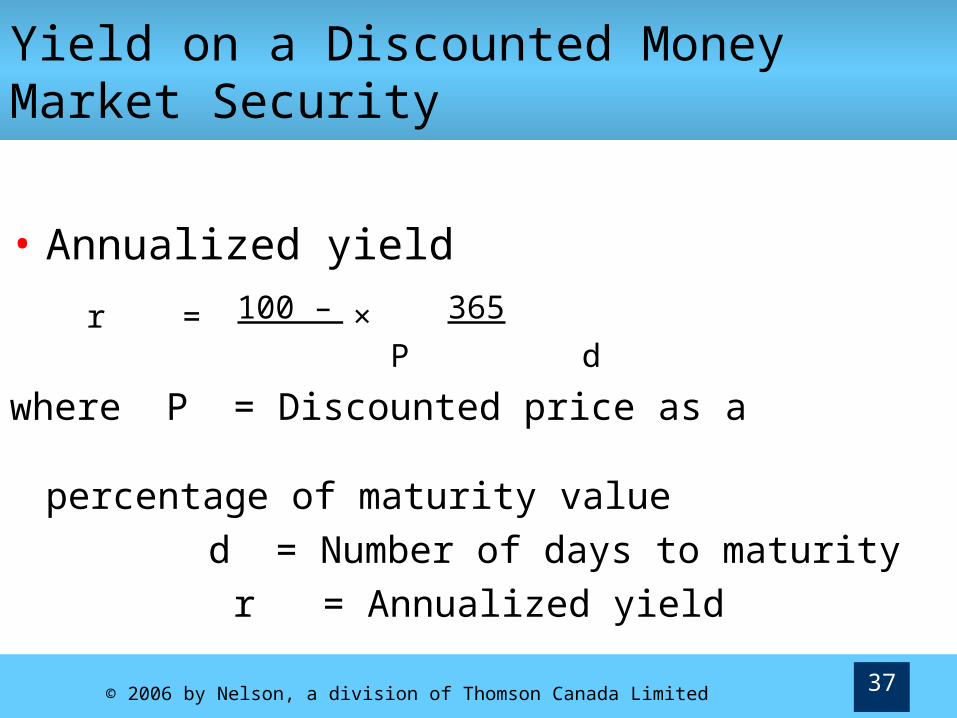
Yield on a Discounted Money Market Security
• Annualized yield 100 – P 365
P d
where P = Discounted price as a percentage of maturity value
d = Number of days to maturity r = Annualized yield
×r =
© 2006 by Nelson, a division of Thomson Canada Limited 38
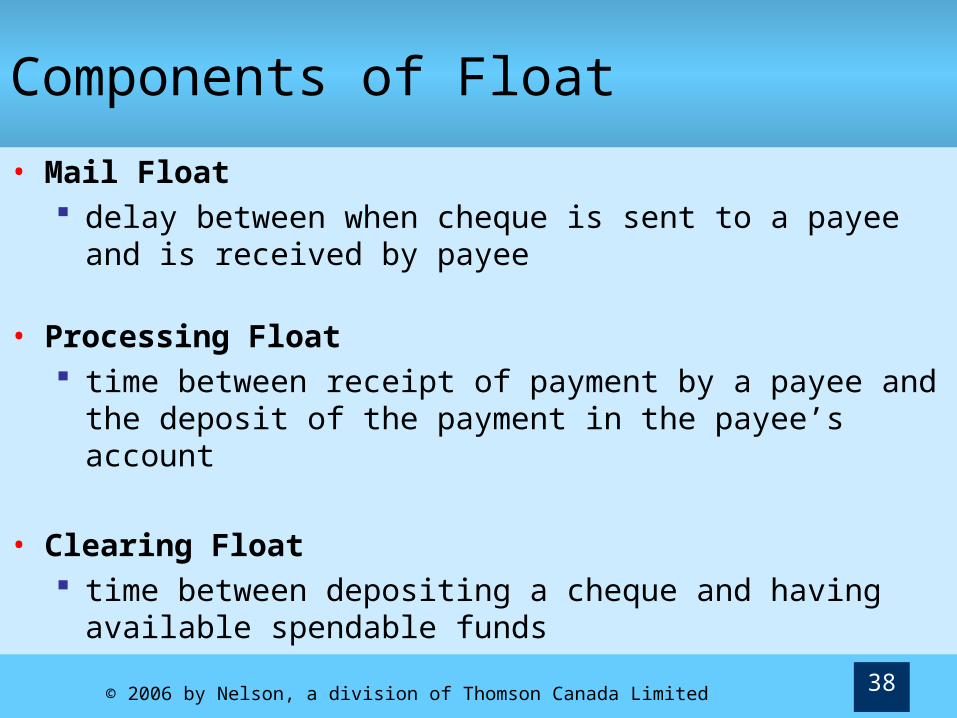
Components of Float
• Mail Float delay between when cheque is sent to a payee and
is received by payee
• Processing Float time between receipt of payment by a payee and the
deposit of the payment in the payee’s account
• Clearing Float time between depositing a cheque and having
available spendable funds

© 2006 by Nelson, a division of Thomson Canada Limited 39
Cheque Disbursement and the Cheque Clearing Process• When you pay a bill,
You write cheque and mail to payee (2-3 days of mail float)
Payee receives cheque and performs internal processing (1 day of processing float)
Payee deposits cheque in its own bank (1 day of processing float)
Payee’s bank sends cheque into interbank clearing system which processes cheque (2 days of clearing float)

© 2006 by Nelson, a division of Thomson Canada Limited 40
Figure 4.5: The Cheque-Clearing Process
© 2006 by Nelson, a division of Thomson Canada Limited 41
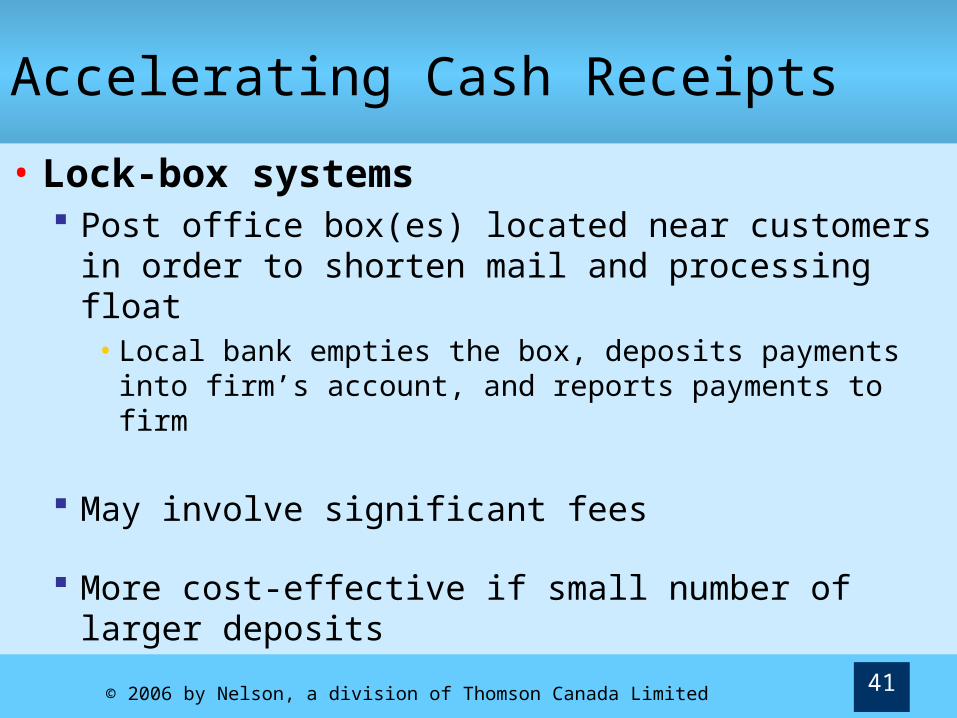
Accelerating Cash Receipts
• Lock-box systems Post office box(es) located near customers in
order to shorten mail and processing float• Local bank empties the box, deposits payments
into firm’s account, and reports payments to firm
May involve significant fees
More cost-effective if small number of larger deposits
© 2006 by Nelson, a division of Thomson Canada Limited 42
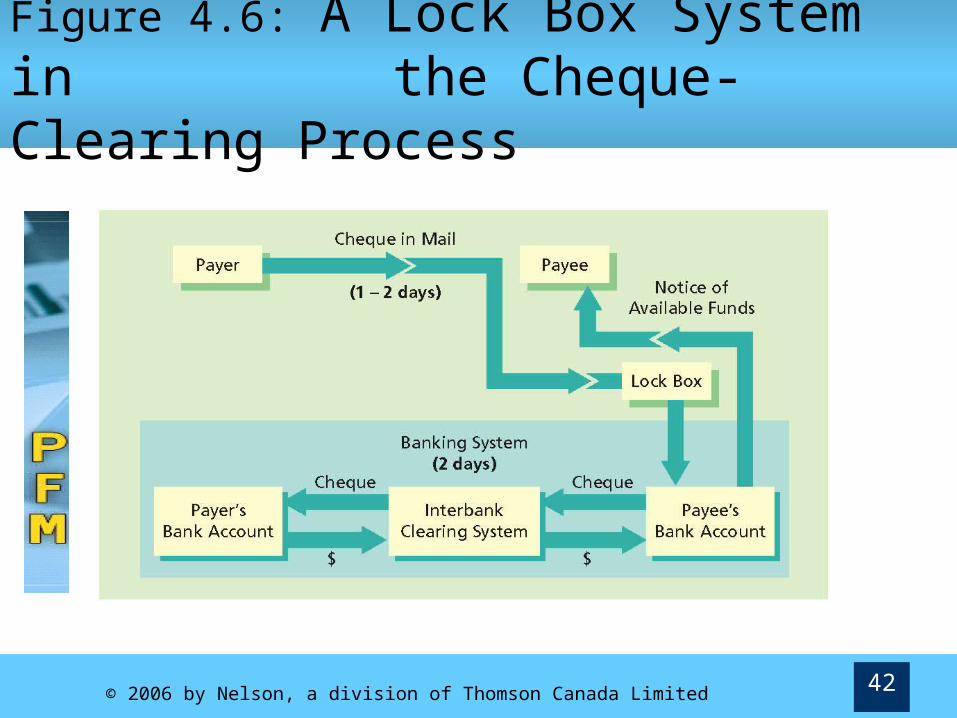
Figure 4.6: A Lock Box System in the Cheque-Clearing Process

© 2006 by Nelson, a division of Thomson Canada Limited 43
Accelerating Cash Receipts
• Concentration Banking Customers send cheques sent to firm’s local
collection centres, where they are deposited
Local deposits are transferred electronically into one central concentration account
Reduces mail float
Funds available for paying loans or investing in marketable securities

© 2006 by Nelson, a division of Thomson Canada Limited 44
Electronic Funds Transfer
• Electronic funds transfer mechanisms are reducing the importance of float management techniques for many companies
© 2006 by Nelson, a division of Thomson Canada Limited 45
Electronic Funds Transfer
• Wire Transfers Transferring money electronically
• Preauthorized Cheques Customer gives payee signed cheque-like
documents in advance When payee ships product, it deposits
preauthorized cheque in its bank account• Eliminates mail float • Payee must trust payer
© 2006 by Nelson, a division of Thomson Canada Limited 46
Managing Cash Outflow
• Zero balance accounts (ZBAs) Decentralization of cash payments can lead to large
number of cash balances around the country
Divisions write cheques on ZBAs—funded from central account only when cheques are cleared
Solves problem of idle cash in decentralized bank accounts
• Remote disbursing Using bank in remote location for disbursement
chequing account• Increases mail float
© 2006 by Nelson, a division of Thomson Canada Limited 47
Evaluating Cash Management Services
• Evaluation involves comparison of costs versus benefits of faster collection
© 2006 by Nelson, a division of Thomson Canada Limited 48
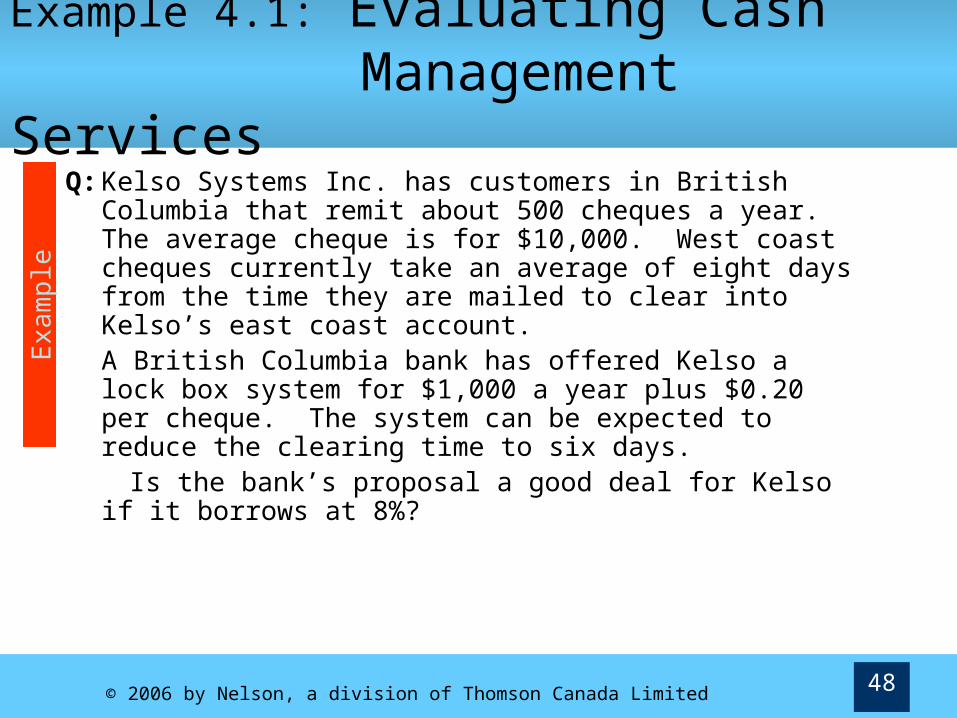
Example 4.1: Evaluating Cash Management Services
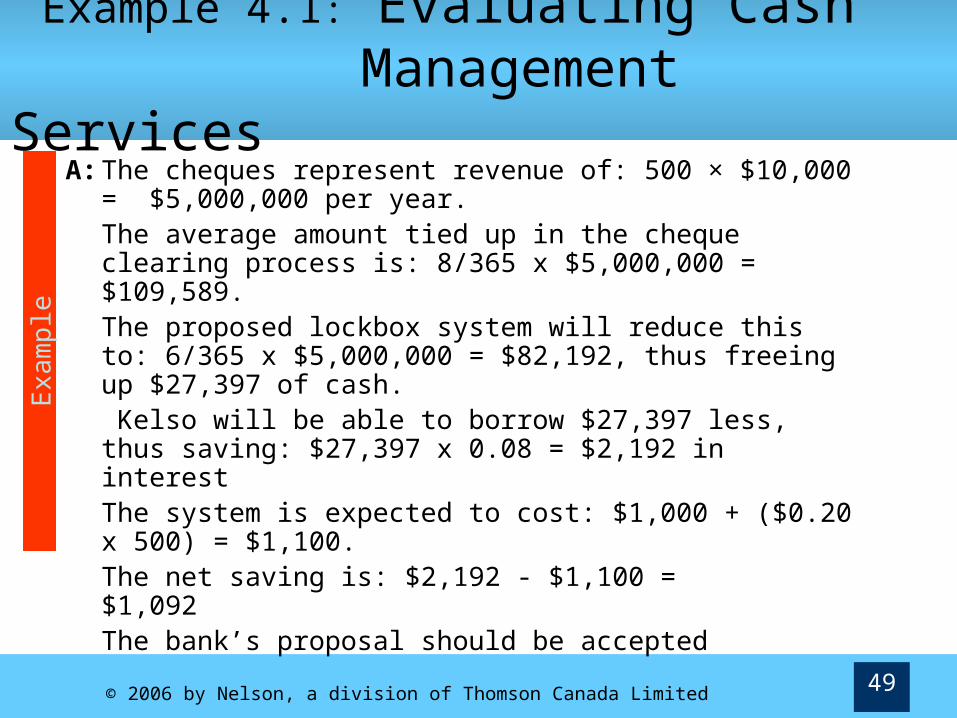
Q: Kelso Systems Inc. has customers in British Columbia that remit about 500 cheques a year. The average cheque is for $10,000. West coast cheques currently take an average of eight days from the time they are mailed to clear into Kelso’s east coast account. A British Columbia bank has offered Kelso a lock box system for $1,000 a year plus $0.20 per cheque. The system can be expected to reduce the clearing time to six days.
Is the bank’s proposal a good deal for Kelso if it borrows at 8%?
Exa
mpl
e
© 2006 by Nelson, a division of Thomson Canada Limited 49
Example 4.1: Evaluating Cash Management Services
A: The cheques represent revenue of: 500 × $10,000 = $5,000,000 per year. The average amount tied up in the cheque clearing process is: 8/365 x $5,000,000 = $109,589.
The proposed lockbox system will reduce this to: 6/365 x $5,000,000 = $82,192, thus freeing up $27,397 of cash. Kelso will be able to borrow $27,397 less, thus saving: $27,397 x 0.08 = $2,192 in interestThe system is expected to cost: $1,000 + ($0.20 x 500) = $1,100.The net saving is: $2,192 - $1,100 = $1,092 The bank’s proposal should be accepted
Exa
mpl
e
© 2006 by Nelson, a division of Thomson Canada Limited 50
Managing Accounts Receivable
• Generally firms like as little money as possible tied up in receivables Reduces costs (firm has to borrow to support the
receivable level) Minimizes bad debt exposure
• But, having good relationships with customers is important Increases sales
• Firm needs to strike a balance on these issues

© 2006 by Nelson, a division of Thomson Canada Limited 51
Trade-offs in Receivable Management
Liberal Management More sales and gross margin, but
More bad debtsHigher collection costsMore discount expensesHigher receivablesLonger collectionsMore interest expense
Strict ManagementLess sales and gross margin, but
Less bad debtsLower collection costsLess discount expensesLower receivablesShorter collectionsLess interest expense
Trade-offs in Managing Accounts Receivable

© 2006 by Nelson, a division of Thomson Canada Limited 52
Managing Accounts Receivable
• Policy Decisions Influencing Accounts Receivable Credit Policy
• Criteria used to screen credit applications• Controls quality of accounts to which credit is extended
Terms of Sale• Terms and conditions under which credit extended must be
repaid
Collections Policy• Methods employed to collect payment on past due accounts
© 2006 by Nelson, a division of Thomson Canada Limited 53
Credit Policy
• Must examine creditworthiness of potential credit customers Credit report Customer’s financial statements Bank references Customer’s reputation among other vendors
• Conflicts often arise between sales and credit departments Sales department’s job to generate sales Credit department may refuse credit to high risk
accounts

© 2006 by Nelson, a division of Thomson Canada Limited 54
Terms of Sale
• Credit sales are made according to specified terms of sale Example: 2/10, net 30 means customer
receives 2% discount if payment is made within 10 days, otherwise entire amount is due by 30 days
Customers pay quickly to save money Firm’s terms of sale generally follow industry
practice

© 2006 by Nelson, a division of Thomson Canada Limited 55
Collections Policy
• Firm’s collection policy—manner and aggressiveness with which firm pursues payment from delinquent customers Being overly aggressive can damage customer relations
• Function of collections department— to follow up on overdue receivables (called dunning) Mail polite letter Follow up with additional dunning letters Phone calls Collection agency Lawsuit
© 2006 by Nelson, a division of Thomson Canada Limited 56
Inventory Management
• Inventory management— establishes a balance between carrying enough inventory to meet sales or production requirements while minimizing inventory costs
• Inventory usually managed by manufacturing or operations However, finance department has an oversight
responsibility • Monitor level of lost or obsolete inventory• Supervise periodic physical inventories

© 2006 by Nelson, a division of Thomson Canada Limited 57
Benefits and Costs of Carrying Adequate Inventory• Benefits
Reduces stockouts and backorders Makes operations run more smoothly, improves customer
relations and increases sales
• Carrying Costs Interest on funds used to acquire inventory Storage and security Insurance Taxes Shrinkage Spoilage Breakage Obsolescence
© 2006 by Nelson, a division of Thomson Canada Limited 58
Inventory Ordering Costs
• Inventory ordering costs Expenses of placing orders with suppliers,
receiving shipments, and processing materials into inventory • Excludes vendor charges
Relate to the number of orders placed rather than to the amount of inventory held
Tend to vary inversely with carrying costs
© 2006 by Nelson, a division of Thomson Canada Limited 59
Economic Order Quantity (EOQ) Model
• EOQ model recognizes trade-offs between carrying costs and ordering costs Carrying costs increase with amount of inventory
held ( from larger orders) Ordering costs increase with the number of orders
placed (from more orders)
• EOQ minimizes total of sum of ordering and carrying costs
© 2006 by Nelson, a division of Thomson Canada Limited 60
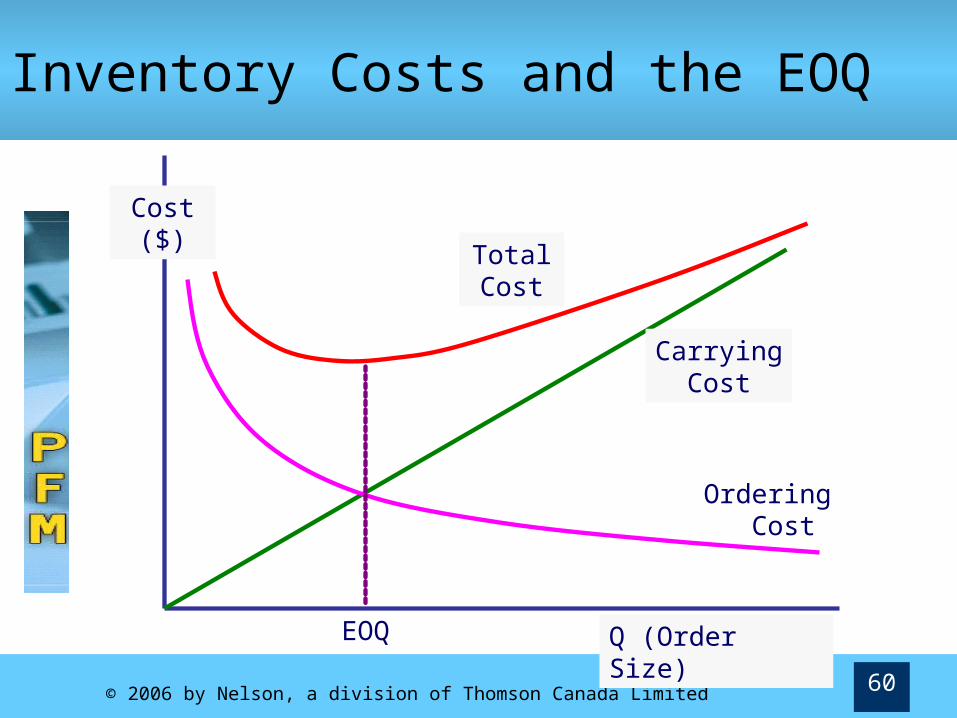
Inventory Costs and the EOQ
Q (Order Size)
Cost ($) Total
Cost
EOQ
Carrying Cost
Ordering Cost
© 2006 by Nelson, a division of Thomson Canada Limited 61
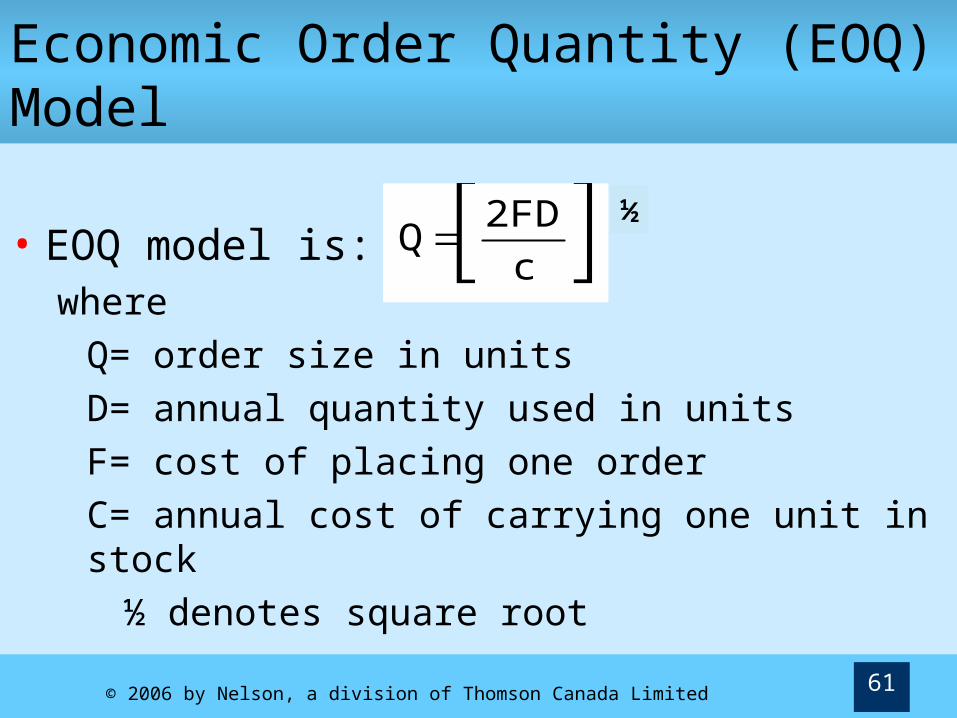
Economic Order Quantity (EOQ) Model
• EOQ model is:
whereQ= order size in unitsD= annual quantity used in unitsF= cost of placing one orderC= annual cost of carrying one unit in stock
½ denotes square root
c
2FDQ
½
© 2006 by Nelson, a division of Thomson Canada Limited 62
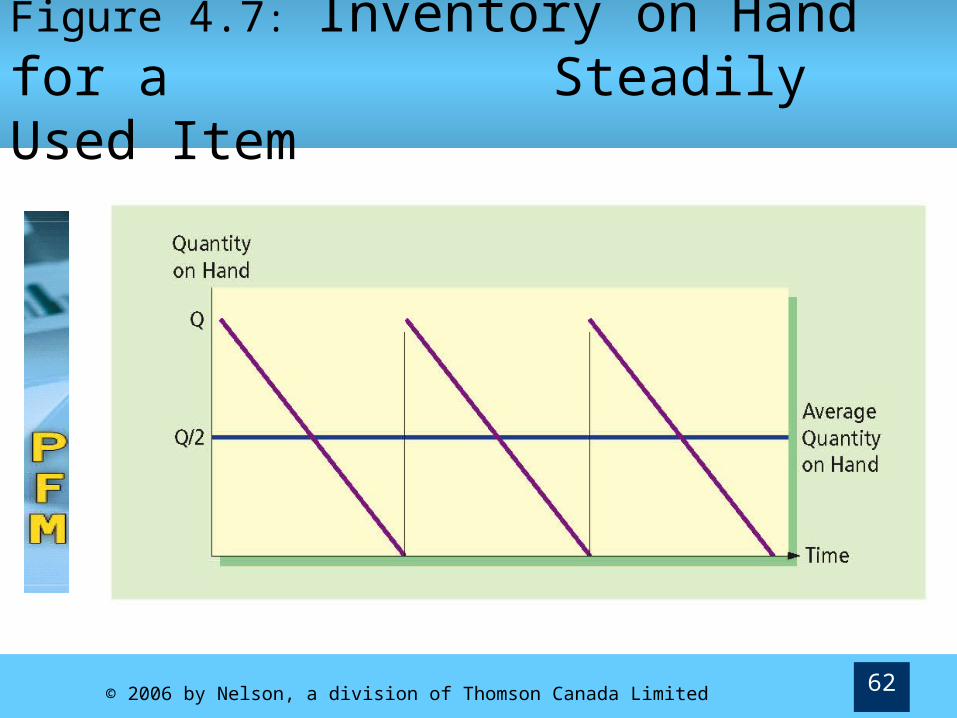
Figure 4.7: Inventory on Hand for a Steadily Used Item

© 2006 by Nelson, a division of Thomson Canada Limited 63
Economic Order Quantity (EOQ) Model • Other Inventory Formulas
Average Inventory = Total Carrying Cost: =
Number of Orders =
Total Ordering Cost = FN =
Total Ordering and Carrying Cost =
2
Q
Qc
2
DN =
QD
FQ
Q DTC = c +F
2 Q
© 2006 by Nelson, a division of Thomson Canada Limited 64
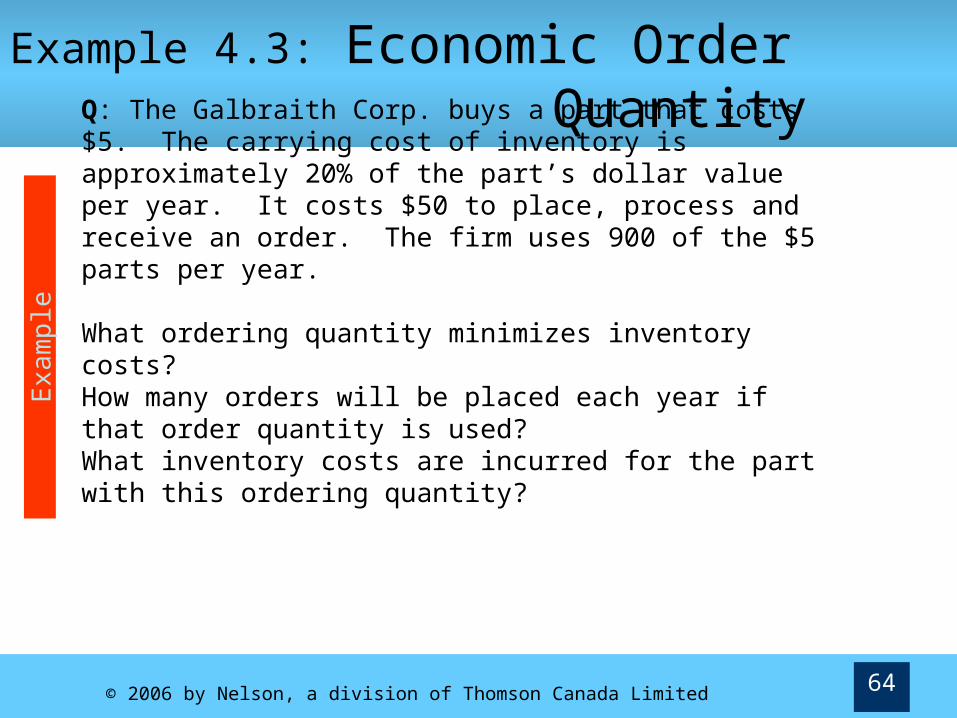
Example 4.3: Economic Order Quantity
Exa
mpl
e
Q: The Galbraith Corp. buys a part that costs $5. The carrying cost of inventory is approximately 20% of the part’s dollar value per year. It costs $50 to place, process and receive an order. The firm uses 900 of the $5 parts per year.
What ordering quantity minimizes inventory costs?How many orders will be placed each year if that order quantity is used? What inventory costs are incurred for the part with this ordering quantity?
© 2006 by Nelson, a division of Thomson Canada Limited 65
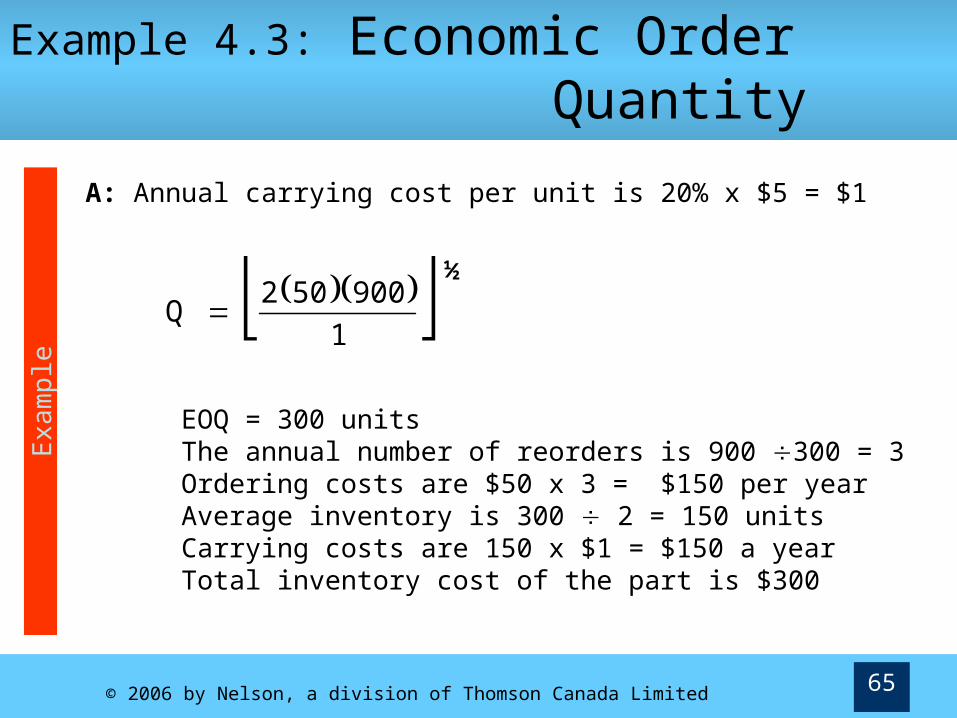
Example 4.3: Economic Order Quantity
Exa
mpl
e
A: Annual carrying cost per unit is 20% x $5 = $1
EOQ = 300 units The annual number of reorders is 900 300 = 3Ordering costs are $50 x 3 = $150 per yearAverage inventory is 300 2 = 150 units Carrying costs are 150 x $1 = $150 a yearTotal inventory cost of the part is $300
1
900502Q
½

© 2006 by Nelson, a division of Thomson Canada Limited 66
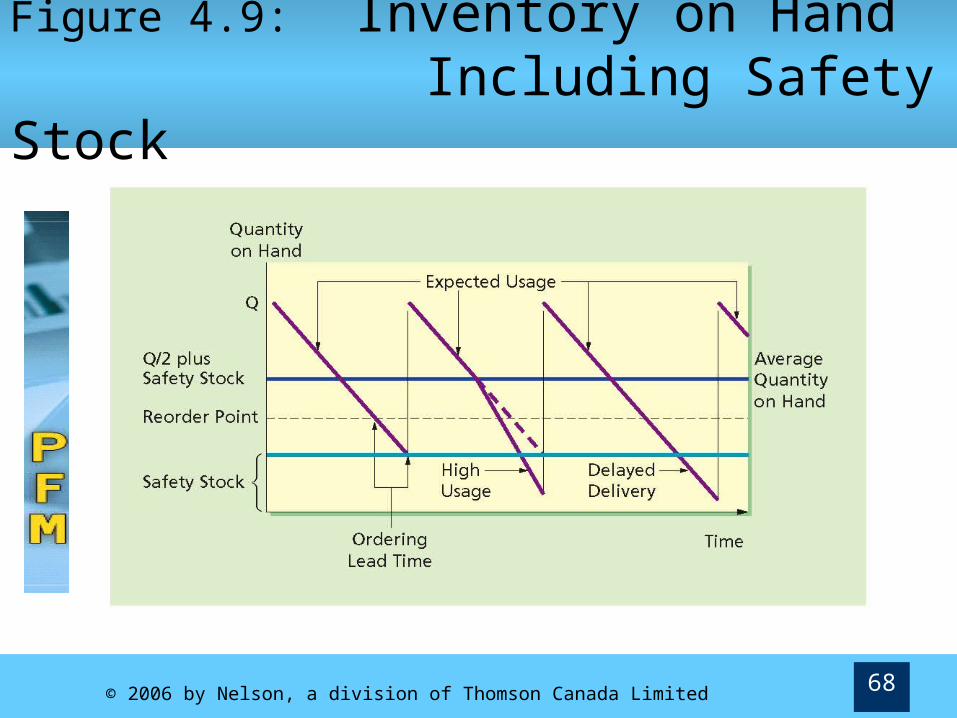
Safety Stocks, Reorder Points and Lead Times• Safety stock provides insurance against
unexpectedly rapid use or delayed delivery Additional supply of inventory that is carried
at all times to be used when normal working stocks run out
Rarely advisable to carry so much safety stock that stockouts never happen•Carrying costs would be excessive

© 2006 by Nelson, a division of Thomson Canada Limited 67
Safety Stocks, Reorder Points and Lead Times
• Ordering lead time—advance notice needed so that an order placed will arrive when required Usually estimated by item’s supplier
• Reorder point—level of inventory at which order is placed
© 2006 by Nelson, a division of Thomson Canada Limited 68
Figure 4.9: Inventory on Hand Including Safety Stock
© 2006 by Nelson, a division of Thomson Canada Limited 69
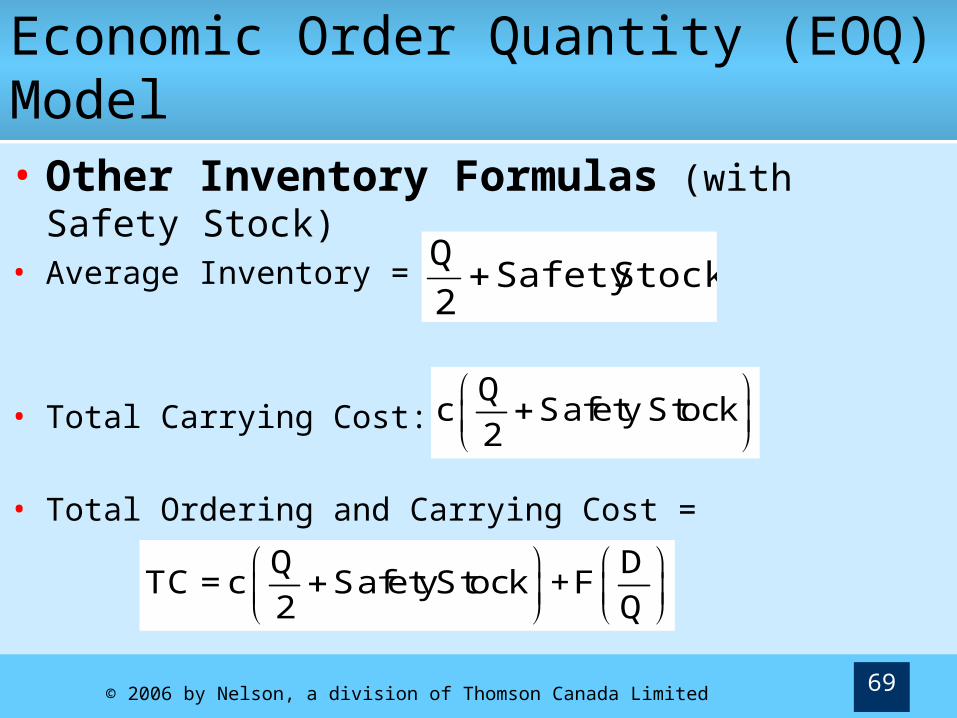
Economic Order Quantity (EOQ) Model • Other Inventory Formulas (with Safety
Stock) • Average Inventory =
• Total Carrying Cost: =
• Total Ordering and Carrying Cost =
StockSafety 2
Q
Qc Safety Stock
2
Q DTC = c SafetyStock +F
2 Q
© 2006 by Nelson, a division of Thomson Canada Limited 70
Tracking Inventories—The ABC System• Some inventory items (A items) require great
deal of attention Very expensive Critical to firm’s processes or to those of customers
• Some inventory items do not require great deal of attention (C items) Commonplace, easy to obtain
• B items fall between items A & C
• ABC system segregates items by value and places tighter control on higher cost (value) pieces
© 2006 by Nelson, a division of Thomson Canada Limited 71
Just In Time (JIT) Inventory System
• Inventory supplied At exactly the right time In exactly the right quantities
• Theoretically eliminates the need for factory inventory Shortens operating cycle Reduces costs Eliminate wasteful procedures But: late delivery can stop factory’s entire production line
• Works best with large manufacturers who are powerful with respect to supplier Supplier is willing to do almost anything to keep the
manufacturer’s business