Embed Size (px)
Citation preview

WO
RK
ING
PAP
ER |
ISS
UE
04
| 2
4 A
PRIL
201
9
Konstantinos Efstathiou ([email protected]) is an Affiliate Fellow at Bruegel
Guntram Wolff ([email protected]) is the Director of Bruegel
KONSTANTINOS EFSTATHIOU AND GUNTRAM WOLFF
We use a newly-compiled dataset to investigate whether and why European Union countries implement the economic policy recommendations they receive from the EU. We find that implementation rates are modest and have worsened at a time when the economic environment has improved and market pressure on sovereigns has subsided. Implementation has deteriorated in particular among countries designated as having ‘excessive’ macroeconomic imbalances. We then empirically test three factors that could influence implementation rates: (i) the macroeconomic environment; (ii) pressure from financial markets; and (iii) the strength of EU-level macroeconomic surveillance.
The econometric estimates indicate that larger fiscal and current account deficits and a higher probability of sovereign default increase the likelihood of implementation. However, stronger surveillance under the Macroeconomic Imbalances Procedure (MIP) does not seem to drive implementation rates. The quality of governance, the fragmentation of government coalitions and fewer recommendations received are connected to increased implementation, whereas for countries under the MIP, implementation slowed during election years. Finally, recommendations on financial services have a much greater chance of being implemented, whereas those on broadening the tax base, the long-term sustainability of public finance and pension systems, and competition in services are much less likely to be implemented. Overall, economic fundamentals and political economy factors provide only a small part of the answer to the question of why countries reform: ultimately, reform decisions are down to factors outside of the models.
WHAT DRIVES NATIONAL IMPLEMENTATION OF EU POLICY RECOMMENDATIONS?
WO
RK
ING
PAPER | ISSU
E 4 | 2019
1
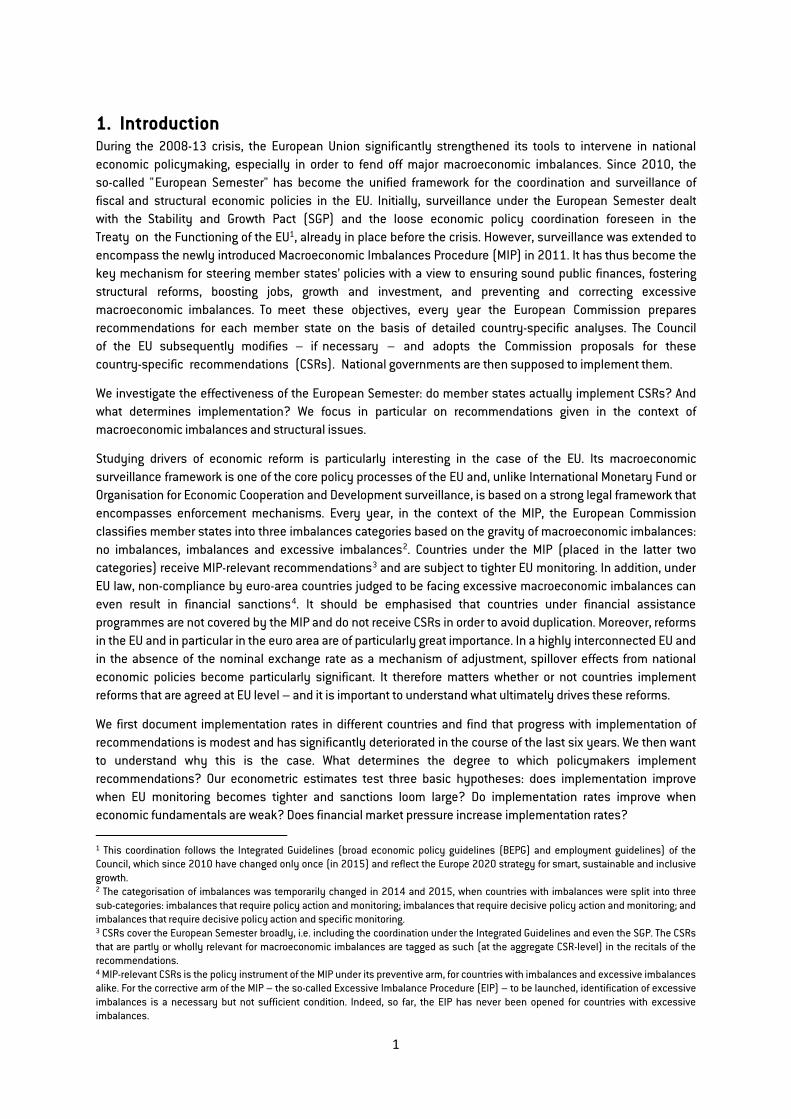
1. IntroductionDuring the 2008-13 crisis, the European Union significantly strengthened its tools to intervene in national economic policymaking, especially in order to fend off major macroeconomic imbalances. Since 2010, the so-called " European Semester" has become the unified framework for the coordination and surveillance of fiscal and structural economic policies in the EU. Initially, surveillance under the European Semester dealt with the Stability and Growth Pact (SGP) and the loose economic policy coordination foreseen in the Treaty on the Functioning of the EU1, already in place before the crisis. However, surveillance was extended to encompass the newly introduced Macroeconomic Imbalances Procedure (MIP) in 2011. It has thus become the key mechanism for steering member states’ policies with a view to ensuring sound public finances, fostering structural reforms, boosting jobs, growth and investment, and preventing and correcting excessive macroeconomic imbalances. To meet these objectives, every year the European Commission prepares recommendations for each member state on the basis of detailed country-specific analyses. The Council of the EU subsequently modifies – if necessary – and adopts the Commission proposals for these country-specific recommendations (CSRs). National governments are then supposed to implement them.
We investigate the effectiveness of the European Semester: do member states actually implement CSRs? And what determines implementation? We focus in particular on recommendations given in the context of macroeconomic imbalances and structural issues.
Studying drivers of economic reform is particularly interesting in the case of the EU. Its macroeconomic surveillance framework is one of the core policy processes of the EU and, unlike International Monetary Fund or Organisation for Economic Cooperation and Development surveillance, is based on a strong legal framework that encompasses enforcement mechanisms. Every year, in the context of the MIP, the European Commission classifies member states into three imbalances categories based on the gravity of macroeconomic imbalances: no imbalances, imbalances and excessive imbalances2. Countries under the MIP (placed in the latter two categories) receive MIP-relevant recommendations3 and are subject to tighter EU monitoring. In addition, under EU law, non-compliance by euro-area countries judged to be facing excessive macroeconomic imbalances can even result in financial sanctions4. It should be emphasised that countries under financial assistance programmes are not covered by the MIP and do not receive CSRs in order to avoid duplication. Moreover, reforms in the EU and in particular in the euro area are of particularly great importance. In a highly interconnected EU and in the absence of the nominal exchange rate as a mechanism of adjustment, spillover effects from national economic policies become particularly significant. It therefore matters whether or not countries implement reforms that are agreed at EU level – and it is important to understand what ultimately drives these reforms.
We first document implementation rates in different countries and find that progress with implementation of recommendations is modest and has significantly deteriorated in the course of the last six years. We then want to understand why this is the case. What determines the degree to which policymakers implement recommendations? Our econometric estimates test three basic hypotheses: does implementation improve when EU monitoring becomes tighter and sanctions loom large? Do implementation rates improve when economic fundamentals are weak? Does financial market pressure increase implementation rates?
1 This coordination follows the Integrated Guidelines (broad economic policy guidelines (BEPG) and employment guidelines) of the Council, which since 2010 have changed only once (in 2015) and reflect the Europe 2020 strategy for smart, sustainable and inclusive growth. 2 The categorisation of imbalances was temporarily changed in 2014 and 2015, when countries with imbalances were split into three sub-categories: imbalances that require policy action and monitoring; imbalances that require decisive policy action and monitoring; and imbalances that require decisive policy action and specific monitoring. 3 CSRs cover the European Semester broadly, i.e. including the coordination under the Integrated Guidelines and even the SGP. The CSRs that are partly or wholly relevant for macroeconomic imbalances are tagged as such (at the aggregate CSR-level) in the recitals of the recommendations. 4 MIP-relevant CSRs is the policy instrument of the MIP under its preventive arm, for countries with imbalances and excessive imbalances alike. For the corrective arm of the MIP – the so-called Excessive Imbalance Procedure (EIP) – to be launched, identification of excessive imbalances is a necessary but not sufficient condition. Indeed, so far, the EIP has never been opened for countries with excessive imbalances.
2
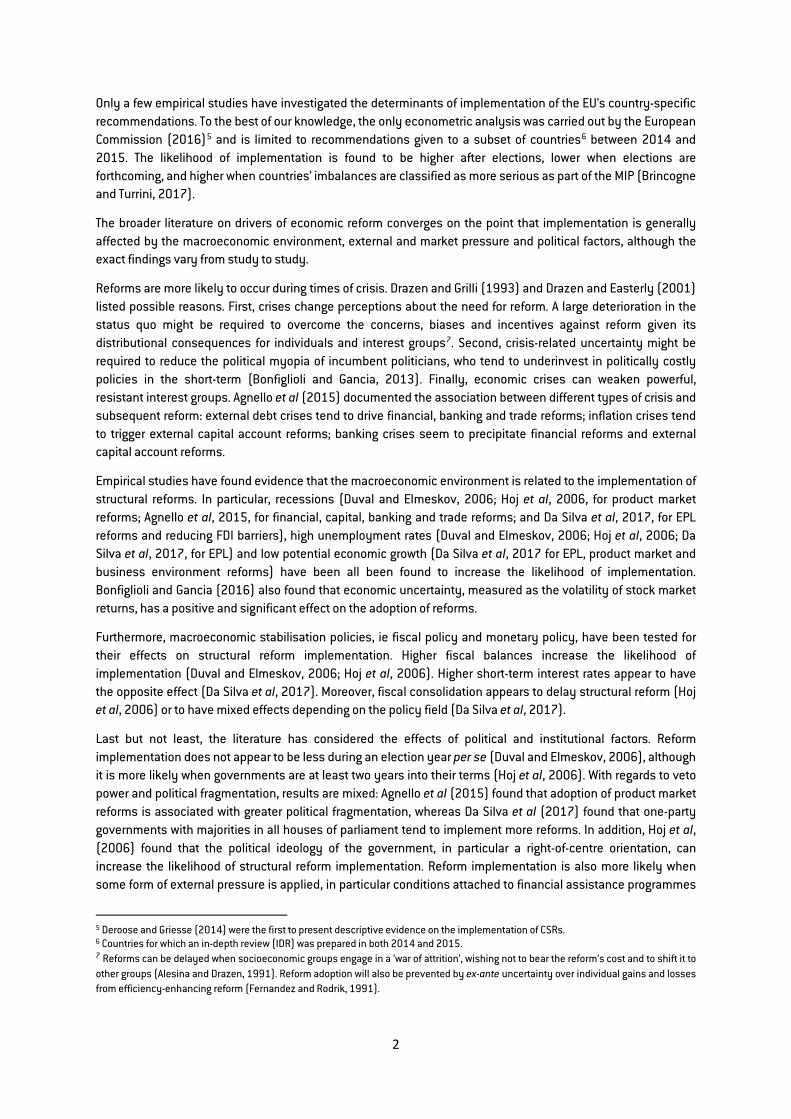
Only a few empirical studies have investigated the determinants of implementation of the EU’s country-specific recommendations. To the best of our knowledge, the only econometric analysis was carried out by the European Commission (2016)5 and is limited to recommendations given to a subset of countries6 between 2014 and 2015. The likelihood of implementation is found to be higher after elections, lower when elections are forthcoming, and higher when countries’ imbalances are classified as more serious as part of the MIP (Brincogne and Turrini, 2017).
The broader literature on drivers of economic reform converges on the point that implementation is generally affected by the macroeconomic environment, external and market pressure and political factors, although the exact findings vary from study to study.
Reforms are more likely to occur during times of crisis. Drazen and Grilli (1993) and Drazen and Easterly (2001) listed possible reasons. First, crises change perceptions about the need for reform. A large deterioration in the status quo might be required to overcome the concerns, biases and incentives against reform given its distributional consequences for individuals and interest groups7. Second, crisis-related uncertainty might be required to reduce the political myopia of incumbent politicians, who tend to underinvest in politically costly policies in the short-term (Bonfiglioli and Gancia, 2013). Finally, economic crises can weaken powerful, resistant interest groups. Agnello et al (2015) documented the association between different types of crisis and subsequent reform: external debt crises tend to drive financial, banking and trade reforms; inflation crises tend to trigger external capital account reforms; banking crises seem to precipitate financial reforms and external capital account reforms.
Empirical studies have found evidence that the macroeconomic environment is related to the implementation of structural reforms. In particular, recessions (Duval and Elmeskov, 2006; Hoj et al, 2006, for product market reforms; Agnello et al, 2015, for financial, capital, banking and trade reforms; and Da Silva et al, 2017, for EPL reforms and reducing FDI barriers), high unemployment rates (Duval and Elmeskov, 2006; Hoj et al, 2006; Da Silva et al, 2017, for EPL) and low potential economic growth (Da Silva et al, 2017 for EPL, product market and business environment reforms) have been all been found to increase the likelihood of implementation. Bonfiglioli and Gancia (2016) also found that economic uncertainty, measured as the volatility of stock market returns, has a positive and significant effect on the adoption of reforms.
Furthermore, macroeconomic stabilisation policies, ie fiscal policy and monetary policy, have been tested for their effects on structural reform implementation. Higher fiscal balances increase the likelihood of implementation (Duval and Elmeskov, 2006; Hoj et al, 2006). Higher short-term interest rates appear to have the opposite effect (Da Silva et al, 2017). Moreover, fiscal consolidation appears to delay structural reform (Hoj et al, 2006) or to have mixed effects depending on the policy field (Da Silva et al, 2017).
Last but not least, the literature has considered the effects of political and institutional factors. Reform implementation does not appear to be less during an election year per se (Duval and Elmeskov, 2006), although it is more likely when governments are at least two years into their terms (Hoj et al, 2006). With regards to veto power and political fragmentation, results are mixed: Agnello et al (2015) found that adoption of product market reforms is associated with greater political fragmentation, whereas Da Silva et al (2017) found that one-party governments with majorities in all houses of parliament tend to implement more reforms. In addition, Hoj et al, (2006) found that the political ideology of the government, in particular a right-of-centre orientation, can increase the likelihood of structural reform implementation. Reform implementation is also more likely when some form of external pressure is applied, in particular conditions attached to financial assistance programmes
5 Deroose and Griesse (2014) were the first to present descriptive evidence on the implementation of CSRs. 6 Countries for which an in-depth review (IDR) was prepared in both 2014 and 2015. 7 Reforms can be delayed when socioeconomic groups engage in a ‘war of attrition’, wishing not to bear the reform’s cost and to shift it to other groups (Alesina and Drazen, 1991). Reform adoption will also be prevented by ex-ante uncertainty over individual gains and losses from efficiency-enhancing reform (Fernandez and Rodrik, 1991).

3
(Da Silva et al, 2017) or the EU single market programme (Hoj et al, 2006; Da Silva et al, 2017). On the other hand, Da Silva et al (2017) did not find evidence that financial market pressure promotes implementation.
The next section presents our new dataset and provides the first key statistics. In section 3, we discuss our empirical approach while section 4 shows the econometric estimates of the drivers of reforms. The last section concludes.
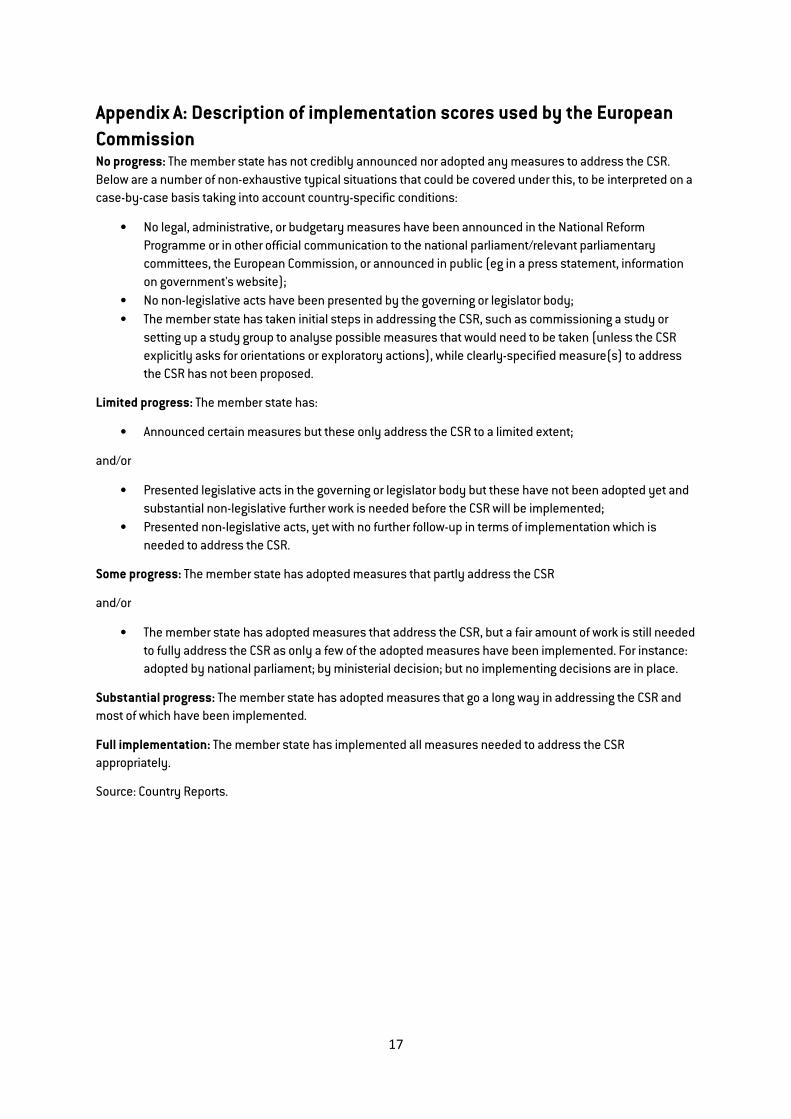
2. Implementation of CSRs: what do the data show? 2.1. The dataset We compiled our new dataset from the European Commission’s publicly available Country Reports. The dataset contains for every recommendation its text, the year in and country to which it was addressed, and the progress made by the country in implementing it. This implementation score, which is our dependent variable, is evaluated by the European Commission and takes the form of an ordered, categorical variable translating implementation into a five-point scale: no progress, limited progress, some progress, substantial progress and full implementation. This assessment has been accepted as accurate by the members of the Economic Policy Committee – a group of officials from member states that supports the work of ECOFIN (European Court of Auditors, 2018). Appendix A gives further information on these scores.
We assign each recommendation to one or several codified policy area(s) for which it is relevant. For instance, recommendations on collective bargaining, wage indexation and minimum wage regimes are codified as being relevant for ‘wages and wage-setting’. This type of matching is also carried out by the European Commission but is not made public. We used the same list of 32 policy areas as the European Commission (Appendix B) and carried out basic statistical comparisons that showed that our classifications correspond closely to the European Commission’s. The observations in our dataset are the so-called subparts of CSRs, so they refer to specific recommendations such as “further reduce the regulatory burden for firms, including by pursuing the simplification programme”8.
The resulting dataset is three-dimensional and nested: every recommendation, indexed by j, corresponds to year t and country i. The dataset covers all the recommendations addressed to member states from 2013 to 2018, except those related to fiscal targets based on the Stability and Growth Pact (SGP)9, for which implementation scores are not available. The total number of observations is 1901.
Finally, we matched at the country-year level the dataset of recommendations with the explanatory variables. These can be divided into four sets: a) macroeconomic data; b) market measures of sovereign risk; c) political variables; and d) the classification of countries into categories of macroeconomic imbalances in the context of surveillance under the MIP.
The macroeconomic data comes from the European Commission’s AMECO database and the IMF World Economic Outlook (WEO). We used the real-time vintages of the macroeconomic variables, ie the values for year t come from the Spring Economic Forecast of the European Commission of year t+1 (published in May) and the WEO published in April. These vintages represent the information available as of the time recommendations were adopted, without subsequent revisions. Market measures of sovereign risk (ie sovereign default probability, 5-year credit default swap (CDS) spreads) were obtained from Bloomberg. The sources of the political variables are the Database of Political Institutions 2017 and the World Bank’s World Governance Indicators. The variables are described in detail in Appendix C.
8 To illustrate with an example, the text of CSR 4 to France in 2017 read “Further reduce the regulatory burden for firms, including by pursuing the simplification programme. Continue to lift barriers to competition in the services sector, including in business services and regulated professions. Simplify and improve the efficiency of public support schemes for innovation”. Each sentence of this CSR is a subpart. 9 The sample also excludes subparts that simply ask countries to comply with financial assistance programme requirements (this was the case for Romania in 2013, 2014 and 2015).
4
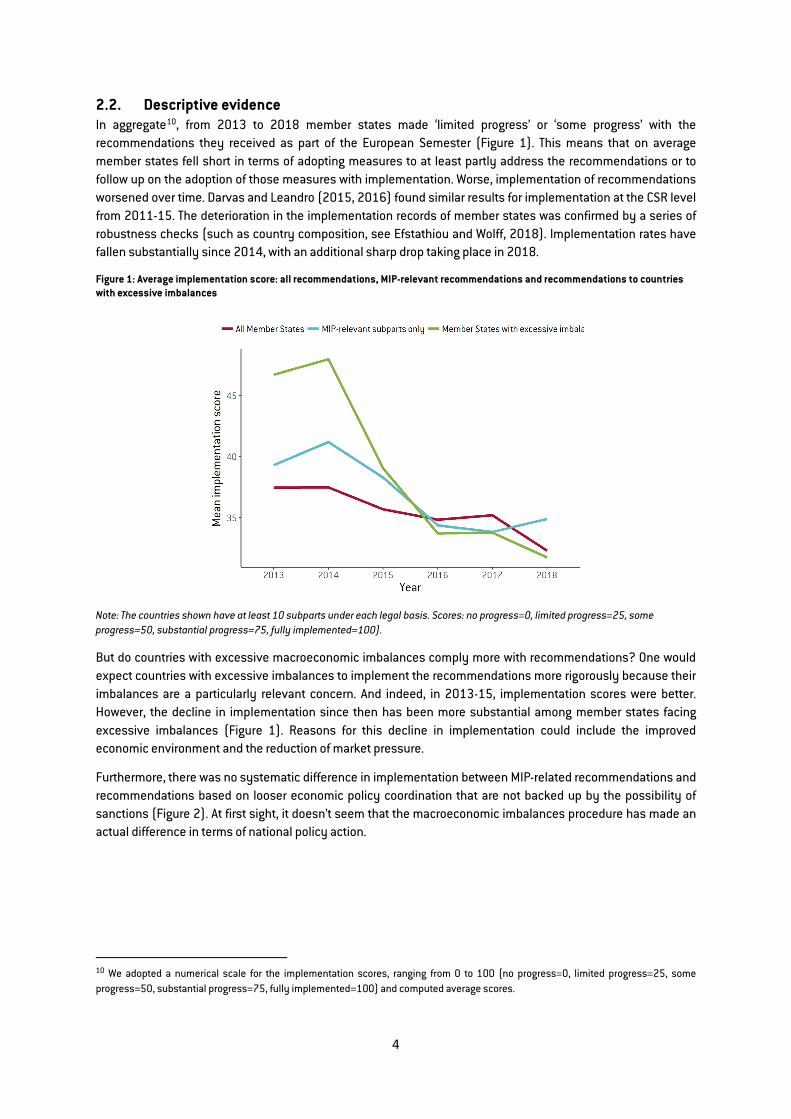
2.2. Descriptive evidence In aggregate10, from 2013 to 2018 member states made ‘limited progress’ or ‘some progress’ with the recommendations they received as part of the European Semester (Figure 1). This means that on average member states fell short in terms of adopting measures to at least partly address the recommendations or to follow up on the adoption of those measures with implementation. Worse, implementation of recommendations worsened over time. Darvas and Leandro (2015, 2016) found similar results for implementation at the CSR level from 2011-15. The deterioration in the implementation records of member states was confirmed by a series of robustness checks (such as country composition, see Efstathiou and Wolff, 2018). Implementation rates have fallen substantially since 2014, with an additional sharp drop taking place in 2018.
Figure 1: Average implementation score: all recommendations, MIP-relevant recommendations and recommendations to countries with excessive imbalances
Note: The countries shown have at least 10 subparts under each legal basis. Scores: no progress=0, limited progress=25, some progress=50, substantial progress=75, fully implemented=100).
But do countries with excessive macroeconomic imbalances comply more with recommendations? One would expect countries with excessive imbalances to implement the recommendations more rigorously because their imbalances are a particularly relevant concern. And indeed, in 2013-15, implementation scores were better. However, the decline in implementation since then has been more substantial among member states facing excessive imbalances (Figure 1). Reasons for this decline in implementation could include the improved economic environment and the reduction of market pressure.
Furthermore, there was no systematic difference in implementation between MIP-related recommendations and recommendations based on looser economic policy coordination that are not backed up by the possibility of sanctions (Figure 2). At first sight, it doesn’t seem that the macroeconomic imbalances procedure has made an actual difference in terms of national policy action.
10 We adopted a numerical scale for the implementation scores, ranging from 0 to 100 (no progress=0, limited progress=25, some progress=50, substantial progress=75, fully implemented=100) and computed average scores.

5
Figure 2: Average implementation score by country 2013-18, MIP-relevant vs. non MIP-relevant recommendations
Note: The countries shown have at least 10 subparts under each legal basis. Scores: no progress=0, limited progress=25, some progress=50, substantial progress=75, fully implemented=100). The countries shown have at least 10 subparts under each legal basis.
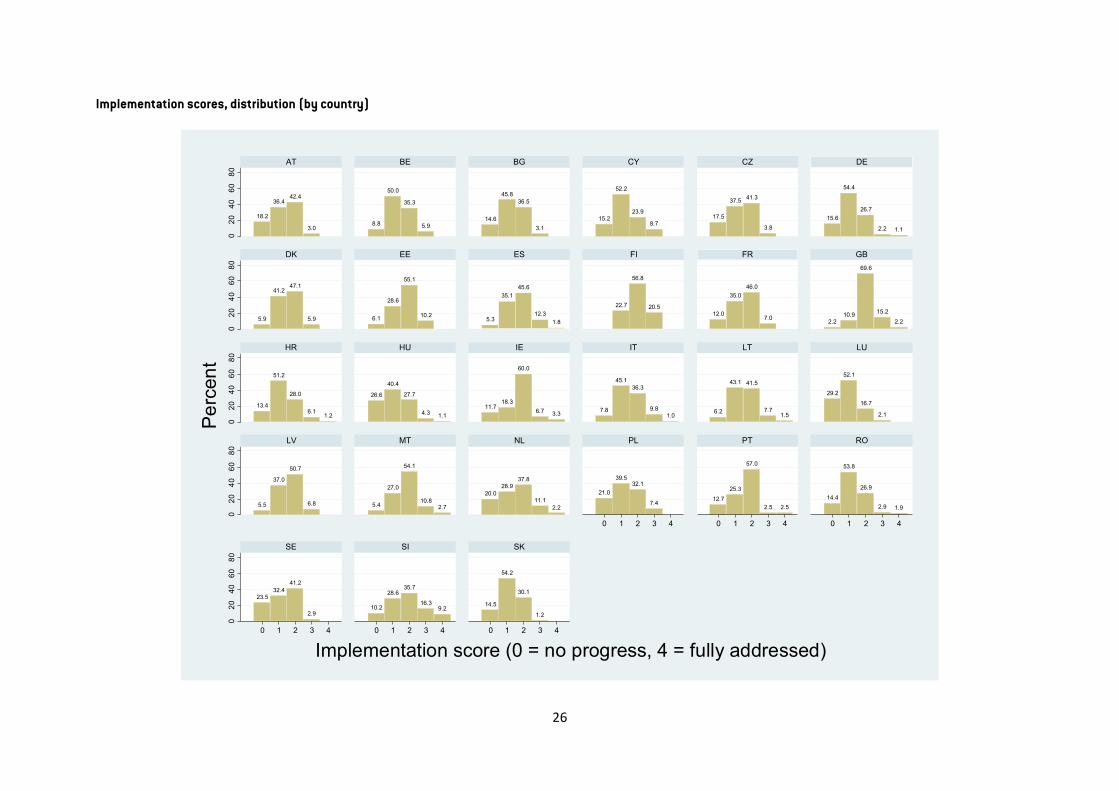
Meanwhile, implementation varied substantially between countries and policy areas from 2013-17. The countries with the highest implementation scores (see Figure 3) were the United Kingdom (51), Finland (49), Slovenia (46), Malta (45) and Ireland (43). Implementation was lowest in Luxembourg (23), Hungary (28), Slovakia (30), Germany (30) and Sweden (31).
Figure 3: Average implementation score 2013-18, by country
Note: The countries shown have at least 10 subparts under each legal basis. Scores: no progress=0, limited progress=25, some progress=50, substantial progress=75, fully implemented=100).
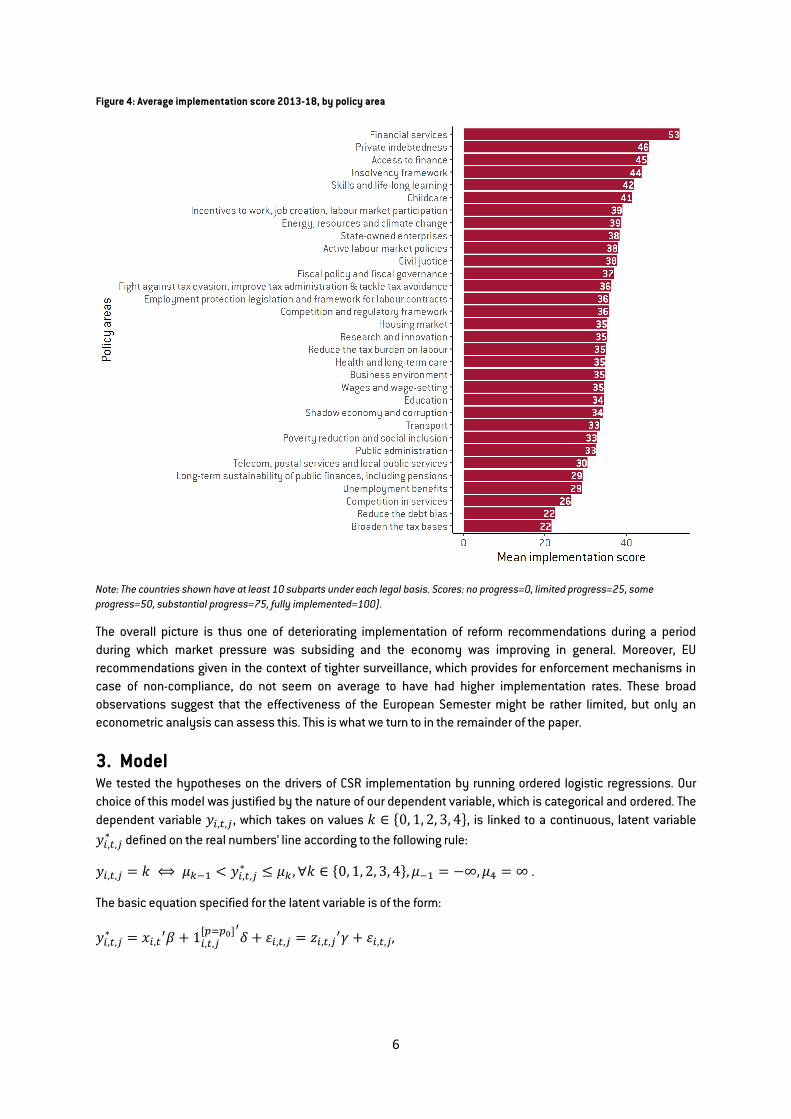
Implementation scores by policy area (Figure 4) are on average high for the financial sector (financial services: 53; private indebtedness: 46; access to finance: 45; and the insolvency framework: 44), skills and life-long learning (42) and childcare (41). However, recommendations related to taxation, such as on broadening the tax base (22) or reducing the debt bias (22), competition in services (26) and reforms focused on unemployment benefits (29) and the long-term sustainability of public finances including pensions (29), are poorly implemented overall.
6
Figure 4: Average implementation score 2013-18, by policy area
Note: The countries shown have at least 10 subparts under each legal basis. Scores: no progress=0, limited progress=25, some progress=50, substantial progress=75, fully implemented=100).
The overall picture is thus one of deteriorating implementation of reform recommendations during a period during which market pressure was subsiding and the economy was improving in general. Moreover, EU recommendations given in the context of tighter surveillance, which provides for enforcement mechanisms in case of non-compliance, do not seem on average to have had higher implementation rates. These broad observations suggest that the effectiveness of the European Semester might be rather limited, but only an econometric analysis can assess this. This is what we turn to in the remainder of the paper.
3. Model We tested the hypotheses on the drivers of CSR implementation by running ordered logistic regressions. Our choice of this model was justified by the nature of our dependent variable, which is categorical and ordered. The dependent variable 𝑦𝑦𝑖𝑖,𝑡𝑡,𝑗𝑗 , which takes on values 𝑘𝑘 ∈ {0, 1, 2, 3, 4}, is linked to a continuous, latent variable 𝑦𝑦𝑖𝑖,𝑡𝑡,𝑗𝑗∗ defined on the real numbers’ line according to the following rule:
𝑦𝑦𝑖𝑖,𝑡𝑡,𝑗𝑗 = 𝑘𝑘 ⟺ 𝜇𝜇𝑘𝑘−1 < 𝑦𝑦𝑖𝑖,𝑡𝑡,𝑗𝑗∗ ≤ 𝜇𝜇𝑘𝑘 ,∀𝑘𝑘 ∈ {0, 1, 2, 3, 4},𝜇𝜇−1 = −∞,𝜇𝜇4 = ∞ .
The basic equation specified for the latent variable is of the form:
𝑦𝑦𝑖𝑖,𝑡𝑡,𝑗𝑗∗ = 𝑥𝑥𝑖𝑖,𝑡𝑡′𝛽𝛽 + 1𝑖𝑖,𝑡𝑡,𝑗𝑗
[𝑝𝑝=𝑝𝑝0]′𝛿𝛿 + 𝜀𝜀𝑖𝑖,𝑡𝑡,𝑗𝑗 = 𝑧𝑧𝑖𝑖,𝑡𝑡,𝑗𝑗′𝛾𝛾 + 𝜀𝜀𝑖𝑖,𝑡𝑡,𝑗𝑗 ,
7
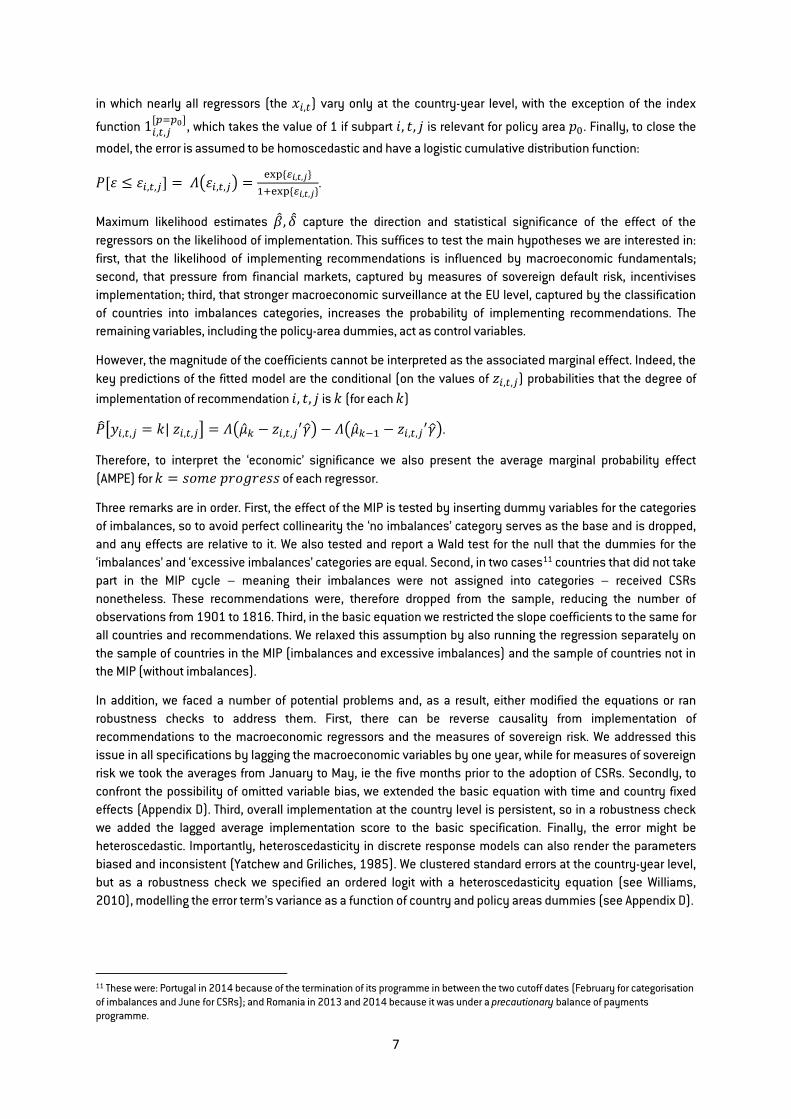
in which nearly all regressors (the 𝑥𝑥𝑖𝑖,𝑡𝑡) vary only at the country-year level, with the exception of the index
function 1𝑖𝑖,𝑡𝑡,𝑗𝑗[𝑝𝑝=𝑝𝑝0], which takes the value of 1 if subpart 𝑖𝑖, 𝑡𝑡, 𝑗𝑗 is relevant for policy area 𝑝𝑝0. Finally, to close the
model, the error is assumed to be homoscedastic and have a logistic cumulative distribution function:
𝑃𝑃[𝜀𝜀 ≤ 𝜀𝜀𝑖𝑖,𝑡𝑡,𝑗𝑗] = 𝛬𝛬�𝜀𝜀𝑖𝑖,𝑡𝑡,𝑗𝑗� = exp {𝜀𝜀𝑖𝑖,𝑡𝑡,𝑗𝑗}1+exp {𝜀𝜀𝑖𝑖,𝑡𝑡,𝑗𝑗}
.
Maximum likelihood estimates �̂�𝛽,𝛿𝛿 capture the direction and statistical significance of the effect of the regressors on the likelihood of implementation. This suffices to test the main hypotheses we are interested in: first, that the likelihood of implementing recommendations is influenced by macroeconomic fundamentals; second, that pressure from financial markets, captured by measures of sovereign default risk, incentivises implementation; third, that stronger macroeconomic surveillance at the EU level, captured by the classification of countries into imbalances categories, increases the probability of implementing recommendations. The remaining variables, including the policy-area dummies, act as control variables.
However, the magnitude of the coefficients cannot be interpreted as the associated marginal effect. Indeed, the key predictions of the fitted model are the conditional (on the values of 𝑧𝑧𝑖𝑖,𝑡𝑡,𝑗𝑗) probabilities that the degree of implementation of recommendation 𝑖𝑖, 𝑡𝑡, 𝑗𝑗 is 𝑘𝑘 (for each 𝑘𝑘)
𝑃𝑃��𝑦𝑦𝑖𝑖,𝑡𝑡,𝑗𝑗 = 𝑘𝑘| 𝑧𝑧𝑖𝑖,𝑡𝑡,𝑗𝑗� = 𝛬𝛬��̂�𝜇𝑘𝑘 − 𝑧𝑧𝑖𝑖,𝑡𝑡,𝑗𝑗′𝛾𝛾�� − 𝛬𝛬��̂�𝜇𝑘𝑘−1 − 𝑧𝑧𝑖𝑖,𝑡𝑡,𝑗𝑗
′𝛾𝛾��.
Therefore, to interpret the ‘economic’ significance we also present the average marginal probability effect (AMPE) for 𝑘𝑘 = 𝑠𝑠𝑠𝑠𝑠𝑠𝑠𝑠 𝑝𝑝𝑝𝑝𝑠𝑠𝑝𝑝𝑝𝑝𝑠𝑠𝑠𝑠𝑠𝑠 of each regressor.
Three remarks are in order. First, the effect of the MIP is tested by inserting dummy variables for the categories of imbalances, so to avoid perfect collinearity the ‘no imbalances’ category serves as the base and is dropped, and any effects are relative to it. We also tested and report a Wald test for the null that the dummies for the ‘imbalances’ and ‘excessive imbalances’ categories are equal. Second, in two cases11 countries that did not take part in the MIP cycle – meaning their imbalances were not assigned into categories – received CSRs nonetheless. These recommendations were, therefore dropped from the sample, reducing the number of observations from 1901 to 1816. Third, in the basic equation we restricted the slope coefficients to the same for all countries and recommendations. We relaxed this assumption by also running the regression separately on the sample of countries in the MIP (imbalances and excessive imbalances) and the sample of countries not in the MIP (without imbalances).
In addition, we faced a number of potential problems and, as a result, either modified the equations or ran robustness checks to address them. First, there can be reverse causality from implementation of recommendations to the macroeconomic regressors and the measures of sovereign risk. We addressed this issue in all specifications by lagging the macroeconomic variables by one year, while for measures of sovereign risk we took the averages from January to May, ie the five months prior to the adoption of CSRs. Secondly, to confront the possibility of omitted variable bias, we extended the basic equation with time and country fixed effects (Appendix D). Third, overall implementation at the country level is persistent, so in a robustness check we added the lagged average implementation score to the basic specification. Finally, the error might be heteroscedastic. Importantly, heteroscedasticity in discrete response models can also render the parameters biased and inconsistent (Yatchew and Griliches, 1985). We clustered standard errors at the country-year level, but as a robustness check we specified an ordered logit with a heteroscedasticity equation (see Williams, 2010), modelling the error term’s variance as a function of country and policy areas dummies (see Appendix D).
11 These were: Portugal in 2014 because of the termination of its programme in between the two cutoff dates (February for categorisation of imbalances and June for CSRs); and Romania in 2013 and 2014 because it was under a precautionary balance of payments programme.

8
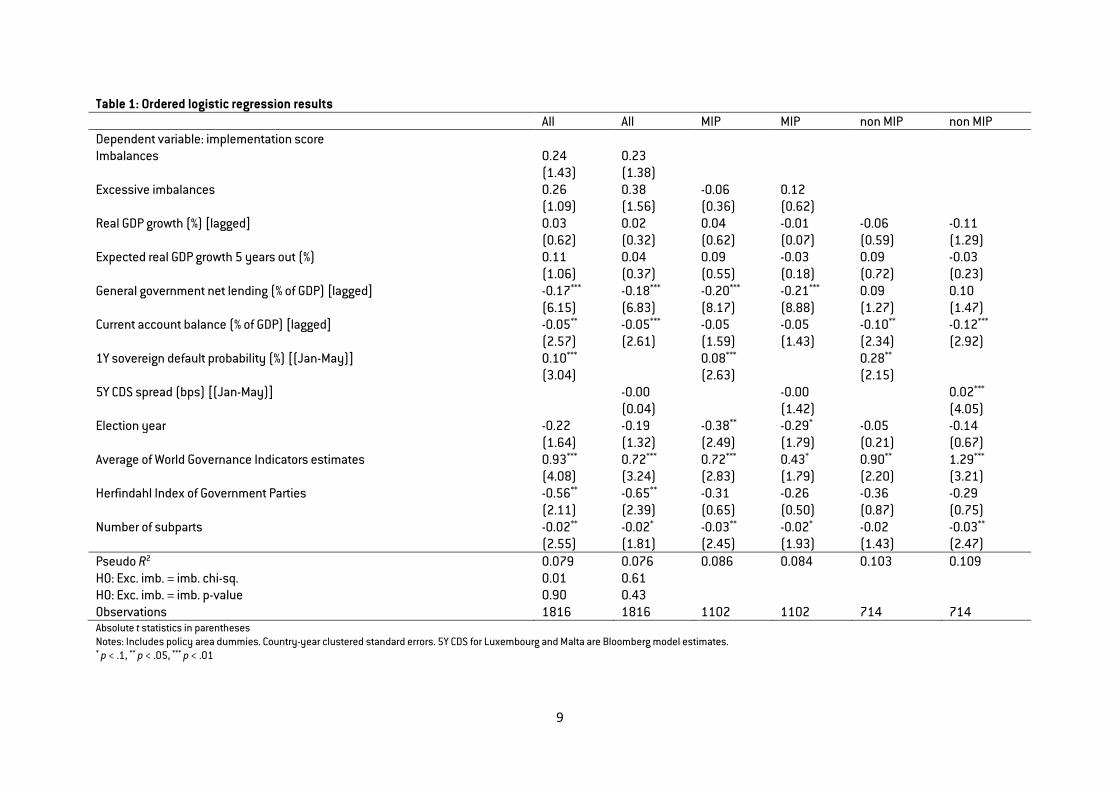
4. Results 4.1. Main results Three main results emerge from our basic equation (Table 1). First, economic fundamentals matter: countries with high public and external deficits are more likely to implement recommendations. Second, financial market pressure increases the probability of implementation. However, this result is sensitive to the choice of variable: the coefficient on the 1-year sovereign default probability is positive and statistically significant but when the 5-year credit default swap (CDS) spread takes its place, statistical significance vanishes. Third, there is no evidence that the classification of countries in the MIP mattered for implementation. The categorisation in either one of the MIP categories, ie the imbalances or the excessive imbalances category, does not result in a statistically significant effect compared to countries classified as having no imbalance. The difference in implementation between imbalances and excessive imbalances is not statistically significant either.
Furthermore, we find three robust results among the control variables. First, higher governance quality – which includes the government effectiveness measure among others – increased the probability of implementation. Second, more fragmented governments – in terms of a larger number of parties participating and their more equal representation in parliament – were more likely to make further progress with recommendations, possibly reflecting greater diffusion of the political cost and/or ownership of the reform agenda. Third, a lower number of recommendations received by a country in a given year resulted in better implementation per recommendation.
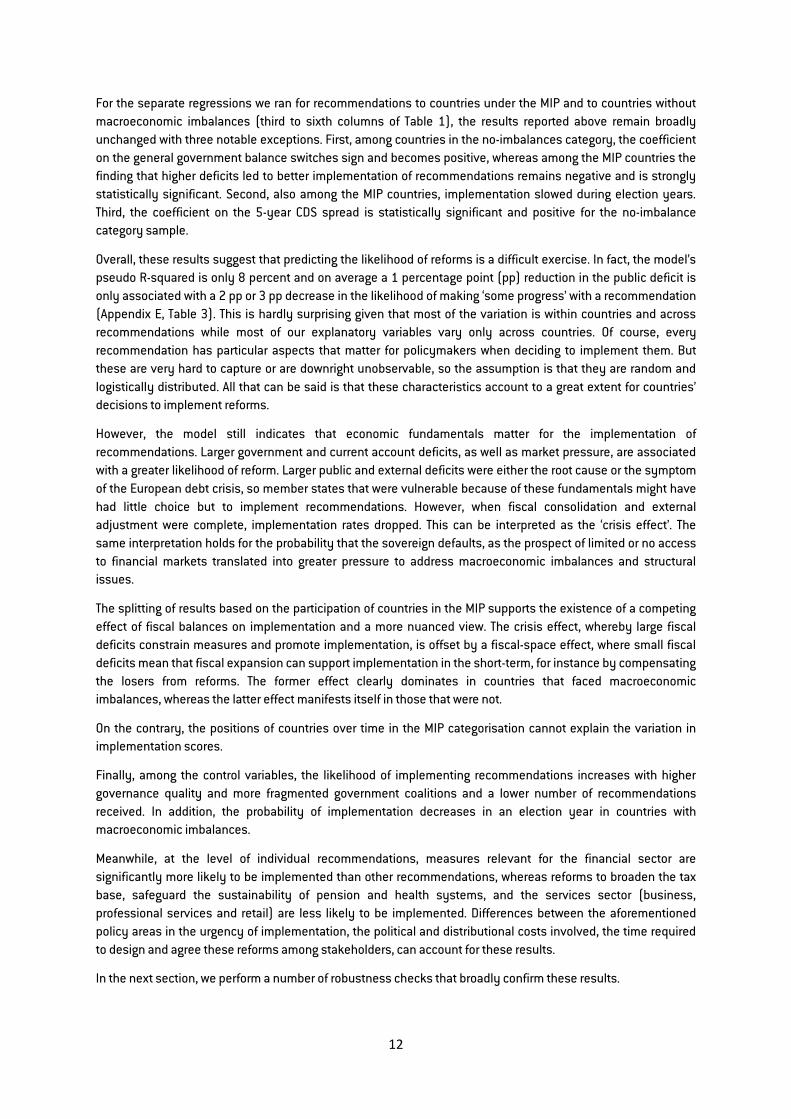
Turning to the policy-area dummies (Table 2), the probability of implementation is greater if the recommendation was relevant for financial services (at the 1 percent confidence level), access to finance, energy, resources and climate change, the fight against tax evasion, improving the tax administration and tackling tax avoidance, health and long-term care, incentives to work, job creation and labour market participation, and skills and lifelong learning (at least at the 10 percent confidence level). On the contrary, it is lower if the recommendation concerned broadening the tax base, competition in services, the long-term sustainability of public finances, including pensions (all at the 1 percent confidence level), poverty reduction and social inclusion, telecom, postal services and local public services, transport, and reducing the debt bias (at least at the 10 percent confidence level).
9
Table 1: Ordered logistic regression results All All MIP MIP non MIP non MIP Dependent variable: implementation score Imbalances 0.24 0.23 (1.43) (1.38) Excessive imbalances 0.26 0.38 -0.06 0.12 (1.09) (1.56) (0.36) (0.62) Real GDP growth (%) [lagged] 0.03 0.02 0.04 -0.01 -0.06 -0.11 (0.62) (0.32) (0.62) (0.07) (0.59) (1.29) Expected real GDP growth 5 years out (%) 0.11 0.04 0.09 -0.03 0.09 -0.03 (1.06) (0.37) (0.55) (0.18) (0.72) (0.23) General government net lending (% of GDP) [lagged] -0.17*** -0.18*** -0.20*** -0.21*** 0.09 0.10 (6.15) (6.83) (8.17) (8.88) (1.27) (1.47) Current account balance (% of GDP) [lagged] -0.05** -0.05*** -0.05 -0.05 -0.10** -0.12*** (2.57) (2.61) (1.59) (1.43) (2.34) (2.92) 1Y sovereign default probability (%) [(Jan-May)] 0.10*** 0.08*** 0.28** (3.04) (2.63) (2.15) 5Y CDS spread (bps) [(Jan-May)] -0.00 -0.00 0.02*** (0.04) (1.42) (4.05) Election year -0.22 -0.19 -0.38** -0.29* -0.05 -0.14 (1.64) (1.32) (2.49) (1.79) (0.21) (0.67) Average of World Governance Indicators estimates 0.93*** 0.72*** 0.72*** 0.43* 0.90** 1.29*** (4.08) (3.24) (2.83) (1.79) (2.20) (3.21) Herfindahl Index of Government Parties -0.56** -0.65** -0.31 -0.26 -0.36 -0.29 (2.11) (2.39) (0.65) (0.50) (0.87) (0.75) Number of subparts -0.02** -0.02* -0.03** -0.02* -0.02 -0.03** (2.55) (1.81) (2.45) (1.93) (1.43) (2.47) Pseudo R2 0.079 0.076 0.086 0.084 0.103 0.109 H0: Exc. imb. = imb. chi-sq. 0.01 0.61 H0: Exc. imb. = imb. p-value 0.90 0.43 Observations 1816 1816 1102 1102 714 714 Absolute t statistics in parentheses Notes: Includes policy area dummies. Country-year clustered standard errors. 5Y CDS for Luxembourg and Malta are Bloomberg model estimates. * p < .1, ** p < .05, *** p < .01

10
Table 2: Ordered logistic regression policy-area dummies All All MIP MIP non MIP non MIP Dependent variable: implementation score
Access to finance 0.58* 0.66* 0.37 0.48 1.93*** 1.94*** (1.66) (1.82) (0.96) (1.19) (4.48) (4.14) Financial services 1.67*** 1.67*** 1.53*** 1.54*** 2.06** 2.05** (6.27) (6.29) (5.26) (5.36) (2.02) (2.10) Housing market -0.29 -0.25 -0.27 -0.22 0.14 0.09 (0.72) (0.61) (0.55) (0.45) (0.25) (0.17) Private indebtedness -0.38 -0.29 -0.22 -0.10 -1.67*** -1.68*** (0.82) (0.64) (0.46) (0.21) (3.75) (3.83) Active labour market policies 0.15 0.18 0.14 0.19 0.17 0.16 (0.80) (0.97) (0.52) (0.70) (0.54) (0.48) Employment protection legislation and framework for labour contracts
-0.47 -0.45 -0.12 -0.13 -1.64** -1.55**
(1.24) (1.16) (0.28) (0.29) (2.15) (2.02) Incentives to work; job creation; labour market participation
0.27* 0.27* 0.15 0.14 0.65*** 0.63***
(1.92) (1.90) (0.76) (0.71) (2.70) (2.63) Unemployment benefits -0.37 -0.39 -0.69 -0.83 -0.40 -0.54 (0.76) (0.77) (0.94) (1.10) (0.94) (1.19) Wages and wage-setting -0.40 -0.45 -0.21 -0.29 -1.24 -1.32 (1.41) (1.57) (0.74) (0.98) (1.50) (1.59) Business environment -0.01 -0.02 -0.09 -0.08 0.26 0.41 (0.05) (0.07) (0.29) (0.26) (0.84) (1.35) Civil justice -0.13 -0.10 -0.15 -0.10 0.25 0.31 (0.63) (0.47) (0.64) (0.45) (0.51) (0.65) Insolvency framework 0.47 0.44 0.39 0.34 0.72 0.59 (1.35) (1.25) (0.95) (0.84) (1.13) (0.93) Public administration -0.15 -0.16 -0.13 -0.13 -0.22 -0.18 (0.88) (0.90) (0.52) (0.50) (0.76) (0.62) Shadow economy and corruption -0.02 0.01 -0.05 -0.03 0.13 0.15 (0.06) (0.04) (0.15) (0.08) (0.28) (0.34) State-owned enterprises -0.06 -0.07 -0.37 -0.36 2.29* 2.41* (0.18) (0.19) (1.16) (1.13) (1.73) (1.86) Broaden the tax bases -1.71*** -1.68*** -1.42*** -1.38*** -2.25*** -2.24*** (6.67) (6.54) (3.97) (3.77) (4.99) (5.08) Fight against tax evasion; improve tax administration & tackle tax avoidance
0.45** 0.44** 0.16 0.13 1.04*** 1.06***
(2.23) (2.14) (0.56) (0.46) (3.27) (3.33) Fiscal policy and fiscal governance -0.05 -0.07 0.06 0.04 -0.26 -0.19 (0.24) (0.33) (0.29) (0.17) (0.48) (0.35) Long-term sustainability of public finances; including pensions
-1.13*** -1.12*** -0.62** -0.64** -1.63*** -1.56***
(5.34) (5.35) (2.28) (2.35) (4.23) (4.13) Reduce the debt bias -1.30* -1.27* -1.33* -1.31 -1.11*** -1.34*** (1.80) (1.71) (1.67) (1.59) (2.79) (3.47) Reduce the tax burden on labour 0.28 0.26 0.04 -0.03 1.10** 0.98* (1.11) (1.00) (0.14) (0.12) (2.15) (1.89) Childcare 0.40 0.40 0.33 0.45 0.37 0.48 (1.24) (1.26) (0.54) (0.72) (0.95) (1.17) Education -0.02 -0.04 0.06 0.05 -0.05 -0.07

11
(0.11) (0.22) (0.30) (0.22) (0.18) (0.25) Health and long-term care 0.54** 0.52** 0.21 0.25 1.01*** 0.98*** (2.46) (2.39) (0.70) (0.83) (2.75) (2.73) Poverty reduction and social inclusion
-0.34* -0.34** -0.43* -0.44* -0.18 -0.18
(1.94) (1.99) (1.82) (1.89) (0.63) (0.62) Skills and life-long learning 0.32** 0.32** 0.13 0.10 0.75*** 0.78*** (2.02) (2.06) (0.57) (0.44) (3.35) (3.36) Competition and regulatory framework
-0.38 -0.37 -0.46 -0.45 -0.32 -0.42
(1.09) (1.04) (1.22) (1.17) (0.31) (0.40) Competition in services -1.13*** -1.14*** -1.18*** -1.22*** -1.06** -1.07** (4.44) (4.54) (3.54) (3.77) (2.40) (2.39) Energy; resources and climate change
0.50** 0.49** 0.34 0.30 0.95*** 0.92***
(2.25) (2.21) (1.11) (0.98) (3.23) (3.12) Research and innovation -0.13 -0.09 -0.35 -0.37 0.10 0.11 (0.65) (0.45) (1.32) (1.27) (0.35) (0.36) Telecom; postal services and local public services
-0.77** -0.70* -1.12** -1.09** 0.24 0.15
(2.07) (1.95) (2.26) (2.26) (0.40) (0.26) Transport -0.57** -0.54** -0.07 -0.02 -1.20*** -1.18*** (2.36) (2.20) (0.23) (0.05) (3.42) (3.31) Pseudo R2 0.079 0.076 0.086 0.084 0.103 0.109 Observations 1816 1816 1102 1102 714 714 Absolute t statistics in parentheses Notes: Includes policy area dummies. Country-year clustered standard errors. 5Y CDS for Luxembourg and Malta are Bloomberg model estimates. * p < .1, ** p < .05, *** p < .01
12
For the separate regressions we ran for recommendations to countries under the MIP and to countries without macroeconomic imbalances (third to sixth columns of Table 1), the results reported above remain broadly unchanged with three notable exceptions. First, among countries in the no-imbalances category, the coefficient on the general government balance switches sign and becomes positive, whereas among the MIP countries the finding that higher deficits led to better implementation of recommendations remains negative and is strongly statistically significant. Second, also among the MIP countries, implementation slowed during election years. Third, the coefficient on the 5-year CDS spread is statistically significant and positive for the no-imbalance category sample.
Overall, these results suggest that predicting the likelihood of reforms is a difficult exercise. In fact, the model’s pseudo R-squared is only 8 percent and on average a 1 percentage point (pp) reduction in the public deficit is only associated with a 2 pp or 3 pp decrease in the likelihood of making ‘some progress’ with a recommendation (Appendix E, Table 3). This is hardly surprising given that most of the variation is within countries and across recommendations while most of our explanatory variables vary only across countries. Of course, every recommendation has particular aspects that matter for policymakers when deciding to implement them. But these are very hard to capture or are downright unobservable, so the assumption is that they are random and logistically distributed. All that can be said is that these characteristics account to a great extent for countries’ decisions to implement reforms.
However, the model still indicates that economic fundamentals matter for the implementation of recommendations. Larger government and current account deficits, as well as market pressure, are associated with a greater likelihood of reform. Larger public and external deficits were either the root cause or the symptom of the European debt crisis, so member states that were vulnerable because of these fundamentals might have had little choice but to implement recommendations. However, when fiscal consolidation and external adjustment were complete, implementation rates dropped. This can be interpreted as the ‘crisis effect’. The same interpretation holds for the probability that the sovereign defaults, as the prospect of limited or no access to financial markets translated into greater pressure to address macroeconomic imbalances and structural issues.
The splitting of results based on the participation of countries in the MIP supports the existence of a competing effect of fiscal balances on implementation and a more nuanced view. The crisis effect, whereby large fiscal deficits constrain measures and promote implementation, is offset by a fiscal-space effect, where small fiscal deficits mean that fiscal expansion can support implementation in the short-term, for instance by compensating the losers from reforms. The former effect clearly dominates in countries that faced macroeconomic imbalances, whereas the latter effect manifests itself in those that were not.
On the contrary, the positions of countries over time in the MIP categorisation cannot explain the variation in implementation scores.
Finally, among the control variables, the likelihood of implementing recommendations increases with higher governance quality and more fragmented government coalitions and a lower number of recommendations received. In addition, the probability of implementation decreases in an election year in countries with macroeconomic imbalances.
Meanwhile, at the level of individual recommendations, measures relevant for the financial sector are significantly more likely to be implemented than other recommendations, whereas reforms to broaden the tax base, safeguard the sustainability of pension and health systems, and the services sector (business, professional services and retail) are less likely to be implemented. Differences between the aforementioned policy areas in the urgency of implementation, the political and distributional costs involved, the time required to design and agree these reforms among stakeholders, can account for these results.
In the next section, we perform a number of robustness checks that broadly confirm these results.
13
4.2. Robustness checks The results of the main specifications are generally robust to alternative specifications. However, some notable differences in results emerge as regards the statistical significance of the coefficients. This section summarises these results, which can be found in full in Appendix E.
First, the effect of including country effects is that nearly all statistically significant results reported in the previous section vanish. The addition of 26 dummies on top of the variables of the baseline equation clearly strains the exercise. The inclusion of time dummies on top of country effects accentuates this problem. On the contrary, the inclusion only of time effects barely changes the main results. In the first specification the election year dummy and in the second the excessive imbalance category dummy become statistically significant, but only at the 90 percent confidence level.
Second, specifying a heteroscedasticity equation has the opposite effect, increasing the number of statistical significant coefficients. In addition to the results reported in the previous section, statistically significant variables include expected real GDP growth (positive effect), elections (negative effect) and the imbalances and excessive imbalances categories (positive effect). However, the null hypothesis that the difference in implementation between these two MIP categories is zero is still not rejected.
Finally, the inclusion of the lagged score corroborates the persistent character of implementation but does not lead to substantial changes to the results. The only exception is the positive effect of categorisation in excessive imbalances in one of the specifications, but still, it is an effect that is statistically significant relative to the ‘no imbalances’ category only at the 10 percent level and not statistically significant relative to the ‘imbalances’ category.
In conclusion, the robustness checks generally corroborate the main results. In a few specifications, we find a statistically significantly differential of categorisation in excessive imbalances compared to no imbalances, but only at lower confidence levels. In addition, we find no evidence of a statistically significant implementation differential between the excessive imbalances and the imbalances categories.
5. Conclusion We used a newly compiled dataset on European Semester recommendations to identify what drives their implementation by member states. We focused on the recommendations given to prevent and correct macroeconomic imbalances or to address structural issues and abstracted from fiscal surveillance at the European level. We noted two facts from the data. First, implementation has worsened during a period when the economic environment has improved and market pressure on sovereigns has subsided. Second, the deterioration was driven by the implementation record of countries designated in the excessive imbalances category of the MIP.
We therefore used ordered logistic regressions to evaluate three main hypotheses about what determines implementation at the country-level.
The first is that the implementation of recommendations depends on the economic situation of member states. We found that the size of the fiscal and current account deficits increased the likelihood of implementation. In relation to fiscal deficits, we interpreted this as a crisis effect, with worse fiscal fundamentals leaving little choice to countries but to enact the recommended reforms. However, for countries without macroeconomic imbalances, this crisis effect is less important and smaller deficits are more likely to facilitate the implementation of reforms.
The second hypothesis is that financial market pressure drives implementation rates. Financial market pressure plays a role: when sovereigns are closer to default, the chance of implementing recommendations increases. The result is, however, sensitive to the choice of the measure of market pressure.

14
The third hypothesis is that progress depends on the degree to which European institutions can monitor implementation and sanction countries in case of non-compliance. The bulk of the evidence presented does not support this hypothesis. We found no evidence of an incremental positive effect on implementation from a country being placed in the stricter MIP categories. We found a statistically significant differential in implementation between the excessive imbalances and the no imbalances categories only in a few specifications, and even then the confidence level was weak compared to other results.
Beyond testing the main hypotheses, we found that the probability of implementing recommendations increases with the quality of governance and the fragmentation of government coalitions, and decreases relative to the number of recommendations received. Moreover, for countries in the MIP, implementation slowed down during election years. Finally, recommendations on financial services have a much higher chance of being implemented. In contrast, the least progress was made on recommendations about the broadening of tax bases, the long-term sustainability of public finances and pensions systems, and competition in services.
The overall message is that pinning down the determinants of countries’ decision to reform is a difficult exercise. The empirical model can only explain a fraction of the variation. The most robust determinant we could find was the economic fundamentals. Put simply: good recommendations might be a precious input to national policymakers, but reforms will really only be implemented when the time is right politically or the risks are high.
15
6. References Agnello, L., V. Castro, J. T. Jalles and R. Sousa (2015) ‘What determines the likelihood of structural reforms?’ European Journal of Political Economy 37: 129-145
Alesina, A. and A. Drazen (1991) ‘Why are Stabilizations Delayed?’ The American Economic Review 81(5): 1170-1188
Bonfiglioli, A. and G. Gancia (2013) ‘Uncertainty, Electoral Incentives and Political Myopia’, The Economic Journal 123 (May): 373-100
Bonfiglioli, A. and G. Gancia (2016) ‘Economic Uncertainty and Structural Reforms’, Economics Working Papers 1494, Department of Economics and Business, Universitat Pompeu Fabra
Bricongne, J. and A. Turrini (2017) ‘The EU Macroeconomic Imbalance Procedure: Some impact and no sanctions‘, VoxEU, 22 June
Cruz, C., P. Keefer and C. Scartascini (2018) ‘Database of Political Institutions 2017 (DPI2017)’, Inter-American Development Bank, Numbers for Development, available at https://mydata.iadb.org/Reform-Modernization-of-the-State/Database-of-Political-Institutions-2017/938i-s2bw
Da Silva, Α., A. Givone and D. Sondermann (2017) ‘When do countries implement structural reforms?’ Working Paper Series 2078, European Central Bank
Darvas, Z. and Á. Leandro (2015) ‘The Limitations of Policy Coordination in the Euro Area under the European Semester’, Policy Contribution 2015/19, Bruegel
Darvas, Z. and Á. Leandro (2016) ‘Implementation of European Semester recommendations worsens further’, Bruegel Blog, 15 June
Deroose, S. and J. Griesse (2014) ‘Implementing economic reforms – are EU Member States responding to European Semester recommendations?’ ECFIN Economic Brief, Issue 37/October
Drazen, A. and V. Grilli (1993) ‘The Benefit of Crises for Economic Reforms’, The American Economic Review 83(3): 598-607
Drazen, A. and W. Easterly (2001) ‘Do Crises Induce Reform? Simple Empirical Tests of Conventional Wisdom’, Economics and Politics 13(2): 129-158
Duval, R. and J. Elmeskov (2006) ‘The Effects of EMU on Structural Reforms in Labour and Product Markets’, Working Paper Series 596, European Central Bank
Efstathiou, Κ. and G.B. Wolff (2018) ‘Is the European Semester effective and useful?’ Policy Contribution 2018/09, Bruegel
European Commission (2016) ‘The Macroeconomic Imbalance Procedure – Rationale, Process, Application: A Compendium’, Institutional Paper 039
European Court of Auditors (2018) ‘Audit of the Macroeconomic Imbalance Procedure (MIP)’, Special Report 03/2018
Fernandez, R. and D. Rodrik (1991) ‘Resistance to Reform: Status Quo Bias in the Presence of Individual-Specific Uncertainty’, The American Economic Review 81(5): 1146-1155
Høj, J., V. Galasso, G. Nicoletti and T. Dang (2006) ‘The Political Economy of Structural Reform: Empirical Evidence from OECD Countries’, OECD Economics Department Working Papers, No. 501, OECD

16
Kaufmann, D., A. Kraay and M. Mastruzzi (2010) ‘The Worldwide Governance Indicators: Methodology and Analytical Issues’, World Bank Policy Research Working Paper No. 5430
Williams, R. (2010) ‘Fitting heterogeneous models with oglm’, The Stata Journal, 10, Number 4: 540-567
Yatchew, A. and Z. Griliches (1985) ‘Specification Error in Probit Models’, The Review of Economics and Statistics 67(1): 134-139
17
Appendix A: Description of implementation scores used by the European Commission No progress: The member state has not credibly announced nor adopted any measures to address the CSR. Below are a number of non-exhaustive typical situations that could be covered under this, to be interpreted on a case-by-case basis taking into account country-specific conditions:
• No legal, administrative, or budgetary measures have been announced in the National Reform Programme or in other official communication to the national parliament/relevant parliamentary committees, the European Commission, or announced in public (eg in a press statement, information on government's website);
• No non-legislative acts have been presented by the governing or legislator body; • The member state has taken initial steps in addressing the CSR, such as commissioning a study or
setting up a study group to analyse possible measures that would need to be taken (unless the CSR explicitly asks for orientations or exploratory actions), while clearly-specified measure(s) to address the CSR has not been proposed.
Limited progress: The member state has:
• Announced certain measures but these only address the CSR to a limited extent;
and/or
• Presented legislative acts in the governing or legislator body but these have not been adopted yet and substantial non-legislative further work is needed before the CSR will be implemented;
• Presented non-legislative acts, yet with no further follow-up in terms of implementation which is needed to address the CSR.
Some progress: The member state has adopted measures that partly address the CSR
and/or
• The member state has adopted measures that address the CSR, but a fair amount of work is still needed to fully address the CSR as only a few of the adopted measures have been implemented. For instance: adopted by national parliament; by ministerial decision; but no implementing decisions are in place.
Substantial progress: The member state has adopted measures that go a long way in addressing the CSR and most of which have been implemented.
Full implementation: The member state has implemented all measures needed to address the CSR appropriately.
Source: Country Reports.

18
Appendix B: List of policy areas Policy area Broad policy area Fiscal policy and fiscal governance Public finances and taxation Long-term sustainability of public finances, including pensions Public finances and taxation Reduce the tax burden on labour Public finances and taxation Broaden the tax bases Public finances and taxation Reduce the debt bias Public finances and taxation Fight against tax evasion, improve tax administration & tackle tax avoidance Public finances and taxation Financial services Financial sector Housing market Financial sector Access to finance Financial sector Private indebtedness Financial sector Employment protection legislation and framework for labour contracts Labour market Unemployment benefits Labour market Active labour market policies Labour market Incentives to work, job creation, labour market participation Labour market Wages and wage-setting Labour market Childcare Social inclusion and education Health and long-term care Social inclusion and education Poverty reduction and social inclusion Social inclusion and education Education Social inclusion and education Skills and life-long learning Social inclusion and education Research and innovation Structural policies Competition and regulatory framework Structural policies Competition in services Structural policies Telecom, postal services and local public services Structural policies Energy, resources and climate change Structural policies Transport Structural policies
Business environment Public administration and business environment
Insolvency framework Public administration and business environment
Public administration Public administration and business environment
State-owned enterprises Public administration and business environment
Civil justice Public administration and business environment
Shadow economy and corruption Public administration and business environment

19
Appendix C: Description and sources of variables Variable Description Source
Dependent variable: implementation score
Categorical variable; 0 = no progress; 1 = limited progress; 2 = some progress; 3 = substantial progress; 4 = fully addressed European Commission Country Reports
Imbalances Dummy variable; 1 = country classified in the "imbalances" category, 0 = otherwise European Commission In-depth reviews
Excessive imbalances Dummy variable; 1 = country classified in the "excessive imbalances" category, 0 = otherwise European Commision In-depth reviews
General government net lending (% of GDP) [lagged]
AMECO code UBLG. The lagged value (for year t) corresponds to the value for year t-1 appearing in the European Commission forecast published in the spring of year t.
AMECO
Current account balance (% of GDP) [lagged]
AMECO code UBCA. The lagged value (for year t) corresponds to the value for year t-1 appearing in the European Commission forecast published in the spring of year t. The current account series for Croatia in the 2018 forecast contained several missing values so for 2017 we used the value from the 2017 forecast.
AMECO
Real GDP growth (%) [lagged] AMECO code OVGD. The lagged value (for year t) corresponds to the value for year t-1 appearing in the European Commission forecast published in the spring of year t.
AMECO
Expected real GDP growth 5 years out (%) [lagged]
Real GDP growth forecast for year t+5. World Economic Outlook
1Y sovereign default probability (%) [(Jan-May)]
Probability of sovereign default inferred from empirical model with inputs being: GDP growth, Economist Intelligence Unit Political Risk Score and non-performing bank loans ratio for all countries; government surplus and refinancing ability for those countries issuing debt only in their own currency (in our sample all euro area countries, Denmark, Sweden and the UK); reserves to external debt for all other countries.
Bloomberg
5Y CDS spread (bps) [(Jan-May)]
Average of daily closing price, January to May Bloomberg
Election year Dummy variable; 1 = if legislative (also presidential for Cyprus, France, Lithuania and Poland) elections held, 0 = otherwise. We update this variable into 2018 and in some instances correct its values.
Database of Political Institutions 2017
Average of World Governance Indicators estimates
Average of six governance indicators: voice and accountability, political stability and absence of violence/terrorism, government effectiveness, regulatory quality, rule of law, control of corruption. These indicators are capturing perceptions and measure countries' relative performance, not absolute levels. Each indicator is a continuous variable ranging from -2.5 to 2.5. We use 2017 values for 2018 (not available).
World Bank
Herfindahl Index of Government Parties
Defined as ∑ 𝑠𝑠𝑖𝑖2𝑁𝑁𝑖𝑖=1 , where 𝑠𝑠𝑖𝑖 is the ratio of parliament seats of party 𝑖𝑖 to the total seats of the government majority in
parliament and 𝑁𝑁 is the number of parties in government. We update this variable into 2018 and in some instances correct its values.
Database of Political Institutions 2017
Number of subparts Total number of recommendations per country (in a given year). Country-specific recommendations

20
Appendix D: Summary of models and assumptions
Baseline Time fixed effects (FE) Country fixed effects (FE) Country and time FE Baseline with heteroskedasticity Equation 𝑦𝑦𝑖𝑖,𝑡𝑡,𝑗𝑗
∗ = 𝑧𝑧𝑖𝑖,𝑡𝑡,𝑗𝑗′𝛾𝛾 + 𝜀𝜀𝑖𝑖,𝑡𝑡,𝑗𝑗
𝑦𝑦𝑖𝑖,𝑡𝑡,𝑗𝑗∗ = 𝜈𝜈𝑡𝑡 + 𝑧𝑧𝑖𝑖,𝑡𝑡,𝑗𝑗
′𝛾𝛾 + 𝜀𝜀𝑖𝑖,𝑡𝑡,𝑗𝑗
𝑦𝑦𝑖𝑖,𝑡𝑡,𝑗𝑗∗ = 𝛼𝛼𝑖𝑖 + 𝑧𝑧𝑖𝑖,𝑡𝑡,𝑗𝑗
′𝛾𝛾 + 𝜀𝜀𝑖𝑖,𝑡𝑡,𝑗𝑗 𝑦𝑦𝑖𝑖,𝑡𝑡,𝑗𝑗∗ = 𝛼𝛼𝑖𝑖 + 𝜈𝜈𝑡𝑡 + 𝑧𝑧𝑖𝑖,𝑡𝑡,𝑗𝑗
′𝛾𝛾 + 𝜀𝜀𝑖𝑖,𝑡𝑡,𝑗𝑗
𝑦𝑦𝑖𝑖,𝑡𝑡,𝑗𝑗∗ = 𝑧𝑧𝑖𝑖,𝑡𝑡,𝑗𝑗
′𝛾𝛾 + 𝜀𝜀𝑖𝑖,𝑡𝑡,𝑗𝑗
Error assumptions 𝜀𝜀~𝑙𝑙𝑠𝑠𝑝𝑝𝑖𝑖𝑠𝑠𝑡𝑡𝑖𝑖𝑙𝑙(0,1) 𝜀𝜀~𝑙𝑙𝑠𝑠𝑝𝑝𝑖𝑖𝑠𝑠𝑡𝑡𝑖𝑖𝑙𝑙(0,1)
𝜀𝜀~𝑙𝑙𝑠𝑠𝑝𝑝𝑖𝑖𝑠𝑠𝑡𝑡𝑖𝑖𝑙𝑙(0,1) 𝜀𝜀~𝑙𝑙𝑠𝑠𝑝𝑝𝑖𝑖𝑠𝑠𝑡𝑡𝑖𝑖𝑙𝑙(0,1)
𝜀𝜀𝑖𝑖,𝑡𝑡,𝑗𝑗~𝑙𝑙𝑠𝑠𝑝𝑝𝑖𝑖𝑠𝑠𝑡𝑡𝑖𝑖𝑙𝑙(0, exp (𝜂𝜂𝑖𝑖 + 1𝑖𝑖,𝑡𝑡,𝑗𝑗[𝑝𝑝=𝑝𝑝0]′𝜃𝜃))

21
Appendix E: Additional results Table 3: Ordered logistic regression marginal effects All All MIP MIP non MIP non MIP Imbalances 0.04 0.03 (1.42) (1.37) Excessive imbalances 0.04 0.05 -0.01 0.02 (1.09) (1.57) (0.36) (0.63) Real GDP growth (%) [lagged] 0.00 0.00 0.01 -0.00 -0.01 -0.02 (0.62) (0.32) (0.61) (0.07) (0.59) (1.28) Expected real GDP growth 5 years out (%) 0.02 0.01 0.01 -0.00 0.01 -0.00 (1.06) (0.37) (0.55) (0.18) (0.72) (0.23) General government net lending (% of GDP) [lagged] -0.02*** -0.03*** -0.03*** -0.03*** 0.01 0.02 (6.18) (7.08) (7.63) (8.45) (1.26) (1.46) Current account balance (% of GDP) [lagged] -0.01*** -0.01*** -0.01 -0.01 -0.02** -0.02*** (2.60) (2.64) (1.61) (1.46) (2.35) (2.93) 1Y sovereign default probability (%) [(Jan-May)] 0.01*** 0.01*** 0.04** (3.07) (2.64) (2.18) 5Y CDS spread (bps) [(Jan-May)] -0.00 -0.00 0.00*** (0.04) (1.41) (4.04) Election year -0.03* -0.03 -0.05*** -0.04* -0.01 -0.02 (1.66) (1.33) (2.60) (1.85) (0.21) (0.67) Average of World Governance Indicators estimates 0.13*** 0.10*** 0.09*** 0.05* 0.14** 0.20*** (4.14) (3.26) (2.86) (1.80) (2.25) (3.33) Herfindahl Index of Government Parties -0.08** -0.09** -0.04 -0.03 -0.06 -0.04 (2.13) (2.44) (0.66) (0.50) (0.87) (0.75) Number of subparts -0.00** -0.00* -0.00** -0.00* -0.00 -0.01** (2.54) (1.80) (2.45) (1.93) (1.40) (2.38) Pseudo R2 Observations 1816 1816 1102 1102 714 714 Absolute t statistics in parentheses Notes: Includes policy area dummies. Country-year clustered standard errors. 5Y CDS for Luxembourg and Malta are Bloomberg model estimates. * p < .1, ** p < .05, *** p < .01

22
Table 4: Ordered logistic regression results, fixed effects Time effects Time effects Country effects Country effects Both effects Both effects Dependent variable: implementation score Imbalances 0.26 0.25 0.14 0.02 0.17 0.06 (1.54) (1.49) (0.60) (0.09) (0.73) (0.24) Excessive imbalances 0.29 0.41* 0.55 0.44 0.56 0.47 (1.15) (1.66) (1.60) (1.21) (1.64) (1.24) Real GDP growth (%) [lagged] 0.04 0.03 0.06 0.03 0.07 0.03 (0.70) (0.46) (1.01) (0.42) (1.09) (0.41) Expected real GDP growth 5 years out (%) 0.09 0.02 -0.09 -0.05 -0.10 -0.07 (0.74) (0.12) (0.33) (0.21) (0.38) (0.26) General government net lending (% of GDP) [lagged] -0.17*** -0.19*** -0.04 -0.10* -0.05 -0.10* (6.00) (6.66) (0.82) (1.67) (0.87) (1.77) Current account balance (% of GDP) [lagged] -0.05*** -0.06*** -0.02 -0.01 -0.02 -0.02 (2.74) (2.77) (0.34) (0.29) (0.34) (0.34) 1Y sovereign default probability (%) [(Jan-May)] 0.10*** 0.17*** 0.17*** (2.96) (2.77) (2.85) 5Y CDS spread (bps) [(Jan-May)] -0.00 -0.00 -0.00 (0.19) (0.11) (0.30) Election year -0.24* -0.20 -0.15 -0.13 -0.16 -0.13 (1.74) (1.41) (1.14) (0.93) (1.20) (0.97) Average of World Governance Indicators estimates 0.87*** 0.64*** (3.60) (2.79) Herfindahl Index of Government Parties -0.56** -0.64** -0.84* -0.96* -0.85* -0.98* (2.13) (2.37) (1.72) (1.87) (1.73) (1.88) Number of subparts -0.03** -0.03* -0.00 0.00 -0.01 -0.00 (2.46) (1.93) (0.46) (0.04) (0.43) (0.10) Pseudo R2 0.080 0.077 0.094 0.092 0.095 0.092 H0: Exc. imb. = imb. chi-sq. 0.01 0.63 2.51 2.25 2.16 1.95 H0: Exc. imb. = imb. p-value 0.91 0.43 0.11 0.13 0.14 0.16 Observations 1816 1816 1816 1816 1816 1816 Absolute t statistics in parentheses Notes: Includes policy area dummies. Country-year clustered standard errors. 5Y CDS for Luxembourg and Malta are Bloomberg model estimates. * p < .1, ** p < .05, *** p < .01

23
Table 5: Ordered logistic regression results, other specifications Heteroscedasticity
equation Heteroscedasticity equation
Lagged implementation score
Lagged implementation score
Dependent variable: implementation score Imbalances 0.18* 0.17* 0.22 0.20 (1.91) (1.86) (1.34) (1.21) Excessive imbalances 0.26* 0.32** 0.31 0.47* (1.94) (2.21) (1.27) (1.95) Country implementation score (0-100) [lagged] 0.02*** 0.03*** (3.31) (3.70) Real GDP growth (%) [lagged] 0.01 -0.00 0.05 0.02 (0.45) (0.13) (0.89) (0.43) Expected real GDP growth 5 years out (%) 0.16** 0.11* 0.16 0.08 (2.54) (1.87) (1.63) (0.74) General government net lending (% of GDP) [lagged]
-0.11*** -0.11*** -0.15*** -0.16***
(4.32) (4.51) (5.12) (5.61) Current account balance (% of GDP) [lagged] -0.04*** -0.04*** -0.04** -0.04* (3.15) (3.19) (2.00) (1.91) 1Y sovereign default probability (%) [(Jan-May)] 0.07*** 0.11*** (2.79) (3.29) 5Y CDS spread (bps) [(Jan-May)] 0.00 -0.00 (0.03) (0.61) Election year -0.20** -0.18** -0.15 -0.11 (2.48) (2.33) (1.07) (0.75) Average of World Governance Indicators estimates
0.76*** 0.57*** 1.00*** 0.68***
(4.30) (3.90) (4.56) (2.99) Herfindahl Index of Government Parties -0.34** -0.38** -0.43 -0.53* (2.17) (2.52) (1.58) (1.89) Number of subparts -0.02*** -0.02*** -0.02*** -0.02** (3.02) (2.74) (2.87) (2.08) Pseudo R2 0.118 0.116 0.087 0.084 H0: Exc. imb. = imb. chi-sq. 0.55 1.55 0.21 1.96 H0: Exc. imb. = imb. p-value 0.46 0.21 0.64 0.16

24
Observations 1816 1816 1746 1746 Absolute t statistics in parentheses Notes: Includes policy area dummies. Country-year clustered standard errors. 5Y CDS for Luxembourg and Malta are Bloomberg model estimates. In regressions (3) and (4) the lagged country implementation score for 2013 (i.e. the 2012 score) is caluclated at the CSR-level. * p < .1, ** p < .05, *** p < .01

25
Appendix F: Summary statistics Implementation scores, distribution
Implementation scores, distribution (by year)
12.9
39.3 39.4
7.0
1.3
010
2030
40Pe
rcen
t
No prog
ress
Limite
d prog
ress
Some p
rogres
s
Substa
ntial
progre
ss
Fully a
ddres
sed
Implementation score
13.5
37.8 36.6
9.7
2.5
14.5
33.8
41.2
8.3
2.2
13.2
39.1 40.3
6.6
0.8
11.9
41.8 41.4
4.98.5
45.542.7
3.3
13.2
48.8
33.7
4.4
050
050
0 1 2 3 4 0 1 2 3 4 0 1 2 3 4
2013 2014 2015
2016 2017 2018
Perc
ent
Implementation score (0 = no progress, 4 = fully addressed)
26
Implementation scores, distribution (by country)
18.2
36.442.4
3.08.8
50.0
35.3
5.914.6
45.836.5
3.115.2
52.2
23.9
8.717.5
37.5 41.3
3.815.6
54.4
26.7
2.2 1.1
5.9
41.247.1
5.9 6.1
28.6
55.1
10.25.3
35.145.6
12.31.8
22.7
56.8
20.512.0
35.046.0
7.0 2.210.9
69.6
15.22.2
13.4
51.2
28.0
6.11.2
26.6
40.4
27.7
4.3 1.111.7
18.3
60.0
6.7 3.3 7.8
45.136.3
9.81.0
6.2
43.1 41.5
7.71.5
29.2
52.1
16.7
2.1
5.5
37.0
50.7
6.8 5.4
27.0
54.1
10.82.7
20.028.9
37.8
11.12.2
21.0
39.532.1
7.412.7
25.3
57.0
2.5 2.514.4
53.8
26.9
2.9 1.9
23.532.4
41.2
2.910.2
28.635.7
16.39.2
14.5
54.2
30.1
1.2
020
4060
800
2040
6080
020
4060
800
2040
6080
020
4060
80
0 1 2 3 4 0 1 2 3 4 0 1 2 3 4
0 1 2 3 4 0 1 2 3 4 0 1 2 3 4
AT BE BG CY CZ DE
DK EE ES FI FR GB
HR HU IE IT LT LU
LV MT NL PL PT RO
SE SI SK
Perc
ent
Implementation score (0 = no progress, 4 = fully addressed)

27
Variable (country – year level) Mean Std. dev Min Max Real GDP growth (%) [lagged)] 2.00 1.92 -2.37 7.81 Expected real GDP growth 5 years out (%) 2.26 0.83 0.77 4.01 General government net lending (% of GDP) [lagged)] -2.00 2.34 -14.71 3.93 Current account balance (% of GDP) [lagged)] 1.95 3.89 -8.07 12.56 1Y sovereign default probability (%) [(Jan-May)] 1.10 1.94 0.01 11.30 5Y CDS spread (bps) [(Jan-May)] 80.19 70.43 9.56 316.41 Election year 0.28 0.45 0.00 1.00 Average of World Governance Indicators estimates 1.07 0.47 0.13 1.85 Herfindahl Index of Government Parties 0.64 0.26 0.19 1.00 Number of subparts 13.24 8.13 1.00 46.00 Observations 156
Policy areas Share Access to finance 0.02 Financial services 0.05 Housing market 0.02 Private indebtedness 0.02 Active labour market policies 0.07 Employment protection legislation and framework for labour contracts 0.02 Incentives to work; job creation; labour market participation 0.12 Unemployment benefits 0.01 Wages and wage-setting 0.03 Business environment 0.05 Civil justice 0.02 Insolvency framework 0.01 Public administration 0.07 Shadow economy and corruption 0.03 State-owned enterprises 0.03 Broaden the tax bases 0.04 Fight against tax evasion; improve tax administration & tackle tax avoidance 0.04 Fiscal policy and fiscal governance 0.08 Long-term sustainability of public finances; including pensions 0.09 Reduce the debt bias 0.01 Reduce the tax burden on labour 0.03 Childcare 0.02 Education 0.08 Health and long-term care 0.05 Poverty reduction and social inclusion 0.08 Skills and life-long learning 0.06 Competition and regulatory framework 0.03 Competition in services 0.04 Energy; resources and climate change 0.06 Research and innovation 0.04

28
Telecom; postal services and local public services 0.01 Transport 0.03 Observations 1901