Embed Size (px)
Citation preview
Florida State University Libraries
Faculty Publications The Department of Chemistry and Biochemistry
2014
Zn(II)-coordination modulated ligandphotophysical processes – the developmentof fluorescent indicators for imagingbiological Zn(II) ionsLei Zhu, Zhao Yuan, J. Simmons, and Kesavapillai Sreenath
Follow this and additional works at the FSU Digital Library. For more information, please contact [email protected]
1
Zn )) ‐coordinationmodulatedligandphotophysicalprocesses–thedevelopmentoffluorescentindicatorsforimagingbiologicalZn )) ionsLeiZhu,* ZhaoYuan,J.TylerSimmons,KesavapillaiSreenath
DepartmentofChemistryandBiochemistry,FloridaStateUniversity, 95Chieftan Way,Tallahassee,FL32306‐4390,UnitedStates
Abstract. Molecular photophysics and metal coordination chemistry are the two fundamental pillars that support the development of fluorescent cation indicators. In this article, we describe how Zn(II)‐coordination alters various ligand‐centered photophysical processes that are pertinent to developing Zn(II) indicators. The main aim is to show how small organic Zn(II) indicators work under the constraints of specific requirements, including Zn(II) detection range, photophysical requirements such as excitation energy and emission color, temporal and spatial resolutions in a heterogeneous intracellular environment, and fluorescence response selectivity between similar cations such as Zn(II) and Cd(II). In the last section, the biological questions that fluorescent Zn(II) indicators help to answer are described, which have been motivating and challenging this field of research.
1.Theimpactofthislineofresearch
1‐1.Theimpactonchemistry
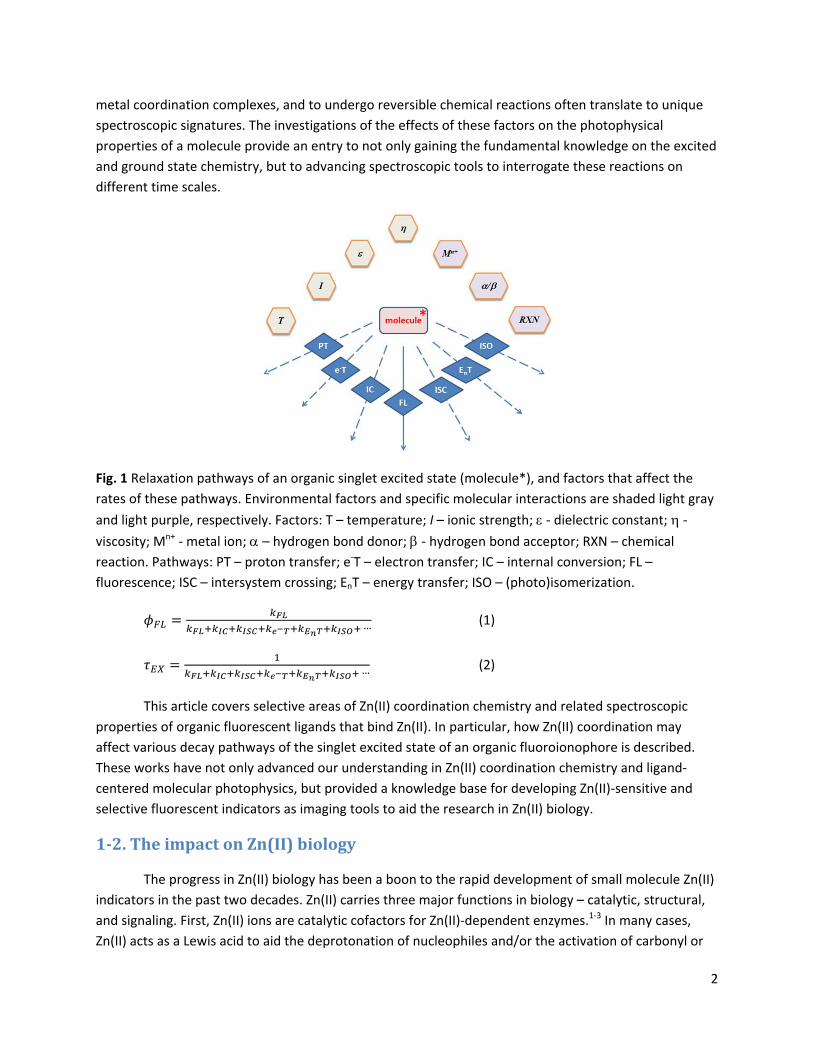
All molecules in the singlet excited state fluoresce, until non‐radiative decay pathways kinetically outcompete fluorescence emission. These pathways (Fig. 1) include internal conversion (IC), intersystem crossing (ISC), and photoisomerization, as well as inter‐ or intramolecular electron transfer, (e‐T), energy transfer (EnT), and proton transfer (PT). The fluorescence quantum yield (FL) and excited state lifetime (EX) of a fluorophore are functions of these processes, as shown in equations 1 and 2, respectively. The rates of these processes are sensitive to environmental factors and specific molecular interactions available to the fluorophore (Fig. 1). Temperature (T), ionic strength (I), dielectric constant (), and viscosity () are bulk environmental properties. The effects of these factors on the excited and ground state properties reveal the conformational and electronic structural information of a fluorophore. The specific abilities of a molecule to form hydrogen bond with solvent molecules, to form
2
metal coordination complexes, and to undergo reversible chemical reactions often translate to unique spectroscopic signatures. The investigations of the effects of these factors on the photophysical properties of a molecule provide an entry to not only gaining the fundamental knowledge on the excited and ground state chemistry, but to advancing spectroscopic tools to interrogate these reactions on different time scales.
Fig. 1 Relaxation pathways of an organic singlet excited state (molecule*), and factors that affect the rates of these pathways. Environmental factors and specific molecular interactions are shaded light gray and light purple, respectively. Factors: T – temperature; I – ionic strength; ‐ dielectric constant; ‐ viscosity; Mn+ ‐ metal ion; – hydrogen bond donor; ‐ hydrogen bond acceptor; RXN – chemical reaction. Pathways: PT – proton transfer; e‐T – electron transfer; IC – internal conversion; FL – fluorescence; ISC – intersystem crossing; EnT – energy transfer; ISO – (photo)isomerization.
∙∙∙ (1)
∙∙∙ (2)
This article covers selective areas of Zn(II) coordination chemistry and related spectroscopic properties of organic fluorescent ligands that bind Zn(II). In particular, how Zn(II) coordination may affect various decay pathways of the singlet excited state of an organic fluoroionophore is described. These works have not only advanced our understanding in Zn(II) coordination chemistry and ligand‐centered molecular photophysics, but provided a knowledge base for developing Zn(II)‐sensitive and selective fluorescent indicators as imaging tools to aid the research in Zn(II) biology.
1‐2.TheimpactonZn(II)biology
The progress in Zn(II) biology has been a boon to the rapid development of small molecule Zn(II) indicators in the past two decades. Zn(II) carries three major functions in biology – catalytic, structural, and signaling. First, Zn(II) ions are catalytic cofactors for Zn(II)‐dependent enzymes.1‐3 In many cases, Zn(II) acts as a Lewis acid to aid the deprotonation of nucleophiles and/or the activation of carbonyl or
3
phosphonyl electrophiles. Hydrolytic enzymes such as carbonic anhydrase,4 carboxypeptidase A (a Zn(II) protease),5 and alkaline phosphatase (a Zn(II) nuclease)6,7 require Zn(II) ions in their catalytic pockets to activate and deliver a nucleophilic water to the electrophilic CO2, carbonyl, and phosphonyl, respectively. The alcohol binding of Zn(II) and subsequent formation of Zn(II) alkoxide precede the delivery of a hydride to the NAD+ in alcohol dehydrogenases.8‐11 In Class II aldolase, Zn(II) acts as a Lewis acid to facilitate the formation of an enolate from 2‐hydroxyketone.
The action of a Zn(II) ion held in a multidentate binding pocket of an enzyme on a substrate changes the electronic structure of the substrate, which could be interrogated via spectroscopic means. For example, the drop of C=O stretching frequency when a carbonyl binds Zn(II) can be detected by infrared spectroscopy. This line of thinking is reflected in designing a fluorescent indicator, which is a combination of a multidentate Zn(II)‐binding ligand and a “substrate”, whose electronic structure is sensitive to the interaction with Zn(II), and can be easily interrogated by a spectroscopic means – fluorescence.
Second, Zn(II) ions carry structural functions in holding proteins together. For example, Zn(II) finger proteins are key components in many transcription factors.12,13 Insulin is stored in a hexameric form held together via Zn(II) binding, which upon dissociative secretion affords monomers that has the hormonal activity.14 The structural functions of Zn(II) are also implicated in pathology, in particular that of the Alzheimer’s. It is suggested that Cu(II) and Zn(II) drive the formation of amyloid‐ plagues that are found in the brains of Alzheimer’s patients.15
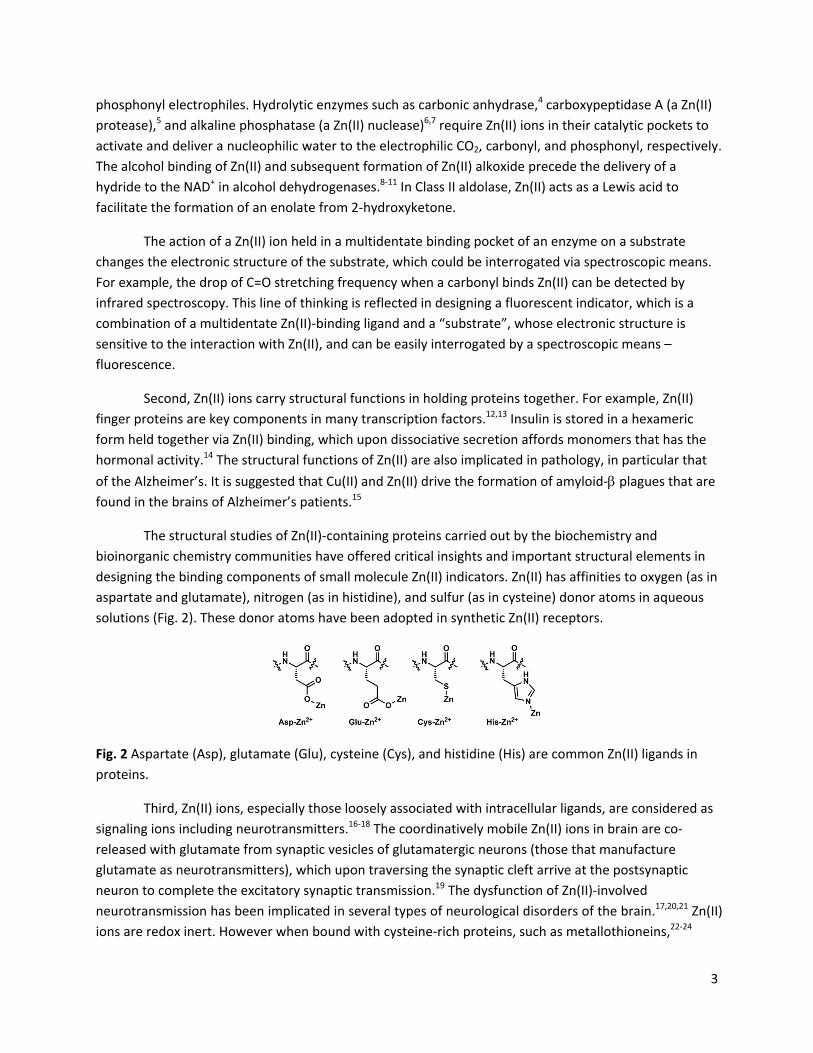
The structural studies of Zn(II)‐containing proteins carried out by the biochemistry and bioinorganic chemistry communities have offered critical insights and important structural elements in designing the binding components of small molecule Zn(II) indicators. Zn(II) has affinities to oxygen (as in aspartate and glutamate), nitrogen (as in histidine), and sulfur (as in cysteine) donor atoms in aqueous solutions (Fig. 2). These donor atoms have been adopted in synthetic Zn(II) receptors.
Fig. 2 Aspartate (Asp), glutamate (Glu), cysteine (Cys), and histidine (His) are common Zn(II) ligands in proteins.
Third, Zn(II) ions, especially those loosely associated with intracellular ligands, are considered as signaling ions including neurotransmitters.16‐18 The coordinatively mobile Zn(II) ions in brain are co‐released with glutamate from synaptic vesicles of glutamatergic neurons (those that manufacture glutamate as neurotransmitters), which upon traversing the synaptic cleft arrive at the postsynaptic neuron to complete the excitatory synaptic transmission.19 The dysfunction of Zn(II)‐involved neurotransmission has been implicated in several types of neurological disorders of the brain.17,20,21 Zn(II) ions are redox inert. However when bound with cysteine‐rich proteins, such as metallothioneins,22‐24

4
Zn(II) may provide molecular signals for intracellular redox potentials. When Zn(II)‐bound cysteine residues are oxidized to form disulfide bonds, Zn(II) ions are released to result in an increase of local Zn(II) concentrations. Such oxidation‐effected Zn(II) release may be linked to the formation of protein aggregates, which are significant in neurodegenerative diseases such as Alzheimer’s and Parkinson’s.
Fig. 3 A model of Zn(II) homeostasis, and the disruption of which in a lysosome. See descriptions in the text. ROS: reactive oxygen species.
Zn(II) homeostasis in mammalian cells and its dysfunction is illustrated in Fig. 3, using lysosomal Zn(II) as an arbitrary example. Intracellular Zn(II) concentration and distribution are tightly regulated by three classes of proteins – Zn(II) buffers, transporters, and sensors. The cysteine‐rich metallothioneins (MTs) are Zn(II) buffers,25‐27 by which the Zn(II) concentration is controlled via the equilibrium between Zn(II)‐bound MTs and the apo forms (left in Fig. 3). Zn(II) transporter proteins ZnT reduce the cytosolic Zn(II) concentration by sequestering Zn(II) into intracellular organelles or extracellular space.28,29 Another type of Zn(II) transporters, ZIP proteins, mobilizes Zn(II) ions in the opposite direction to increase the cytosolic Zn(II) concentration. The fluctuations of “free” Zn(II) ions, which are loosely defined as those available for pickup by other Zn(II)‐dependent proteins, are communicated to Zn(II) sensor proteins.30‐32 Depending on how far the free Zn(II) concentrations drift away from the homeostatic balance, the sensor proteins act upon transcription factors that lead to the expression of various Zn(II) transporters and/or metallothioneins.33
The activity fluctuations of any of the three classes of proteins (buffers, transporters, and sensors) affect Zn(II) homeostasis. For example, if lysosomes are subjected to oxidative stress (e.g., a sudden influx of hydrogen peroxide), the cysteine residues in Zn(II)‐bound MTs are oxidized to disulfides with release of Zn(II) ions.24 The rapid accumulation of un‐ or weakly ligated Zn(II) ions may (a) activate various Zn(II)‐dependent proteins, (b) displace other essential trace metals, such as Cu(II), from proteins, or (c) induce membrane disintegration, possibly a downstream consequence of over‐activation of certain enzymes.34 Lysosomal membrane disintegration leads to the release of toxic levels of hydrolytic

5
enzymes21 to ultimately result in cell death. This process is called lysosomal membrane permeabilization (LMP).35 Zn(II) ions, therefore, appear to be a link between oxidative stress and LMP,36 which raises interest in developing fluorescent indicators to correlate lysosomal Zn(II) concentrations to the levels of oxidative stress and downstream markers for LMP.37
The homeostasis of lysosomal Zn(II) highlights the fact that Zn(II) distribution, availability, and dynamics33 in living cells sensitively affect Zn(II) protein functions and signaling events, as well as other aspects of physiological functions that are intimately related to the well‐being of an organism. To put Zn(II) ions under surveillance in a living specimen, the more traditional methods such as Timm staining or X‐ray fluorescence are not suitable, because they require fixed specimens that are metabolically inactive, and they give the information of total Zn(II) distribution, rather than the “free” Zn(II) ions that are participating in dynamic processes. The free Zn(II) ions are also called “mobile”, “chelatable”, “rapidly exchangeable”, and “loosely bound”, with various degrees of thermodynamic and kinetic connotations. They are distinguished from the Zn(II) ions tightly bound with proteins. As mentioned earlier, these “free” Zn(II) ions are in this article simply considered to be available for redistribution in living systems; and they are the targets to light up under the fluorescence microscopes, upon binding to Zn(II)‐selective fluorescent indicators.
2.Scopeandorganizationofthisarticle
In the article, the discussion is limited to organic fluoroionophores for Zn(II) ions. These compounds are often referred as small molecule organic indicators as opposed to synthetic polymeric or biomolecular (e.g., protein‐ or nucleic acid‐based) indicators. Given the facts that Zn(II) itself is not redox active, and has no spectroscopic signature in the UV/VIS region, the photophysical properties discussed herein are solely organic ligand‐based, singlet state processes. In addition to small organic indicators, the systems that are based upon metal‐centered luminescence,38‐40 protein‐41‐45 or protein‐organic hybrid structures,46‐49 and polymeric constructs50 have contributed significantly to the advances of Zn(II) sensing/imaging technologies. A few review articles on phosphorescence51 and protein‐based Zn(II) indicators52‐54 are listed in the reference section for the interested readers to explore.
There are four primary sections (3‐6) in this article. Section 3 provides an introduction to excited state processes that are sensitive to environmental factors, including the presence of Zn(II) ions. Simple experiments for characterizing these processes, and for differentiating one from another are listed. Section 4 focuses on Zn(II) coordination chemistry, and is organized by the denticity of the Zn(II) ligands. Zn(II) coordination thermodynamics and kinetics are included, followed by a subsection on the metal ion selectivity of Zn(II) ligands. Selective Zn(II) indicators that have been published in chemistry literature are used as examples in Section 4. Section 5 includes a brief introduction of fluorescence microscopy, and the recent developments of Zn(II) indicators with defined subcellular targets. In Section 6, applications of Zn(II) indicators in cell biology and neurobiology, which are published in primarily biological journals, are described. The biological problems that Zn(II) indicators may help solve are the focus of this section. The last, summary section points out a couple of challenges in Zn(II) indicator development, and updates on a wish list for the future Zn(II) indicators.
6
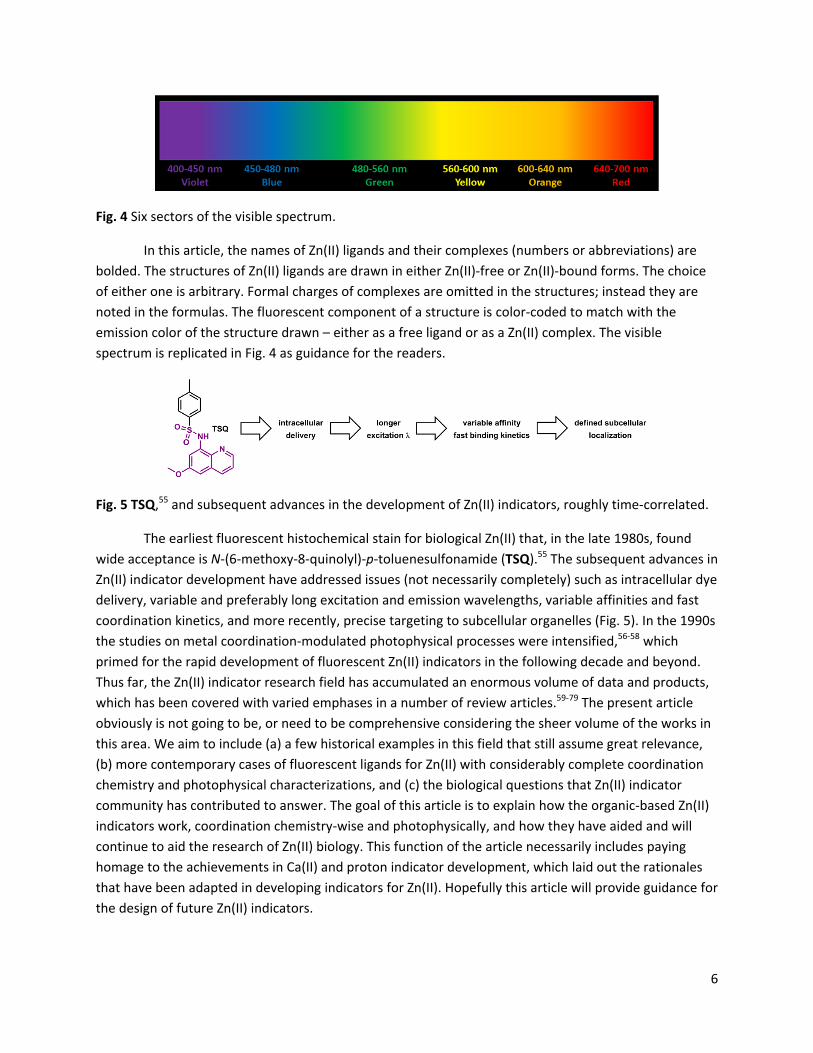
Fig. 4 Six sectors of the visible spectrum.
In this article, the names of Zn(II) ligands and their complexes (numbers or abbreviations) are bolded. The structures of Zn(II) ligands are drawn in either Zn(II)‐free or Zn(II)‐bound forms. The choice of either one is arbitrary. Formal charges of complexes are omitted in the structures; instead they are noted in the formulas. The fluorescent component of a structure is color‐coded to match with the emission color of the structure drawn – either as a free ligand or as a Zn(II) complex. The visible spectrum is replicated in Fig. 4 as guidance for the readers.
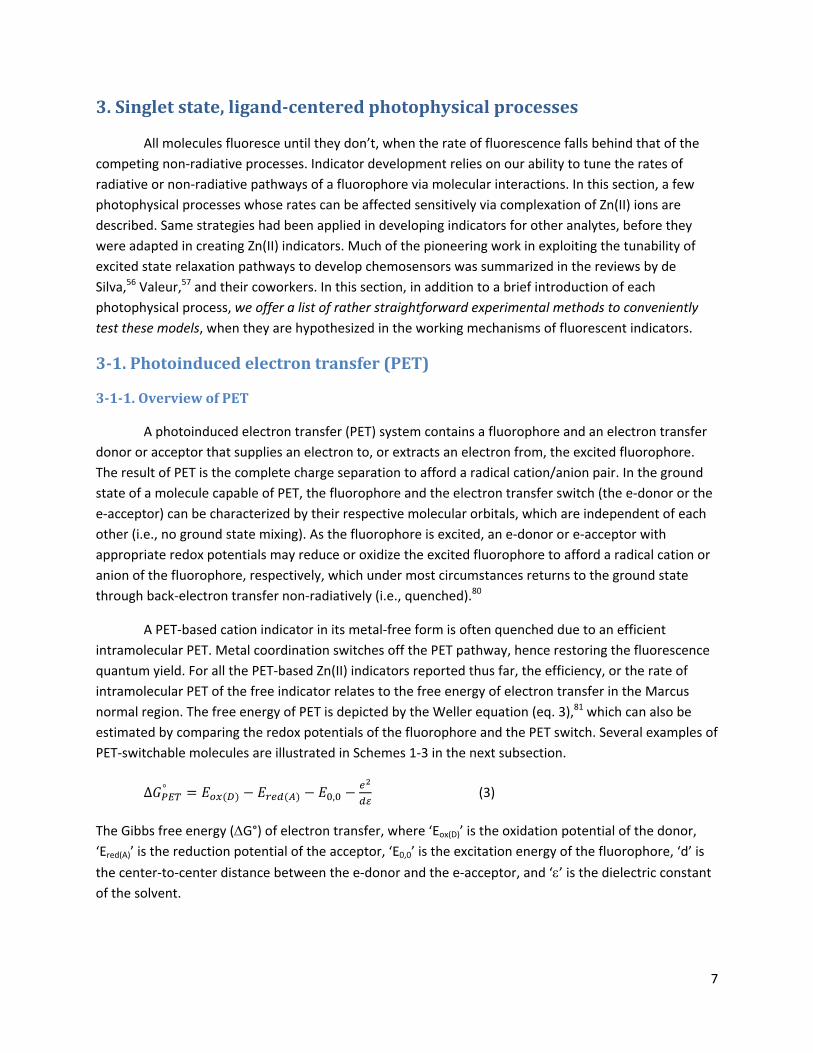
Fig. 5 TSQ,55 and subsequent advances in the development of Zn(II) indicators, roughly time‐correlated.
The earliest fluorescent histochemical stain for biological Zn(II) that, in the late 1980s, found wide acceptance is N‐(6‐methoxy‐8‐quinolyl)‐p‐toluenesulfonamide (TSQ).55 The subsequent advances in Zn(II) indicator development have addressed issues (not necessarily completely) such as intracellular dye delivery, variable and preferably long excitation and emission wavelengths, variable affinities and fast coordination kinetics, and more recently, precise targeting to subcellular organelles (Fig. 5). In the 1990s the studies on metal coordination‐modulated photophysical processes were intensified,56‐58 which primed for the rapid development of fluorescent Zn(II) indicators in the following decade and beyond. Thus far, the Zn(II) indicator research field has accumulated an enormous volume of data and products, which has been covered with varied emphases in a number of review articles.59‐79 The present article obviously is not going to be, or need to be comprehensive considering the sheer volume of the works in this area. We aim to include (a) a few historical examples in this field that still assume great relevance, (b) more contemporary cases of fluorescent ligands for Zn(II) with considerably complete coordination chemistry and photophysical characterizations, and (c) the biological questions that Zn(II) indicator community has contributed to answer. The goal of this article is to explain how the organic‐based Zn(II) indicators work, coordination chemistry‐wise and photophysically, and how they have aided and will continue to aid the research of Zn(II) biology. This function of the article necessarily includes paying homage to the achievements in Ca(II) and proton indicator development, which laid out the rationales that have been adapted in developing indicators for Zn(II). Hopefully this article will provide guidance for the design of future Zn(II) indicators.
7
3.Singletstate,ligand‐centeredphotophysicalprocesses
All molecules fluoresce until they don’t, when the rate of fluorescence falls behind that of the competing non‐radiative processes. Indicator development relies on our ability to tune the rates of radiative or non‐radiative pathways of a fluorophore via molecular interactions. In this section, a few photophysical processes whose rates can be affected sensitively via complexation of Zn(II) ions are described. Same strategies had been applied in developing indicators for other analytes, before they were adapted in creating Zn(II) indicators. Much of the pioneering work in exploiting the tunability of excited state relaxation pathways to develop chemosensors was summarized in the reviews by de Silva,56 Valeur,57 and their coworkers. In this section, in addition to a brief introduction of each photophysical process, we offer a list of rather straightforward experimental methods to conveniently test these models, when they are hypothesized in the working mechanisms of fluorescent indicators.
3‐1.Photoinducedelectrontransfer(PET)
3‐1‐1.OverviewofPET
A photoinduced electron transfer (PET) system contains a fluorophore and an electron transfer donor or acceptor that supplies an electron to, or extracts an electron from, the excited fluorophore. The result of PET is the complete charge separation to afford a radical cation/anion pair. In the ground state of a molecule capable of PET, the fluorophore and the electron transfer switch (the e‐donor or the e‐acceptor) can be characterized by their respective molecular orbitals, which are independent of each other (i.e., no ground state mixing). As the fluorophore is excited, an e‐donor or e‐acceptor with appropriate redox potentials may reduce or oxidize the excited fluorophore to afford a radical cation or anion of the fluorophore, respectively, which under most circumstances returns to the ground state through back‐electron transfer non‐radiatively (i.e., quenched).80
A PET‐based cation indicator in its metal‐free form is often quenched due to an efficient intramolecular PET. Metal coordination switches off the PET pathway, hence restoring the fluorescence quantum yield. For all the PET‐based Zn(II) indicators reported thus far, the efficiency, or the rate of intramolecular PET of the free indicator relates to the free energy of electron transfer in the Marcus normal region. The free energy of PET is depicted by the Weller equation (eq. 3),81 which can also be estimated by comparing the redox potentials of the fluorophore and the PET switch. Several examples of PET‐switchable molecules are illustrated in Schemes 1‐3 in the next subsection. ∆ ° , (3)
The Gibbs free energy (G°) of electron transfer, where ‘Eox(D)’ is the oxidation potential of the donor, ‘Ered(A)’ is the reduction potential of the acceptor, ‘E0,0’ is the excitation energy of the fluorophore, ‘d’ is the center‐to‐center distance between the e‐donor and the e‐acceptor, and ‘’ is the dielectric constant of the solvent.

8
3‐1‐2.AfewexamplesofmoleculescapableofintramolecularPET
Compound 1 (Scheme 1) embodies the key principles of PET‐based fluorescence switching strategy.82 The excited anthryl fluorophore in 1 is quenched via electron transfer from the tertiary amino group. The electron transfer is efficient because the energy of the non‐bonding orbital (NBO) of the amino group is higher than the HOMO level of the anthryl, which is vacated upon photo‐excitation. Protonation of, or Zn(II)‐binding at, the tertiary amino group (Scheme 1) lowers the energy of the NBO to the extent that the thermodynamic driving force of PET is drastically reduced, and consequently increases the fluorescence quantum yield (see eq. 1). Compound 1 represents a straightforward strategy to construct a fluorescence off‐on switch, which was advocated by Czarnik83 and de Silva56 in the 1990s, and has since been applied extensively in chemosensor design.
Scheme 1 Protonation and Zn(II)‐coordination alter the fluorescence of compound 1.82
The less‐discussed half of the PET‐switching chemistry is the potential of the excited fluorophore as the e‐donor.82 When a pyridyl group in 1, in addition to the tertiary amino group, is protonated to afford [H2(1)]
2+ (Scheme 1), the LUMO level of the pyridinium is lowered to accept an electron from the excited anthryl group, which results in the formation of the radical cation of anthryl and the quenching of fluorescence.
Compound 2 upon either protonation or Zn(II)‐binding suffers fluorescence quenching due to PET from the excited anthryl to the LUMO of protonated or Zn(II)‐bound bipyridyl (bipy, Scheme 2).84 By comparing the Zn(II)‐dependent fluorescence properties of 1 and 2, it may be concluded that Zn(II)‐bound bipy is a more potent e‐acceptor than Zn(II)‐bound pyridyl. Indeed, Zn(II)‐bound bipy and terpyridyl (terpy) have been found to quench fluorescence in other cases.85,86
Scheme 2 Bipy in compound 2 is an efficient e‐acceptor in PET when protonated or bound with Zn(II).84
9
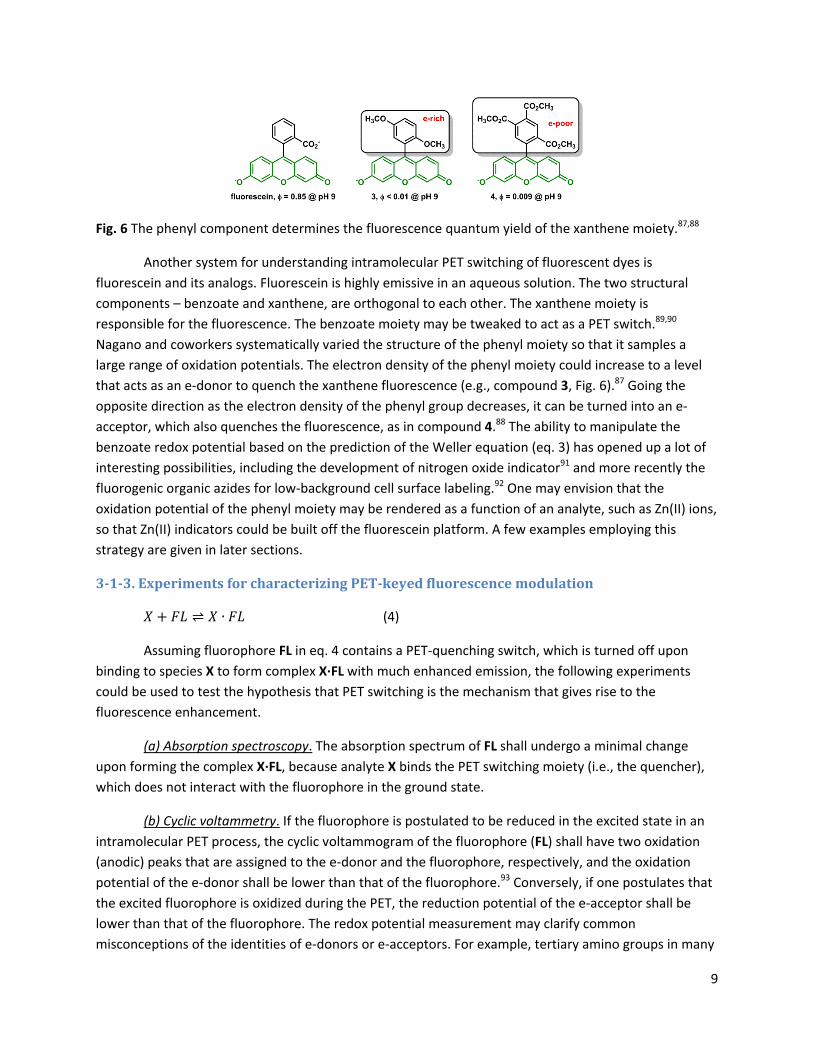
Fig. 6 The phenyl component determines the fluorescence quantum yield of the xanthene moiety.87,88
Another system for understanding intramolecular PET switching of fluorescent dyes is fluorescein and its analogs. Fluorescein is highly emissive in an aqueous solution. The two structural components – benzoate and xanthene, are orthogonal to each other. The xanthene moiety is responsible for the fluorescence. The benzoate moiety may be tweaked to act as a PET switch.89,90 Nagano and coworkers systematically varied the structure of the phenyl moiety so that it samples a large range of oxidation potentials. The electron density of the phenyl moiety could increase to a level that acts as an e‐donor to quench the xanthene fluorescence (e.g., compound 3, Fig. 6).87 Going the opposite direction as the electron density of the phenyl group decreases, it can be turned into an e‐acceptor, which also quenches the fluorescence, as in compound 4.88 The ability to manipulate the benzoate redox potential based on the prediction of the Weller equation (eq. 3) has opened up a lot of interesting possibilities, including the development of nitrogen oxide indicator91 and more recently the fluorogenic organic azides for low‐background cell surface labeling.92 One may envision that the oxidation potential of the phenyl moiety may be rendered as a function of an analyte, such as Zn(II) ions, so that Zn(II) indicators could be built off the fluorescein platform. A few examples employing this strategy are given in later sections.
3‐1‐3.ExperimentsforcharacterizingPET‐keyedfluorescencemodulation⇌ ∙ (4)
Assuming fluorophore FL in eq. 4 contains a PET‐quenching switch, which is turned off upon binding to species X to form complex X∙FL with much enhanced emission, the following experiments could be used to test the hypothesis that PET switching is the mechanism that gives rise to the fluorescence enhancement.
(a) Absorption spectroscopy. The absorption spectrum of FL shall undergo a minimal change upon forming the complex X∙FL, because analyte X binds the PET switching moiety (i.e., the quencher), which does not interact with the fluorophore in the ground state.
(b) Cyclic voltammetry. If the fluorophore is postulated to be reduced in the excited state in an intramolecular PET process, the cyclic voltammogram of the fluorophore (FL) shall have two oxidation (anodic) peaks that are assigned to the e‐donor and the fluorophore, respectively, and the oxidation potential of the e‐donor shall be lower than that of the fluorophore.93 Conversely, if one postulates that the excited fluorophore is oxidized during the PET, the reduction potential of the e‐acceptor shall be lower than that of the fluorophore. The redox potential measurement may clarify common misconceptions of the identities of e‐donors or e‐acceptors. For example, tertiary amino groups in many

10
instances can be oxidized electrochemically in preference to the fluorophore, which suggests that an amino group be a capable e‐donor to quench that particular fluorophore. A pyridyl group, however, is very difficult to oxidize electrochemically. In many solvents it would not be oxidized within the permissible voltage scan window. Therefore, the pyridyl nitrogen is rarely, if at all, an e‐donor to quench an excited fluorophore.
(c) Fluorescence quantum yield. The fluorophore in the PET‐quenched state shall have a lower fluorescence quantum yield than its inherent fluorescence quantum yield in the absence of an (often intramolecular) quencher. The fluorescence quantum yield change shall be the benchmark in determining fluorescence turn‐on or turn‐off, rather than the emission intensity, because the latter is a function of both fluorescence quantum yield and molar absorptivity at the excitation wavelength.
(d) Fluorescence lifetime. The PET‐quenched state of a fluorophore shall have a shorter decay time constant, in addition to the normal time constant of fluorescence decay. The fluorescence lifetime data can be collected using the time‐correlated single‐photon counting (TCSPC) method, which may require a single photon counter accessary to a steady‐state fluorometer and a nanosecond LED light source.
(e) Control experiments. If an e‐donor is the quencher of the excited fluorophore, protonation of the often basic e‐donor (i.e. an amino group) would increase the oxidation potential, which shall lead to an enhancement of the fluorescence quantum yield. A model compound with the e‐donating or accepting quencher removed shall have a high f, but otherwise identical absorption and emission features.
3‐2.Excitedstateconformationalrigidification
“Rigidification” shall be distinguished from “planarization”. The latter is a molecular design strategy for enhancing electron delocalization. Rigidification reduces the number of rotational degrees of freedom that contributes to the non‐radiative decays of the excited state. Vibrationally or rotationally coupled internal conversion (IC) is a major non‐radiative decay pathway of a molecule with a large number of vibrational and rotational freedoms. Eliminating some of the vibrational/rotational freedoms via structural rigidification shall decrease the rate of IC, hence increasing the fluorescence quantum yield. The concept “aggregation‐induced emission” (AIE) is based on the fact that in aggregated states, the non‐radiative decay rates offered by bond vibrations and rotations are decreased due to tighter molecular packing.94,95 If aggregation does not introduce new, intermolecular‐based quenching pathways, the fluorescence quantum yield of the molecule shall increase. Hexaphenylsilole (HPS) and tetraphenylethene (TPE) in Fig. 7 are the archetypical AIE‐prone molecules. This concept has been applied in developing fluorescent indicators.96

11
Fig. 7 HPS and TPE are capable of aggregation‐induced emission (AIE).94
Bond rotation in the excited state could lead to photoisomerization. Rigidifying isomerizable conformations has been a viable strategy to enhance fluorescence quantum yield. For example, trans‐stilbene (Fig. 8) has two major decay pathways on the singlet manifold – fluorescence and trans → cis photoisomerization.97,98 The photoisomerization product cis‐isomer has a non‐planar conformation due to the steric congestion between the two cis‐phenyl rings, hence resulting in the reduction of fluorescence quantum yield. By locking the double bond in the trans configuration in the excited state to eliminate the fluorescence‐quenching isomerization pathway, the fluorescence of trans‐stilbene analogues is conserved, such as in compound 5 (Fig. 8) with a fluorescence quantum yield of unity.99
Fig. 8 Structures of trans‐stilbene, compound 5,99 Ca(II) indicators stil‐1 and indo‐1.100
This line of thinking has been applied to create bright fluorophores and fluorescent indicators. Tsien and coworkers developed Ca(II) indicators containing trans‐stilbene‐like fluorophores (e.g., stil‐1 in Fig. 8).100 By locking up the trans configuration using a heterocycle, the fluorescence quantum yield increases from 0.14 of stil‐1 to 0.38 in indo‐1 (Fig. 8). Freezing out some of the excited state rotational freedoms through selective non‐covalent host/guest complex formation is also a viable strategy for indicator development, as demonstrated by Armitage and coworkers in developing fluoromodules – specific combinations of biomolecules and fluorogenic organic dyes that afford strong fluorescence.101,102 The fluorescence quantum yields of the dye molecules used in fluoromodules in low viscosity solvents are compromised by the excited state bond rotations. However, their fluorescence is restored in viscous solvents such as glycerol, which slows down bond rotation, or via specific binding to proteins and nucleic acids selected for enhancing their fluorescence. The solvent viscosity dependency experiment provides a test to determine whether fluorescence enhancement can be attributed to conformational rigidification.

12
Fig. 9 Wild‐type GFP chromophore and GFP‐inspired Zn(II) indicators PyMDI103 and 6.104
Another notable example of structural rigidification‐enhanced fluorescence is embodied in green fluorescent protein (GFP, Fig. 9).105 The GFP fluorophore includes an isomerizable double bond, the action of which almost entirely quenches the fluorescence when the fluorophore is isolated from its protein shell.106 When protected in the ‐barrel structure, the bond rotation of the GFP fluorophore in the excited state is hindered, photoisomerization rate is decreased, so that the fluorescence quantum yield is enhanced. Based on the similar structural rigidification concept, two GFP‐fluorophore‐containing Zn(II) indicators (PyMDI and 6 in Fig. 9) were developed by Tolbert,103 James,104 and their coworkers.
3‐3.Internalchargetransfer(orintramolecularchargetransfer,ICT)
3‐3‐1.OverviewofICT
Positively solvatochromic compounds are characterized by a bathochromic shift of absorption or emission as solvent polarity increases. Therefore, these compounds belong to a subgroup of solvatochromic dyes,107 yet have found a disproportionally wide range of applications in fluorescence microscopy.
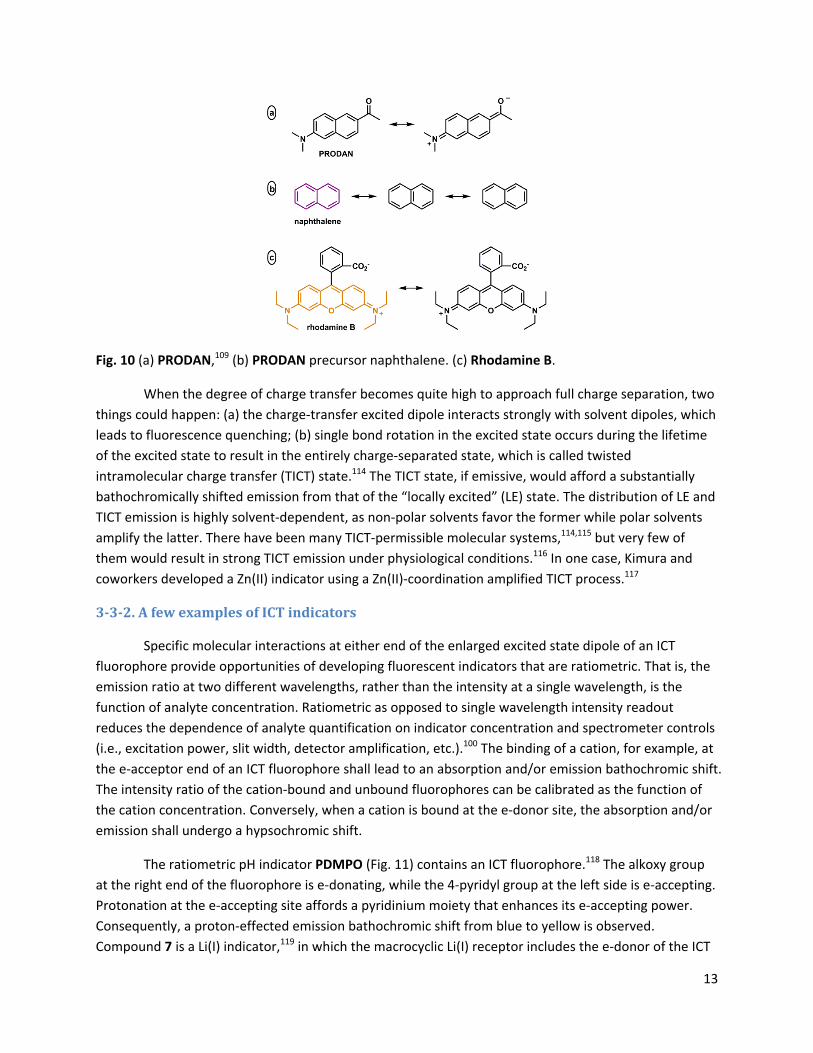
In most cases, a positively solvatochromic dye that has an e‐donor and an e‐acceptor in conjugation undergoes internal charge transfer (ICT) upon photo‐excitation.108 The electron distribution in the ground and excited states can be represented by the neutral and the zwitterionic resonance structures, respectively. An example of this qualitative representation is shown for 6‐propionyl‐2‐(dimethylamino)naphthalene (PRODAN, Fig. 10a).109 This simplified treatment contributes to the understanding of how the emission of an ICT molecule depends on its microenvironment. As solvent polarity increases, the excited state zwitterionic structure, which has a larger dipole moment than that of the ground state, enjoys more substantial effect of solvent stabilization. The solvent‐mediated excited state stabilization reduces the energetic difference between the excited and ground states to result in a bathochromically shifted emission and a large Stokes shift. PRODAN analogues can be understood in the same manner.110‐112 PRODAN was developed and successfully applied as a protein microenvironment polarity indicator.109,113 Contrary to PRODAN, its structural progenitor naphthalene does not have a polar major contributing resonance structure (Fig. 10b). Therefore, naphthalene is not solvatochromic. By the same measure, although rhodamine B (Fig. 10c) is zwitterionic, its resonance structure has the same dipole moment. Therefore, Rhodamine B is not solvatochromic, and has a small Stokes shift.
13
Fig. 10 (a) PRODAN,109 (b) PRODAN precursor naphthalene. (c) Rhodamine B.
When the degree of charge transfer becomes quite high to approach full charge separation, two things could happen: (a) the charge‐transfer excited dipole interacts strongly with solvent dipoles, which leads to fluorescence quenching; (b) single bond rotation in the excited state occurs during the lifetime of the excited state to result in the entirely charge‐separated state, which is called twisted intramolecular charge transfer (TICT) state.114 The TICT state, if emissive, would afford a substantially bathochromically shifted emission from that of the “locally excited” (LE) state. The distribution of LE and TICT emission is highly solvent‐dependent, as non‐polar solvents favor the former while polar solvents amplify the latter. There have been many TICT‐permissible molecular systems,114,115 but very few of them would result in strong TICT emission under physiological conditions.116 In one case, Kimura and coworkers developed a Zn(II) indicator using a Zn(II)‐coordination amplified TICT process.117
3‐3‐2.AfewexamplesofICTindicators
Specific molecular interactions at either end of the enlarged excited state dipole of an ICT fluorophore provide opportunities of developing fluorescent indicators that are ratiometric. That is, the emission ratio at two different wavelengths, rather than the intensity at a single wavelength, is the function of analyte concentration. Ratiometric as opposed to single wavelength intensity readout reduces the dependence of analyte quantification on indicator concentration and spectrometer controls (i.e., excitation power, slit width, detector amplification, etc.).100 The binding of a cation, for example, at the e‐acceptor end of an ICT fluorophore shall lead to an absorption and/or emission bathochromic shift. The intensity ratio of the cation‐bound and unbound fluorophores can be calibrated as the function of the cation concentration. Conversely, when a cation is bound at the e‐donor site, the absorption and/or emission shall undergo a hypsochromic shift.
The ratiometric pH indicator PDMPO (Fig. 11) contains an ICT fluorophore.118 The alkoxy group at the right end of the fluorophore is e‐donating, while the 4‐pyridyl group at the left side is e‐accepting. Protonation at the e‐accepting site affords a pyridinium moiety that enhances its e‐accepting power. Consequently, a proton‐effected emission bathochromic shift from blue to yellow is observed. Compound 7 is a Li(I) indicator,119 in which the macrocyclic Li(I) receptor includes the e‐donor of the ICT

14
fluorophore. Li(I) binding leads to hypsochromic shifts of both absorption and emission of the fluorophore.
The third example is the Ca(II) indicator fura‐2 that contains an ICT fluorophore.100 The BAPTA type Ca(II) ligand (see Section 4‐4‐2) is integrated in the e‐donor of the fluorophore. Ca(II) binding to fura‐2 results in absorption bathochromic shift, but little fluorescence change. Due to the ICT nature of the fluorophore, in the excited state the affinity of BAPTA to Ca(II) is reduced due to the cationic character at the e‐donor site of the excited state dipole. Therefore, during the lifetime of the fluorophore, Ca(II) could be ejected due to the decreasing affinity, to result in an emission spectrum similar to that of the free indicator. However, the excitation spectrum of fura‐2 is sensitively dependent on Ca(II) binding, and undergoes a hypsochromic shift upon coordination. Therefore, a ratiometric measurement of Ca(II) is achieved in the excitation spectral mode.100 The design principles of the three indicators in Fig. 11 can be directly applied in creating Zn(II) indicators. Indeed, after replacing the analyte‐recognition component in each of these compounds with Zn(II)‐selective ligands, similar fluorescence responses are replicated, but selective to Zn(II). These Zn(II)‐sensitive compounds are described in Section 4.
Fig. 11 Ratiometric indicators based on ICT fluorophores: PDMPO – a pH indicator;118 7 – a Li(I) indicator,119 and fura‐2 – a Ca(II) indicator.100
3‐3‐3.ExperimentsforcharacterizingICT‐basedfluorescencemodulation
(a) Solvatochromism. Because an ICT fluorophore has different dipole moments in ground and excited states, a solvent polarity dependency on absorption and/or emission and a large Stokes shift are characteristic of an ICT‐type (including TICT) fluorophore. The Lippert‐Mataga equation (eq. 5) relates the Stokes shift to the orientation polarizability (f, eq. 6) in a linear relationship.120 The slope of the Lippert‐Mataga plot gives the change of dipole moment upon excitation, which characterizes the degree of ICT of a fluorophore. (5)
Δ (6)
From cyclohexane to DMSO, the dielectric constant spans 2‐47, which is a sufficient range for characterizing the degree of charge transfer (i.e., change of dipole moment). A main cause of deviation from the Lippert‐Magata equation (eq. 5) is specific solvent‐solute interactions, for example, hydrogen

15
bonding of a solvent molecule with the negative terminal of an excited state dipole, which is not factored in the Lippert‐Magata model.
(b) Spectral shift upon binding. Assuming a cationic analyte, the binding at the e‐donor or e‐acceptor ends of an ICT fluorophore shall lead to absorption hypso‐ or bathochromic shifts, respectively. Emission shall follow suit, except in the cases when a cation binds at the donor site of an ICT fluorophore in the ground state, while it is ejected in the excited state due to a positive charge buildup at the donor site, as seen for fura‐2 (Fig. 11).100 Occasionally, the binding of a cation at the e‐donor site of OH or NH type (having exchangeable protons) may result in a bathochromic shift of absorption and/or emission. This could be attributed to the deprotonation of the OH or NH groups upon cation binding, which elevates the acidity of these exchangeable protons. When the deprotonation occurs, the electron density of the donor site significantly increases, which leads to a higher degree of charge transfer in the excited state, hence a bathochromic shift in absorption and/or emission. In the example shown in Scheme 3, Zn(II) coordination at the e‐donor dihydroxyl site of methylesculetin leads to both absorption and emission bathochromic shifts, as a result of Zn(II)‐mediated deprotonation.121 The fluorescence properties of other 7‐hydroxycoumarin‐containing Zn(II) indicators122 could be interpreted using the same rationale.
Scheme 3 Methylesculetin undergoes deprotonation upon forming a Zn(II) complex.121
(c) Excitation and emission spectra. Because the interaction between an analyte and an ICT fluorophore may lead to a spectral shift in either absorption or emission, or both, it is advisable to collect both absorption and excitation spectra, in addition to emission spectra. Sometimes a complexation reaction with an ICT fluorophore only leads to a change of emission intensity, which is deceptively similar to what is expected from a PET switch (Section 3‐1). In those cases, excitation spectra in the presence and absence of the analyte need to be taken. An ICT fluorophore shall show a spectral shift of excitation spectrum upon analyte titration, while a PET switch would only show the intensity, not the frequency change of the excitation spectrum. The studies of fura‐2100 and an ICT‐based Zn(II) indicator123 illustrate the need, and the benefit of collecting excitation spectra.
(d) Density Functional Theory (DFT) calculation. Frontier molecular orbital (FMO) computation has been utilized to visualize the charge redistribution of an ICT fluorophore upon photo‐excitation.209 The elevation of an electron from HOMO to LUMO upon photo‐excitation leads to the change of dipole moment. The DFT calculation of FMOs usually agrees with the qualitative conclusion drawn from analyzing the resonance structures, as shown in Fig. 10.
16
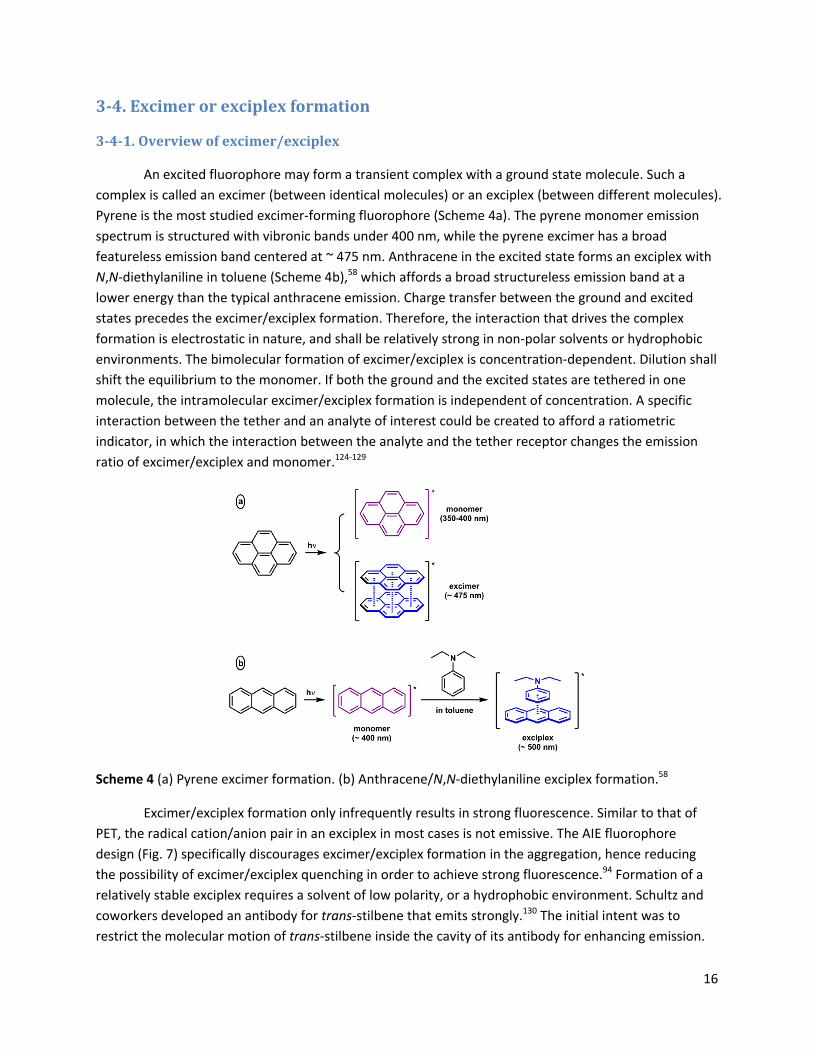
3‐4.Excimerorexciplexformation
3‐4‐1.Overviewofexcimer/exciplex
An excited fluorophore may form a transient complex with a ground state molecule. Such a complex is called an excimer (between identical molecules) or an exciplex (between different molecules). Pyrene is the most studied excimer‐forming fluorophore (Scheme 4a). The pyrene monomer emission spectrum is structured with vibronic bands under 400 nm, while the pyrene excimer has a broad featureless emission band centered at ~ 475 nm. Anthracene in the excited state forms an exciplex with N,N‐diethylaniline in toluene (Scheme 4b),58 which affords a broad structureless emission band at a lower energy than the typical anthracene emission. Charge transfer between the ground and excited states precedes the excimer/exciplex formation. Therefore, the interaction that drives the complex formation is electrostatic in nature, and shall be relatively strong in non‐polar solvents or hydrophobic environments. The bimolecular formation of excimer/exciplex is concentration‐dependent. Dilution shall shift the equilibrium to the monomer. If both the ground and the excited states are tethered in one molecule, the intramolecular excimer/exciplex formation is independent of concentration. A specific interaction between the tether and an analyte of interest could be created to afford a ratiometric indicator, in which the interaction between the analyte and the tether receptor changes the emission ratio of excimer/exciplex and monomer.124‐129
Scheme 4 (a) Pyrene excimer formation. (b) Anthracene/N,N‐diethylaniline exciplex formation.58
Excimer/exciplex formation only infrequently results in strong fluorescence. Similar to that of PET, the radical cation/anion pair in an exciplex in most cases is not emissive. The AIE fluorophore design (Fig. 7) specifically discourages excimer/exciplex formation in the aggregation, hence reducing the possibility of excimer/exciplex quenching in order to achieve strong fluorescence.94 Formation of a relatively stable exciplex requires a solvent of low polarity, or a hydrophobic environment. Schultz and coworkers developed an antibody for trans‐stilbene that emits strongly.130 The initial intent was to restrict the molecular motion of trans‐stilbene inside the cavity of its antibody for enhancing emission.

17
Instead, an exciplex forms between the excited trans‐stilbene and a tyrosine residue to result in strong, structureless exciplex emission.130,131
3‐4‐2.Experimentstocharacterizeexcimer/exciplexformation
(a) Emission spectra. The excimer/exciplex emission bands are broad and structureless. Because an excimer/exciplex forms from the excited state of the monomer in an exothermic process, the emission wavelength of an excimer/exciplex is always longer than that of the monomer. Bimolecular excimer/exciplex formation is concentration‐dependent. Dilution shall push the equilibrium to the monomer emission side.
(b) Excitation spectra. Because the excimer formation follows the excitation of the monomer, the excitation spectra of both excimer and monomer emission shall resemble the absorption spectrum of the monomer. The mirror image correlation between excitation and emission spectra expected for small polycyclic aromatic molecules is absent for excimer emission.
3.5.Excitedstateprotontransfer(ESPT,phototautomerization)
3‐5‐1.OverviewofESPT
Fluorophores that contain intramolecular hydrogen bonds may undergo excited state proton transfer (ESPT), which results in abnormal fluorescence (e.g., no mirror image relationship with the absorption spectrum) with a large Stokes shift. For example, 3‐hydroxyflavone (Scheme 5) in the non‐polar solvent 2‐methylbutane upon excitation in the UV region undergoes phototautomerization to afford the pyrylium salt tautomer, which emits in yellow‐green.132 2‐(2’‐Hydroxyphenyl)benzoxazole (HBO)133 contains a benzoxazole and a phenol moieties that are joined by a covalent and a hydrogen bond (Scheme 6). Phenol is a photoacid,134,135 while the benzoxazole heterocycle might act similarly to pyridine in the excited state, which is a photobase. Therefore, it appears logical for the proton transfer to occur in the excited state due to the large alterations of the acid/base properties of the two components (Scheme 6).
Scheme 5 3‐Hydroxyflavone undergoes excited state proton transfer (ESPT).132
18
Phototautomerization is solvent‐dependent. In a nonpolar solvent such as cyclohexane, ESPT is much more rapid than fluorescence. Therefore, in most cases only the emission of the phototautomer is observed. In the examples of which proton transfer is mediated via an intramolecular hydrogen bond (e.g., 3‐hydroxyflavone, HBO), very rapid ESPT occurs via proton tunneling, and the reaction is driven by a favorable exothermic phototautomerization to lead to a large Stokes shift. In solvents with stronger hydrogen bond‐accepting abilities, for example acetonitrile or methanol, dual emission from both tautomers is expected, because the ESPT rate is decreased. In very strong hydrogen bond‐accepting solvents such as DMSO, ESPT is too slow to compete with the fluorescence. Therefore, the emission of the phototautomer becomes the minor component.
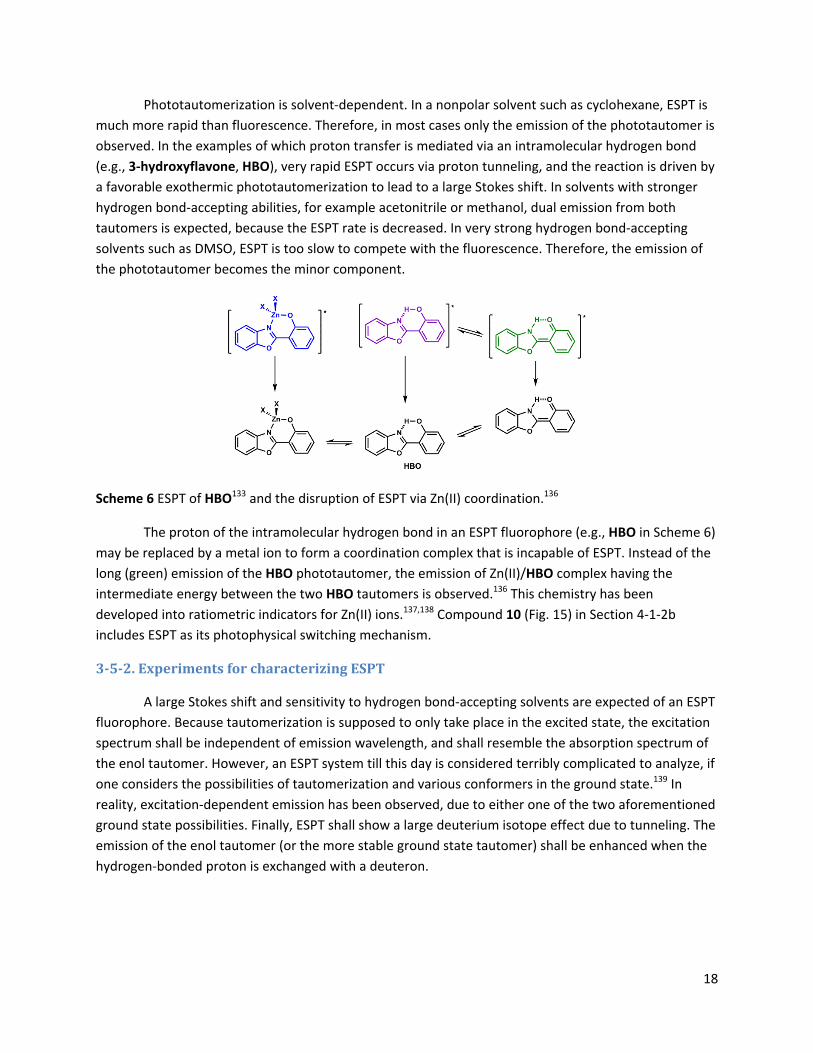
Scheme 6 ESPT of HBO133 and the disruption of ESPT via Zn(II) coordination.136
The proton of the intramolecular hydrogen bond in an ESPT fluorophore (e.g., HBO in Scheme 6) may be replaced by a metal ion to form a coordination complex that is incapable of ESPT. Instead of the long (green) emission of the HBO phototautomer, the emission of Zn(II)/HBO complex having the intermediate energy between the two HBO tautomers is observed.136 This chemistry has been developed into ratiometric indicators for Zn(II) ions.137,138 Compound 10 (Fig. 15) in Section 4‐1‐2b includes ESPT as its photophysical switching mechanism.
3‐5‐2.ExperimentsforcharacterizingESPT
A large Stokes shift and sensitivity to hydrogen bond‐accepting solvents are expected of an ESPT fluorophore. Because tautomerization is supposed to only take place in the excited state, the excitation spectrum shall be independent of emission wavelength, and shall resemble the absorption spectrum of the enol tautomer. However, an ESPT system till this day is considered terribly complicated to analyze, if one considers the possibilities of tautomerization and various conformers in the ground state.139 In reality, excitation‐dependent emission has been observed, due to either one of the two aforementioned ground state possibilities. Finally, ESPT shall show a large deuterium isotope effect due to tunneling. The emission of the enol tautomer (or the more stable ground state tautomer) shall be enhanced when the hydrogen‐bonded proton is exchanged with a deuteron.
19
3.6.Försterresonanceenergytransfer(FRET)
3‐6‐1.OverviewofFRET
An excited fluorophore A may pass its excitation energy to a nearby fluorophore B, so that fluorophore A relaxes to the ground state non‐radiatively, while fluorophore B is excited to ultimately exhibit fluorescence. Several mechanisms may contribute to energy transfer in the excited state, including Förster resonance energy transfer (FRET). The rate of FRET (kFRET) as represented in the Förster formulism (eq. 7)140 is a function of the distance between the energy donor and acceptor (r), the spectral overlap integral between the donor emission and the acceptor absorption spectra (J()), the orientation factor () associated with the dipole‐dipole interaction between the donor and the acceptor,141 the fluorescence quantum yield of the donor in the absence of an acceptor (D), and the refractive index of the medium (n), which relates to dielectric constant as shown in eq. 8.
∙ ∙ ∙∙ ∙ (7)
(8)
3‐6‐2.ApplyingFRETindevelopingfluorescentindicators
As a ramification of the Förster formulism, changing the donor‐acceptor (D‐A) distance (r) via analyte binding has been an often‐adopted strategy for developing fluorescent indicators, most notably the genetically encoded Ca(II) indicator Cameleon,142 of which Ca(II) binding reduces the D‐A distance (r) to increase the FRET efficiency. The reduction or elimination of FRET by analyte‐induced increase of r value has also been successfully employed in indicators for activities of hydrolytic enzymes143‐145 and for sequence‐specific nucleic acid detection (e.g., molecular beacons).146 It has been challenging to adopt the strategy of D‐A distance modulation in the realm of small molecule indicator design.147,148 An indicator of Zn(II) (29) that exploits analyte binding‐modulated J() is described in Section 4‐1‐2e.
3‐6‐3.CharacterizationofFRET
(a) Degree of spectral overlap. FRET requires an overlap between the emission spectrum of the FRET donor and the absorption spectrum of the acceptor. The spectral overlap integral (J()) can be computed (www.fluortools.com) to gauge the possibility of FRET when the two fluorophores are brought together.
(b) Donor lifetime. A FRET process decreases the lifetime of the donor because FRET provides an additional decay pathway for the excited donor. If the energy transfer occurs through the trivial mechanism, i.e., the emitted photons of the donor are reabsorbed by the acceptor molecules, the donor lifetime would not change.
(c) Excitation spectra. In a FRET system, the emission of both donor and acceptor originates from the excitation of the donor. Therefore, the excitation spectra of emission at all wavelengths shall include the donor contribution.

20
(d) Time‐resolved transient absorption spectroscopy. FRET can be characterized by ultrafast time‐resolved spectroscopy. Femtosecond time‐resolved transient absorption spectroscopy could provide the transient absorption spectra of both the donor and the acceptor.149 If FRET is operative, the decay of the donor shall correlate with the rise of the acceptor transient absorption. Because FRET is mediated by the dipole‐dipole interaction between the donor and the acceptor, a solvent polarity effect of the rate of FRET (kFRET, see eq. 7) is expected.149 These experiments require demanding instrumentation, therefore, are not routinely conducted.
4.Zn(II)coordinationchemistry
4‐1.Structures
4‐1‐1.Coordinationgeometry
Zn(II) is capable of adopting three coordination numbers ‐ 4, 5, and 6. The energetic cost for hydrated Zn(II) to switch among the three coordination numbers is within 0.4 kcal/mol in the gas phase.150 The deftness of Zn(II) in changing the coordination number contributes to the effectiveness of Zn(II) as a catalytic center, because ligand association and dissociation are common elementary steps in the relevant catalytic cycles. A tetrahedral geometry is observed for tetra‐coordinated Zn(II) ions, most notably of the Zn(II) ions in Zn(II) finger proteins.151 Five‐coordinated Zn(II) is found in the active site of carbonic anhydrase.5 Hexacoordinated ligands such ethylenediaminetetraacetic acid (EDTA) and tetrakis(2‐pyridylmethyl)ethylenediamine (TPEN) bind Zn(II) in the octahedral geometry. A ligand of high denticity usually manifests an effective entropy‐driven chelation effect. Therefore, the hexa‐coordinated ligands have the highest affinity to Zn(II) ions comparing to ligands of less denticity.
Fig. 12 Zn(II) coordination geometry in various ligand environments.
The coordination number of Zn(II) up to 6 determines that one Zn(II) ion may bind multiple ligands of low denticity. In Section 4‐1‐2e, an interesting case on the effect of the coordination stoichiometry on the fluorescence properties of the Zn(II) complex is described.
4‐1‐2.Zn(II)ligandsofvariousdenticity
(a) Hexadentate ligands. Hexadentate ligands such as EDTA and TPEN152 are high‐affinity Zn(II) ligands. Both form Zn(II) complexes of 1:1 stoichiometry, in which Zn(II) adopts octahedral coordination geometry (Fig. 13). At neutral pH, the ionic ligand EDTA is primarily used for preparing solutions with metal buffering capacities (see Section 4‐2‐2). The neutral ligand TPEN is able to permeate through cell membrane, and to chelate intracellular Zn(II) and other transition metal ions.153 Another distinction

21
between EDTA and TPEN is their metal ion selectivity. In addition to first‐row transition metal ions, EDTA has high affinities to Mg(II) and Ca(II). The all‐aza ligand TPEN shows preferential binding to transition metal ions over group 2A ions. By replacing the pyridyl groups in TPEN with fluorescent quinolinyl (e.g., TQEN)154,155 and isoquinolinyl156,157 groups, the TPEN analogues developed by Mikata and coworkers undergo fluorescence enhancement upon Zn(II) complexation. The fluorescence enhancement is attributed to the attenuation of the intramolecular PET in TQEN via Zn(II) coordination.
Fig. 13 Structures of Zn(II)/EDTA and Zn(II)/TPEN complexes, and a fluorescent TPEN analogue, TQEN.154
Hexadentate ligands are rarely included in Zn(II) indicators. In addition to the fluorescent TQEN described above, compound 8 (Scheme 7) was shown by Jiang and coworkers as a hexadentate ligand in the crystal structure of its 1:1 complex with Zn(II).158 This compound is built on the tripodal tetradentate ligand that includes a tertiary amino, two pyridyl, and one quinolinyl groups. Two oxygen ligands are strategically placed on the quinolinyl group so that all donor atoms bind Zn(II) to form 5‐membered chelate rings, in much the same way as that of TPEN. Ligand 8 can also be taken as the sum of two tridentate halves (boxed). Both halves bind facially to Zn(II). The facial preference of the di(2‐picolyl)amino group (right box) is commented in Section 4‐1‐2d. The tight binding afforded by the hexadentate 8 was quantified at Kd = 0.45 fM (pH = 7.4, I 0.1), close to that of TPEN (Kd = 0.40 fM).
Scheme 7 Hexadentate ligand 8 and its Zn(II) complex.158
(b) Pentadentate ligands. A pentadentate Zn(II) ligand could be drawn out in two ways. First, replacing one pyridyl group in TPEN with a non‐binding moiety affords a pentadentate ligand (“6‐1” approach). In ligand TPESA reported by Nagano and coworkers (Fig. 14),159 one pyridyl group in TPEN is replaced by benzylsulfonate for increasing aqueous solubility, and decreasing membrane permeability. The octahedral Zn(II) geometry drawn in Fig. 14 is arbitrary. The counter ion X may dissociate to afford a trigonal bipyramidal geometry, common for a pentadentate ligand. TPESA was used to control extracellular Zn(II) concentrations. By reducing the denticity from 6 to 5, the affinity of this compound to Zn(II) (Kd = 0.5 pM) drops by three orders of magnitude from that of TPEN.
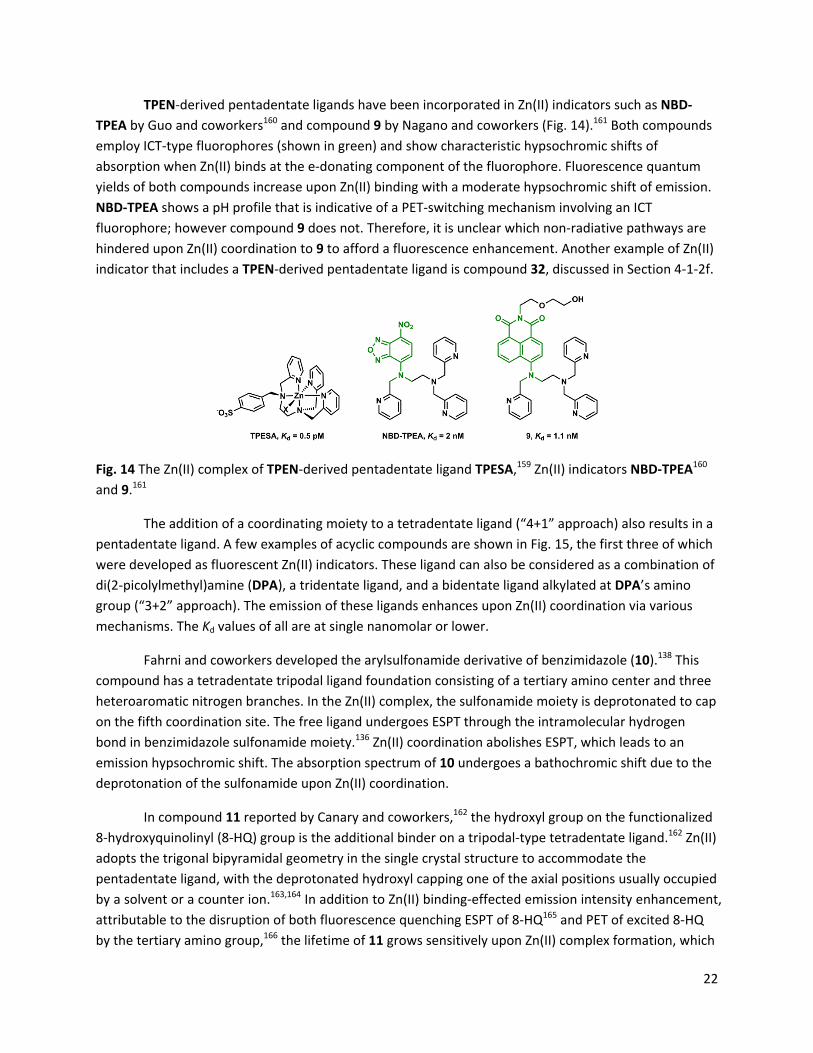
22
TPEN‐derived pentadentate ligands have been incorporated in Zn(II) indicators such as NBD‐TPEA by Guo and coworkers160 and compound 9 by Nagano and coworkers (Fig. 14).161 Both compounds employ ICT‐type fluorophores (shown in green) and show characteristic hypsochromic shifts of absorption when Zn(II) binds at the e‐donating component of the fluorophore. Fluorescence quantum yields of both compounds increase upon Zn(II) binding with a moderate hypsochromic shift of emission. NBD‐TPEA shows a pH profile that is indicative of a PET‐switching mechanism involving an ICT fluorophore; however compound 9 does not. Therefore, it is unclear which non‐radiative pathways are hindered upon Zn(II) coordination to 9 to afford a fluorescence enhancement. Another example of Zn(II) indicator that includes a TPEN‐derived pentadentate ligand is compound 32, discussed in Section 4‐1‐2f.
Fig. 14 The Zn(II) complex of TPEN‐derived pentadentate ligand TPESA,159 Zn(II) indicators NBD‐TPEA160 and 9.161
The addition of a coordinating moiety to a tetradentate ligand (“4+1” approach) also results in a pentadentate ligand. A few examples of acyclic compounds are shown in Fig. 15, the first three of which were developed as fluorescent Zn(II) indicators. These ligand can also be considered as a combination of di(2‐picolylmethyl)amine (DPA), a tridentate ligand, and a bidentate ligand alkylated at DPA’s amino group (“3+2” approach). The emission of these ligands enhances upon Zn(II) coordination via various mechanisms. The Kd values of all are at single nanomolar or lower.
Fahrni and coworkers developed the arylsulfonamide derivative of benzimidazole (10).138 This compound has a tetradentate tripodal ligand foundation consisting of a tertiary amino center and three heteroaromatic nitrogen branches. In the Zn(II) complex, the sulfonamide moiety is deprotonated to cap on the fifth coordination site. The free ligand undergoes ESPT through the intramolecular hydrogen bond in benzimidazole sulfonamide moiety.136 Zn(II) coordination abolishes ESPT, which leads to an emission hypsochromic shift. The absorption spectrum of 10 undergoes a bathochromic shift due to the deprotonation of the sulfonamide upon Zn(II) coordination.
In compound 11 reported by Canary and coworkers,162 the hydroxyl group on the functionalized 8‐hydroxyquinolinyl (8‐HQ) group is the additional binder on a tripodal‐type tetradentate ligand.162 Zn(II) adopts the trigonal bipyramidal geometry in the single crystal structure to accommodate the pentadentate ligand, with the deprotonated hydroxyl capping one of the axial positions usually occupied by a solvent or a counter ion.163,164 In addition to Zn(II) binding‐effected emission intensity enhancement, attributable to the disruption of both fluorescence quenching ESPT of 8‐HQ165 and PET of excited 8‐HQ by the tertiary amino group,166 the lifetime of 11 grows sensitively upon Zn(II) complex formation, which

23
leads to the possibility of using fluorescence lifetime as the detection readout. Pentadentate ligands for Zn(II) based on the combination of 8‐hydroxyquinoline derivatives and DPA have also been studied by Jiang and coworkers.167 Compound HQ1 is a derivative of the hexadentate compound 8. The alkylated 8‐hydroxyl group appears to weakly bind with Zn(II) in the solid state (dZn‐O = 2.668(4) Å). It is therefore likely that in solution, Zn(II) exhibits a more typical trigonal bipyramidal geometry with the phenoxyl oxygen unbound.
Lippard and coworker developed the anionic pentadentate ligand ZX1 as a tool to manipulate extracellular Zn(II) that is released to the synaptic cleft.168 ZX1 contains a sulfonate and an anilinyl ligands, which contribute to fast binding kinetics because none of the binding atoms requires deprotonation in forming the Zn(II) complex. As a result, this compound responds to the fluctuation of extracellular Zn(II) rapidly, suitable as a tool in studying rapid Zn(II) mobilizations in biological events.169
Fig. 15 Zn(II) complexes of a few pentadentate ligands 10,138 11,162 HQ1,167 and ZX1,168 with Kd values shown.
Macrocyclic tetradentate cyclen and cyclam ligands could be functionalized by an additional ligand (“4+1” approach) and a fluorophore to afford a pentadentate ligand targeting Zn(II) ions. Kimura and coworkers prepared compound 12 (Fig. 16)170 that contains the fluorophore dansylamide, a known inhibitor of Zn(II)‐dependent carboxypeptidase A.171 This compound forms a tight 1:1 Zn(II) complex of a distorted square pyramidal geometry, and affords a Zn(II)‐dependent fluorescence enhancement.170
Fig. 16 Pentadentate ligands that include cyclen (12)170 and cyclam (13).172
Todd, Watkinson, and coworkers appended a 1,2,3‐triazolyl‐substituted 1,8‐naphthylimide fluorophore on the macrocyclic tetradentate cyclam ligand to afford the pentadentate compound 13 (Fig. 16).172 13 forms a 1:1 complex with Zn(ClO4)2 with a Kd of 4.3 nM (pH = 7.0). Ligand 13 is pentadentate in the complex, while Zn(II) takes a perchlorate ion anti to the 1,2,3‐triazolyl group to complete an octahedral geometry. The Zn(II)‐enhanced emission is attributed to the reduction of thermodynamic driving force of PET in 13.172,173
24
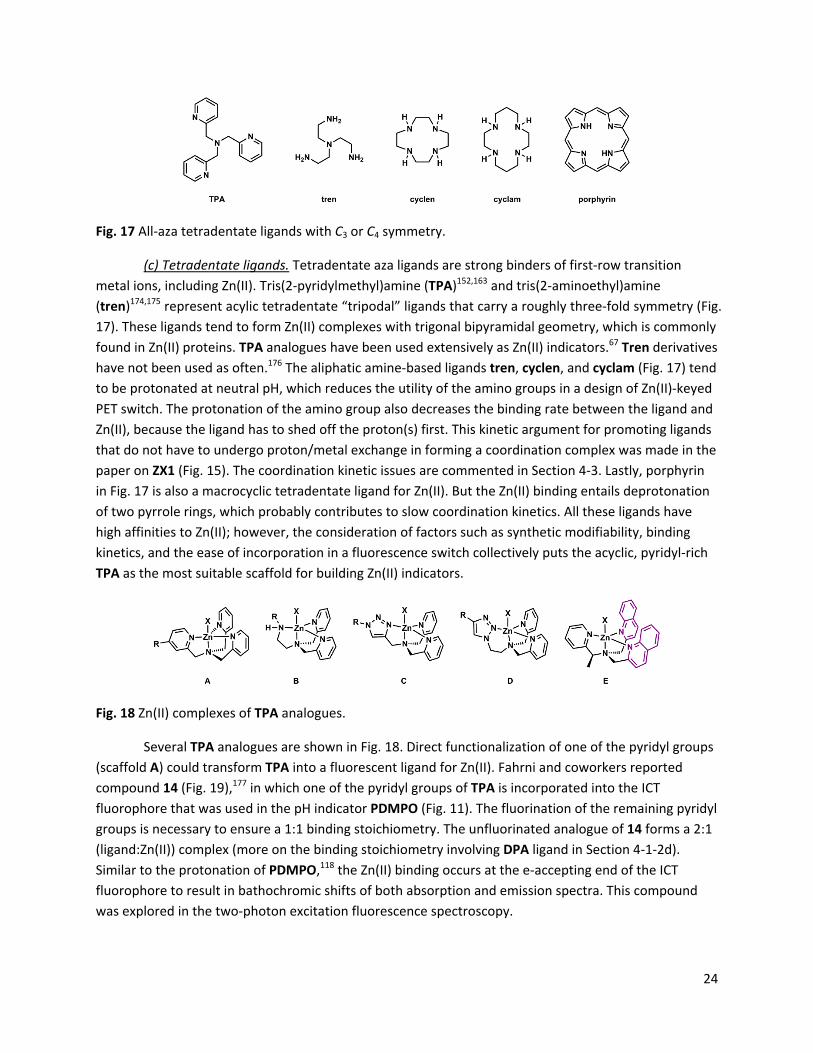
Fig. 17 All‐aza tetradentate ligands with C3 or C4 symmetry.
(c) Tetradentate ligands. Tetradentate aza ligands are strong binders of first‐row transition metal ions, including Zn(II). Tris(2‐pyridylmethyl)amine (TPA)152,163 and tris(2‐aminoethyl)amine (tren)174,175 represent acylic tetradentate “tripodal” ligands that carry a roughly three‐fold symmetry (Fig. 17). These ligands tend to form Zn(II) complexes with trigonal bipyramidal geometry, which is commonly found in Zn(II) proteins. TPA analogues have been used extensively as Zn(II) indicators.67 Tren derivatives have not been used as often.176 The aliphatic amine‐based ligands tren, cyclen, and cyclam (Fig. 17) tend to be protonated at neutral pH, which reduces the utility of the amino groups in a design of Zn(II)‐keyed PET switch. The protonation of the amino group also decreases the binding rate between the ligand and Zn(II), because the ligand has to shed off the proton(s) first. This kinetic argument for promoting ligands that do not have to undergo proton/metal exchange in forming a coordination complex was made in the paper on ZX1 (Fig. 15). The coordination kinetic issues are commented in Section 4‐3. Lastly, porphyrin in Fig. 17 is also a macrocyclic tetradentate ligand for Zn(II). But the Zn(II) binding entails deprotonation of two pyrrole rings, which probably contributes to slow coordination kinetics. All these ligands have high affinities to Zn(II); however, the consideration of factors such as synthetic modifiability, binding kinetics, and the ease of incorporation in a fluorescence switch collectively puts the acyclic, pyridyl‐rich TPA as the most suitable scaffold for building Zn(II) indicators.
Fig. 18 Zn(II) complexes of TPA analogues.
Several TPA analogues are shown in Fig. 18. Direct functionalization of one of the pyridyl groups (scaffold A) could transform TPA into a fluorescent ligand for Zn(II). Fahrni and coworkers reported compound 14 (Fig. 19),177 in which one of the pyridyl groups of TPA is incorporated into the ICT fluorophore that was used in the pH indicator PDMPO (Fig. 11). The fluorination of the remaining pyridyl groups is necessary to ensure a 1:1 binding stoichiometry. The unfluorinated analogue of 14 forms a 2:1 (ligand:Zn(II)) complex (more on the binding stoichiometry involving DPA ligand in Section 4‐1‐2d). Similar to the protonation of PDMPO,118 the Zn(II) binding occurs at the e‐accepting end of the ICT fluorophore to result in bathochromic shifts of both absorption and emission spectra. This compound was explored in the two‐photon excitation fluorescence spectroscopy.

25
Fig. 19 Structures of tetradentate compounds 14177 ad ZnAF‐R2.178
Replacing one pyridyl group in TPA with a functionalized aminoethyl group leads to ligand scaffold B (Fig. 18). The R group in scaffold B often is a fluorophore. As an early example, Nagano and coworkers developed ZnAF‐R2 (Fig. 19)178 by replacing the BAPTA ligand for Ca(II) in fura‐2 (Fig. 11) with the Zn(II)‐selective scaffold B. This modification transforms a Ca(II) indicator to one that is selective for Zn(II) without altering the fluorescence switching mechanism. It is interesting to note that same as fura‐2, but opposite to compound 14, Zn(II) binds at the e‐donor site of the ICT fluorophore in ZnAF‐R2. The emission frequency and quantum yield are not altered much because Zn(II) is likely ejected in the excited state after charge transfer. However, the excitation spectrum is sensitively dependent on Zn(II) concentration, which can be used for analytical purposes, as shown in the study of fura‐2.
In addition to ZnAF‐R2, scaffold B (Fig. 18) has been applied extensively in the last decade to afford Zn(II) indicators containing various fluorophores, including dansylamide,179 4‐aminonaphthalimide,180 PRODAN analogue (as a two‐photon fluorophore),181 NBD,182 and fluorescein (e.g., ZnAF‐2 in Fig. 45, Section 6‐1).183,184
Zhu and coworkers replaced a pyridyl group in TPA with a 1,2,3‐triazolyl group in two different configurations (C and D, Fig. 18).185 The formation of 1,2,3‐triazole from Cu(I)‐catalyzed azide‐alkyne cycloaddition186,187 not only provides a covalent linker between a fluorophore and a Zn(II) binding site, but enhances the binding affinity by providing an additional ligand to Zn(II) in the form of a 1,2,3‐triazole.185,188 Both scaffolds C185,189 and D190 have been characterized in the solid state. The dissociation constants of their Zn(II) complexes are in single nanomolar range.185
The Zn(II) coordination chemistry and its associated fluorescence change of compound 15 was studied in detail.189 Zn(II) binding results in a fluorescence enhancement of the anthryl fluorophore, which initially was considered as another case of turning off PET quenching pathway via Zn(II)‐binding.185 A more careful examination of 1H NMR and isothermal titration colorimetry (ITC) data of solution binding, and the stepwise fluorescence changes in the Zn(II) titration experiment revealed the nuances in this chemistry (Scheme 8).189 Both 1H NMR and ITC give evidence of a [Zn(15)2]2+ complex. The structured fluorescence of the anthryl undergoes a modest enhancement during the initial stage of Zn(II) titration. Further addition of Zn(II) leads to a significantly intensified emission band, which concurrently undergoes a bathochromic shift to morph into a structureless broad band. In conjunction with fluorescence lifetime data, it was concluded that the formation of complex [Zn(15)2]2+ affords the

26
modest fluorescence enhancement attributable to the attenuation of PET. The second stage of fluorescence change – a red shift and the appearance of an unstructured emission band – is characteristic of an intramolecular exciplex formation between the excited anthryl and a pyridyl group in the 1:1 [Zn(15)]2+ complex.189
Scheme 8 Sequential formation of 2:1 and 1:1 (ligand:Zn(II)) complexes of 15.189 An = 2‐anthryl.
The peculiar stepwise fluorescence change of compound 15 over a Zn(II) gradient is ascribed to the ability of anthryl group to form an exciplex with either an electron donor or an acceptor (i.e., pyridinium). In a more recent report,191 7‐methoxycoumarin replaces 2‐anthryl in the 1,2,3‐triazolyl‐containing scaffold C to afford compound 16 (Fig. 20), whose fluorescence undergoes a smooth enhancement upon Zn(II) binding that is comfortably explained using the PET‐switching model. In the same contribution,191 the thermodynamic benefit of the 1,2,3‐triazolyl group to the Zn(II) affinity was quantified at 1.8 kcal/mol in acetonitrile using ITC, via the comparison of coordination thermodynamics of 17 and its isomer iso‐17 (Fig. 20).
Fig. 20 1,2,3‐Triazolyl‐containing tetradentate 16 and 17, and tridentate iso‐17.191
Instead of changing one pyridyl group to a fluorophore‐attached ligand in the TPA scaffold, Castagnetto and Canary replaced two pyridyl groups with their fluorescent analogue quinolinyl to afford compound E (Fig. 18).192 Compound E also has a chirality center bridging the amino to the pyridyl. Consequently, The Zn(II) complex formation leads to an exciton‐coupled circular dichroism (CD) signal due to the interactions between two quinolinyl transition dipole moments in the [Zn(E)]2+ complex. Canary and coworkers later developed a fluorescent chiral Zn(II) indicator, which relates Zn(II) concentration to the fluorescence‐detected circular dichroism (FDCD) readout.193 The FDCD approach increases the detection sensitivity from the absorption‐based CD detection in the previous work, and potentially enhances the Zn(II) detection selectivity because the amplitude and sign of the FDCD signals, which are determined by the stereochemistry of the complex, are sensitive not only to binding strength, but also to coordination geometry.

27
Fig. 21 Cyclen‐containing Zn(II) indicators 18,194 19,195 and ACF‐2,196 operating via the PET‐switching mechanism.
Czarnik and coworkers reported compound 18 (Fig. 21),194 which was one of the earliest fluorescent Zn(II) indicators based on the PET‐switching strategy. The Zn(II) binding at cyclen arrests the PET from the tertiary amino group to the excited anthryl, thus increasing fluorescence. Under neutral aqueous conditions, the tertiary amino group of 18 is substantially protonated to lose its electron transfer ability. The binding of Zn(II) therefore does not elicit much further fluorescence enhancement, leading to a small fluorescence signal dynamic range and hence a low signal‐to‐noise ratio. Brückner and coworkers developed compound 19, which contains a coumarin fluorophore and a cyclen ligand outfitted with three ester moieties.195 The neutral compound permeates the cell membrane and is subsequently hydrolyzed by intracellular esterases to complete cell entry and trapping. Nagano and coworkers developed the fluorescein analogue ACF‐2, in which the cyclen‐anilinyl moiety quenches the excited state of xanthene.196 The anilinyl group is not protonated at the neutral pH, thus is effective in PET quenching of the excited xanthene fluorophore under biologically relevant conditions. The Zn(II) coordination raises the oxidation potential of the anilinyl group, slows down PET, and restores the xanthene fluorescence with higher sensitivity than that of compound 18.
Fig. 22 Structures of tridentate ligands di(2‐picolyl)amine (DPA), iminodiacetic acid (IDA), and 2,2';6',2"‐terpyridine (terpy).
(d) Tridentate ligands. DPA, IDA, and terpy are common Zn(II)‐binding tridentate ligands (Fig. 22). DPA is the Zn(II) ligand of choice of many Zn(II) indicators, which are extensively covered in the reviews by de Silva,197 and Yoon,74 and their coworkers. One DPA‐containing Zn(II) indicator is Newport Green PDX (Fig. 23) of a low affinity (Kd = 40 M), which could be attributed to the low affinity of anilinyl nitrogen to Zn(II).198 IDA‐containing Zn(II) indicator FluoZin‐1198 has a higher affinity to Zn(II), but it is less selective than Newport Green PDX for Zn(II) over Ca(II) (the Kd values are shown in Fig. 23). Furthermore, IDA is ionized at the neutral pH. Therefore, for intracellular applications, FluoZin‐1 needs to be delivered as an acetoxymethyl ester (FluoZin‐1 AM),199 which upon entry into cell is hydrolyzed and trapped inside. A few other examples involving solely IDA as the ligand in a Zn(II) indicator have also been developed.200‐
202 Overall IDA is not applied as frequently as DPA in Zn(II) indicators. In all three examples in Fig. 23,
28
fluorescence of the xanthene is quenched by the anilinyl moiety, and is restored upon Zn(II) coordination – a typical PET switching mechanism similar to that of ACF‐2 in Fig. 21.
Fig. 23 Structures of Newport Green PDX, FluoZin‐1, and the cell membrane‐permeable FluoZin‐1 AM.198
What is intriguing and rarely discussed is DPA’s propensity to form a 2:1 complex with Zn(II) of a singular stereochemistry – cis‐facial. Zhu and coworkers characterized the Zn(II) complexes of a number of N‐alkylated DPA ligands in solid state and solution (acetonitrile).203 The 2:1 complexes unequivocally exhibit the cis‐facial stereochemistry, which was rationalized in a DFT calculation. The significance of the 2:1 complex in fluorescence imaging and quantitative analysis has yet to be scrutinized.
Fig. 24 Terpy‐containing fluorescent ligands 20,204 TTT,86 22,205 TAT,86 for Zn(II) ions. Compound 21206 contains a terpy analogue “clickate”.
Terpy forms both 2:1 (mer isomer) and 1:1 complexes with Zn(II). If terpy is connected to a fluorophore, the Zn(II)/terpy complex often quenches the fluorescence.86,204,205 Zn(II)‐binding lowers the LUMO level of terpy, renders it an efficient e‐acceptor to provide a PET pathway for the fluorophores in 20 (Fig. 24, left),204 TTT,86 and 21,206 which contains a 1,2,3‐triazolyl analogue of terpy (“clickate”), to relax non‐radiatively. The clickate/Zn(II) coordination is similar to that of terpy in both coordination geometry and associated fluorescence modulations.206 Compounds 22205 and TAT86 (Fig. 24, right) are ICT‐type fluorophores. Zn(II) binding at the e‐withdrawing terpy site enhances the charge transfer to the extent that full charge separation may be approached in the excited state, which would lead to the twisted internal charge transfer (TICT, Section 3‐3‐1) to reduce the fluorescence quantum yield.
(e) Bidentate ligands. Any combination of N/S/O ligands may afford bidentate ligands for Zn(II). The examples in Fig. 25 are selected for their relevance to Zn(II) biochemistry and indicator development. Bipy and phen are conjugated neutral ligands for Zn(II) and other transition metal ions. Phen is used for

29
colorimetric quantitative analysis of transition metal ions, and is an inhibitor of Zn(II) proteases, such as carboxypeptidase A.207 Extended conjugation from bipy and phen affords fluoroionophores208 that may be used as Zn(II) indicators. Pyrithione is a widely used ionophore for transporting Zn(II) ions in the form of [ZnL2] to intracellular space.209,210 Hydroxamates are potent Zn(II) protease inhibitors.211 These compounds offer two oxygen donors which are hard Lewis bases (see below) and are also good ferric ion ligands. Arylsulfonamides are known carbonic anhydrase inhibitors and have been developed into pharmaceuticals.212 The bidentate N‐arylsulfonyl‐8‐aminoquinoline (Fig. 25) is the earliest widely used fluorescent dye for histological staining of biological Zn(II).55
Fig. 25 A few bidentate ligands for Zn(II).
Bipy‐based molecules carrying arylvinyl groups at 4/5 and/or 4’/5’ positions are ICT type fluoroionophores (e.g., 23‐26 in Fig. 26).213‐216 Zn(II) coordination at the e‐withdrawing bipy moiety of 23‐26 stabilizes the emissive charge‐transfer state, which leads to a bathochromic shift of emission.213 The p‐anisyl group‐containing 23 undergoes an emission bathochromic shift and enhancement in both organic (acetonitrile)213 and neutral aqueous solutions (unpublished). The Kd of compound 23 is in micromolar (assuming a [ZnL] complex), which is not sensitive enough for recording moderate changes of intracellular nanomolar free Zn(II) concentrations in mammalian cells under basal conditions, but could be useful in situations when a dramatic fluctuation of local Zn(II) concentrations occurs.
Fig. 26 Fluorescent bipy (23‐26)213,214,216,217 and phen (27)218 derivatives are ICT fluoroionophores sensitive to Zn(II).
The symmetrically substituted bipy 24‐26 (Fig. 26)214,216,217 and phen (27)218 ligands are ICT type fluoroionophores, and they undergoes emission red shift upon Zn(II) binding. All these compounds have the potential to be developed as ratiometric Zn(II) indicators. Other bidentate ligands consisting of

30
nitrogen ligands in aromatic heterocycles, such as 2,2‐dipyridylamino,219 2‐(2’‐pyridyl)benzimidazolyl,220 and 4‐(2’‐pyridyl)‐1,2,3‐triazolyl221 groups, have also been conjugated with chromophores and shown fluorescence modulations upon Zn(II) coordination.
Zn(II) has coordination number up to 6 and could bind up to three bidentate ligands. Bipy is used here to illustrate the complexity of Zn(II) coordination chemistry with bidentate ligands in relation to the ligand fluorescence properties. Zn(II)/bipy complexes of all three stoichiometries (3:1, 2:1, and 1:1) have been characterized in the solid state.222 In a titration experiment using a fluorescent ICT‐type bipy derivative (28) and Zn(ClO4)2, the sequential formation of complexes up to 1:1 stoichiometry was observed (Scheme 9) using various experimental methods.213 As Zn(ClO4)2 was added to the acetonitrile solution of 28, the absorption spectrum undergoes a bathochromic shift until the ligand:Zn(II) ratio reaches 3:1. The emission at 480 nm is quenched, and isothermal titration colarimetry (ITC) registers a strongly exothermic transition till this point.
Increasing Zn(ClO4)2 up to 2:1 (ligand:Zn(II)) ratio affords only minimal changes in all three experiments. This observation suggests that the transition from 3:1 to 2:1 complexes does not carry either a spectroscopic or a thermal signature. Further addition of Zn(ClO4)2 significantly increases fluorescence intensity at a longer wavelength (604 nm), while no change in absorption and ITC trace is registered. Taking together, it was concluded that all the ligand molecules are bound with Zn(II) at 3:1 ligand:Zn(II) ratio, based on the absorption and ITC data. Fluorescence data suggests that [Zn(28)3]2+ and [Zn(28)2]
2+ complexes have low fluorescence quantum yields, while the [Zn(28)]2+ complex is highly emissive. This example underscores the need of using different experimental methods to study an equilibrium of multiple species to gain a complete picture and correct interpretation of the chemistry. Absorption spectroscopy or ITC alone would have missed the 1:1 complex formation.
Strongly coordinating anions, such as chloride, appear to favor the formation of the 1:1 complex.223,224 When ZnCl2 was used in place of Zn(ClO4)2 in the previous experiment, only a complex of the 1:1 stoichiometry ([Zn(28)Cl2]) was observed.213
Scheme 9 Observing stepwise Zn(II) coordination of compound 28 (R = N‐methyl‐2‐vinylpyrrole) using different techniques. X = monodentate counter ion or solvent. Charges on the complexes are omitted.213
31
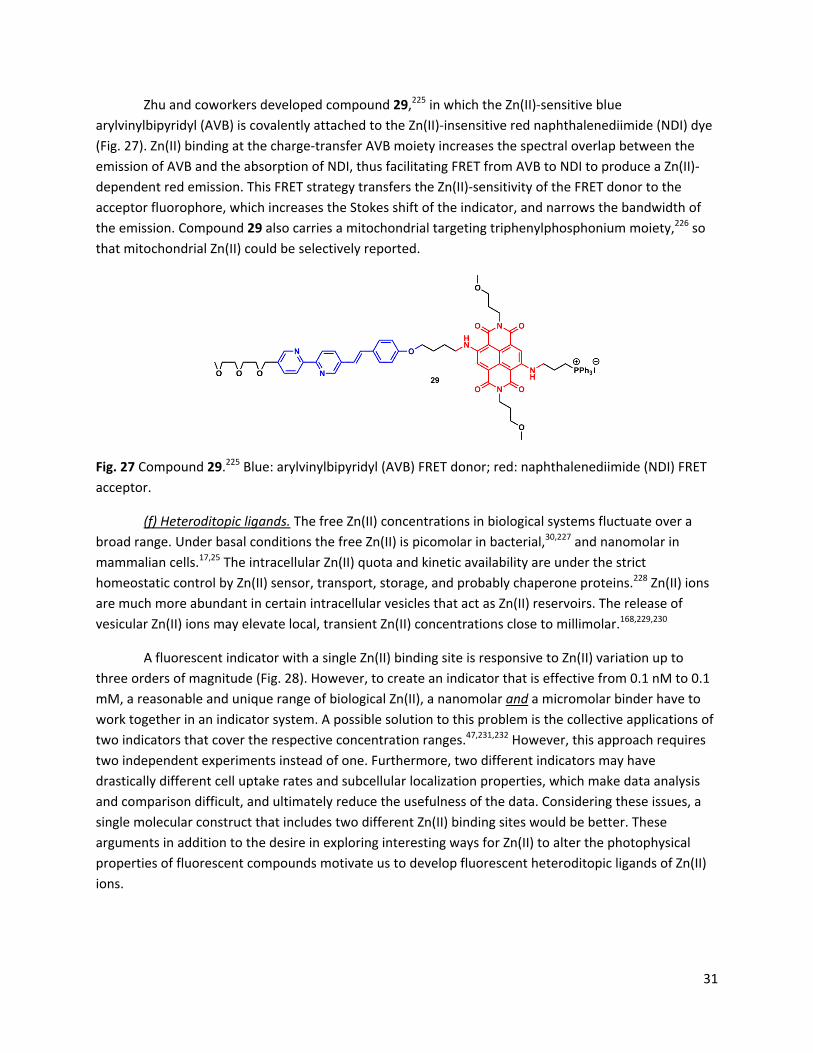
Zhu and coworkers developed compound 29,225 in which the Zn(II)‐sensitive blue arylvinylbipyridyl (AVB) is covalently attached to the Zn(II)‐insensitive red naphthalenediimide (NDI) dye (Fig. 27). Zn(II) binding at the charge‐transfer AVB moiety increases the spectral overlap between the emission of AVB and the absorption of NDI, thus facilitating FRET from AVB to NDI to produce a Zn(II)‐dependent red emission. This FRET strategy transfers the Zn(II)‐sensitivity of the FRET donor to the acceptor fluorophore, which increases the Stokes shift of the indicator, and narrows the bandwidth of the emission. Compound 29 also carries a mitochondrial targeting triphenylphosphonium moiety,226 so that mitochondrial Zn(II) could be selectively reported.
Fig. 27 Compound 29.225 Blue: arylvinylbipyridyl (AVB) FRET donor; red: naphthalenediimide (NDI) FRET acceptor.
(f) Heteroditopic ligands. The free Zn(II) concentrations in biological systems fluctuate over a broad range. Under basal conditions the free Zn(II) is picomolar in bacterial,30,227 and nanomolar in mammalian cells.17,25 The intracellular Zn(II) quota and kinetic availability are under the strict homeostatic control by Zn(II) sensor, transport, storage, and probably chaperone proteins.228 Zn(II) ions are much more abundant in certain intracellular vesicles that act as Zn(II) reservoirs. The release of vesicular Zn(II) ions may elevate local, transient Zn(II) concentrations close to millimolar.168,229,230
A fluorescent indicator with a single Zn(II) binding site is responsive to Zn(II) variation up to three orders of magnitude (Fig. 28). However, to create an indicator that is effective from 0.1 nM to 0.1 mM, a reasonable and unique range of biological Zn(II), a nanomolar and a micromolar binder have to work together in an indicator system. A possible solution to this problem is the collective applications of two indicators that cover the respective concentration ranges.47,231,232 However, this approach requires two independent experiments instead of one. Furthermore, two different indicators may have drastically different cell uptake rates and subcellular localization properties, which make data analysis and comparison difficult, and ultimately reduce the usefulness of the data. Considering these issues, a single molecular construct that includes two different Zn(II) binding sites would be better. These arguments in addition to the desire in exploring interesting ways for Zn(II) to alter the photophysical properties of fluorescent compounds motivate us to develop fluorescent heteroditopic ligands of Zn(II) ions.
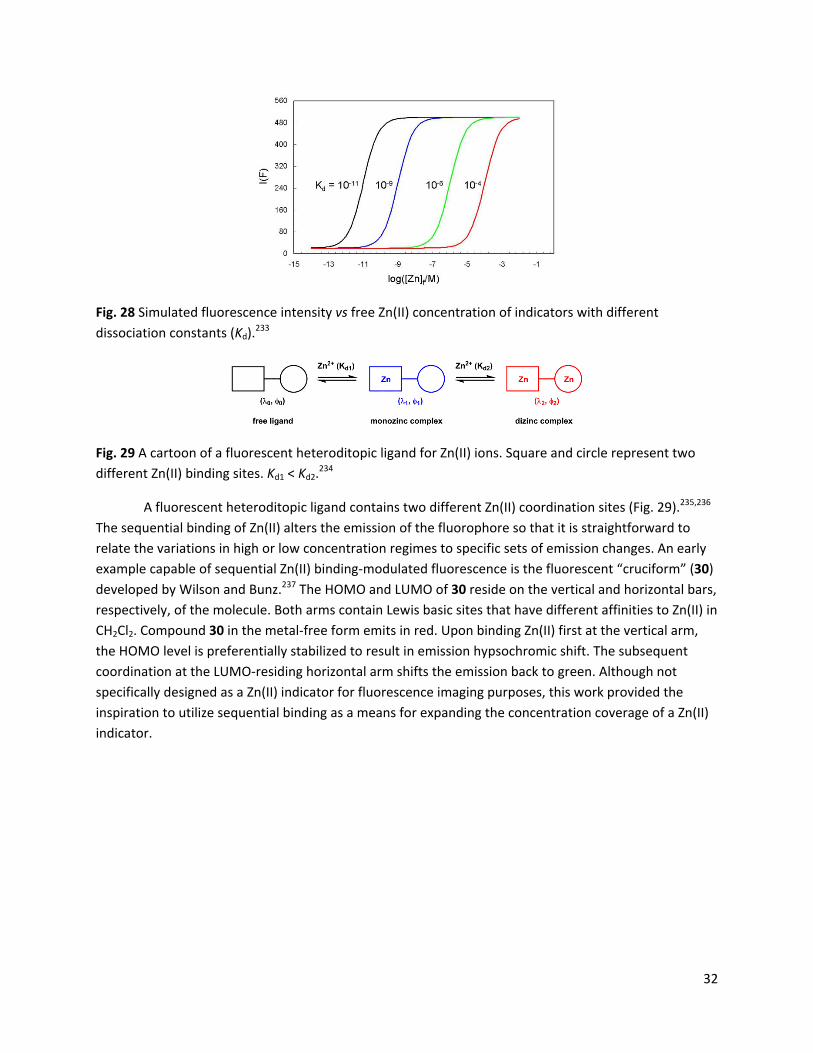
32
Fig. 28 Simulated fluorescence intensity vs free Zn(II) concentration of indicators with different dissociation constants (Kd).233
Fig. 29 A cartoon of a fluorescent heteroditopic ligand for Zn(II) ions. Square and circle represent two different Zn(II) binding sites. Kd1 < Kd2.234
A fluorescent heteroditopic ligand contains two different Zn(II) coordination sites (Fig. 29).235,236 The sequential binding of Zn(II) alters the emission of the fluorophore so that it is straightforward to relate the variations in high or low concentration regimes to specific sets of emission changes. An early example capable of sequential Zn(II) binding‐modulated fluorescence is the fluorescent “cruciform” (30) developed by Wilson and Bunz.237 The HOMO and LUMO of 30 reside on the vertical and horizontal bars, respectively, of the molecule. Both arms contain Lewis basic sites that have different affinities to Zn(II) in CH2Cl2. Compound 30 in the metal‐free form emits in red. Upon binding Zn(II) first at the vertical arm, the HOMO level is preferentially stabilized to result in emission hypsochromic shift. The subsequent coordination at the LUMO‐residing horizontal arm shifts the emission back to green. Although not specifically designed as a Zn(II) indicator for fluorescence imaging purposes, this work provided the inspiration to utilize sequential binding as a means for expanding the concentration coverage of a Zn(II) indicator.

33
Scheme 10 Sequential binding of Zn(II) to fluorescent “cruciform” 30 by Wilson and Bunz in CH2Cl2.237
Zhu and coworkers have developed fluorescent heteroditopic ligand platforms using different combinations of Zn(II) coordination‐mediated photophysical processes. Fluorescent heteroditopic ligand 31 undergoes sequential fluorescence enhancement (in low‐concentration regime) and emission wavelength shift (in high‐concentration regime) as Zn(II) concentration increases (Scheme 11).235 Compound 31 contains two Zn(II)‐binding ligands – the tridentate DPA (high affinity), and the bidentate bipy (low affinity) – and a phenylvinylbipyridyl ICT fluorophore. In the metal‐free form, 31 has weak fluorescence because the excited fluorophore is quenched via PET from the tertiary amino group. Zn(II) binding at the high‐affinity DPA moiety enhances fluorescence via attenuating PET. Further increase of Zn(II) concentration affords the dinuclear complex, in which bipy site is also occupied. The binding at bipy stabilizes the charge‐transfer excited state of the ICT fluorophore, thus leading to a bathochromic shift of emission.
Scheme 11 (a) Sequential Zn(II) binding of compound 31, and corresponding fluorescence changes.235 (b) A modified fluorescent heteroditopic ligand 32 with a pentadentate high‐affinity Zn(II) ligand.234

34
Fig. 30 A general heteroditopic ligand design with exchangeable aryl group (Ar) and high‐affinity (HF) site, which also acts as a PET quencher (Q).238
The fluorescence enhancement (1/0) upon Zn(II) binding at the high‐affinity site (HF, Fig. 30) and the emission band shift () when Zn(II) coordinates at the low‐affinity site (LF) are the parameters for evaluating a fluorescent heteroditopic ligand.234 The choice of the aryl ring on the fluorophore (e.g., phenyl in 31), affects both factors in conflicting ways.238 Increasing the electron density of the aryl ring (e.g., from phenyl to thienyl) creates a larger emission band shift () because the charge transfer character of the fluorophore is strengthened.213 However, the improvement in comes at the expense of lowering the degree of fluorescence enhancement because the PET in the Zn(II)‐free form becomes less efficient with an electron‐richer fluorophore (the e‐acceptor in PET).93,238 The phenyl group in 31 offers the best compromise in acetonitrile (1/0 = 18, = 60 nm). However, in aqueous solutions, the of phenylvinylbipyridyl is reduced to 28 nm.233
To create a heteroditopic ligand that responds to Zn(II) over a large concentration range in buffered neutral aqueous solutions, the tridentate DPA in 31 is replaced by the pentadentate N,N,N’‐tris(pyridylmethyl)ethyleneamino and their fluorinated analogues.233,234 Compound 32 (Scheme 11) undergoes a more than 5‐fold fluorescence enhancement followed by emission bathochromic shift over a range of 0.1 nM to 0.1 mM of free Zn(II).234 The deficiency of this compound is still the emission band separation, which is too small (32 nm) for the two bands to be captured by two different emission filter sets, for example, blue (i.e., 420‐480 nm) and green (i.e., 510‐560 nm).
Addressing the small emission band shift () issue in compounds 31 and 32 requires an entirely new molecular design. The small in polar solvents such as water is an inherent consequence of a change‐transfer fluoroionophore.213 When it is in the Zn(II)‐free form, the emission of the AVB fluoroionophore is positively solvatochromic. When Zn(II) binds at the negative end of the excited state dipole of an AVB fluoroionophore, the solvent effect diminishes because the excited state is primarily stabilized by a Zn(II) ion, rather than solvent dipoles. The differing solvent polarity effect on free and Zn(II)‐bound AVB fluoroionophore leads to the small values in polar solvents.
The solvent effect on a fluorescent heteroditopic ligand can be reduced by employing a two‐fluorophore molecular design.239 The fluorophore that responds to the Zn(II) variation in the low concentration regime shall be non‐solvatochromic, such as the anthryl group in compound 33 (Scheme 12). As the DPA ligand in 33 captures a Zn(II) ion to switch off PET, the anthryl fluorescence is enhanced. When Zn(II) binds at the bipy site of 33 to form the dinuclear complex, the absorption of the thienylvinylbipyridyl bathochromically shifts to overlap with the emission band of the anthryl. Such an overlap leads to FRET from anthryl to the Zn(II)‐bound AVB fluorophore, which switches off anthryl emission and turns on the Zn(II)‐AVB complex fluorescence. Both emitting fluorophores – anthryl and
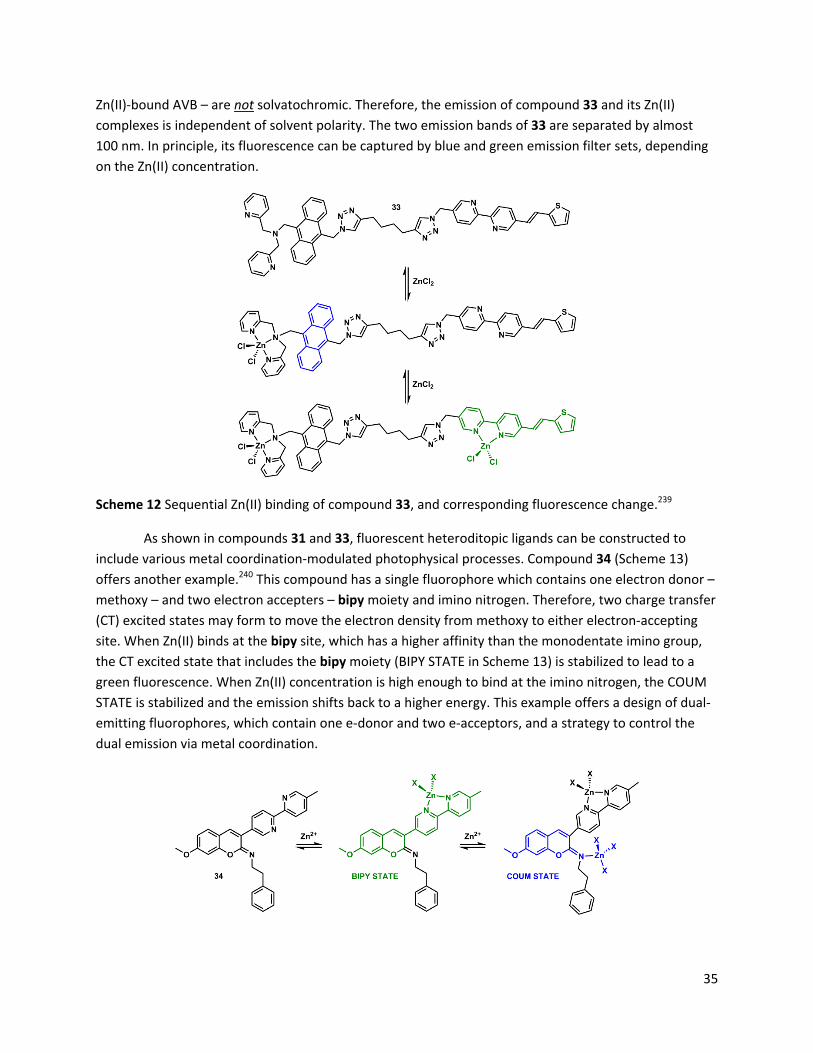
35
Zn(II)‐bound AVB – are not solvatochromic. Therefore, the emission of compound 33 and its Zn(II) complexes is independent of solvent polarity. The two emission bands of 33 are separated by almost 100 nm. In principle, its fluorescence can be captured by blue and green emission filter sets, depending on the Zn(II) concentration.
Scheme 12 Sequential Zn(II) binding of compound 33, and corresponding fluorescence change.239
As shown in compounds 31 and 33, fluorescent heteroditopic ligands can be constructed to include various metal coordination‐modulated photophysical processes. Compound 34 (Scheme 13) offers another example.240 This compound has a single fluorophore which contains one electron donor – methoxy – and two electron accepters – bipy moiety and imino nitrogen. Therefore, two charge transfer (CT) excited states may form to move the electron density from methoxy to either electron‐accepting site. When Zn(II) binds at the bipy site, which has a higher affinity than the monodentate imino group, the CT excited state that includes the bipy moiety (BIPY STATE in Scheme 13) is stabilized to lead to a green fluorescence. When Zn(II) concentration is high enough to bind at the imino nitrogen, the COUM STATE is stabilized and the emission shifts back to a higher energy. This example offers a design of dual‐emitting fluorophores, which contain one e‐donor and two e‐acceptors, and a strategy to control the dual emission via metal coordination.

36
Scheme 13 Sequential Zn(II) binding of compound 34, and corresponding fluorescence changes. X = monodentate counter ion or solvent molecule.240
A fluorescent heteroditopic ligand can be created so that all three coordination states (metal‐free, mono‐, and di‐coordinated) are emissive and occupy three different regions of the visible spectrum. Compound 35 is a covalent conjugate of an AVB fluorophore and rhodamine spirolactam (Scheme 14).241 The free ligand has blue emission from the AVB fluorophore, which upon formation of the monozinc(II) complex emits in green. Rhodamine spirolactam absorbs in UV and does not emit. When Zn(II) ions are abundant enough to interact with the carbonyl of the spirolactam, The spirolactam ring opens to afford rhodamine that emits strongly in orange. This compound is an example whose fluorescence color changes across the visible spectrum over a Zn(II) concentration gradient. The Zn(II)‐effected rhodamine spirolactam ring opening chemistry242‐244 in compound 35, however, is ineffective in aqueous solutions, which prevents this ditopic system to be applied as an indicator for biological Zn(II) imaging. Projects that aim to improve the rate of Zn(II)‐keyed spirolactam ring opening in aqueous solutions are ongoing in our laboratory.
Scheme 14 Sequential Zn(II) binding of compound 35, and corresponding fluorescence changes.241
4‐2.Coordinationaffinity
4‐2‐1.AfewobservationsofaZn(II)/ligandbindingequilibrium
Scheme 15 A model of Zn(II) coordination equilibrium with a tridentate ligand (blue). The octahedral Zn(II) geometry in the 1:1 complex is arbitrary. The facial stereochemistry is observed for most tridentate Zn(II) ligands, except terpy.
37
A typical binding equilibrium between a solvated Zn(II) ion and a tridentate ligand (blue) is shown in Scheme 15. Zn(II) is delivered as ZnX2 (X is a monodentate counter ion). Solvent (S) is designated as monodentate. The forward equilibrium constant is defined as the association constant (Ka), and the reverse the dissociation constant (Kd). Common complications in quantitative analysis of the binding equilibrium are apparent in Scheme 15. Assuming the solvent is water, the vaguely defined “free zinc(II) ions”25,228 are in their solvated, and possibly counter ion‐bound forms. Upon formation of a 1:1 complex with the tridentate ligand, the Zn(II) ion either is desolvated (as shown), or loses its counter ions. Therefore, the magnitude of Ka (and Kd) depends on the solvation energy of Zn(II) and the strength of counter ion/Zn(II) interaction.
A ligand for Zn(II) is also a Brønsted base. Consequently, the acid‐base equilibrium involving the ligand affects the observed Zn(II) binding affinity. Furthermore, due to the flexible coordination number that Zn(II) adapts to, Zn(II) complexes of different binding stoichiometries may coexist. All these issues contribute to the difficulty in analyzing the binding equilibria, especially using spectroscopic means if some processes leave spectral signatures but others do not. Potentiometric titration shall give a relatively complete picture of the binding equilibria,211,245 but this experiment often requires a significantly larger amount of ligand than optical spectroscopic methods. A compromised solution is to report an apparent dissociation constant of an assumed [ZnL] complex as a uniform standard for comparing the affinities of ligands to Zn(II) ions. In these experiments, the pH (e.g., 7.4) and ionic strength (e.g., I = 0.1) shall be kept identical, and conditions discouraging the formation of complexes of other stoichiometries shall be employed (e.g., dilute conditions, water as the solvent to afford a strong solvent/Zn(II) interaction, and to minimize counter ion effect).
(9)
Another method to compare the affinities of various ligands to Zn(II), regardless of stoichiometry, is the pZn scale (eq. 9).245 The pZn scale reflects the free Zn(II) ion availability of a solution, which is analogous to the pH scale for measuring proton availability. To use the pZn values to compare Zn(II) affinities of different ligands, these values have to be measured under identical conditions, including the total concentrations of Zn(II) and the ligand, environmental parameters such as pH, temperature, and ionic strength. A few published pZn values are co‐listed with apparent Kd values of the ligands in Fig. 31. The conditions of the measurements are shown in the caption.
4‐2‐2.Measuringadissociationconstant(Kd)inametalion‐bufferedsystem
The apparent dissociation constant of an assumed 1:1 (ligand:Zn(II)) complex can be measured under metal‐buffered neutral aqueous conditions, where the total Zn(II) concentration ([Zn]t) is close to millimolar. Because the majority of Zn(II) ions is bound with the metal ion‐buffering ligands, the free Zn(II) (unbound from the metal‐buffering ligands, hydrated Zn(II) ions)25 is kept at much lower levels. Therefore, this situation mimics that in the intracellular milieu, where the total Zn(II) abundance (i.e., Zn(II) quota) is high, while the majority of which is locked in with Zn(II)‐binding proteins.25,246 The fluctuation of the free Zn(II) concentration ([Zn]f) may trigger the release or uptake of Zn(II) by Zn(II)‐binding proteins, such as metallothioneins,25,27,247 to offset the change, therefore creating a buffering
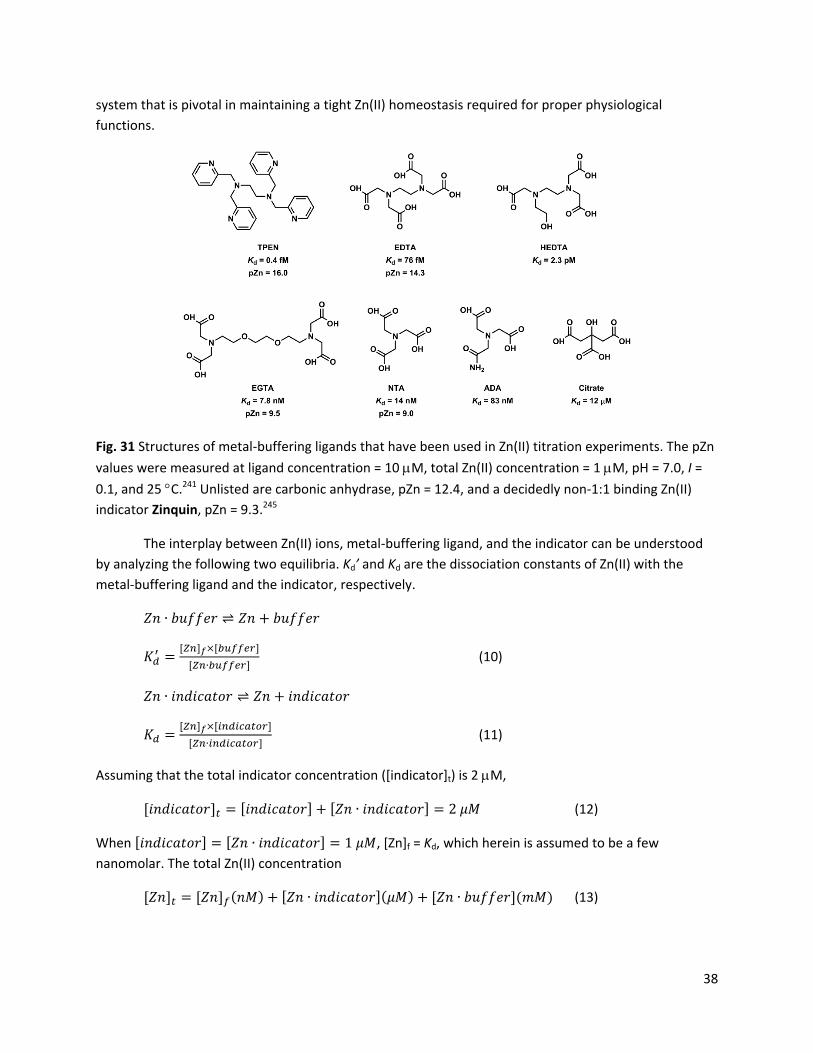
38
system that is pivotal in maintaining a tight Zn(II) homeostasis required for proper physiological functions.
Fig. 31 Structures of metal‐buffering ligands that have been used in Zn(II) titration experiments. The pZn values were measured at ligand concentration = 10 M, total Zn(II) concentration = 1 M, pH = 7.0, I = 0.1, and 25 C.241 Unlisted are carbonic anhydrase, pZn = 12.4, and a decidedly non‐1:1 binding Zn(II) indicator Zinquin, pZn = 9.3.245
The interplay between Zn(II) ions, metal‐buffering ligand, and the indicator can be understood by analyzing the following two equilibria. Kd’ and Kd are the dissociation constants of Zn(II) with the metal‐buffering ligand and the indicator, respectively.
∙ ⇌
∙ (10)
∙ ⇌
∙ (11)
Assuming that the total indicator concentration ([indicator]t) is 2 M,
∙ (12)
When ∙ , [Zn]f = Kd, which herein is assumed to be a few nanomolar. The total Zn(II) concentration
∙ ∙ (13)
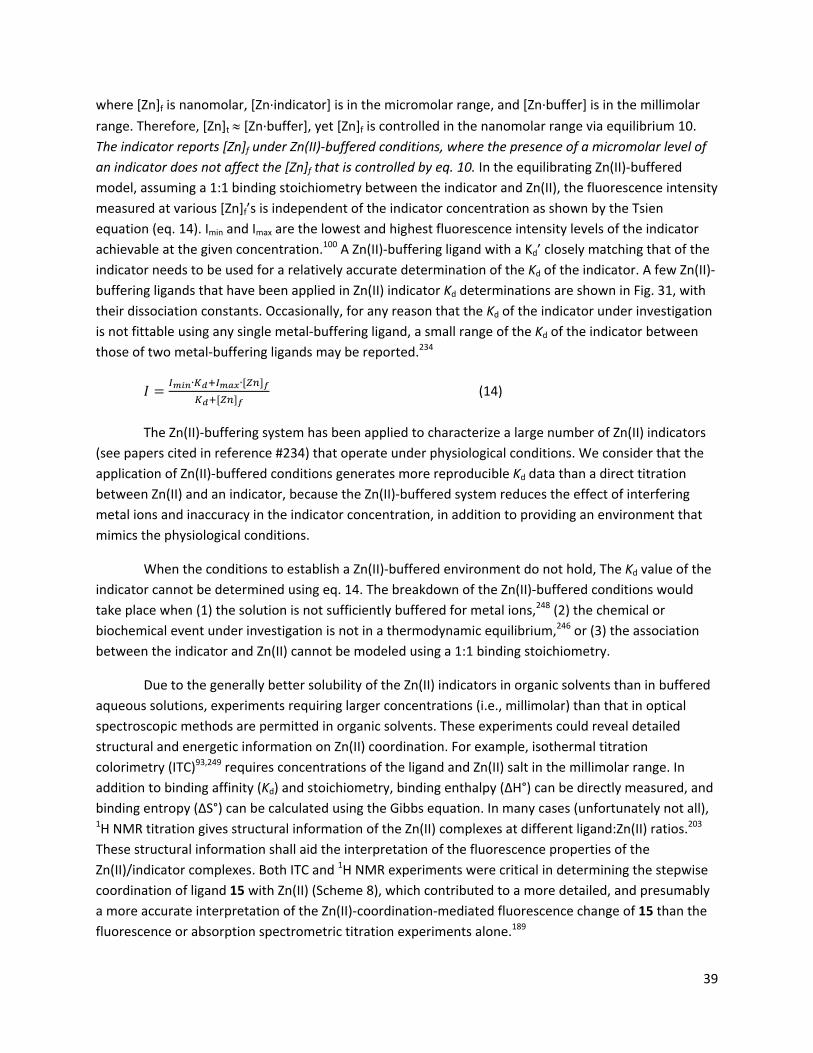
39
where [Zn]f is nanomolar, [Zn∙indicator] is in the micromolar range, and [Zn∙buffer] is in the millimolar range. Therefore, [Zn]t [Zn∙buffer], yet [Zn]f is controlled in the nanomolar range via equilibrium 10. The indicator reports [Zn]f under Zn(II)‐buffered conditions, where the presence of a micromolar level of an indicator does not affect the [Zn]f that is controlled by eq. 10. In the equilibrating Zn(II)‐buffered model, assuming a 1:1 binding stoichiometry between the indicator and Zn(II), the fluorescence intensity measured at various [Zn]f’s is independent of the indicator concentration as shown by the Tsien equation (eq. 14). Imin and Imax are the lowest and highest fluorescence intensity levels of the indicator achievable at the given concentration.100 A Zn(II)‐buffering ligand with a Kd’ closely matching that of the indicator needs to be used for a relatively accurate determination of the Kd of the indicator. A few Zn(II)‐buffering ligands that have been applied in Zn(II) indicator Kd determinations are shown in Fig. 31, with their dissociation constants. Occasionally, for any reason that the Kd of the indicator under investigation is not fittable using any single metal‐buffering ligand, a small range of the Kd of the indicator between those of two metal‐buffering ligands may be reported.234 ∙ ∙
(14)
The Zn(II)‐buffering system has been applied to characterize a large number of Zn(II) indicators (see papers cited in reference #234) that operate under physiological conditions. We consider that the application of Zn(II)‐buffered conditions generates more reproducible Kd data than a direct titration between Zn(II) and an indicator, because the Zn(II)‐buffered system reduces the effect of interfering metal ions and inaccuracy in the indicator concentration, in addition to providing an environment that mimics the physiological conditions.
When the conditions to establish a Zn(II)‐buffered environment do not hold, The Kd value of the indicator cannot be determined using eq. 14. The breakdown of the Zn(II)‐buffered conditions would take place when (1) the solution is not sufficiently buffered for metal ions,248 (2) the chemical or biochemical event under investigation is not in a thermodynamic equilibrium,246 or (3) the association between the indicator and Zn(II) cannot be modeled using a 1:1 binding stoichiometry.
Due to the generally better solubility of the Zn(II) indicators in organic solvents than in buffered aqueous solutions, experiments requiring larger concentrations (i.e., millimolar) than that in optical spectroscopic methods are permitted in organic solvents. These experiments could reveal detailed structural and energetic information on Zn(II) coordination. For example, isothermal titration colorimetry (ITC)93,249 requires concentrations of the ligand and Zn(II) salt in the millimolar range. In addition to binding affinity (Kd) and stoichiometry, binding enthalpy (ΔH°) can be directly measured, and binding entropy (ΔS°) can be calculated using the Gibbs equation. In many cases (unfortunately not all), 1H NMR titration gives structural information of the Zn(II) complexes at different ligand:Zn(II) ratios.203 These structural information shall aid the interpretation of the fluorescence properties of the Zn(II)/indicator complexes. Both ITC and 1H NMR experiments were critical in determining the stepwise coordination of ligand 15 with Zn(II) (Scheme 8), which contributed to a more detailed, and presumably a more accurate interpretation of the Zn(II)‐coordination‐mediated fluorescence change of 15 than the fluorescence or absorption spectrometric titration experiments alone.189

40
4‐3.Coordinationkinetics
The Zn(II)/protein binding (kon) operates at best at the diffusion limit. Most Zn(II)‐dependent proteins have nanomolar or picomolar affinities (e.g., carbonic anhydrase II has a pKd of 12.1), which results in very slow dissociation rates (koff).33 For processes involving “mobile” Zn(II) ions, the local, transient fluctuations of [Zn(II)] can be rapid, in minutes or even seconds. The glucose‐stimulated insulin release, which can be monitored using co‐released Zn(II) ions as a marker, occurs in a few to tens of seconds.250,251. The synaptic Zn(II) release in hippocampal slices usually is monitored over seconds to minutes.252‐254 In one study on the possible role of Zn(II) as a second messenger, the Zn(II) “wave” is shown to occur over minutes. The concurrent Ca(II) fluctuation occurs in seconds.255 An indicator shall have a faster response time to its analyte than the rate of the process that the analyte participates in. Therefore, these observations suggest that the Zn(II) binding (association and dissociation) kinetics of the indicators developed to monitor these biological processes shall be within seconds or at very least minutes.
(15)
Assuming a Zn(II) complex of 1:1 stoichiometry is formed in a single elementary step, the dissociation constant of the complex (Kd) is the ratio of dissociation rate constant (koff) over that of association (kon, eq. 15). The kon values of a few Zn(II) indicators measured in neutral aqueous solutions using the stopped‐flow method are listed in Fig. 32.256 The values of koff (not listed because in some cases Kd and kon were measured at different temperatures) could be calculated using eq. 15. Cyclen‐containing compound 18 has nanomolar affinity to Zn(II),194,257 but the kon value is relatively small (56 M‐1s‐1),257 which leads to a very slow dissociation, and renders the association equilibrium essentially irreversible. Capping cyclen with an amino ligand increases both affinity and kon (compound 36 in Fig. 32).257 However, the dissociation becomes even slower as the complex becomes tighter. The kinetically stable cyclen or cyclam metal complexes have been used as anion indicators.258,259
The kinetic data of the ZnAF series by Nagano and coworkers,183,231 the ZP series by Lippard and coworkers,232,260 and the two triazolyl‐containing compounds developed by our group191 were collected using the stopped‐flow method. All compounds contain at least one 2‐aminomethylpyridyl bidentate unit, which appears to be adequate to achieve a kon on the scale of 106 M‐1s‐1 at room temperature (25 °C). At this kon value, a micromolar (Kd) Zn(II) binder would give a koff on the scale of 1‐100 s‐1, probably large enough to record fast biological Zn(II) flux events. However, nanomolar or tighter binders as often reported for DPA‐containing indicators would give koff on the scale of 10‐3 s‐1, unsuitable for monitoring rapid biological Zn(II) fluctuations.
Based on the limited kinetic data available at this point, the following conclusions may be drawn:

41
Fig. 32 Dissociation (Kd) and association rate constants (kon) of a few Zn(II) indicators (references are cited in the text). X = monodentate counter ion or solvent. The charges of these structures are omitted in their formula.
42
(1) Macrocyclic ligands such as cyclen have slow association and dissociation rates. The fact that cyclen is heavily protonated at neutral pH does not help because shedding off protons to allow Zn(II) binding slows down the coordination equilibrium.
(2) DPA‐containing ligands afford kon over 106 M‐1s‐1, and Kd lower than 100 nM, which puts koff less than 0.1 s‐1. This value of koff may limit their uses in monitoring fast biological Zn(II) fluxes.
(3) Replacing one pyridyl group in DPA with a weaker ligand or a non‐binder does not decrease kon as much as increase Kd, thus leading to a much larger koff.228,229 The faster dissociation kinetics comes at the expense of a lower affinity.
As a tool of visualizing minimally disturbed biological processes, the binding kinetics of Zn(II) indicators shall be much faster than the Zn(II)‐involved biological events under investigation. Therefore, to have a toolbox of Zn(II) indicators with different Zn(II)‐binding rates would be helpful to determine with confidence the kinetics of the targeted Zn(II)‐involved biological processes.
4‐4.Coordinationselectivity
Ligand choice is an important consideration in Zn(II) indicator development. A Zn(II) ligand is preferred to show higher affinity to Zn(II) than that to any possible competing ions, so that both false positives, when a competing ion elicits the same fluorescence response from the Zn(II) indicator, and false negatives, when the competing ion quenches the fluorescence, are minimized. Based on this argument, the selectivity of a Zn(II) indicator shall be primarily determined by the selective binding to Zn(II) by the ligand portion of the indicator.
The competing ions for a Zn(II) indicator, in a biological setting and otherwise, can be classified in three groups: (a) hydronium ions in an aqueous solution, and other solvated protons found in organic solvents, (b) alkali and alkaline earth ions, and (c) transition metal ions of low oxidation states. The metal ions with +3 oxidation state that are remotely relevant to the issue of Zn(II) selectivity are aluminum(III), iron(III), and Co(III). Metal species with oxidation state large than +3 most likely form oxo anions in aqueous solutions, which would not interfere with a Zn(II) coordination reaction. The following discussions are in the most part limited in the selectivity in aqueous solutions.
4‐4‐1.Hydroniumions
Protonation of the Lewis basic ligand portion of a Zn(II) indicator in most cases alters the fluorescence property in the same way as Zn(II) binding. In a PET‐switching system in which the ligand portion is the e‐donor, protonation would restore the fluorescence by shutting down PET. In an ICT system in which the ligand site is the e‐withdrawing component of the fluoroionophore, protonation would enhance ICT to afford a red shift of emission. In a neutral aqueous solution, whether protonation would interfere with the Zn(II) response depends on how close the pKa of the ligand portion is to neutrality. Therefore, it is always advisable to measure the pKa of the Zn(II) indicator to evaluate the susceptibility of the Zn(II)‐dependent fluorescence to the interference by protonation.
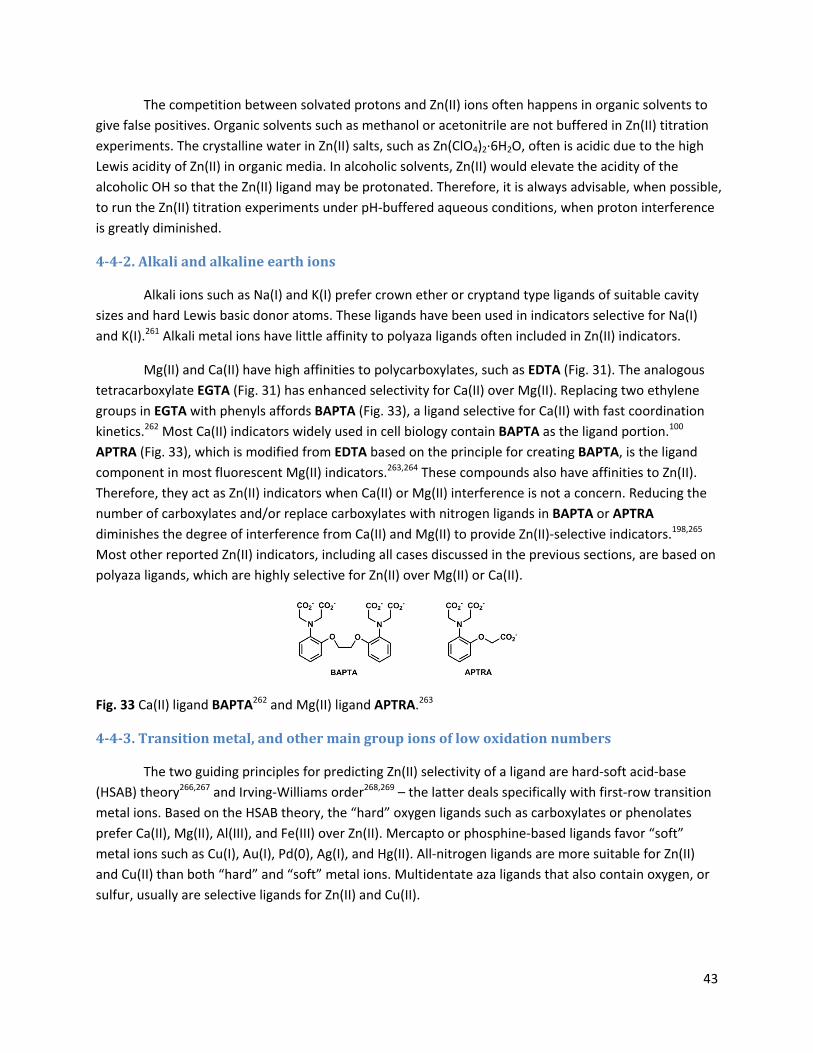
43
The competition between solvated protons and Zn(II) ions often happens in organic solvents to give false positives. Organic solvents such as methanol or acetonitrile are not buffered in Zn(II) titration experiments. The crystalline water in Zn(II) salts, such as Zn(ClO4)2∙6H2O, often is acidic due to the high Lewis acidity of Zn(II) in organic media. In alcoholic solvents, Zn(II) would elevate the acidity of the alcoholic OH so that the Zn(II) ligand may be protonated. Therefore, it is always advisable, when possible, to run the Zn(II) titration experiments under pH‐buffered aqueous conditions, when proton interference is greatly diminished.
4‐4‐2.Alkaliandalkalineearthions
Alkali ions such as Na(I) and K(I) prefer crown ether or cryptand type ligands of suitable cavity sizes and hard Lewis basic donor atoms. These ligands have been used in indicators selective for Na(I) and K(I).261 Alkali metal ions have little affinity to polyaza ligands often included in Zn(II) indicators.
Mg(II) and Ca(II) have high affinities to polycarboxylates, such as EDTA (Fig. 31). The analogous tetracarboxylate EGTA (Fig. 31) has enhanced selectivity for Ca(II) over Mg(II). Replacing two ethylene groups in EGTA with phenyls affords BAPTA (Fig. 33), a ligand selective for Ca(II) with fast coordination kinetics.262 Most Ca(II) indicators widely used in cell biology contain BAPTA as the ligand portion.100 APTRA (Fig. 33), which is modified from EDTA based on the principle for creating BAPTA, is the ligand component in most fluorescent Mg(II) indicators.263,264 These compounds also have affinities to Zn(II). Therefore, they act as Zn(II) indicators when Ca(II) or Mg(II) interference is not a concern. Reducing the number of carboxylates and/or replace carboxylates with nitrogen ligands in BAPTA or APTRA diminishes the degree of interference from Ca(II) and Mg(II) to provide Zn(II)‐selective indicators.198,265 Most other reported Zn(II) indicators, including all cases discussed in the previous sections, are based on polyaza ligands, which are highly selective for Zn(II) over Mg(II) or Ca(II).
Fig. 33 Ca(II) ligand BAPTA262 and Mg(II) ligand APTRA.263
4‐4‐3.Transitionmetal,andothermaingroupionsoflowoxidationnumbers
The two guiding principles for predicting Zn(II) selectivity of a ligand are hard‐soft acid‐base (HSAB) theory266,267 and Irving‐Williams order268,269 – the latter deals specifically with first‐row transition metal ions. Based on the HSAB theory, the “hard” oxygen ligands such as carboxylates or phenolates prefer Ca(II), Mg(II), Al(III), and Fe(III) over Zn(II). Mercapto or phosphine‐based ligands favor “soft” metal ions such as Cu(I), Au(I), Pd(0), Ag(I), and Hg(II). All‐nitrogen ligands are more suitable for Zn(II) and Cu(II) than both “hard” and “soft” metal ions. Multidentate aza ligands that also contain oxygen, or sulfur, usually are selective ligands for Zn(II) and Cu(II).

44
A harder judgment to pass would be the selectivity between Zn(II) and other first‐row transition metal ions. The Irving‐Williams order (Mn(II) < Fe(II) < Co(II) < Ni(II) < Cu(II) > Zn(II))268 offers a theoretical model for selectivity prediction. A safe conclusion to draw is Cu(II)’s superiority in binding affinity to a given ligand over all the other first‐row divalent neighbors. Indeed, rarely has Zn(II) been reported to have a higher affinity than Cu(II) for a given ligand.270 However, the Irving‐Williams order does not address the binding preference between Zn(II) and the rest of the members in the series. The ambiguity of Zn(II) placement in the Irving‐Williams order is reflected in the metal ion affinity data of DPA, TPA, and TPEN (Table 1),152 as well as in reports of Zn(II) indicators. In some cases the ligands are selective for Zn(II) over Fe(II)/Co(II)/Ni(II), but in many other instances the latter three ions of paramagnetic electron configurations show high affinity to the Zn(II) indicators and quench their fluorescence. A few hypotheses could be conceived in designing compounds with a higher selectivity for Zn(II) than Fe(II)/Co(II)/Ni(II), based on their different coordination numbers and the redox properties. Fe(II)/Co(II)/Ni(II) prefer octahedral geometry, while Zn(II) are impartial to coordination numbers 4‐6.150 Ligands with low‐lying LUMO levels may have stronger affinities to Fe(II)/Co(II)/Ni(II) than predicted from their Lewis acidities (Table 1), because metal‐to‐ligand charge transfer (MLCT) may occur in the ground state. Therefore, by choosing ligands with a reasonably high LUMO levels may skew the selectivity toward Zn(II).
Table 1 Ionic radii, polarizabilities, and 1:1 complex dissociation constants (Kd) of 8 divalent ions to DPA, TPA, and TPEN – 6 of the Irving‐Williams series, in addition to Cd(II) and Pb(II).
Mn(II) Fe(II) Co(II) Ni(II) Cu(II) Zn(II) Cd(II) Pb(II) Ionic radius/pm (Wikipedia)
97 (hs)a 81 (ls)b
92 (hs)a 75 (ls)b
88 (hs)a 79 (ls)b 83 87 88 109 133
Ionic radiusc/pm271 80 74 70 66 69 71 91 112 Ionic radiusc/pm272 80 76 72 69 57 74 95 118 Polarizability273 NA ‐1.0 NA NA 0.2 0.8 1.8 4.8 Average observed coordination # (AOCN)271 6 6 6 6 5d 5
e 6 7
Lewis acidity271 0.34 0.34 0.35 0.34 0.39 0.40 0.32 0.29 DPA (pKd)152 3.5 6.2 8.1 9.3 13.9 7.6 6.4 6.0 TPA (pKd)152 5.6 8.7 11.4 14.6 16.2 11.0 9.9 8.6 TPEN (pKd)152 10.3 14.6 16.6 21.6 20.5 15.6 16.3 14.0 a. hs – high spin; b. ls – low spin; c. hs and ls are not distinguished; d. square pyramidal; Jahn‐Teller hexa‐coordinated is also common. e. 4, 5, and 6 are equally possible; trigonal bipyramidal more likely than square planar when 5.
4‐4‐4.IndicatorsselectiveforeitherZn(II)orCd(II)
In addition to first‐row transition metal ions, the selectivity between Zn(II) and Cd(II) or Pb(II) has been increasingly studied due to the growing interest in developing indicators for Cd(II) and Pb(II), elements of environmental concerns. Pb(II) is much larger and a weaker Lewis acid than Zn(II) (Table 1). Therefore, indicators designed for Zn(II) usually would not be interfered by Pb(II). Developing indicators

45
that are selective for either Zn(II) or Cd(II) is an interesting challenge. Both ions are in group IIB in the periodic table. They have similar coordination chemistry, and for many ligands they are interchangeable as suitable metal ions. Indeed, the Zn(II)‐binding, cysteine‐rich metallothionein was first isolated using Cd(II) as the substitute metal.274 On the other hand, Zn(II) transporter (ZnT) proteins, which utilizes histidines for binding, select Zn(II) over Cd(II).275 The Zn(II)/Cd(II) selectivity achieved by the evolutionary forces motivates the laboratory efforts to replicate this selectivity.
Achieving selectivity between Zn(II) and Cd(II) in fluorescent indicator development has drawn rapidly growing interest because Cd(II) has been recognized as an environmental pollutant, thus justifying the development of Cd(II)‐selective indicators in environmental chemical analysis.276 Similar to Pb(II), Cd(II) has a larger ionic radius than Zn(II) (Table 1); it is also a weaker Lewis acid than Zn(II).271 Therefore, ligands developed for Zn(II) in most cases would show a significant, but weaker affinity to Cd(II), and consequently less fluorescence changes.277 Also, if an indicator undergoes emission red shift upon Zn(II) binding due to the stabilization of excited state dipole of the fluorophore by Zn(II), the degree of the red shift is usually smaller if Cd(II) is used in acquiring the spectrum (see Section 4‐4‐4c). In addition to these general points, interesting cases still emerge to teach us new lessons in Zn(II) and Cd(II) coordination chemistry. In the following examples, different effects of Zn(II) and Cd(II) coordination on the fluorescence of the ligands are described.
Fig. 34 “Steric crowding” decreases selectivity for Zn(II) over Cd(II).277,278
(a) Size difference and “steric crowding”. The ionic radius of Cd(II) is larger than that of Zn(II) (Table 1). Therefore, a ligand can be designed to have a small or large cavity size to favor either Zn(II) or Cd(II),279 respectively. In a series of studies by the groups of Mikata and Hancock, quinolinyl and isoquinolinyl‐containing tripodal ligands analogous to TPA,277,278 and hexadentate ligands derived from TPEN,154‐157,280,281 exhibit varied selectivities between Zn(II) and Cd(II). These fluorescent ligands are quenched via intramolecular PET from the tertiary amino groups. The binding with either Zn(II) or Cd(II) restores the fluorescence. The relative fluorescence enhancement upon binding Zn(II) and Cd(II) provides a measure of the selectivity of each ligand. The hexadentate TQEN (Fig. 34) forms strong 1:1 complexes with both Zn(II) and Cd(II) with low Zn(II)/Cd(II) selectivity.154 The quinolinyl groups of TQEN appear to butt into each other in forming a tight complex with the smaller Zn(II), which reduces the Zn(II)/Cd(II) selectivity of TQEN.156 This observation is termed by Hancock as the “steric crowding”
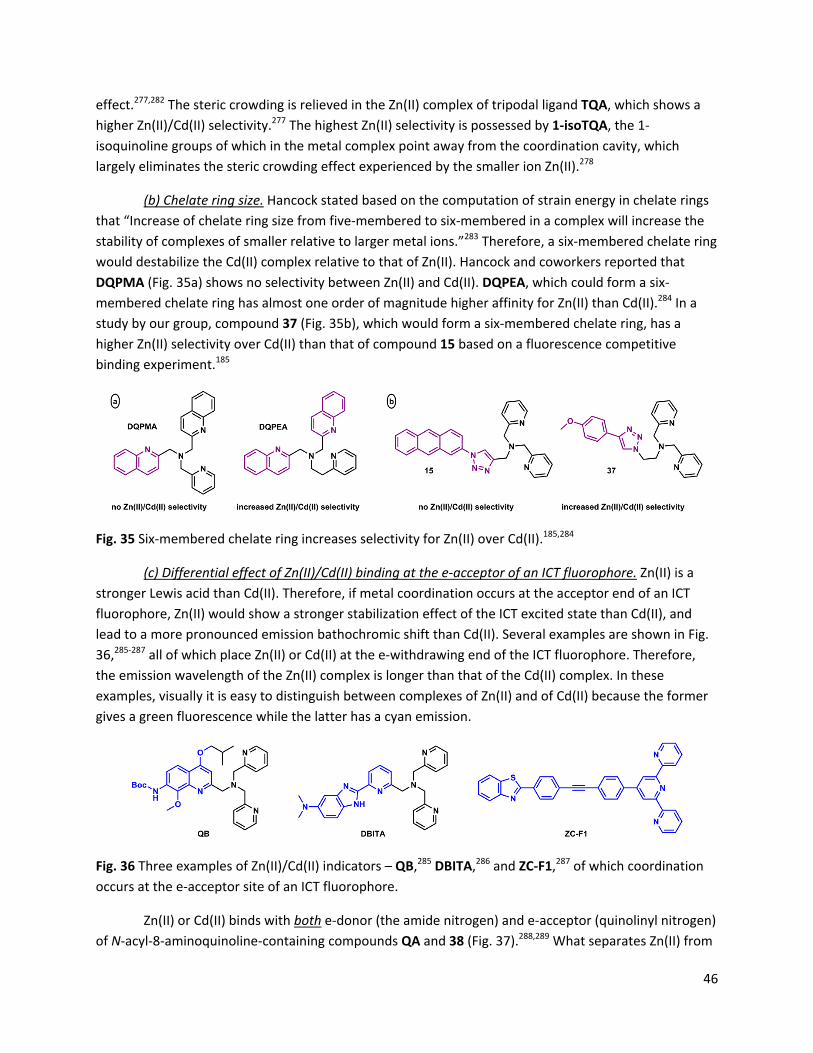
46
effect.277,282 The steric crowding is relieved in the Zn(II) complex of tripodal ligand TQA, which shows a higher Zn(II)/Cd(II) selectivity.277 The highest Zn(II) selectivity is possessed by 1‐isoTQA, the 1‐isoquinoline groups of which in the metal complex point away from the coordination cavity, which largely eliminates the steric crowding effect experienced by the smaller ion Zn(II).278
(b) Chelate ring size. Hancock stated based on the computation of strain energy in chelate rings that “Increase of chelate ring size from five‐membered to six‐membered in a complex will increase the stability of complexes of smaller relative to larger metal ions.”283 Therefore, a six‐membered chelate ring would destabilize the Cd(II) complex relative to that of Zn(II). Hancock and coworkers reported that DQPMA (Fig. 35a) shows no selectivity between Zn(II) and Cd(II). DQPEA, which could form a six‐membered chelate ring has almost one order of magnitude higher affinity for Zn(II) than Cd(II).284 In a study by our group, compound 37 (Fig. 35b), which would form a six‐membered chelate ring, has a higher Zn(II) selectivity over Cd(II) than that of compound 15 based on a fluorescence competitive binding experiment.185
Fig. 35 Six‐membered chelate ring increases selectivity for Zn(II) over Cd(II).185,284
(c) Differential effect of Zn(II)/Cd(II) binding at the e‐acceptor of an ICT fluorophore. Zn(II) is a stronger Lewis acid than Cd(II). Therefore, if metal coordination occurs at the acceptor end of an ICT fluorophore, Zn(II) would show a stronger stabilization effect of the ICT excited state than Cd(II), and lead to a more pronounced emission bathochromic shift than Cd(II). Several examples are shown in Fig. 36,285‐287 all of which place Zn(II) or Cd(II) at the e‐withdrawing end of the ICT fluorophore. Therefore, the emission wavelength of the Zn(II) complex is longer than that of the Cd(II) complex. In these examples, visually it is easy to distinguish between complexes of Zn(II) and of Cd(II) because the former gives a green fluorescence while the latter has a cyan emission.
Fig. 36 Three examples of Zn(II)/Cd(II) indicators – QB,285 DBITA,286 and ZC‐F1,287 of which coordination occurs at the e‐acceptor site of an ICT fluorophore.
Zn(II) or Cd(II) binds with both e‐donor (the amide nitrogen) and e‐acceptor (quinolinyl nitrogen) of N‐acyl‐8‐aminoquinoline‐containing compounds QA and 38 (Fig. 37).288,289 What separates Zn(II) from
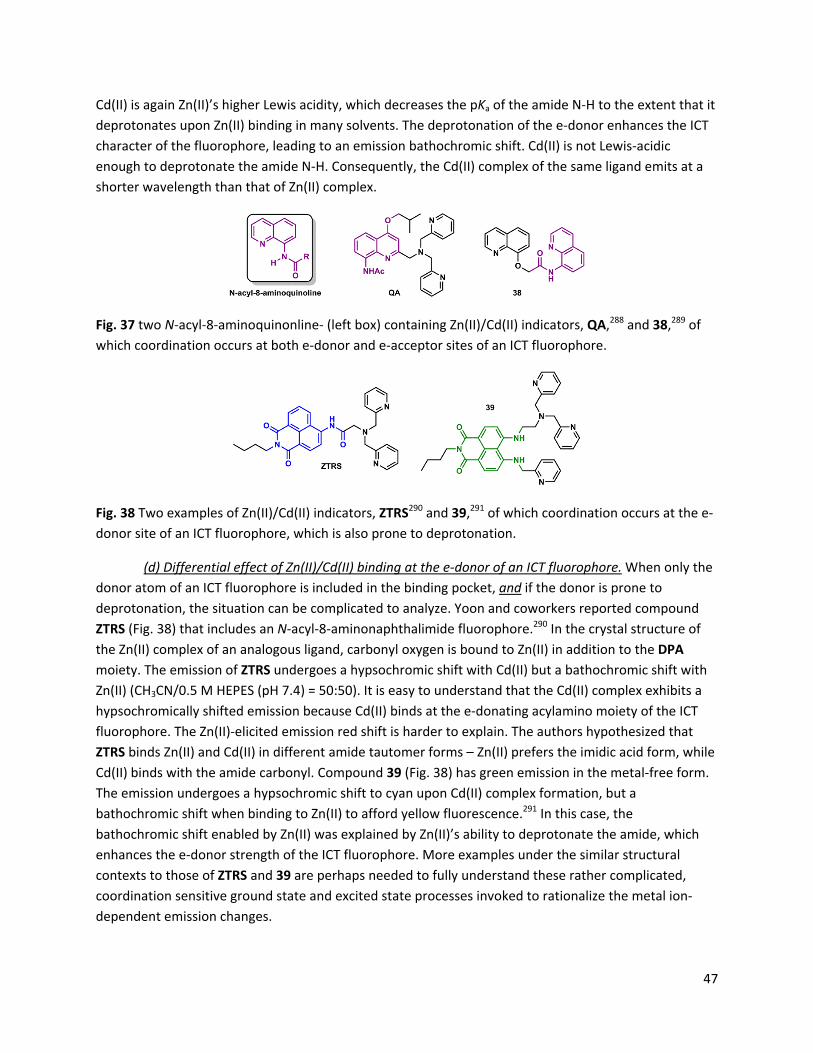
47
Cd(II) is again Zn(II)’s higher Lewis acidity, which decreases the pKa of the amide N‐H to the extent that it deprotonates upon Zn(II) binding in many solvents. The deprotonation of the e‐donor enhances the ICT character of the fluorophore, leading to an emission bathochromic shift. Cd(II) is not Lewis‐acidic enough to deprotonate the amide N‐H. Consequently, the Cd(II) complex of the same ligand emits at a shorter wavelength than that of Zn(II) complex.
Fig. 37 two N‐acyl‐8‐aminoquinonline‐ (left box) containing Zn(II)/Cd(II) indicators, QA,288 and 38,289 of which coordination occurs at both e‐donor and e‐acceptor sites of an ICT fluorophore.
Fig. 38 Two examples of Zn(II)/Cd(II) indicators, ZTRS290 and 39,291 of which coordination occurs at the e‐donor site of an ICT fluorophore, which is also prone to deprotonation.
(d) Differential effect of Zn(II)/Cd(II) binding at the e‐donor of an ICT fluorophore. When only the donor atom of an ICT fluorophore is included in the binding pocket, and if the donor is prone to deprotonation, the situation can be complicated to analyze. Yoon and coworkers reported compound ZTRS (Fig. 38) that includes an N‐acyl‐8‐aminonaphthalimide fluorophore.290 In the crystal structure of the Zn(II) complex of an analogous ligand, carbonyl oxygen is bound to Zn(II) in addition to the DPA moiety. The emission of ZTRS undergoes a hypsochromic shift with Cd(II) but a bathochromic shift with Zn(II) (CH3CN/0.5 M HEPES (pH 7.4) = 50:50). It is easy to understand that the Cd(II) complex exhibits a hypsochromically shifted emission because Cd(II) binds at the e‐donating acylamino moiety of the ICT fluorophore. The Zn(II)‐elicited emission red shift is harder to explain. The authors hypothesized that ZTRS binds Zn(II) and Cd(II) in different amide tautomer forms – Zn(II) prefers the imidic acid form, while Cd(II) binds with the amide carbonyl. Compound 39 (Fig. 38) has green emission in the metal‐free form. The emission undergoes a hypsochromic shift to cyan upon Cd(II) complex formation, but a bathochromic shift when binding to Zn(II) to afford yellow fluorescence.291 In this case, the bathochromic shift enabled by Zn(II) was explained by Zn(II)’s ability to deprotonate the amide, which enhances the e‐donor strength of the ICT fluorophore. More examples under the similar structural contexts to those of ZTRS and 39 are perhaps needed to fully understand these rather complicated, coordination sensitive ground state and excited state processes invoked to rationalize the metal ion‐dependent emission changes.

48
5.FluorescencemicroscopicimagingofintracellularZn(II)ions
In this section, widefield and laser confocal microscopies, with which Zn(II) indicators have been applied extensively, are briefly described in relation to the choices of fluorophores for these two techniques. Readers interested in a more comprehensive grasp of state‐of‐art fluorescence microscopies are referred to an excellent book by Murphy and Davidson,292 and the microscopy educational website “molecular expressions” maintained by Michael Davidson and coworkers (http://micro.magnet.fsu.edu/). Commonly used biological specimens in Zn(II) imaging experiments are described, followed by the major focus of this section, which is directed to the introduction of Zn(II) indicators that have defined subcellular localization properties.
5‐1.Widefieldmicroscopy
Arc lamps (mercury, xenon, or metal halide) or monochromic light‐emitting diodes (LEDs) are the usual illumination sources of widefield fluorescence microscopy. The microscope can be fitted with different bandpass filter sets, each of which includes an excitation filter, a dichromatic mirror, and an emission filter, that are suitable for various fluorophores. The wavelength range of a filter set can be as large as 60 nm. The exciter and emitter of the QMAX blue filter set covers 355‐405 nm and 420‐480 nm, respectively. Therefore, QMAX blue is suitable for a UV excitable dye that emits in blue, such as the nuclear stain DAPI.293,294 A window of excitation wavelengths cleared by a bandpass filter set creates relatively strong background fluorescence, comparing to that of the monochromic laser excitation of a confocal microscope. On the other hand, most dyes can be used under a widefield microscope because of the flexible selection of excitation bands of various arc lamps. The acquisition of an image on a conventional widefield microscope is rapid. However, in addition to the in‐focus emission, photons originated from out‐of‐focus planes of a relatively thick specimen are also captured by the detector, which contributes to the blurriness of the image.
5‐2.Laserconfocalmicroscopy
Laser confocal microscopy uses monochromic laser as the light source. The confocal method in conjunction with optical sectioning technology significantly increases the resolution and signal‐to‐noise ratio from those of a widefield technique. The emitted photons from a focal plane of a specimen, which is determined by the positioning of the laser point source and the dichromatic mirror, are focused using a pinhole aperture before entering the detector. Therefore, the photons above and below the focal plane are rejected, which gives a highly focused, i.e., well‐resolved, image. The focal plane can be varied so that the entire depth of a specimen can be sampled via z‐scanning. These individually acquired images (single optical sections) are then projected to a single plane to form a high‐resolution composite view that includes all the viewable information of the specimen with high resolution. Because a large portion of the emitted photons are out‐of‐focus and therefore are rejected, a monochromic laser with high intensity is needed as the light source to produce enough in‐focus photons. The monochromic nature of a laser also reduces the background fluorescence. The shortcoming of laser confocal microscopy is that fluorophores are preferred to have excitation maxima that match up with the available laser sources. Fluorescein, for example, is a commonly used fluorophore in laser confocal

49
microscopy due to its efficient excitation by the commercially available 488‐nm argon‐ion laser source. Also, the fluorophores need to be adequately photostable to endure the high‐intensity laser illumination over a relatively long time (comparing to the widefield imaging acquisition) required for the scanning mechanism.
5‐3.Commonlyusedspecimens
Eukaryotic cellular and tissue samples are often used in fluorescence Zn(II) imaging experiments, because of their relevance to human physiology and health. Due to the limit on the penetration depths of UV and visible photons, the specimens need to be thin, with a thickness up to a few hundred microns. Mammalian cells, hippocampal and olfactory bulb tissue slices, and zebrafish larvae are three types of specimens often used in biological Zn(II) imaging experiments, which are briefly described in this section. The penetration depth can be increased using near‐infrared (NIR) excitation, which either requires an NIR‐absorbing fluorophore,295‐297 or a light source capable of two‐photon excitation of a UV/VIS absorbing fluorophore.298,299
Mammalian cells such as HeLa are commonly used in vitro platforms for evaluating the basic parameters of a Zn(II) indicator, such as toxicity, cell membrane permeability, Zn(II) responsiveness when Zn(II) is delivered to dye‐loaded cells from the growth medium, for example, via an ionophore such as sodium pyrithione (Fig. 25). To load a small organic indicator to the intracellular space, the cells are incubated in a growth medium that contains a few micromolar or lower concentration of the indicator, so that the impact of the foreign species on the physiology of the cells is minimized. The incubation usually takes 30 min or longer to ensure the indicator uptake. The growth medium is then replaced with the indicator‐free medium, assuming that the indicators have been retained fully intracellularly. How much of the dye is retained and the distribution of the dye is mostly unknown. This is one of the reasons that a ratiometric indicator is preferred so that the impact of such uncertainties is reduced. Further incubation in a medium with graded Zn(II) concentrations with or without an ionophore imparts some degree of control of intracellular free Zn(II) abundance, which shall be reflected by the altered fluorescence of the indicator.
HeLa and other readily available, easily maintained cell lines are usually used to assess the utility of an indicator in live cell imaging. The more interesting cell lines in Zn(II) cell biology are prostate cells,300 pancreatic islet ‐cells,250,251 and primary neurons260 cultured from rat hippocampus or olfactory bulbs. These are free Zn(II)‐rich cells, and the change in Zn(II) distribution and mobilization are intimately related to several heavily invested areas of human health, such as cancer, diabetes, and neurological diseases.
Hippocampal and olfactory bulb slices contain Zn(II)‐rich neurons. The synaptic release of Zn(II) can be studied using fluorescence microscopy and electrophysiology. The metabolically active hippocampal slices (i.e., “live”) can be produced using a vibratome from a freshly removed rat brain. The thickness of such a slice is usually a few hundred microns. A frozen rat brain can be sliced into even thinner specimen down to a few microns.254 The metabolic function of the frozen slices might have been

50
compromised, so that the data from the ultra‐thin frozen slices might not be correlated to the observation from electrophysiological experiments.
Zebrafish is a model organism for biological studies. The genetics and developmental biology of zebrafish are well understood. Zebrafish larvae of a few days old have almost the same size (3‐7 days old about 3‐4 mm in length).301,302 They are about a few hundred microns thick,303 and transparent, which are suitable for fluorescence imaging experiments. Zebrafish have been used as a living biological platform for Zn(II) imaging, which has revealed interesting Zn(II) distributions during zebrafish embryonic and larvae development.160,290
5‐4.Zn(II)indicatorswithdefinedsubcellularlocalizationproperties
High spatial and temporal resolutions are distinctive advantages of fluorescence microscopy over other imaging methods.71,304 Therefore, fluorescent Zn(II) indicators with well‐defined subcellular localization properties are preferred to record local Zn(II) dynamics in living specimens. Most of the Zn(II) indicators reported thus far have nonspecific intracellular destinations, which are not suitable for studying organelle‐specific Zn(II)‐involved processes.49 During the past few years, significant efforts have been put forth to develop Zn(II) indicators targeting specific organelles, including mitochondria, lysosome, Golgi apparatus, and cell membrane. Several approaches from chemical to genetic are briefly described in this section. The assessment of subcellular localization fidelity can be carried out in a co‐staining experiment using a marker dye with known, precise localization property (usually a transiently expressed fluorescent protein with an organellar fusion, or a synthetic marker with a strictly defined subcellular target) that has an entirely different emission coverage from that of the indicator under investigation.305 The degree of co‐localization of the indicator and the known organelle marker can be quantified by co‐localization parameters, such as the Pearson’s coefficient.305
Fig. 39 Structures of mitochondria‐accumulating rhodamine 123306 and MitoQ10.307
5‐4‐1.Alkyltriphenylphosphonium(alkylTPP)formitochondriallocalization
Lipophilic cations are known to accumulate in mitochondria, driven by both favorable hydrophobic adsorption to mitochondrial membrane and a steep mitochondrial membrane potential that completes the internalization.226 Rhodamine 123 (Fig. 39) is known to localize in and stain mitochondria,306 which became the structural basis for the series of MitoTracker indicators. One of the mitochondria‐selective Zn(II) indicators, RhodZin‐3, was developed on a rhodamine scaffold.265 The lipophilic cation alkyltriphenylphosphonium (alkylTPP) has been used to deliver various molecular cargos to mitochondria,226 for instance ubiquinone in MitoQ10 (Fig. 39), whose derivative is an antioxidant to
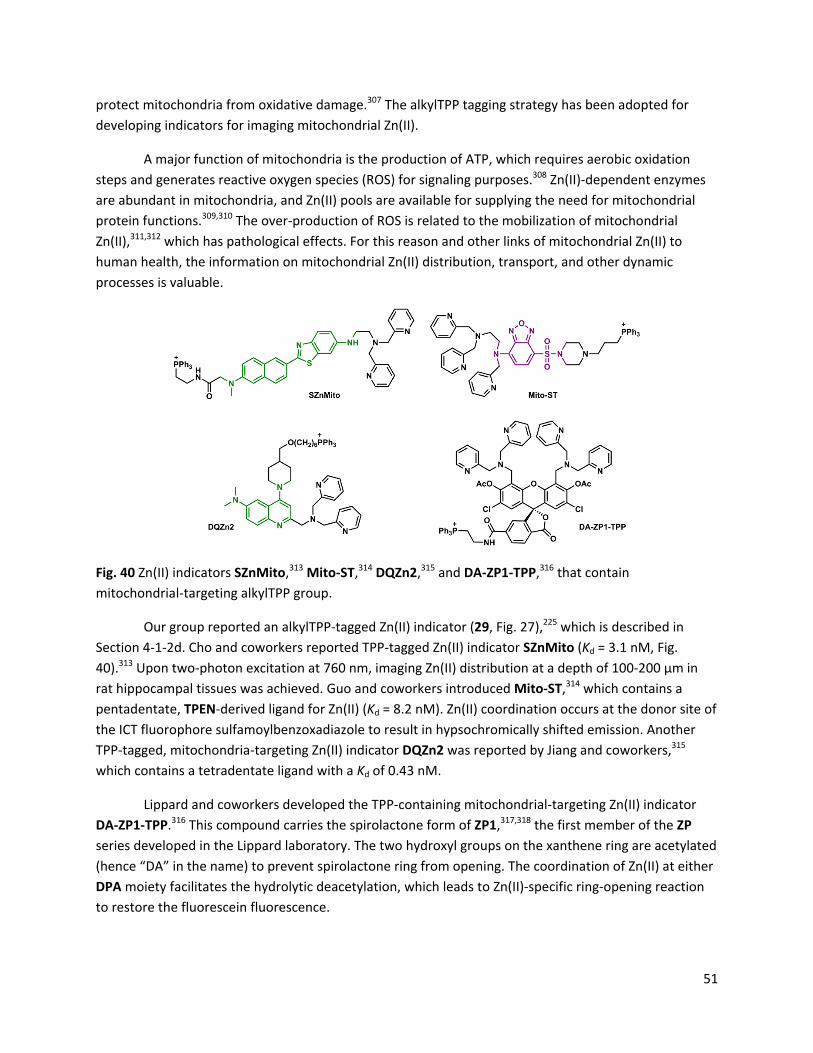
51
protect mitochondria from oxidative damage.307 The alkylTPP tagging strategy has been adopted for developing indicators for imaging mitochondrial Zn(II).
A major function of mitochondria is the production of ATP, which requires aerobic oxidation steps and generates reactive oxygen species (ROS) for signaling purposes.308 Zn(II)‐dependent enzymes are abundant in mitochondria, and Zn(II) pools are available for supplying the need for mitochondrial protein functions.309,310 The over‐production of ROS is related to the mobilization of mitochondrial Zn(II),311,312 which has pathological effects. For this reason and other links of mitochondrial Zn(II) to human health, the information on mitochondrial Zn(II) distribution, transport, and other dynamic processes is valuable.
Fig. 40 Zn(II) indicators SZnMito,313 Mito‐ST,314 DQZn2,315 and DA‐ZP1‐TPP,316 that contain mitochondrial‐targeting alkylTPP group.
Our group reported an alkylTPP‐tagged Zn(II) indicator (29, Fig. 27),225 which is described in Section 4‐1‐2d. Cho and coworkers reported TPP‐tagged Zn(II) indicator SZnMito (Kd = 3.1 nM, Fig. 40).313 Upon two‐photon excitation at 760 nm, imaging Zn(II) distribution at a depth of 100‐200 μm in rat hippocampal tissues was achieved. Guo and coworkers introduced Mito‐ST,314 which contains a pentadentate, TPEN‐derived ligand for Zn(II) (Kd = 8.2 nM). Zn(II) coordination occurs at the donor site of the ICT fluorophore sulfamoylbenzoxadiazole to result in hypsochromically shifted emission. Another TPP‐tagged, mitochondria‐targeting Zn(II) indicator DQZn2 was reported by Jiang and coworkers,315 which contains a tetradentate ligand with a Kd of 0.43 nM.
Lippard and coworkers developed the TPP‐containing mitochondrial‐targeting Zn(II) indicator DA‐ZP1‐TPP.316 This compound carries the spirolactone form of ZP1,317,318 the first member of the ZP series developed in the Lippard laboratory. The two hydroxyl groups on the xanthene ring are acetylated (hence “DA” in the name) to prevent spirolactone ring from opening. The coordination of Zn(II) at either DPA moiety facilitates the hydrolytic deacetylation, which leads to Zn(II)‐specific ring‐opening reaction to restore the fluorescein fluorescence.

52
The accumulation of lipophilic cation‐tagged Zn(II) indicator molecules in mitochondria is driven by favorable membrane potentials. If the mitochondrial membrane is depolarized as a consequence of a biological event, these molecules would not be retained by mitochondria, and thus rendered ineffective in reporting mitochondrial Zn(II). This concern was raised by Palmer and coworkers, who reported a genetically‐encoded, mitochondria‐targeting Zn(II) indicator, which is directed to the organelles by a mitochondria‐targeting sequence at the N‐terminus.44 Another strategy to enforce mitochondrial localization of a synthetic molecule is to include an electrophilic alkyl chloride moiety in the structure, such as in MitoTracker Red. The positively charged molecules are directed to mitochondria via the favorable membrane potential, followed by the covalent immobilization via nucleophilic substitution between the alkyl chloride portion of the dye molecule and the cysteine residues of intra‐mitochondrial proteins. This method involves modification of intracellular proteins. Therefore, it may or may not affect the normal cellular functions.
Fig. 41 (a) First reported lysosomal‐targeting stain DAMP.319 (b) Tertiary amino groups are lysosomotropic tags. (c) A lysosomal‐targeting Zn(II) indicator.320
5‐4‐2.Weaklybasiclysosomotropicaminesforlysosomallocalization
Weakly basic aliphatic amines tend to accumulate in acidic organelles, in particular lysosomes, in a process called lysosomotropism.321,322 The earliest lysosomotropic molecule for intracellular staining purposes is DAMP (Fig. 41a),319 which accumulates in lysosomes and can be labeled by DAMP‐specific antibodies. Acyclic aliphatic tertiary amines323‐325 and N‐methylmorpholino323 groups (Fig. 41b) are now commonly used tags to target lysosomes and other acidic organelles. The biological significance of lysosomal Zn(II) is described in Section 1‐2. Lysosome‐targeting Zn(II) indicator DQZn4 (Fig. 41c)320 was reported by Jiang and coworkers as a modified version of DQZn2 (Fig. 40). A tertiary amino group was used in DQZn4 for lysosomal localization.
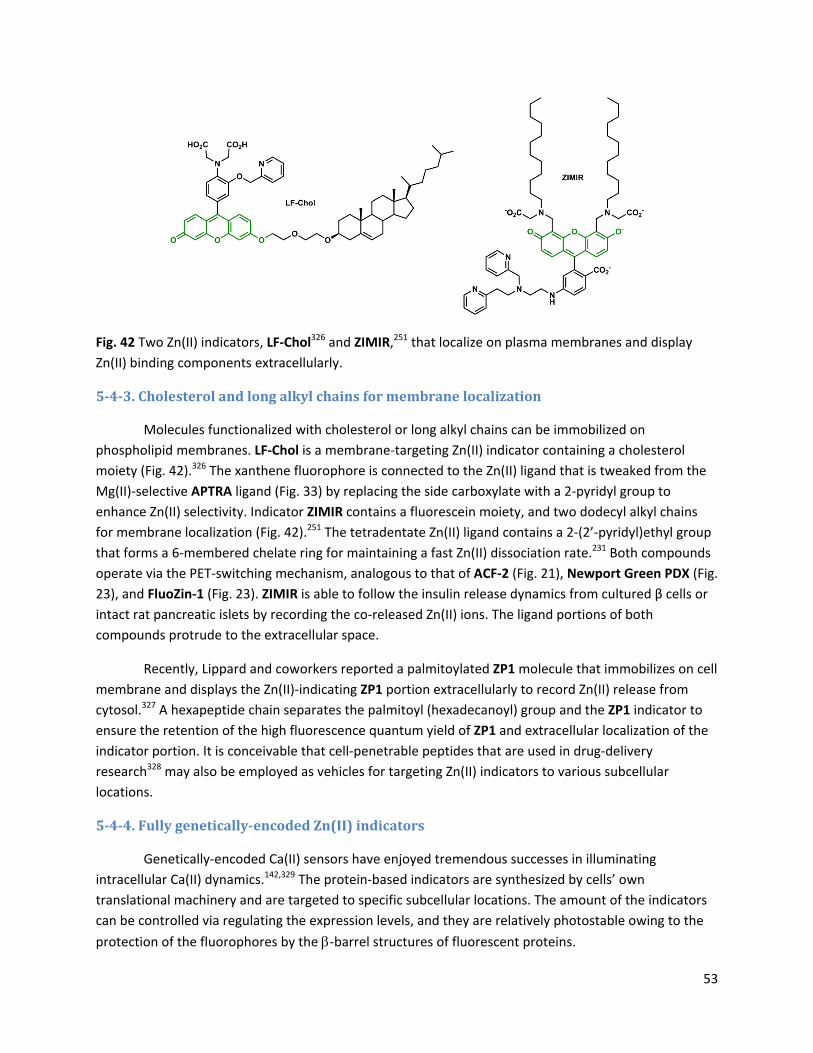
53
Fig. 42 Two Zn(II) indicators, LF‐Chol326 and ZIMIR,251 that localize on plasma membranes and display Zn(II) binding components extracellularly.
5‐4‐3.Cholesterolandlongalkylchainsformembranelocalization
Molecules functionalized with cholesterol or long alkyl chains can be immobilized on phospholipid membranes. LF‐Chol is a membrane‐targeting Zn(II) indicator containing a cholesterol moiety (Fig. 42).326 The xanthene fluorophore is connected to the Zn(II) ligand that is tweaked from the Mg(II)‐selective APTRA ligand (Fig. 33) by replacing the side carboxylate with a 2‐pyridyl group to enhance Zn(II) selectivity. Indicator ZIMIR contains a fluorescein moiety, and two dodecyl alkyl chains for membrane localization (Fig. 42).251 The tetradentate Zn(II) ligand contains a 2‐(2’‐pyridyl)ethyl group that forms a 6‐membered chelate ring for maintaining a fast Zn(II) dissociation rate.231 Both compounds operate via the PET‐switching mechanism, analogous to that of ACF‐2 (Fig. 21), Newport Green PDX (Fig. 23), and FluoZin‐1 (Fig. 23). ZIMIR is able to follow the insulin release dynamics from cultured β cells or intact rat pancreatic islets by recording the co‐released Zn(II) ions. The ligand portions of both compounds protrude to the extracellular space.
Recently, Lippard and coworkers reported a palmitoylated ZP1 molecule that immobilizes on cell membrane and displays the Zn(II)‐indicating ZP1 portion extracellularly to record Zn(II) release from cytosol.327 A hexapeptide chain separates the palmitoyl (hexadecanoyl) group and the ZP1 indicator to ensure the retention of the high fluorescence quantum yield of ZP1 and extracellular localization of the indicator portion. It is conceivable that cell‐penetrable peptides that are used in drug‐delivery research328 may also be employed as vehicles for targeting Zn(II) indicators to various subcellular locations.
5‐4‐4.Fullygenetically‐encodedZn(II)indicators
Genetically‐encoded Ca(II) sensors have enjoyed tremendous successes in illuminating intracellular Ca(II) dynamics.142,329 The protein‐based indicators are synthesized by cells’ own translational machinery and are targeted to specific subcellular locations. The amount of the indicators can be controlled via regulating the expression levels, and they are relatively photostable owing to the protection of the fluorophores by the ‐barrel structures of fluorescent proteins.
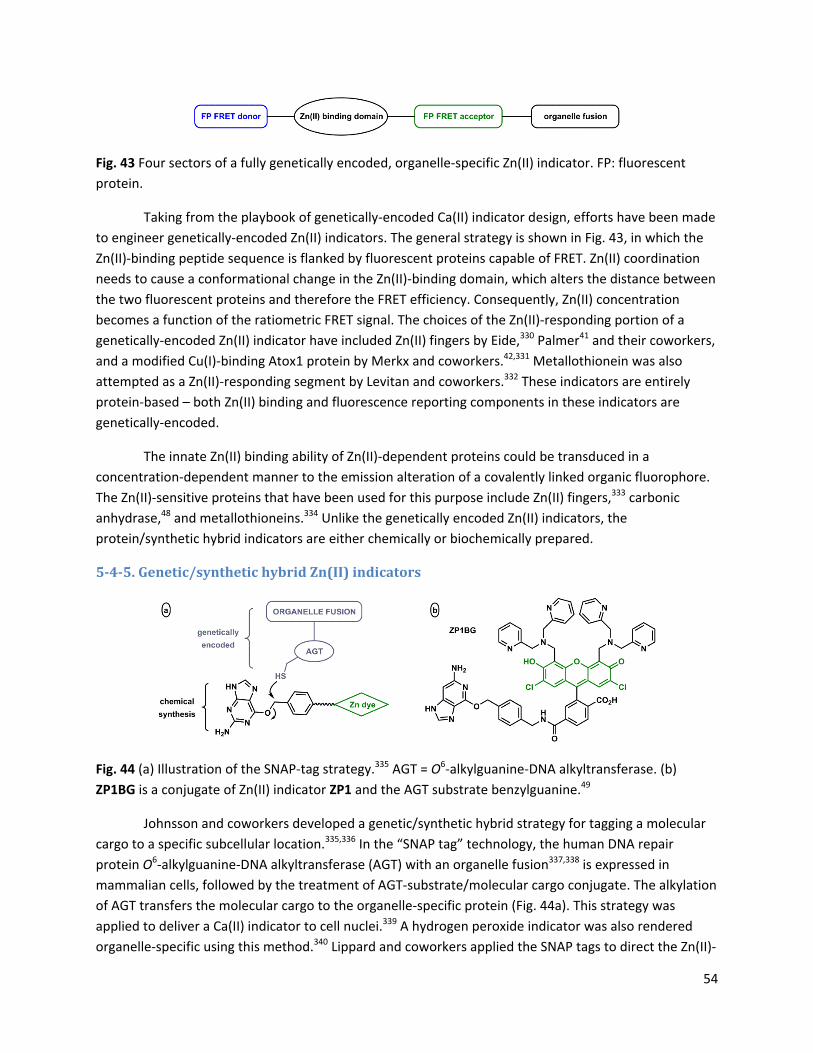
54
Fig. 43 Four sectors of a fully genetically encoded, organelle‐specific Zn(II) indicator. FP: fluorescent protein.
Taking from the playbook of genetically‐encoded Ca(II) indicator design, efforts have been made to engineer genetically‐encoded Zn(II) indicators. The general strategy is shown in Fig. 43, in which the Zn(II)‐binding peptide sequence is flanked by fluorescent proteins capable of FRET. Zn(II) coordination needs to cause a conformational change in the Zn(II)‐binding domain, which alters the distance between the two fluorescent proteins and therefore the FRET efficiency. Consequently, Zn(II) concentration becomes a function of the ratiometric FRET signal. The choices of the Zn(II)‐responding portion of a genetically‐encoded Zn(II) indicator have included Zn(II) fingers by Eide,330 Palmer41 and their coworkers, and a modified Cu(I)‐binding Atox1 protein by Merkx and coworkers.42,331 Metallothionein was also attempted as a Zn(II)‐responding segment by Levitan and coworkers.332 These indicators are entirely protein‐based – both Zn(II) binding and fluorescence reporting components in these indicators are genetically‐encoded.
The innate Zn(II) binding ability of Zn(II)‐dependent proteins could be transduced in a concentration‐dependent manner to the emission alteration of a covalently linked organic fluorophore. The Zn(II)‐sensitive proteins that have been used for this purpose include Zn(II) fingers,333 carbonic anhydrase,48 and metallothioneins.334 Unlike the genetically encoded Zn(II) indicators, the protein/synthetic hybrid indicators are either chemically or biochemically prepared.
5‐4‐5.Genetic/synthetichybridZn(II)indicators
Fig. 44 (a) Illustration of the SNAP‐tag strategy.335 AGT = O6‐alkylguanine‐DNA alkyltransferase. (b) ZP1BG is a conjugate of Zn(II) indicator ZP1 and the AGT substrate benzylguanine.49
Johnsson and coworkers developed a genetic/synthetic hybrid strategy for tagging a molecular cargo to a specific subcellular location.335,336 In the “SNAP tag” technology, the human DNA repair protein O6‐alkylguanine‐DNA alkyltransferase (AGT) with an organelle fusion337,338 is expressed in mammalian cells, followed by the treatment of AGT‐substrate/molecular cargo conjugate. The alkylation of AGT transfers the molecular cargo to the organelle‐specific protein (Fig. 44a). This strategy was applied to deliver a Ca(II) indicator to cell nuclei.339 A hydrogen peroxide indicator was also rendered organelle‐specific using this method.340 Lippard and coworkers applied the SNAP tags to direct the Zn(II)‐

55
sensitive ZP1BG (Fig. 44b) to mitochondria and Golgi apparatus.49 Unlike the fully genetically‐encoded indicators, the genetically‐encoded component of the SNAP tag constitutes only the organelle‐directing part of the Zn(II) indicator. It removes the burden of engineering the Zn(II)‐responding component of the indicator, and allows a high degree of flexibility in choosing the affinity and color of the Zn(II) indicator. However, A SNAP tag requires a biochemical step after the expression of the tag, which comparing to the fully genetically encoded indicators is a disadvantage.
6.FluorescenceZn(II)imagingtoaddressbiologicalproblems
6‐1.AfewindicatorsappliedinZn(II)biology
Several indicators that are often used in Zn(II) biology research are shown in Fig. 45. The common features of these compounds are a proper balance of water solubility and membrane permeability, compatibility with either widefield or confocal microscopy, and photostability of the fluorophores. In this section, the chemical properties of these compounds pertinent to fluorescence microscopic imaging are described, followed by their applications in bioimaging that are organized by different biological problems being addressed.
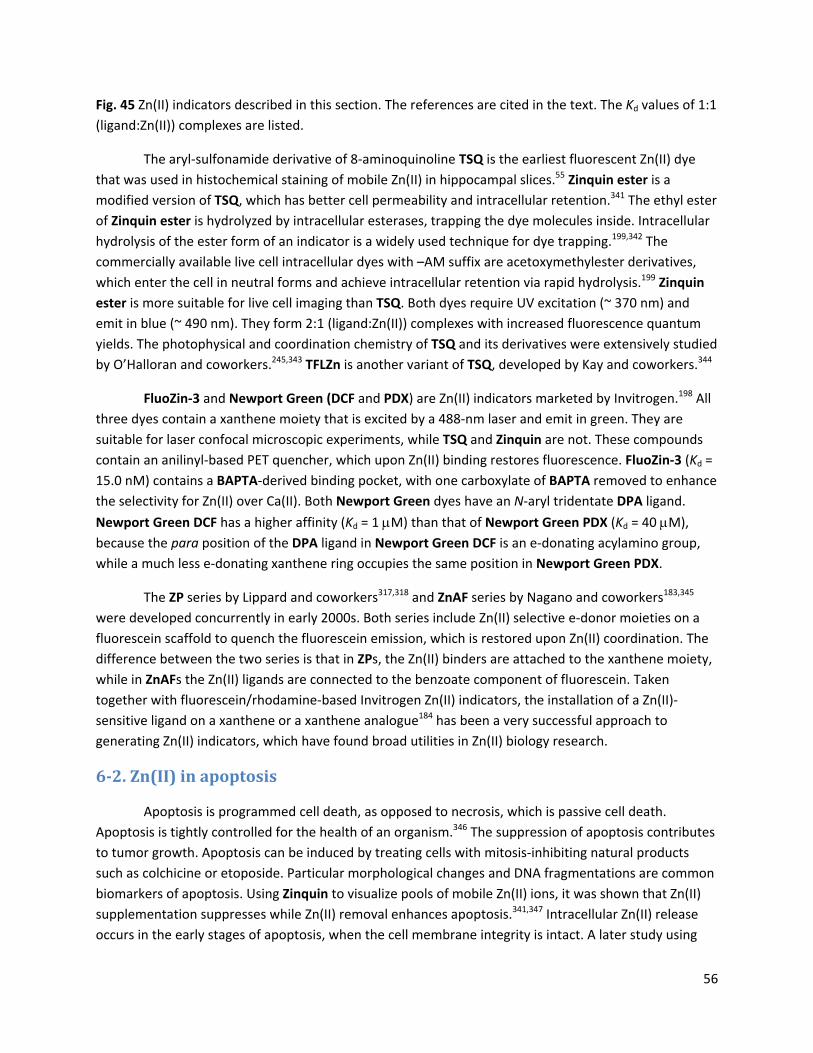
56
Fig. 45 Zn(II) indicators described in this section. The references are cited in the text. The Kd values of 1:1 (ligand:Zn(II)) complexes are listed.
The aryl‐sulfonamide derivative of 8‐aminoquinoline TSQ is the earliest fluorescent Zn(II) dye that was used in histochemical staining of mobile Zn(II) in hippocampal slices.55 Zinquin ester is a modified version of TSQ, which has better cell permeability and intracellular retention.341 The ethyl ester of Zinquin ester is hydrolyzed by intracellular esterases, trapping the dye molecules inside. Intracellular hydrolysis of the ester form of an indicator is a widely used technique for dye trapping.199,342 The commercially available live cell intracellular dyes with –AM suffix are acetoxymethylester derivatives, which enter the cell in neutral forms and achieve intracellular retention via rapid hydrolysis.199 Zinquin ester is more suitable for live cell imaging than TSQ. Both dyes require UV excitation (~ 370 nm) and emit in blue (~ 490 nm). They form 2:1 (ligand:Zn(II)) complexes with increased fluorescence quantum yields. The photophysical and coordination chemistry of TSQ and its derivatives were extensively studied by O’Halloran and coworkers.245,343 TFLZn is another variant of TSQ, developed by Kay and coworkers.344
FluoZin‐3 and Newport Green (DCF and PDX) are Zn(II) indicators marketed by Invitrogen.198 All three dyes contain a xanthene moiety that is excited by a 488‐nm laser and emit in green. They are suitable for laser confocal microscopic experiments, while TSQ and Zinquin are not. These compounds contain an anilinyl‐based PET quencher, which upon Zn(II) binding restores fluorescence. FluoZin‐3 (Kd = 15.0 nM) contains a BAPTA‐derived binding pocket, with one carboxylate of BAPTA removed to enhance the selectivity for Zn(II) over Ca(II). Both Newport Green dyes have an N‐aryl tridentate DPA ligand. Newport Green DCF has a higher affinity (Kd = 1 M) than that of Newport Green PDX (Kd = 40 M), because the para position of the DPA ligand in Newport Green DCF is an e‐donating acylamino group, while a much less e‐donating xanthene ring occupies the same position in Newport Green PDX.
The ZP series by Lippard and coworkers317,318 and ZnAF series by Nagano and coworkers183,345 were developed concurrently in early 2000s. Both series include Zn(II) selective e‐donor moieties on a fluorescein scaffold to quench the fluorescein emission, which is restored upon Zn(II) coordination. The difference between the two series is that in ZPs, the Zn(II) binders are attached to the xanthene moiety, while in ZnAFs the Zn(II) ligands are connected to the benzoate component of fluorescein. Taken together with fluorescein/rhodamine‐based Invitrogen Zn(II) indicators, the installation of a Zn(II)‐sensitive ligand on a xanthene or a xanthene analogue184 has been a very successful approach to generating Zn(II) indicators, which have found broad utilities in Zn(II) biology research.
6‐2.Zn(II)inapoptosis
Apoptosis is programmed cell death, as opposed to necrosis, which is passive cell death. Apoptosis is tightly controlled for the health of an organism.346 The suppression of apoptosis contributes to tumor growth. Apoptosis can be induced by treating cells with mitosis‐inhibiting natural products such as colchicine or etoposide. Particular morphological changes and DNA fragmentations are common biomarkers of apoptosis. Using Zinquin to visualize pools of mobile Zn(II) ions, it was shown that Zn(II) supplementation suppresses while Zn(II) removal enhances apoptosis.341,347 Intracellular Zn(II) release occurs in the early stages of apoptosis, when the cell membrane integrity is intact. A later study using

57
Zn(II) indicator 12 (Fig. 16) replicated these observations.348 It was hypothesized that the oxidation of Zn(II)‐binding proteins occurs during apoptosis, which triggers Zn(II) release. However, there is no firm evidence that the initiation of apoptosis precedes the Zn(II) release.
6‐3.MossyfiberneuronsynapticZn(II)release
Zn(II) ions accumulate in hippocampus, which is a region of the brain critical to learning and memory.349 The total concentration of Zn(II) in hilas, a sub‐region of hippocampus that is filled with mossy fiber neuropil, is as high as 220 M.350 The freshly prepared rat hippocampal slice tissues containing metabolically active (i.e., live) neurons release and uptake Zn(II) during neuronal activities when they are stimulated by high K(I) concentrations or electrical means.252,253 These early observations of hippocampal Zn(II) were made using atomic absorption spectrometry, with or without the aid of 66Zn(II) isotope, or using decay of radioisotope 65Zn(II). It was not until 1989 that Frederickson and coworkers provided the first example of histochemical fluorescence staining of hippocampal Zn(II) using TSQ. In the following text, a few studies that utilize Zn(II) indicators as tools to probe the functional roles of hippocampal Zn(II) are briefly described.
A link between Zn(II) and the induction of long‐term potentiation (LTP) in the CA1 region of hippocampus was proposed by Weiss et al.351 Using TSQ to stain synaptically released Zn(II), Roder and coworkers established that (a) removal of presynaptic vesicular Zn(II) via either chronic dietary deficiency or rapid depletion using a Zn(II) chelator impairs the induction of LTP of Zn(II)‐containing mossy fiber‐CA3 synapses, and (b) the effect of depleting Zn(II) on LTP could be reversed by supplementing Zn(II).352
Frederickson and coworkers used Newport Green DCF to monitor the Zn(II) release from mossy fibers353 during the high frequency electric stimulation to induce mossy fiber CA3 LTP.354 In addition to corroborating with Roder and coworkers’ finding that mossy fiber Zn(II) release is correlated with LTP, a few more details of this process were revealed. Newport Green DCF has a Kd of 1 M whose fluorescence is unaltered by Ca(II) at 10 mM. By removing Zn(II) using chelator CaEDTA, the basal level of synaptic transmission mediated by Ca(II) is uncompromised. This observation confirms that it is Zn(II), not Ca(II), that is required for the induction of LTP under the high frequency stimulation. It was also found that the entry of Zn(II) ions into postsynaptic neurons, not merely the interaction between Zn(II) and postsynaptic membrane proteins, is required for the induction of LTP. The co‐release of glutamate facilitates the Zn(II) entry to postsynaptic neurons, presumably via glutamate‐gated ion channels.
Ample evidence has emerged to show that there are vesicular labile Zn(II) in hippocampal presynaptic neurons,254 which carry signaling capacities when released with glutamate.17 The Zn(II)‐mediated neurotransmission is implicated in LTP, which is relevant to the learning and memory functions of brain. So how are these Zn(II) ions sequestered into the synaptic vesicles?
The ZnT class of Zn(II) transporter proteins is responsible for the removal of Zn(II) from cytosol to vesicles or extracellular space.28,29,355,356 ZnT1 and ZnT3 are expressed in the brain; the former removes excess labile Zn(II) from cytosol to extracellular space to protect cells from Zn(II) toxicity, and

58
the latter accumulates Zn(II) from cytosol to intracellular vesicles. It was therefore hypothesized that ZnT3 sequesters Zn(II) ions from neuronal cytosol to the synaptic vesicles. Lee and coworkers used TSQ to visualize hippocampal labile Zn(II) in conjunction with immunostaining of ZnT3 and synaptophysin, a synapse marker.357 The emission from all three subjects co‐localizes in the neuropil region of hippocampus, which is rich of mossy fiber synapses. The immunostain of ZnT1 does not overlap with that of synaptic Zn(II), and is distributed evenly across the hippocampus. These data supports the function of ZnT3 in transporting Zn(II) to synaptic vesicles in hippocampal neurons.
Olfactory bulb (OB) is the region of the brain in direct contact with olfactory sensory neurons that involve in odor information processing. Similar to hippocampus of the brain, OB contains high levels of free Zn(II). Trombley and coworkers stained live OB slices with ZP1, which illuminated the high free Zn(II) content in the two outer layers of an OB slice – glomerular layer and granule cell layer.358 The intervening external plexiform layer contains a much lower level of stainable Zn(II). Patterned electrical stimulation causes the fluorescence intensity of ZP1 from the individual glomeruli adjacent to the microelectrode to decrease, suggesting Zn(II) release from the glomeruli upon stimulation. This observation echoes the more intensely studied synaptic Zn(II) release in hippocampus, and suggests the same function of Zn(II) as a neurotransmitter in OB.
In addition to being a neurotransmitter, evidence acquired from Zn(II) imaging has suggested that free Zn(II) is an intracellular second messenger (more common second messengers are cAMP, Ca(II), NO, etc.) for transducing extracellular stimuli to intracellular responses. In one study by Hirano and coworkers, mast cells expressing high‐affinity immunoglobulin E (IgE) receptors were sensitized by IgE.255 Upon stimulating the IgE‐sensitized mast cells by the specific antigen, the crosslinking of IgE receptors occurs, which causes the release of Zn(II) from endoplasmic reticulum, and possibly nucleus. This externally stimulated Zn(II) release was visualize by Newport Green DCF, and was termed a “Zn(II) wave”. Other experiments led to the postulation that the Zn(II) wave induces tyrosine phosphorylation and inhibits tyrosine phosphatase activities. Thus, Zn(II) is considered as a second messenger that translates an external stimulus into enhanced protein kinase activities.
In another study that shows Zn(II)’s function as a signaling molecule, it was found that Zn(II) is released from the mechanically injured human keratinocyte cells, as shown by the extracellular impermeable Zn(II) indicator ZnAF‐2, to trigger the activity of a membrane Zn(II) sensor ZnR.359 The activity of ZnR leads to a rapid intracellular Ca(II) release (monitored by intracellular Ca(II) dye fura‐2 acetoxymethyl ester) that initiates the downstream activities of wound healing. This work offers a likely molecular biological rationale for applying Zn(II)‐containing ointments for wound healing purposes.
6‐4.Zn(II)’sinvolvementinamyloid‐aggregation
The diagnosis of Alzheimer’s disease can only be confirmed postmortem by the presence of deposition of amyloid‐ (A) plagues in a patient’s brain. The aggregation of A is also linked to cerebral amyloid angiopathy. A aggregation can be initiated in the presence of free divalent ions such as Zn(II), Cu(II),and Fe(II) of relatively high concentrations.15 These ions hypermetallate the A peptide to afford plagues. In 2000, Frederickson and coworkers used TSQ to stain the high Zn(II) content in the senile

59
plaques and neurofibrillary tangles (NFT) of postmortem brain samples from Alzheimer’s patients, which provided evidence to the link between the abnormally high Zn(II) content in the brain and the propensity of A aggregation.360
Using transgenic mice expressing cerebral amyloid plaque pathology with or without brain Zn(II) transporter ZnT3‐knockout, Koh and coworkers showed that a high activity of ZnT3 leads to intense fluorescence staining using TFLZn in the mossy fiber region of the hippocampus, and high levels of insoluble A plagues.361 A variant of TSQ with enhanced water solubility, TFLZn (Fig. 45) carries a carboxylate on the sulfonylated aryl moiety.344 The carboxylate can be esterified to produce a cell membrane permeable version of TFLZn. This work in conjunction with the known link between ZnT3 and synaptic Zn(II) appears to pin synaptic Zn(II) as a major contributor to the metallated precipitation of A peptide. Also using TFLZn, it was shown that there are significant exchangeable Zn(II) pools originated from the action of ZnT3 in the perivascular spaces in neocortex, which facilitates the formation of A aggregates on the blood vessel walls to lead to cerebral amyloid angiopathy.362
6‐5.Zn(II)involvementinprostatecancer
Prostate has the highest Zn(II) abundance among all soft tissues. Prostate cancer is the singular prostate disease that shows a substantial reduction of tissue Zn(II) content.363 Therefore, prostate Zn(II) may be considered a biomarker for prostate cancer, which was a possibility explored by Medarova, Lippard, and coworkers.300 A modified version of ZP1, ZPP1 (Fig. 45), was used to quantify Zn(II) in cell and tissue lysates.364 ZPP1 has this unique property that only the [Zn2(ZPP1)]4+ complex is highly fluorescent, while the free ligand and the 1:1 complex [Zn(ZPP1)]2+ are not. Therefore, by titrating a ZPP1 solution into a Zn(II) solution of unknown concentration, the maximal fluorescence intensity would be reached when all Zn(II) ions are sequestered into the [Zn2(ZPP1)]4+ complex. The Zn(II) concentration is twice that of the ZPP1 concentration at that point.
Normal and transformed human prostate epithelial cells were stained with ZPP1.300 The transformed cells have down‐regulated Zn(II) transporter ZIP1 activities, which, in the opposite direction of ZnTs, bring Zn(II) ions into cytosol. The fluorescence intensity levels of the two types of cells, as compared using flow cytometry, confirms the much lower Zn(II) abundance in transformed cells than that in normal cells. The Zn(II) contents of normal and transformed cells were estimated at 12‐16 fmol/cell and 6‐8 fmol/cell, respectively, determined via ZPP1 titration of the cell lysates. Transgenic mice that develop progressive prostate cancer were used as in vivo models. In the imaging experiment, ZPP1 was delivered to prostate via intravenous injection, after which an incision at prostate was made, and the anesthetized mouse was subjected to intravital microscopy. The Zn(II)‐induced fluorescence intensity drops as the disease progresses, thus supporting the authors’ hypothesis of Zn(II) as a biomarker for prostate cancer.
In a study related to the treatment of prostate cancer, it was found that parenteral Zn(II) protects myeloid (bone marrow) progenitor cells against the toxicity induced by the drug decetaxel.365 Unlike the prostate cancer cells which have severely compromised Zn(II) uptake ability, the myeloid progenitor cells readily absorb Zn(II), as monitored by staining using FluoZin‐3 AM (an intracellular Zn(II)
60
indicator) and quantified by flow cytometry, which shield the healthy cells from the cytotoxic effect of the chemotherapy medications.
6‐6.Zn(II)asamarkerofinsulinsecretion
Insulin takes the hexameric form, which is held together by two structural Zn(II) ions per hexamer, in granules in pancreatic β‐cells. When insulin is released via vesicular exocytosis as triggered by, for example, glucose, the hexamer disintegrates to monomers with concurrent ejection of Zn(II). During the early development of Zinquin ester, pancreatic islet cells were stained with Zinquin ester and showed stronger fluorescence than that of fibroblasts stained under the identical conditions.366 The intense fluorescence appears to localize in secretory granules, along with diffuse cytoplasmic fluorescence, attributable to extragranular pools of labile Zn(II). Upon exposure to a high concentration of glucose solution (~ 25 mM), the intracellular fluorescence intensity decreases as a result of co‐release of Zn(II) and insulin. Similar observations were reported using Newport Green DCF as the Zn(II) indicator.367 The more favorable long wavelength emission of Newport Green DCF allowed the use of cell sorting to purify labeled cells.
Extracellular Zn(II) spikes can be used as markers for insulin release. Kennedy and coworkers initially employed Zinquin acid (the hydrolyzed form of Zinquin ester, Fig. 45), which is a membrane impermeable Zn(II) indicator, to monitor Zn(II) efflux from pancreatic β cells as stimulated by glucose or other stimulants.368 Zn(II) indicators for monitoring Zn(II) release from pancreatic β cells over the years have improved. FluoZin‐3 provides a better signal‐to‐noise ratio,250,369 and ZIMIR (Fig. 42) described in Section 5‐4‐3 situates on the cell membrane and direct the indicator component to the extracellular space.251 Therefore, the background emission from the extracellular free dye molecules can be minimized, which enhances the quality of the imaging experiments.
7.Summaryandoutlook
The application of TSQ as a fluorescent Zn(II) stain of hippocampal slices in the 1980s has been followed by the development of a plethora of fluorescent Zn(II) indicators that can be used under different types of microscopes, that are suitable for monitoring Zn(II) distributions and mobilizations in metabolically active specimens, that can be directed to precise subcellular targets. Combined with tools in biology such as electrophysiology, transgenic organisms, immunofluorescence, and others, many questions in Zn(II) biology are being addressed. The scope of this article is limited to the chemistry side, with only a brief mention of the biological questions that Zn(II) indicators help to answer. We aim to show how organic fluorescent indicators for Zn(II) work, in terms of their Zn(II) coordination chemistry and Zn(II)‐binding‐modulated ligand photophysical processes. Using the accumulated experience as the basis for formulating design guidelines, we are hoping that future Zn(II) indicators that are meeting new demands can be developed. In addition to the fundamental discoveries in Zn(II) biology, several Zn(II)‐involved topics that are highly relevant to human health, such as diabetes, neurological diseases, and prostate cancer, continue to present motivations to both biologists and chemists to formulate hypothesis and develop tools to experimentally address these challenges.
61
7‐1.Thewishlist,reiterated
What are the future directions in developing fluorescent indicators for Zn(II) ions? Frederickson provided a wish list of the properties of a desirable Zn(II) indicator – ratiometric, right affinity, right coordination kinetics (faster than the biological process under investigation), right permeability, and low toxicity.370 With the rapidly increasing sophistication of fluorescence microscopic instrumentations over the past decade, the unique advantages of the state‐of‐art microscopy over other types of imaging methods appear to be the high spatial resolution imparted by, for example, the super‐resolution techniques, and temporal resolution that is made possible by the CCD cameras of increasing speed of image acquisition. Therefore, to fully harness the potential of the instrumentation, indicators with highly defined subcellular localization properties need to be developed (The last few years have seen the significant progress of organelle‐targeting Zn(II) indicator development – Section 5‐4). Photostable fluorophores need to be incorporated into the indicator structure so that the indicator molecules could endure high frequency image acquisition. If a blinking fluorophore is used in, for example, stochastic optical reconstruction microscopy (STORM) of super‐resolution capacity, the fluorophore shall be bright in the “on” state so that a large number of photons can be produced to enhance the resolution.
7‐2.Free,ornotsofree,stainableZn(II)ions?
An unsettled issue in fluorescence Zn(II) imaging is how the signals should be interpreted. Are the synaptically released Zn(II) ions free in the synaptic cleft, or merely externalized on the outer membranes of the presynaptic neurons?371‐373 Can the signals be taken strictly as a function of free, hydrated Zn(II), or so‐called “rapidly exchangeable” or “loosely bound” Zn(II), or a collections of indicator‐bound Zn(II) ions that are also partially bound with intracellular ligands or proteins? These types of Zn(II) ions may or may not have different physiological functions. Zinquin was shown to form ternary complexes with Zn(II) and another ligand, which raised questions on the interpretations of Zn(II)‐dependent fluorescence observed in bioimaging experiments.374 Recently, Petering and coworkers have shown that a major portion of TSQ‐Zn(II) fluorescence should be attributed to TSQ‐Zn(II)‐protein ternary complexes rather than TSQ‐Zn(II) binary complexes.375‐377 This possibility shall be investigated for other Zn(II) indicators. It might be of significance to distinguish the stainable Zn(II) of different ligand environments, for example, truly hydrated Zn(II), Zn(II)‐metabolite or signaling molecule complexes, and Zn(II)‐containing proteins (Zn(II) proteome). Indicators with defined Zn(II) coordination chemistry is preferred (i.e., with only one possible binding stoichiometry), so that the interpretation of the fluorescence signal could be relatively straightforward and accurate.
7‐3.PerturbationofZn(II)‐involvedphysiologicalprocesses
Zn(II) ions are strictly regulated in biological systems through a homeostatic apparatus, which includes a Zn(II)‐buffering system.246 An ideal indicator shall be an absolute “bystander” of ongoing biological events. However, at micromolar indicator loading, it is unclear how much of the Zn(II)‐protein buffering equilibria is affected. From the work of Petering and coworkers, it is clear that TSQ at normal imaging loading concentrations react primarily with Zn(II) proteins, in addition to perhaps a small pool of free Zn(II).375,376 TPEN or other ligands introduced for depleting nutrient Zn(II) in certain studies may

62
have also stripped off Zn(II) ions from proteins.377 Because the indicator distribution in the heterogeneous intracellular environment is also heterogeneous, the local indicator concentrations are usually unknown, which not only complicates data analysis, but leads to possibilities of affecting intracellular Zn(II) homeostasis, a concern voiced by Palmer and coworkers.378 Therefore, we do not know whether at certain intracellular locales the indicator molecules are accumulated to the extent to overtake the endogenous Zn(II) buffering machinery. To address these issues, indicators with well‐defined subcellular localization properties are again required. Furthermore, it shall be advocated to run the same imaging experiments at different indicator concentrations, so that the Zn(II) concentration in the absence of an indicator could be extrapolated. Addressing these issues when developing future generations of Zn(II) indicators requires the creativity of the chemists in our community, who are well‐informed of the challenges and promises of Zn(II) biology.
Acknowledgement. Our research has been supported by the National Institutes of Health (GM081382) and the National Science Foundation (CHE0809201, CHE1213574). We are particularly grateful to Michael Davidson (National High Magnetic Field Laboratory) for providing expertise on the fluorescence microscopy front of this work, Prof. Cathy Levenson (FSU College of Medicine) on neurobiology, Prof. Mike Shatruk (FSU Chemistry and Biochemistry) on the inorganic component of this work, and Prof. Ken Knappenberger (FSU Chemistry and Biochemistry) on the collaboration in photophysical characterizations of the fluorescent ligands and complexes.
TOC graphic abstract
Knowledge of Zn(II) coordination‐modulated ligand photophysics is the foundation for developing fluorescent indicators that help address challenges in Zn(II) biology.
References:
(1) Coleman, J. E. Annu. Rev. Biochem. 1992, 61, 897‐946. (2) Vallee, B. L.; Auld, D. S. Acc. Chem. Res. 1993, 1993, 543‐551. (3) Lipscomb, W. N.; Sträter, N. Chem. Rev. 1996, 96, 2375‐2433. (4) Christianson, D. W.; Fierke, C. A. Acc. Chem. Res. 1996, 29, 331‐339. (5) Christianson, D. W.; Lipscomb, W. N. Acc. Chem. Res. 1989, 22, 62‐69.
63
(6) Coleman, J. E. Annu. Rev. Biophys. Biomol. Struct. 1992, 21, 441‐483. (7) Holtz, K. M.; Stec, B.; Kantrowitz, E. R. J. Biol. Chem. 1999, 274, 8351‐8354. (8) Pettersson, G. CRC Crit. Rev. Biochem. 1987, 21, 349‐389. (9) Kimura, E.; Sbionoya, M.; Hoshino, A.; Ikeda, T.; Yamada, Y. J. Am. Chem. Soc. 1992, 114, 10134‐
10137. (10) Kleifeld, O.; Frenkel, A.; Martin, J. M. L.; Sagi, I. Nat. Struct. Mol. Biol. 2003, 10, 98‐103. (11) Ladenstein, R.; Winberg, J.‐O.; Benach, J. Cell. Mol. Life Sci. 2008, 65, 3918‐3935. (12) Berg, J. M.; Shi, Y. Science 1996, 271, 1081‐1085. (13) Berg, J. M.; Godwin, H. A. Annu. Rev. Biophys. Biomol. Struct. 1997, 26, 357‐371. (14) Dodson, G.; Steiner, D. Curr. Opin. Struct. Biol. 1998, 8, 189‐194. (15) Bush, A. I. Trends Neurosci. 2003, 26, 207‐214. (16) Bush, A. I. Curr. Opin. Chem. Biol. 2000, 4, 184‐191. (17) Frederickson, C. J.; Koh, J.‐Y.; Bush, A. I. Nat. Rev. Neurosci. 2005, 6, 449‐462. (18) Sensi, S. L.; Paoletti, P.; Bush, A. I.; Sekler, I. Nat. Rev. Neurosci. 2009, 10, 780‐791. (19) Paoletti, P.; Vergnano, A. M.; Barbour, B.; Casado, M. Neuroscience 2009, 158, 126‐136. (20) Choi, D. W.; Koh, J. Y. Annu. Rev. Neurosci. 1998, 21, 347‐375. (21) Sensi, S. L.; Paoletti, P.; Koh, J.‐Y.; Aizenman, E.; Bush, A. I.; Hershfinkel, M. J. Neurosci. 2011, 31,
16076‐16085. (22) Kagi, J. H. R.; Schaffer, A. Biochemistry 1988, 27, 8509‐8515. (23) Maret, W. Biochemistry 2004, 43, 3301‐3309. (24) Bell, S. G.; Vallee, B. L. ChemBioChem 2009, 10, 55‐62. (25) Krężel, A.; Maret, W. J. Biol. Inorg. Chem. 2006, 11, 1049‐1062. (26) Krężel, A.; Hao, Q.; Maret, W. Arch. Biochem. Biophys. 2007, 463, 188‐200. (27) Krężel, A.; Maret, W. J. Biol. Inorg. Chem. 2008, 13, 401‐409. (28) Eide, D. J. Biochim. Biophys. Acta 2006, 1763, 711‐722. (29) Cousins, R. J.; Liuzzi, J. P.; Lichten, L. A. J. Biol. Chem. 2006, 281, 24085‐24089. (30) Outten, C. E.; O'Halloran, T. V. Science 2001, 292, 2488‐2492. (31) Bird, A. J.; McCall, K.; Kramer, M.; Blankman, E.; Winge, D. R.; Eide, D. J. EMBO J. 2003, 22, 5137‐
5146. (32) Waldron, K. J.; Rutherford, J. C.; Ford, D.; Robinson, N. J. Nature 2009, 460, 823‐830. (33) Maret, W.; Li, Y. Chem. Rev. 2009, 109, 4682‐4707. (34) Lee, S.‐J.; Koh, J.‐Y. Mol. Brain 2010, 3, 30. (35) Boya, P.; Kroemer, G. Oncogene 2008, 27, 6434‐6451. (36) Hwang, J. J.; Lee, S.‐J.; Kim, T.‐Y.; Cho, J.‐H.; Koh, J.‐Y. J. Neurosci. 2008, 28, 3114‐3122. (37) Roh, H. C.; Collier, S.; Guthrie, J.; Robertson, J. D.; Kornfeld, K. Cell Metabolism 2012, 15, 88‐99. (38) Hanaoka, K.; Kikuchi, K.; Kojima, H.; Urano, Y.; Nagano, T. J. Am. Chem. Soc. 2004, 126, 12470‐
12476. (39) You, Y.; Lee, S.; Kim, T.; Ohkubo, K.; Chae, W.‐S.; Fukuzumi, S.; Jhon, G.‐J.; Nam, W.; Lippard, S. J.
J. Am. Chem. Soc. 2011, 133, 18328‐18342. (40) Woo, H.; Cho, S.; Han, Y.; Chae, W.‐S.; Ahn, D.‐R.; You, Y.; Nam, W. J. Am. Chem. Soc. 2013, 135,
4771‐4787. (41) Dittmer, P. J.; Miranda, J. G.; Gorski, J. A.; Palmer, A. E. J. Biol. Chem. 2009, 284, 16289‐16297. (42) Vinkenborg, J. L.; Nicolson, T. J.; Bellomo, E. A.; Koay, M. S.; Rutter, G. A.; Merkx, M. Nat.
Methods 2009, 6, 737‐U10. (43) Qin, Y.; Dittmer, P. J.; Park, J. G.; Jansen, K. B.; Palmer, A. E. Proc. Nat. Acad. Sci. USA 2011, 108,
7351‐7356. (44) Park, J. G.; Qin, Y.; Galati, D. F.; Palmer, A. E. ACS Chem. Biol. 2012, 7, 1636‐1640.
64
(45) Miranda, J. G.; Weaver, A. L.; Qin, Y.; Park, J. G.; Stoddard, C. I.; Lin, M. Z.; Palmer, A. E. PLoS ONE 2012, 7, e49371.
(46) Thompson, R. B.; Jones, E. R. Anal. Chem. 1993, 65, 730‐734. (47) Shults, M. D.; Pearce, D. A.; Imperiali, B. J. Am. Chem. Soc. 2003, 125, 10591‐10597. (48) Bozym, R. A.; Thompson, R. B.; Stoddard, A. K.; Fierke, C. A. ACS Chem. Biol. 2006, 1, 103‐111. (49) Tomat, E.; Nolan, E. M.; Jaworski, J.; Lippard, S. J. J. Am. Chem. Soc. 2008, 130, 15776‐15777. (50) Sumner, J. P.; Aylott, J. W.; Monsona, E.; Kopelman, R. Analyst 2002, 127, 11‐16. (51) You, Y.; Cho, S.; Nam, W. Inorg. Chem. 2014, 53, 1804‐1815. (52) Vinkenborg, J. L.; Koay, M. S.; Merkx, M. Curr. Opin. Chem. Biol. 2010, 14, 231‐237. (53) Palmer, A. E.; Qin, Y.; Park, J. G.; McCombs, J. E. Trends Biotech. 2011, 29, 144‐152. (54) Dean, K. M.; Qin, Y.; Palmer, A. E. Biochim. Biophys. Acta 2012, 1823, 1406‐1415. (55) Frederickson, C. J.; Kasarskis, E. J.; Ringo, D.; Frederickson, R. E. J. Neurosci. Methods 1987, 20,
91‐103. (56) de Silva, A. P.; Gunaratne, H. Q. N.; Gunnlaugsson, T.; Huxley, A. J. M.; McCoy, C. P.; Rademacher,
J. T.; Rice, T. E. Chem. Rev. 1997, 97, 1515‐1566. (57) Valeur, B.; Leray, I. Coord. Chem. Rev. 2000, 205, 3‐40. (58) Valeur, B. Molecular Fluorescence. Principles and Applications; Wiley‐VCH, 2002. (59) Kimura, E.; Aoki, S. BioMetals 2001, 14, 191‐204. (60) Burdette, S. C.; Lippard, S. J. Coord. Chem. Rev. 2001, 216‐217, 333‐361. (61) Burdette, S. C.; Lippard, S. J. Proc. Natl. Acad. Sci. USA 2003, 100, 3605‐3610. (62) Thompson, R. B. Curr. Opin. Chem. Biol. 2005, 9, 526‐532. (63) Kikuchi, K.; Komatsu, H.; Nagano, T. Curr. Opin. Chem. Biol. 2004, 8, 182‐191. (64) Jiang, P.; Guo, Z. Coord. Chem. Rev. 2004, 248, 205‐229. (65) Lim, N. C.; Freake, H. C.; Brückner, C. Chem. Eur. J. 2005, 11, 38‐49. (66) Chang, C. J.; Lippard, S. J. Met. Ions Life Sci. 2006, 1, 321‐370. (67) Dai, Z.; Canary, J. W. New J. Chem. 2007, 31, 1708‐1718. (68) Carol, P.; Sreejith, S.; Ajayaghosh, A. Chem. Asian J. 2007, 2, 338‐348. (69) Domaille, D. W.; Que, E. L.; Chang, C. J. Nat. Chem. Biol. 2008, 4, 168‐175. (70) Que, E. L.; Domaille, D. W.; Chang, C. J. Chem. Rev. 2008, 108, 1517‐1549. (71) McRae, R.; Bagchi, P.; Sumalekshmy, S.; Fahrni, C. J. Chem. Rev. 2009, 109, 4780‐4827. (72) Nolan, E. M.; Lippard, S. J. Acc. Chem. Res. 2009, 42, 193‐203. (73) Tomat, E.; Lippard, S. J. Curr. Opin. Chem. Biol. 2010, 14, 225‐230. (74) Xu, Z.; Yoon, J.; Spring, D. R. Chem. Soc. Rev. 2010, 39, 1996‐2006. (75) Pluth, M. D.; Tomat, E.; Lippard, S. J. Annu. Rev. Biochem. 2011, 80, 333‐355. (76) Huang, Z.; Lippard, S. J. Methods in Enzymology 2012, 505, 445‐468. (77) Formica, M.; Fusi, V.; Giorgi, L.; Micheloni, M. Coord. Chem. Rev. 2012, 256, 170‐192. (78) Liu, Z.; He, W.; Guo, Z. Chem. Soc. Rev. 2013, 42, 1568‐1600. (79) Carter, K. P.; Young, A. M.; Palmer, A. E. Chem. Rev. ASAP. (80) Anslyn, E. V.; Dougherty, D. A. Modern Physical Organic Chemistry; University Science Books:
Sausalito, CA, 2006. (81) Rehm, D.; Weller, A. Isr. J. Chem. 1970, 8, 259‐271. (82) de Silva, S. A.; Zavaleta, A.; Baron, D. E.; Allam, O.; Isidor, E. V.; Kashimura, N.; Percapio, J. M.
Tetrahedron Lett. 1997, 38, 2237‐2240. (83) Czarnik, A. W. Acc. Chem. Res. 1994, 27, 302‐308. (84) de Silva, A. P.; Dixon, I. M.; Gunaratne, H. Q. N.; Gunnlaugsson, T.; Maxwell, P. R. S.; Rice, T. E. J.
Am. Chem. Soc. 1999, 121, 1393‐1394. (85) Sohna, J.‐E. S.; Jaumier, P.; Fages, F. J. Chem. Res. 1999, 134‐135.
65
(86) Bergamini, G.; Boselli, L.; Ceroni, P.; Manca, P.; Sanna, G.; Pilo, M. Eur. J. Inorg. Chem. 2011, 4590‐4595.
(87) Ueno, T.; Urano, Y.; Setsukinai, K.‐i.; Takakusa, H.; Kojima, H.; Kikuchi, K.; Ohkubo, K.; Fukuzumi, S.; Nagano, T. J. Am. Chem. Soc. 2004, 126, 14079‐14085.
(88) Urano, Y.; Kamiya, M.; Kanda, K.; Ueno, T.; Hirose, K.; Nagano, T. J. Am. Chem. Soc. 2005, 127, 4888‐4894.
(89) Miura, T.; Urano, Y.; Tanaka, K.; Nagano, T.; Ohkubo, K.; Fukuzumi, S. J. Am. Chem. Soc. 2003, 125, 8666‐8671.
(90) Sunahara, H.; Urano, Y.; Kojima, H.; Nagano, T. J. Am. Chem. Soc. 2007, 129, 5597‐5604. (91) Nagano, T.; Yoshimura, T. Chem. Rev. 2002, 102, 1235‐1269. (92) Shieh, P.; Hangauer, M. J.; Bertozzi, C. R. J. Am. Chem. Soc. 2012, 134, 17428‐17431. (93) Zhang, L.; Zhu, L. J. Org. Chem. 2008, 73, 8321‐8330. (94) Hong, Y.; Lam, J. W. Y.; Tang, B. Z. Chem. Commun. 2009, 4332‐4353. (95) Hong, Y.; Lam, J. W. Y.; Tang, B. Z. Chem. Soc. Rev. 2011, 40, 5361‐5388. (96) Ding, D.; Li, K.; Liu, B.; Tang, B. Z. Acc. Chem. Res. 2013, 46, 2441‐2453. (97) Saltiel, J. J. Am. Chem. Soc. 1967, 89, 1036‐1037. (98) Waldeck, D. H. Chem. Rev. 1991, 91, 415‐436. (99) Saltiel, J.; Zafiriou, O. C.; Megarity, E. D.; Lamola, A. A. J. Am. Chem. Soc. 1968, 90, 4759‐4760. (100) Grynkiewicz, G.; Poenie, M.; Tsien, R. Y. J. Biol. Chem. 1985, 260, 3440‐3450. (101) Constantin, T. P.; Silva, G. L.; Robertson, K. L.; Hamilton, T. P.; Fague, K.; Waggoner, A. S.;
Armitage, B. A. Org. Lett. 2008, 10, 1561‐1564. (102) Shank, N. I.; Zanotti, K. J.; Lanni, F.; Berget, P. B.; Armitage, B. A. J. Am. Chem. Soc. 2009, 131,
12960‐12969. (103) Baldridge, A.; Solntsev, K. M.; Song, C.; Tanioka, T.; Kowalik, J.; Hardcastle, K.; Tolbert, L. M.
Chem. Commun. 2010, 46, 5686‐5688. (104) Li, Y.; Shi, L.; Qin, L.‐X.; Qu, L.‐L.; Jing, C.; Lan, M.; James, T. D.; Long, Y.‐T. Chem. Commun. 2011,
47, 4361‐4363. (105) Tsien, R. Y. Angew. Chem. Int. Ed. 2009, 48, 5612‐5626. (106) Dong, J.; Solntsev, K. M.; Tolbert, L. M. J. Am. Chem. Soc. 2006, 128, 12038‐12039. (107) Suppan, P.; Ghoneim, N. Solvatochromism; The Royal Society of Chemistry, 1997. (108) Loving, G. S.; Sainlos, M.; Imperiali, B. Trends Biotech. 2009, 28, 73‐83. (109) Weber, G.; Farris, F. J. Biochemistry 1979, 18, 3075‐3078. (110) Lu, Z.; Lord, S. J.; Wang, H.; Moerner, W. E.; Twieg, R. J. J. Org. Chem. 2006, 71, 9651‐9657. (111) Kucherak, O. A.; Didier, P.; Mély, Y.; Klymchenko, A. S. J. Phys. Chem. Lett. 2010, 1, 616‐620. (112) Niko, Y.; Kawauchi, S.; Konishi, G.‐i. Chem. Eur. J. 2013, 19, 9760‐9765. (113) MacGregor, R. B.; Weber, G. Nature 1986, 319, 70‐73. (114) Grabowski, Z. R.; Rotkiewicz, K.; Rettig, W. Chem. Rev. 2003, 103, 3899‐4031. (115) Rettig, W. Top. Curr. Chem. 1994, 169, 253‐299. (116) Hamasaki, K.; Ikeda, H.; Nakamura, A.; Ueno, A.; Toda, F.; Suzuki, I.; Osa, T. J. Am. Chem. Soc.
1993, 115, 5035‐5040. (117) Aoki, S.; Kagata, D.; Shiro, M.; Takeda, K.; Kimura, E. J. Am. Chem. Soc. 2004, 126, 13377‐13390. (118) Diwu, Z.; Chen, C.‐S.; Zhang, C.; Klaubert, D. H.; Haugland, R. P. Chem. Biol. 1999, 6, 411‐418. (119) Blackburn, C.; Bai, M.; LeCompte, K. A.; Langmuir, M. E. Tetrahedron Lett. 1994, 35, 7915‐7918. (120) Lakowicz, J. R. Principles of Fluorescence Spectroscopy; 3rd ed.; Springer, 2006. (121) Zhang, L.; Dong, S.; Zhu, L. Chem. Commun. 2007, 1891‐1893. (122) Mizukami, S.; Okada, S.; Kimura, S.; Kikuchi, K. Inorg. Chem. 2009, 48, 7630‐7638. (123) Kiyose, K.; Kojima, H.; Urano, Y.; Nagano, T. J. Am. Chem. Soc. 2006, 128, 6548‐6549. (124) Sclafani, J. A.; Maranto, M. T.; Sisk, T. M.; Arman, S. A. V. Tetrahedron Lett. 1996, 37, 2193‐2196.

66
(125) Suzuki, Y.; Morozumi, T.; Nakamura, H.; Shimomura, M.; Hayashita, T.; Bartsh, R. A. J. Phys. Chem. B 1998, 102, 7910‐7917.
(126) Nishizawa, S.; Watanabe, M.; Uchida, T.; Teramae, N. J. Chem. Soc. Perkin Trans. 2 1999, 141‐143.
(127) Zhu, L.; Lynch, V. M.; Anslyn, E. V. Tetrahedron 2004, 60, 7267‐7275. (128) Manandhar, E.; Broome, J. H.; Myrick, J.; Lagrone, W.; Cragg, P. J.; Wallace, K. J. Chem. Commun.
2011, 47, 8796‐8798. (129) Manandhar, E.; Wallace, K. J. Inorg. Chim. Acta 2012, 381, 15‐43. (130) Simeonov, A.; Matsushita, M.; Juban, E. A.; Thompson, E. H. Z.; Hoffman, T. Z.; IV, A. E. B.; Taylor,
M. J.; Wirsching, P.; Rettig, W.; McCusker, J. K.; Stevens, R. C.; Millar, D. P.; Schultz, P. G.; Lerner, R. A.; Janda, K. D. Science 2000, 290, 307‐313.
(131) Debler, E. W.; Kaufmann, G. F.; Meijler, M. M.; Heine, A.; Mee, J. M.; Pljevaljĉić, G.; Bilio, A. J. D.; Schultz, P. G.; Millar, D. P.; Janda, K. D.; Wilson, I. A.; Gray, H. B.; Lerner, R. A. Science 2008, 319, 1232‐1235.
(132) Sengupta, P. K.; Kasha, M. Chem. Phys. Lett. 1979, 68, 382‐385. (133) Mordzinski, A.; Grabowska, A. Chem. Phys. Lett. 1982, 90, 122‐127. (134) Wan, P.; Shukla, D. Chem. Rev. 1983, 93, 571‐584. (135) Tolbert, L. M.; Solntsev, K. M. Acc. Chem. Res. 2002, 35, 19‐27. (136) Henary, M. M.; Fahrni, C. J. J. Phys. Chem. A 2002, 106, 5210‐5220. (137) Taki, M.; Wolfold, J. L.; O'Halloran, T. V. J. Am. Chem. Soc. 2004, 126, 712‐713. (138) Henary, M. M.; Wu, Y.; Fahrni, C. J. Chem. Eur. J. 2004, 10, 3015‐3025. (139) Abou‐Zied, O. K.; Jimenez, R.; Thompson, E. H. Z.; Millar, D. P.; Romesberg, F. E. J. Phys. Chem. A
2002, 106, 3665‐3672. (140) Scholes, G. D. Annu. Rev. Phys. Chem. 2003, 54, 57‐87. (141) Ranjit, S.; Gurunathan, K.; Levitus, M. J. Phys. Chem. B 2009, 113, 7861‐7866. (142) Miyawaki, A.; Llopis, J.; Heim, R.; McCaffery, J. M.; Adams, J. A.; Ikura, M.; Tsien, R. Y. Nature
1997, 388, 882‐887. (143) Matayoshi, E. D.; Wang, G. T.; Krafft, G. A.; Erickson, J. Science 1990, 247, 954‐958. (144) Kawanishi, Y.; Kikuchi, K.; Takakusa, H.; Mizukami, S.; Urano, Y.; Higuchi, T.; Nagano, T. Angew.
Chem. Int. Ed. 2000, 39, 3438‐3440. (145) Takakusa, H.; Kikuchi, K.; Urano, Y.; Sakamoto, S.; Yamaguchi, K.; Nagano, T. J. Am. Chem. Soc.
2002, 124, 1653‐1657. (146) Tyagi, S.; Kramer, F. R. Nat. Biotechnol. 1996, 14, 303‐308. (147) Valeur, B.; Pouget, J.; Bourson, J. J. Lumin. 1992, 52, 345‐347. (148) Li, M.‐J.; Kwok, W.‐M.; Lam, W. H.; Tao, C.‐H.; Yam, V. W.‐W.; Phillips, D. L. Organometallics
2009, 28, 1620‐1630. (149) Sreenath, K.; Yi, C.; Knappenberger, J. K. L.; Zhu, L. Phys. Chem. Chem. Phys. 2014, 16, 5088‐5092. (150) Bock, C. W.; Katz, A. K.; Glusker, J. P. J. Am. Chem. Soc. 1995, 117, 3754‐3765. (151) Lippard, S. J.; Berg, J. M. Principles of Bioinorganic Chemistry; University Science Books: Mill
Valley, CA, 1994. (152) Anderegg, G.; Hubmann, E.; Podder, N. G.; Wenk, F. Helv. Chim. Acta 1977, 60, 123‐140. (153) Arslan, P.; Virgilio, F. D.; Beltrame, M.; Tsien, R. Y.; Pozzan, T. J. Biol. Chem. 1985, 260, 2719‐
2727. (154) Mikata, Y.; Wakamatsu, M.; Yano, S. Dalton Trans. 2005, 545‐550. (155) Mikata, Y.; Wakamatsu, M.; Kawamura, A.; Yamanaka, N.; Yano, S.; Odani, A.; Morihiro, K.;
Tamotsu, S. Inorg. Chem. 2006, 45, 9262‐9268. (156) Mikata, Y.; Yamanaka, A.; Yamashita, A.; Yano, S. Inorg. Chem. 2008, 47, 7295‐7301.

67
(157) Mikata, Y.; Yamashita, A.; Kawata, K.; Konno, H.; Itami, S.; Yasuda, K.; Tamotsu, S. Dalton Trans. 2011, 40, 4059‐4066.
(158) Wang, H.‐H.; Gan, Q.; Wang, X.‐J.; Xue, L.; Liu, S.‐H.; Jiang, H. Org. Lett. 2007, 9, 4995‐4998. (159) Kawabata, E.; Kikuchi, K.; Urano, Y.; Kojima, H.; Odani, A.; Nagano, T. J. Am. Chem. Soc. 2005,
127, 818‐819. (160) Qian, F.; Zhang, C.; Zhang, Y.; He, W.; Gao, X.; Hu, P.; Guo, Z. J. Am. Chem. Soc. 2009, 131, 1460‐
1468. (161) Hanaoka, K.; Muramatsu, Y.; Urano, Y.; Terai, T.; Nagano, T. Chem. Eur. J. 2010, 16, 568‐572. (162) Royzen, M.; Durandin, A.; Young, V. G. J.; Geacintov, N. E.; Canary, J. W. J. Am. Chem. Soc. 2006,
128, 3854‐3855. (163) Allen, C. S.; Chuang, C.‐L.; Cornebise, M.; Canary, J. W. Inorg. Chim. Acta 1995, 239, 29‐37. (164) Zhu, L.; dos Santos, O.; Koo, C. W.; Rybstein, M.; Pape, L.; Canary, J. W. Inorg. Chem. 2003, 42,
7912‐7920. (165) Bardez, E.; Devol, I.; Larrey, B.; Valeur, B. J. Phys. Chem. B 1997, 101, 7786‐7793. (166) Bronson, R. T.; Montalti, M.; Prodi, L.; Zaccheroni, N.; Lamb, R. D.; Dalley, N. K.; Izatt, R. M.;
Bradshaw, J. S.; Savage, P. B. Tetrahedron 2004, 60, 11139‐11144. (167) Xue, L.; Wang, H.‐H.; Wang, X.‐J.; Jiang, H. Inorg. Chem. 2008, 47, 4310‐4318. (168) Pan, E.; Zhang, X.‐a.; Huang, Z.; Krezel, A.; Zhao, M.; Tinberg, C. E.; Lippard, S. J.; McNamara, J. O.
Neuron 2011, 71, 1116‐1126. (169) Radford, R. J.; Lippard, S. J. Curr. Opin. Chem. Biol. 2013, 17, 129‐136. (170) Koike, T.; Watanabe, T.; Aoki, S.; Kimura, E.; Shiro, M. J. Am. Chem. Soc. 1996, 118, 12696‐12703. (171) Chen, R. F.; Kernohan, J. C. J. Biol. Chem. 1967, 242, 5813‐5823. (172) Tamanini, E.; Sedger, A. K. L. M.; Todd, M. H.; Watkinson, M. Inorg. Chem. 2009, 48, 319‐324. (173) Ast, S.; Rutledge, P. J.; Todd, M. H. Eur. J. Inorg. Chem. 2012, 5611‐5615. (174) Interrante, L. V. Inorg. Chem. 1968, 7, 943‐949. (175) Canary, J. W.; Xu, J.; Castagnetto, J. M.; Rentzeperis, D.; Marky, L. A. J. Am. Chem. Soc. 1995, 117,
11545‐11547. (176) Dakanali, M.; Roussakis, E.; Kay, A. R.; Katerinopoulos, H. E. Tetrahedron Lett. 2005, 45, 4193‐
4196. (177) Sumalekshmy, S.; Henary, M. M.; Siegel, N.; Lawson, P. V.; Wu, Y.; Schmidt, K.; Bredas, J.‐L.;
Perry, J. W.; Fahrni, C. J. J. Am. Chem. Soc. 2007, 129, 11888‐11889. (178) Maruyama, S.; Kikuchi, K.; Hirano, T.; Urano, Y.; Nagano, T. J. Am. Chem. Soc. 2002, 124, 10650‐
10651. (179) Kim, T. W.; Park, J.‐h.; Hong, J.‐I. J. Chem. Soc., Perkin Trans. 2 2002, 923‐927. (180) Wang, J.; Xiao, Y.; Zhang, Z.; Qian, X.; Yang, Y.; Xu, Q. J. Mater. Chem. 2005, 15, 2836‐2839. (181) Kim, H. M.; Seo, M. S.; An, M. J.; Hong, J. H.; Tian, Y. S.; Choi, J. H.; Kwon, O.; Lee, K. J.; Cho, B. R.
Angew. Chem. Int. Ed. 2008, 47, 5167‐5170. (182) Jiang, W.; Fu, Q.; Fan, H.; Wang, W. Chem. Commun. 2008, 259‐261. (183) Hirano, T.; Kikuchi, K.; Urano, Y.; Nagano, T. J. Am. Chem. Soc. 2002, 124, 6555‐6562. (184) Koide, Y.; Urano, Y.; Hanaoka, K.; Terai, T.; Nagano, T. ACS Chem. Biol. 2011, 6, 600‐608. (185) Huang, S.; Clark, R. J.; Zhu, L. Org. Lett. 2007, 9, 4999‐5002. (186) Hein, J. E.; Fokin, V. V. Chem. Soc. Rev. 2010, 39, 1302‐1315. (187) Struthers, H.; Mindt, T. L.; Schibli, R. Dalton Trans. 2010, 39, 675‐696. (188) Lau, Y. H.; Rutledge, P. J.; Watkinson, M.; Todd, M. H. Chem. Soc. Rev. 2011, 40, 2848‐2866. (189) Michaels, H. A.; Murphy, C. S.; Clark, R. J.; Davidson, M. W.; Zhu, L. Inorg. Chem. 2010, 49, 4278‐
4287. (190) Kuang, G.‐C.; Michaels, H. A.; Simmons, J. T.; Clark, R. J.; Zhu, L. J. Org. Chem. 2010, 75, 6540‐
6548.
68
(191) Simmons, J. T.; Allen, J. R.; Morris, D. R.; Clark, R. J.; Levenson, C. W.; Davidson, M. W.; Zhu, L. Inorg. Chem. 2013, 52, 5838‐5850.
(192) Castagnetto, J. M.; Canary, J. W. Chem. Commun. 1998, 203‐204. (193) Dai, Z.; Proni, G.; Mancheno, D.; Karimi, S.; Berova, N.; Canary, J. W. J. Am. Chem. Soc. 2004, 126,
11760‐11761. (194) Akkaya, E. U.; Huston, M. E.; Czarnik, A. W. J. Am. Chem. Soc. 1990, 112, 3590‐3593. (195) Lim, N. C.; Schuster, J. V.; Porto, M. C.; Tanudra, M. A.; Yao, L.; Freake, H. C.; Brückner, C. Inorg.
Chem. 2005, 44, 2018‐2030. (196) Hirano, T.; Kikuchi, K.; Urano, Y.; Higuchi, T.; Nagano, T. Angew. Chem. Int. Ed. 2000, 39, 1052‐
1054. (197) de Silva, A. P.; Moody, T. S.; Wright, G. D. Analyst 2009, 134, 2385‐2393. (198) Gee, K. R.; Zhou, Z.‐L.; Ton‐That, D.; Sensi, S.; Weiss, J. H. Cell Calcium 2002, 31, 245‐251. (199) Tsien, R. Y. Nature 1981, 290, 527‐528. (200) Gunnlaugsson, T.; Lee, T. C.; Parkesh, R. Org. Biomol. Chem. 2003, 1, 3265‐3267. (201) Meng, X.‐M.; Zhu, M.‐Z.; Liu, L.; Guo, Q.‐X. Tetrahedron Lett. 2006, 47, 1559‐1562. (202) Parkesh, R.; Lee, T. C.; Gunnlaugsson, T. Org. Biomol. Chem. 2007, 5, 310‐317. (203) Simmons, J. T.; Yuan, Z.; Daykin, K. L.; Nguyen, B. T.; Clark, R. J.; Shatruk, M.; Zhu, L. Supramol.
Chem. 2014, DOI:10.1080/10610278.2013.844816. (204) Goze, C.; Ulrich, G.; Charbonniere, L.; Cesario, M.; Prange, T.; Ziessel, R. Chem. Eur. J. 2003, 9,
3748‐3755. (205) Goodall, W.; Williams, J. A. G. Chem. Commun. 2001, 2514‐2515. (206) Younes, A. Y.; Clark, R. J.; Zhu, L. Supramol. Chem. 2012, 24, 696‐706. (207) Felber, J.‐P.; Coombs, T. L.; Vallee, B. L. Biochemistry 1962, 1, 231‐238. (208) Loren, J. C.; Siegel, J. S. Angew. Chem. Int. Ed. 2000, 40, 754‐757. (209) Forbes, I. J.; Zalewski, P. D.; Hursta, N. P.; Giannakis, C.; Whitehouse, M. W. FEBS Lett. 1989, 247,
445‐447. (210) Kim, C. H.; Kim, J. H.; Moon, S. J.; Chung, K. C.; Hsu, C. Y.; Seo, J. T.; Ahn, Y. S. Biochem. Biophys.
Res. Commun. 1999, 259, 505‐509. (211) Chiu, Y.‐H.; Gabriel, G. J.; Canary, J. W. Inorg. Chem. 2005, 44, 40‐44. (212) Supuran, C. T.; Scozzafava, A. Bioorg. Med. Chem. 2007, 15, 4336‐4350. (213) Younes, A. H.; Zhang, L.; Clark, R. J.; Zhu, L. J. Org. Chem. 2009, 74, 8761‐8772. (214) Ajayaghosh, A.; Carol, P.; Sreejith, S. J. Am. Chem. Soc. 2005, 127, 14962‐14963. (215) Dennis, A. E.; Smith, R. C. Chem. Commun. 2007, 4641‐4643. (216) Sun, Y.; Wang, S. Inorg. Chem. 2010, 49, 4394–4404. (217) Dennis, A. E.; Smith, R. C. Chem. Commun. 2007, 4641‐4643. (218) Joshi, H. S.; Jamshidi, R.; Tor, Y. Angew. Chem. Int. Ed. 1999, 38, 2722‐2725. (219) Kang, Y.; Seward, C.; Song, D.; Wang, S. Inorg. Chem. 2003, 42, 2789‐2797. (220) Martić, S.; Wu, G.; Wang, S. Inorg. Chem. 2008, 47, 8315–8323. (221) Schweinfurth, D.; Hardcastle, K.; Bunz, U. H. F. Chem. Commun. 2008, 2203‐2205. (222) Eom, G. H.; Park, H. M.; Hyun, M. Y.; Jang, S. P.; Kim, C.; Lee, J. H.; Lee, S. J.; Kim, S.‐J.; Kim, Y.
Polyhedron 2011, 30, 1555‐1564. (223) Kozhevnikov, D. N.; Shabunina, O. V.; Kopchuk, D. S.; Slepukhin, P. A.; Kozhevnikov, V. N.
Tetrahedron Lett. 2006, 47, 7025‐7029. (224) Kozhevnikov, V. N.; Shabunina, O. V.; Kopchuk, D. S.; Ustinova, M. M.; König, B.; Kozhevnikov, D.
N. Tetrahedron 2008, 64, 8963‐8973. (225) Sreenath, K.; Allen, J. R.; Davidson, M. W.; Zhu, L. Chem. Commun. 2011, 47, 11730‐11732. (226) Murphy, M. P.; Smith, R. A. J. J. Annu. Rev. Pharmacol. Toxicol. 2007, 47, 629‐656. (227) Hitomi, Y.; Outten, C. E.; O'Halloran, T. V. J. Am. Chem. Soc. 2001, 123, 8614‐8615.
69
(228) Finney, L. A.; O'Halloran, T. V. Science 2003, 300, 931‐936. (229) Frederickson, C. J.; Giblin, L. J.; Krężel, A.; McAdoo, D. J.; Muelle, R. N.; Zeng, Y.; Balaji, R. V.;
Masalha, R.; Thompson, R. B.; Fierke, C. A.; Sarvey, J. M.; Valdenebro, M. d.; Prough, D. S.; Zornow, M. H. Experimental Neurobiology 2006, 198, 285‐293.
(230) Frederickson, C. J. Int. Rev. Neurobiol. 1989, 31, 145‐238. (231) Komatsu, K.; Kikuchi, K.; Kojima, H.; Urano, Y.; Nagano, T. J. Am. Chem. Soc. 2005, 127, 10197‐
10204. (232) Nolan, E. M.; Jaworski, J.; Okamoto, K.‐I.; Hayashi, Y.; Sheng, M.; Lippard, S. J. J. Am. Chem. Soc.
2005, 127, 16812‐16823. (233) Zhang, L.; Murphy, C. S.; Kuang, G.‐C.; Hazelwood, K. L.; Constantino, M. H.; Davidson, M. W.;
Zhu, L. Chem. Commun. 2009, 7408‐7410. (234) Kuang, G.‐C.; Allen, J. R.; Baird, M. A.; Nguyen, B. T.; Zhang, L.; Morgan, T. J. J.; Levenson, C. W.;
Davidson, M. W.; Zhu, L. Inorg. Chem. 2011, 50, 10493–10504. (235) Zhang, L.; Clark, R. J.; Zhu, L. Chem. Eur. J. 2008, 14, 2894‐2903. (236) Zhu, L.; Zhang, L.; Younes, A. H. Supramol. Chem. 2009, 21, 268‐283. (237) Wilson, J. N.; Bunz, U. H. F. J. Am. Chem. Soc. 2005, 127, 4124‐4125. (238) Younes, A. H.; Zhang, L.; Clark, R. J.; Davidson, M. W.; Zhu, L. Org. Biomol. Chem. 2010, 8, 5431‐
5441. (239) Wandell, R. J.; Younes, A. H.; Zhu, L. New J. Chem. 2010, 34, 2176‐2182. (240) Younes, A. Y.; Zhu, L. ChemPhysChem 2012, 13, 3827‐3835. (241) Sreenath, K.; Clark, R. J.; Zhu, L. J. Org. Chem. 2012, 77, 8268‐8279. (242) Zhang, X.; Shiraishi, Y.; Hirai, T. Tetrahedron Lett. 2007, 48, 5455–5459. (243) Du, P.; Lippard, S. J. Inorg. Chem. 2010, 49, 10753‐10755. (244) Sasaki, H.; Hanaoka, K.; Urano, Y.; Terai, T.; Nagano, T. Bioorg. Med. Chem. 2011, 19, 1072‐1078. (245) Fahrni, C. J.; O'Halloran, T. V. J. Am. Chem. Soc. 1999, 121, 11448‐11458. (246) Colvin, R. A.; Holmes, W. R.; Fontaine, C. P.; Maret, W. Metallomics 2010, 2, 306‐317. (247) Krężel, A.; Maret, W. J. Am. Chem. Soc. 2007, 129, 10911‐10921. (248) Dineley, K. E.; Malaiyandi, L. M.; Reynolds, I. J. Mol. Pharmacol. 2002, 62, 618‐627. (249) Ladbury, J. E.; Chowdhry, B. Z. Biocalorimetry. Applications of Calorimetry in the Biological
Sciences; John Wiley & Sons Ltd: West Sussex, 1998. (250) Qian, W.‐J.; Gee, K. R.; Kennedy, R. T. Anal. Chem. 2003, 75, 3468‐3475. (251) Li, D.; Chen, S.; Bellomo, E. A.; Tarasov, A. I.; Kaut, C.; Rutter, G. A.; Li, W.‐h. Proc. Natl. Acad. Sci.
USA 2011, 108, 21063‐21068. (252) Assaf, S. Y.; Chung, S.‐H. Nature 1984, 308, 734‐736. (253) Howell, G. A.; Welch, M. G.; Frederickson, C. J. Nature 1984, 308, 736‐738. (254) Frederickson, C. J.; Giblin, L. J. I.; Rengarajan, B.; Masalha, R.; Frederickson, C. J.; Zeng, Y.; Lopez,
E. V.; Koh, J.‐Y.; Chorin, U.; Besser, L.; Hershfinkel, M.; Li, Y.; Thompson, R. B.; Krezel, A. J. Neurosci. Methods 2006, 154, 19‐29.
(255) Yamasaki, S.; Sakata‐Sogawa, K.; Hasegawa, A.; Suzuki, T.; Kabu, K.; Sato, E.; Kurosaki, T.; Yamashita, S.; Tokunaga, M.; Nishida, K.; Hirano, T. J. Cell. Biol. 2007, 177, 637‐645.
(256) Johnson, K. A. In The Enzymes, 1992; Vol. XX. (257) Aoki, S.; Kaido, S.; Fujioka, H.; Kimura, E. Inorg. Chem. 2003, 42, 1023‐1030. (258) Fabbrizzi, L.; Foti, F.; Taglietti, A. Org. Lett. 2005, 7, 2603‐2606. (259) Kraskouskaya, D.; Bancerz, M.; Soor, H. S.; Gardiner, J. E.; Gunning, P. T. J. Am. Chem. Soc. 2014,
ASAP. (260) Nolan, E. M.; Ryu, J. W.; Jaworski, J.; Feazell, R. P.; Sheng, M.; Lippard, S. J. J. Am. Chem. Soc.
2006, 128, 15517‐15528. (261) Minta, A.; Tsien, R. Y. J. Biol. Chem. 1989, 264, 19449‐19457.
70
(262) Tsien, R. Y. Biochemistry 1980, 19, 2396‐2404. (263) Raju, B.; Murphy, E.; Levy, L. A.; Hall, R. D.; London, R. E. Am. J. Physiol. 1989, 256, C540‐C548. (264) London, R. E. Annu. Rev. Physiol. 1991, 53, 241‐258. (265) Sensi, S. L.; Ton‐That, D.; Weiss, J. H.; Rothe, A.; Gee, K. R. Cell Calcium 2003, 34, 281‐284. (266) Pearson, R. G. Science 1966, 151, 172‐177. (267) Klopman, G. J. Am. Chem. Soc. 1968, 90, 223‐234. (268) Irving, H.; Williams, R. J. P. Nature 1948, 162, 746‐747. (269) Irving, H.; Williams, R. J. P. J. Chem. Soc. 1953, 3192‐3210. (270) Increasing Zn(II)/Cu(II) selectivity has been attempted by enforcing coordination geometry
favoring Zn(II). See Dai, Z.; Xu, X.; Canary, J. W. Chem. Commun. 2002, 1414‐1415. (271) Brown, I. D. Acta Cryst. Section B 1988, 44, 545‐553. (272) Hancock, R. D.; Martell, A. E. J. Chem. Ed. 1996, 73, 654‐661. (273) Tessman, J. R.; Kahn, A. H.; Shockley, W. Phys. Rev. 1953, 92, 890‐895. (274) Margoshes, M.; Vallee, B. L. J. Am. Chem. Soc. 1957, 79, 4813‐4814. (275) Hoch, E.; Lin, W.; Chai, J.; Hershfinkel, M.; Fu, D.; Sekler, I. Proc. Natl. Acad. Sci. USA 2012, 109,
7202‐7207. (276) Kim, H. N.; Ren, W. X.; Kim, J. S.; Yoon, J. Chem. Soc. Rev. 2012, 41, 3210‐3244. (277) Williams, N. J.; Gan, W.; Reibenspies, J. H.; Hancock, R. D. Inorg. Chem. 2009, 48, 1407‐1415. (278) Mikata, Y.; Kawata, K.; Iwatsuki, S.; Konno, H. Inorg. Chem. 2012, 51, 1859‐1865. (279) Cockrell, G. M.; Zhang, G.; VanDerveer, D. G.; Thummel, R. P.; Hancock, R. D. J. Am. Chem. Soc.
2008, 130, 1420‐1430. (280) Mikata, Y.; Sato, Y.; Takeuchi, S.; Kuroda, Y.; Konno, H.; Iwatsuki, S. Dalton Trans. 2013, 42,
9688–9698. (281) Mikata, Y.; Nodomi, Y.; Kizu, A.; Konno, H. Dalton Trans. 2014, 43, 1684‐1690. (282) Hancock, R. D.; Martell, A. E. Chem. Rev. 1989, 89, 1875‐1914. (283) Hancock, R. D. Acc. Chem. Res. 1990, 23, 253‐257. (284) Gan, W.; Jones, S. B.; Reibenspies, J. H.; Hancock, R. D. Inorg. Chim. Acta 2005, 358, 3958‐3966. (285) Xue, L.; Liu, Q.; Jiang, H. Org. Lett. 2009, 11, 3454‐3457. (286) Liu, Z.; Zhang, C.; He, W.; Zhenghao Yang; Gao, X.; Guo, Z. Chem. Commun. 2010, 46, 6138–6140. (287) Tan, Y.; Gao, J.; Yu, J.; Wang, Z.; Cui, Y.; Yang, Y.; Qian, G. Dalton Trans. 2013, 42, 11465–11470. (288) Xue, L.; Liu, C.; Jiang, H. Org. Lett. 2009, 11, 1655‐1658. (289) Zhou, X.; Li, P.; Shi, Z.; Tang, X.; Chen, C.; Liu, W. Inorg. Chem. 2012, 51, 9226−9231. (290) Xu, Z.; Baek, K.‐H.; Kim, H. N.; Cui, J.; Qian, X.; Spring, D. R.; Shin, I.; Yoon, J. J. Am. Chem. Soc.
2010, 132, 601‐610. (291) Lu, C.; Xu, Z.; Cui, J.; Zhang, R.; Qian, X. J. Org. Chem. 2007, 72, 3554‐3557. (292) Murphy, D. B.; Davidson, M. W. Fundamentals of Light Microscopy and Electronic Imaging;
Second ed.; Wiley‐Blackwell: Hoboken, NJ, 2013. (293) Russell, W. C.; Newman, C.; Williamson, D. H. Nature 1975, 253, 461‐462. (294) Kapuscinski, J. Biotech. Histochem. 1995, 70, 220‐233. (295) Frangioni, J. V. Curr. Opin. Chem. Biol. 2003, 7, 626–634. (296) Yuan, L.; Lin, W.; Zheng, K.; He, L.; Huang, W. Chem. Soc. Rev. 2013, 42, 622‐661. (297) Guo, Z.; Park, S.; Yoon, J.; Shin, I. Chem. Soc. Rev. 2014, 43, 16‐29. (298) Kim, H. M.; Cho, B. R. Acc. Chem. Res. 2009, 42, 863‐872. (299) Sarkar, A. R.; Kang, D. E.; Kim, H. M.; Cho, B. R. Inorg. Chem. 2014, 53, 1794‐1803. (300) Ghosh, S. K.; Kim, P.; Zhang, X.‐a.; Yun, S.‐H.; Moore, A.; Lippard, S. J.; Medarova, Z. Cancer Res.
2010, 70, 6119‐6127. (301) Kimmel, C. B.; Ballard, W. W.; Kimmel, S. R.; Ullmann, B.; Schilling, T. F. Dev. Dyn. 1995, 203,
253–310.
71
(302) Parichy, D. M.; Elizondo, M. R.; Mills, M. G.; Gordon, T. N.; Engeszer, R. E. Dev. Dyn. 2009, 238, 2975–3015.
(303) Zhu, P.; Fajardo, O.; Shum, J.; Schärer, Y.‐P. Z.; Friedrich, R. W. Nat. Protocols 2012, 7, 1410‐1425. (304) Fernández‐Suárez, M.; Ting, A. Y. Nat. Rev. Mol. Cell Biol. 2008, 9, 929‐943. (305) Bolte, S.; Cordelières, F. P. J. Microscopy 2006, 224, 213‐232. (306) Johnson, L. V.; Walsh, M. L.; Chen, L. B. Proc. Natl. Acad. Sci. USA 1980, 77, 990‐994. (307) Kelso, G. F.; Porteous, C. M.; Coulter, C. V.; Hughes, G.; Porteous, W. K.; Ledgerwood, E. C.;
Smith, R. A. J.; Murphy, M. P. J. Biol. Chem. 2001, 276, 4588‐4596. (308) Dickinson, B. C.; Srikun, D.; Chang, C. J. Curr. Opin. Chem. Biol. 2010, 14, 50‐56. (309) Pierrel, F.; Cobine, P. A.; Winge, D. R. Biometals 2007, 20, 675‐682. (310) Atkinson, A.; Winge, D. R. Chem. Rev. 2009, 109, 4708‐4721. (311) Sensi, S.; Ton‐That, D.; Sullivan, P. G.; Jonas, E. A.; Gee, K. R.; Kaczmarek, L. K.; Weiss, J. H. Proc.
Natl. Acad. Sci. U. S. A. 2003, 100, 6157‐6162. (312) Dineley, K. E.; Votyakova, T. V.; Reynolds, I. J. J. Neurochem. 2003, 85, 563–570. (313) Masanta, G.; Lim, C. S.; Kim, H. J.; Han, J. H.; Kim, H. M.; Cho, B. R. J. Am. Chem. Soc. 2011, 133,
5698‐5700. (314) Liu, Z.; Zhang, C.; Chen, Y.; He, W.; Guo, Z. Chem. Commun. 2012, 48, 8365‐8367. (315) Xue, L.; Li, G.; Yu, C.; Jiang, H. Chem. Eur. J. 2012, 18, 1050‐1054. (316) Chyan, W.; Zhang, D. Y.; Lippard, S. J.; Radford, R. J. Proc. Nat. Acad. Sci. USA 2014, 111, 143‐148. (317) Walkup, G. K.; Burdette, S. C.; Lippard, S. J.; Tsien, R. Y. J. Am. Chem. Soc. 2000, 122, 5644‐5645. (318) Burdette, S. C.; Walkup, G. K.; Spingler, B.; Tsien, R. Y.; Lippard, S. J. J. Am. Chem. Soc. 2001, 123,
7831‐7841. (319) Anderson, R. G. W.; Falck, J. R.; Goldstein, J. L.; Brown, M. S. Proc. Natl. Acad. Sci. USA 1984, 81,
4838‐4842. (320) Xue, L.; Li, G.; Zhu, D.; Liu, Q.; Jiang, H. Inorg. Chem. 2012, 51, 10842−10849. (321) Duve, C. d.; Barsy, T. d.; Poole, B.; Trouet, A.; Tulkens, P.; Hoof, F. V. Biochemical Pharmacology
1974, 23. (322) Goldman, S. D.; Funk, R. S.; Rajewski, R. A.; Krise, J. P. Bioanalysis 2008, 1, 1445‐1459. (323) Galindo, F.; Burguete, M. I.; Vigara, L.; Luis, S. V.; Kabir, N.; Gavrilovic, J.; Russell, D. A. Angew.
Chem. Int. Ed. 2005, 117, 6662‐6666. (324) Kim, H. M.; An, M. J.; Hong, J. H.; Jeong, B. H.; Kwon, O.; Hyon, J.‐Y.; Hong, S.‐C.; Lee, K. J.; Cho, B.
R. Angew. Chem. Int. Ed. 2008, 47, 2231‐2234. (325) Han, J. H.; Park, S. K.; Lim, C. S.; Park, M. K.; Kim, H. J.; Kim, H. M.; Cho, B. R. Chem. Eur. J. 2012,
18, 15246‐15249. (326) Iyoshi, S.; Taki, M.; Yamamoto, Y. Org. Lett. 2011, 13, 4558‐4561. (327) Radford, R. J.; Chyan, W.; Lippard, S. J. Chem. Sci. 2013, 4, 3080‐3084. (328) Stewart, K. M.; Horton, K. L.; Kelley, S. O. Org. Biomol. Chem. 2008, 6, 2242‐2255. (329) Miyawaki, A.; Griesbeck, O.; Heim, R.; Tsien, R. Y. Proc. Nat. Acad. Sci. USA 1999, 96, 2135‐2140. (330) Qiao, W.; Mooney, M.; Bird, A. J.; Winge, D. R.; Eide, D. J. Proc. Nat. Acad. Sci. USA 2006, 103,
8674‐8679. (331) Dongen, E. M. W. M. v.; Dekkers, L. M.; Spijker, K.; Meijer, E. W.; Klomp, L. W. J.; Merkx, M. J.
Am. Chem. Soc. 2006, 128, 10754‐10762. (332) Pearce, L. L.; Gandley, R. E.; Han, W.; Wasserloos, K.; Stitt, M.; Kanai, A. J.; McLaughlin, M. K.;
Pitt, B. R.; Levitan, E. S. Proc. Nat. Acad. Sci. USA 2000, 97, 477‐482. (333) Walkup, G. K.; Imperiali, B. J. Am. Chem. Soc. 1996, 118, 3053‐3054. (334) Hong, S.‐H.; Maret, W. Proc. Nat. Acad. Sci. USA 2003, 100, 2255‐2260. (335) Keppler, A.; Gendreizig, S.; Gronemeyer, T.; Pick, H.; Vogel, H.; Johnsson, K. Nat. Biotech. 2003,
21, 86‐89.

72
(336) Keppler, A.; Pick, H.; Arrivoli, C.; Vogel, H.; Johnsson, K. Proc. Natl. Acad. Sci. USA 2004, 101, 9955‐9959.
(337) Shaner, N. C.; Patterson, G. H.; Davidson, M. W. J. Cell. Sci. 2007, 120, 4247‐4260. (338) Snapp, E. L. Trends Cell Biol. 2009, 19, 649‐655. (339) Bannwarth, M.; Correa, I. R.; Sztretye, M.; Pouvreau, S.; Fellay, C.; Aebischer, A.; Royer, L.; Rios,
E.; Johnsson, K. ACS Chem. Biol. 2009, 4, 179‐190. (340) Srikun, D.; Albers, A. E.; Nam, C. I.; Iavarone, A. T.; Chang, C. J. J. Am. Chem. Soc. 2010, 132, 4455. (341) Zalewski, P. D.; Forbes, I. J.; Seamark, R. F.; Borlinghaus, R.; Betts, W. H.; Lincoln, S. F.; Ward, A.
D. Chem. Biol. 1994, 1, 153‐141. (342) Woodroofe, C. C.; Lippard, S. J. J. Am. Chem. Soc. 2003, 125, 11458‐11459. (343) Nasir, M. S.; Fahrni, C. J.; Suhy, D. A.; Kolodsick, K. J.; Singer, C. P.; O'Halloran, T. V. J. Biol. Inorg.
Chem. 1999, 4, 775‐783. (344) Budde, T.; Minta, A.; White, J. A.; Kay, A. R. Neuroscience 1997, 79, 347‐358. (345) Hirano, T.; Kikuchi, K.; Urano, Y.; Higuchi, T.; Nagano, T. J. Am. Chem. Soc. 2000, 122, 12399‐
12400. (346) Evan, G. Chem. Biol. 1994, 1, 137‐141. (347) Zalewski, P. D.; Forbes, I. J.; Betts, W. H. Biochem. J. 1993, 296, 403‐408. (348) Kimura, E.; Aoki, S.; Kikuta, E.; Koike, T. Proc. Natl. Acad. Sci. USA 2003, 100, 3731‐3736. (349) Franco‐Pons, N.; Casanovas‐Aguilar, C.; Arroyo, S.; Rumià, J.; Pérez‐Clausell, J.; Danscher, G.
Neuroscience 2000, 98, 429‐435. (350) Frederickson, C. J.; Klitenick, M. A.; Manton, W. I.; Kirkpatrick, J. B. Brain Res. 1983, 273, 335‐339. (351) Weiss, J. H.; Koh, J. Y.; Christine, C. W.; Choi, D. W. Nature 1989, 338, 212. (352) Lu, Y.‐M.; Taverna, F. A.; Tu, R.; Ackerley, C. A.; Wang, Y.‐T.; Roder, J. Synapse 2000, 38, 187‐197. (353) Li, Y.; Hough, C. J.; Suh, S. W.; Sarvey, J. M.; Frederickson, C. J. J. Neurophysiol. 2001, 86, 2597‐
2604. (354) Li, Y.; Hough, C. J.; Frederickson, C. J.; Sarvey, J. M. J. Neurosci. 2001, 21, 8015‐8025. (355) Liuzzi, J. P.; Cousins, R. J. Annu. Rev. Nutr. 2004, 24, 151‐172. (356) Sekler, I.; Sensi, S. L.; Hershfinkel, M.; Silverman, W. F. Mol. Med. 2007, 13, 337‐343. (357) Lee, J.‐Y.; Kim, J. S.; Byun, H.‐R.; Palmiter, R. D.; Koh, J.‐Y. Brain Res. 2011, 1418, 12‐22. (358) Blakemore, L. J.; Tomat, E.; Lippard, S. J.; Trombley, P. Q. Metallomics 2013, 5, 208‐213. (359) Sharir, H.; Zinger, A.; Nevo, A.; Sekler, I.; Hershfinkel, M. J. Biol. Chem. 2010, 285, 26097‐26106. (360) Suh, S. W.; Jensen, K. B.; Jensen, M. S.; Silva, D. S.; Kesslak, P. J.; Danscher, G.; Frederickson, C. J.
Brain Res. 2000, 852, 274‐278. (361) Lee, J.‐Y.; Cole, T. B.; Palmiter, R. D.; Suh, S. W.; Koh, J.‐Y. Proc. Natl. Acad. Sci. USA 2002, 99,
7705‐7710. (362) Friedlich, A. L.; Lee, J.‐Y.; Groen, T. v.; Cherny, R. A.; Volitakis, I.; Cole, T. B.; Palmiter, R. D.; Koh,
J.‐Y.; Bush, A. I. J. Neurosci. 2004, 24, 3453‐3459. (363) Costello, L. C.; Franklin, R. B. Prostate 1998, 35, 285‐296. (364) Zhang, X.‐a.; Hayes, D.; Smith, S. J.; Friedle, S.; Lippard, S. J. J. Am. Chem. Soc. 2008, 130, 15788‐
15789. (365) Makhov, P.; Kutikov, A.; Golovine, K.; Uzzo, R. G.; Canter, D. J.; Kolenko, V. M. The Prostate 2011,
71, 1413‐1419. (366) Zalewski, P. D.; Millard, S. H.; Forbes, I. J.; Kapaniris, O.; Slavotinek, A.; Betts, W. H.; Ward, A. D.;
Lincoln, S. F.; Mahadevan, I. J. Histochem. Cytochem. 1994, 42, 877‐884. (367) Lukowiak, B.; Vandewalle, B.; Riachy, R.; Kerr–Conte, J.; Gmyr, V.; Belaich, S.; Lefebvre, J.; Pattou,
F. J. Histochem. Cytochem. 2001, 49, 519‐527. (368) Qian, W.‐J.; Aspinwall, C. A.; Battiste, M. A.; Kennedy, R. T. Anal. Chem. 2000, 72, 711‐717. (369) Gee, K. R.; Zhou, Z.‐L.; Qian, W.‐J.; Kennedy, R. T. J. Am. Chem. Soc. 2002, 124, 776‐778.
73
(370) Frederickson, C. Sci. STKE 2003, 2003, pe18. (371) Kay, A. R. J. Neurosci. 2003, 23, 6847‐6855. (372) Kay, A. R. Trends Neurosci. 2006, 29, 200‐206. (373) Nydegger, I.; Rumschik, S. M.; Kay, A. R. ACS Chem. Neurosci. 2010, 1, 728‐736. (374) Hendrickson, K. M.; Geue, J. P.; Wyness, O.; Lincoln, S. F.; Ward, A. D. J. Am. Chem. Soc. 2003,
125, 3889‐3895. (375) Meeusen, J. W.; Tomasiewicz, H.; Nowakowski, A.; Petering, D. H. Inorg. Chem. 2011, 50, 7563–
7573. (376) Nowakowski, A. B.; Petering, D. H. Inorg. Chem. 2011, 50, 10124–10133. (377) Meeusen, J. W.; Nowakowski, A.; Petering, D. H. Inorg. Chem. 2012, 51, 3625−3632. (378) Qin, Y.; Miranda, J. G.; Stoddard, C. I.; Dean, K. M.; Galati, D. F.; Palmer, A. E. ACS Chem. Biol.
2013, 8, 2366‐2371.