Embed Size (px)
Citation preview

Florida State University Libraries
Electronic Theses, Treatises and Dissertations The Graduate School
2005
An Investigation of Financial AssuranceMechanisms for Environmental LiabilitiesWendy D. Habegger
Follow this and additional works at the FSU Digital Library. For more information, please contact [email protected]
THE FLORIDA STATE UNIVERSITY
COLLEGE OF BUSINESS
AN INVESTIGATION OF FINANCIAL ASSURANCE MECHANISMS FOR ENVIRONMENTAL LIABILITIES
By
WENDY D. HABEGGER
A Dissertation submitted to the Department of Finance
in partial fulfillment of the requirements for the degree of
Doctor of Philosophy
Degree Awarded: Spring Semester, 2005
ii
The members of the Committee approve the Dissertation of Wendy D. Habegger defended on April 4, 2005.
_________________________ Pamela P. Peterson-Drake
Co-chair Directing Dissertation _________________________ Patrick F. Maroney Outside Committee Member _________________________ Gary A. Benesh Co-chair Directing Dissertation _________________________ Pamela K. Coats Committee Member
Approved: __________________________________ E. Joe Nosari, Interim Dean, College of Business The Office of Graduate Studies has verified and approved the above named committee members.

iii
I dedicate my dissertation to my savior Jesus Christ. I would not have completed the degree without His love, mercy, help, and direction. I also dedicate my dissertation to my parents, Karen and Kenneth Habegger. It is a privilege to have you as my parents and I could not have asked for better. Thank you for your unconditional love, encouragement, and financial support.
O sing unto the LORD a new song: sing unto the LORD, all the earth.
Sing unto the LORD, bless his name; shew forth his salvation from day to day. Declare his glory among the heathen, his wonders among all people.
For the LORD is great, and greatly to be praised: he is to be feared above all gods. For all the gods of the nations are idols: but the LORD made the heavens.
Honour and majesty are before him: strength and beauty are in his sanctuary. Give unto the LORD, O ye kindreds of the people, give unto the LORD glory and strength.
Give unto the LORD the glory due unto his name: bring an offering, and come into his courts. O worship the LORD in the beauty of holiness: fear before him, all the earth.
Say among the heathen that the LORD reigneth: the world also shall be established that it shall not be moved: he shall judge the people righteously.
Let the heavens rejoice, and let the earth be glad; let the sea roar, and the fullness thereof. Let the field be joyful, and all that is therein: then shall all the trees of the wood rejoice
Before the LORD: for he cometh, for he cometh to judge the earth: he shall judge the world with righteousness, and the people with his truth.
Psalm 96, KJV

iv
ACKNOWLEDGEMENTS
During the course of my studies, I had help along the way. I thank my committee members Dr. Gary Benesh, Dr. Pamela Coats, Dr. Patrick Maroney, and Dr. Pamela Peterson-Drake for their assistance and patience. I thank those Florida State University faculty members who were not on my committee but were supportive, Dr. Donald Nast and Dr. William Christiansen. I would like to thank Dr. Raid Amin from the University of West Florida, and Dr. Elton Scott, formerly from FSU for their guidance with my statistical interpretations. However, any errors of fact or interpretation are my responsibility. Finally, Dr. William Whitaker, thank you for the firm nudge to get my Ph.D. Linwood, thanks for the ear, the shoulder, the hugs, and the yeast rolls. You are next. Melita, thanks for being the best office mate. I appreciate all your prayers and support. You both are always in my heart and my prayers. To my most precious and faithful Boxer Maddie, you were there with me through it all. I would have been so lonely without your unconditional love and affection. Finally, to all the others, thank you for your prayers and continued support and interest in my life.

v
TABLE OF CONTENTS List of Tables ........................................................................................................Page vi List of Figures ........................................................................................................Page viii Abstract ..............................................................................................................Page ix 1. Introduction and Purpose ..........................................................................................Page 1 Environmental Liabilities and Financial Assurance...............................................Page 2 The Focus ........................................................................................................Page 5 The Contribution ...................................................................................................Page 6 The Findings ........................................................................................................Page 7 Outline and Summary of the Dissertation .............................................................Page 7 2. Review of the Literature .............................................................................................Page 8 What are Financial Assurance Requirements?.....................................................Page 8 What is the state of financial assurance today in the United States?...................Page 14 Reasonableness and Adequacy of Current Requirements...................................Page 23 Problems and Issues.............................................................................................Page 25 3. Analysis of Current Financial Assurance Guidelines.................................................Page 29 Review of the EPA’s Standards ............................................................................Page 29 Methods for Determining Company Health and Bankruptcy Prediction ...............Page 33 Data ........................................................................................................Page 37 Methodology ........................................................................................................Page 39 Results ........................................................................................................Page 41 Robustness Check ................................................................................................Page 49 Summary ........................................................................................................Page 51 4. Tests of financial assurance effectiveness: a sensitivity analysis .............................Page 53 Purpose for Sensitivity Analysis ............................................................................Page 53 Data ........................................................................................................Page 54 Methodology ........................................................................................................Page 54 Results ........................................................................................................Page 55 Summary ........................................................................................................Page 57 5. Conclusion ........................................................................................................Page 58 Summary of Findings ............................................................................................Page 58 Conclusions ........................................................................................................Page 60 Further Research ..................................................................................................Page 61 APPENDIX ........................................................................................................Page 105 A Major Environmental Catastrophes ................................................................Page 105 REFERENCES ........................................................................................................Page 108 BIOGRAPHICAL SKETCH ............................................................................................Page 116

vi
LIST OF TABLES Table 2.1: Time line of the major environmental laws ................................................... Page 62 Table 3.1: State versus federal regulations ................................................................... Page 63 Table 3.2: Comparison of methods and models ............................................................ Page 66 Table 3.3: Panel A: Classification results for the EPA’s financial tests, 1985-1999..................................................................................................... Page 67 Table 3.3: Panel B: Classification accuracy rates for the EPA’s financial tests by year, 1985-1999....................................................................................... Page 68 Table 3.4: Classification accuracy rates for the EPA’s financial tests by industry, 1985-1999..................................................................................................... Page 70 Table 3.5: Panel A: Classification results for Grice and Ingram (2001), 1985-1999 .... Page 72 Table 3.5: Panel B: Classification accuracy rates for Grice and Ingram (2001) by year, 1985-1999....................................................................................... Page 73 Table 3.6: Classification accuracy rates for Grice and Ingram (2001) by industry, 1985-1999...................................................................................................... Page 74 Table 3.7: Panel A: Classification results for bond ratings, 1985-1999........................ Page 75 Table 3.7: Panel B: Classification accuracy rates for bond ratings by year, 1985-1999 ....................................................................................................... Page 76 Table 3.8: Classification accuracy rates for bond ratings by industry, 1985-1999 ........ Page 77 Table 3.9: Panel A: Classification results auditor opinion, 1985-1999 ......................... Page 78 Table 3.9: Panel B: Classification accuracy rates for auditor opinion by year, 1985-1999....................................................................................................... Page 79 Table 3.10: Classification accuracy rates for auditor opinion by industry, 1985-1999.................................................................................................... Page 80 Table 3.11: Panel A: Classification results for the Altman Z-Score Model for publicly traded firms, 1985-1999 ................................................................ Page 81

vii
Table 3.11: Classification accuracy rates for the Altman Z-Score Model for publicly traded firms by year, 1985-1999.................................................... Page 82 Table 3.12: Classification accuracy rates for the Altman Z-Score Model for publicly traded firms by industry, 1985-1999.............................................. Page 83 Table 3.13: Panel A: Classification results for the Altman Z-Score Model for privately held firms, 1985-1999 .................................................................. Page 84 Table 3.13: Panel B: Classification accuracy rates for the Altman Z-Score Model for privately held firms by year, 1985-1999 ................................................ Page 85 Table 3.14: Classification accuracy rates for the Altman Z-Score Model for privately held firms by industry, 1985-1999........................................... Page 86 Table 3.15: Summary of classification rates for methods including logistic results, 1985-1999.................................................................................................... Page 88 Table 3.16: Summary of classification rates by method, 1985-1999............................. Page 89 Table 3.17: Summary of classification rates for each method by industry, 1985-1999..................................................................................................... Page 91 Table 3.18: Summary of overall classification rates by method, 1985-1999 ................. Page 92 Table 4.1: Distribution of error rates for the EPA’s financial tests using varying levels of PP&E for closure costs, 1985-1999................................... Page 93 Table 4.2: Distribution of classification rates for the EPA’s financial tests using varying levels of PP&E for closure costs by industry, 1985-1999 ...... Page 94 Table 4.3: Panel A Mean and median financial measures for firms subject to the EPA’s financial tests, 1985-1999............................................................ Page 101 Table 4.3: Panel B: Mean and median financial measures for firms subject to the EPA’s financial tests by industry, 1985-1999 ......................................... Page 102 Table A1: Summary of articles from trade and popular press ....................................... Page 107

viii
LIST OF FIGURES Figure 3.1: The proportion of bankrupt firm/years by year prior to bankruptcy for firms from 1985-1999 ............................................................................. Page 64 Figure 3.2: Proportion of bankrupt firm/years by industry for firms from 1985-1999...... Page 65 Figure 3.3: Classification error rates for the EPA's financial tests from 1985-1999 ....... Page 69 Figure 3.4: Classification error rates for the EPA's financial tests by industry ............... Page 71

ix
ABSTRACT
Firms are now required to disclose environmental activities and obligations. Prior, presumably
viable firms failed to include such obligations on financials. Firms in bankruptcy are often successful in
discharging their environmentally liabilities often at great cost to the public. The purpose of this
dissertation is to examine existing financial tests companies use to assure the Environmental Protection
Agency that they can satisfy their environmental obligations. Passing these tests allows firms to continue
engaging in potentially hazardous lines of business without actually allocating the necessary funds. I
examine the ability of the tests to detect firms that eventually go bankrupt. I compare the performance of
the tests to several methods used to predict bankruptcy such as the Altman Z-Score models, Grice and
Ingram’s definition of distress, bond ratings, and auditor opinion. I also test the sensitivity of the financial
tests to varying cost of closure.

1
CHAPTER 1 INTRODUCTION AND PURPOSE
Many firms may have undisclosed obligations for mitigation and reclamation of environmental
hazards. These mitigation and reclamation obligations may be short or long term and vary in amount.
For example, in the case of Safety-Kleen, the cost of mitigation for one landfill located in the state of
South Carolina is almost $1 billion, whereas its assets prior to the 2001 bankruptcy filing were
approximately $3 billion.1 Firms can have substantial liabilities that have the potential of becoming
catastrophic. Thus, there is incentive to manage the environmental liability to keep it from becoming an
environmental catastrophe. In Appendix A, I detail several of the major environmental catastrophes to
illustrate the importance of environmental liability mitigation and management.
Given that some of these catastrophic events are still fresh in the public’s mind, there is
increased concern about the risk the public bears for firms who fail to meet their environmental
obligations. In the popular media, such as The Wall Street Journal, The Associated Press, and state and
local newspapers, and trade publications, such as Platt’s Oilgram and Platt’s Coal Outlook, one finds
numerous articles about current environmental liability management issues and the associated costs
borne by the taxpayer [Table A1].
In light of the recent corporate scandals and bankruptcies of large firms (such as Enron,
WorldCom, Global Crossing, and Sunbeam) and coupled with the current economic downturn, the public
is increasingly concerned with firm transparency and viability. Aside from the issue of undisclosed off-
balance sheet liabilities, firms have successfully discharged environmentally related liabilities by filing for
bankruptcy protection. In this dissertation, I examine a variety of methods used to classify bankrupt firms.
Specifically, I compare the Environmental Protection Agency’s (EPA) financial tests ability to detect a
firm’s loss of viability with other methods available from the financial distress and bankruptcy prediction
literature.
Accurate assessment of firm viability is important to minimize both business and social costs.
Firms incorrectly assessed as lacking viability when in fact a firm is financially viable, these firms must
seek third party indemnification for their liabilities. Thus, the firm incurs additional business costs. Firms
lacking financial viability that are misclassified continue operations as usual and expose the public to the
potential social cost of funding the cleanup should the distressed firm default.
1 Report by Disclosure Incorporated.

2
When a firm defaults on its environmental obligation, the creditors and taxpayers ultimately bear
the burden of the cost of cleanup.2 In general, one assumes a firm will continue indefinitely and be viable
in the process by generating enough resources to maintain operations—the basic definition of “going
concern.” When an auditor issues a going concern modified opinion for a firm, this indicates that the
auditor believes the firm may struggle to remain a going concern in the next fiscal year. The definition of
“financial distress” may vary but it implies a firm continues to lack the ability to maintain going concern
status; however, the firm may still recover. Failing recovery, a firm may file for bankruptcy and reorganize
or it may liquidate.
To mitigate the costs of the environmental cleanup and hold the appropriate parties responsible,
regulators make additional requirements of firms that lose their going concern status. Regulators require
those firms to obtain an alternate form of assurance or risk losing their operating permit. However, at
times, regulators do not have much warning about a firm’s pending default.3
In this dissertation, I examine one of the existing financial mechanisms used to assure regulators
that companies will be able to satisfy their environmental obligations.4 For example, an entity that creates
and maintains a landfill must assure both state and federal regulators it has the financial means—either
through internal (that is financial wherewithal) or external (such as insurance) mechanisms—to cover the
costs of cleaning up and closing the landfill. In difficult economic environments, the need for financial
assurance is great. Yet external mechanisms are often expensive for entities to obtain. If companies
meet the criteria, they prefer to provide internal assurance.
1.1 Environmental Liabilities and Financial Assurance
1.1.1 What is financial assurance? Financial assurance is the demonstration of the ability to
fund costs associated with environmental liabilities. Such costs include closure obligations, post-closure
obligations, and corrective actions taken by an owner, operator, user, and anyone deemed a potentially
responsible party as defined and codified by The Code of Federal Regulations (CFR). Facilities are
required to prove they are financially viable to fund the following activities:
2 In reference to Safety-Kleen in South Carolina, the estimated cost is approximately $24.61 per person in
South Carolina for the Safety-Kleen issue alone. This figure is a crude estimate based on the $1 billion cost for a future repair at the landfill divided by the number of residents in the state (4,063,011) as reported by the U.S. Census Bureau at the time Safety-Kleen filed for bankruptcy protection in 2001. Although this estimate does not appear to be costly, this estimate is only for one repair at one site. It does not include estimates for other repairs, other sites, other types of hazards, or other hazards and sites owned by other companies. One can easily calculate the potential burden on the taxpayer if South Carolina has more than one site of concern. Estimating the total possible environmental liability and the potential burden for the taxpayers of each state is beyond the scope of this dissertation. 3 As reported in The Tampa Tribune on March 17, 2001, the Florida Department of Environmental
Protection took emergency control of the phosphate-mining site and phosphogypsum stacks abandoned by Mulberry Phosphates. A copy of the article is at http://www.fluoridealert.org/phosphate-industry.htm. 4 These mechanisms, directly or modified, are also used for state and local governments, as well as other
municipalities. The focus of this dissertation is on companies, though much of this research is applicable to other entities. Throughout the paper, I imply the terms “company,” “state and local governments,” and “municipalities” in the terms “entity” and “owner or operator.”

3
1) maintain the site during the life of the business and comply with the EPA and related state
regulatory agency guidelines,
2) properly close the site when the business is complete,
3) restore the site to a reasonable condition as dictated by the EPA and state authorities, and
4) maintain the site after closure, and cover any costs arising from unexpected contamination,
injuries, or problems before, during, and after closure.
If a firm, new or existing, cannot provide internal financial assurance then the firm must seek
alternative external financial assurance. Inability to obtain financial assurance will leave the firm without
the necessary permits and licenses needed to operate.
1.1.2 Why is financial assurance important? The purpose of financial assurance is to
internalize all environmental liability costs to the potentially responsible party. By requiring the
responsible party to take financial responsibility for all liabilities, this mitigates the social cost borne by
taxpayers. Enforcement may be in the form of the tort laws of strict liability and joint and several liability.
When discussing the issue of liability, it is necessary to distinguish negligence from strict liability
and joint and several liability from joint liability.5 Under negligence, proof is required that the responsible
party failed to use adequate precaution and any injury sustained was the direct result of the pollution or
the unsafe work environment caused directly cause by the lack of precaution. Strict liability is
independent of negligence; therefore, the responsible party for the hazardous activity may be liable for
the potential hazard, regardless if the responsible party used adequate precaution. Negligence in
environmental cases is often difficult to prove. Therefore, in environmental cases, the state regulatory
agencies prefer the use of strict liability. It removes the burden of proving negligence, and potential
environmental hazards can be considered “unusually dangerous activities” [Cross and Miller (2001) page
277].
Joint and several liability usually applies to torts, and it means either one or all of the involved
potentially responsible parties may be responsible for the entire liability; no one is safe from the
responsibility. In a sense, it is a situation where the regulators attempt to get what they can from
whomever. If they did not get it all in the first round, then they may find other potentially responsible
parties and attempt to recover it from them as well. For joint liability, which is usually applicable in
contract situations, it may be an all or nothing situation. Thus, if it happens to one responsible party, then
it happens to all. If the state regulatory agency holds one responsible party accountable, then the agency
must hold all responsible parties accountable. Likewise, if the state regulatory agency pardons one party,
then they pardon all. Potentially responsible parties tend to use joint liability against each other for
sharing the liability and for a fairer distribution of the obligation. The state regulatory agencies tend to
5 Further discussion on types of liability can be found in Cross and Miller (2001), Chapters 12 and 25.
4
focus on the use of strict liability and joint and several liability when instigating litigation and cost recovery
from responsible parties.
To accomplish the goal of internalizing the liability, the EPA requires firms involved in potentially
hazardous lines of business to apply for permits and/or licenses. These permits give the firm permission
to perform the necessary activities related to the line of business with the potential hazard. The permits
may also predefine acceptable limits of pollution. To receive these permits, firms must meet all
guidelines required by the governing regulatory agencies. Specifically, they must show proof of financial
assurance.6 Demonstration of financial assurance contractually binds the permitee to fulfill the obligation
for which it is providing assurance.
Several financial assurance mechanisms exist. Each potential hazard can require the use of a
single mechanism or, in some cases, a combination of mechanisms. Mechanisms may include
insurance, trust funds, corporate parent guarantees, or financial tests. Many of these mechanisms
subject the responsible party of the facility to increased monitoring by state and federal regulators and,
often, an additional third-party financial provider. Misuse of assurance mechanisms can lead to the
taxpayers bearing the costs.7 In other words, a distributional concern exists as the burden shifts to the
U.S. taxpayers. The most controversial of these mechanisms, the financial test, is the focus of
investigation in this dissertation. Financial tests are the least expensive mechanism because they only
require the firm to provide financial statements attesting to the firm’s viability should it face an
environmental claim. It is a promise that binds the firm to the obligation; however, it provides no tangible
guarantee that funds will be available when needed.
Firms that are not financially viable can find third-party assurance but at a higher cost, which the
firm may not be able to afford [Boyd (2001a)]. A firm claiming it cannot afford the mechanism may be
financially beyond its means. It becomes an environmental concern. Firms may attempt to negotiate for
a temporary relaxation in the requirements. However, these relaxed requirements do not always comply
with federal law.8 In some cases, firms that negotiated a temporary reprieve filed for bankruptcy shortly
thereafter.9
6 In many cases, firms must answer to more than one regulatory agency. The many environmental acts
have established regulatory agencies relevant to the specific issue they address, while the EPA monitors all environmental hazards. For example, licensees of nuclear power reactors are also responsible to the Nuclear Regulatory Commission (NRC). The Underground Injection Control (UIC) program director for each state monitors underground injection wells for the EPA. The Office of Surface Mining Reclamation and Enforcement (OSMRE) monitors mining operations. The United States Coast Guard regulates water transportation of hazardous materials. For a review of the major regulatory acts and the statutes governing compliance and enforcement through criminal prosecution, see Lachenmayr, Lockner, Olson, and Wolpert (1998). 7 At a Florida Department of Environmental Protection (DEP) mining reclamation meeting in September
2002, the attorney for the DEP, Mr. John Alden, explained some common misuses of financial assurance mechanisms. Misuses can include approval by a representative of the company who is not an officer and, therefore, does not legally bind the company; providing fraudulent financial statements; and attempting to use one mechanism to cover sites not specified by the mechanism. 8As reported in The Greenwire on December 18, 2002, Dow Chemical Company and Michigan’s
Department of Environmental Quality came to an agreement to reduce Dow’s financial assurance costs and clean-up liability for dioxin contamination in the soil by allowing Dow to increase the amount they

5
1.2 The Focus
In this dissertation, I examine the ability of the financial tests to classify a firm according to its
financial viability. Specifically, I focus on analyzing the financial fundamentals that make up these tests.
Among the questions I address are the following:
• Are these financial tests effective in assuring that financial resources exist to fund the
cleanup of environmental accidents?10
That is, can these tests detect when a firm will go
bankrupt?
• Do the financial tests foster cost internalization, or do they hinder those responsible from
taking responsibility? That is, are these tests effective in guaranteeing the necessary
funds are available for environmental cleanups?
Whereas other studies focus on the environmental, economic, legal, and ethical effects
concerning environmental contamination, in this dissertation I investigate the financial precursor to these
issues. Specifically, I address the viability of firms to fulfill their legal financial obligation for the
maintenance, closure, and any corrective actions directly related to site operations. Other studies are
reactive studies because they are often ex-post analysis of the liability realization. They examine the
after effects on the environment and its inhabitants and the economic welfare and social costs [Riering
1992, Boyd 1993]. Other studies focus on policy-making, risk sharing, and the legal debate between
bankruptcy law and environmental law [Van ‘T Veld 1997, McGraw 1998].11
Recently, environmental law,
disclosure, and the contractual commitment of the permitee are receiving increased attention.12
This
study is a reactive study in the sense that my interest in this topic was peaked after reading about the
many firms attempting to discharge their environmental liabilities. I realized that if these firms are
successful in their bid to dismiss their obligations, then I as a taxpayer am ultimately bearing the cost. I
focus on the EPA’s financial tests applicability for social cost mitigation.
dump into the soil at no added cost to Dow. This reduction of liability means the reduction of standards. This reduction in the state standard violates the federal guidelines, so the City of Midland, Michigan, and several environmental groups have filed a lawsuit to stop the approval of the proposal. 9 Mulberry Phosphates filed for bankruptcy in 2001 and abandoned the mining site and the
phosphogypsum stacks for the State of Florida to clean up at the cost of $125 million (as of April 3, 2003). 10
Deterrence is important in some types of environmental hazards. For example, if a phosphate processing company files for bankruptcy and is unable to fund the cost of pumping the acidic water for its phosphogypsum stacks, a significant probability exists that there will be a hazardous spill into the state’s water supply. In this case, funds are necessary to deter an environmental hazard. 11
The difficulty here lays in the fact the courts must interpret congressional intent. No consensus exists among the courts. For a review of cases, see Hill (1998), Spracker and Barnette (1994), Bloom (1995), and C. Barth (1994). 12
As reported in The Ohio Law Letter in October 2002, the SEC petitioned to require full disclosure of environmental liabilities in corporate filings. This petition came in light of several major bankrupt corporations with serious environmental liabilities and on the heels of the 1998 EPA report that found 74 percent of firms fail to report environmental liability litigation in excess of $100,000. Not reporting such liabilities violates the SEC regulation S-K and can warrant criminal charges.

6
1.3 The Contribution
The importance of this dissertation is in its contribution to the overall well being of the
environment and society. In light of the anecdotal evidence of firms attempting to avoid their
environmental obligation and the public seeking improved disclosure requirements from the Securities
and Exchange Commission (SEC) and the Financial Accounting Standards Board (FASB), it is logical
that the next step is to look at the adequacy of the EPA’s financial tests.13
The EPA’s financial tests use
well-known financial analysis techniques and methods. When applied, the financial tests should be able
to provide regulators with guidance about a firm’s viability. Specifically, these tests should let regulators
know when a firm’s viability may be waning. Early and more accurate detection by the EPA creates
proactive enforcement of compliance, mitigates costs, and lessens the financial burden on the taxpayer.
This dissertation ties together the areas of finance, accounting, insurance, government
regulation, the environment, financial distress, and bankruptcy under the umbrella of risk management.
This topic is timely and significant, as it affects everyone. It is a serious study of the real-world
application of risk management techniques and whether these techniques accomplish their designed
purpose. Failure of risk management techniques in this arena can lead to environmental catastrophes
that no amount of money can restore. Diligent monitoring and revision are not just necessary—they are
vital to our survival.
Because these financial tests dictate whether firms may continue to engage in potentially
hazardous lines of business, there are four potential outcomes. The first two are what we hope for; non-
bankrupt firms receive permits and continue operating while firms that are quickly approaching
bankruptcy must find an alternative means of financial assurance. The other two potential outcomes may
result in additional unexpected costs. Firms quickly approaching bankruptcy that continue operations,
without providing an alternate form of assurance create potential social costs on the environment and
taxpayers if they default on their obligations. Non-bankrupt firms that must find alternate financial
assurance incur additional business costs that may be unnecessary.
These financial tests are comprised of financial ratios. We know from prior research that ratios
can be consistent indicators of distress [Beaver (1966, 1968), Altman (1968, 1977, 1993), Ohlson (1980),
Scott (1981), and Grice and Ingram (2001)]. I compare the classification accuracy of the EPA’s financial
tests and other commonly used bankruptcy prediction methods.14
My reason for doing so is to search for
alternative methods that may have better classification accuracy than the EPA’s financial tests. If such
methods exist, then perhaps the EPA might consider selecting one of these for future use. I also conduct
sensitivity analyses for differing levels of closure costs that represent the environmental liabilities. My
purpose for doing so is to determine how sensitive the tests are to varying closure costs.
13
The disclosure requirements are the Securities and Exchange Commission (SEC) Regulation S-K items 101, 103, and 303. The new accounting change is the implementation of Financial Accounting Board Standard (FASB) Statement Number 143, effective June 2002. 14
I test the null hypothesis that there is no difference in the classification of bankruptcy between bankrupt and non-bankrupt firms. Type I error indicates a bankrupt firm passes the financial tests. Type II error indicates a non-bankrupt firm fails the financial tests.

7
1.4 The Findings
I find the EPA’s financial tests are able to classify over 90 percent of the bankrupt observations
and over 60 percent of the non-bankrupt observations correctly. Annually, the results remain consistent.
The tests do classify the firms more accurately in some industries than in others. When compared to
other methods, the classification ability of the EPA’s financial tests is most comparable and consistent
with the Altman’s Z-Score methods.
I find the financial tests are somewhat sensitive to varying closure costs. As closure costs
increase, there is an insignificant decrease in type I error [the number of bankrupt observations that fail
the financial tests]. As expected, misclassification of non-bankrupt observations increases as closure
costs increase.
1.5 Outline and Summary
In Chapter 2, I describe financial assurance tests for the major environmental liabilities and
provide a review of the environmental liability literature. The major environmental liabilities are as follows:
nuclear power reactors; above and below surface mining; injection wells; municipal solid waste landfill
facilities (MSWLF) and hazardous waste treatment, storage, and disposal facilities (TSDF); underground
storage tanks (UST); and transportation of hazardous materials in water bound vessels. I explain the
types of financial assurance available to firms with environmental liabilities and discuss problems and
issues.
In Chapter 3, I provide a review of the distress and bankruptcy prediction literature and analyze
the classification accuracy of the EPA’s financial tests. I also compare the EPA’s classification rates with
various methods for detecting bankruptcy: Grice and Ingram’s (2001) definition of financial distress, bond
ratings, and auditor opinion, Altman’s Z-Scores for publicly traded and privately held firms. In Chapter 4, I
test the sensitivity of the financial tests to detecting bankruptcy with varying levels of closure costs.
Finally, in Chapter 5, I summarize my results and offer avenues for future research.

8
CHAPTER 2 REVIEW OF THE LITERATURE
2.1 What Are the Financial Assurance Requirements?
2.1.1 Development of guidelines. Financial assurance guidelines have evolved over the past
30 years from the major environmental laws and their amendments. These laws are the reaction to
negative events caused by a lack of protection for the environment and its inhabitants. I devote this
section to the introduction of some major laws and briefly explain their purpose.15
I provide a list of some
of the environmental laws over the past 65 years in Table 2.1. Many of the earlier laws listed in Table 2.1
have been amended and are subsumed in the present laws.
Congress and state legislatures establish environmental requirements by passing laws that limit
negative human impact on the environment. These statutes are included in the federal or state code of
laws respective to the legislature that passed the law. State statutes only apply to the state, whereas
federal statutes apply to all states. Regulatory entities generate rules to implement the statutes. Local
governments also pass statutes, called ordinances, rules, or orders, to govern issues not addressed by
federal or state laws. The statutes are applicable in the region governed by the local government.
The federal government relies on the state and local governments and regulatory agencies to
implement and to enforce the federal statutes within their specific states and regions. Often, the states
regulate the general law and allow more localized governmental units to interpret implementation and
execution of the law, as long as it meets the state and federal standards. For example, the federal
government regulates landfills, and the state is responsible for the management of the landfills and
compliance with using the landfills. The local government in the area in which the landfill resides may
determine the method of waste pick up and disposal.
The National Environmental Policy Act of 1969 (NEPA) established the Council on Environmental
Quality that reports annually to Congress on the state of all environmental affairs in the United States.16
15
For an extensive survey on the evolution of environmental policy from an economics perspective, please see Cropper and Oates (1992). 16
42 U.S.C. § 4321-4347, and may be found at http://ceq.eh.doe.gov/nepa/regs/nepa/nepaeqia.htm.

9
The Council investigates all aspects of quality management for the environment, both current and
forward-looking trends. In other words, the Council is the keeper of the environment, monitoring the
effects of the current and future applications of laws and compliance. It provides guidelines for the
federal government’s role and responsibility for the environment. An all encompassing law with its
amendments, the Resource Conservation and Recovery Act of 1976 (RCRA) gives the EPA complete
control over all things related to hazardous waste, barring historical and abandoned waste sites. In those
cases, Comprehensive Environmental Response, Compensation, and Liability Act of 1980 (CERCLA)
covers those sites.17
RCRA provides objectives for the rigorous treatment of hazardous waste throughout
the waste’s existence.
Congress expanded federal authority for the EPA to respond to toxic releases with the advent of
CERCLA (or Superfund) and its amendments. A key provision of CERCLA is the improvement of the
National Contingency Plan. This plan outlines the procedures for such releases. It also establishes the
National Priorities List (NPL) that contains contaminated sites that are of concern, and for which the EPA
collects taxes from the offending industries to fund the cleanup of necessary sites.18
Congress amended CERCLA with the Superfund Amendments and Reauthorization Act of 1986
(SARA), making several changes and additions to the program. In particular, SARA supports the
investigation and the implementation of new techniques for the management and maintenance of
hazardous waste and requires continuity between state and federal regulations. One of the most
important provisions is the updating of the Hazard Ranking System (HRS). The HRS is a ranking system
that provides regulators with a list of criteria used to calculate a score. This score tells the regulators the
potential threat the particular site is to the environment. SARA provides improvements to the HRS for a
more appropriate score with respect to the level of waste sites contain.19
Other laws regulate specific types of potential damage to the environment. For example,
o air emissions from all mobile sources are regulated according to the Clean Air Act of 1990
(CAA),20
o federal control of all things pesticide related is regulated by the Federal Insecticide, Fungicide
and Rodenticide Act of 1972 (FIFRA), 21
o pesticide regulation is expanded with the Food Quality Protection Act of 1996 (FQPA) and
the FIFRA and Federal Food, Drug, and Cosmetic Act (FFDCA),22
o drinking water quality is regulated by the Safe Drinking Water Act of 1974 (SDWA),23
17
42 U.S.C. § 321, and may be found at http://www.epa.gov/region5/defs/html/rcra.htm and http://www4.law.cornell.edu/uscode/42/ch82.html. 18
42 U.S.C. § 9601, and may be found at http://www.epa.gov/superfund/action/law/cercla.htm and http://www4.law.cornell.edu/uscode/42/ch103.html. 19
42 U.S.C. § 9601, and may be found at http://www.epa.gov/superfund/action/law/sara.htm and http://www4.law.cornell.edu/uscode/42/ch103.html. 20
42 U.S.C. § 7401, and may be found at http://www.epa.gov/region5/defs/html/caa.htm and http://www.epa.gov/oar/caa/contents.html. 21
7 U.S.C. § 135, and may be found at http://www.epa.gov/region5/defs/html/fifra.htm and http://www4.law.cornell.edu/uscode/7/ch6.html.

10
o all manner of chemicals are regulated under the Toxic Substances Control Act of 1976
(TSCA),24
and
o the Clean Water Act of 1977 regulates pollutants discharged into the United States waters
(CWA), which amends the Federal Water Pollution Control Act Amendments of 1972.25
These laws provide guidance to the EPA and state regulatory agencies on business compliance
and regulation. Any business activity that may produce an environmental hazard requires some form of
financial assurance. The hazards include the licensing and decommissioning of nuclear power plants;
surface and underground mining and reclamation; plugging and abandoning injection wells; waste
management landfill facilities; hazardous waste treatment, storage, and disposal facilities; and
underground storage tanks for hazardous materials.26
I discuss these types of hazards in the next
sections. For the analyses in this dissertation, I examine the hazards as a whole, meaning I do not treat
hazards uniquely.
2.1.2 Federal and state guidelines. Before discussing the guidelines for the hazards, I
address preemption. The states have the main responsibility to monitor and to enforce compliance,
provided they have the capability to do so. In cases where the state lacks the necessary laws, personnel,
equipment, or overall ability to implement the federal laws—for example, if the state does not have an
EPA office or Regional Administrator or a state regulatory agency—then federal law is the precedent. If
the state has the state-level framework and the federal and state laws are concurrent, then federal law
preempts state law [Cross and Miller (2000), Copeland (1997)].
Although states have some leeway from the federal government, the federal government may
intervene in the activities within a state at any time it sees fit if a federal law exists. However, if a federal
law does not exist but a state law does, then state law may preempt federal law. The degree of federal
government intervention depends upon the varying level of preemption [Meltz (1999)]. Preemption may
be general, in which the federal government may intervene at will, or it may be highly specific in that the
state may or may not be given certain variances or waivers for certain types of environmental activities.
The ability to receive the waiver depends upon a multitude of factors, such as the type of hazard, the
accessibility to treatment facilities, and the financial viability of the firm responsible for the hazard.
RCRA Section 3009 ensures states that have implemented federal programs may impose stricter
regulations than the federal programs require. If the federal program tightens the regulations, the states
must likewise tighten their regulations. In other words, the state may be more rigorous than federal
requirements, but it cannot be more lenient. Thus, the states may require additional or more stringent
financial assurance requirements. In states that do not have approved programs implemented, the EPA
22
Public Law 104-170, August 3, 1996, and may be found at http://www.epa.gov/opppsps1/fqpa/ and http://www4.law.cornell.edu/uscode/21/ch9.html. 23
42 U.S.C. § 300f, and may be found at http://www.epa.gov/region5/defs/html/sdwa.htm and http://www4.law.cornell.edu/uscode/42/300f.html. 24
15 U.S.C. § 2601, and may be found at http://www.epa.gov/region5/defs/html/tsca.htm and http://www4.law.cornell.edu/uscode/15/ch53.html. 25
33 U.S.C. § 1251, and may be found at http://www.epa.gov/region5/water/cwa.htm and http://www4.law.cornell.edu/uscode/33/ch26.html.

11
Regional Director evaluates the equivalency of the state-required mechanism to the federal-required
mechanism. The next section describes the guidelines for firms that may engage in the following types of
business activities that pose potential environmental hazards:
(a) nuclear power reactors,
(b) above and below surface mining,
(c) municipal solid waste landfill facilities (MSWLF) and hazardous waste treatment, storage,
and disposal facilities (TSDF),
(d) underground storage tanks (UST), and
(e) the transportation of hazardous waste across bodies of water.
2.1.2.1 Nuclear power reactors. The regulatory agency for the licensing and decommissioning
of nuclear power reactors is the Nuclear Regulatory Commission (NRC).27
The NRC defines two types of
nuclear reactors: power and non-power. Power nuclear reactors are commercial reactors used to
generate electricity. Non-power reactors are those used in research, testing, and training by non-profit
organizations. These types of entities are beyond the scope of this dissertation, as I focus on those firms
that are for-profit institutions. The NRC evaluates the financial qualifications of an applicant for a nuclear
power reactor license at various stages of business and for several reasons. Evaluations of applicants’
financials occur for the following:
• initial licensing,
• prior to being sold, acquired, or restructured because the license to operate transfers to
the buyer,
• license renewal for nuclear power reactors that are not electric utilities, and
• if the NRC suspects the firm is no longer a going concern.
Financial qualifications refer to an applicant’s ability to meet the necessary requirements as
dictated by the NRC and the EPA to acquire the operating license and comply with environmental
regulations while in operation. Financial assurance is different from financial qualification in that financial
assurance refers to the applicant’s ability to cover costs associated with hazard-related incidents and
accidents during operation and costs related to the decommissioning of the plant. Both are related; if an
applicant shows proof of financial assurance, then the financial qualifications follow. However, satisfying
the financial qualifications does not imply financial assurance is satisfied, as financial assurance is
accident related and financial qualifications relate to the day-to-day operations.
Nuclear power reactors that are electric utilities are not required to resubmit financial information
upon license renewal. The NRC argues that because electric utilities are highly regulated, they must
already be financially viable to operate the plant safely. Therefore, electric power reactors are not
required to submit proof of financial qualifications upon renewing the operating license. Nuclear power
reactors that are non-electric utilities and non-power reactors must always submit financial information.
Owners and operators of non-power reactors are typically private, state, federally operated nonprofit
26
I use the terms owners, operators, applicants, and licensees interchangeably. 27
10 CFR Parts 30 and 50.

12
educational institutions, or research institutions. The financial information for these types of institutions is
harder to obtain. Therefore, increased and regular scrutiny of their financials is necessary.
The NRC likewise monitors current license holders through the trade press and popular media. If
negative information exists about a license holder, the NRC reserves the right to investigate the firm’s
financials.28
The NRC provides flexible, case-by-case analysis of the financial assurance requirements
for each applicant and may provide some variances or waivers to these requirements. The mechanisms
available are specific to the type of nuclear entity: qualified nuclear entities, unqualified nuclear entities,
and all others. Qualified and unqualified nuclear entities may use any of the mechanisms discussed in
this dissertation. Those in the “others” category are limited, as they may not be as financially viable or
transparent.
2.1.2.2 Above and below surface mining. The Office of Surface Mining Reclamation and
Enforcement (OSMRE) is the regulating authority for surface and underground mining operations and
reclamation.29
To receive a permit to mine, companies must conduct mining operations according to the
permit and provide the required financial assurance for any incidents that occur during operation, closure,
and reclamation. A dilemma with financial assurance mechanisms is the lack of a long-term mechanism.
Often, events occur that are not included and accounted for at the beginning or during the course of
operations. When reclamation begins, unexpected environmental needs may arise for which the firm
lacks the financial assurance, and the firm may not have deep pockets to cover the costs from another
funding source.
As mentioned in the anecdotal evidence in Table A.1., Appendix A, one such unforeseen
environmental need with mining is the need for continual treatment of acid or toxic mine drainage (AMD).
AMD is a toxic byproduct of the mining activity. Currently, mining companies have been using
performance bonds (surety bonds, self-bonds, cash bonds, negotiable federal or state bonds, and
negotiable certificates of deposit) to cover the funds needed to complete the reclamation plan, without
considering the need for AMD treatment. When re-estimating financial assurance, often the affected
firms forfeit the bonds in lieu of reestablishing new bonds for higher amounts that the firm cannot afford.
Forfeiting bonds increases regulator scrutiny as the next step after bond forfeiture is often filing for
bankruptcy protection against all creditors—and especially the environmental liability.
2.1.2.3 Injection wells. The Director or Regional Administrator for the EPA office within the
specified state or region is responsible for regulating injection wells. The EPA classifies injection wells
based on the type of material injected into the ground and the depth of the injection. The office regulates
the investigation of actual and potential aquifers, injection procedures, and monitoring of the injected
waste.
Owners and operators of injection wells are limited to using only procedures specified by the EPA
for the injection process and must frequently monitor the wells for contamination. Prior to beginning the
process, they must demonstrate financial assurance for any possible contamination that may result
28
Federal Register, Volume 67, Number 107, June 4, 2002, p. 38427-38431.

13
during operations and for the eventual plugging and abandonment of the well. In cases where the
Underground Injection Control (UIC) program is state administered, the state may have more regulations
and mechanisms than the EPA requires. These state regulations may be more stringent as long as they
satisfy the EPA guidelines.
2.1.2.4 Municipal solid waste landfill facilities (MSWLF), hazardous waste treatment,
storage, and disposal facilities (TSDF). A state’s division of solid and hazardous waste management,
under RCRA, regulates waste disposal landfills and facilities. The term “landfill” applies to all facilities
that participate in land disposal activities. Subtitle C classification is for those that generate hazardous
waste in large quantities, such as corporations, schools, and hospitals. Subtitle D classification is for
those that generate a small quantity of hazardous waste, such as households and small businesses.30
Facilities may acquire multiple types of permits to operate. These permits, classified as standard
or special, depend upon the purpose of the facility and the degree of permission needed to perform an
activity.31
For example, facilities that store the hazardous waste may only receive a standard permit,
whereas a facility that burns waste would receive a special permit because the facility must maintain the
proper equipment to conduct such activities. The facility must provide for safety precautions related to
the changing chemical composition of the waste during burning and provide for proper disposal after the
activity is complete.
2.1.2.5 Underground storage tanks. The EPA Office of Underground Storage Tanks (OUST)
is responsible for regulating all manner of underground storage tanks, petroleum-based products, and
any hazardous material such as polychlorinated biphenyls (PCBs).32
The term “underground storage
tank” means either a lone tank or a system of tanks and associated components that are underground.
Some types of tanks are exempt from federal regulations, although some state and local
governments may include these tanks in their regulations, as the states may have more stringent
regulations than federally required. Currently, 29 states and the District of Columbia and Puerto Rico are
implementing the approved UST programs. Some tanks may only be required to meet federal regulations
in the event they become involved in a hazardous cleanup process. The UST programs provide clear
guidelines for owners as to the proper construction of the tank, the appropriate application of the tank,
maintenance, and disposal upon completion of use of the tank. The basis for financial assurance
standards for underground storage tanks is the number of tanks in the various stages of the life of the
tank.
29
30 C.F.R. Parts 700 – 800 and Federal Register, Volume 67, Number 96, May 17, 2002, p. 35070-35073. 30
ICF Consulting Group’s report entitled Analysis of Subtitle C and D Financial Tests with subsections disseminated from July 14, 1995, to December 9, 1997. 31
U.S. Department of Energy, Office of Environmental Policy and Assistance, RCRA Information Brief, DOE/EH-413/9715, September 1997, p. 1-4. 32
40 CFR 280, and may be found at http://www.access.gpo.gov/nara/cfr/cfrhtml_00/Title_40/40cfr280_00.html.

14
2.1.2.6 Transportation of hazardous materials in water bound vessels. The EPA regulates
domestic marine facilities, whereas the U.S. Coast Guard regulates domestic water bound vessels.33
The
International Convention for the Prevention of Pollution from Ships (MARPOL) Convention and
international treaties regulate foreign water bound vessels.34
According to regulations, the water
transportation industry must exercise extreme caution with the maintenance of all vessels, the fueling of
vessels, and the types of leaks or discharges from the vessels. Operators and owners of water-related
facilities and water bound vessels must apply for general permits as to the nature of their existence and
other permits pertaining to the cargo, purpose, and destination.
2.2 What is the state of financial assurance today in the United States?
2.2.1 Measuring environment liability. Environmental liabilities encompass a variety of
levels and types of liabilities. In this dissertation, I do not categorize liabilities. That is, I focus on total
liabilities as opposed to it’s the individual parts.35
When I refer to “liabilities,” I intend it to mean any
environmentally related obligation.
The difficulty in measuring environmental liabilities is undisputed in the literature. The difficulty
lies in quantifying the total cost. Because the total cost encompasses those known and unknown costs,
the estimates are, from the onset, inexact. Even the known costs—those related to site closure,
remediation, reclamation, and post-closure treatment—are inexact, as they are historical costs. However,
they are less inaccurate than the unknown costs. This inaccuracy is not due to lack of rigorous study.
The costs relate more to property damage and health-related claims. The extent of the damage is
unknown. For example, as mentioned in Appendix A, Table A.1, the mining operations in Pennsylvania
were unaware when they began mining decades earlier that a byproduct of the operation is the
production of acid mine drainage (AMD). AMD is extremely toxic and severely contaminates the land,
water, and, in turn, the people inhabiting the nearby land and using the nearby sources of water. The
total cost for this environmental liability is unknown. The only costs the state of Pennsylvania can
estimate are the costs for closure, cleanup, and maintenance of the AMD.
Often, both certain and uncertain costs must be estimated on a case-by-case basis if no set
standard or precedence is followed within an industry. These case-by-case estimations may include
scientifically based decision techniques, contingent scenario evaluation, and a variety of economic
valuation techniques.36
Hence, the literature provides a variety of estimation methods for these illusive
33
33 CFR 138, 151-158 and 40 CFR 263-265 and 279, and may be found at http://www.access.gpo.gov/nara/cfr/cfrhtml_00/Title_33/33cfr138_00.html, http://www.access.gpo.gov/nara/cfr/cfrhtml_00/Title_33/33cfr153_00.html, http://www.access.gpo.gov/nara/cfr/cfrhtml_00/Title_40/40cfr263_00.html, and http://www.access.gpo.gov/nara/cfr/cfrhtml_00/Title_40/40cfr279_00.html. 34
http://www.imo.org/Conventions/contents.asp?doc_id=678&topic_id=258. 35
For an explanation of the variety of categories, please see Valuing Potential Environmental Liabilities for Managerial Decision-Making: A Review of Available Techniques (1996), p 17. 36
For an introduction to and application of valuation techniques, please see Valuing Potential Environmental Liabilities for Managerial Decision-Making: A Review of Available Techniques (1996), p 22.

15
unknown costs; however, the techniques provide no guarantees of accuracy or consensus in the
estimates. Likewise, for the techniques themselves, there is no consensus on accuracy or acceptance by
those using them.
Academicians use market valuation models to evaluate a firm’s value. In these models, we input
proxies for the characteristics. These characteristics include whether or not a firm has an environmental
liability and accurately discloses this information [Landsman (1986); Beaver, Eger, Ryan, Wolfson (1989);
Harris and Ohlson (1987, 1990); Barth, Beaver, Stinson (1991); Barth (1991, 1994); Barth and McNichols
(1994); Nelson (1996); Barth, Beaver, and Landsman (1996); Campbell, Sefcik, and Soderstrom (2001)].
A byproduct of these characteristics is whether the information is believable by market participants [Barth
and McNichols (1994), Harris and Ohlson (1987, 1990), Campbell, Sefcik, and Soderstrom (2001)]. If a
liability is significantly greater than what the market perceived, the market will devalue the firm
accordingly. The above researchers show that honest disclosure ultimately is good for the firm.
Other methods used for measuring environmental damages are the hedonic pricing method, the
travel cost method, and the contingent valuation method. These methods attempt to estimate the use
and non-use values of the environment. The hedonic pricing method is often used to estimate the
change in value due to the presence or lack of an environmental characteristic [Hite, Chern, Hitzhusen,
and Randall (2000); Buschena, Anderson, and Leonard (2001); Ready, Berger, and Blomquist (1997);
Thayer, Murdoch, and Beron (1999)]. For example, a house’s price depends upon its location to a
landfill. Typically, regression analysis generates such prices or values.
Although the hedonic pricing method applies an existing pricing scheme within the market for
valuation purposes, the travel cost method does not. Instead, it estimates the value of items for which a
pricing scheme does not exist [Smith (1997), Fix and Loomis (1998)]. In other words, it attempts to value
the enjoyment of scenic natural areas, such as lakes, parks, beaches, and forests. Those who enjoy
these areas pay real costs for their enjoyment in the form of time, money, and opportunity cost. The
method of valuation is in the form of cost-benefit and impact analyses.
The contingent valuation method is used to estimate the value of environmental services and the
surrounding environment [Coller and Harrison (1995); Cummings, Harrison, and Rutstrom (1995);
Cummings and Harrison (1994); and Harrison and Lesley (1994)]. Of the three, this method is the most
controversial, as it does not depend on a pricing system. Instead, it depends on a measure of social
benefit or social opportunity cost that researchers extract from opinion surveys.
Selecting the most appropriate model or method is difficult, as they may be more appropriate for
some environmental hazards and not others. Likewise, the use of more than one model or method may
be appropriate for robustness sake; however, if the model or method is incomplete or computationally
expensive, then the purpose of the model or method is defeated. Although no consensus exists on which
valuation model or method is the best, these are concentrated efforts to estimate the liabilities for
accurate reporting.
2.2.2 Methods companies use to provide financial assurance for environment liabilities

16
2.2.2.1 Internal assurance versus external assurance. The financial assurance mechanisms
available are common for most potential environmental hazards. Although the potential environmental
hazards are different in nature, the outcome is the same. Regardless of the material, contamination is
contamination. The EPA requires mechanisms but allows for some deviation by allowing state and local
governments to apply rules that are more stringent and increase regulation requirements.
The mechanisms described below guarantee funds for closure, post-closure, and corrective
action costs. This means funds must be available for the closing, maintaining and monitoring after the
closing, and any potential accident that may occur during operation and after closure, including bodily
injury, property damage, or any other liability. Because many potential accidents can occur, it can be
difficult to quantify the funds necessary for assuring against all the possibilities. Likewise, it would be
difficult to afford the amount of assurance necessary for every conceivable accident. The purpose is to
guarantee the EPA will have access to the funds when necessary and that the appropriate PRP will pay.
If an owner or operator has deep pockets, it often provides internal assurance with self-
assurance mechanisms, such as self-assurance/self-insurance, trust funds, or internal bonds. Those that
do not have deep pockets or prefer third-party mechanisms select external assurance mechanisms.
Owners or operators who may have enough capital to provide self-assurance may prefer third-party
mechanisms to signal to the public their stability or to be more transparent. Usually, third-party
mechanisms require due diligence for qualification. Environmental due diligence means an applicant
must pass a regulator’s and/or creditor’s risk screening. The risk screening is a costly procedure. The
property under question is examined, and the potential and highly probable risks associated with the
property and its use, are assessed. Likewise, the applicant for the mechanism must pass an inspection
of its financials.
Most mechanisms have similarities, such as:
• cost estimates must be updated annually,
• mechanisms must be reevaluated with respect to these new cost estimates for their
appropriateness,
• adjustment of the necessary funds to reflect the new estimates must be made available,
• regulators must be informed of a change in funding and/or mechanism, and
• new mechanisms or additional funds must be in place within four months of the end of
the fiscal year.
2.2.2.2 External assurance
2.2.2.2.1 Trust funds. Two trust fund methods are available: a prepayment fund or an
external sinking fund. The prepayment method requires complete advanced funding in a trust fund,
escrow account, government fund, certificate of deposit, or government securities. Well-known organized
trust funds include the Superfund, Abandoned Mine Reclamation Fund, Leaking Underground Storage
Fund, Environmental Response Fund, and Oil Spill Liability Trust Fund. Unlike the trust funds initiated by
individual firms, federal and state industry-specific taxes fund the organized trust funds.
17
With an external sinking fund, annual payments are made until it is completely funded which must
be prior to the expiration of the permit or upon closure, whichever occurs first. Similar to the prepayment
fund, the external sinking fund may take on any of the forms listed above. According to the regulations,
the payment depends upon the current closure cost estimate minus the current value of the trust fund
divided by the number of years remaining in the pay-in period.
2.2.2.2.2 Surety methods: bonds, letter of credit, or line of credit. A surety
mechanism is one that provides a performance guarantee, meaning a firm that holds this type of
mechanism promises to close, clean up, and/or maintain the expressly named site. To satisfy regulators,
surety mechanisms:
• do not expire, unless otherwise noted in advance by the issuer of the mechanism,
• certify the surety will pay the full face value to the designated recipient upon the holder’s
default,
• remain in effect until regulators revoke the permit, and
• issued by surety companies approved under the U.S. Department of the Treasury
Circular 570 and the EPA.
Surety bonds, also called payment bonds, performance bonds, or financial guarantee bonds,
certify the surety company will provide the available funds when the owner or operator defaults on their
responsibilities. Similarly, parent corporations or other third parties may issue letters or lines of credit.
The assurance providers perform the same function as the surety company, meaning they guarantee the
availability of funds upon the mechanism holder’s default.
2.2.2.2.3 Insurance. Insurance policies are available for a variety of environmental
liabilities. The insurance policy contains provisions that guarantee funds will be available in the event a
claim arises. Like the surety mechanism, insurance policies remain in affect unless the policyholder
defaults on the premium payment or regulators verify closure of the site according to the indicated
guidelines. External and internal insurance are popular mechanisms for insuring closure costs and
insuring against liability claims. Internal insurance, or self-insurance, I discuss below.
2.2.2.3 Internal assurance
2.2.2.3.1 Statement or letter of intent. Typically, those who provide self-, parent, or
corporate guarantees, and those who are federal, state, or local government licensees use this
mechanism. The statement or letter of intent includes the guaranteeing entity’s obligation to provide the
funds when needed. It also denotes the estimated cost of closure and indicates the source of guaranteed
funds to cover the closure costs in the event the company or subsidiary defaults. This mechanism is
especially tenuous when a company is providing a self-guarantee. If the company fails, then the funds
are not available to meet the guarantee. Similarly, parent firms have been known to divest a failing
subsidiary, leaving regulators without recourse for reimbursement [Ringleb and Wiggins (1990) and
MacMinn and Brockett (1995)].

18
2.2.2.3.2 Self-, parent, or corporate guarantee. Passing one of two possible financial
test options is required for self-, parent, grandparent, sibling, or any other corporate guarantee.37
Companies that use the financial tests to provide self-guarantees (e.g., self-bonding or self-insuring)
must:
• provide a letter from a company manager, typically the chief financial officer, attesting to
the company’s compliance with environmental rules,
• provide the firm’s independently audited financial statements for the current fiscal year,
and
• verify the current fiscal financial statements pass the financial test.
The financial tests vary slightly according to the type of hazard. Below is a list of requirements for
passing the financial tests by each type of hazard:
2.2.2.3.2.1 Nuclear power reactor licenses. To provide self-guarantees for nuclear power reactor
licenses, companies must satisfy all the following requirements: Tangible net worth of at least $10 million
or at least 10 times the total current closure cost estimate for all facilities. They must also have at least
90 percent of total assets located in the United States or at least 10 times the current closure cost
estimate for all facilities. For those companies without bond ratings, the company must have a ratio of
cash flow divided by total liabilities greater than 0.15 and a ratio of total liabilities divided by net worth less
than 1.5. For those companies with bond ratings, the most current bond issue rated at A or higher by
Standard and Poor’s or Moody’s. Finally, the company must have at least one class of equity securities.
For those providing parent or other corporate guarantees, all the following must be satisfied. Two
of the following three ratios: a ratio of total liabilities to net worth less than 2.0; a ratio of the sum of net
income plus depreciation, depletion, and amortization to total liabilities greater than 0.1; and a ratio of
current assets to current liabilities greater than 1.5. The company must have net working capital at least
six times the sum of the current closure cost estimate for all facilities. Likewise, tangible net worth must
be at least $10 million and at least six times the sum of the current closure cost estimate for all facilities.
At least 90 percent of total assets located in the United States or at least six times the current closure
cost estimate for all facilities.
Otherwise, the parent or other company must satisfy the following requirements. The most
current bond issue rated at A or higher by Standard and Poor’s or Moody’s. The company must have net
working capital at least six times the sum of the current closure cost estimate for all facilities. Tangible
net worth must be at least $10 million and at least six times the sum of the current closure cost estimate
for all facilities. At least 90 percent of total assets must be located in the United States or at least six
times the current closure cost estimate for all facilities.
2.2.2.3.2.2 Nuclear non-power reactor licenses. Although examination of owners and
operators of non-power reactors is beyond the scope of this study, those entities may obtain parent or
37
A corporate parent must own at least 50 percent of the voting stock of the firm or subsidiary for which it is providing the guarantee. A corporate grandparent owns over 50 percent of a firm through a subsidiary, and a corporate sibling is a firm that shares the same corporate parent.
19
corporate guarantees that may not be from non-profit organizations. To provide parent and other
corporate guarantees for nuclear non-power reactor licenses, companies must satisfy the following
financial test:38
Two of the following three ratios: a ratio of total liabilities to net worth less than 2.0; a ratio of the
sum of net income plus depreciation, depletion, and amortization to total liabilities greater than 0.1; and a
ratio of current assets to current liabilities greater than 1.5. Net working capital must be at least six times
the sum of the current closure cost estimate for all facilities. Tangible net worth must be at least $10
million and at least six times the sum of the current closure cost estimate for all facilities. At least 90
percent of total assets located in the United States or at least six times the current closure cost estimate
for all facilities.
Otherwise, the parent or other company must satisfy the following requirements. For those
companies with bond ratings, the most current bond issue rated at BBB by Standard and Poor’s or Baa
by Moody’s. Net working capital must be at least six times the sum of the current closure cost estimate
for all facilities. Tangible net worth must be at least $10 million and at least six times the sum of the
current closure cost estimate for all facilities. At least 90 percent of total assets located in the United
States or at least six times the current closure cost estimate for all facilities.
According to the regulations, each nuclear power license applicant presents proof of financial
assurance and a decommissioning funding plan. Liability coverage estimates and cost estimates are
available in the decommissioning funding plan. These estimates depend on the type of power used; the
type of waste produced; all costs related to the servicing of the site, equipment, and waste; the number of
reactors at a site; and the number of incidents occurring at the site.39
These cost estimates determine the
amount and the type of financial protection and financial assurance required. “Financial protection” is the
terminology used by the NRC when discussing liability coverage. Financial protection is an additional
requirement beyond the financial assurance amounts and applies to liability claims and legal costs.40
In addition to the financial assurance and liability coverage requirements for owners and
operators, any non-regular activities performed at the site require liability coverage. Non-regular activities
are any activities beyond the normal activities of the site. For example, subcontractors at sites with
functioning nuclear reactors must obtain permits and carry liability coverage. Likewise, sites that use
plutonium or uranium or create fuel must carry additional coverage.
2.2.2.3.2.3 Mining licenses. Bonds were the most popular mechanism for obtaining
assurances for mining operations; however, given the multiple bond defaults, as mentioned in Appendix
A, Table A.1 and by Boyd (2001a), some states have denied mining companies the option to use the
bonding mechanism. A firm may obtain a surety or collateral bond from a third party. The firm may also
38
10 CFR 30 and 10 CFR 30. 39
NRC report NUREG - 1307, "Report on Waste Burial Charges." 10 CFR 30.35 and 10 CFR Part 50.75, and may be found at http://www.access.gpo.gov/nara/cfr/waisidx_03/10cfr30_03.html. 40
The amount of liability coverage is the base amount of liability coverage times the maximum kilowatt power level times the population factor. For more details, see 10 CFR 140.12 Section B.

20
issue a self-bond, or the firm’s parent may do so. In order for a firm to issue a self-bond or for the parent
to provide a bond, the following criteria must be satisfied:41
The firm must be in operation for at least five consecutive years. The current bond issuance
rates at least an A by Standard and Poor's or Moody’s. The firm’s tangible net worth must be at least $10
million. It may satisfy the following ratios: A ratio of total liabilities to net worth of no more than 2.5 and a
ratio of current assets to current liabilities of at least 1.2. Total assets in the United States must total at
least $20 million. The firm’s ratio of total liabilities to net worth should be no more than 2.5, and its ratio of
current assets to current liabilities of at least 1.2.
Similar to the nuclear regulations, mining companies must provide for liability coverage in
addition to financial assurance. Insurance is available to cover the required amounts of $300,000 for
each incident and annual total coverage of $500,000.42
2.2.2.3.2.4 Injection wells: Class I and II. The EPA and state DEP offices regulate five
classes of injection wells. Classes III-IV are not explicitly discussed in this section, as they are directly
related to mining operations, nuclear operations, and operations that have since been banned by the
EPA. The wells discussed in this section are specific to hazardous waste and oil and gas wells.
Applicants providing Class I hazardous waste injection well self-guarantees must satisfy the following
financial test:43
For applicants without bond ratings, two of the following ratios must be satisfied: a ratio of total
liabilities to net worth less than 2.0; a ratio of the sum of net income plus depreciation, depletion, and
amortization to total liabilities greater than 0.1; or a ratio of current assets to current liabilities greater than
1.5. The applicant must have tangible net worth must be at least $10 million and at least six times the
sum of the current closure estimate. The applicant must also have net working capital must be at least
six times the sum of the current closure estimate. At least 90 percent of total assets located in the United
States or at least six times the current closure cost estimate for all facilities.
Alternatively, the applicant may satisfy all the following criteria:
Have a current bond rating of at least BBB by Standard and Poor’s or at least Baa by Moody’s.
The applicant must have net working capital at least six times the sum of the current closure cost
estimate for all facilities. Likewise, tangible net worth must be at least $10 million and at least six times
the sum of the current closure cost estimate for all facilities. At least 90 percent of the applicant’s total
assets located in the United States or at least six times the current closure cost estimate for all facilities.
41
30CFR800.23, and may be found at http://a257.g.akamaitech.net/7/257/2422/14mar20010800/edocket.access.gpo.gov/cfr_2002/julqtr/30cfr800.23.htm. 42
30CFR800.60, and may be found at http://a257.g.akamaitech.net/7/257/2422/14mar20010800/edocket.access.gpo.gov/cfr_2002/julqtr/30cfr800.60.htm. 43
40CFR144, and may be found at http://a257.g.akamaitech.net/7/257/2422/14mar20010800/edocket.access.gpo.gov/cfr_2002/julqtr/40cfr144.63.htm.
21
Applicants providing Class II oil and gas related injection well self- or parent guarantees must
satisfy the following financial test:44
The firm has been in operation for at least five consecutive years and has at least two sites, with
one site having five functional years. The firm has a respectable history of cleanup. All of the following
ratios must be satisfied: A ratio of total liabilities to net worth less than 2.0, net income plus depreciation,
depletion, and amortization to total liabilities must be greater than 0.1, and the current ratio must be
greater than 1.5. Likewise, current liabilities to net worth must be less than 1.0, current assets minus
current liabilities to total assets must be greater than –0.10, and revenues minus expenses greater than
zero. Have tangible net worth of at least $1 million.
Alternatively, the applicant may satisfy the following criteria:
The firm has been in operation for at least five consecutive years and has at least two sites, with
one site having five functional years. The firm has a respectable history of cleanup. The most current
bond issue rated at least BBB by Standard and Poor’s or at least Baa by Moody’s. Have tangible net
worth of at least $1 million.
For injection wells, the financial assurance requirements vary as the type of injection well varies.
Whereas all classes require proof of coverage for plugging and abandonment costs, others require more
financial assurance to protect against surface, soil, and water contamination. For example, in the state of
Colorado, an owner of a Class II oil and gas injection well may obtain “blanket” coverage for $25,000 for
wells in irrigated and dry land areas. Likewise, the liability requirements differ according to the proximity
to highly populated areas. For example, in Colorado, the general liability coverage requirement is
$500,000 per occurrence for low populated areas and $1 million of coverage for highly populated areas.45
2.2.2.3.2.5 MSWLF and TSDF. Those entities providing self-, parent, or other corporate
guarantees for solid waste landfills and waste treatment, storage, and disposal facilities must satisfy the
following requirements:46
The most current bond issue rated at least BBB by Standard and Poor’s or at least Baa by
Moody’s; or one of the following two ratios: a ratio of total liabilities to net worth less than 2.0 or a ratio of
the sum of net income plus depreciation, depletion, and amortization, minus $10 million, to total liabilities
greater than 0.1. Net working capital must be at least six times the sum of the current closure cost
estimate for all facilities plus $10 million. They must have tangible net worth of at least $10 million and
greater than the sum of the current closure cost estimate plus $10 million for all facilities. At least 90
percent of total assets located in the United States or at least six times the current closure cost estimate
for all facilities.
44
http://www.epa.gov/R5water/uic/forms/ffrdooc2.pdf. 45
40CFR144.63, and may be found at http://a257.g.akamaitech.net/7/257/2422/14mar20010800/edocket.access.gpo.gov/cfr_2002/julqtr/40cfr144.63.htm.Colorado’s requirements are at http://oil-gas.State.co.us/RR%20Asps/700-ser.htm. 46
40CFR258.74, and may be found at http://a257.g.akamaitech.net/7/257/2422/14mar20010800/edocket.access.gpo.gov/cfr_2002/julqtr/40cfr258.74.htm.

22
Local government standards vary slightly, as do standards for landfills that manage toxic waste
and are on the Superfund list. For MSWLFs and TSDFs, liability coverage varies for the type of accident
that may occur on the site. Accident types are dependent upon their longevity. For those accidents that
are spontaneous, the minimum liability coverage requirement is $1 million per event with a $3 million total
for all events. Accidents that occur over the long run, such as leaks that cause contamination and health
issues, the minimum liability coverage is $3 million per event with a $6 million total for all events. The
states do allow for the accumulation of types of liability. This allowance in no way diminishes the
responsibility of the PRP.
2.2.2.3.2.6 Underground storage tanks. Those entities providing self-, parent, or other
corporate guarantees for underground storage tanks must satisfy the following requirements:
The entities must have tangible net worth of at least $10 million and at least 10 times the total of
all costs related to the sum of the underground storage tanks. Likewise, they must have at least a rating
of 4A or 5A from Dun and Bradstreet. In addition, the entities must receive an unqualified opinion from an
independent auditor.
Alternatively, the following criteria may be satisfied:
Have proof of the required liability coverage. The applicant must receive an unqualified opinion
from an independent auditor. These financial assurance requirements may appear slim compared to the
other hazards. However, the underground storage tanks are also included in the assurance requirements
for MSWLF and TSDF. The requirements vary depending on the number of tanks and net worth. Many
classifications of the types and number of tanks exist, thus giving the owners and operators the flexibility
to either increase or decrease the numbers of tanks on the site based on the affordability of carrying
them. Coverage can range from $500,000 to as much as $2 million.
2.2.2.3.2.7 Transportation of hazardous materials in water bound vessels. Vessels
transporting hazardous materials across bodies of water are responsible under OPA and CERCLA.47
The following assurance is required based upon the vessel type and tonnage: The vessel operator must
have working capital at least equal to the total carrying estimates. Net worth should be at least 10 times
the total carrying estimates. Total assets must be in the U.S. and are greater than global liabilities.
Further, certain requirements exist as to the number of guarantors for this industry: No more than four
insurers may simultaneously provide insurance for the vessel or provide a financial warranty. No more
than ten sureties may simultaneously provide a surety bond.
OPA and CERCLA each dictate liability coverage requirements. Under OPA, liability coverage
for water traveling vessels spans $500,000 to $10 million, depending on the tank status (non-tank versus
tank) and tonnage, or $600 to $1,200 per gross ton, depending on the tank status. Under CERCLA, the
liability coverage spans $500,000 to $5 million, depending on the type of material carried, or $300 per
gross ton.
Multiple insurers for an aquatic vessel are acceptable if coverage is vertical as opposed to
horizontal. Horizontal coverage implies layering coverage for the liability, meaning insurers share some
47
33 CFR 138, 33 CFR Part 154, and Federal Register, Volume 61, March 7, 1996, p. 9274.

23
portions. This form is not appropriate, as the overlapping portion is often the cause of litigation as each
insurer argues its portion is the lesser. Vertical coverage implies dividing liabilities by percentage or by
type between insurers, according to each insurer’s ability and willingness to cover the liability. Because
potentially responsible parties may be subject to joint and several liability, this means that the insurers are
likewise subject. They may either be responsible for their agreed upon percentages or for the entire
liability.
2.2.2.3.3 Multiple mechanisms for multiple facilities. Using a combination of certain
allowable mechanisms enables owners and operators to guarantee all necessary funds. If an owner
operates more than one site, the mechanism(s) must cover the sum of needed funds for all the sites.
Mechanisms are not transferable or usable for multiple sites. The following examples are acceptable
combinations of mechanisms:
• Have a surety mechanism (bond or letter of credit) with a trust fund or payment
guarantee.
• Have a single trust fund with any other mechanism.
• Have multiple trust funds.
Self- and parent guarantees are individual mechanisms. The may not be combined together or with any
other mechanism or combination of mechanisms. Parent companies combine the financial statements of
all subsidiaries with their own financial statements. Therefore referencing the same financial information
repeatedly, resulting in an overestimation of viability.
2.3 Reasonableness and Adequacy of Current Requirements
Often it is difficult for the EPA to hold polluters responsible and force internalizing environmental
costs because firms ultimately have the option to abandon the site and attempt to have the liability
discharged in bankruptcy court. If the EPA’s requirements are too difficult to meet and maintain, then the
EPA runs the risk of the polluter abandoning its responsibility and passing the financial burden and
contamination on to the government, which in turn passes these costs on to the public. The EPA has
struggled since inception to maintain the delicate balance of imposing strict regulations with provisions
flexible enough to keep the polluter from completely abandoning its responsibility. These flexible
provisions are evident in the above-mentioned financial assurance mechanisms, the credit
enhancements, and the economic enforcement models from which the EPA’s standards were developed.
In each of these areas, the EPA provides means for a potentially responsible party to pay at least some
portion of its responsibility if it cannot fund the entire cost. In light of the bankruptcy law versus
environmental law debate, the EPA cannot afford to take an all-or-nothing stance. The EPA must
consider and accept something-instead-of-nothing. It is preferable to have a potentially responsible party
voluntarily contribute than risk the bankruptcy court discharging the entire liability.

24
Furthermore, the EPA is open to revising regulations when the current standards are in need of
revision.48
The high assurance requirements provide a barrier to entry for new firms with potentially
hazardous processes. However, the EPA’s purpose is not to punish those firms that are already in
existence but to help them take responsibility for their actions. The assurance requirements must be
harsh enough to deter yet flexible enough to keep the polluting party active in the process.
To facilitate the implementation of the EPA's initiatives and to help responsible parties to take as
much responsibility as possible, the EPA provides a variety of methods. The EPA takes great effort to
understand and consider its federal needs and the needs of the businesses and surrounding
communities. The EPA attempts to find a balance between all participating parties for the overall welfare
of everyone involved. Most of the concerns of the businesses and surrounding communities are financial
in nature. The ability of a firm to pay a liability depends upon the size of the firm and the availability of the
necessary resources by both the firm and the state. The EPA attempts to provide compromises for such
situations without reducing the need for compliance.
Larger businesses often have deeper pockets than smaller ones and thus are more likely to meet
the EPA’s criteria without hardship. Smaller businesses often have difficulty meeting the EPA’s criteria
and are often in need of additional guarantees for fulfillment of environmental obligations. Other credit
enhancements available are grants and guaranteed loans, bond banks, state revolving funds, bond pools,
interest rate subsidies, senior and subordinate debt structuring, cross-collateralization, small business
administration surety bond programs, and tax incentive programs. Although these credit enhancements
may be somewhat restrictive and have limitations, they provide opportunities for compliance when small
businesses could not otherwise meet the minimum requirements.
Several sources are available for small businesses to acquire credit enhancements thus enabling
small businesses to meet the financial assurance requirements through external parties. These external
parties provide the necessary financial assistance the smaller firms need. For example, the following
programs aid small businesses by finding or providing financial assistance: the Environmental Finance
Program, the Office of Small Business Ombudsman, and the National Small Business Financial
Assistance Workgroup.49
48
In 1996, the EPA commissioned an intensive study performed by the ICF Corporation to analyze the financial tests for Subtitles C and D specifically for TSDFs and MSWLFs 49
Furthermore, the EPA issues many environmental program grants, loans, and other incentives to states as incentives for the states to implement the EPA’s initiatives and programs. Although federal law requires these states to comply with environmental laws, often the states may not have the funds, personnel, or sites necessary to implement the programs on their own. Thus, the EPA provides grants, can require state contributions, or provide for reimbursement to states after implementing the EPA’s initiatives [Environmental Program Grants: State, Interstate, and Local Agencies. The Federal Register, Volume 66, Number 6, January 9, 2001, p. 1725-1748.] Examples of such grants and loans are the Pollution Prevention Program, the Partnership Program, and. the Department of Housing and Urban Development (HUD). In particular, HUD provides community redevelopment loans specifically designed to have lower interest rates than regular loans for the redevelopment of brownfields. Tax incentive programs offer a variety of tax credits, specific to the state of residence, for pollution reduction. These tax credits can be in the form of reduced property or sales taxes, which are helpful to current and future corporate residents.

25
Given the dynamic state of the market, testing the reasonableness and the adequacy of the EPA
requirements is necessary. For example, with the current changes in accounting standards, it is
necessary to examine if the effectiveness of tests still holds and if any changes exist in the types and
quantity of firms experiencing financial difficulty. Therefore, the EPA standards warrant revisiting. Given
hindsight, researchers can say what “should have been” instituted to maximize the internalization of the
negative externalities by responsible parties. Many companies in hazardous lines of business existed
prior to certain EPA regulations. The EPA implemented regulations that may no longer be adequate
given the current market. Likewise, the EPA does not have complete foresight to determine future
regulations. However, with changing accounting regulations requiring greater transparency, perhaps we
can see how the current requirements are holding up in the midst of the changing scenery.
2.4 Problems and Issues.
Liability measurement and compliance enforcement are the foremost problems. Liability
measurement is dynamic because every conceivable potential hazard and claim is unknown. Because
we have no definitive form of estimation, how can we determine if the polluter can bear the financial
responsibility? Estimation, compliance, and monitoring can be costly, time consuming, and difficult.
Coupled with the inconsistent rulings from judges because of the unresolved ambiguity between
bankruptcy law and environmental law, polluters often emerge free from responsibility. The tendency for
judges to rule pro-bankruptcy externalizes the liabilities to the taxpayers. The tide is slowly changing in
favor of environmental accountability.
Several studies on liability rules and assurance mechanisms provide evidence that complete
compliance may never be achieved, regardless of the implementation of environmental laws and
attempts to force compliance [Boyd (1993, 2001a, 2001b), Shavell (1982, 1984), Gerard (2000), Ferreira
and Suslick (2001), Larson (1996), Menell (1991)]. These studies show that individual risk and shared
risk remain with the use of financial assurance mechanisms. Specifically, with insurance and bonds, the
amounts are not adequate to fund the liability claims. Instead, the firms are finding it more cost effective
to relax their level of caution, thus allowing claims against the policy, and to forfeit the bonds instead of
providing funds for the entire liability. Several of the studies mentioned above observe that the
mechanisms are devoid of controls for moral hazard and the likelihood of default.
Contrary to these studies, others find insurance as an adequate, low-cost mechanism for
enforcing compliance, as those that benefit most from using the legal system are the lawyers [Freeman
and Kunreuther (1996), Heyes (1998), Katzman (1988)]. Furthermore, states have a greater chance of
recovering the costs under the use of insurance as opposed to the law. Because the liability is joint and
several, the states may receive cost recovery from a variety of insurance providers without the extra legal
transaction costs. However, this is assuming the insurers pay the claims without objection. Freeman and
Kunreuther (1996) compare studies conducted by the RAND Institute for Civil Justice in 1983, 1991, and
1993. They report the money available for cleanup after investigation, litigation, and other transaction
costs is greater for those with insurance policies than those without insurance policies. In all the years,

26
they consistently find that for those that lack insurance policies, the money paid for environmental costs is
40 percent of the award money. For those with insurance policies, approximately 70 to 80 percent of the
funds are available for environmental costs. The differential amount is due the plaintiffs and their
attorneys.
Research shows that to date, the laws and mechanisms cannot force the polluter to pay, some
researchers propose the use of a capital market mechanism to aid in compliance [Van ‘T Veld (1997),
Segerson (1997)]. Van ‘T Veld (1997) provides an innovative theory for the “judgment proof problem.”
The judgment proof problem coincides with bankruptcy as it implies firms cannot be held liable for
environmental liabilities greater than a firm’s net worth, and under bankruptcy protection, these liabilities
can be discharged. Given this protection, a firm is unlikely to exercise caution and risk reduction for
environmental liabilities while conducting its line of business. Van ‘T Veld suggests firms be subjected to
market mechanisms in conjunction with the financial assurance mechanisms to improve their exercise of
caution. The purpose of a market mechanism is to increase scrutiny by both regulators and the market,
thus increasing transparency. This mechanism should likewise increase the firm’s caution level and
compliance. Some market mechanisms include a limit on firm size and requiring customers of the
environmentally laden firms to share in the liability.
Similarly, Segerson (1997) focuses on an extension of the latter mechanism with respect to real
estate. Because real estate is a commodity, the contamination present in the land is a factor in its current
and future value. If the land is highly contaminated, then the land will not sell, or the new owner will
assume the environmental responsibility that comes with the land. However, a drawback of market
mechanism is that it only applies to those that function regularly in the market. This means that the one
time participant is less likely to comply whereas the repeat participant will want to comply with market
mechanisms. It appears that a combination of both market and financial assurance mechanisms are
necessary in order to accommodate all types of market participants.
Delving further into the legal debate, the research [Riering (1992), Hill (1998), Boyd (2001a)]
addresses the inconsistencies between legal judgments concerning bankruptcy law and environmental
law. The research provides an explanation as to the purpose behind the rulings, taking into consideration
each law and illustrating the inconsistencies with anecdotal evidence.50
The core of the discussion is the
lack of legislator foresight to consider the intersection of the two laws. Because congressional intent is
unclear, the courts must interpret it for each lawsuit. Based on the precedent of bankruptcy law as
recorded in Article I of the U.S. Constitution, many judges rule accordingly. However, environmental
laws, as a recent development, have evolved because of environmental disasters and an increased
awareness for a safe, clean environment.
50
In the case of Penn Terra Limited v. Department of Environmental Resources, Commonwealth of Pennsylvania, 733 F.2d 267 (3d. Cir. 1984), the court ruled pro-environmental law. In the case of Ohio v. Kovacs, 717 F.2d 984 (6th. Cir. 1983), the court ruled pro-bankruptcy law. In the case of The United States v. Whiz co, Inc., 841 F.2d 147 (6th. Cir. 1988), the court compromised but the ruling can be interpreted as more pro-bankruptcy law than pro-environmental law. In the case of the United States v. LTV Corporation (In re Chateaugay), 944 F.2d 997 (2d. Cir. 1991), the court ruled with a compromise that appears to more equitable between the two laws.

27
The Bankruptcy Reform Act (BRA) of 1979 enables corporations in distress to reorganize as
opposed to liquidate. The BRA directly competes with RCRA and CERCLA. Whereas the BRA provides
distressed firms with a strategic business decision to protect cash flows and reorganize, RCRA and
CERCLA attempt to lay claim to these cash flows for the liabilities the firms are attempting to discharge
[Depree and Jude (1995)].51
Congress attempted to ease this conflict by further specifying environmental
debts that were not dischargeable debts. However, given various interpretations, some environmental
obligations are not included as non-dischargeable debts. The key is in the classification of the liability. If
the liability is a non-monetary judgment, then the environmental claims are not dischargeable. It then
comes under the jurisdiction of “police and regulatory” powers. However, if the environmental liability is a
monetary judgment, then the claim is dischargeable and protection provided under the U.S. bankruptcy
code.52
Thus, polluters can avoid incurring environmental liability costs, regardless of the cause of
bankruptcy. Recovery of funds is difficult, especially when parent firms can spin off their liability-laden
subsidiary or the subsidiary can transfer assets back to the parent prior to filing for bankruptcy [Ringleb
and Wiggins (1990), MacMinn and Brockett (1995)]. Because court rulings are not consistent towards
one law over the other, it may be in a firm’s best interest to file for bankruptcy protection if a high
probability exists that the judge will rule in favor of the precedence set by bankruptcy law.
A characteristic that follows the firms involved in environmentally related areas or those firms that
have a history of environmental claims against them is risk overhang. Gron and Winton (2001) describe
risk overhang as the risk that remains with a firm that influences future business. Whereas their study
focuses on the financial services industry (non-life insurance companies) and the “credit crunches”
spanning the mid to late 1980s and into the early 1990s, the same holds true for firms involved with
environmental liabilities, both those providing insurance and those needing insurance. Relating their
discussion to firms that incur environmental liabilities, the firms experiencing environmental liabilities may
experience a decline in reputation and a decline in future business opportunities, depending upon the
liability. For example, when the Exxon Valdez accident occurred, Exxon Corporation reacted immediately
to the incident and instituted cleanup efforts in less than 24 hours. However, Pennsylvania DEP was not
that fortunate when LTV Steel abandoned several mines, leaving the acid mine drainage to the state.
Because this liability lingers for both the underwriter and for the firm committing the liability, minimizing
risk overhang is a priority.
Complete compliance may appear hopeless in this imperfect world; nevertheless, improved
compliance is the focus. If the EPA must accept some rather than none from responsible parties, then
researchers should attempt to study incremental steps for improving compliance. If future compliance
improves, regardless if the mechanism is market or non-market based, then the burden borne by
taxpayers is reduced and environmental costs are mitigated, hence the purpose of this dissertation.
51
Liquidation and reorganization, the supporting under-wire framework of the BRA, lifts and separates the firms from the sagging weight of environmental debts. The bankruptcy law acts as securing straps, maintaining the firm in its current upright position in the midst of legal jostling. It buffers the firm by providing padding against claimants and in turn allows environmental obligations to become dischargeable claims.

28
Not until the laws are more concrete, determination of responsibility is more transparent,
enforcement is faster and easier, and responsible parties are accountable, can the EPA adequately fulfill
its intentions. In the meantime, increased monitoring of the responsible parties is necessary, along with
regular review of the standards ensuring compliance. Hence, the goal of this study is to look at the
standards because they are often lost in the more glamorous debates of the legal and liability issues.
52
11 U.S.C. § 362 (a).

29
CHAPTER 3 ANALYSIS OF CURRENT FINANCIAL ASSURANCE GUIDELINES
The purpose of financial tests is two-fold: First, they offer assurance to the public that funds may
be available to satisfy a firm’s financial obligation to mitigate damage to the environment from business
activities. Second, they provide businesses with an affordable mechanism to fulfill the assurances
required by law.
The natural concern that follows is what happens when firms are no longer able to pass the
financial test criteria. Because the financial tests do not guarantee the assured funds, do the financial
tests provide the state regulatory agencies with early enough detection of a firm’s waning viability to
obtain an alternate financial assurance mechanism? Are these financial tests adequate to ensure most
companies will be able to satisfy their potential obligations? Anecdotal evidence, as described in Table
A.1., suggests the financial tests may not be sufficient to protect the interests of the public.53
In this
chapter, I examine the financial tests and assess their effectiveness in identifying companies that
eventually go bankrupt.
3.1 Review of the EPA’s Standards
The EPA uses a variety of detection methods and enforcement models to analyze a firm’s
financial situation and other issues that may influence compliance and enforcement. These various
methods and models are often used together to provide the EPA with a more comprehensive view of a
firm. The ultimate goal in using these methods and models is to protect the environment, taxpayers, and
good corporate citizens. Because examination of the EPA’s compliance and enforcement models is
beyond the scope of this dissertation, I choose to focus on EPA’s financial tests. These financial tests
provide financial requirements and guidance for permit acquisition and renewal.54
Any firm wanting to obtain or update a current working permit from a state’s environmental
regulatory agency may subject itself to the EPA’s financial tests. These tests require a firm to meet and
maintain a minimum level of financial viability to acquire the needed permits.
53
For example, the State of Pennsylvania no longer accepts performance bonds for assurance from the mining industry in light of the multiple mining forfeitures. Likewise, the State of Florida is currently restructuring the financial tests given the abandonment of phosphogypsum stacks by Mulberry Phosphates. 54
In 1982, the EPA implemented the financial standards and recorded them in 40 CFR 264.143.

30
A firm may use either financial test #1 or financial test #2, provided the firm meets the necessary
criteria for that test [40 CFR 264.143]. The requirements for financial tests are stringent because the firm
providing the guarantee is not required to have additional backers or monitors other than the
corresponding regulatory agency. The financial tests are as follows:55
Financial Test #1
o Two of the following three ratios: a ratio of total liabilities to net worth less than 2.0; a ratio of
the sum of net income plus depreciation, depletion, and amortization to total liabilities greater
than 0.1; and a ratio of current assets to current liabilities greater than 1.5.
o Have tangible net worth of at least $10 million.
o Have tangible net worth and net working capital each at least six times the current closure
cost estimate for all facilities.
o At least 90 percent of the total assets located in the U.S. or at least six times the current
closure cost estimate for the total of all facilities.
Financial Test #2
o Have tangible net worth of at least $10 million.
o Have tangible net worth of at least six times the current closure cost estimate for all facilities.
o At least 90 percent of the total assets located in the U.S. or at least six times the current
closure cost estimate for the total of all facilities.
o Have a current rating of at least BBB by Standard and Poor’s or at least Baa by Moody’s.
The EPA uses the above requirements as a benchmark for determining passing and failing firms.
If a firm meets all the criteria for either of the two tests, then it passes the test. If it fails any one of the
criteria, then it fails the test and must obtain an alternate form of financial assurance in the form of a third
party mechanism. What the EPA does not have is a set benchmark for the number of passing and failing
firms. Clearly, to maximize environmental and taxpayer safety, the optimal situation would be for all
financially viable firms to pass the tests and for all firms that lack financial viability to fail the tests early on
so they may obtain an alternate financial assurance mechanism. However, this situation does not always
happen. For firms with waning approaching bankruptcy, early detection is not necessarily financially
beneficial for them, and they may attempt to prolong detection. For example, early detection of a good
corporate citizen may cause this firm to seek alternate financial mechanisms it may not be able to afford
due to the increase in default risk. Likewise, the third party providing this alternate mechanism may be
reluctant to do so [Eanes and Price (2000)]. Early detection of a bad corporate citizen may cause this
firm to abandon the liability sooner rather than later [Melcer (2003)].
55
Some hazards require a minimum operation requirement in order to apply internal assurance standards. For example, a mining applicant must be operational for at least five years. The applicant can be a separate entity or in the form of a joint venture and must have fixed assets in the United States worth at least $20 million, have a ratio of total liabilities to net worth of no more than 2.5, and have a ratio of current assets to current liabilities of at least 1.2.

31
The EPA commissioned consultants to perform analyses to assess the adequacy of the financial
tests in detecting default.56
The EPA determined the financial tests offer an acceptable balance between
providing an affordable financial assurance mechanism and adequately screening financial viability.
According to the EPA’s assessment, the financial tests provide tolerable assurance at “low public and
private costs."57
In the analysis, the total risk for default and non-recovery by any bankrupt firm,
regardless of net worth or industry, is only 2.274 percent of the entire bankrupt group. This number
implies the failure and misclassification risk of a bankrupt firm completely defaulting on its environmental
obligation is very small. The EPA assumes they are able to receive some cost recovery from the
offending firm.
Consultants conducted the above analyses in 1981 and 1987 and only for landfills and disposal
treatment facilities. The assumptions for the 1987 analysis were an improvement over the assumptions
for the 1981 analysis in that the 1987 analysis applied conservative assumptions about default and
bankruptcy rates to admittedly incomplete data. Based upon admittedly incomplete data, the EPA
concluded few firms approach default, and these firms may still obtain alternative assurance
mechanisms. Presumably, the restitution of some funds is available from firms that survive bankruptcy.
The EPA concludes the financial tests continue to provide adequate financial assurance with little default
risk. This means the EPA applies a potentially outdated conclusion based upon incomplete data, a small
sample from one hazard, and assumes a fund restitution rate of at least 20 percent to the current
situation, without regard for the ever-present option to abandon.
One interpretation of the EPA’s benchmark is that it provides a test that does not hinder viable
companies but requires firms approaching bankruptcy to find more binding alternative financial assurance
mechanisms. In other words, the financial tests attempt to maximize productivity and social benefit and
to minimize the social costs of default. The EPA does not give specific measurements of what constitutes
an unacceptable level of default. Instead, the EPA relies on the guidance provided by the financial test
criteria, prior studies, and the annual analyses of the financial statements by regulators. If a firm passes
the tests, it receives its permit; if the firm fails, it fails to receive its permit.
In recent years, the conclusions from the 1987 appear to conflict with anecdotal evidence and the
ever-present option to abandon. The EPA’s analysis is almost 17 years old and it may be beneficial to
conduct a study using current default rates and more complete firm data and with other hazards. The
analysis should likewise consider a firm’s option to abandon the environmental liability. Because the
option to abandon is a viable choice for a firm, there is no clear-cut way to control or account for this in
my analysis. Abandonment is an ever-present option and the financial tests do not to assess the
probability of exercising this option. However, financial analysts can value future cash flows by applying
probabilities to those cash flows based on the potential state of the economy many years in the future.
56
Subtitle C and D Corporate Financial Test Issue Paper: Performance of the financial test as a predictor of bankruptcy, April 30, 1996. ICF Consulting Group performed the analyses for the EPA. ICF’s report entitled Analysis of Subtitle C and D Financial Tests has multiple sections disseminated from July 14, 1995, to December 9, 1997.

32
Similarly, the option to abandon may be valued as a real option. A firm may always attempt to exercise
its option to abandon. However, it is up to the determination of the court if the option is exercisable in the
form of discharging the liability.
In Table A.1., I provide a brief list of firms that have attempted to exercise the option to abandon.
For these firms, the benefits of abandoning the liability outweighed the costs of obtaining an alternate
financial assurance mechanism. If a firm uses the financial tests to assure the closure costs and related
liabilities and then chooses to file for bankruptcy, then the only recourse the EPA has is to petition that
the debts related to the costs of closure and any other related environmental liability not be
dischargeable. If the firm was required to use another more binding financial assurance mechanism,
such as a trust fund or a bond, then the EPA has means to reclaim the necessary funds. The EPA’s
financial tests are mere promises that a firm will pay the necessary funds when needed. They
demonstrate this by producing financial statements that meet the existing criteria. Therefore, I perform
my analyses under the same assumptions the EPA applies: the responsible party will pay all or at least
some of the environmental obligations.
3.1.1 Variations in standards provided by states. The types of programs available to states
are compliance and incentive-based programs.58
The environmental compliance programs directly
implement the federal regulations at the state level and are mandatory.59
The state incentive-based
programs are voluntary and provide incentives for participating in environmental conservation programs.60
Compliance programs can vary from state to state, and states may impose regulations that are tighter
than what is federally required. In general, however, states are updating their statutes as needed to be
more in line with the EPA’s regulations.61
An interesting facet to the compliance programs is a variance. A variance is a temporary
allowable deviation from the current standards. Usually, the standards are relaxed so a company can
rebound from the issue that caused them to fail the existing criteria in the first place. Companies
requesting variances must apply and provide proof that their need for the temporary relaxation is, indeed,
temporary. The variances cloud the true results of the financial tests because firms may apply for short-
term relaxation to the standards.
57
Subtitle C and D Corporate Financial Test Issue Paper: Performance of the financial test as a predictor of bankruptcy, April 30, 1996. 58
A list of programs is available at http://www.epa.gov/epahome/programs.htm and http://www.epa.gov/epahome/hi-voluntary.htm. 59
Programs based on the environmental laws are at http://www.epa.gov/epahome/laws.htm. For example, the Resource Conservation and Recovery Act of 1976 guides the handling of hazardous waste in every state. 60
Examples of voluntary incentive-based programs are the Green Power Partnership, the WasteWi$e Program, and recycling. 61
Some states may lag considerably in updating and applying new EPA regulations due to the scale of implementation [Lowrance (1992)]. More focus on states taking over the responsibility of day-to-day management of environmental issues, as is evident in the Regulatory Innovations Agreement signed by the EPA and the Environmental Council of the states.
61 Most states are consistent or approaching
consistency with the EPA’s guidelines. Few states are more restrictive in their regulations.

33
Environmental variances complicate the financial test issue. Firms request variances when they
need temporary easements in the current standards. These temporary easements can be justified if the
firm is truly experiencing a temporary downturn or is in a cyclical industry. Other granted easements are
the direct result of political influence and pressure [Eisler (2004), Wright (2004), Walton (2004), Weiss
and Art (1997)]. An area for future research is to find concrete objectives and clear benchmarks to make
absolute comparisons. In my analysis, I cannot account for any variances, as they are numerous and
span the major hazards. Comparing the methods, I can only gauge which method better fits the EPA’s
goal of maximizing productivity and social benefit and minimizing social costs due to default.
3.2 Methods for Determining Viability and Bankruptcy Prediction
3.2.1 Bankruptcy prediction and financial assurance. Although the purpose of this
dissertation is to examine the classification ability, I examine bankruptcy models because those are the
basis of most of the EPA’s methods. Many of the bankruptcy prediction models focus on the prediction of
a firm filing for bankruptcy within a specified timeframe, usually two to five years. Within this window of
opportunity, a firm may rebound or liquidate. These models use financial information to gauge a firm’s
financial viability and to determine the probability a firm may become defunct within the window. These
bankruptcy models foreshadow those who may become unable to fulfill their financial assurance
obligation.62
3.2.2 Going concern. To use the financial tests, a firm is required to have financial
statements audited by an independent auditor. The auditor must provide an opinion better than “adverse”
[40 CFR 264.143 (f) (3) i-iii]. In the next section, I review the importance of the auditor opinion and the
going concern status as related to financial assurance. An auditor opinion is important because it
assures investors and creditors that the financial statements are prepared according to generally
accepted accounting principles (GAAP) and that the statements provide a fair presentation of the firm’s
status [Stice, Stice, and Skousen (2002), page 12]. The auditor opinion is a gauge of a firm’s current
condition, as well as an indicator of its immediate future. Therefore, the opinion helps regulators and
investors determine the overall viability of the firm.
An auditor opinion can range from unqualified, unqualified with clarification, qualified, no opinion,
or adverse. Opinions considered good opinions are unqualified and unqualified with clarification. They
indicate the financial statements are prepared properly and the disclosure of material information.
Occasionally, the auditor may provide further explanation. Qualified opinions signify the presence of an
inconsistency in the disclosure materials. A lack of an opinion implies the firm may no longer be a going
concern, meaning the firm may not be financially viable for the next fiscal year. An adverse opinion
specifies the financial statements were not prepared according to GAAP.
62
Often used interchangeably, the terms “financial distress” and “bankruptcy” are in fact two distinct states of firm health. Financial distress refers to a firm that owes more than the income it generates, and it must seek short-term solutions to its inability to pay its obligations. Bankruptcy refers to a firm that has formally filed for bankruptcy protection under the law.
34
Receiving an adverse opinion or no opinion is a red flag for regulators, as this means the auditor
cannot confirm the appropriateness or consistency of the financial statements and that the firm may
cease as a going concern [40 CFR 264.143 (f) (8)]. Upon the first receipt of this type of an opinion, the
state agency investigates an operator’s viability and may require other forms of financial assurance. The
goal is to act quickly to obtain alternate assurance from the responsible party before the firm defaults
because firms often file for bankruptcy soon after receiving such an opinion [Jones (1996), Tan (2002),
Geiger and Raghunandan (2002)]. Often, firms in approaching bankruptcy do not submit their financials
or produce alternate financial assurance to the auditor or the state environmental regulatory agency in a
timely fashion [Deegan and Rankin (1999)].
Financial statements drive auditor opinions because the auditor is basing the opinion on the
presented financial statements. The auditor opinion should be redundant. However, according to prior
research [McKeown, Mutchler, and Hopwood (1991); Jones (1996); Tan (2002); Geiger and
Raghunandan (2002); Deegan and Rankin (1999); Carcello, Hermanson, and Huss (1995); Weil (2001)],
this is not always the case. Therefore, comparing financial statements and auditor opinions should
provide reasons why the two might coincide or diverge. The auditor opinion offers a quick point of
reference for regulators as they determine if further scrutiny is necessary. However, if regulators rely
solely on the auditor opinion prior to further investigation, they may miss potential problems.
3.2.3 Definitions of bankruptcy and financial distress. The foundation of the financial
assurance standards rests upon a firm’s financial viability. Therefore, the definition of “health” determines
the strength of the foundation. If the criteria for soundness are too lenient and financial standards too
easily met, then the ultimate goal of the standards (i.e., assuring the necessary funds when needed)
becomes irrelevant. Likewise, if the definition is too strict, then an existing firm may find it more
convenient and cost effective to exercise its option to abandon. The appropriate definition of viability can
help the financial standards in determining the financial strength of a firm and provide a more equitable
assumption of risk.
In the literature, the definition of “bankruptcy” usually means a firm has filed for bankruptcy.
However, one can define the term “financial distress” in a variety of ways. The lack of a common
definition for “financial distress” is a universal criticism in the bankruptcy prediction and financial distress
literature. Altman (1993) provides a summary of the different terms used for “financial distress” and its
many interpretations.63
For the purpose of this dissertation, I classify the firms as either being bankrupt or
non-bankrupt. I do so because the definition of bankruptcy is clear. Either a firm is bankrupt or it is not.
3.2.4 Methods of bankruptcy prediction
63
Altman’s terms are as follows: economic failure, business failure, technical insolvency, bankrupt insolvency, technical default, legal default, bankruptcy, and legal bankruptcy. Economic failure may refer to any of the following: It may indicate the cost of capital exceeds the average return on investment, a deficit in current investments and such prospects, or the revenues generated do not meet costs. Business failure indicates inadequate business conditions. Technical insolvency is the firm’s inability to fulfill immediate responsibilities. Bankrupt insolvency indicates a firm has a negative net worth. Technical or legal default is the act of defaulting on a creditor. Formal default is the act of defaulting that
35
3.2.4.1 Multivariate analysis: Z-Score, multiple discriminant analysis (MDA). Bankruptcy
prediction had humble univariate beginnings.64
Its extension into the multivariate analysis using multiple
financial criteria simultaneously is extremely useful because it provides a multidimensional picture of firm
viability. Using only one ratio at a time for analysis provides a one-dimensional view and does not fully
explain a firm’s health. Altman (1968) expands Beaver’s work using multiple discriminant analysis (MDA)
to develop the Z-Score model to estimate a firm’s probability of bankruptcy. As the Z-Score increases,
the probability of bankruptcy decreases.
According to Altman (1968, 1993), his Z-Score model has an overall prediction accuracy in the
year prior to bankruptcy of approximately 95 percent. This statistic means correct classification occurs for
95 percent of all firms, based on their true health in the year prior to insolvency. When investigating the
type of firm, bankrupt and non-bankrupt firms independently, Altman (1968) says his model is 97 percent
accurate for non-bankrupt firms and 94 percent accurate for bankrupt firms. These statistics mean non-
bankrupt firms are correctly classified 97 percent of the time and that bankrupt firms are correctly
classified 94 percent of the time (in the year prior to bankruptcy). Type I error (misclassifying a bankrupt
firm as non-bankrupt) is 6% and type II error (misclassifying a non-bankrupt firm as bankrupt).is 3%.
The predictive accuracy of the model weakens as the number of years prior to bankruptcy
increases. Altman’s model is more accurate than Beaver’s analysis for one and two years prior to
bankruptcy, but Beaver’s model is more consistent for a longer period. Beaver’s model has 80 percent
accuracy for five years prior to bankruptcy, as opposed to Altman’s five-year model that has 36 percent
accuracy [Altman (1993)]. Other researchers expand Altman’s work by applying his Z-Score model to
various industries, spanning varying intervals of time, comparing his model with others, and applying it to
international companies and industries [Bhargava, Dubelaar, and Scott (1997), Taffler (1982)].
A few variations of the original Altman model exist, including the Altman’s Z-Score for private
firms, ZETA analysis, applications to specific industries, and applications to specific countries. For all the
variables, it is more desirable for a firm to have high ratios to drive the Z-Score higher. The original
Altman model is as follows [Altman (1968), p. 594.]:
Z = 0.012X1 + 0.014X2 + 0.033X3 + 0.0006X4 + 0.999X5,
where
leads to bankruptcy. Chapter 11 bankruptcy is corporate reorganization. Chapter 7 bankruptcy is liquidation. 64
Univariate ratio analysis using accounting data conveys information about a firm’s financial health. Because the technique involves examining one factor at a time, its applicability is relevant to the improvement of the individual criteria of the financial standards. Similarly, it is useful to examine several financial measures in conjunction with each other in the prediction of distress. Wilcox (1971) contends no theoretical basis exists to explain the use of some accounting variables over others. The most significant ratios out of the multitude tested have become the benchmarks used in current research [Beaver (1966), Wilcox (1971), Altman (1968), Ohlson (1980), and Zmijewski (1984)]. This empirical research is the basis for theoretical development that has increased in complexity since its inception [Wilcox (1971)]. Prior to the development of the theory, the data and the results drove the hypotheses, as opposed to the hypotheses driving the data analysis, as is often the case in new areas of research [Scott (1981), Sheppard (1994)].

36
Z = the Z-Score firm health indicator,
X1 = net working capital/total assets,
X2 = retained earnings/total assets,
X3 = earnings before interest and taxes/total assets,
X4 = market value of equity/book value of liabilities, and
X5 = sales/total assets.
X1 is a measure of firm liquidity. Firms in distress generally have liquidity problems. Net working
capital is defined as current assets minus current liabilities. The liquidity issue arises when the current
liabilities begin to outweigh the current assets. When divided by a firm’s total assets, the measure
provides a percentage of the firm’s total assets that are liquid. A higher ratio increases the overall Z-
Score and indicates a healthier firm.
X2 is a measure of the reinvested earnings in a firm. The greater the reinvested earnings, the
more profits the firm has at its disposal. When divided by total assets, the ratio provides the percentage
of accumulated earnings reinvested in the firm with respect to the firm’s total assets. X3 is a measure of
how effective a firm’s operations and the use of its assets. In other words, it is a relative measure of the
percentage of operating income with respect to the firm’s assets.
X4 is the reciprocal of the debt to equity ratio. It measures the market’s value of the equity of the
firm as a percentage of the firm’s liabilities. This measure reflects the ability of the firm’s assets to
manage the firm’s debts, meaning if the ratio is greater than or equal to one, then enough assets exist to
at least meet or exceed the debts. If the ratio is less than one, then the debts exceed the assets. X5 is a
measure of the capacity of a firm’s assets to create sales over a specific period. This measure illustrates
the amount of goods and services sold with respect to the firm’s assets. Altman classifies firms with Z-
Scores below 1.81 as bankrupt, between 1.81 and 2.67 as inconclusive, and above 2.67 as healthy.
The Z-Score model for private firms, adapted from Altman’s original model, replaces the market
value of equity in the fourth variable with net worth. Thus, X4 is the measure of net worth to total liabilities.
The model is:
Z’=0.717X1 + 0.847X2 + 3.107X3 + 0.420X4 + 0.998X5.
Altman classifies firms with Z-Scores less than 1.23 as bankrupt, between 1.23 and 2.90 as inconclusive,
and above 2.90 as healthy. Type I error is approximately 9 percent, and type II error is approximately 3
percent. In comparing the two Altman Z-Score models, private firms have a wider area of
inconclusiveness, but the error rates of the two models are similar.65
Several researchers find the original Altman Z-Score model lacks predictability because the
model needs updating [Grice and Ingram (2001); Begley, Ming, and Watts (1996); Boritz, Kennedy, and
Sun (2003); Russ, Peffley, and Greenfield (2004)]. Researchers cite many reasons for the loss of
65
Altman’s ZETA analysis is an updated model based on market changes since the prior models. The ZETA model addresses some of the criticisms from the past. The ZETA includes firm size, recent data over a longer time span, firms from other industries, and adjustments for changes in financial reporting standards. The ZETA has classification accuracy of 90 percent within one year of bankruptcy and

37
predictability, such as the lack of the model’s coefficients to capture the current market and its dynamic
qualities. Other reasons include the small sample size only representing firms within the manufacturing
industry limits the applicability of the model and the generalizability of the results.
Altman also assumed the firms in the sample had equal prior probabilities for bankruptcy.
Assuming equality biases the results. Equal probabilities are not necessarily representative of the
percent of business failures. Equal probabilities tend to understate type I errors because it assigns
bankrupt firms with lower probabilities of failure when they may actually be higher. Likewise, type II
errors may be overstated because higher probabilities of failure given to non-bankrupt firms when they
might actually be lower
3.2.5 Summary of bankruptcy prediction models. Distress and bankruptcy prediction
models are numerous and increasingly sophisticated. However, they cannot necessarily tell us which
firm will go bankrupt. They can give identifying characteristics. Although just because a characteristic
warns of impending distress, does not mean bankruptcy will occur, because not all distressed firms go
bankrupt. For example, if a firm can manage its gloomy characteristics, then deterioration may slow or
stop. The key is to use the warning characteristics to increase regulator scrutiny to avoid the potential
abandonment of environmental obligations.
Morris (1998) suggests these models do not convey more information than what the market
already knows, implying an underlying assumption of all the models is that all information is accurate and
fully disclosed. However, given recent disclosure scandals, the inputs into the model are not completely
accurate, resulting in the model yielding incorrect results [The Ohio Law Letter, October 2002, see also
Chapter 1 footnote 12]. The difficulty level for applying these models varies, and the most cost-effective
method is to use the simplest model that gives the most accurate predictability percentages. For the
purpose of this dissertation, I apply the simplest models with the most accurate historical percentages:
Altman’s Z-Score Model for private firms and Altman’s Z-Score Model for publicly traded firms. I compare
them with the EPA’s financial tests to determine if the current EPA financial tests are as good as the
Altman benchmarks.
3.3 Data
I select a sample of publicly traded U.S. companies from Standard and Poor’s Compustat
Primary, Secondary, and Tertiary; Annual Full Coverage; and Research Files for the fiscal years 1985-
1999. I exclude foreign firms, the financial services industry, and subsidiaries. I also remove firms whose
reason for delisting is not available. I exclude financial firms because their financial ratios are very
different from those of firms in other industries and because they are not as likely to incur the same
magnitude of environmental liabilities as other industries.66
I remove subsidiaries to avoid double
accuracy of 70 percent within five years. The ZETA model is beyond the scope of this dissertation, as certain components of the model are proprietary. 66
I am not considering financial firms that underwrite environmental liabilities as that examination is beyond the scope of this dissertation. Instead, I consider environmental liabilities directly related to closure costs and all liabilities related to pre- and post-closure. Every firm has environmental liabilities,
38
counting financial information because the parent corporation’s information includes the subsidiary’s
information. I also remove firms that do not have the magnitude of environmental liabilities that would
require them to obtain financial assurance. For example, I remove service firms that provide legal and
administrative services but I retain those firms that provide environmentally related services. I remove
firms in their start up years. Those observations downwardly bias the non-bankrupt data because of high
start up costs.
I summarize the initial sample in Figure 3.1. I classify firms as bankrupt and non-bankrupt from
1985-1999. If the firm files for bankruptcy or is in liquidation or reorganization, then it is included in the
bankrupt sub-sample. A company is bankrupt in the year it files for Chapter 11 or Chapter 7, and the firm
must have at least two years of prior data to be included in the sample. I use the data for the fiscal year
prior to bankruptcy for detection purposes.
The non-bankrupt sub-sample includes all firms that have at least two years worth of data and
are not bankrupt. The non-bankrupt sub-sample also includes the healthy years from the firms that
eventually go bankrupt. The healthy years from the bankrupt firms are the years at least three fiscal
years prior to bankruptcy. I illustrate with the following examples:
o If a firm files for bankruptcy in 1998 and its fiscal year end is after May, then the firm’s 1997
data is included in the bankrupt group because financial information for the year prior to
bankruptcy occurs in 1997. I delete the 1996 data and any data after 1997. If the firm
existed in any year prior to 1996, then those years are included in the non-bankrupt group.
o If a firm goes bankrupt in 1998 and its fiscal year end is prior to May, then the firm’s 1996
data is included in my bankrupt group because the financial information for the bankrupt year
is actually from 1997, based upon the end of the fiscal year. Therefore, the year prior to
bankruptcy is 1996. I delete the data for 1995 and any data after 1996. If the firm existed in
any year prior to 1995, then those years are included in the non-bankrupt group.
After applying all the indicated filters to the bankrupt sub-sample, I find 499 bankrupt firms from
1985 to 1999.67
There are 34,921 non-bankrupt firm/years for 4,749 firms after applying the necessary
filters. The entire sample consists of 4,749 firms with 35,420 firm/years.
I subdivide the sample by the North American Industrial Classification System (NAICS). The
NAICS code is a six-digit code that identifies company activity, sub-sector, and industry information.
but some are more urgent and dangerous than others. For example, firms in the financial services industry do not necessarily have closure costs similar to firms within the mining and manufacturing industries (gas and oil companies are included in these two industries). However, they still have environmental liabilities in the form of landfill usage, wastewater treatment, and computer and other equipment disposal, etc. Because the nature of the financial services industry is not to operate in an environmentally hazardous line of business, firms within this industry do not necessarily need to assure against closure costs and certain environmental liabilities. However, they are still liable for their use of environmental resources. 67
A firm/year is the number of years a firm exists and has valid data. For example, if one firm exists for 20 years and another firm for four years, then the sample contains two firms with 24 firm/years.

39
However, for the purpose of this study, I use the two-digit NAICS code.68
I report the classification by
industry for bankrupt and non-bankrupt firm/years in Figure 3.3. Industries I am particularly interested in
are the mining, construction, and manufacturing industries. These three industries account for almost 50
percent of the total number of bankrupt firm/years. The utilities industry has a low occurrence of bankrupt
firm/years. This result is not surprising, as the industry is highly regulated.
The focus of the analysis is on the EPA’s financial tests. I evaluate the ability of the tests to
classify the firm/years within their specific groups and with respect to the entire sample. Additionally, I
compare alternate methods ability to classify bankrupt firm/years. The alternative methods include bond
ratings, auditor opinion, and Altman’s Z-score model for publicly traded and privately held companies.
3.4 Methodology
I evaluate each method’s ability to classify a firm’s financial status given their actual group status.
For each method, I apply the method-specific financial criteria and classify the non-bankrupt and bankrupt
observations accordingly. The methods for defining a firm’s viability include the Grice and Ingram (2001)
definition of health, auditor opinion, bond ratings, and Altman’s Z-Score models for publicly traded and
privately held firms.69
I treat the classification percentages from the EPA’s financial tests as the base
case with which I compare all other results. I use annual financial data for a firm’s fiscal year to
determine the firm’s health status. For the bankrupt group, I use the financial data in the fiscal year prior
to bankruptcy.
For classification purposes, I set up my two-by-two contingency tables such that type I error is
classification of a bankrupt firm/years as passing the method (being classified as non-bankrupt) and type
II error is classification of non-bankrupt firm/years as failing the method (being classified as bankrupt).
Type I error is the most critical in the case of environmental obligations because allowing a company to
do business when it cannot meet its financial obligations has environmental, health, and public cost
consequences. Type II error implies good corporate citizens will need to use a financial assurance
mechanism other than the financial tests. This error means that for the sake of caution, a healthy firm
that is misclassified is required to obtain another mechanism at additional expense. The added expense
may be an unfair penalty the healthy firm bears. Type I and II errors relate to the social and business
costs of conducting environmentally related business.
Because type I error and type II error are group specific, I also consider classification errors with
respect to the entire sample. This provides some insight to what regulators face when conducting annual
reviews of firms. For example, when a regulator conducts her review, I assume she has no prior
knowledge of a firm’s financial status. Then after the review, the regulator forms an opinion of a firm’s
68
I consolidate the NAICS codes for wholesale trade (NAICS code 42) and retail trade (NAICS codes 44-45) into the group trade. 69
Grice and Ingram (2001) define healthy firms as those that have stock ratings of B or better or investment-grade bond ratings. Likewise, they define financially distressed firms as those whose stock ratings are below B, whose bonds do not have investment-grade ratings, or who have filed for bankruptcy. As long as the firms have at least one type of rating, I apply the definition.

40
financial status based upon the information the firm submits. Her classification of firms is with respect to
the entire sample as opposed to the individual groups.
Along with examining the classification, I test the following hypothesis:
Ho: There is no association between the method and the non-bankrupt and bankrupt groups. In
other words, the method and the groups are independent.
Ha: There is an association between the method and the groups, meaning that the method and
the groups are not independent.
The association in the hypotheses refers to whether the method and the groups are independent
or dependent. If the method is independent from the groups, then there is no link or tendency for the
classification of the groups. A link implies the method and the groups have an association or a there
exists a tendency of the method to classify the groups in a particular manner. The methods are financial
health indicators and the groups are the eventual outcome. Thus, the association or link is between the
health indicator and an observations eventual outcome.
With respect to this study, the null hypothesis implies that the EPA’s financial tests do not have a
tendency to classify firm/years in any particular manner. Thus, there is just as much chance to classify
firms as passing or failing regardless of the group. Whereas, the alternative hypothesis implies a
systematic tendency of the EPA’s financial tests to classify groups differently. Investigation of the
contingency table tells how the method tends to classify the groups differently.
From the EPA’s perspective, it is more important to mitigate social costs over business costs.
From the business perspective, it is important to mitigate business costs. I test the null on an overall,
annual, and industry basis. By overall sample, I mean the entire sample as a whole, without regard to
year or industry. I examine the classification patterns for the annual and industry classifications.
Whereas my focus is on the performance of the financial tests, I also use other common methods
(definition of distress, auditor opinion, bond ratings, and bankruptcy prediction models) so I can compare
the classification ability of the EPA’s methods with these other methods.
My sample contains two independent categories—bankrupt firm/years and non-bankrupt
firm/years. I classify the sample by each of the methods. This classification yields a two-by-two
contingency table in which the columns represent the actual health of a firm (bankrupt or non-bankrupt)
and the rows represent the outcome of the method (pass or fail). In the contingency table, I provide a
tally of the observations that occur for each category. For the overall sample, I use the Chi-square
statistic from the Chi-square test of association. The Chi-square statistic tests the difference between the
estimated observations expected in each cell with the actual observations observed in each cell. This
means that the statistic compares the non-bankrupt firm/years expected to pass the EPA’s financial tests
with those that actually do pass. If there is a significant difference between the actual and the expected,
then the Chi-square is statistically significant. For example, if the EPA’s financial tests classify more non-
bankrupt observations as passing than what actually passes, then there is a tendency for the EPA’s
financial tests to pass the non-bankrupt group. Likewise, if the EPA’s financial tests classify fewer non-

41
bankrupt observations as passing than what actually passes, then there is a tendency for the EPA’s
financial tests to fail the non-bankrupt group.
For the sample by year and industry, I use the two Fisher exact p-value from the Fisher exact test
when appropriate. The Chi-square test and the Fisher exact test have the same interpretation. I use the
Fisher exact test in lieu of the Chi-square test when one or more of my contingency squares contain an
expected frequency of less than five observations because this violates the Chi-square required minimum
of five.
In the section to follow, I discuss the within group and overall classification rates. I use logistic
regressions as a robustness check for the likelihood of classifying bankrupt firm/years. From the logistic
analysis, I assess the fit of the regression, the significance of the method, and its odds ratio. In assessing
the fit of the regression, I examine the significance of the likelihood ratio. I use the p-value from the Chi-
square statistic generated by the logistic regression. This p-value determines the ability of the
independent variable (method) to classify a firm as being bankrupt. Finally, I discuss the odds ratio for
each method.
3.5 Results
I report the classification accuracy for the methods for the sample from 1985-1999, for the
sample by year, and for the sample by industry. Classification accuracy entails the percent of firm/years
classified correctly and incorrectly within each group for each method and with respect to the entire
sample. When I refer to the entire sample, I consider the classification of each observation regardless of
its group.
Classification accuracy is an important issue given the cost of misclassification. For example, in
classifying a non-bankrupt firm as failing the financial tests, the firm bears the cost of finding alternate
financial assurance. Misclassifying firms, which are quickly approaching insolvency, incurs potential
social costs. Costs of this type of misclassification can be significant given the totality of the responsibility
for the entire environmental liability. This situation is assuming the cost of misclassification is not
symmetric. If the costs are symmetric, the cost of misclassifying a non-bankrupt firm as failing is the
same as misclassifying a bankrupt firm as passing. In view of the anecdotal evidence, specifically the
mining industry in Pennsylvania, the cost of misclassification is asymmetric with the misclassification of
bankrupt firms outweighing the misclassification of non-bankrupt firms. This is especially the case if a
bankrupt firm liquidates as opposed to reorganizing. If a firm reorganizes, the EPA has another
opportunity to recover some of the funds for cleanup and closure. Otherwise, the entire burden is on the
state and the taxpayers to supply the necessary funds.
3.5.1 EPA standards: Financial tests #1 and #2. I classify bankrupt and non-bankrupt
firm/years by pass/fail rates for the financial tests. I report the criteria for the financial tests in Table 3.2
Panel A. Applying the financial tests, I use the required capital structure ratio, profitability ratio, liquidity
ratio, and measures of credit worthiness. All these measures are readily available except estimates of
closure cost. Because closure costs are not available, I use one percent of net plant, property, and

42
equipment (PP&E) as the estimate for closure costs. I chose net PP&E because it is available on
Compustat, and it represents the cost to the company for the external structures directly related to
operation and production. This measure characterizes the assets used in the creation of the potential
environmental liability.
In the next chapter, I investigate varying levels of closure costs from one percent to ten percent of
net PP&E. The net PP&E measure is quantitatively less than the EPA’s rule of thumb for assurance for
closure costs, which is at least a multiple of six times tangible net worth, working capital, and total
assets.70
The reason I select a measure smaller than what the EPA might require is for two reasons: The
first is the lack of availability of actual closure costs and the firm’s estimation method. Second, not all
firms have prohibitive closure costs, so it is unfair to apply an extreme proxy.71
Financial test #1 is an inexpensive financial assurance mechanism that is available to all firms. If
a firm cannot meet the financial criteria in financial test #1, then the firm may use financial test #2,
provided the firm has rated bonds that satisfy the minimum rating. I apply the EPA’s financial tests to the
overall sample. In Table 3.3 Panel A, I report the classification rates for the EPA’s financial tests from
1985-1999. Within the individual groups, non-bankrupt and bankrupt, the method classifies the bankrupt
firm/years more accurately than non-bankrupt years. Type I error indicates about 8 percent of the
bankrupt firm/years pass EPA financial tests, and type II error indicates almost 38 percent of the non-
bankrupt firm/years fail the EPA financial tests. Thus, 39 of the 499 bankrupt firm/years passed the
financial tests and 13,266 of the 34,921 non-bankrupt firm/years failed the financial tests. The p-value for
the Chi-square statistic is highly significant indicating that we must reject the null hypothesis that the EPA
test outcome and the actual status of firm health are independent. In other words, there is an association
between the EPA test results and the financial status of the firm.
The misclassified bankrupt firm/years comprise only about one-tenth of one percent of the entire
sample. If costs of misclassification were symmetric, then it would appear as if non-bankrupt firms
receive the brunt of the tests as the tests misclassify far more non-bankrupt firms than bankrupt firms.
The non-bankrupt firms bear additional financial burden because they must allocate additional resources
to obtain alternate financial assurance. Bankrupt firms appear to be few and if costs are symmetric, then
the cost is less than the cost to the non-bankrupt firms. The misclassification with respect to the entire
sample is approximately 38 percent.
I assume that the costs of misclassification are not symmetric. I base my assumption on several
factors. These factors include the costs of the environmental obligation, the financial tests lack of
guarantee for the obligation, and the risk of transferring the obligation to the public. The known and
70
Other states use a multiplier different from what is federally required. For some examples, see Table 3.1. 71
The Securities and Exchange Commission (SEC) does not specify a benchmark of when a liability, or in this case closure costs, becomes material. Instead, the SEC cautions against using any “rule of thumb.” The SEC requires reporting all liabilities that could potentially affect an investor’s perception of the status of the firm. Goodwin Proctor Law Advisory entitled Disclosure of potential environmental liabilities in the wake of Sarbanes-Oxley, November 2002, page 3. 17 CFR Part 211, Release Number SAB 99.
43
unknown costs associated with an environmental obligation can compound quickly and firms may not
have the necessary resources to fulfill a growing obligation [Table A.1]. The financial tests do not provide
secured funds for the obligation and this absence of security leaves the taxpayer exposed to the potential
risk of bearing the financial burden. Thus, my assumption of asymmetric costs is justified.
One could suggest the EPA’s financial tests would have better classification results if they
classified all firms as healthy; then, the only firms misclassified would be the few that were truly
unhealthy. Technically, that is what is taking place. I subject the firms to the financial tests regardless of
actual health. Then, I show in the contingency tables exactly how the financial tests performed compared
to the actual health, but the knowledge of a firm’s actual fate does not influence the financial test
classification. The purpose of the tests is to assess if a firm is financially capable of handling its
environmental obligations before they happen. Thus, firms using these tests are healthy until they prove
themselves otherwise, meaning they are healthy until they fail the financial tests or provide another
financial assurance mechanism. The EPA’s financial tests are one of several mechanisms firms can use
to provide this assurance. From the EPA’s perspective, it is more important the financial test criteria be
able to classify unhealthy firms.
On an annual basis, the classification accuracy improves through time as shown in Table 3.3
Panel B [and Figure 3.3]. The majority of all bankrupt firm/years fail the financial tests and a
preponderance of non-bankrupt firm/years fail the financial tests. This result implies that most firms
subject to the EPA’s standards are providing third-party financial assurance mechanisms. Statistical
significance exists for all years indicating the consistent existence of an association between the method
and its ability to classify the groups. I list classification rates for the EPA’s financial tests, by industry in
Table 3.4 [and Figure 3.4]. The classification rates illustrate a similar pattern as the annual classification
rates. For all industries, few firms may use the financial tests to assure closure costs. Therefore, most
firms must use third-party mechanisms.
3.5.2 Grice and Ingram (2001) and bond ratings. In this section, I examine investment
ratings. I apply Grice and Ingram’s (2001) definition of “financial distress.” They define non-distressed
firms as those that have stock ratings of B or above or investment-grade bond ratings.72
Financially
distressed firms consist of those with stock ratings below B, or bond ratings below BBB, or firms that have
filed for bankruptcy. Because not all firms have stock or bond ratings, the sample reduces to 20,627
firm/years with 20,555 non-bankrupt firm/years and 72 bankrupt firm/years.
I also examine bond ratings as the sole criteria for financial viability. Bond ratings should
coincide with the Grice and Ingram definition and the EPA’s financial tests, as the bond rating itself is the
main criteria for the EPA’s financial test #2. My motivation for examining investment ratings is to
investigate their usefulness and potential applicability within the EPA standards. The EPA already makes
use of bond ratings in its financial test #2; perhaps stock ratings might prove useful as well.
72
Compustat may not report stock ratings on firms that are new to the database or are highly volatile. Absence of stock ratings does affect the sample size because the observation must contain a stock rating or a bond rating.

44
I illustrate the overall classification rates from 1985-1999, in Table 3.5 Panel A and the annual
rates in Panel B. The type I error is 1.36 percent, and type II error is almost 61 percent. The low type I
error is due to the one bankrupt observation is incorrectly classified by the Grice and Ingram definition.
However, this method correctly classifies only about 38 percent of the non-bankrupt firm/years. The
statistically significant Chi-square statistic (p<0.0001) indicates an association exists between the Grice
and Ingram definition and the non-bankrupt and bankrupt groups.
When I consider the entire sample, the misclassified bankrupt firm/years constitute one-
hundredth of a percent of the entire sample. The misclassified non-bankrupt firm/years comprise almost
65 percent. The classification rate remains consistent on an annual basis. In the latter years of the
sample, the Fisher exact p-values indicate the existence of an association between method and the
groups. The Grice and Ingram method classifies more firm/years as distressed. This misclassification of
bankrupt firm/years implies lower social costs but the preponderance of misclassified non-bankrupt
firm/years implies higher business costs.
The Grice and Ingram method considers another aspect of firm viability (i.e., stock ratings) that
the EPA’s financial tests do not. The Grice and Ingram method misclassifies bankrupt firms at a lower
rate than the EPA’s financial tests. One could argue the EPA should incorporate stock ratings into the
financial tests for firm health consideration. The EPA considers bond ratings for those firms that have
them, so why not stock ratings as well? The inclusion of stock ratings may save the firms the additional
cost of acquiring a third-party mechanism while subjecting the firm to market scrutiny.
I find the Grice and Ingram method to have high classification accuracy for bankrupt firm/years
for each industry. I report the classification rates in Table 3.6. In all industries except the utilities
industry, I find it tends to classify bankrupt firm/years better than non-bankrupt firm/years. The utilities
industry is the only industry that has a high correct classification of non-bankrupt firm/years. This is not
surprising as the utilities industry is highly monitored and regulated. Based on these findings, the use of
both stock and bond ratings provides a fuller sense of financial health, where the use of bond ratings
alone does not (see the EPA’s financial tests and below).
The bond ratings used are the Standard and Poor’s (S&P) domestic long-term issuer credit
ratings as reported by Compustat. These ratings represent a firm’s ability to service debt obligation
longer than one year. A determinant of future health is long-term bond ratings. They are appropriate
because environmental liabilities are long-term obligations. The better able a firm is to maintain a long-
term obligation, meaning it meets the scheduled debt obligation payments, the better the perceived ability
to fulfill an environmental obligation. However, the extrapolation that long-term bond ratings assure a
company will fulfill any long-term environmental obligation is premature. Extrapolation over too long of a
period is inappropriate, considering business cycles, competition, and the potential magnitude of an
environmental liability. There is no guarantee the firm’s health will remain constant even through the life
of the bond, as is evident with the frequency in which credit rating agencies revise ratings on existing
bond issues. All the debt rating says is that at this time, the firm is able to service its long-term debt; it
does not guarantee a firm can afford an environmental liability of a significant magnitude if it arises.

45
Examining bond ratings by themselves is helpful because it is a component of the EPA’s financial
tests. I make the same argument for auditor opinion. Another reason for investigating bond ratings is
that they are also an alternative financial assurance mechanism. Firms financially able to obtain a bond
may obtain an alternative form of assurance if necessary. However, just because a firm can obtain a
bond does not mean it will if the benefit of default outweighs the cost of shouldering an environmental
cleanup.73
In using this method, I exclude firm/years that lack bond ratings. The sample for this method
contains 6,210 firm/years. The motivation behind examining the bond rating and comparing it to the
definition of health by Grice and Ingram (2001) and the EPA’s financial tests is that perhaps only the bond
rating is necessary. If this is the case, then the other criteria for financial test #2 may be redundant.
I classify firm/years as healthy if they have bond ratings in line with EPA standards—BBB and
above. Firm/years are unhealthy if they have bond ratings below BBB. The initial break down of the
bond ratings yields 181 rated as AAA, 851 rated between AA+ and AA-, 2,378 rated between A+ and A-,
2,162 rated as BBB+ to BBB-, 1,502 rated as BB+ to BB-, 1,029 rated as B+ to B-, and 107 rated CCC+
and below. Therefore, 5,572 firm/years are rated as healthy (BBB and above), and 2,638 firm/years are
rated as unhealthy (below BBB). However, I must interpret the results for the bond analysis with great
caution because there are only 11 bankrupt firm/years with bond ratings. I report the overall and annual
classification rates in Table 3.7 Panels A and B, respectively. Within the groups, the type I and II errors
are zero percent and 32 percent, respectively. The statistically significant two-sided Fisher exact p-value
(p<0.0001) indicates the existence of an association between bond ratings and firm health.
Because of the lack of bond ratings in the bankrupt firm/year group, some annual statistics
cannot be calculated and thus not reported. The sample for bond ratings is much smaller as not all firms
have bond ratings. Nevertheless, for those firms that have bonds, the method does generally classify
bankrupt firm/years as unhealthy and non-bankrupt firm/years as healthy. This result is not surprising
given the scrutiny a firm undergoes to obtain and maintain a bond. The classification accuracy for the
entire sample is approximately 68 percent.
I report the industry results in Table 3.8. Classification accuracy is variable by industry and is
similar to the annual results. Given the industries of interest, those being mining, construction, and
manufacturing, only for manufacturing is there exist an association between bond ratings and the groups.
Within manufacturing, 100 percent of the bankrupt observations and almost 70 percent of the non-
bankrupt observations are classified correctly. For construction, there are only 27 non-bankrupt
observations. I cannot calculate statistics pertaining to the overall classification but for the non-bankrupt
group, one-third of the non-bankrupt observations are correctly classified. Similarly, for the mining
industry, there is a lack of observations for bankrupt firm/years. This finding coincides with the anecdotal
evidence of states removing bonds as an option for financial assurance [Table A.1]. For the non-
bankrupt observations, almost 46 percent are classified correctly.
73
Investigation of the amount of environmental cleanup is beyond the scope of this dissertation. I mention the potential magnitude of the environmental liability is to remind the reader the firm still has the

46
3.5.3 Auditor opinion. I investigate the ability to discern a company’s health using the auditor
opinion alone because it is a component of the EPA’s financial tests. Qualified opinions may be neither
positive nor negative. Instead, qualified opinions may suggest a firm must clarify its financial position to
the auditor. Because the opinions are not transparently negative, I include qualified opinions with the
unqualified and unqualified with explanatory language opinions. I compare auditor opinion with the actual
health of the firm.
Of the 35,420 firm/years, 26,672 firm/years receive unqualified opinions, 7,684 firm/years receive
unqualified with explanatory language, 998 firm/years receive qualified opinions, 64 firm/years receive no
opinions, and only one firm/year receives an adverse opinion from 1985-1999.74
I classify unhealthy
firm/years as those with no auditor opinion or an adverse opinion. All other opinions—unqualified,
unqualified with clarification, and qualified—are healthy.
I report the overall and annual classification rates in Table 3.9 Panels A and B, respectively. For
the overall sample, the type I error is approximately 97 percent, and the type II error is less than two-
tenths of a percent. Disturbingly, but not surprisingly, this method classifies almost all firm/years,
including bankrupt firm/years, as receiving positive auditor opinions. Only 13 out of 486 of the bankrupt
firm/years are correctly classified. Based on prior research, these findings are expected [McKeown,
Mutchler, and Hopwood (1991); Jones (1996); Tan (2002); Geiger and Raghunandan (2002); Deegan
and Rankin (1999); Carcello, Hermanson, and Huss (1995); Weil (2001)].
Because the number of bankrupt firm/years is less than the number of non-bankrupt firm/years,
the non-bankrupt firm/years dominate the overall classification accuracy when the entire sample is
considered. For example, only about 1.5 percent of the total firm/years are misclassified, but as
mentioned above, almost all the bankrupt firm/years are misclassified. Thus, it appears that auditor
opinions are of little use in forecasting impending bankruptcies.
The annual classification rates remain consistent for this method - high classification accuracy for
non-bankrupt firm/years and low classification accuracy for bankrupt firm/years. Some of the two-sided
Fisher exact p-values coincide with the overall Chi-square p-value while others do not. I list the industry
classification rates in Table 3.10. Results are similar in that all industries have high classification
accuracy for non-bankrupt firm/years and low classification accuracy for bankrupt firm/years. Only for two
industries does there appear to be an association between the opinion and the firm’s status.
There are several reasons why an auditor opinion may be less dire than that conveyed by a firm’s
financials. However, it is usually the case that the auditor opinion often lags the firm’s true state.
Auditors often hesitate to issue an adverse opinion or to refrain from issuing one at all. When an auditor
issues an adverse opinion or fails to issue one, bankruptcy is often imminent. Auditors fail to issue
negative opinions for a variety of reasons. Generally, auditors are concerned with job security and fear
potential litigation. They may be overconfident of the firm’s ability to survive as they may have insider
information. They also fear contributing to the “self-fulfilling prophecy” [Grice (2000); Carcello and Neal
option to abandon, even with third-party mechanisms such as bonds.

47
(2003); Mutchler, Hopwood, and McKeown (1997); Pryor and Terza (2001); Tucker and Matsumura
(1998); Matsumura, Subramanyam, and Tucker (1997); Mutchler (1985)].
3.5.4 Altman’s Z-Score models for publicly traded and privately held firms. Although I do
not use private firms in the sample, I apply the Altman’s Z-Score models for both private and publicly
traded firms. I list them in Table 3.2 Panel B. The Altman models are well-established, recognized
benchmarks used to detect financial viability, so their inclusion is appropriate in my analyses. In addition,
although the EPA does not make use of either Altman model in the financial tests, the EPA does use the
Altman’s Z-Score Model for privately held firms for mediation and litigation. My motivation for
investigating both is to provide additional alternatives the EPA may use to strengthen its financial tests.
The privately held model provides firms with a higher threshold requirement for reaching viability
and a lower threshold requirement for insolvency. This wide range between a healthy and an unhealthy
classification, also known as the inconclusive zone, benefits firms because a Z-Score in those intervals
may not necessarily attract the attention of the EPA regulator unless other financial test results suggest
financial difficulties. If the EPA uses the Altman’s model for publicly traded firms, the inconclusive zone is
tighter, with the threshold for proving health slightly lower and the threshold for demonstrating a lack of
health being higher. A tighter inconclusive zone implies a firm will have a higher chance of falling into
one of the classification zones than with the Altman model for privately held firms. However, a
disadvantage of the Altman model for publicly traded firms is endogenous to the model. Whereas the
tighter intervals may appear to be more attractive, they may be tighter because the model design is
specific to firms that are required to meet a higher disclosure standard than a privately held firm.
Therefore, I use both models.
In applying Altman’s Z-Score models, I do so blindly, meaning I do not apply many limiting
assumptions. I do not limit my application to size or a specific industry as in Altman’s original application.
Altman restricts his sample to firms in the manufacturing industry having total assets from $1 to $25
million and his sample size contains 33 observations in each group. I apply the Altman models to all the
data in the sample that remains after removing missing data.75
My sample for the publicly traded method
contains 35,012 firm/years [34,542 non-bankrupt firm/years and 470 bankrupt firm/years]. Similarly, for
the privately held model, my sample contains 33,757 firm/years [33,414 non-bankrupt firm/years and 343
bankrupt firm/years.76
3.5.4.1 Altman’s Z-Score model for publicly traded firms. Z-Scores greater than 2.675
indicate there is a low probability of a firm going bankrupt. I treat these Z-Scores as an indication of
health. Z-Scores between 1.81 and 2.675 are inconclusive, and Z-Scores less than 1.81 indicate a firm
has a high probability of going bankrupt. I provide the Z-Score intervals in Table 3.2 Panel B.
74
Some firms receive no opinion if an auditor refuses to issue an opinion or if the firm is in the process of switching auditors. 75
The data most frequently missing, zero, or less than zero for this method is sales and market value of equity. 76
The data most frequently missing, zero, or less than zero for this method is sales and net worth as recorded by book value of equity.

48
I find healthy Z-Scores for 20,654 firm/years, inconclusive Z-Scores for 5,561 firm/years, and
unhealthy Z-Scores for 8,797 firm/years. I report the overall and the annual classification rates in Table
3.11 Panels A and B, respectively. Considering the entire sample, less than one-half percent of all
observations are misclassified bankrupt firm/years and approximately 25 percent are misclassified non-
bankrupt firm/years. Within the groups, the type I error is almost 30 percent and the type II error is almost
25 percent. The overall classification accuracy rate with this method is almost 73 percent.
In general, the Altman’s Z-Score tends to classify more non-bankrupt firm/years as healthy and
more bankrupt firms/years as unhealthy for the total sample and by year. The statistically significant Chi-
square p-value (p<0.0001) for the entire sample and the Fisher exact p-values for the samples by year
support the existence of an association between the Z-Score and the groups.
I report in Table 3.12 the industry classification rates. I find the classification accuracy of the
Altman’s Z-Score varies greatly from industry to industry. Despite the model's application to only the
manufacturing industry, there are high levels of classification accuracy for other industries. In some
industries, such as agriculture, construction, manufacturing, and transportation the percent correctly
classified for both non-bankrupt and bankrupt is greater than 60 percent. The Altman’s Z-Scores are
associated with the groups for all industries except utilities, real estate, and services.
3.5.4.2 Altman’s Z-Score model for privately held firms. I calculate the Z-Scores using the
Altman’s Z-Score model for privately held firms. Z-Scores greater than 2.90 indicate a firm has a lower
chance of becoming bankrupt in the near future. Z-Scores between 1.23 and 2.90 are inconclusive and
may indicate warning signs. Z-Scores less than 1.23 indicate a firm has a high probability of going
bankrupt in the near future. I list the Z-score intervals in Table 3.2 Panel B.
I calculate Z-Scores for 33,757 firm/years. I find non-bankrupt indicating Z-Scores for 10,901
firm/years, inconclusive Z-Scores for 15,384 firm/years, and bankrupt indicating Z-Scores for 7,472
firm/years. I report the overall and the annual classification rates in Table 3.13, panels A and B,
respectively. Within the groups, the type I error is approximately 41 percent, and the type II error is
almost 22 percent. Similar to the publicly traded method, an association exists between the privately held
method and the groups. Considering the entire sample, classification accuracy is 89 percent with less
than half of a percent of the misclassified firm/years being bankrupt firm/years.
I report the classification accuracy rates among the industries in Table 3.14. The Z-Score and
the groups are dependent for all industries except for mining, utilities, transportation, real estate, and
services. For other environmental matters related to fiduciary responsibility, the EPA makes use of the
privately held model instead of the publicly traded model. However, the EPA applies the Z-Score model
after a firm contends it cannot afford to pay for its environmental liability. Applying a prediction model
after the fact seems backwards. This application could partially explain the anecdotal evidence,
especially for firms in industries for which the method has no association.

49
3.6 Robustness check
In Table 3.15, I report the within group classification rates and their respective logistic
regressions and odds ratios. I estimate individual logistic regressions for each method and actual firm
status.77
Logistic regressions model the likelihood of a particular outcome. In this case, the logistic
models the likelihood of bankrupt observation classification by each method. The likelihood ratio, which
uses the Chi-square statistic, assesses the fit of the model. A statistically significant likelihood ratio
means the logistic regression is a better fit for the data rather than not using a model [Cody and Smith
(1997); Boehmer, Broussard, and Kallunki (2002); Allison (2001)].78
This relates to the existence of an
association between the method and the actual firm status. Similar to the contingency tables, I find that
the logistic regressions for all methods are statistically significant (p<0.0001).
Because the coefficient estimated by the logistic regression is not directly interpretable, I use it to
calculate the odds ratio. The odds ratio gives the likelihood of a bankrupt observation failing a method.
For example, for the EPA’s financial tests, the corresponding odds ratio indicates a bankrupt observation
is 19 times as likely to fail rather than pass [Cody and Smith (1997)]. To calculate the odds ratio, one
must find the ratio of the probability of classifying bankrupt observations over the probability of classifying
non-bankrupt observations. To do this, one must use the intercept and coefficient estimated by the
regression.
For example, the following logistic regression is for the EPA’s financial tests:
Y = -6.3194 + 2.9577X, where Y represents the binary firm status of non-bankrupt or bankrupt
and X is the binary indicator for passing/failing the EPA financial tests. The probability of a firm being
classified as bankrupt is PB = (e(-6.3194 + 2.9577)
/(1+ e(-6.3194 + 2.9577)
)). The probability of a firm being classified
as non-bankrupt is PNB = (e(-6.3194)
/(1+ e(-6.3194)
)). The odds ratio is the ratio of the probabilities such that
PB/PNB is about 19. The difference between the above hand calculation and the number reported in Table
3.15 is due to rounding [Cody and Smith (1997); Boehmer, Broussard, and Kallunki (2002); Allison
(2001)].79
The odds ratio for Grice and Ingram and bond rating methods indicate bankrupt observations are
more likely to fail these two methods. Their odds ratios are 45 and 48 respectively. I interpret these
results with caution because the size of the sample for Grice and Ingram and bonds are different from the
other methods. These measures are not surprising given that the samples for Grice and Ingram and
77
The models I estimate are simple linear models in the following form: Log (p / (1-p)) = α+βx where α is the intercept and β is the coefficient estimate and x is the method specific binary classification indicator. 78
There are other indicators of model fit, such as the Akaike Information Criterion and the Schwartz Criterion however, those criteria are better suited when investigating incremental adjustments to the regressions by adding one variable at a time. For the purpose of my analysis, the logistics are not incrementally changing. I estimate a logistic regression for each method. Evaluating all the methods in the same logistic regression is not appropriate because I am not investigating if a firm uses all methods simultaneously. Instead, I am investigating the use of the methods independently. 79
An alternate way to calculate the odds ratio is to use the two-by-two contingency table and calculate the following: It is the product of the ratio of failing bankrupt observations to passing bankrupt observations and the ratio of passing non-bankrupt observations to failing non-bankrupt observations.

50
bond ratings are significantly smaller than the other methods. In addition, firms that hold bonds must
meet stricter disclosure and collateral requirements. In general, firms that hold debt have to be healthy
enough to hold and to service the debt.
For auditor opinion, the odds ratio is less than one. This means a bankrupt observation is less
likely to receive a negative opinion. Of all the methods, auditor opinion is least likely to fail an
observation. The odds ratio for Altman’s Z-Score for publicly traded and privately held firms is just over
seven and five, respectively. Thus, bankrupt observations are at least five times as likely to receive a low
Z-Score with either of the Altman methods.
The pseudo R-squares provide some support for classification ability for each method but are
difficult to interpret. Because the sample size varies across methods, I can only compare the pseudo R-
squares for those methods that have similar sample size and distribution. Thus, I can only cautiously
compare the EPA’s financial tests with auditor opinion and the Altman Z-Score methods. Across the four
methods, the EPA’s financial tests have the highest pseudo R-square. I warily interpret this to indicate
that the financial tests have some classification ability. The financial tests appear to have greater
classification ability than auditor opinion and slightly better classification ability than the Altman’s Z-Score
methods. Low pseudo R-square measures suggest that classification is difficult to estimate [Allison
(2001]. In general, the robustness checks provide additional confirmation that an association exists
between the methods and the groups. Thus, the methods are able to classify the groups with some
degree of accuracy.
3.7 Summary
I provide three summary tables for the methods and their overall classification rates, Tables 3.16,
3.17, and 3.18. In Table 3.16, I report the classification rates per method. I record the frequency counts,
the percent classification within group, and percent classification with respect to the entire sample. As
before, Type I error implies an increase in potential social costs should an unhealthy firm default on its
environmental obligations. Type II error implies an added cost for the firm because it must provide proof
it is financially viable. An optimal method would be one that balances the tradeoffs with respect to total
costs.
Comparing the methods, I observe that all of the methods are able to classify the groups with
some degree of accuracy. Some methods have a tendency to classify one group better than the other
group. When considering the non-bankrupt group, the EPA’s financial tests, the Altman models, and
auditor opinion tend to classify more firm/years as passing than failing. Amongst those methods, the EPA
classifies fewer non-bankrupt firm/years as passing and more non-bankrupt firm/years as failing. This
implies that the EPA’s tests require more non-bankrupt firms to acquire an alternate form of assurance.
For the bankrupt group, the EPA’s financial tests misclassify fewer bankrupt firm/years than
auditor opinion or the Altman models. The Grice and Ingram (2001) method appears to misclassify fewer
Yet a third way to odd ratios are estimated is to take the point estimate from the regression use it as the exponent in the exponential function.

51
bankrupt firm/years than all the methods except bond ratings. I interpret these results [Grice and Ingram
and bond ratings] with caution because their sample sizes are not directly comparable with the other
methods due to the lack of bond ratings for many firms.
On an annual basis, the results are similar for all methods. The association between the method
and the group is consistent and persists annually for all methods except bond ratings and auditor opinion.
This is due to the difference in sample size and the lack of bankrupt bond data and auditor opinion for
some years. On an industry basis, the association between method and group within an industry exists
for some and not others. In Table 3.17, I report the industries and the classification rates for the methods
for which an association exists between the method and the groups.
Based on Tables 3.16, 3.17, and 3.18, I find the EPA’s financial tests have a reasonable within-
group classification accuracy rate when compared to the other methods. From the environmental
perspective, because the EPA has a type I error of almost 8 percent, there is still some room for within-
group improvement. Perhaps the EPA might consider incorporating other methods, such as stock ratings
and the Altman’s Public Z-Score as an additional screen for firms that pass the EPA rules. The financial
test’s type II error of almost 38 percent implies many firms must secure alternate forms of financial
assurance. From the business perspective, this means an additional cost to the company. Thus, firms
may need to redirect resources to fulfill the assurance requirement.
The EPA generally protects the environment and taxpayers from unhealthy firms, but it may
overly penalize healthy firms who are potentially good corporate citizens. The EPA is trying to protect the
environment against contamination but at what cost to the taxpayers? On one hand, the EPA is
attempting to minimize the potential cleanup burden on the taxpayer. On the other, if the EPA prevents a
good corporate citizen from conducting operations, then the taxpayer bears this burden as well. It seems
clear that the EPA attaches a greater cost to misclassifying an unhealthy firm than it attaches to
misclassifying a healthy firm. Nevertheless, to make a definitive statement about the nature of the
tradeoff that exists between these two types of misclassifications would necessitate estimates of the
actual costs involved in each case. To date, the EPA has not chosen to provide such estimates.

52
CHAPTER 4 TESTS OF FINANCIAL ASSURANCE EFFECTIVENESS: A SENSITIVITY ANALYSIS
4.1 Purpose for Sensitivity Analysis
In the previous chapter, I compare the ability of the EPS’s financial tests to classify bankrupt and
non-bankrupt firms with other viable alternatives. Overall, I conclude that the EPA rules appear to
perform as well or better than the other methods. In this chapter, I look at how varying the estimated
costs of closure impacts on the classification accuracy of the EPA financial tests. This sensitivity analysis
is for the EPA’s rules, as the other methods do not explicitly incorporate closure costs in the
classifications.
Closure costs encompass any liability directly related to the assets and operations. These costs
account for a possible future claim for a potential liability. This dynamic aspect of closure costs is difficult
to estimate; thus, it is open to interpretation by the firm. This is not to imply that the engineered estimate
or interpretation is not rigorous. It only means that there are uncertainties with respect to the estimate
and there is no single standard for estimating these uncertain costs. However, regardless of
interpretation and its uncertainties, the firm is obligated to cover all related costs. The magnitude of these
potential costs can be very large as discussed and illustrated in Appendix A and Table A.1. As a proxy
for the estimated costs of closure, I use a firm’s amount of net property, plant, and equipment (PP&E)
because this amount represents the tangible assets a firm uses for production purposes. This measure
represents the cost to the firm to put the assets in place that directly contribute to the creation of the
potential liability.80
These closure costs estimates only loosely proxy environmental liabilities because
such liabilities are extremely difficult to estimate. Thus, I perform a sensitivity analysis where closure
costs vary from one to ten percent of net PP&E.
If a healthy firm has a relatively low cost of closure, the firm should be able to cover this cost at
no direct expense to the state regulatory agencies or the taxpayers.
80
This dissertation does not examine the ratio of net PP&E to environmental liability because the liability is difficult to estimate.

53
If cost of closure changes, the EPA's financial tests should provide an indication when the
amount of closure costs becomes unaffordable and a firm’s health questionable. From Chapter 3, we
know the financial tests are better at classifying bankrupt firm/years as opposed to non-bankrupt
firm/years. If the increase in closure costs does not cause the firm to fail the test, then the firm may
continue operations as usual. A change in type II error rates and classification accuracy merely indicates
that state environmental regulators might consider taking a closer look at the extreme cases of the non-
bankrupt firms that fail the tests when closure costs change dramatically.
A decrease in type I error indicates more bankrupt firms are correctly classified. With higher
estimates of closure costs, firms with declining health are less likely to meet their environmental
obligations. The EPA’s financial tests should be able to classify more bankrupt firms as failing with
increasing closure costs. Intuitively, I expect to see a decrease in type I error, an in increase in type II
error, and a decrease in overall classification accuracy with the change in closure costs. Higher closure
costs for non-bankrupt firm/years implies reallocation capital. Because the tests already misclassify non-
bankrupt firms, I expect increased misclassification with rising costs.
4.2 Data
For the sensitivity analysis, I use the same sample of firm/years that I used in Chapter 3 for the
analysis of the EPA’s financial tests. Similar to the prior analysis, I examine the overall sample on an
industry basis. The focus of this analysis is on the EPA’s financial tests and the classification ability with
varying closure costs. I calculate the ten costs of closure for each observation. Costs of closure vary
from one to ten percent of a firm’s net PP&E. The EPA’s financial tests require tangible net worth, net
working capital, and total assets to be greater than six times these estimated closure costs.
4.3 Methodology
I perform classification analyses for the varying levels of closure costs. In Table 4.1, I report the
classification accuracy results for the overall sample at each level of closure costs. A firm must have
tangible net worth and/or net working capital greater than six times the closure costs, depending upon
which financial test (#1 or #2) the firm uses to pass the EPA’s closure cost requirement. All the firms
within the sample have total assets well over six times the closure costs.
Type I error is a concern for the EPA because it means that the financial tests are not detecting
some bankrupt firms. These bankrupt firms continue operations without providing a more secured form of
assurance. As a result, the state and taxpayers may incur social costs related to the firm’s potential
default. Type II error is a concern to non-bankrupt firms who may be denied permits and forced to obtain
third party assurance mechanisms. Thus, they may incur additional business costs.
I test the null hypothesis (Ho) that the EPA’s financial tests are independent of the groups. Thus,
there should be no association or tendency in classifying the groups as closure costs change. This
means that there is no difference in classification accuracy when applying the tests to the non-bankrupt
and bankrupt groups. The alternative hypothesis (Ha) is that the EPA’s financial tests are dependent

54
from the groups. In other words, there is an association or tendency in the tests classification ability with
changing closure costs.
Similar to the analysis in Chapter 3, I use the Chi-square test of association for the overall
sample and the two-sided Fisher exact p-values when necessary (for industries). The Chi-square
statistics and two-sided Fisher exact p-values indicate an association or tendency of the tests in
classifying the two groups. I reject the null hypothesis if the p-values are less than a five-percent level of
significance. In the next section, I discuss the classification rates for the financial tests for varying levels
of closure costs for the entire sample and the industries.
4.4 Results
I report the type I and II errors, classification accuracy percentages, and the Chi-square statistic
and its p-value for the sample in Table 4.1. I find type I error decreases and type II error increases as
expected. As closure costs increase from one to ten percent, the type I error decreases by roughly two
percent and type II error increases almost 20 percent. On average, the within-group classification
accuracy decreases from 77 percent (with closure costs equaling one percent) to 69 percent (with closure
costs equaling ten percent). With respect to the entire sample, the average classification accuracy
decreases from approximately 62 percent to 45 percent.
The sensitivity of the non-bankrupt group influences the decrease in overall classification
accuracy with respect to the entire sample. This is not necessarily a negative aspect of the test. It
provides clues to the financial tests’ ability to detect firms that may struggle with the increase in closure
costs. Just because a non-bankrupt firm may fail the financial tests with a higher level of closure costs
does not mean the firm will default on its environmental liability. It merely signals a problem could arise in
the future if closure costs and all other costs related to closure exceed a certain level. However, the
potentially responsible parties still have the option to abandon their liability through bankruptcy protection
if the costs become such a burden that bankruptcy is necessary.
In Table 4.2, I report my finding for the industries. The only industries for which a consistent
association exists between the EPA’s financial tests and the groups are manufacturing, trades,
transportation, and information. Agriculture, mining, and services yield an association for some lower
levels of closure costs. No association exists between the financial tests and utilities, construction, and
real estate.
Classification accuracy within the groups decreased more dramatically for the non-bankrupt
group for certain industries. For example, as closure costs increased from one to ten percent,
classification accuracy for construction, trade, information, and services fell by almost six percent. This
implies that six percent more firms, in those industries, must find an alternate form of financial assurance.
For agriculture, mining, manufacturing, and real estate, classification accuracy decreased by an average
of 14 percent. For transportation and utilities, accuracy decreased by over 20 percent.
With respect to the entire sample, the decline in overall classification accuracy is dramatic. The
industries with the greatest decline in classification accuracy are real estate, utilities, transportation, and

55
mining. On average, those industries decline by almost 38 percent. For the agriculture and services, the
declines are almost 19 and 21 percent, respectively. For construction, trades, information, and
manufacturing, the percentage decline is in the lower teens [12, 12, 13, and 14 percent respectively].
I report in Table 4.3 Panel A the mean and median financial measures for the sample and for the
sample by groups. In Panel B, I record the mean and median financial measures by industry. I include
the medians because they provide a more realistic measure because the data is highly skew. When I
compare the mean and median measures for the non-bankrupt and bankrupt groups, the statistically
significant p-values (p<0.0001) imply both the means and the medians for the groups are dissimilar to
each other.
I examine the separate components of the financial tests. I limit my discussion to financial test #1
because it contains similar financial criteria as financial test #2 and retains a fuller sample. For financial
test #1, I find the means and medians for the overall sample and the groups pass the ratio #1 (total
liabilities/net worth). This means that firms, on average, have less than twice the liabilities as net worth.
The means and medians for the non-bankrupt group pass ratio #2 (net income plus depreciation,
depletion, and amortization/total liabilities) and the bankrupt group fails. For ratio #3 (current ratio), on
average, all groups pass the liquidity requirement except the median measure for the bankrupt group.
The first component of the EPA’s financial test #1 requires firms to pass two of the three ratios. It is
possible that some bankrupt firms will pass if it meets two of the three ratio’s requirements.
Examining the second component of financial test #1, that being tangible net worth greater than
$10 million, the bankrupt group fails. For the third and fourth component (tangible net worth and net
working capital, and total assets at least six times the total current closure costs), both groups median
measures pass the requirement. Because the bankrupt group, on average, fails to have tangible net
worth greater than $10 million, it fails the EPA’s financial test #1.
I find that as closure costs increase, on average, both groups fail more components. Specifically,
the groups tend to fail the net working capital requirement. On average, firms may be able to satisfy one
of the two but not both, and the criteria require both be satisfied simultaneously. Failing the net worth
requirement also causes a firm to fail financial test #2.
I report my industry findings in Table 4.3 Panel B. I find most industry means and all industry
medians pass ratio #1. Those industries whose means fail are utilities, construction, and trade. Similar
results hold for ratio #2. For ratio #3, the median measures for mining, utilities, transportation, and real
estate fail. The component most often failed by the industries is the net working capital requirement.
Specifically, utilities, transportation, information, real estate, and services fail when closure costs are one
percent of net PP&E. Thus, these four industries, on average, have a tendency to fail the EPA’s financial
tests more frequently than the other industries.81
All industries tend to have sufficient total assets to
cover closure costs. If the closure costs exceed 10 percent, then firms that are less healthy may find it
81
The utilities industry is different from other industries with respect to passing the tests. It is a highly regulated industry and the EPA is one of many agencies with which the industry complies. These results are not surprising and should not necessarily be disturbing because of the high level of regulation in this industry.

56
difficult to meet the closure costs. These firms will need alternate sources of financial assurance or
liquidate assets if necessary to acquire a third-party mechanism or to cover a liability.
4.5. Summary
In summary, I find the EPA’s financial tests are sensitive to varying closure costs. Specifically, as
the magnitude of closure costs increases, type I errors decrease with less magnitude than type II errors
increase. This means as closure costs increase, the financial tests tend to classify a greater number of
non-bankrupt firm/years as failing and fewer bankrupt firm/years as passing. The non-bankrupt
observations may be able to afford the potential increase of the environmental obligation. However, the
financial tests tend to err on the side of environmental caution by focusing on minimizing social costs.
Thus, higher closure costs result in more of the cost burden shifting to the firms engaged in activities that
may cause damage to the environment.
Overall, almost all industries pass the first few components of the financial tests. However, they
tend to fail the working capital requirements. Failure continues with increasing closure costs. This result
means firms may not have adequate current assets after satisfying current liabilities to assure closure
costs, regardless of the proxy for closure costs. However, the firms do show they have enough total
assets to handle the closure costs. Thus, firms have enough resources although those resources may be
not be specifically allocated to cover the liabilities.
One drawback with my analysis is that I assume accurate closure costs that are revised and
timely. Whether or not this situation actually occurs is difficult to say because the liabilities themselves
are difficult to estimate, and there is no standard method for their estimation. My analysis is somewhat
one-dimensional because I am assuming closure costs are a certain percentage of a firm’s PP&E.
Despite the lack of dimensionality, firms most often fail the working capital criteria. Because the financial
tests are promises of assurance, if a company cannot fulfill these promises with its current assets, then it
must obtain outside assistance of some sort. In the next chapter, I summarize my results and propose
future research.

57
CHAPTER 5 SUMMARY AND CONCLUSION
5.1 Summary of Findings
The EPA’s financial tests provide an inexpensive internal mechanism for firms to assure the EPA
that they will fund all environmentally related costs associated with business operations and closure. To
prove financial status, a firm must meet the requirements of the financial tests. The financial criteria
within the tests measure liquidity, profitability, and the ability of a firm to handle its obligations. These
measures should reflect the firm’s financial health in a timely fashion, and regulators should be able to
interpret when a firm begins to decline.82
If a firm meets the financial requirements, it implies that the firm
has sufficient means to fund environmentally related costs from “cradle to grave.” In return, the firm
receives operating permits that allows them to begin or continue operations. With this mechanism, a firm
is not obligated to put forth any funds towards an environmental liability until a claim occurs.
82
However, this is not always the case, as firms may switch auditors prior to reporting to the EPA or may not submit the financial information to the auditor in a timely fashion [McKeown, Mutchler, and Hopwood (1991); Geiger and Ranghunandan (2001); Weil (2001)]. According to the standards, the owner or operator has 60 days to report the updated cost of closure [40 CFR 264.143 (e) (9)] and must update all financial information and submit it within 90 days of the fiscal year end [40 CFR 264.143 (f) (5)]. Further, if any indication the company needs to obtain alternative financial assurance arises, the responsible party must obtain the alternative financial assurance within 120 days of the end of the fiscal year or within 30 days of notification from the regulators that the financial tests may not be used [40 CFR 264.143 (7 & 8)].

58
If the firm fails to prove its financial viability, it must obtain another form of financial assurance the
EPA deems acceptable prior to receiving a permit. These other forms of financial assurance include trust
funds, bonds, insurance, or any other external mechanism. Because these are third party mechanisms,
there is an additional business cost related to acquiring such a mechanism. Depending upon a firm’s
risk, this mechanism can be expensive or even nonexistent. For example, the State of Pennsylvania will
no longer accept performance bonds as a means for assurance for mining operations [Table A.1]. I apply
the EPA’s financial tests to firms that may incur an environmental liability. In my sample, I have two
independent groups, those firms that are non-bankrupt and those that are one year prior to filing
bankruptcy. I use classification analysis to determine if the EPA’s financial tests are able to classify the
firms by their actual financial status. I do so to examine the EPA’s ability to detect viability prior to filing
for bankruptcy. If the financial tests do not detect a firm’s viability, then there is the possibility that a firm
may file for bankruptcy protection prior to the EPA obtaining any funds for a liability. If a firm files for
bankruptcy protection, it will attempt to have their liabilities discharged. These liabilities include
environmental obligations. Much of the anecdotal evidence suggests that firms often use bankruptcy as a
means to escape their liabilities [Table A.1, McMinn and Brockett (1995), Melcer (2003), Morse (2004),
Sissell (2004), Chang (1998, 2003), Brickley (1997), and Cieri, Ganske, and Lennox (1999)]. Costs
related to environmental liabilities can magnify quickly and discharged liabilities become the responsibility
of the state and the taxpayers.
If the financial tests accurately classify firm viability then there is a chance that the EPA may
acquire the necessary funds from a firm before a bankruptcy court discharges the liabilities. Firms that
fail the financial tests may directly pay the EPA or fund the liability through the third party mechanisms
thus, sparing the state and taxpayers from the full cost of the environmental liability. The EPA’s goal is to
mitigate social costs.
Based on my results from Chapters 3 and 4, I find that the EPA’s financial tests are able to
classify most bankrupt firm/years correctly. However, the financial tests misclassify almost 40 percent of
the non-bankrupt firms. This implies that some non-bankrupt firms may be required to provide a more
costly third party assurance mechanism. From the firm’s perspective, the additional price firms must pay
for another mechanism may be too costly relative to what the firm can afford. However, if the firm wishes
to continue business operations, then they must obtain another acceptable form of assurance. This
additional cost represents a shift in corporate resources from other areas to provide coverage for
something that was once free.
The EPA attempts to balance the tradeoffs between business and social costs. The additional
cost paid by non-bankrupt firms to obtain alternative assurance is the trade off for the financial tests
stringency in detecting unhealthy firms. When I compare the EPA’s financial tests with other methods,
some of these other methods have increased classification accuracy for either one group or the other, but
not for both. For example, the Altman methods tend to classify more non-bankrupt firm/years correctly
than the EPA’s financial tests. Similarly, the Grice and Ingram approach tends to classify more bankrupt
firm/years correctly as compared to the EPA’s financial tests. However, I cannot make a judgment as to
59
whether one method is the best as the costs of misclassification are unknown. When we know the costs,
we can better value a method’s ability to classify firm/years.
I find that the bankrupt group is not particularly sensitive to varying the costs of closure, largely
because the rules detect most bankrupt firms at the lower level of closure costs assumed originally.
However, for the non-bankrupt group, the financial tests are sensitive and appear to be a prohibitive
criterion. Because the non-bankrupt group is sensitive, this influences the overall classification accuracy.
In turn, some industries show a greater decline of classification accuracy as closure costs increase.
Assuming misclassification costs are not symmetric then the misclassification of any bankrupt firm could
result in a higher social cost than what the non-bankrupt firms pay in additional business cost [Bergman
(2004)].
For the industries of interest, the mining industry appears to be more sensitive to increases in
closure costs than both the construction and manufacturing industries. As closure costs increase from
one to ten percent, classification accuracy declines almost 30 percent for mining about 10 percent for
construction, and 13 percent for manufacturing. Given the anecdotal evidence for mining, the decline in
classification accuracy is not surprising. Mining related costs can mushroom in cost and complexity as
illustrated in Pennsylvania’s concern over acid mine drainage costs and in Florida’s perpetual
maintenance of the phosphogypsum stacks.
5.2 Conclusions
Given the EPA’s desire for social cost mitigation, I find the EPA’s tests do a good job of
classifying observations from the bankrupt group. The tests tend to misclassify almost 40 percent of the
non-bankrupt observations resulting in increased business costs for those that wish to remain
operational. To balance the cost concerns, the financial tests may benefit from incorporating components
from the other methods. Specifically, the use of an Altman’s Z-Score may help in classifying more non-
bankrupt observations correctly. This may help to balance the mitigation of social costs with the
reduction of business costs.
From the onset of this dissertation, I wished to answer the following questions:
o Are these financial tests effective in assuring that financial resources exist to fund the
cleanup of environmental accidents? That is, can these tests detect when a firm will
go bankrupt?
o Do the financial tests foster cost internalization, or does it hinder those responsible
from taking responsibility?
From my findings, I conclude that the EPA’s financial tests do generally detect when a firm is very close
to insolvency. However, the tests are not effective in assuring that financial resources exist to fund a
necessary cleanup. Detection does not imply collection. There exists a vast gap between the two
[Bergmann (2004)]. What I mean is that the EPA’s financial tests may indicate when a firm is near
insolvency, this does not imply that the state regulators will be able to secure any funding from a firm

60
unless the firm is a willing to comply.83
Research shows that in general, firms are willing to internalize the
cost for the sake of firm reputation, longevity, firm value, and riskiness [Klassen and McLaughlin (1995),
McGuire, Sundgren, and Schneeweis (1988)]. However, these financial tests do not provide an external
guarantee. When a firm fails the financial tests and subsequently provides documentation of an alternate
financial assurance mechanism does the EPA truly have a guarantee? One could interpret the EPA’s
financial tests as relying on a firm’s sense of social responsibility.
5.3 Further Research
This topic provides many avenues for future research, such as the establishment of a benchmark
for what constitutes a standard level of classification accuracy. The EPA does not have a measure to
compare classification performance. Therefore comparing the other methods against the EPA’s financial
tests is difficult. Developing means of estimating the cost of misclassification for both non-bankrupt and
bankrupt firms would facilitate comparisons across methods considerably. The individual financial test
criteria also are somewhat deficient in that they do not incorporate items such as environmental
variances, legal nuances, or political influence [Barry, Bergman, Hohmann, and Steckler, 1997].
In the last five years, the dominant focus of prediction models research has been on one type of
model—neural networks using genetic algorithms. Neural networks and genetic algorithms have been an
operational topic for some time in the fields of biology, mathematics, and computer science. Only within
the last decade have we seen financial applications [Frydman, Altman, Kao (1985); Lacher, Coats,
Sharma, and Fant (1995); Olmeda and Fernandez (1997); Shah and Murtaza, (2000); Sung, Chang, and
Lee (1999); Yang, Platt, and Platt (1999); Zhang, Hu, Patuwo, and Indro, (1999); Lee, Han, and Kwon
(1996); Jain and Nag (1997)]. Most of the research published about the use of neural networks in finance
has been by the neurocomputing, operations research, information management systems, and statistics
communities. These methods warrant investigation with respect to the financial test criteria.
With respect to changes in accounting regulations, it will be interesting to revisit this topic in the
near future. We do not yet know the full impact FAS 143 and Sarbanes-Oxley will have on environmental
liabilities [FAS 143, Alciatore, Dee, and Easton (2004)]. These new regulations require increased
transparency, thus providing regulators with more company specific information with which to make
permit granting decisions.
83
As in the case of Mulberry Phosphates, state regulators received notification twenty-four hours prior to corporate abandonment.

61
Table 2.1 Time line of the major environmental laws This information is unoriginal and is available from a variety of sources [Cross and Miller (2001), www.epa.gov]. I provide this list for the convenience to show the EPA’s evolution of legislative activity.
Law Year enacted
and/or amended
Federal Food, Drug, and Cosmetic Act 1938 Shoreline Erosion Protection Act 1965 Solid Waste Disposal Act 1965 National Environmental Policy Act 1969 The Clean Air Act 1955, 1977, 1990 The Occupational Safety Health Act 1970 Pollution Prevention Packaging Act 1970 Resource Recovery Act 1970 Lead-Based Paint Poisoning Prevention Act 1971 Coastal Zone Management Act 1972 Federal Insecticide, Fungicide, and Rodenticide Act 1947, 1972 Marine Protection, Research, and Sanctuaries Act 1972 Ocean Dumping Act 1972 Endangered Species Act 1973 The Safe Drinking Water Act 1974 Shoreline Erosion Control Demonstration Act 1974 Hazardous Materials Transportation Act 1975 The Resource Conservation and Recovery Act 1976 The Toxic Substances Control Act 1976 Federal Water Pollution Control Act or The Clean Water Act 1948, 1972, 1977 Surface Mining Control and Reclamation Act 1977 Uranium Mill-Tailings Radiation Control Act 1978 Asbestos School Hazard Detection and Control Act 1980 Comprehensive Environmental Response, Compensation, and Liability Act or Superfund
1980
Nuclear Waste Policy Act 1982 Asbestos School Hazard Abatement Act 1984 Asbestos Hazard Emergency Response Act 1986 Emergency Planning and Community Right to Know Act 1986 The Superfund Amendments and Reauthorization Act 1986 Indoor Radon Abatement Act 1988 Lead Contamination Control Act 1988 Medical Waste Tracking Act 1988 Ocean Dumping Ban Act 1988 Shore Protection Act 1988 National Environmental Education Act 1990 The Pollution Prevention Act 1990 The Oil Pollution Act 1990 The Sanitary Food Transportation Act 1990 Food Quality Protection Act 1996 Chemical Safety Information, Site Security and Fuels Regulatory Relief Act 1999

62
Table 3.1 State versus federal regulations Some state regulations differ from the federal regulations. Below is a list of states whose regulations for the hazardous and solid waste storage and treatment facilities which includes publicly and privately owned landfills and underground storage tanks varies from the federal regulations. State regulations must be as strict as the federal regulations
State Variation State regulation
Florida Tangible net worth requirement is half the federal requirement (solid waste only).
FLA 62-701.900 (5) (e)
Massachusetts
Financial tests are not available options for financial assurance mechanism as of November 2002.
310 CMR 30.900
Nevada The current ratio is absent. NAC 444.7499 Section 13
North Dakota The tangible net worth and working capital requirements are two-thirds the federal requirement.
NDAC 33-20-14
Oklahoma The current ratio is absent. OAC 252:515-27-81
Oregon The debt-to-equity ratio allows more debt and the federal requirement and bond ratings are not required.
OAR 340-094-0145 (6) (f)
Virginia Lacks the federally required debt-to-equity ratio and the current ratio is absent.
9 VAC 20-70-200
Wisconsin
Different tests are required depending upon the type of activity and the tests use additional financial ratios in addition to the federally required ones and bond ratings are incorporated.
NR 685.07 (5) (f), WAC 298.41 (4)-(7), NR 685.08 (8)

63
Figure 3.1: The proportion of bankrupt firm/years prior to bankruptcy from 1985-1999. I illustrate the proportion of bankrupt firm/years per year in the sample. My sample includes firm/year observations from Standard and Poor’s Compustat Annual Research, Annual Industrial, and Full Coverage files from 1985-1999.
0.00%
0.50%
1.00%
1.50%
2.00%
2.50%
3.00%
1985 1986 1987 1988 1989 1990 1991 1992 1993 1994 1995 1996 1997 1998 1999
Year prior to bankruptcy
Proportion of bankrupt firms

64
Figure 3.2: Proportion of bankrupt firm/years by industry from 1985-1999. I illustrate the proportion of bankrupt firm/years by industry in the sample. My sample includes firm/year observations from Standard and Poor’s Compustat Annual Research, Annual Industrial, and Full Coverage files from 1985-1999.
0.00% 1.00% 2.00% 3.00% 4.00%
Agriculture, Forestry, Fishing, and
Hunting
Mining
Utilities
Construction
Manufacturing
Wholesale and Retail Trade
Transportation and Warehousing
Information
Real Estate, Rental, and Leasing
Services
Industry
Proportion of bankrupt firms
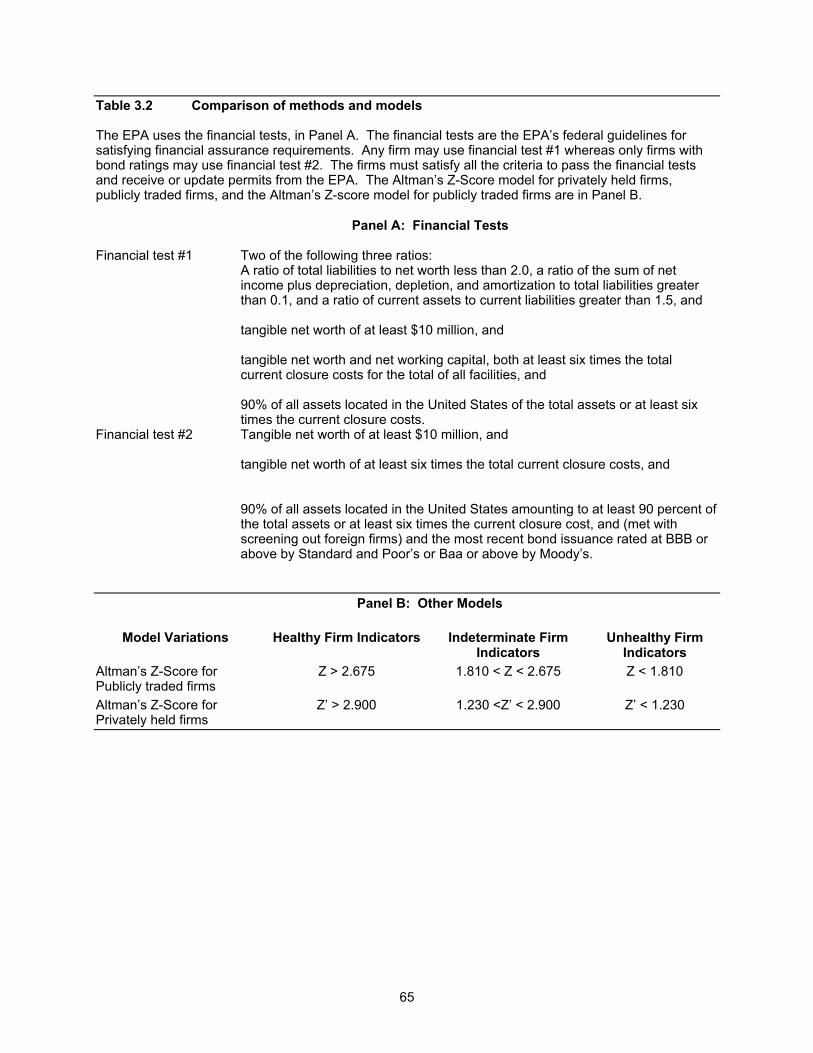
65
Table 3.2 Comparison of methods and models The EPA uses the financial tests, in Panel A. The financial tests are the EPA’s federal guidelines for satisfying financial assurance requirements. Any firm may use financial test #1 whereas only firms with bond ratings may use financial test #2. The firms must satisfy all the criteria to pass the financial tests and receive or update permits from the EPA. The Altman’s Z-Score model for privately held firms, publicly traded firms, and the Altman’s Z-score model for publicly traded firms are in Panel B.
Panel A: Financial Tests
Financial test #1 Two of the following three ratios: A ratio of total liabilities to net worth less than 2.0, a ratio of the sum of net income plus depreciation, depletion, and amortization to total liabilities greater than 0.1, and a ratio of current assets to current liabilities greater than 1.5, and tangible net worth of at least $10 million, and tangible net worth and net working capital, both at least six times the total current closure costs for the total of all facilities, and 90% of all assets located in the United States of the total assets or at least six times the current closure costs.
Financial test #2 Tangible net worth of at least $10 million, and tangible net worth of at least six times the total current closure costs, and
90% of all assets located in the United States amounting to at least 90 percent of the total assets or at least six times the current closure cost, and (met with screening out foreign firms) and the most recent bond issuance rated at BBB or above by Standard and Poor’s or Baa or above by Moody’s.
Panel B: Other Models
Model Variations Healthy Firm Indicators Indeterminate Firm Indicators
Unhealthy Firm Indicators
Altman’s Z-Score for Publicly traded firms
Z > 2.675 1.810 < Z < 2.675 Z < 1.810
Altman’s Z-Score for Privately held firms
Z’ > 2.900 1.230 <Z’ < 2.900 Z’ < 1.230

66
Table 3.3 Panel A: Classification results for the EPA’s financial tests, 1985-1999 I classify the distribution of 35,420 firm/years from Standard and Poor’s Compustat Annual Research, Annual Industrial, and Full Coverage files from 1985-1999. I classify firms as passing or failing the EPA’s financial tests in the year prior to bankruptcy. The cells contain the frequency of observations and I denote the percentage of the entire sample in brackets. Type I error indicates the rate at which bankrupt firm/years pass the EPA’s financial tests in the year prior to bankruptcy. Type II error indicates the rate at which non-bankrupt firm/years fail the EPA’s financial tests. I report the Chi-square statistic and corresponding p-value.
EPA’s Financial Tests
Bankrupt Non-bankrupt Total
Pass 39 [7.82%]
21,655[62.01%]
21,694
Fail 460[92.18%]
13,266[37.99%]
13,726
Total Chi-square p-value
499608.8115<0.0001
34,921 35,420

67
Table 3.3 Continued Panel B: Classification accuracy rates for the EPA’s financial tests by year, 1985-1999 I classify the distribution of 35,420 firm/years from Standard and Poor’s Compustat Annual Research, Annual Industrial, and Full Coverage files from 1985-1999. I classify firms as passing or failing the EPA’s financial tests in the year prior to bankruptcy. I report the two-sided Fisher exact p-values in lieu of the Chi-square because the Chi-square may not provide accurate statistics as 25% of the cells have expected counts less than 5. I denote the annual sample size by N and report the percentages of correct and incorrect classification. Correct classification occurs when non-bankrupt firm/years pass and bankrupt firm/years fail the EPA’s financial tests in the year prior to bankruptcy from 1985-1999. Incorrect classification occurs when non-bankrupt firms fail and bankrupt firm/years pass the EPA’s financial tests in the year prior to bankruptcy from 1985-1999.
Year Number of
firm/years Bankrupt correctly classified
Non-bankrupt correctly classified
Fisher exact p-
value
1985 2,382 88.89% 56.68% 0.0128 1986 2,611 96.55% 55.85% <0.0001 1987 2,631 100.00% 56.29% <0.0001 1988 2,427 100.00% 56.73% <0.0001 1989 2,312 98.08% 57.83% <0.0001 1990 2,217 97.44% 60.42% <0.0001 1991 2,230 93.33% 62.55% <0.0001 1992 2,179 82.35% 65.45% <0.0001 1993 2,312 92.59% 66.00% <0.0001 1994 2,450 88.24% 65.15% <0.0001 1995 2,540 94.74% 64.95% <0.0001 1996 2,618 78.57% 66.10% <0.0001 1997 2,489 88.64% 65.89% <0.0001 1998 2,201 80.00% 65.94% <0.0001 1999 1,821 95.24% 66.39% <0.0001
All years 35,420 92.18% 62.01% <0.0001

68
Figure 3.3: Classification error rates for the EPA’s financial tests from 1985-1999. I illustrate the distribution of classification error rates for the EPA’s financial tests from 1985-1999. Type I error indicates bankrupt firm/years misclassified as non-bankrupt firm/years. Type II error indicates non-bankrupt firm/years misclassified as bankrupt firm/years.
0.00%
10.00%
20.00%
30.00%
40.00%
50.00%
60.00%
1985 1986 1987 1988 1989 19901991 1992 1993 1994 1995 1996 1997 1998 1999 All
Year
Error rates
Type I Error: Misclassified bankrupt firm/years
Type II Error: Misclassified non-bankrkupt firm/years

69
Table 3.4 Classification accuracy rates for the EPA’s financial tests by industry, 1985-1999 I use a distribution of 35,420 firm/years from Standard and Poor’s Compustat Annual Research, Annual Industrial, and Full Coverage files from 1985-1999. I classify firm/years as passing or failing the EPA’s financial test requirement. For bankrupt firms, I use the data for the year prior to bankruptcy. I classify industries subject to EPA guidelines by two-digit North American Industrial Classification System (NAICS) code. The NAICS code identifies company activity. I consolidate the NAICS codes for wholesale trade (NAICS code 42) and retail trade (NAICS codes 44-45) into trade. I denote the industry sample size by N and report the classification accuracy rates. I report the two-sided Fisher exact p-values in lieu of the Chi-square because the Chi-square may not provide accurate statistics as 25% of the cells have expected counts less than 5. Correct classification occurs when non-bankrupt firm/years pass and bankrupt firm/years fail the EPA’s financial tests in the year prior to bankruptcy from 1985-1999. Incorrect classification occurs when non-bankrupt firms fail and bankrupt firm/years pass the EPA’s financial tests in the year prior to bankruptcy from 1985-1999.
Industries subject to EPA guidelines
NAICS code Number of firm/years
Bankrupt correctly classified
Non-bankrupt correctly classified
Fisher exact p-value
Agriculture, Forestry, Fishing, and Hunting
11 187 85.71 % 61.67 % 0.0173
Mining 21 2,224 96.30 % 41.69 % <0.0001 Utilities 22 2,028 100.00% 55.73% 0.1964 Construction 23 359 85.71% 42.90% 0.2461 Manufacturing 31-33 20,948 91.90% 68.04% <0.0001 Wholesale and Retail Trade
42-45 4,037 92.31% 59.54% <0.0001
Transportation and Warehousing
48-49 1,077 100.00% 53.26% <0.0001
Information 51 3,931 92.98% 52.66% <0.0001 Real Estate, Rental, and Leasing
53 195 100.00% 51.30% 0.2411
Services 56 434 80.00% 54.89% 0.0086
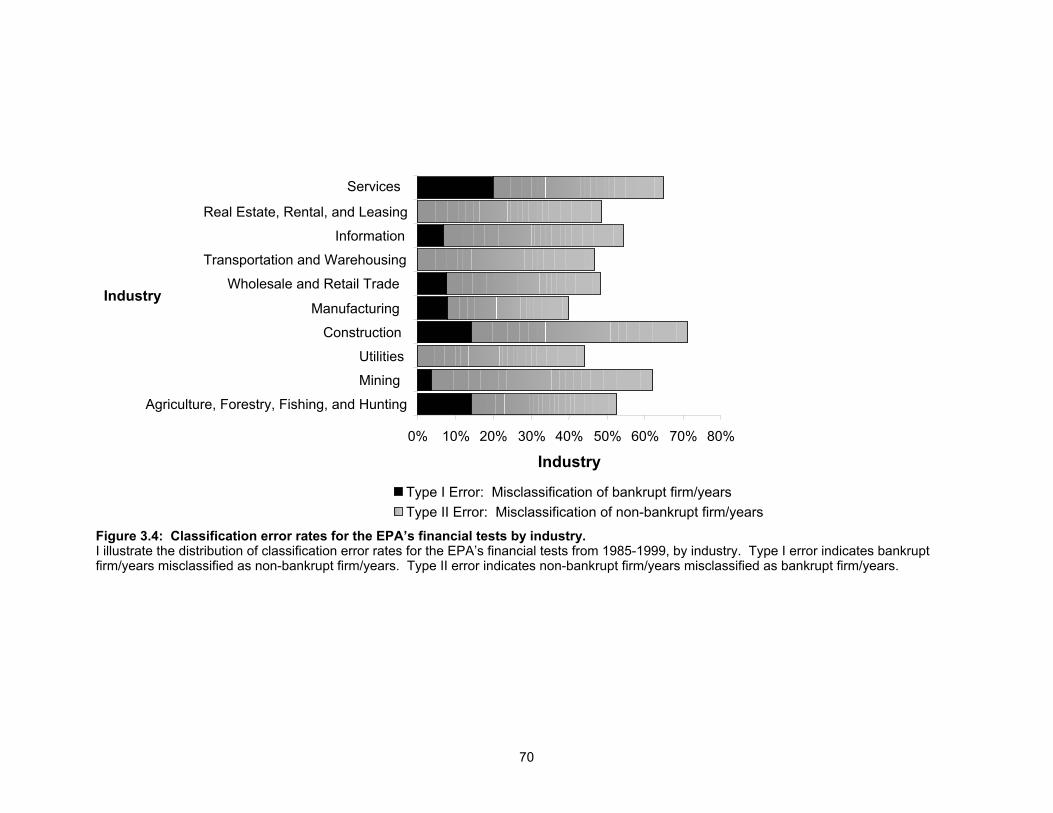
70
Figure 3.4: Classification error rates for the EPA’s financial tests by industry. I illustrate the distribution of classification error rates for the EPA’s financial tests from 1985-1999, by industry. Type I error indicates bankrupt firm/years misclassified as non-bankrupt firm/years. Type II error indicates non-bankrupt firm/years misclassified as bankrupt firm/years.
0% 10% 20% 30% 40% 50% 60% 70% 80%
Agriculture, Forestry, Fishing, and Hunting
Mining
Utilities
Construction
Manufacturing
Wholesale and Retail Trade
Transportation and Warehousing
Information
Real Estate, Rental, and Leasing
Services
Industry
Industry
Type I Error: Misclassification of bankrupt firm/years
Type II Error: Misclassification of non-bankrupt firm/years
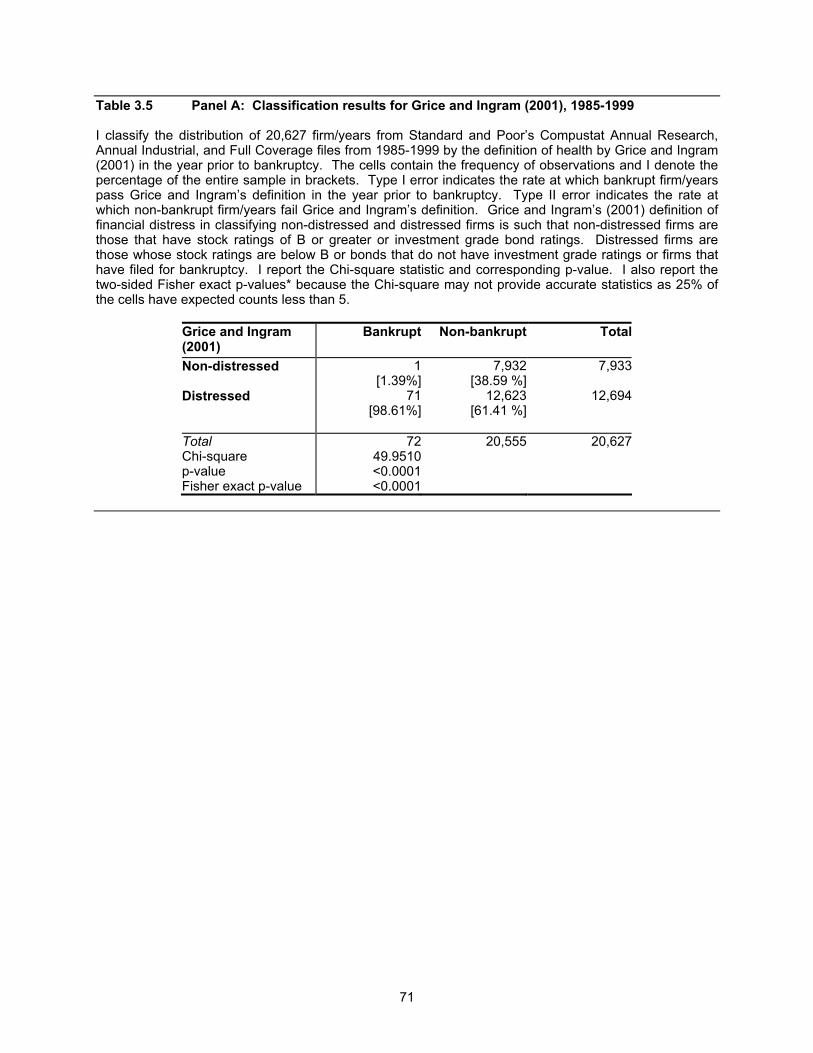
71
Table 3.5 Panel A: Classification results for Grice and Ingram (2001), 1985-1999 I classify the distribution of 20,627 firm/years from Standard and Poor’s Compustat Annual Research, Annual Industrial, and Full Coverage files from 1985-1999 by the definition of health by Grice and Ingram (2001) in the year prior to bankruptcy. The cells contain the frequency of observations and I denote the percentage of the entire sample in brackets. Type I error indicates the rate at which bankrupt firm/years pass Grice and Ingram’s definition in the year prior to bankruptcy. Type II error indicates the rate at which non-bankrupt firm/years fail Grice and Ingram’s definition. Grice and Ingram’s (2001) definition of financial distress in classifying non-distressed and distressed firms is such that non-distressed firms are those that have stock ratings of B or greater or investment grade bond ratings. Distressed firms are those whose stock ratings are below B or bonds that do not have investment grade ratings or firms that have filed for bankruptcy. I report the Chi-square statistic and corresponding p-value. I also report the two-sided Fisher exact p-values* because the Chi-square may not provide accurate statistics as 25% of the cells have expected counts less than 5.
Grice and Ingram (2001)
Bankrupt Non-bankrupt Total
Non-distressed 1 [1.39%]
7,932[38.59 %]
7,933
Distressed 71[98.61%]
12,623[61.41 %]
12,694
Total Chi-square p-value Fisher exact p-value
7249.9510<0.0001<0.0001
20,555 20,627

72
Table 3.5 Continued Panel B: Classification accuracy rates for Grice and Ingram (2001) by year, 1985-1999 I use a distribution of 20,627 firm/years is drawn from Standard and Poor’s Compustat Annual Research, Annual Industrial, and Full Coverage files from 1985-1999. I apply Grice and Ingram’s (2001) definition of financial distress to the sample. Grice and Ingram’s (2001) definition of financial distress is such that non-distressed firms are those that have stock ratings of B or greater or investment grade bond ratings. Distressed firms are those whose stock ratings are below B or bonds that do not have investment grade ratings or firms that have filed for bankruptcy. I denote the overall and annual sample size by N and report the correct and incorrect classification rates. I report the percent for each type of firm, non-bankrupt and bankrupt, that are correctly classified. Correct classification occurs when non-bankrupt firm/years are classified as non-distressed and bankrupt firm/years are classified as distressed by Grice and Ingram in the year prior to bankruptcy from 1985-1999. Incorrect classification occurs when non-bankrupt firms are classified as distressed and bankrupt firm/years are classified as non-distressed by Grice and Ingram in the year prior to bankruptcy from 1985-1999. I report the two-sided Fisher exact p-values in lieu of the Chi-square because the Chi-square may not provide accurate statistics as 25% of the cells have expected counts less than 5.
Year N Bankrupt correctly classified
Non-bankrupt correctly classified
Fisher exact p-
value 1985 1,247 100.00% 54.74% 0.4531 1986 1,463 75.00% 46.88% 0.6275 1987 1,425 100.00% 43.12% 1.0000 1988 1,358 100.00% 42.58% 0.5111 1989 1,359 100.00% 40.46% 0.0461 1990 1,331 100.00% 40.32% 0.1535 1991 1,327 100.00% 39.53% 0.1583 1992 1,272 100.00% 32.83% 0.1794 1993 1,329 100.00% 32.33% 0.1823 1994 1,443 100.00% 33.52% 0.5543 1995 1,455 100.00% 34.18% 0.3060 1996 1,473 100.00% 34.63% 0.5556 1997 1,470 100.00% 34.65% 0.3050 1998 1,412 100.00% 35.03% 0.0022 1999 1,263 100.00% 35.28% 0.0179
All years 20,627 98.61% 38.59 % <0.0001

73
Table 3.6 Classification accuracy rates for Grice and Ingram (2001) by industry, 1985-1999 I use a distribution of 20,627 firm/years from Standard and Poor’s Compustat Annual Research, Annual Industrial, and Full Coverage files from 1985-1999. I apply Grice and Ingram’s (2001) definition of financial distress to the sample. Grice and Ingram’s (2001) definition of financial distress is such that non-distressed firms are those that have stock ratings of B or greater or investment grade bond ratings. Distressed firms are those whose stock ratings are below B or bonds that do not have investment grade ratings or firms that have filed for bankruptcy. The North American Industrial Classification System (NAICS) code identifies company activity. I consolidate the NAICS codes for wholesale trade (NAICS code 42) and retail trade (NAICS codes 44-45) into trade and similarly, I consolidate services (NAICS codes 54 to 92). I denote the industry sample size by N and the classification rates. I report the percent for each type of firm, non-bankrupt and bankrupt, that are correctly classified. Correct classification occurs when non-bankrupt firm/years are classified as non-distressed and bankrupt firm/years are classified as distressed by Grice and Ingram in the year prior to bankruptcy from 1985-1999. Incorrect classification occurs when non-bankrupt firms are classified as distressed and bankrupt firm/years are classified as non-distressed by Grice and Ingram in the year prior to bankruptcy from 1985-1999. I report the two-sided Fisher exact p-values in lieu of the Chi-square because the Chi-square may not provide accurate statistics as 25% of the cells have expected counts less than 5. *I indicate the lack of a statistic due to lack of bankrupt firm/years with N/A.
Industries subject to EPA guidelines
NAIC code N Bankrupt correctly
classified
Non-bankrupt correctly
classified
Fisher exact p-value
Agriculture, Forestry, Fishing, and Hunting
11 85 100.00% 28.57% 1.0000
Mining 21 1,119 100.00% 9.51% 1.0000 Utilities 22 1,840 N/A 74.95% N/A Construction 23 208 100.00% 20.29% 1.0000 Manufacturing 31-33 12,654 100.00% 35.99% <0.0001 Wholesale and Retail Trade 42-45 2,119 100.00% 40.62% 0.0013 Transportation and Warehousing
48-49 667 100.00% 31.17% 0.5561
Information 51 1,627 90.00% 44.71% 0.0497 Real Estate, Rental, and Leasing
53 119 N/A 14.29 % N/A
Services 56 189 100.00% 20.21 % 1.0000

74
Table 3.7 Panel A: Classification results for bond ratings, 1985-1999 I use a distribution of 8,210 firm/years from Standard and Poor’s Compustat Annual Research, Annual Industrial, and Full Coverage files from 1985-1999. Because in this analysis, I classify firm/years by Standard and Poor’s long-term domestic bond ratings, I remove those firm/years without bond ratings. Type I error indicates the rate at which bankrupt firm/years have bond ratings at least BBB or greater (investment grade bond ratings) in the year prior to bankruptcy. Type II error indicates the rate at which non-bankrupt firm/years fail to have bond ratings less than BBB. I report the Chi-square statistic and corresponding p-value. I also report the two-sided Fisher exact p-values* because the Chi-square may not provide accurate statistics as 25% of the cells have expected counts less than 5.
Bond Ratings Bankrupt Non-bankrupt Total
At least BBB 0* [0.00%]
5,572[67.96%]
5,572
Below BBB 11[100.00%]
2,627[32.04%]
2,638
Total Chi-square p-value Fisher exact p-value
1123.2654<0.0001<0.0001
8,199 8,210

75
Table 3.7 Continued Panel B: Classification accuracy rates for bond ratings by year, 1985-1999 I use a distribution of 8,210 firm/years from Standard and Poor’s Compustat Annual Research, Annual Industrial, and Full Coverage files from 1985-1999. I classify firm/years as being above or below a rating of BBB by Standard and Poor’s long-term domestic bond ratings. Because in this analysis, I classify firm/years by Standard and Poor’s long-term domestic bond ratings, I remove those firm/years without bond ratings. I find 5,572 firm/years with ratings above BBB and 2,638 below BBB. I report the percent for each type of firm, non-bankrupt and bankrupt, that are correctly classified. Correct classification occurs when non-bankrupt firm/years has bond ratings of at least BBB and bankrupt firm/years have bond ratings below BBB in the year prior to bankruptcy. Incorrect classification occurs if non-bankrupt firm/years have bond ratings less than BBB and bankrupt firm/years have bond ratings of at least BBB in the year prior to bankruptcy. I denote the sample size by N. I report the two-sided Fisher exact p-values in lieu of the Chi-square because the Chi-square may not provide accurate statistics as 25% of the cells have expected counts less than 5. Year N Bankrupt
correctly classified
Non-bankrupt correctly classified
Fisher exact p-value*
1985 400 0.00% 73.50% N/A 1986** 569 100.00% 65.85% 0.3427
1987 567 0.00% 64.90% N/A 1988 521 0.00% 67.37% N/A 1989 499 0.00% 69.14% N/A 1990 475 0.00% 72.00% N/A 1991 490 0.00% 73.27% N/A 1992 453 0.00% 69.09% N/A 1993 488 0.00% 66.60% N/A 1994 558 0.00% 68.82% N/A 1995 579 0.00% 68.22% N/A 1996 618 0.00% 67.31% N/A
1997** 663 100.00% 66.31% 0.3379 1998** 683 100.00% 65.24% <0.0001 1999** 647 100.00% 66.05% 0.1163
All years 8,210 100.00% 67.96% <0.0001 *I indicate the lack of a statistic due to lack of bankrupt firm/years with N/A. **In these years, all of the bankrupt observations are correctly classified. In 1986 and 1987, there is one observation in each year. In 1998, there are seven observations and in 1999, there are two observations.

76
Table 3.8 Classification accuracy rates for bond ratings by industry, 1985-1999 I use a distribution of 8,210 firm/years from Standard and Poor’s Compustat Annual Research, Annual Industrial, and Full Coverage files from 1985-1999. I classify firm/years as being above or below a rating of BBB by Standard and Poor’s long-term domestic bond ratings. Because in this analysis, I classify firm/years by Standard and Poor’s long-term domestic bond ratings, I remove those firm/years without bond ratings. I find 5,572 firm/years with ratings above BBB and 2,638 below BBB. The NAICS code identifies company activity. I consolidate the NAICS codes for wholesale trade (NAICS code 42) and retail trade (NAICS codes 44-45) into trade. I report the percent for each type of firm, non-bankrupt and bankrupt, that are correctly classified. Correct classification occurs when non-bankrupt firm/years has bond ratings of at least BBB and bankrupt firm/years have bond ratings below BBB in the year prior to bankruptcy. Incorrect classification occurs if non-bankrupt firm/years have bond ratings less than BBB and bankrupt firm/years have bond ratings of at least BBB in the year prior to bankruptcy. I denote the sample size by N. I report the two-sided Fisher exact p-values* in lieu of the Chi-square because the Chi-square may not provide accurate statistics as 25% of the cells have expected counts less than 5.
Industries subject to EPA guidelines
NAICS Code
N Bankrupt correctly
classified
Non-bankrupt correctly
classified
Fisher exact p-value*
Agriculture, Forestry, Fishing, and Hunting
11 25 0.00% 76.00% N/A
Mining 21 543 0.00% 45.67% N/A Utilities 22 1,041 0.00% 93.76% N/A Construction 23 27 0.00% 33.33% N/A Manufacturing** 31-33 4,377 100.00% 67.02% 0.0039 Wholesale and Retail Trade**
42-45 874 100.00% 61.54% 0.0575
Transportation and Warehousing**
48-49 404 100.00% 67.25% 0.3292
Information** 51 774 100.00% 65.54% 0.1196 Real Estate, Rental, and Leasing
53 54 0.00% 74.07% N/A
Services 56 91 0.00% 40.66% N/A *I indicate the lack of a statistic due to lack of bankrupt firms with N/A. **In these industries, all of the bankrupt observations are correctly classified. The manufacturing, trade, transportation, and information industries have five, three, one, and two bankrupt observations, respectively.

77
Table 3.9 Panel A: Classification results auditor opinion, 1985-1999 I classify the distribution of 35,420 firm/years from Standard and Poor’s Compustat Annual Research, Annual Industrial, and Full Coverage files from 1985-1999 by auditor opinion in the year prior to bankruptcy. Correct classification occurs when non-bankrupt firm/years receive an unqualified opinion, an unqualified opinion with clarification, or a qualified opinion. Likewise, correct classification also occurs when bankrupt firm/years receive no opinion or an adverse opinion in the year prior to bankruptcy. Type I error indicates the rate at which bankrupt firm/years receive an unqualified opinion, an unqualified opinion with clarification, or a qualified opinion in the year prior to bankruptcy. Type II error indicates the rate at which non-bankrupt firm/years receive an unqualified opinion, an unqualified opinion with clarification, or a qualified opinion. I report the Chi-square statistic and corresponding p-value.
Auditor opinion Bankrupt Non-bankrupt Total
Unqualified, unqualified with clarification, or qualified
486[97.39%]
34868[99.85%]
35,354
Adverse or none 13[2.61%]
53[0.15%]
66
Total Chi-square p-value
499159.2223<0.0001
34,921 35,420

78
Table 3.9 Continued Panel B: Classification accuracy rates for auditor opinion by year, 1985-1999 I classify the distribution of 35,420 firm/years from Standard and Poor’s Compustat Annual Research, Annual Industrial, and Full Coverage files from 1985-1999 by auditor opinion in the year prior to bankruptcy. Correct classification occurs when non-bankrupt firm/years receive an unqualified opinion, an unqualified opinion with clarification, or a qualified opinion. Likewise, correct classification also occurs when bankrupt firm/years receive no opinion or an adverse opinion in the year prior to bankruptcy. Type I error indicates the rate at which bankrupt firm/years receive an unqualified opinion, an unqualified opinion with clarification, or a qualified opinion in the year prior to bankruptcy. Type II error indicates the rate at which non-bankrupt firm/years receive an unqualified opinion, an unqualified opinion with clarification, or a qualified opinion. I report the two-sided Fisher exact p-values* in lieu of the Chi-square because the Chi-square may not provide accurate statistics as 25% of the cells have expected counts less than 5. I denote the sample size by N.
Year N Bankrupt
correctly classified
Non-bankrupt correctly classified
Fisher exact p-values*
1985 2,382 0.00% 99.62% 1.0000 1986 2,611 3.45% 99.69% 0.0958 1987 2,631 0.00% 99.73% 1.0000 1988 2,427 9.09% 99.83% <0.0001 1989 2,312 7.69% 99.73% <0.0001 1990 2,217 2.56% 99.86% 0.0686 1991 2,230 10.00% 99.82% <0.0001 1992 2,179 5.88% 99.86% 0.0309 1993 2,312 0.00% 99.91% 1.0000 1994 2,450 0.00% 99.96% 1.0000 1995 2,540 0.00% 99.92% 1.0000 1996 2,618 0.00% 99.88% 1.0000 1997 2,489 0.00% 99.96% 1.0000 1998 2,201 0.00% 100.00% N/A 1999 1,821 0.00% 100.00% N/A
All years 35,420 2.61% 99.85% <0.0001 *All opinions are unqualified, unqualified with clarification, or qualified. Therefore, I could not calculate a statistic.

79
Table 3.10 Classification accuracy rates for auditor opinion by industry, 1985-1999 I classify the distribution of 35,420 firm/years from Standard and Poor’s Compustat Annual Research, Annual Industrial, and Full Coverage files from 1985-1999 by auditor opinion by two-digit North American Industrial Classification System (NAICS code). The NAICS code identifies company activity. I consolidate the NAICS codes for wholesale trade (NAICS code 42) and retail trade (NAICS codes 44-45) into trade. Correct classification occurs when non-bankrupt firm/years receive an unqualified opinion, an unqualified opinion with clarification, or a qualified opinion. Likewise, correct classification also occurs when bankrupt firm/years receive no opinion or an adverse opinion in the year prior to bankruptcy. Type I error indicates the rate at which bankrupt firm/years receive an unqualified opinion, an unqualified opinion with clarification, or a qualified opinion in the year prior to bankruptcy. Type II error indicates the rate at which non-bankrupt firm/years receive an unqualified opinion, an unqualified opinion with clarification, or a qualified opinion. I report the two-sided Fisher exact p-values* in lieu of the Chi-square because the Chi-square may not provide accurate statistics as 25% of the cells have expected counts less than 5. I denote the sample size by N
Industries subject to EPA
guidelines
NAICS code
N Bankrupt correctly
classified
Non-bankrupt correctly
classified
Fisher exact
p-value*
Agriculture, Forestry, Fishing, and Hunting
11 187 0.00% 100.00 N/A
Mining 21 2,224 3.70% 99.54% 0.1260 Utilities 22 2,028 0.00% 100.00% N/A Construction 23 359 14.29% 98.86% 0.0943 Manufacturing 31-33 20,948 2.46% 99.92% <0.0001 Wholesale and Retail Trade
42-45 4,037 3.85% 99.72% 0.0022
Transportation and Warehousing
48-49 1,077 0.00% 100.00% N/A
Information 51 3,931 1.75% 99.72% 0.1610 Real Estate, Rental, and Leasing
53 195 0.00% 100.00% N/A
Services 56 434 0.00% 100.00% N/A *All opinions are unqualified, unqualified with clarification, or qualified. Therefore, I could not calculate a statistic.

80
Table 3.11 Panel A: Classification results for the Altman Z-Score Model for publicly traded firms, 1985-1999
I use a distribution of 35,012 firm/years from Standard and Poor’s Compustat Annual Research, Annual Industrial, and Full Coverage files from 1985-1999. Sample attrition is the result of insufficient data. I calculate Z-scores for each firm/year using Altman’s Z-Score Model for publicly traded firms. For publicly traded firms, Z-Scores less than 1.81 indicate a higher propensity for bankruptcy. Z-Scores, between 1.81 and 2.675 are inconclusive and Z-Scores greater than 2.675 indicate a lower propensity for a firm to go bankrupt. I combine the inconclusive Z-Scores with those that indicate a lower propensity for bankruptcy into one category. Type I error indicates the rate at which bankrupt firm/years have Z-Scores at least 1.81 in the year prior to bankruptcy and type II error indicates the rate at which non-bankrupt firm/years have Z-Scores less than 1.81. I report Chi-square and corresponding p-value. I denote the sample size by N. Altman’s Z-Score Model for publicly traded firms is as follows:
Z = 0.012X1 + 0.014X2 + 0.033X3 + 0.0006X4 + 0.999X5, where Z = the Z-Score firm health indicator, X1 = working capital/total assets, X2 = retained earnings/total assets, X3 = earnings before interest and taxes/total assets, X4 = market value of equity/book value of liabilities, and X5 = sales/total assets.
Altman’s Z-Score Model for publicly traded firms
Bankrupt Non-bankrupt Total
Z ≥ 1.81 139 [29.57%]
26,076[75.49%]
26,215
Z < 1.81 331[70.43%]
8,466[24.51%]
8,797
Total Chi-square p-value
470519.6494<0.0001
34,542 35,012

81
Table 3.11 Continued Panel B: Classification accuracy rates for the Altman Z-Score Model for publicly
traded firms by year, 1985-1999 I use a distribution of 35,012 firm/years from Standard and Poor’s Compustat Annual Research, Annual Industrial, and Full Coverage files from 1985-1999. Sample attrition is the result of insufficient data. I calculate Z-scores for each firm/year using Altman’s Z-Score Model for publicly traded firms. For publicly traded firms, Z-Scores less than 1.81 indicate a higher propensity for bankruptcy. Z-Scores, between 1.81 and 2.675 are inconclusive and Z-Scores greater than 2.675 indicate a lower propensity for a firm to go bankrupt. I combine the inconclusive Z-Scores with those that indicate a lower propensity for bankruptcy into one category. Type I error indicates the rate at which bankrupt firm/years have Z-Scores at least 1.81 in the year prior to bankruptcy and type II error indicates the rate at which non-bankrupt firm/years have Z-Scores less than 1.81. I report the two-sided Fisher exact p-values* in lieu of the Chi-square because the Chi-square may not provide accurate statistics as 25% of the cells have expected counts less than 5. I denote the sample size by N. Altman’s Z-Score Model for publicly traded firms is as follows:
Z = 0.012X1 + 0.014X2 + 0.033X3 + 0.0006X4 + 0.999X5, where Z = the Z-Score firm health indicator, X1 = working capital/total assets, X2 = retained earnings/total assets, X3 = earnings before interest and taxes/total assets, X4 = market value of equity/book value of liabilities, and X5 = sales/total assets.
Year N Bankrupt
correctly classified
Non-bankrupt correctly classified
Fisher exact
p-value
1985 2,356 28.57% 76.16% 0.67431986 2,580 75.00% 73.63% <0.00011987 2,597 82.35% 74.29% <0.00011988 2,397 80.00% 73.47% <0.00011989 2,283 76.00% 73.98% <0.00011990 2,197 81.58% 72.30% <0.00011991 2,208 84.62% 74.24% <0.00011992 2,158 81.25% 78.48% <0.00011993 2,283 46.15% 80.24% 0.00231994 2,424 56.25% 75.25% 0.00721995 2,513 75.68% 77.50% <0.00011996 2,579 60.71% 78.83% <0.00011997 2,456 70.73% 76.73% <0.00011998 2,178 59.26% 72.98% <0.00011999 1,803 64.10% 73.41% <0.0001
All years 35,012 70.43% 75.49% <0.0001

82
Table 3.12 Classification accuracy rates for the Altman Z-Score Model for publicly traded firms by industry, 1985-1999 I use a distribution of 35,012 firm/years from Standard and Poor’s Compustat Annual Research, Annual Industrial, and Full Coverage files from 1985-1999. Sample attrition is the result of insufficient data. I calculate Z-scores for each firm/year using Altman’s Z-Score Model for publicly traded firms. For publicly traded firms, Z-Scores less than 1.81 indicate a higher propensity for bankruptcy. Z-Scores, between 1.81 and 2.675 are inconclusive and Z-Scores greater than 2.675 indicate a lower propensity for a firm to go bankrupt. I combine the inconclusive Z-Scores with those that indicate a lower propensity for bankruptcy into one category. Type I error indicates the rate at which bankrupt firm/years have Z-Scores at least 1.81 in the year prior to bankruptcy and type II error indicates the rate at which non-bankrupt firm/years have Z-Scores less than 1.81. The NAICS code identifies company activity. I consolidate the NAICS codes for wholesale trade (NAICS code 42) and retail trade (NAICS codes 44-45) into trade. I report the two-sided Fisher exact p-values* in lieu of the Chi-square because the Chi-square may not provide accurate statistics as 25% of the cells have expected counts less than 5. I denote the sample size by N. Altman’s Z-Score Model for publicly traded firms is as follows:
Z = 0.012X1 + 0.014X2 + 0.033X3 + 0.0006X4 + 0.999X5, where Z = the Z-Score firm health indicator, X1 = working capital/total assets, X2 = retained earnings/total assets, X3 = earnings before interest and taxes/total assets, X4 = market value of equity/book value of liabilities, and X5 = sales/total assets.
Industries subject to EPA guidelines
NAICS code
N Bankrupt correctly
classified
Non-bankrupt correctly
classified
Fisher exact p-value
Agriculture, Forestry, Fishing, and Hunting
11 186 71.43% 71.51% 0.0268
Mining 21 2,172 83.33% 44.65% 0.0063 Utilities 22 2,023 100.00% 17.41% 1.0000 Construction 23 359 85.71% 83.24% 0.0002 Manufacturing 31-33 20,673 76.98% 84.07% <0.0001 Wholesale and Retail Trade
42-45 4,013 46.75% 88.29% <0.0001
Transportation and Warehousing
48-49 1,077 65.00% 61.87% 0.0193
Information 51 3,886 71.70% 69.29% <0.0001 Real Estate, Rental, and Leasing
53 195 50.00% 48.19% 1.0000
Services 56 428 50.00% 74.88% 0.0572
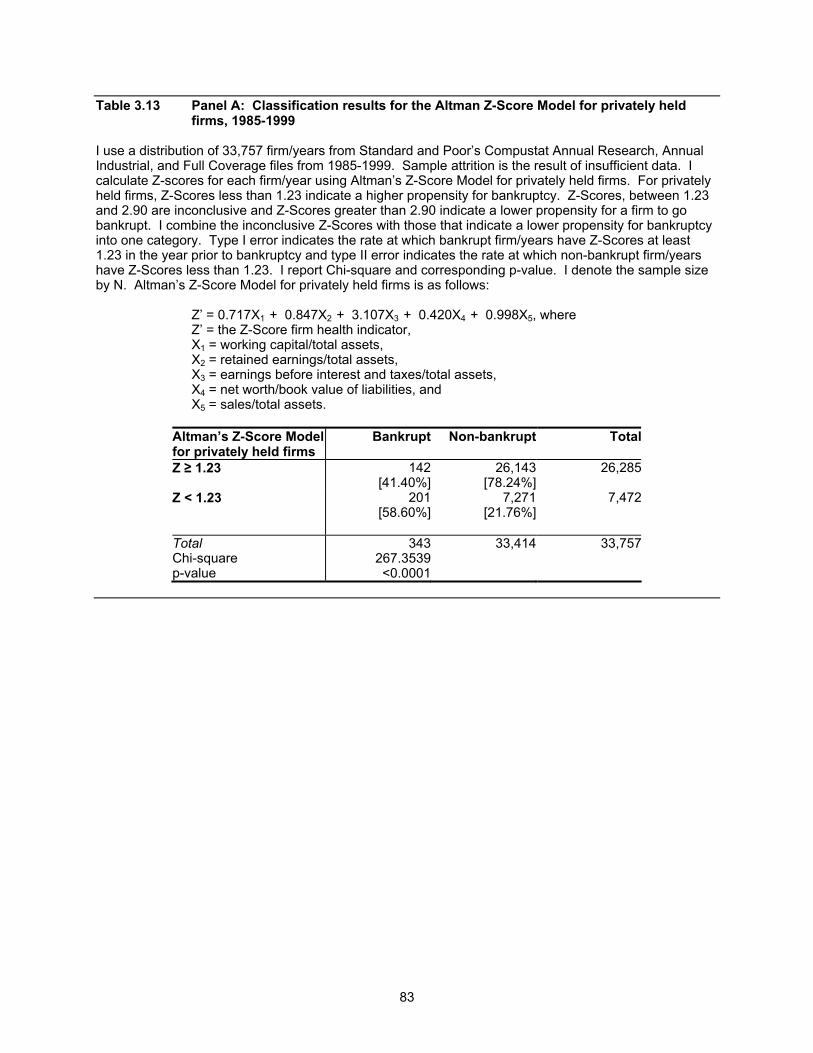
83
Table 3.13 Panel A: Classification results for the Altman Z-Score Model for privately held firms, 1985-1999
I use a distribution of 33,757 firm/years from Standard and Poor’s Compustat Annual Research, Annual Industrial, and Full Coverage files from 1985-1999. Sample attrition is the result of insufficient data. I calculate Z-scores for each firm/year using Altman’s Z-Score Model for privately held firms. For privately held firms, Z-Scores less than 1.23 indicate a higher propensity for bankruptcy. Z-Scores, between 1.23 and 2.90 are inconclusive and Z-Scores greater than 2.90 indicate a lower propensity for a firm to go bankrupt. I combine the inconclusive Z-Scores with those that indicate a lower propensity for bankruptcy into one category. Type I error indicates the rate at which bankrupt firm/years have Z-Scores at least 1.23 in the year prior to bankruptcy and type II error indicates the rate at which non-bankrupt firm/years have Z-Scores less than 1.23. I report Chi-square and corresponding p-value. I denote the sample size by N. Altman’s Z-Score Model for privately held firms is as follows:
Z’ = 0.717X1 + 0.847X2 + 3.107X3 + 0.420X4 + 0.998X5, where Z’ = the Z-Score firm health indicator, X1 = working capital/total assets, X2 = retained earnings/total assets, X3 = earnings before interest and taxes/total assets, X4 = net worth/book value of liabilities, and X5 = sales/total assets.
Altman’s Z-Score Model for privately held firms
Bankrupt Non-bankrupt Total
Z ≥ 1.23 142 [41.40%]
26,143[78.24%]
26,285
Z < 1.23 201[58.60%]
7,271[21.76%]
7,472
Total Chi-square p-value
343267.3539<0.0001
33,414 33,757
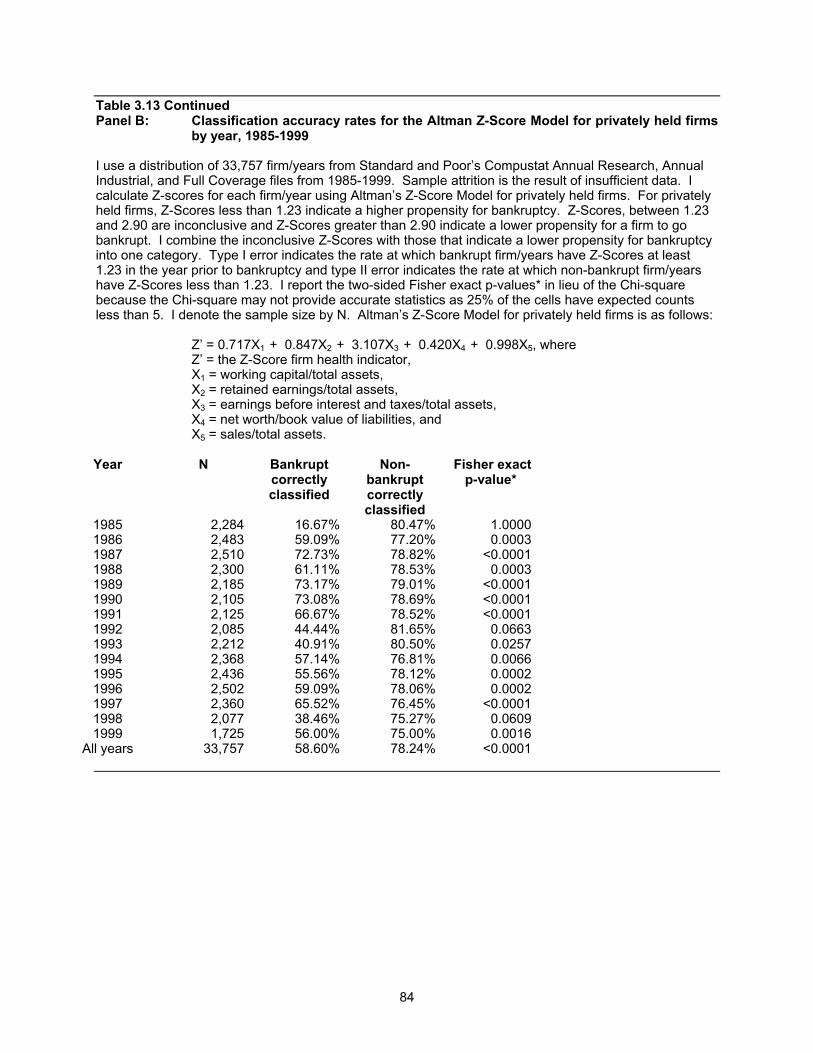
84
Table 3.13 Continued Panel B: Classification accuracy rates for the Altman Z-Score Model for privately held firms
by year, 1985-1999 I use a distribution of 33,757 firm/years from Standard and Poor’s Compustat Annual Research, Annual Industrial, and Full Coverage files from 1985-1999. Sample attrition is the result of insufficient data. I calculate Z-scores for each firm/year using Altman’s Z-Score Model for privately held firms. For privately held firms, Z-Scores less than 1.23 indicate a higher propensity for bankruptcy. Z-Scores, between 1.23 and 2.90 are inconclusive and Z-Scores greater than 2.90 indicate a lower propensity for a firm to go bankrupt. I combine the inconclusive Z-Scores with those that indicate a lower propensity for bankruptcy into one category. Type I error indicates the rate at which bankrupt firm/years have Z-Scores at least 1.23 in the year prior to bankruptcy and type II error indicates the rate at which non-bankrupt firm/years have Z-Scores less than 1.23. I report the two-sided Fisher exact p-values* in lieu of the Chi-square because the Chi-square may not provide accurate statistics as 25% of the cells have expected counts less than 5. I denote the sample size by N. Altman’s Z-Score Model for privately held firms is as follows:
Z’ = 0.717X1 + 0.847X2 + 3.107X3 + 0.420X4 + 0.998X5, where Z’ = the Z-Score firm health indicator, X1 = working capital/total assets, X2 = retained earnings/total assets, X3 = earnings before interest and taxes/total assets, X4 = net worth/book value of liabilities, and X5 = sales/total assets.
Year N Bankrupt
correctly classified
Non-bankrupt correctly classified
Fisher exactp-value*
1985 2,284 16.67% 80.47% 1.00001986 2,483 59.09% 77.20% 0.00031987 2,510 72.73% 78.82% <0.00011988 2,300 61.11% 78.53% 0.00031989 2,185 73.17% 79.01% <0.00011990 2,105 73.08% 78.69% <0.00011991 2,125 66.67% 78.52% <0.00011992 2,085 44.44% 81.65% 0.06631993 2,212 40.91% 80.50% 0.02571994 2,368 57.14% 76.81% 0.00661995 2,436 55.56% 78.12% 0.00021996 2,502 59.09% 78.06% 0.00021997 2,360 65.52% 76.45% <0.00011998 2,077 38.46% 75.27% 0.06091999 1,725 56.00% 75.00% 0.0016
All years 33,757 58.60% 78.24% <0.0001

85
Table 3.14 Classification accuracy rates for the Altman Z-Score Model for privately held firms by industry, 1985-1999 I use a distribution of 33,757 firm/years from Standard and Poor’s Compustat Annual Research, Annual Industrial, and Full Coverage files from 1985-1999. Sample attrition is the result of insufficient data. I calculate Z-scores for each firm/year using Altman’s Z-Score Model for privately held firms. For privately held firms, Z-Scores less than 1.23 indicate a higher propensity for bankruptcy. Z-Scores, between 1.23 and 2.90 are inconclusive and Z-Scores greater than 2.90 indicate a lower propensity for a firm to go bankrupt. I combine the inconclusive Z-Scores with those that indicate a lower propensity for bankruptcy into one category. Type I error indicates the rate at which bankrupt firm/years have Z-Scores at least 1.23 in the year prior to bankruptcy and type II error indicates the rate at which non-bankrupt firm/years have Z-Scores less than 1.23. The NAICS code identifies company activity. I consolidate the NAICS codes for wholesale trade (NAICS code 42) and retail trade (NAICS codes 44-45) into trade. I report the two-sided Fisher exact p-values* in lieu of the Chi-square because the Chi-square may not provide accurate statistics as 25% of the cells have expected counts less than 5. I denote the sample size by N. Altman’s Z-Score Model for privately held firms is as follows:
Z’ = 0.717X1 + 0.847X2 + 3.107X3 + 0.420X4 + 0.998X5, where Z’ = the Z-Score firm health indicator, X1 = working capital/total assets, X2 = retained earnings/total assets, X3 = earnings before interest and taxes/total assets, X4 = net worth/book value of liabilities, and X5 = sales/total assets.

86
Table 3.14 Continued Classification accuracy rates for the Altman Z-Score Model for privately held firms by industry, 1985-1999
Industries subject to EPA guidelines
NAICS code
N Bankrupt correctly
classified
Non-bankrupt correctly
classified
Fisher exact p-value*
Agriculture, Forestry, Fishing, and Hunting
11 184 83.33% 62.36% 0.0347
Mining 21 2,067 72.73% 43.77% 0.1350 Utilities 22 2,017 0.00% 29.85% N/A Construction 23 348 60.00% 86.59% 0.0214 Manufacturing 31-33 19,962 62.70% 86.95% <0.0001 Wholesale and Retail Trade
42-45 3,888 38.33% 91.93% <0.0001
Transportation and Warehousing
48-49 1,056 43.75% 69.04% 0.2840
Information 51 3,628 67.65% 67.33% <0.0001 Real Estate, Rental, and Leasing
53 190 50.00% 54.26% 1.0000
Services 56 417 53.85% 70.05% 0.1215 *I indicate the lack of a statistic due to lack of bankrupt firms with N/A.
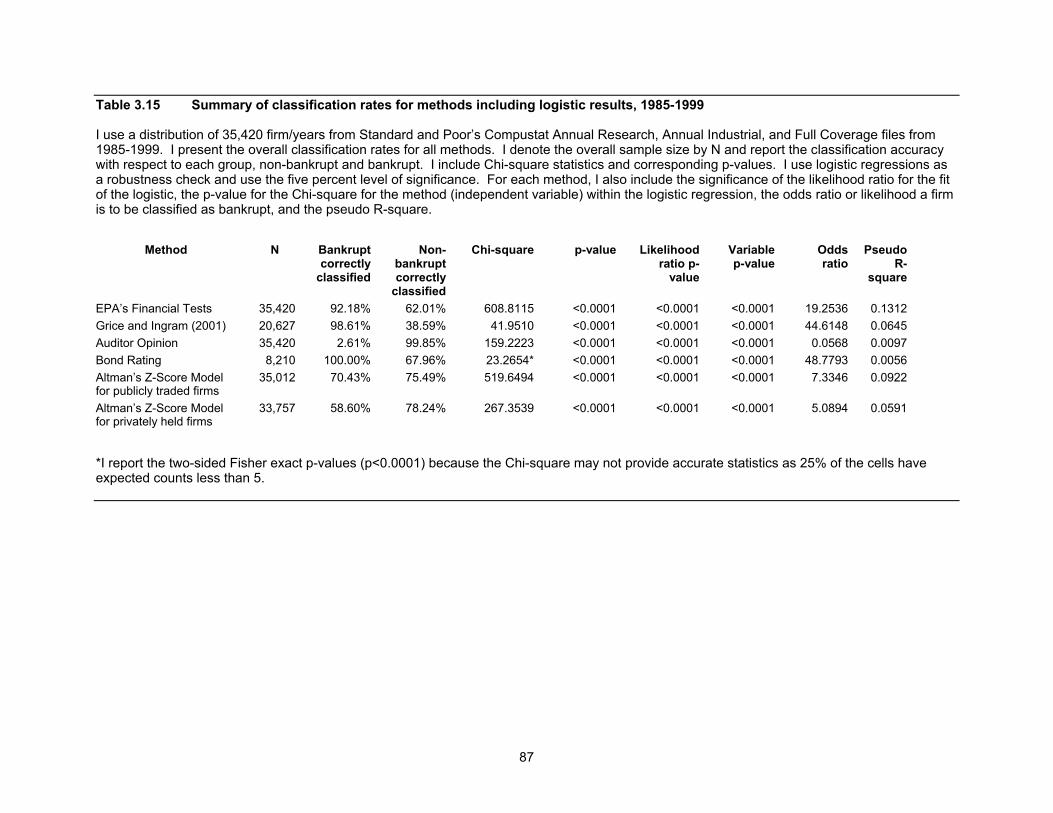
87
Table 3.15 Summary of classification rates for methods including logistic results, 1985-1999 I use a distribution of 35,420 firm/years from Standard and Poor’s Compustat Annual Research, Annual Industrial, and Full Coverage files from 1985-1999. I present the overall classification rates for all methods. I denote the overall sample size by N and report the classification accuracy with respect to each group, non-bankrupt and bankrupt. I include Chi-square statistics and corresponding p-values. I use logistic regressions as a robustness check and use the five percent level of significance. For each method, I also include the significance of the likelihood ratio for the fit of the logistic, the p-value for the Chi-square for the method (independent variable) within the logistic regression, the odds ratio or likelihood a firm is to be classified as bankrupt, and the pseudo R-square.
*I report the two-sided Fisher exact p-values (p<0.0001) because the Chi-square may not provide accurate statistics as 25% of the cells have expected counts less than 5.
Method N Bankrupt correctly
classified
Non-bankrupt correctly
classified
Chi-square p-value Likelihood ratio p-
value
Variable p-value
Odds ratio
Pseudo R-
square
EPA’s Financial Tests 35,420 92.18% 62.01% 608.8115 <0.0001 <0.0001 <0.0001 19.2536 0.1312
Grice and Ingram (2001) 20,627 98.61% 38.59% 41.9510 <0.0001 <0.0001 <0.0001 44.6148 0.0645
Auditor Opinion 35,420 2.61% 99.85% 159.2223 <0.0001 <0.0001 <0.0001 0.0568 0.0097
Bond Rating 8,210 100.00% 67.96% 23.2654* <0.0001 <0.0001 <0.0001 48.7793 0.0056
Altman’s Z-Score Model for publicly traded firms
35,012 70.43% 75.49% 519.6494 <0.0001 <0.0001 <0.0001 7.3346 0.0922
Altman’s Z-Score Model for privately held firms
33,757 58.60% 78.24% 267.3539 <0.0001 <0.0001 <0.0001 5.0894 0.0591

88
Table 3.16 Summary of classification rates by method, 1985-1999 In this expanded contingency table, I report the total number of observations per cell per method. I collect the observations from Standard and Poor’s Compustat Annual Research, Annual Industrial, and Full Coverage files from 1985-1999. All methods classify the distribution of 35,420 firm/years except Grice and Ingram, bond ratings and the Altman models. Their sample sizes are 20,627, 8,210, 35,012, and 33,757 firm/years respectively. Beneath the total number of firm/year observations, I record the percent of within group classification and the percent classification with respect to the entire sample, respectively. Type I error indicates the rate at which bankrupt firm/years pass the EPA’s financial tests in the year prior to bankruptcy with respect to only the bankrupt group. Type II error indicates the rate at which non-bankrupt firm/years fail the EPA’s financial tests with respect to only the non-bankrupt group.

89
Table 3.16 Continued Summary of classification rates by method, 1985-1999
Method Bankrupt Non-bankrupt
Pass
EPA Within group Entire sample GI Within group Entire sample Bond Within group Entire sample Auditor Within group Entire sample Z-Score public Within group Entire sample Z-Score private Within group Entire sample
39
[7.82%] [0.11%]
1
[1.39 %] [<0.01%]
0
[0.00%] [0.00%]
486
[97.39%] [1.37%]
139
[29.57%] [0.40%]
142
[41.40%] [0.42%]
21,655
[62.01%] [61.14%]
7932
[38.59%] [38.45%]
5,572
[67.96%] [67.87%]
34,868
[99.85%] [98.44%]
26,076
[75.49%] [74.48%]
26,143
[78.24%] [77.44%]
Fail
EPA Within group Entire sample GI Within group Entire sample Bond Within group Entire sample Auditor Within group Entire sample Z-Score public Within group Entire sample Z-Score private Within group Entire sample
460
[92.18%] [1.30%]
71
[98.61%] [0.34%]
11
[100.00%] [0.13%]
13
[2.61%] [0.04%]
331
[70.43%] [0.95%]
201
[58.60%] [0.60%]
13,266
[37.99%] [37.45%]
12,623
[61.41%] [61.20%]
2,627
[32.04%] [32.00%]
53
[0.15%] [0.15%]
8,466
[24.51%] [24.18%]
7,271
[21.76%] [21.54%]

90
Table 3.17 Summary of classification rates for each method by industry, 1985-1999 In this table, I report the within-group classification accuracy rates for each method for each industry. I collect the observations from Standard and Poor’s Compustat Annual Research, Annual Industrial, and Full Coverage files from 1985-1999. All methods classify the distribution of 35,420 firm/years except Grice and Ingram, bond ratings, and the Altman models. Their sample sizes are 20,627, 8,210, 35,012, and 33,757 firm/years respectively. Although I do not report the error rates, type I error indicates the rate at which bankrupt firm/years pass the EPA’s financial tests in the year prior to bankruptcy with respect to only the bankrupt group. Type II error indicates the rate at which non-bankrupt firm/years fail the EPA’s financial tests with respect to only the non-bankrupt group. I exclude utilities and real estate because no association exists between any method and those industries. I remove services as only one method, the EPA’s financial tests, has an association with groups.
Method Agriculture Mining Construction Manufacturing Wholesale & Retail Trades
Transportation & warehousing
Information
Bankrupt Non-bankrupt
Bankrupt Non-bankrupt
Bankrupt Non-bankrupt
Bankrupt Non-bankrupt
Bankrupt Non-bankrupt
Bankrupt Non-bankrupt
Bankrupt Non-bankrupt
EPA’s financial tests
85.71 % 61.67 % 96.30 % 41.69 % 91.90% 68.04% 92.31% 59.54% 100.00% 53.26% 92.98% 52.66%
Grice and Ingram
60.00% 86.59% 62.70% 86.95% 38.33% 91.93% 67.65% 67.33%
Bond Ratings
100.00% 67.02%
Auditor Opinion
2.46% 99.92% 3.85% 99.72%
Z-Score Public
71.43% 71.51% 83.33% 44.65% 85.71% 83.24% 76.98% 84.07% 46.75% 88.29% 65.00% 61.87% 71.70% 69.29%
Z-Score Private
83.33% 62.36% 60.00% 86.59% 62.70% 86.95% 38.33% 91.93% 67.65% 67.33%

91
Table 3.18 Summary of overall classification rates by method, 1985-1999 I report the total number of observations per cell per method. I collect the observations from Standard and Poor’s Compustat Annual Research, Annual Industrial, and Full Coverage files from 1985-1999. All methods classify the distribution of 35,420 firm/years except Grice and Ingram, bond ratings, and the Altman models. Their sample sizes are 20,627, 8,210, 35,012, and 33,757 firm/years respectively. Beneath the total number of firm/year observations, I record the overall classification accuracy and inaccuracy for the overall percent classification with respect to the entire sample.
Method Classification Accuracy
Classification Inaccuracy
EPA GI Bond Auditor Z-Score public Z-Score private
22,115
[62.44%]
8,003 [38.79%]
5,583
[68.00%]
34,881 [98.48%]
26,407
[74.58%]
26,344 [77.50%]
13,305[37.56%]
12,624[61.21%]
2,672[32.00%]
539[1.52%]
8,605
[25.42%]
7,413[22.50%]

92
Table 4.1 Distribution of error rates for the EPA’s financial tests using varying levels of PP&E for closure costs, 1985-1999 I use a distribution of 35,420 firm/years (34,921 non-bankrupt firm/years and 499 bankrupt firm/years) from Standard and Poor’s Compustat Annual Research, Annual Industrial, and Full Coverage files from 1985-1999. I classify non-bankrupt and bankrupt firm/years as passing or failing the EPA’s financial test requirement for the overall sample and annually in the year prior to bankruptcy for each level of closure costs. I estimate closure costs to vary from one- to ten-percent of a firm’s net property, plant, and equipment. These rates represent the within-group classification accuracy. I report the type I and II error rates and p-value associated with these rates. The overall classification accuracy represents the classification with respect to the entire sample. Type I error indicates the rate at which bankrupt firm/years pass the EPA’s financial tests in the year prior to bankruptcy. I report the Chi-square statistic and corresponding p-value.
Level of closure costs by percent
Bankrupt correctly
classified
Non-bankrupt correctly
classified
Overall classification
accuracy
Type I error Type II error Chi-square P-value
1% 92.18% 62.01% 62.44% 7.82% 37.99% 608.8115 <0.00012% 92.38% 60.42% 60.97% 7.62% 39.58% 570.0417 <0.00013% 92.59% 58.99% 59.46% 7.41% 41.01% 538.1618 <0.00014% 92.79% 57.49% 57.99% 7.21% 42.51% 506.6590 <0.00015% 92.99% 55.87% 56.39% 7.01% 44.13% 474.8531 <0.00016% 92.99% 53.81% 54.36% 7.01% 46.19% 432.7134 <0.00017% 93.19% 51.20% 51.79% 6.81% 48.80% 387.8263 <0.00018% 93.59% 48.56% 50.20% 6.41% 51.44% 350.1671 <0.00019% 93.99% 46.08% 46.75% 6.01% 53.92% 318.4687 <0.000110% 94.19% 44.03% 44.73% 5.81% 55.97% 292.3238 <0.0001

93
Table 4.2 Distribution of classification rates for the EPA’s financial tests using varying levels of PP&E for closure costs by industry, 1985-1999
I use a distribution of 35,420 firm/years (34,921 non-bankrupt firm/years and 499 bankrupt firm/years) from Standard and Poor’s Compustat Annual Research, Annual Industrial, and Full Coverage files from 1985-1999. I classify firm/years as passing or failing the EPA’s financial test requirement for each level of closure costs. I estimate closure costs to vary from one to ten percent of a firm’s net property, plant, and equipment. For bankrupt firms, I use the data for the year prior to bankruptcy. I classify industries subject to EPA guidelines by two-digit North American Industrial Classification System (NAICS) code. The NAICS code identifies company activity. I consolidate the NAICS codes for wholesale trade (NAICS code 42) and retail trade (NAICS codes 44-45) into trade. I denote the industry sample size by N, the number of non-bankrupt firm/years within the industry by Nnb, and the number of bankrupt firm/years within the industry by Nb. I report the type I and II error rates and p-value associated with these rates. Type I error indicates the rate at which bankrupt firm/years pass the EPA’s financial tests in the year prior to bankruptcy. Type II error indicates the rate at which non-bankrupt firm/years fail the EPA’s financial tests. The correct classification and error rates relate to the within-group classification. I also report the overall classification accuracy for classification with respect to the entire sample. I report the two-sided Fisher exact p-values* in lieu of the Chi-square because the Chi-square may not provide accurate statistics as 25% of the cells have expected counts less than 5.

94
Table 4.2 Continued Distribution of classification rates for the EPA’s financial tests using varying levels of PP&E for closure costs by industry, 1985-1999
Industries subject to EPA guidelines
Level of closure
cost
Bankrupt correctly classified
Non-bankrupt correctly classified
Overall classification
accuracy
Type I error
Type II error
Fisher exact
p-value
Agriculture, Forestry, Fishing, and Hunting
1% 85.71% 61.67% 62.57% 14.29% 38.33% 0.0173
NAICS Code=11 2% 85.71% 61.11% 62.03% 14.29% 38.89% 0.0187 N=187 3% 85.71% 61.11% 62.03% 14.29% 38.89% 0.0187 Nnb=180 4% 85.71% 60.00% 60.96% 14.29% 40.00% 0.0216 Nb=7 5% 85.71% 57.78% 58.82% 14.29% 42.22% 0.0447 6% 85.71% 53.33% 55.14% 14.29% 46.67% 0.0570 7% 85.71% 52.22% 53.48% 14.29% 47.78% 0.0618 8% 85.71% 50.00% 51.34% 14.29% 50.00% 0.1189 9% 85.71% 46.11% 47.61% 14.29% 53.89% 0.1316 10% 85.71% 42.78% 44.39% 14.29% 57.22% 0.2420 Mining 1% 96.30% 41.69% 42.36% 3.70% 58.31% <0.0001 NAICS Code=21 2% 96.30% 34.27% 35.03% 3.70% 65.73% 0.0003 N= 2,224 3% 96.30% 29.86% 30.67% 3.70% 70.14% 0.0012 Nnb=2,197 4% 96.30% 26.04% 26.89% 3.70% 73.96% 0.0063 Nb=27 5% 96.30% 23.30% 24.19% 3.70% 76.70% 0.0109 6% 96.30% 20.16% 21.09% 3.70% 79.84% 0.0288 7% 100.00% 17.16% 18.16% 0.00% 82.84% 0.0092 8% 100.00% 14.11% 15.15% 0.00% 85.89% 0.0252 9% 100.00% 11.70% 12.77% 0.00% 88.30% 0.0650 10% 100.00% 9.65% 10.74% 0.00% 90.35% 0.1033

95
Table 4.2 Continued Distribution of classification rates for the EPA’s financial tests using varying levels of PP&E for closure costs by industry, 1985-1999
Industries subject to EPA guidelines
Level of closure
cost
Bankrupt correctly classified
Non-bankrupt correctly classified
Overall classificati
on accuracy
Type I error
Type II error
Fisher exact
p-value
Utilities 1% 100.00% 55.73% 53.45% 0.00% 44.27% 0.1964 NAICS Code=22 2% 100.00% 52.71% 52.76% 0.00% 47.29% 0.2240 N=2,028 3% 100.00% 50.35% 50.40% 0.00% 49.65% 0.2469 Nnb=2,026 4% 100.00% 48.72% 48.77% 0.00% 51.28% 0.5001 Nb=2 5% 100.00% 46.00% 46.06% 0.00% 54.00% 0.5030 6% 100.00% 38.70% 38.76% 0.00% 61.30% 0.5255 7% 100.00% 24.93% 25.00% 0.00% 75.07% 1.0000 8% 100.00% 13.38% 13.46% 0.00% 86.62% 1.0000 9% 100.00% 5.73% 5.82% 0.00% 94.27% 1.0000 10% 100.00% 3.06% 3.16% 0.00% 96.94% 1.0000 Construction 1% 85.71% 42.90% 43.76% 14.29% 57.10% 0.2461 NAICS Code=23 2% 85.71% 42.61% 43.45% 14.29% 57.39% 0.2461 N=359 3% 85.71% 40.91% 41.78% 14.29% 59.09% 0.2489 Nnb=352 4% 85.71% 40.06% 40.95% 14.29% 59.94% 0.2518 Nb=7 5% 85.71% 39.49% 40.39% 14.29% 60.51% 0.2543 6% 85.71% 39.20% 40.11% 14.29% 60.80% 0.2557 7% 85.71% 38.07% 39.00% 14.29% 61.93% 0.2624 8% 85.71% 36.65% 37.60% 14.29% 63.35% 0.4294 9% 85.71% 33.52% 34.54% 14.29% 66.48% 0.4325 10% 85.71% 30.97% 32.03% 14.29% 69.03% 0.6806

96
Table 4.2 Continued Distribution of classification rates for the EPA’s financial tests using varying levels of PP&E for closure costs by industry, 1985-1999
Industries subject to EPA guidelines
Level of closure
cost
Bankrupt correctly classified
Non-bankrupt correctly classified
Overall classificati
on accuracy
Type I error
Type II error
Fisher exact
p-value
Manufacturing 1% 91.90% 68.04% 68.36% 8.10% 31.96% <0.0001 NAICS Code=31-33 2% 92.25% 67.20% 67.54% 7.75% 32.80% <0.0001 N=20,948 3% 92.61% 66.26% 66.62% 7.39% 33.74% <0.0001 Nnb=20,664 4% 92.96% 65.12% 65.50% 7.04% 34.88% <0.0001 Nb=284 5% 93.31% 63.74% 64.14% 6.69% 36.26% <0.0001 6% 93.31% 62.26% 62.68% 6.69% 37.74% <0.0001 7% 93.31% 60.44% 60.89% 6.69% 39.56% <0.0001 8% 93.31% 58.46% 58.94% 6.69% 41.54% <0.0001 9% 94.01% 56.40% 56.91% 5.99% 43.60% <0.0001 10% 94.37% 54.19% 54.73% 5.63% 45.81% <0.0001 Wholesale and Retail Trade
1% 92.31% 59.54% 60.16% 7.69% 40.46% <0.0001
NAICS Code=42-45 2% 92.31% 58.95% 59.60% 7.69% 41.05% <0.0001 N=4,037 3% 92.31% 57.89% 58.55% 7.69% 42.11% <0.0001 Nnb=3,959 4% 92.31% 56.48% 57.17% 7.69% 43.52% <0.0001 Nb=78 5% 92.31% 55.17% 55.88% 7.69% 44.83% <0.0001 6% 92.31% 53.73% 54.47% 7.69% 46.27% <0.0001 7% 92.31% 52.24% 53.01% 7.69% 47.76% <0.0001 8% 92.31% 50.69% 51.53% 7.69% 49.31% <0.0001 9% 92.31% 48.65% 49.52% 7.69% 51.35% <0.0001 10% 92.31% 47.26% 48.16% 7.69% 52.74% <0.0001
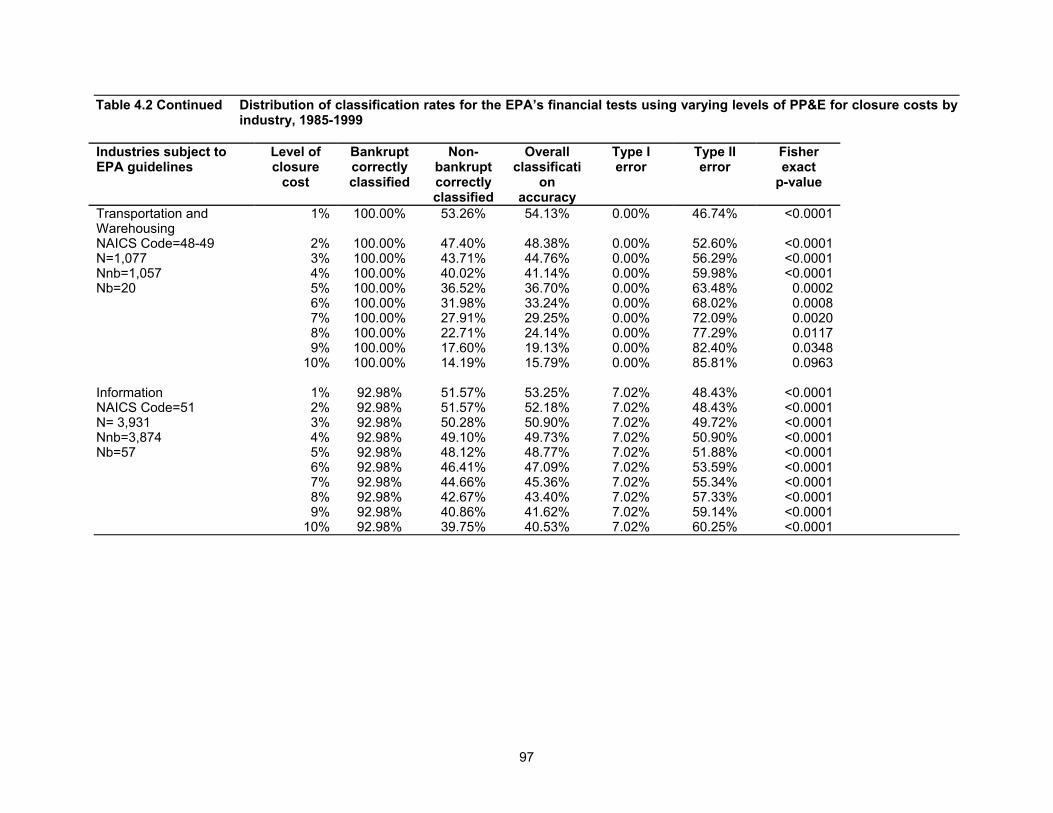
97
Table 4.2 Continued Distribution of classification rates for the EPA’s financial tests using varying levels of PP&E for closure costs by industry, 1985-1999
Industries subject to EPA guidelines
Level of closure
cost
Bankrupt correctly classified
Non-bankrupt correctly classified
Overall classificati
on accuracy
Type I error
Type II error
Fisher exact
p-value
Transportation and Warehousing
1% 100.00% 53.26% 54.13% 0.00% 46.74% <0.0001
NAICS Code=48-49 2% 100.00% 47.40% 48.38% 0.00% 52.60% <0.0001 N=1,077 3% 100.00% 43.71% 44.76% 0.00% 56.29% <0.0001 Nnb=1,057 4% 100.00% 40.02% 41.14% 0.00% 59.98% <0.0001 Nb=20 5% 100.00% 36.52% 36.70% 0.00% 63.48% 0.0002 6% 100.00% 31.98% 33.24% 0.00% 68.02% 0.0008 7% 100.00% 27.91% 29.25% 0.00% 72.09% 0.0020 8% 100.00% 22.71% 24.14% 0.00% 77.29% 0.0117 9% 100.00% 17.60% 19.13% 0.00% 82.40% 0.0348 10% 100.00% 14.19% 15.79% 0.00% 85.81% 0.0963 Information 1% 92.98% 51.57% 53.25% 7.02% 48.43% <0.0001 NAICS Code=51 2% 92.98% 51.57% 52.18% 7.02% 48.43% <0.0001 N= 3,931 3% 92.98% 50.28% 50.90% 7.02% 49.72% <0.0001 Nnb=3,874 4% 92.98% 49.10% 49.73% 7.02% 50.90% <0.0001 Nb=57 5% 92.98% 48.12% 48.77% 7.02% 51.88% <0.0001 6% 92.98% 46.41% 47.09% 7.02% 53.59% <0.0001 7% 92.98% 44.66% 45.36% 7.02% 55.34% <0.0001 8% 92.98% 42.67% 43.40% 7.02% 57.33% <0.0001 9% 92.98% 40.86% 41.62% 7.02% 59.14% <0.0001 10% 92.98% 39.75% 40.53% 7.02% 60.25% <0.0001

98
Table 4.2 Continued Distribution of classification rates for the EPA’s financial tests using varying levels of PP&E for closure costs by industry, 1985-1999
Industries subject to EPA guidelines
Level of closure
cost
Bankrupt correctly classified
Non-bankrupt correctly classified
Overall classificati
on accuracy
Type I error
Type II error
Fisher exact
p-value
Real Estate, Rental, and Leasing
1% 100.00% 47.67% 51.80% 0.00% 52.33% 0.4990
NAICS Code=53 2% 100.00% 47.67% 48.21% 0.00% 52.33% 0.4990 N=195 3% 100.00% 43.52% 44.11% 0.00% 56.48% 0.5071 Nnb=193 4% 100.00% 36.79% 37.44% 0.00% 63.21% 0.5345 Nb=2 5% 100.00% 26.42% 27.18% 0.00% 73.58% 1.0000 6% 100.00% 21.24% 22.06% 0.00% 78.76% 1.0000 7% 100.00% 15.54% 16.41% 0.00% 84.46% 1.0000 8% 100.00% 13.47% 14.36% 0.00% 86.53% 1.0000 9% 100.00% 10.88% 11.80% 0.00% 89.12% 1.0000 10% 100.00% 9.84% 10.77% 0.00% 90.16% 1.0000 Services 1% 80.00% 49.16% 55.76% 20.00% 50.84% 0.0339 NAICS Code=54 2% 80.00% 49.16% 50.23% 20.00% 50.84% 0.0339 N=434 3% 80.00% 46.06% 47.23% 20.00% 53.94% 0.0629 Nnb=419 4% 80.00% 42.48% 43.77% 20.00% 57.52% 0.1101 Nb=15 5% 80.00% 40.10% 41.47% 20.00% 59.90% 0.1777 6% 80.00% 38.66% 40.09% 20.00% 61.34% 0.1811 7% 80.00% 37.71% 39.17% 20.00% 62.29% 0.1865 8% 86.67% 36.28% 38.02% 13.33% 63.72% 0.0974 9% 86.67% 34.84% 36.64% 13.33% 65.16% 0.1006 10% 86.67% 32.70% 34.57% 13.33% 67.30% 0.1599

99
Table 4.3 Panel A Mean and median financial measures for firms subject to the EPA’s financial tests, 1985-1999 I use a distribution of 35,420 firm/years (34,921 non-bankrupt firm/years and 499 bankrupt firm/years) from Standard and Poor’s Compustat Annual Research, Annual Industrial, and Full Coverage files from 1985-1999. I report the mean and median measures in millions of U.S. dollars for the components of the financial measures used in the EPA’s financial test criteria for the overall sample. I include the measures for non-bankrupt and bankrupt firms and for each of the industries represented in my sample. I estimate closure costs to be one percent of a firm’s net property, plant, and equipment. These closure costs incorporate the six times multiple required by the financial tests. I test the differences in means and medians between the two groups. For the test between means, I assume unequal because I find the p-values for the F-statistics for testing the equality of variances are less than 0.0001. For the test between medians, I report the p-value from the median test.

100
Table 4.3 Panel A Mean and median financial measures for firms subject to the EPA’s financial tests, 1985-1999
Ratios Overall Bankrupt Non-bankrupt p-value Mean Median Mean Median Mean Median Means Median
Ratio #1: Total liabilities/Net worth 1.853 1.032 1.466 0.974 1.858 1.032 <0.0001 0.8218 Ratio #2: Net income plus depreciation, depletion, and amortization/Total liabilities 0.565 0.500 -0.709 -0.125 0.584 0.506 <0.0001 <0.0001 Ratio #3: Current ratio 2.808 1.923 1.891 1.047 2.821 1.937 <0.0001 <0.0001 Tangible net worth $457.06 $53.73 $7.72 $1.22 $463.48 $55.81 <0.0001 <0.0001 Net working capital $95.55 $20.16 $2.81 $0.09 $96.88 $20.92 <0.0001 <0.0001 Total assets $1206.49 $118.48 $48.16 $7.00 $1223.04 $122.75 <0.0001 <0.0001 Total liabilities $750.01 $53.67 $40.50 $5.75 $760.11 $55.76 <0.0001 <0.0001 Net PP&E $585.77 $30.45 $13.49 $1.48 $593.95 $31.70 <0.0001 <0.0001

101
Table 4.3 Continued Panel B Mean and median financial measures for firms subject to the EPA’s financial tests by industry, 1985-1999
Ratios Agriculture, Forestry, Fishing,
and Hunting Mining Utilities
Mean Median Mean Median Mean Median Ratio #1: Total liabilities/Net worth 1.909 0.858 1.063 0.864 4.680 1.878 Ratio #2: Net income plus depreciation, depletion, and amortization/Total liabilities
0.096 0.211 1.903 0.958 0.585 0.559
Ratio #3: Current ratio 3.717 1.982 2.530 1.271 1.031 0.880 Tangible net worth $166.63 $30.86 $221.81 $35.98 $1078.08 $406.90 Net working capital $76.07 $14.93 $34.90 $2.22 $-71.79 $-7.96 Total assets $396.80 $45.20 $608.77 $84.46 $3253.56 $1184.05 Total liabilities $230.17 $16.85 $386.96 $36.76 $2179.61 $777.32 Net PP&E $191.14 $12.99 $412.61 $54.91 $2344.72 $871.44

102
Table 4.3 Continued Panel B Mean and median financial measures for firms subject to the EPA’s financial test by industry, 1985-1999
Ratios Construction Manufacturing Wholesale and Retail Trade
Mean Median Mean Median Mean Median Ratio #1: Total liabilities/Net worth
3.954 1.444 1.740 0.888 2.146 1.297
Ratio #2: Net income plus depreciation, depletion, and amortization/Total liabilities
0.922 0.266 0.497 0.539 0.440 0.309
Ratio #3: Current ratio 2.101 1.557 3.176 2.220 2.373 1.791 Tangible net worth $93.40 $19.79 $434.17 $50.14 $235.51 $46.82 Net working capital $34.71 $10.21 $134.45 $30.65 $114.20 $28.32 Total assets $278.56 $52.15 $1077.81 $101.35 $631.19 $121.08 Total liabilities $185.16 $30.66 $644.26 $41.82 $395.49 $64.75 Net PP&E $76.57 $13.11 $432.61 $24.16 $225.29 $23.50

103
Table 4.3 Continued Panel B Mean and median financial measures for firms subject to the EPA’s financial tests by industry, 1985-1999
Ratios Transportation and
Warehousing Information Real Estate, Rental, and
Leasing Services
Mean Median Mean Median Mean Median Median Median Ratio #1: Total liabilities/Net worth
1.840 1.647 1.151 0.840 1.929 1.511 0.006 0.946
Ratio #2: Net income plus depreciation, depletion, and amortization/Total liabilities
0.577 0.465 0.264 0.367 1.329 0.593 0.349 0.378
Ratio #3: Current ratio 1.715 1.183 2.691 1.691 1.627 1.260 3.278 1.745 Tangible net worth $618.89 $101.81 $657.78 $40.07 $210.17 $28.75 $243.47 $33.36 Net working capital $32.65 $5.44 $45.08 $11.24 $17.44 $2.48 $6.80 $7.59 Total assets $1886.13 $276.84 $1776.65 $97.81 $681.03 $103.66 $767.70 $55.23 Total liabilities $1267.24 $161.66 $1119.64 $40.91 $470.86 $52.78 $524.23 $21.06 Net PP&E $1344.73 $139.13 $849.12 $13.78 $434.61 $54.95 $390.13 $12.27

104
APPENDIX A: MAJOR ENVIRONMENTAL CATASTROPHES
This appendix serves to provide further explanation and anecdotal evidence for the relevance,
importance, and urgency of this topic. A brief summary of three environmental catastrophes that
occurred in the United States provides illustration of the environmental and financial devastation that may
result from certain environmental obligations. Following the summaries is a list of articles from the
popular trade press and the Wall Street Journal that address current environmental issues, in particular
the financial distress and pending bankruptcies of firms with environmental obligations. These
environmental obligations not only include environmental catastrophes but also any costs related to the
environment, meaning the financial condition of the firm and potential default on the fulfillment of
environmental obligations is a concern.
Major Environmental Catastrophes
Love Canal, Three Mile Island, and the Exxon-Valdez oil spill are some of the worst and most
visible environmental catastrophes to occur in the U.S.84
The municipality of Niagara Falls in New York,
bought the Love Canal in the 1920s and used it as a landfill.85
Hooker Chemical Company (HCC), a
subsidiary of Occidental Chemical Corporation (OCC), acquired the site and operated it for approximately
13 years until its sale to the Niagara Falls School Board. During those years of operation, HCC buried
approximately 22,000 tons of hazardous chemical waste in the 20-acre site area. Complaints concerning
problems the inhabitants around the site were experiencing went unaddressed for over two decades. In
1980, the Love Canal was a national emergency site, and the people in the surrounding area were
relocated pending further investigation. Jimmy Carter appointed the Ecumenical Task Force (ETF) to test
and to document the contamination, and testing continued from 1980-1991.
The tests included testing the pollution level, testing the habitability of the land, and studying the
effects on genetics. All tests yielded similar results. The land was severely polluted and unfit for human
habitation. Furthermore, investigators found substantiation of genetic mutation. According to the New
York Department of Environmental Conservation, the state has paid $800 million in the cleanup process,
and OCC has paid $2.6 billion.
84
To date, remediation and reclamation is incomplete at these sites. Additionally, remediation requirements have been compromised, as companies have asked and been granted reductions in fulfilling the initial requirements. 85
Ecumenical Task Force of the Niagara Frontier Love Canal Collection (1988), University Archives, University Libraries, State University of New York at Buffalo: http://ublib.buffalo.edu/libraries/projects/lovecanal/.

105
On March 28, 1979, Three Mile Island Nuclear Reactor Unit Two experienced almost complete
meltdown in Harrisburg, Pennsylvania.86
The malfunction of Unit 2 was due to multiple human errors in
succession, resulting in several releases of radiation gas into the atmosphere and contaminated water
into the Susquehanna River. Studies show that while each error was avoidable and reversible at the time
of occurrence, because the undetected and uncorrected errors persisted, a partial meltdown occurred.
Taxpayers paid $700 million for the construction of Unit 2, and it was online for only 90 days before the
accident. Taxpayers were again responsible for the decommissioning costs, estimated at $433 million.
In 1996, a judge dismissed a lawsuit with over 2000 personal injury claims against the owner, General
Public Utilities, stating the plaintiffs did not prove the necessary link between the causes of any illness
and radioactive contamination.
On March 24, 1989, the Exxon-Valdez oil tanker dumped almost 11 million gallons of crude oil
into the waterway of Prince William Sound, Alaska, after running aground on Bligh Reef.87
The state of
Alaska commissioned several economic impact reports that estimated the impact of the contamination on
the tourism industry, fish and wildlife resources, and the fishing industry. Although these reports only
provide preliminary estimates, Exxon is currently in litigation, contesting additional damages assessed
because of the underestimation of the true costs of restitution.
Exxon’s fine reduced from $150 million to $25 million to reflect its cleanup efforts. Exxon divided
the $25 million paid between an environmental fund and a victim fund. Exxon is also required to pay
$100 million in restitution for the loss of fish and wildlife. It will also pay a civil settlement of $900 million
over 10 years. Various state environmental funds share the monies. Exxon paid approximately $2.3
billion in cleanup costs; however, remediation is not complete, and the wildlife is difficult to replenish.
86
This information is from the 20th Anniversary of the TMI Accident Press Packet issued by the Three
Mile Island Alert Organization. Nuclear Reaction: Why Do Americans Fear Nuclear Power? Three Mile Island - The Judge’s Ruling. PBS FRONTLINE Special Report: http://www.pbs.org/wgbh/pages/frontline/shows/reaction/readings/ 87
Exxon-Valdez Oil Spill Trustee Council, http://www.oilspill.state.ak.us/.

106
Table A.1 Summary of articles from trade and popular press
Source Date Firm State Hazard Total
Estimated Liability
Spokane Spokesman-Review
10/25/2002 Kaiser
Aluminum
Washington, California,
Rhode Island
Polychlorinated biphenyl clean up and Superfund clean up
$74 million
The St. Petersburg Times
07/06/2003 Mulberry Corporation
Florida
Abandoned phosphate mines and phosphogypsum stacks
$140 million
The Associated Press State &Local Wire
04/15/2003 Metachem Products
Delaware
Abandoned factory filled with chemicals and used equipment
$75 million
The News Tribune
01/31/2003 Asarco Mining
Washington Abandoned mines and acid mine drainage
$1 billion
Platt’s Coal Outlook and The Philadelphia Inquirer
01/02 /2003 09/26/2002
Bethlehem Steel, Beth Energy Mines, LTV Steel, and Mon View
Pennsylvania Abandoned mines, acid mine drainage, illegal dumping
$5 billion initially + $53 million annually
The Palm Beach Daily Business Review
10/29/2002 Pan Am Florida Contamination at Miami-Dade County Airport
$200 million
Greenwire 10/18/2002 Safety-Kleen South Carolina
Hazardous waste - landfill
$1 billion
The Associated Press State & Local Wire
September 6, 2002
W.R. Grace & Co
Montana Asbestos + $1 billion
The Salt Lake Tribune
June 7, 2002
Magnesium Corporation of America
Utah Mining contamination - vermiculite
$1 billion
The Associated Press State & Local Wire
May 9, 2002
Enron Texas Hazardous Waste – leaking oil pipelines
$15 million

107
REFERENCES
Alciatore, Mimi, Carol Callaway Dee, and Peter Easton, 2004, Accounting for asset retirement
obligations, working paper, Florida State University, 1-44. Allison, Paul, 1999, Logistic regression using the SAS system: Theory and application, SAS Institute,
Cary, North Carolina. Altman, Edward, 1968, Financial ratios, discriminant analysis and the prediction of corporate bankruptcy,
The Journal of Finance, 23, 589-609. Altman, Edward, Robert Haldeman, and Paul Narayanan, 1977, Zeta analysis: A new model to identify
bankruptcy risk of corporations, Journal of Banking and Finance, 1, 29-54. Altman, Edward, 1993, Corporate financial distress and bankruptcy: A complete guide to predicting and
avoiding distress and profiting from bankruptcy 2nd
Edition, John Wiley & Sons, Inc., New York. Anez, Bob, 2002, McGrath: State must file Grace claims in bankruptcy court, The Associated Press State
& Local Wire, September 6. Barth, Mary E., 1991, Relative measurement errors among alternative pension asset and liability
measures, The Accounting Review, 66 (3), 433-463. Barth, Mary E; William H. Beaver; Christopher H. Stinson, 1991, Supplemental data and the structure of
thrift share prices, The Accounting Review, 66 (1), 56-66. Barth, Mary E., 1994, Fair value accounting: evidence from investment securities and the market
baluation of banks, The Accounting Review, 69 (1), 1-25. Beaver, William; Carol Eger; Stephen Ryan; and Mark Wolfson, 1989, Financial reporting, supplemental
disclosures, and bank share prices, Journal of Accounting Research, 27 (2), 157-178. Barry, John, Barry Bergman, Kathryn Hohmann, and Becky Steckler, 1997, Take more money and run:
will money and politics in the senate have environmental consequences? A report compiled for The Environmental Working Group, The Tides Center, and the Sierra Club, 1-39.
Barth, Mary E.; William H. Beaver; and Wayne R. Landsman, 1996, Value-relevance of banks' fair value
disclosures under SFAS No. 107, The Accounting Review, 71 (4), 513-537. Barth, Catherine, 1994, EPA runs “CERCLAs” around bankruptcy law: In re CMC Heartland partners,
Villanova Environmental Law Journal, 5 (1), 1-32. Barth, Mary E., and Maureen F. McNichols, 1994, Estimation and market valuation of environmental
liabilities relating to superfund sites, The Journal of Accounting Research, 32, 177-209.

108
Beaver, William, 1966, Financial ratios as predictors of failure, The Journal of Accounting Research, 4, 71-111.
Beaver, William, 1968, Market prices, financial ratios, and the prediction of failure, The Journal of
Accounting Research, 6 (2), 179-192. Begley, Joy, Jin Ming, and Susan Watts, 1996, Bankruptcy classification errors in the 1980’s: An
empirical analysis of Altman’s and Ohlson’s models, Review of Accounting Studies, 1, 267-284. Bergmann, Karyn S., 2004, Bankruptcy, limited liability and CERCLA: Closing the loophole and parting
the veil, accepted and working research paper series number 2004-02, University of Maryland School of Law, SSRN working paper #503143.
Bhargava, Mukesh, Chris Dubelaar, and Thomas Scott, 1998, predicting bankruptcy in the retail sector:
an examination of the validity of key measures of performance, Journal of Retailing and Consumer Services, 5, 105-117.
Bloom, Michael A., 1995, Bankruptcy’s fresh start vs. environmental clean up: Statutory schizophrenia,
Villanova Environmental Law Journal, 6 (1), 1-13. Blumenthal, Les and Susan Gordon, 2003, Asarco, feds seal deal: Company can sell assets, pay
creditors, create trust fund for cleanup - and survive, The News Tribune, January 31, A01. Boehmer, Ekkehart, John Paul Broussard, Juha-Pekka Kallunki, 2002, Using SAS in financial research,
SAS Institute Inc., Cary, North Carolina. Boritz, J. Efrim, Duane Kennedy, and Jerry Sun, 2003, Predicting business failures in Canada, SSRN
working paper. Boyd, James W., 1993, Liability and potential insolvency, doctoral dissertation, University of
Pennsylvania, 1-232. Boyd, James W., 2001a, Financial responsibility for environmental obligations: Are bonding and
assurance rules fulfilling their promise? Discussion paper 01-42, Resources for the Future, Washington, D.C., 1-67.
Boyd, James W., 2001b, Financial assurance rules and natural resource damage liability: a working
marriage? Discussion paper 01-11, Resources for the Future, Washington, D. C., 1-58. Brickley, Peg, 1997, Cigna court ruling alarms Michigan, Michigan opposes Cigna Corp.'s plan to transfer
asbestos and environmental liabilities to separate firm, Philadelphia Business Journal, 16 (4), 3. Buschena, D. E., T. L. Anderson, and J. L. Leonard, 2001, Valuing non-marketed goods: The case of elk
permit lotteries, Journal of Environmental Economics and Management, 41(1), 33-43. Campbell, Katherine, Stephan E. Sefcik, and Naomi S. Soderstrom, 2001, Disclosure of private
information and reduction of uncertainty: Environmental liabilities in the chemical industry, working paper.
Carcello, Joseph and Terry Neal, 2003, Audit committee independence and disclosure: Choice for
financially distressed firms, Corporate Governance, 11 (4), 289-299. Chang, Joseph, 1998, Grace's new $1.5 bn incarnation is off to a flying start in m&as, Chemical Market
Reporter, 253 (14), 1. Chang, Joseph, 2003, Solutia files chapter 11 bankruptcy, Chemical Market Reporter, 264 (22), 2.

109
Cieri, Richard M., Lyle G Ganske, and Heather Lennox, 1999, Breaking up is hard to do: Avoid the solvency-related pitfalls in spin off transactions, The Business Lawyer, 54 (2), 533-605.
Cody, Ronald P. and Jeffrey K. Smith, 1997, Applied statistics and the SAS programming language, 4
th
edition, Prentice Hall Inc., Upper Saddle River, New Jersey. Coller, Maribeth, and Glenn W. Harrison, 1995, On the use of the contingent valuation method to
estimate environmental costs, Advances in Accounting, 35, 169-193. Copeland, Claudia, 1997, Environmental policy: Issues in federal-state relations, Congressional
Research Service Report for Congress, 97-689. Cropper, Maureen L., and Wallace E. Oates, 1992, Environmental Economics: A Survey, The Journal of
Economic Literature, 30, 675-740. Cross, Frank B., and Roger LeRoy Miller, 2001, West’s legal environment of business: Text, cases,
ethical, regulatory, international, and e-commerce issues, 4th Edition, West Legal Studies in
Business, Division of Thomson Learning, Cincinnati, Ohio, Chapters 1,6, and 25. Cummings, Ronald G., and Glenn W. Harrison, 1994, Was the Ohio court well informed in its assessment
of the accuracy of the contingent valuation method? Natural Resources Journal, 3, 1-36. Cummings, Ronald G., Glenn W. Harrison, and E. Elisabet Rutstrom, 1995, Homegrown values and
hypothetical surveys: Is the dichotomous choice approach incentive-compatible? The American Economic Review, 85, 260-266.
Cunningham, Laurie, 2002, Miami-Dade tells appeals court it has right to go after insurers over Pan Am
pollution, The Palm Beach Daily Business Review, 49 (47), October 29, A1 Deegan, Michaela and Craig Rankin, 1999, The environmental reporting expectations gap: Australian
evidence, British Accounting Review, 31, 313-346. Depree, Chauncey M. and Rebecca K. Jude, 1995, Coping With environmental and tort claims,
Management Accounting, 76, 27-31. Dioxin: Michigan, Dow propose deal that could limit Dow’s cleanup liability, The Greenwire, December
18, 2002. Eanes, Joe B., and Candy Price, 2000, Arranging coverage for hazardous cargo, American Agent &
Broker, 72 (8), 33-42. Environmental Protection Agency Enforcement and Compliance Study Results for 2001, January 31,
2002. Fahys, Judy, 2002, MagCorp deal makes EPA worry: Waste cleanup in question as plant sold, bought
back: EPA hopes to make MagCorp pay $1b penalty, The Salt Lake Tribune, June 7, A1. The Federal Register, 61, p. 9274, March 7, 1996. The Federal Register, 66 (6), p. 1725-1748, January 9, 2001. The Federal Register, 66 (198), p. 52192-52268, October 12, 2001. The Federal Register, 67 (96), p. 35070-35073, May 17, 2002. The Federal Register, 67 (107), p. 38427-38431, June 4, 2002.

110
Ferreira, D.F., and S.B. Suslick, 2001, Identifying potential impacts of bonding instruments on offshore oil projects, Resources Policy, 27, 43-52.
The Financial Accounting Standards Board Statement No. 143: Accounting for Asset Retirement
Obligations, issued June 2001. Fix, Peter and John Loomis, 1998, Comparing the economic value of mountain biking estimated using
revealed and stated preference, Journal of Environmental Planning and Management, 41(2), 227-236.
Freeman, Paul K. and Howard Kunreuther, 1996, The roles of insurance and well-specified standards in
dealing with environmental risks, Managerial and Decision Economics, 17, 517-530. Frydman, Halina, Edward Altman, and Duen-Li Kao, 1985, Introducing recursive partitioning for financial
classification: The case of financial distress, The Journal of Finance, 40, 269-291. Geiger, Marshall and Kannan Raghunandan, 2002, Auditor tenure and audit reporting failures, Auditing:
A Journal of Practice & Theory, 21 (1), 67-78 Gerard, David, 2000, The law and economics of reclamation bonds, Resources Policy, 26, 189-197. Grice, Stephen 2000. Bankruptcy prediction models and going concern audit opinions before and after
SAS 59, B Quest: A Journal of Applied Topics in Business and Economic, http://www.westga.edu/~bquest/2000/bankrupt.html
Grice, John Stephan, and Robert W. Ingram, 2001, Tests of the generalizability of Altman’s bankruptcy
prediction model, Journal of Business Research, 54, 53-61. Gron, Anne, and Andrew Winton, 2001, Risk overhang and market behavior, The Journal of Business,
74, 591-612. Harris, Trevor S. and James A. Ohlson, 1987, Accounting disclosures and the market's valuation of oil
and gas properties, The Accounting Review, 62 (4), 651-670. Harris, Trevor S. and James A. Ohlson 1990, Accounting disclosures and the market's valuation of oil
and gas properties: Evaluation of market efficiency and functional fixation, The Accounting Review 65 (4), 764-780.
Harrison, Glenn W., and James C. Lesley, 1996, Must contingent valuation surveys cost so much?
Journal of Environmental Economics and Management, 31(1), 79-95. Hazwaste: Safety-Kleen to pay $1.4 m for S.C. landfill cleanup, Greenwire, 10 (9), October 18, 2002. Heyes, Anthony, 1998, Making things stick: Enforcement and compliance, Oxford Review of Economic
Policy, 14, 50-63. Hill, H. Hamner, 1998, Bankruptcy vs. environmental protection: A case study in normative conflict,
Canadian Journal of Law and Jurisprudence, 11, 245-276. Hite, Diane, Weh Shyong Chern, Fred Hitzhusen, and Alan Randall, 2001, Property value impacts of an
environmental disamenity, The Journal of Real Estate, Finance, and Economics, 22, 1-22. ICF Consulting Group for the EPA, Analysis of subtitle c and d financial tests with multiple sections
disseminated from July 14, 1995, to December 9, 1997. Jain, Bharat, and Barin Nag, 1997, Performance evaluation of neural network decision models, Journal of
Management Information Systems, 14, 201-216.

111
Jones, Frederick, 1996, The information content of the auditor going concern evaluation, Journal of Accounting and Public Policy, 15, 1-27.
Katzman, Martin T., 1988, Pollution liability insurance and catastrophic environmental risks, The Journal
of Risk and Insurance, 55, 75-100. Kelly, Dennis, 2004, Judge approves Halliburton-Equitas $575 million asbestos settlement. BestWire,
Pittsburgh, Pennsylvania, March 11, A.M. Best Company, Inc. Klassen, Robert D., and Curtis P. McLaughlin, 1996, The impact of environmental management on firm
performance, Management Science, 42 (8), 1199-1214. Lachenmayr, Andrea, Anne M. Lockner, Brian C. Olson, and Carolyn Wolpert, 1998, Environmental
crimes, American Criminal Law Review, 35, 597-671. Lacher, R.C.., Pamela K. Coats, Shankar C. Sharma, and L. Franklin Fant, 1995, A neural network for
classifying the financial health of a firm, European Journal of Operational Research, 85, 53-65. Landsman, Wayne, 1986, An empirical investigation of pension fund property rights, The Accounting
Review, 61 (4)., 662-691. Larson, Bruce A., 1996, Environmental policy based on strict liability: Implications of uncertainty and
bankruptcy, Land Economics, 72, 33-42. Lee, Kun Chang, Ingoo Han, and Youngsig Kwon, 1996, Hybrid neural network models for bankruptcy
predictions, Decision Support Systems, 18, 63-72. Lowrance, Sylvia, 1992, Clarification of EPA policy an authorizing incomplete or late "clusters" under 40
C.F.R. 271.21 and availability of public information under RCRA section 3000 (f), EPA memorandum to Hazardous Waste Management Division Directors, November 6, 1922.
MacMinn, Richard D., and Patrick L. Brockett, 1995, Corporate spin-offs as a value enhancing technique
when faced with legal liability, Insurance: Mathematics and Economics, 16, 63-68. Matsumura, Ella Mae, K. Subramanyam, and Robert Tucker 1997, Strategic auditor behavior and going-
concern judgments, Journal of Business Finance and Accounting, 24 (6), 727-758. McGraw, Patricia Anne, 1998, Changing contracts: The impact of lender environmental liability on
secured debt, corporate financing, and public policy, Ph.D. dissertation, Dalhousie University, Canada.
McGuire, Jean B., Alison Sundgren, and Thomas Schneeweis, 1988, Corporate social responsibility and
firm financial performance, The Academy of Management Journal, 31 (4), 854-872. McKeown, J.C., Mutchler, J.F. and Hopwood, W., 1991, Towards an explanation of auditor failure to
modify the audit opinions of bankrupt companies, Auditing: A Journal of Practice and Theory, 10, 1-13.
Mekeel, Tim, 2004, Shareholders approve new plan to dissolve Lancaster, Pa. based flooring firm,
Lancaster New Era, Lancaster, Pennsylvania, January 8, Knight Ridder/Tribune Business News. Menell, Peter S., 1991, The limitations of legal institutions for addressing environmental risks, The
Journal of Economic Perspectives, 5, 93-113. Melcer, Rachel, 2003, Town and country, Mo.-based spin-off turns to Monsanto for financial help, Knight
Ridder Tribune Business News, Washington, December 7.

112
Meltz, Robert, 1999, Preemption language in federal environmental statutes, Congressional Research Service (CRS) Report for Congress, National Council for Science and the Environment, 1725 K Street, Suite 212, Washington, DC 20006.
Metachem equipment sale to offset cleanup cost, most goes to creditors, The Associated Press State
&Local Wire, April 15, 2003. Morse, Andrew, 2004, Sins of the father, The Deal.com, New York, 1. Mutchler, Jane, 1985, A multivariate analysis of the auditor’s going-concern opinion decision, Journal of
Accounting Research, 23 (2), 668-682. Mutchler, J.F., Hopwood, W., and McKeown, J.C., 1997, The influence of contrary information and
mitigating factors on audit opinion decisions on bankrupt companies, Journal of Accounting Research, 35 (2), 295-310.
Meyer, Peter B. and Thomas S Lyons, 2000, Lessons from private sector brownfield redevelopers,
American Planning Association, Journal Of The American Planning Association, 66 (1), 46- 57. Nelson, Karen K., 1996, Fair value accounting for commercial banks: An empirical analysis of SFAS no.
107, The Accounting Review, 71 (2), 161-182. Nuclear Reaction: Why do Americans fear nuclear power? Three Mile Island: The judge’s ruling. PBS
FRONTLINE Special Report: http://www.pbs.org/wgbh/pages/frontline/shows/reaction/readings/ Ohio v. Kovacs, 717 F.2d 984, 6
th Circuit court, 1983.
Olmeda, Ignacio, and Eugenio Fernandez, 1997, Hybrid classifiers for financial multicriteria decision
making: The case of bankruptcy prediction, Computational Economics, 10, 317-335. Ohlson, J. S., 1980, Financial ratios and the probabilistic prediction of bankruptcy, Journal of Accounting
Research, 19, 109-131. Pakulski, Gary, 2004, Creditors seek more weight in Owens-Corning case, The Blade, Toledo, Ohio,
Knight Ridder/Tribune Business News, May 27. PDEP looks for ways to deal with bankruptcies and AMD, Platt’s Coal Outlook, 27 (2), January 13, 2003,
8 Penn Terra Limited v. Department of Environmental Resources, Commonwealth of Pennsylvania, 733
F.2d 267, Third Circuit court, 1984. Pennsylvania Department of Environmental Protection: Advisory Board to Make Recommendations on
Treating Orphan Mine Discharges Resulting From Bankruptcies; First Meeting Will be Jan. 9, PR Newswire, January 2, 2003.
Pittman, Craig, Julie Hauserman, and Candace Rondeaux, 2003, A $140 million mess, The St.
Petersburg Times, July 6. Porter Wright Morris & Arthur LLP, 2002, Groups urge SEC to require environmental disclosure, The Ohio
Law Letter, 12 (12). Lee Smith Publishers and Printers, October. Pryor, Charlotte and Joseph Terza, 2001, Are going concern audit opinions a self-fulfilling prophecy?
Advances in Quantitative Analysis of Finance and Accounting, 10, 89-116. Railroad commissioner: Enron pipeline sites could cost Texas $15 million, The Associated Press State &
Local Wire, May 9, 2002

113
Ready, Richard C., Mark C. Berger, and Glenn C. Blomquist, 1997, Measuring amenity benefits from farmland: hedonic pricing vs. contingent valuation, Growth and Change, 28 (4), 438-58.
Riering, Wolfgang W., 1992, Environmental obligations and bankruptcy in US-American law, Thesis for
Master of Laws, McGill University, Montreal, Canada, 1-111. Ringleb, A. H., and S. N. Wiggins, 1990, Liability and large-scale, long-term hazards, Journal of Political
Economy, 98, 574-595. Russ, Robert, Wendy Peffley, and Alfred Greenfield, 2004, The Altman z-score revisited, SSRN working
paper. Scott, James, 1981, The probability of bankruptcy: A comparison of empirical predictions and theoretical
models, Journal of Banking and Finance, 5, 317-344. Segerson, Kathleen, 1997, Legal liability as an environmental policy tool: Some implications for land
markets, Journal of Real Estate, Finance, and Economics, 15, 143-159. Shah, Jaymeen, and Mirza Murtaza, 2000, A neural network based clustering procedure for bankruptcy
prediction, American Business Review,18, 80-86. Shavell, Steven, 1982, On liability and insurance, The Bell Journal of Economics, 13, 120-132. Shavell, Steven, 1984, A model of the optimal use of liability and safety regulation, RAND Journal of
Economics, 15, 271-280. Singer, George H., 1995, Lender liability: Evaluating risk under CERCLA and the security interest
exemption, Commercial Law Journal, 100 (2), 156. Sissell, Kara, 2004, Solutia appoints chapter 11 panel, Chemical Week, 166 (1), 7. Smith, V. Kerry, 1997, Time and the valuation of environmental resources, Resources for the future,
discussion paper 98-07, 1-32. Spracker, Stanley M., and James D. Barnette, 1994, The treatment of environmental matters in
bankruptcy cases, Emory University School of Law Bankruptcy Developments Journal: 11, 85-126.
Steele, Karen Dorn, 2002, Utility, chemical firm to split cost of PCB study at Spokane, Wash.-area dam,
Spokane Spokesman Review, October 25. Stice, James D., Earl K. Stice, and K. Fred Skousen, 2002, Intermediate accounting 15
th edition.
Thomson Learning, Southwestern division, Mason, Ohio, 12. Sung, Tae Kyung, Namsik Chang, and Gunhee Lee, 1999, Dynamics of modeling in data mining:
interpretive approach to bankruptcy, Journal of Management Information Systems, 16, 63-85. Taffler, R., 1982, Forecasting company failure in the U.K. using discriminant analysis and financial ratio
data, Journal of the Royal Statistical Society, 145, 342-358. Tan, Christine, 2002, The asymmetric information content of going-concern opinions: Evidence from
bankrupt firms with and without prior distress indicators, working paper, Baruch College CUNY. Thayer, Mark A. , James C. Murdoch, and Kurt Beron, 1999, Improving air quality benefit estimates from
hedonic models, Research project for The National Center for Environmental Research, Office of Research and Development, U.S. Environmental Protection Agency, Science to Achieve Results (STAR) Program, EPA Grant Number: R825826.
114
Tucker, Robert, and Ella Mae Matsumura, 1998, Going concern judgments: An economic perspective, Behavioral Research in Accounting, 10, 179–218.
20
th Anniversary of the TMI accident press packet issued by the Three Mile Island alert organization,
http://www.tmia.com/PressP2.html. The United States v. Whizco, Inc., 841 F.2d 147, 6th Circuit court, 1988. The United States v. LTV Corporation (In re Chateaugay), 944 F.2d 997, 2
nd Circuit court, 1991.
The United States Department of Energy, Office of Environmental Policy and Assistance, RCRA
Information Brief, DOE/EH-413/9715, September 1997, 1-4. Valuing potential environmental liabilities for managerial decision-making: A review of available
techniques, 1996, Report prepared by ICF Incorporated, 9300 Lee Highway, Fairfax, VA, 22031, for the United States Environmental Protection Agency, Office of Pollution Prevention and Toxics, Washington, D.C., 20460, 1-122.
Van ‘T Veld, Klaas Theodoor, 1997, The judgment proof opportunity (tort liability, industrial accidents,
bankruptcy, market structure), Ph.D. dissertation, University of California, Berkley. Verveka, Amber, 2003, Charlotte, N.C. based fiberglass maker struggles to emerge from bankruptcy, The
Charlotte Observer, Aiken, South Carolina, August 3,, Knight Ridder/Tribune Business News. Weil, Jonathan, 2001, Going concerns -- did accountants fail to flag problems at dot-com casualties?
Wall Street Journal, New York, N.Y., February 9,, C.1. Wilcox, Jarrod, 1971, A simple theory of financial ratios as predictors of failure, Journal of Accounting
Research, 9, 389-395. Wright, Andrew, 2003, Desalination disputes leave a bitter taste, Engineering News Record, Bankruptcies
section, 251 (23), 12. Yang, Z., Marjorie Platt, and Harlan Platt, 1999, Probabilistic neural networks in bankruptcy prediction,
Journal of Business Research, 44, 67-74. Zhang, Guoqiang, Michael Hu, Eddy Patuwo, and Daniel Indro, 1999, Artificial neural networks in
bankruptcy prediction: General framework and cross-validation analysis, European Journal of Operational Research, 116, 16-32.
Zmijewski, Mark, 1984, Methodological issues related to the estimation of financial distress prediction
models, Journal of Accounting Research, 24, 59-82.

118
BIOGRAPHICAL SKETCH
Wendy D. Habegger is a Ph.D. student in finance at Florida State University. She obtained her
Bachelor’s of Science in Mathematics from Augusta State University in 1994, and her Master’s in
Education with a major in Mathematics from Georgia Southern University in 1995. She served as faculty
member at Georgia Southern University from 1995–1998. She is currently faculty at the University of
West Florida.