Embed Size (px)
Citation preview
2020 Global Meetings and Events Forecast
Whatever the size or location of your next meeting or convention, Delta has the ideal travel booking program designed to add value and help make planning the event a success. Learn more about our solutions at: DELTA.COM/MEETINGS
SUCCESSFULMEETINGS START HERE.
Executive Summary 5
2020 Global Meeting Activity 10Meetings Activity 10Meeting Prevalence 12Meeting Attendees 12Meeting Length 12Cost per Attendee 13Overall Meeting Spend 13Hotels and Meeting Space 14Global Air 15
Global Trends 19Meeting Planning in the Modern Age 19Destination Selection 19Meeting Types 21Attendee Experience 22Meetings Technology 23Meetings Management 24
Trends by Region 27
North America 28Meetings Activity 28Meetings Budgets and Planning 30Meeting Location 31
Europe 32Meetings Activity 32Meetings Budgets and Planning 34Meeting Location 35
Asia Pacific 38Meetings Activity 38Meetings Budgets and Planning 40Meeting Location 41
Central and South America 43Meetings Activity 43Meetings Budgets and Planning 43Meeting Location 45
Special Sections 47Personalised Incentive Travel Programme 49Small Meetings 55Pain-Free Reconciliation 59
Data Tables 65
Global Trends 66Meeting Activity 66Hotels and Meeting Space 69Air 73Trends 76Meeting Management 79
Regional Trends 81North America 81Europe 85Asia Pacific 89Central and South America 94
Contributors 98
Contents
2020 GLOBAL MEETINGS & EVENTS FORECAST 3

This report contains confidential and proprietary information of © 2019 GBT Travel Services UK Limited doing business as American Express Global Business Travel (GBT), and may not be copied, reproduced, modified, distributed, transferred or disclosed in whole or in part to any third parties without prior written consent of GBT or as otherwise permitted by law. The information contained in this report is prepared from sources and data which we believe to be reliable, but we make no representation as to its accuracy or completeness and we assume neither responsibility nor liability for any damages of any type resulting from any errors or omissions. The report is provided solely for informational purposes and is not to be construed as providing advice, recommendations, endorsements, representations or warranties of any kind whatsoever. Opinions and analysis contained in this report represent the opinions and analysis of American Express Meetings & Events (a division of GBT) and do not represent the opinions or analysis of GBT, American Express Company or any of their respective affiliates, subsidiaries or divisions (including, without limitation, American Express Global Business Travel).
The 2020 Global Meetings and Events Forecast is the independent collaborative work of American Express Meetings & Events personnel and subject matter and industry experts. The advertising within the 2020 Global Meetings and Events Forecast was sold and managed independently of the creation of the 2020 Global Meetings and Events Forecast and has no bearing on the content contained within the 2020 Global Meetings and Events Forecast.
“American Express Meetings & Events” is a division of American Express Global Business Travel (GBT). Banks Sadler is wholly owned by GBT.
GBT is a joint venture that is not wholly owned by American Express Company or any of its subsidiaries (American Express). “American Express Global Business Travel”, “American Express” and the American Express logo are trademarks of American Express, and are used under limited license. Please note that all information stated within the 2020 Global Meetings and Events Forecast is based on a survey distributed by American Express Meetings & Events to industry professionals and suppliers during the months of May and June.
4 AMERICAN EXPRESS MEETINGS & EVENTS
Executive Summary
Optimism and Steady Growth
GERARDO TEJADO
General Manager, American Express Meetings & Events, a division of American Express Global Business Travel
Dear Readers,
I’m pleased to present our ninth annual Global Meetings and Events Forecast. While this is the ninth annual Forecast, it is the first for me as the head of American Express Meetings & Events. I am so excited to be part of this dynamic and growing industry. From technology and data to experience creation and exciting event activations, the events industry brings people together to create connections and prosperity, and that’s something I’m passionate about.
The outlook of this year’s global respondent base is consistent with last year’s Forecast and the performance of the industry that we saw in 2019, including moderate growth, a focus on the attendee experience and delivering experiential events, and an increase in strategic meetings management in Europe.
After receiving very positive reviews on the new format in 2018, we’ve continued with that look but, because we are always identifying ways to improve the Forecast, we’ve refined some questions to deliver improved data and insights, and added some categories of questions. New to the Forecast are questions regarding respondents’ outlook on the industry.
We found that overall, our survey respondents are “very optimistic” about the meetings and events industry when looking to 2020. While there is quite a bit of talk about economic uncertainty and the impact of political change and instability, including the upcoming US elections in 2020 and the impact of Brexit in the UK, our respondents are predicting the industry will remain steady going into 2020.
2020 GLOBAL MEETINGS & EVENTS FORECAST 5
That optimistic outlook seems to be evident in the proliferation of technology companies that are investing in the meetings industry, delivering technology solutions designed to serve all aspects of the meetings lifecycle. The challenge for planners now lies in creating a seamless experience for meeting attendees by using technology for a purpose, not just tech for tech’s sake. Striking this balance is necessary as attendees expect meeting and event experiences to mirror their own experiences with technology in the rest of their lives.
The attendee experience continues to grow in focus with meeting owners and planners, indicating that they spend more time focused on the experiential elements of their events and meetings than on the logistics. Make no mistake, logistics remain important—they are integral to the experience—but theming and content are beginning to take on more of the planner’s mindshare, which is great news for attendees.
Globally, respondents indicate growth in all meeting types. While there are some shifts with internal meetings reducing in some regions and product launches growing in others, it is clear that events and meetings have cemented their place as a critical driver of communications, growth, and engagement for organizations globally.
From an activity perspective, spend is predicted to see very modest increases that in many cases are outpaced by the anticipated increase in costs. The ongoing challenge faced by the meetings industry is one of competing expectations. The creation of immersive experiential events means that other aspects of an event will need to be compromised to help fund the necessary elements. Some look to constrain the number of days, others the number of attendees. In any case, meeting owners must provide the clear “why” and desired outcomes for the event that will drive decisions throughout the planning process.
Hotel supply, demand, and commissions continue to be in focus. While there seems to be agreement that available meeting space will increase in 2020, it will likely not be enough to relieve the pressure, particularly in major-tier cities. This pressure is increased in countries where the economy is thriving, as business and leisure travelers compete for space.
Meeting owners continue to work to meet growing compliance and data privacy demands. In 2019, we saw the first large penalties associated with General Data Protection Regulation (GDPR) violations. Fines are stiff and awareness is high, but only one-quarter of our respondents in Asia Pacific and North America are familiar with GDPR requirements. There is room to tighten up processes in these regions, where it is not uncommon to have a European attendee in the meeting mix.
Globally, respondents indicate growth in all meeting types. While there are some shifts with internal meetings reducing in some regions and product launches growing in others, it is clear that events and meetings have cemented their place as a critical driver of communications, growth, and engagement for organizations globally.
6 AMERICAN EXPRESS MEETINGS & EVENTS
I’m particularly excited about our three special sections, which represent timely topics for the meetings industry. We explore the emerging technology-enabled solutions for, and challenges of, small meetings in “Small Meetings: the Next Frontier of Meetings Management.” Small and simple meetings have historically confounded meeting program owners and are often the last area to receive attention in a managed meeting program. This section looks at the top considerations for meeting program owners who are interested in getting a handle on this meeting type.
Personalization continues to be a buzzword throughout the industry. But the demand for personalized experiences—spurred on by the technology in our daily lives—is a reality. “Delivering a Personalized Incentive Travel Program” gives practical advice on how to create an experience that will make award winners feel truly valued, and increase the impact of your incentives investment.
Our final special section, “Planners Want Pain-Free Reconciliation to Paint More Robust Meeting Spend Pictures,” looks at trends and challenges in the reconciliation and payment space for events and meetings. Based on a separate survey created in conjunction with The BTN Group, this paper uncovers the primary challenges, and looks at ways to close gaps and improve the critical payment and reconciliation process.
The results of our survey mirror my optimism for the meetings industry, and reinforce that it is a vibrant and growing place to be. I wish you all much success as we close out 2019 and look to 2020.
Saludos,
Gerardo Tejado General Manager, American Express Meetings & Events
2020 GLOBAL MEETINGS & EVENTS FORECAST 7
8 AMERICAN EXPRESS MEETINGS & EVENTS
WHERE GLOBAL CONNECTIONS ARE MADEWelcoming, diverse and sophisticated, Canada is a smartplace to collaborate, create and dream big. From coastto coast, discover unique regional cultures and authenticcuisine. Choose to meet in any one of our innovativeconvention facilities or let us introduce your top performersto an exclusive, authentically Canadian resort for a deeplyimmersive, only-in-Canada adventure.
Let us put you in touch with Canada’s meeting experts.
FIND OUT MORE businesseventscanada.ca #meetincanada

SECTION 1
Global Meeting Activity
2020 GLOBAL MEETINGS & EVENTS FORECAST 9
2020 Global Meeting Activity
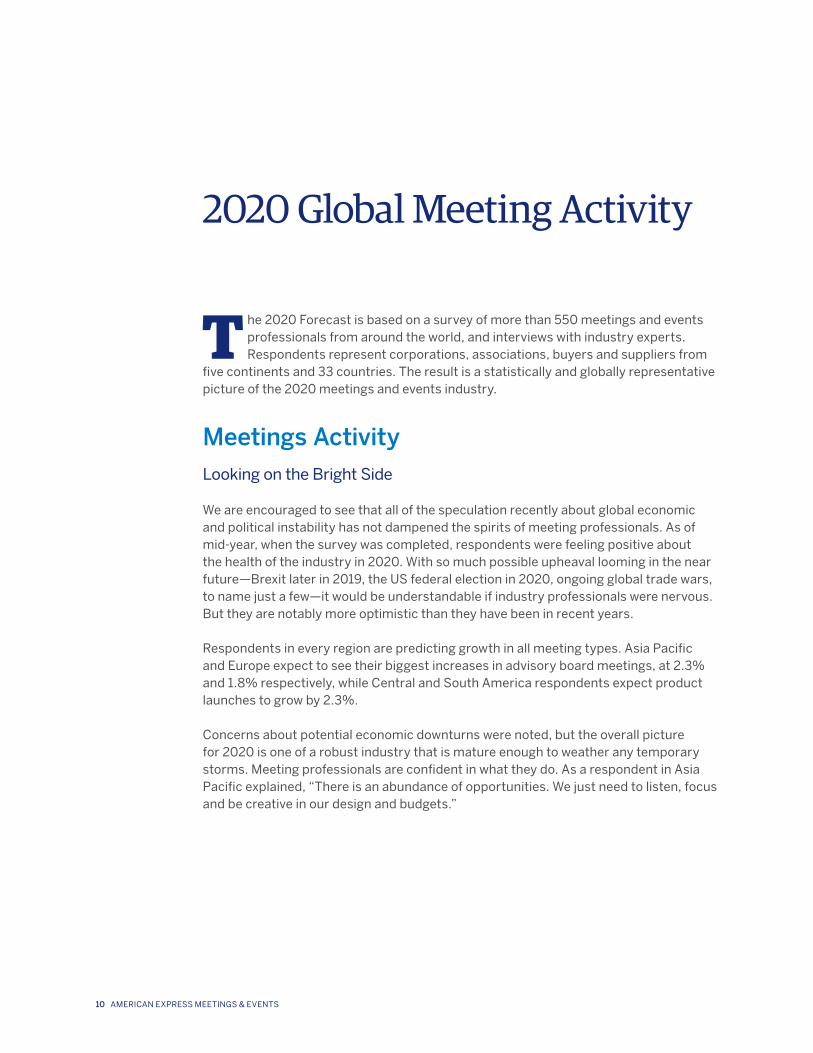
T he 2020 Forecast is based on a survey of more than 550 meetings and events professionals from around the world, and interviews with industry experts. Respondents represent corporations, associations, buyers and suppliers from
five continents and 33 countries. The result is a statistically and globally representative picture of the 2020 meetings and events industry.
Meetings ActivityLooking on the Bright Side
We are encouraged to see that all of the speculation recently about global economic and political instability has not dampened the spirits of meeting professionals. As of mid-year, when the survey was completed, respondents were feeling positive about the health of the industry in 2020. With so much possible upheaval looming in the near future—Brexit later in 2019, the US federal election in 2020, ongoing global trade wars, to name just a few—it would be understandable if industry professionals were nervous. But they are notably more optimistic than they have been in recent years.
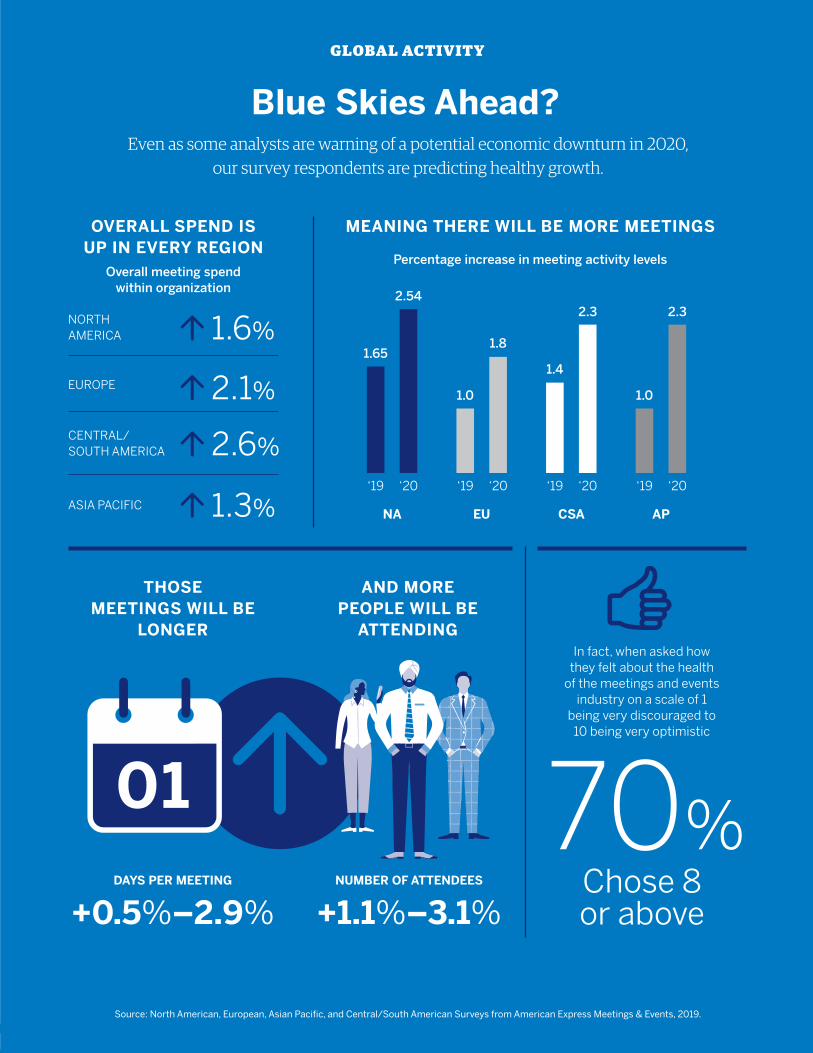
Respondents in every region are predicting growth in all meeting types. Asia Pacific and Europe expect to see their biggest increases in advisory board meetings, at 2.3% and 1.8% respectively, while Central and South America respondents expect product launches to grow by 2.3%.
Concerns about potential economic downturns were noted, but the overall picture for 2020 is one of a robust industry that is mature enough to weather any temporary storms. Meeting professionals are confident in what they do. As a respondent in Asia Pacific explained, “There is an abundance of opportunities. We just need to listen, focus and be creative in our design and budgets.”
10 AMERICAN EXPRESS MEETINGS & EVENTS
2020 GLOBAL MEETINGS & EVENTS FORECAST 11
Blue Skies Ahead?
GLOBAL ACTIVITY
Even as some analysts are warning of a potential economic downturn in 2020, our survey respondents are predicting healthy growth.
OVERALL SPEND IS UP IN EVERY REGION
MEANING THERE WILL BE MORE MEETINGS
Percentage increase in meeting activity levels
1.6%
70%
1.3%
2.1%
2.6%
NORTH AMERICA
ASIA PACIFIC
EUROPE
CENTRAL/SOUTH AMERICA
Overall meeting spend within organization
+0.5%–2.9% +1.1%–3.1%Chose 8or above
DAYS PER MEETING NUMBER OF ATTENDEES
Source: North American, European, Asian Pacifi c, and Central/South American Surveys from American Express Meetings & Events, 2019.
THOSE MEETINGS WILL BE
LONGER
AND MORE PEOPLE WILL BE
ATTENDINGIn fact, when asked how
they felt about the health of the meetings and events
industry on a scale of 1 being very discouraged to
10 being very optimistic
NA EU CSA AP
‘19
1.65
1.0
1.4
1.0
2.54
1.8
2.3 2.3
‘19 ‘19 ‘19 ‘20 ‘20 ‘20 ‘20
Meeting PrevalenceInternal Meetings Are Still Number One
Internal team meetings are expected to account for 18% to 25% of all meetings. This is consistent with last year’s numbers for Europe and Asia Pacific, but North America dropped to 25% from 30% and Central and South America to 18% from 26%. The shift in North America can be mostly accounted for by the growth in incentive events, which are expected to increase from 11% of meetings in 2019 to 15% of meetings in 2020. The strong economy in the US is likely one of the factors driving that growth, as the low rate of unemployment means companies are beefing up their incentive programs to attract and retain employees.
Product launches are expected to increase to 14%–16% of meetings in 2020, from 13%–14% of meetings in 2019, in all regions. Respondents in Central and South America are also predicting a substantial 6% increase in conferences and trade shows in 2020.
Meeting AttendeesMore Attendees Expected
Continuing with the theme of higher numbers across the board, meeting planners in every region expect increases of 1.1% to 3.1% in the number of people attending meetings, which is a significant jump compared to recent years. Respondents in Europe, North America and Central and South America expect that the largest increase in attendees will be at advisory meetings, while Asia Pacific respondents predict the biggest growth will be at product launches. It’s worth noting that this is the second year in a row in which meeting planners have expected increases in every meeting category across the board.
Interestingly, global hoteliers we surveyed did not necessarily share this rosy outlook. They predict increases of 3.1% in advisory meetings and 1.1% in senior leadership and board meetings, but they also predict a decrease of 1% in attendees at internal team meetings. This may be based on a belief that the rationale for holding team meetings is changing. José Miguel Moreno, Vice President of Global B2B Sales & Marketing for Meliá Hotels International, explains that “training meetings are maybe the most affected because of the training portals that all the organizations already have…the e-learning platforms are a huge reality everywhere.”
Meeting LengthDays Stay Consistent
Survey respondents indicated that they believe the number of days per meeting in 2020 will remain fairly consistent with 2019’s numbers, with a few exceptions: product launches in Central and South America are expected to increase in length by 2.9%, and in Asia Pacific by 2.7%.
12 AMERICAN EXPRESS MEETINGS & EVENTS
However, in every region except Central and South America, respondents indicated that the first cost area they would cut in order to maintain their budgets is the number of nights. In Central and South America, 20% of respondents said the first area they would cut would be onsite travel staff, while reducing the number of nights was the second most common choice at 17%. Milton Rivera, Vice President, Business Development and Strategy, American Express Meetings & Events, agrees that reducing meeting length is one of the easiest ways to reduce costs but also sounded a note of caution: “Maybe a shorter meeting aligns with a new demographic that consumes information faster, if they have the right experience and the right technology. But eliminating that night may make the event more rushed and jampacked—robbing Peter to pay Paul. Time will tell.”
Cost per AttendeePer Day Costs Provide More Detail
Note: Based on feedback from our readers, the Forecast is now providing the cost per attendee per day vs. per event, expressed in USD (excluding air travel). This should provide a more helpful metric for benchmarking purposes.
Not surprisingly, costs per attendee per day vary substantially among meeting categories. In Europe, respondents expect their attendee costs to range from a low of $557 for internal team meetings to a high of $745 for incentives. Incentives also have the highest attendee cost of any category in North America, at $706, and Central and South America, at $789. A meeting planner in Europe explained why the higher spend for incentives is necessary: “We need to create memorable events for top performers, without changing the quality and experience of the trip, as this could be seen as miserly on the part of the corporation. The company wants the employee to keep these kinds of events in mind as a once-in-a-lifetime trip.”
Asia Pacific respondents expect the highest attendee per-day cost to be for product launches, at $745, followed closely by incentives, at $722. The region also has the biggest expected percentage increase in per-day costs when compared to 2019, by as much as 2.1% in the senior leadership and board meeting category. Every region predicts an increase in cost in each category, although some of the increases are expected to be minimal, such as for internal meetings in North America and Europe, at just 0.5% and 0.6% respectively.
Overall Meeting SpendSpend Is Higher, but Is It Enough?
After several years of flat or even decreasing budgets, the overall meeting spend for 2020 is predicted to be up across the board. Asia Pacific respondents predict the most modest increase, at 1.3%, followed by North America at 1.6%, Europe at 2.1% and finally Central and South America at a very healthy 2.6%. However, considering the level of growth expected, it’s not clear that those budget increases will keep pace with demand or rising costs. Which means meeting planners will continue to be required to do more with less.
2020 GLOBAL MEETINGS & EVENTS FORECAST 13
The focus over the last few years on improving attendee experience and engagement has raised expectations that meeting planners will create immersive, memorable experiences. As attendees become savvier about what’s possible, they begin to expect that each event they go to will have a certain level of novelty or specialness. But how can planners create new and exciting events when they are dealing with flat budgets?
One tactic may be to change the way meetings and events are viewed within organizations. When stakeholders such as marketing, HR, and security are included in the planning process, it helps meeting planners to get buy-in on budgets, improve communication and increase policy compliance. As Yma Sherry, Vice President, North America, American Express Meetings & Events, explained, “Many of our strategic meetings management clients are focused on the attendee experience, and are putting meeting councils in place to support their stakeholders. In the past, we primarily worked with procurement or finance, but now we are working with sales and marketing, security, and other key meeting stakeholders. The councils help them to understand the overall benefit of consolidating their spend and they allow us to understand their specific needs.”
Another tactic, according to Mr. Rivera, is to implement contracts for all possible event elements at the beginning of the planning process—not just for the hotel space, but for all the services within the hotel, as well as for flights and ancillary supplies. The goal is to optimize all of those costs in one part of the meeting to free up money to increase the experience in other parts. “Buying better and sourcing better can give you more money down the road to color in the rest of the event to make it shine,” he said.
Hotels and Meeting SpacePlaying Catch-Up
Will 2020 be the year that space catches up with demand? Meeting planners expect to see room availability for 2020 increase modestly, by 0.8%–1.4%, and available meeting space to increase slightly more, by 0.8%–1.9%. Hoteliers are expecting room availability in 2020 to increase by 3.6% and available meeting space by 2.4%.
According to Ms. Sherry, “Supply and demand is still an issue. Planners want to go to the major-tier cities, but because hotel and meeting space availability has not kept up with demand over the last few years, they’ve been moving to second-tier cities—which are more affordable, but also may add to travel time for meeting attendees.”
From the hoteliers’ perspective, availability “depends on the hotel type, of course, with conferences and meetings still the main business, but high-end tourist groups and incentives have seen a considerable increase,” according to Mr. Moreno.
Mid-tier properties continue to be the top choice of meeting professionals globally. In comparison to last year, however, respondents in Europe expect to choose more resort properties, increasing the percentage for that tier to 14% from 9%. Respondents in Central and South America, perhaps not surprisingly, have the highest percentage for resort properties out of all regions, at 21%.
14 AMERICAN EXPRESS MEETINGS & EVENTS
Rolf Schmidt, CEO of TOPHOTELPROJECTS, said, “More and more event organizers are going for either B-locations (i.e., not the top cities) or leisure hotels with meeting facilities outside the main season. I see this trend ongoing.”
Construction Is Back to 2018 Levels
Worldwide, new hotel openings in the mid-scale to luxury segments are slightly up over last year’s numbers, at 2,536, which is an increase of 187 properties, according to data from TOPHOTELPROJECTS. Asia Pacific leads the way with 786, followed by North and Central America at 684—a big jump from 563 in 2019. Europe will also see a substantial number of openings, with 667. After a dip in the number of 4- and 5-star properties under construction last year, the numbers in several regions are back up. Asia Pacific will have 1,636 under construction, which is comparable to the numbers in 2018 and earlier. Europe will have 1,093, and North and Central America will have 913.
The top city for hotel openings in 2020 is once again Dubai, with 65. Orlando, coming in at fifth place with 18 openings, and Melbourne, in sixth place with 15 openings, are newcomers to the top 10 list this year.
Group hotel rates are expected to increase from between 2.1% and 3.5%, according to regional respondents. As far as what hoteliers are willing to negotiate in contracts, hotel room rates, at 83%, and Wi-Fi and amenities, at 75% each, were the top three terms. Resort fees are the least likely item open for negotiation, at just 27%.
Meeting professionals in every region indicate that the two hotel trends they expect will have the biggest impact on their jobs are lower commission rates and more challenging contract negotiations. These were also at the top of the list of planners’ concerns last year.
Global AirMore of Everything
Air capacity and volume are both predicted to be up in 2020, across all regions. In line with this, group air costs are expected to rise in 2020. North America expects the biggest increase, at 3.2%, Europe is second at 2.2% and the other regions expect rises of 1.7% to 1.8%. Similar to last year, group air specialists expect rates to be higher, with increases of 3.8% overall, and ranging regionally from a low of 2.3% in Eastern Europe to a high of 3.8% in Asia Pacific. Rates continue to have an impact on destination choice in every region, particularly in Central and South America, where 61% of respondents say rates have a significant influence.
But with new routes being added domestically and internationally, planners have more options to try new meeting locations without necessarily requiring attendees to increase their travel time to get there. Aileen Furlong, Managing Director, Specialty Sales & New Business Development at United Airlines, noted that airlines have recognized that planners are looking for “more diversity of destinations and unique experiences.” She added, “That’s not brand new, but it is continuing to shape our approach to the meetings industry.” Airplane technology is also modernizing, which means there are more direct international options—for example, there are now direct
2020 GLOBAL MEETINGS & EVENTS FORECAST 15
flights from the west coast of the US to New Zealand, something that would have been unheard of a decade ago.
For planners outside the US, there have been challenges with getting visas for some travelers to attend meetings in the US, resulting in some people being unable to attend an event. Group air specialists we interviewed are taking this into account and whenever possible avoiding booking routes that transit the U.S. for nationalities who might need a visa. They also say that travel restrictions are responsible for a change in how incentives are planned: “There was a period when global clients would tend to have one incentive event for their global winners,” said one group air specialist in the United States, “I see a shift back to a more regional approach again.”
Booking Preferences Vary
Respondents report that when it comes to booking group air, they use a variety of resources. Travel management companies are still dominant in North America, where 46% of respondents use this booking resource most frequently, while 48% of respondents in Central and South America work directly with the airlines most of the time. Asia Pacific leads all regions when it comes to working with internal group air specialists, with 58% of respondents using of that resource most of the time.
Group air specialists say that clients are expecting faster booking turnaround times, and are requesting more support, both onsite and virtually, after hours. As better technology becomes available for group bookings, the expectation is that the process will be quicker and easier.
In every region, meeting planners agree that the number one feature they value from a group air provider is its ability to provide favorable rates. Group air specialists find that airlines prefer to negotiate either flat rates from one destination or a combination of flat rates and mini routes. The option of negotiating mini route deals and conference window rates was not chosen as the preferred negotiation option by any of the group air specialists we surveyed.
16 AMERICAN EXPRESS MEETINGS & EVENTS
2020 GLOBAL MEETINGS & EVENTS FORECAST 17
SECTION 2
Global Trends
18 AMERICAN EXPRESS MEETINGS & EVENTS
Global Trends
Meeting Planning in the Modern AgeThere is no doubt that the role of the meeting planner is evolving. In a dynamic and maturing meetings industry that is heavily focused on improving engagement, successful planners need to wear two hats: logistical authority and event whisperer.
As Yma Sherry, Vice President, North America, American Express Meetings & Events, puts it, “The meeting planner’s job is calling for more creativity than ever, to find unique venues and implement technology to enhance the attendee experience. They’re looking for something that will pull people into the meeting, so that they’re not just an attendee, they’re a participant.”
A meeting professional in North America explained how to achieve that: “I always try to bring the best foot forward and bring together the best in the industry. I try to not only make the meeting serious and goal-driven, but also fun and engaging for all who attend. People miss out if they are bored, so I try to organize it so they are actively participating, while enjoying themselves.”
One way planners are achieving this shift in focus is by using online platforms that streamline the booking process. The technology is not perfect yet, as a meeting professional in Germany noted: “Today we’re using a large number of individual solutions, which need to be managed separately even though much of the data could be used in multiple ways to drive planning efficiency and quality.” However, according to our survey, more than half of planners say they spend more time in their job focused on the experiential aspects of their events than the logistical aspects. And this trend should continue, as the technology is enhanced and delivered to planners as a fully integrated end-to-end solution.
Destination SelectionPriorities Differ by Region
When it comes to criteria for selecting meeting destinations, respondents in North America have different priorities than those in other regions. Economic/political instability and general safety concerns are the top factors in Europe, Central and South
2020 GLOBAL MEETINGS & EVENTS FORECAST 19
20 AMERICAN EXPRESS MEETINGS & EVENTS
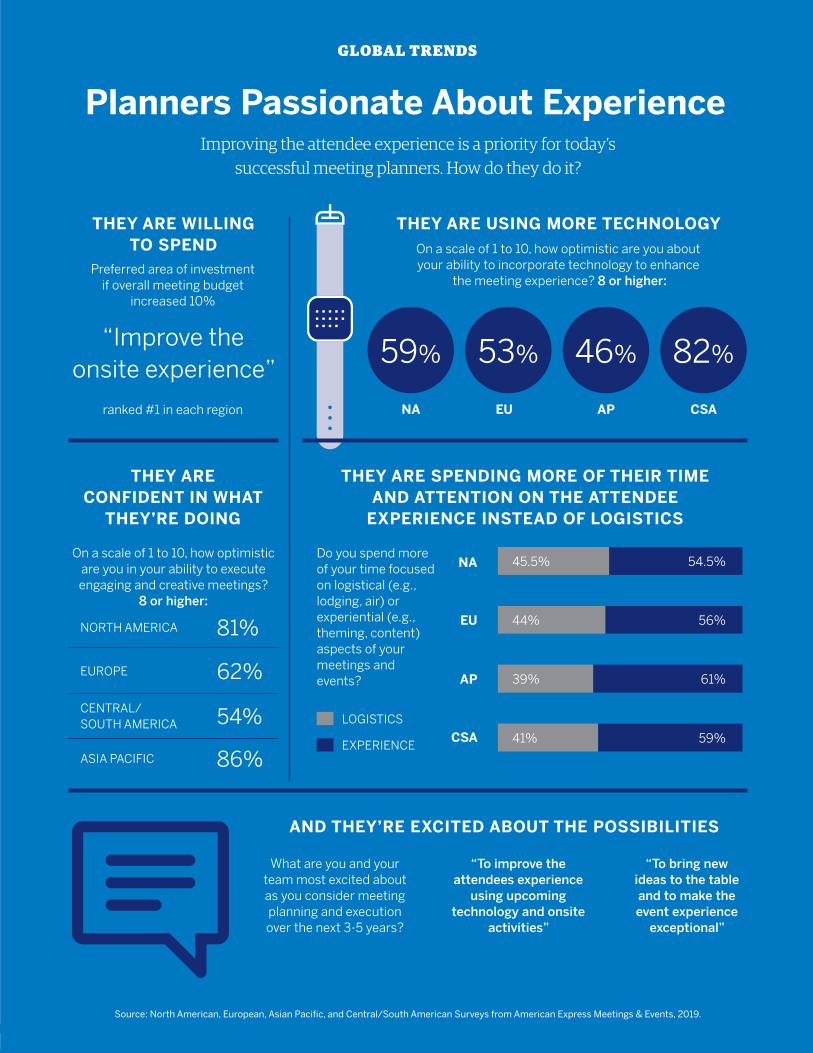
Planners Passionate About Experience
GLOBAL TRENDS
Improving the attendee experience is a priority for today’s successful meeting planners. How do they do it?
THEY ARE WILLING TO SPEND
THEY ARE USING MORE TECHNOLOGY
On a scale of 1 to 10, how optimistic are you about your ability to incorporate technology to enhance
the meeting experience? 8 or higher:
THEY ARE SPENDING MORE OF THEIR TIME AND ATTENTION ON THE ATTENDEE
EXPERIENCE INSTEAD OF LOGISTICS
AND THEY’RE EXCITED ABOUT THE POSSIBILITIES
Preferred area of investment if overall meeting budget
increased 10%
ranked #1 in each region
“Improve the onsite experience”
59% 53% 46% 82%
81%
86%
62%
54%
NORTH AMERICA
ASIA PACIFIC
EUROPE
CENTRAL/SOUTH AMERICA
Source: North American, European, Asian Pacifi c, and Central/South American Surveys from American Express Meetings & Events, 2019.
THEY ARE CONFIDENT IN WHAT
THEY’RE DOING
Do you spend more of your time focused on logistical (e.g., lodging, air) or experiential (e.g., theming, content) aspects of your meetings and events?
What are you and your team most excited about as you consider meeting planning and execution over the next 3-5 years?
On a scale of 1 to 10, how optimistic are you in your ability to execute engaging and creative meetings?
8 or higher:
LOGISTICS
EXPERIENCE
NA EU CSAAP
NA 45.5% 54.5%
EU 44% 56%
AP 39% 61%
CSA 41% 59%
“To improve the attendees experience
using upcoming technology and onsite
activities”
“To bring new ideas to the table and to make the event experience
exceptional”
America, and Asia Pacific, and yet neither of those two factors crack the top five in North America, where location type and ease of air lift are prioritized.
In interviews, meeting professionals explained that in addition to those factors listed above, there are many other factors that must be taken into account when choosing a destination, including how familiar the planner is with the location, its appeal to attendees (is it a “bucket list” location?), whether it’s within budget, the quality of the facilities and strength of its infrastructure, and opportunities for unique offsite experiences, among others. As service baselines become more standardized globally, new destinations are opening up to planners because there is not as much risk as there used to be in trying somewhere new. After all, a 5-star hotel is a 5-star hotel pretty much anywhere in the world now. However, trying a new location does mean more work for the planner since they won’t have an existing local network to rely on, and there’s always the possibility that a destination may be too distant or too niche to appeal to many attendees.
Sustainability and Climate Change Are on the Radar
Another factor influencing destination selection comes from the increased awareness of climate change. Meeting professionals in several regions, particularly in Europe, report that sustainability and corporate social responsibility are growing in importance. As a result, meetings professionals are choosing to hold events in local venues or in places that attendees who must travel to meetings can get to by train rather than air. There are signs that this trend may be here to stay: a recent survey of Swedes1 found that one quarter of them had decided not to fly in the past year to reduce their carbon footprint; KLM Royal Dutch Airlines launched a campaign to encourage people to fly more “responsibly”2; and in 2020, France plans to introduce a new flight “eco-tax,” which will be levied on all flights leaving the country, with proceeds going to support train services and other forms of transportation.3
Meeting TypesHybrid/Virtual Meetings Continue to Be a Factor
Although in-person meetings are still far and away the standard format, hybrid/virtual meetings are growing in some regions and leveling off in others. When comparing the 2019 survey results to the 2020 results of the percentage of planners who use hybrid/virtual meetings in more than 10% of meetings, North America has seen an uptick in that number, going from 43% to 58%. Europe has seen an even larger increase, jumping from 49% up to 66%. Central and South America, on the other hand, had a slight decrease from 76% down to 71%, and Asia Pacific also had a slight decrease, from 70% down to 66%.
Milton Rivera, Vice President, Business Development and Strategy, American Express Meetings & Events, says that hybrid/virtual meeting levels ebb and flow over the years. He cautions that planners can’t convert an in-person meeting into a virtual one and expect everything to run smoothly. “You have to adjust your event to fit,” he explained. “You need to create an agenda and an attendee experience that corresponds with the meeting being virtual.”
2020 GLOBAL MEETINGS & EVENTS FORECAST 21
Attendee ExperienceTight Budgets + Space Issues = Challenge for Planners
Engagement, engagement, engagement—it’s still the central theme of the industry today. Planners are tasked with making sure that attendees are fully engaged with an event, not just while they’re there, but also after it’s over. Effective post-event engagement can be accomplished through the use of a mobile app that provides follow-up polling and communication. But to increase engagement during events, planners are using a variety of strategies. Whether that means choosing an outside-the-box venue, introducing local culture and food to guests, incorporating wellness into the meetings program, planning offbeat offsite activities, or something else, depending on who the audience is and what they want. Whatever planners choose, it can be a challenge to implement if they are dealing with flat budgets, short lead times, and labor-intensive administrative tasks.
According to Yma Sherry, “The success of your meeting depends on the meeting planner. Their job is to recommend creative ideas that will make the event more engaging for the participants.” She continued, “We are looking at ways to make the meeting process less manual, utilizing technologies such as artificial intelligence and facial recognition to simplify the job of the planner, giving them more time to develop creative options.”
High quality meeting spaces play a big role in the overall experience. If the business portion of an event takes place in a stuffy, windowless room, even the most engaging offsite activity cannot make up for that. This is an ongoing issue for meeting professionals—many of our survey respondents cited the need for more inviting spaces with natural light. But it appears that hotel owners and designers may not have caught up yet. Rolf Schmidt, CEO of TOPHOTELPROJECTS, said, “The concept and design of meeting spaces stands far behind the innovative design of other hotel outlets—that is, the lobby, bar, restaurant, and rooms. Looking at the extremely high price level of events in all locations we ask for, it s surprising to me that the volume of new and attractive meeting spaces is so limited.”
Marketing executives are looking for how to be more innovative in a “do more with less” environment. In a recent report published by American Express Meetings & Events, marketers explained that they are purposefully choosing to operate smaller meetings to both meet their budgets and engage more deeply with customers.4 Smaller events allow for more flexibility in destination, venue, experience design, and attendee engagement—offering marketers new opportunities to connect in real and personal ways with their target audience. This is especially true for segments where the attendee group requires a high-touch and highly personalized experience. Marketers deploying these smaller events are enthusiastic about their impact, and they anticipate using the model more extensively in future years:
“I’m able to incorporate amazing new approaches at a micro level because I plan to reuse the approach with other audiences. I design the first micro-event, then do a ‘rinse and repeat’ with several other target groups.”Marketing executive, US
22 AMERICAN EXPRESS MEETINGS & EVENTS
“We call every single buyer we want to invite to the event. They spend half a million Euros on a single piece of our equipment—we call them.” Marketing executive, Europe
Meetings TechnologyGoing Beyond Mobile Apps
There appears to be a general consensus among meeting professionals that 2020 will be the year technology becomes fully integrated. As Mr. Rivera says, “From what I hear, next year is going to be about implementing and getting value out of the available technology. People are ready to invest.”
There are many different tech solutions available that can do everything from simplifying logistics, to providing emergency communications, to using facial recognition software to measure the effectiveness of a booth setup or keynote speaker. The key is to choose the right one for the right event.
According to Reggie Aggarwal, CEO and founder, Cvent, “In 2020, I think there will be a renewed focus on utilizing solutions that will help increase attendee engagement, streamline post-event follow-up, and help organizations fuel their sales pipeline through live events. While trade shows, conventions, and other event types may not have changed format much over the years, the tools to maximize their impact certainly have, and I think the need for better and more actionable data will continue to drive the technological developments in the year ahead.”
Professionals caution, though, that just dropping tech into an event can do more harm than good if it’s not integrated successfully.
Interviewees agreed that mobile apps are ubiquitous at events now—one meeting professional referred to them as “the new lanyards.” Survey respondents across the globe value them for many reasons, but the top reasons are their ability to improve communication and engagement, facilitate networking, and deliver documents electronically. As far as the features of an app that are considered to be very important to the success of a meeting, the agenda feature was ranked the highest, but many of the other 15 features on the list were rated as very important to have.
Linda McNairy, Vice President, Global Operations & Shared Services, American Express Meetings & Events, said she’s seeing a lot more creativity in the way mobile apps are being used. “We recently used a ‘getting to know you’ Q&A in our mobile app for our customer council meeting. One key question was ‘how many of our council meetings have you attended?’ We seeded this question knowing that our new global M&E leader would answer ‘first time.’ We then segmented the group, based on answers, and created team gamification challenges. This exercise worked well to foster a fun and competitive spirit between leadership and clients, driving deeper engagement with this very important group.”
Mr. Aggarwal emphasized that “digitization is not a replacement for in-person events, it’s a supplement.” He continued, “My mantra is, and always has been, that nothing
2020 GLOBAL MEETINGS & EVENTS FORECAST 23
beats meeting face-to-face. Live events are how business gets done and ideas are shared. Technology is just there to make the experience that much more impactful.”
Meetings ManagementEffective Policies Require Local Buy-In
Meetings policies are becoming more robust, as more organizations are creating standalone policies, rather than adding a line or two about meetings to their existing travel policies. But there is difficulty with compliance, as Ms. Sherry explained: “In this age of too much communication and too many emails, people may not even know that the meeting policy exists, much less what it says.” More recognition is needed at the organizational level that policies will not get adopted unless there is engagement at the local level. Mr. Rivera noted, “You may be a massive global brand, but when it comes down to execution, that happens from within the local offices, not from world headquarters.” Meeting professionals in Central and South America in particular say that pharmaceutical clients in their region are concerned about accomplishing meeting policy implementation, in order to be compliant with their industry regulations.
Across the four regions surveyed, safety and security and preferred suppliers are policy components most likely to have explicit language in the meetings management policy. North American respondents are likely to have clear approval processes defined, while respondents in Central and South America have prioritized policies for social media.
The European General Data Protection Regulation (GDPR) rules are now in full effect, with enforcement underway and even some examples of fines being levied in the travel industry. Because of the way the law is structured, when a single European citizen attends a meeting anywhere in the world, any company selling goods or services to or processing and holding the personal data of the attendee must meet GDPR requirements, regardless of the company’s location. Because of this potential exposure, and because fines can reach up to 4% of a company’s worldwide revenue in the previous fiscal year, organizations in every region are bringing their data security and digital marketing policies into alignment with GDPR. Europe and Central and South America lead the regions in implementation, while approximately one-quarter of respondents in Asia Pacific and North America are familiar with the GDPR requirements.
More Benchmarking Needed to Get Real ROI
A continuing trend in the meeting industry is organizations’ desire for benchmarking. The increase in technology has brought with it an increase in data, and companies are asking for it. Ms. McNairy said, “Everybody is very interested in how they rank next to their peer group and competitors: how do my meetings and events measure up against theirs? Across our clients’ programs we find that the goals, unique needs, and even company culture play a role in structure and success. Understanding what is most important to your organization—doing more with less, gaining visibility into spending and activity levels, compliance—can inform key barometers of performance.” With budgets under perennial pressure, measuring return on investment and return on experience will likely become vital to safeguard meetings programs over the next few years.
24 AMERICAN EXPRESS MEETINGS & EVENTS

Mr. Rivera agrees: “There’s a convergence coming with budgets, return on investments, technology, and all of these things that have been maturing and incubating on their own over the years. What I see happening is for them to be brought together into the holy grail for meeting professionals, which is being able to answer the question: was that meeting effective, and did the organization get what they needed out of it?”
1 https://www.weforum.org/agenda/2019/06/sweden-has-invented-a-word-to-encourage-people-not-to-fly-and-it-s-working/
2 https://news.klm.com/100-days-before-it-100th-anniversary-klm-takes-sustainable-aviation-to-the-next-level-with-its-fly-responsibly-initiative/
3 https://www.reuters.com/article/us-france-airlines-tax/france-to-tax-flights-from-its-airports-airline-shares-fall-idUSKCN1U412B
4 In Depth Look at the Event Experience: What Marketers Want
2020 GLOBAL MEETINGS & EVENTS FORECAST 25
26 AMERICAN EXPRESS MEETINGS & EVENTS
Trends by Region
SECTION 3
2020 GLOBAL MEETINGS & EVENTS FORECAST 27
North America
M eeting professionals in North America are expecting 2020 to be a strong year for meetings and events. Growth is predicted to be consistent and stable, and survey respondents indicate they are excited to make use of
new technologies, from back-end systems that make bookings easier to client-facing software that enhances the onsite experience. Meetings management efforts are also paying off for the region, with respondents reporting a high level of adoption of meetings policies. As the meetings industry has matured, there are new areas of focus, as well. Compliance, event disruption preparedness, and social issues like human trafficking were mentioned as factors that professionals need to consider.
Meetings ActivityThe leading type of meeting in North America in 2020 is expected to be internal team and training meetings, which is consistent with previous years. The proportion is predicted to dip, however, to 25% of total meetings, down 5% from last year’s Forecast. The main difference appears to be due to an increase in incentives meetings.
Internal meetings are the top category in the US and second most prevalent in Canada, behind senior leadership and board meetings. Canada is expecting a big jump in the senior leadership category compared to last year’s Forecast, increasing from 13% to 26%. This may be a sign that organizations in that country expect to be focusing more on high-level strategizing than in previous years, perhaps as part of a shifting economy.
Continuing with the moderate growth predicted in last year’s Forecast, professionals expect to see increases in every metric, including the number of attendees and the days per meeting.
Activity levels are expected to grow between 1.7% to 2.5% across North America, with respondents in the US predicting much bigger increases than those in Canada. Regionally, respondents in the US predict the largest increase in activity levels to be in product launches, at 3.3%, while respondents in Canada expect to see the largest increase, 2.2%, in incentives and special events.
“People are constantly needing to connect for so many different things: meetings; events; training; and incentives. This is not going to slow down,” said one survey respondent, a meeting professional in North America. Another respondent in the region
28 AMERICAN EXPRESS MEETINGS & EVENTS
2020 GLOBAL MEETINGS & EVENTS FORECAST 29
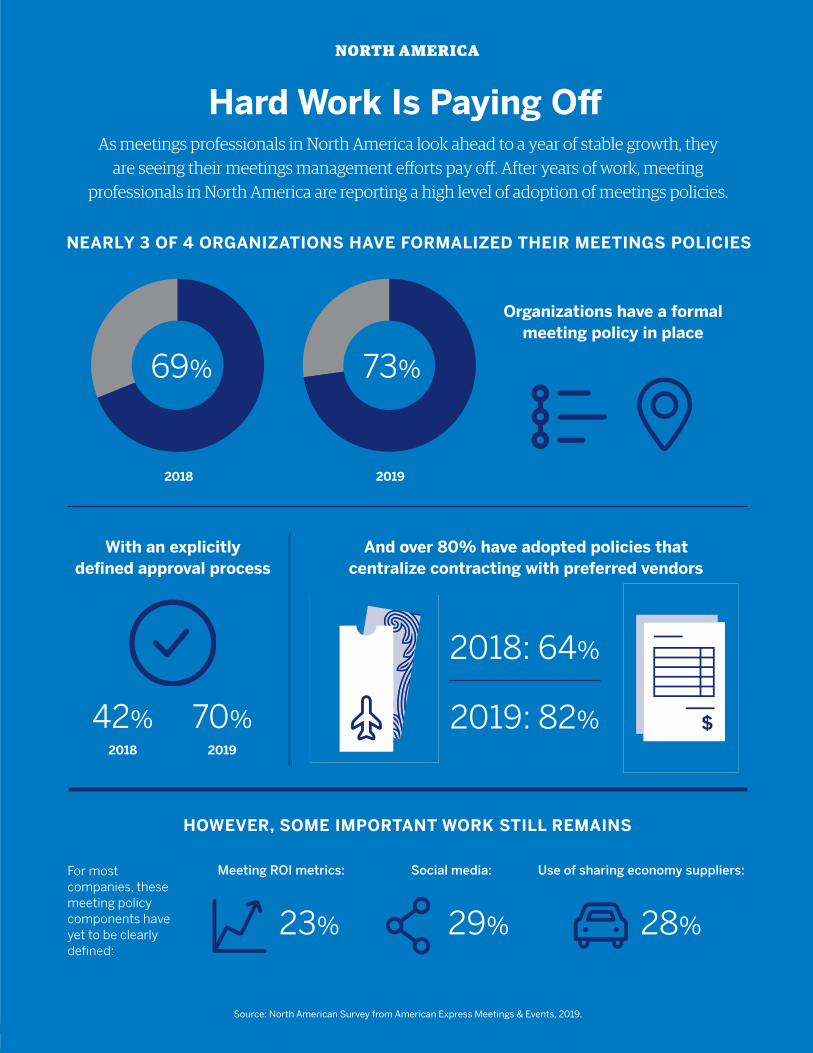
Hard Work Is Paying Off
NORTH AMERICA
As meetings professionals in North America look ahead to a year of stable growth, they are seeing their meetings management eff orts pay off . After years of work, meeting
professionals in North America are reporting a high level of adoption of meetings policies.
NEARLY 3 OF 4 ORGANIZATIONS HAVE FORMALIZED THEIR MEETINGS POLICIES
HOWEVER, SOME IMPORTANT WORK STILL REMAINS
42%
23% 29% 28%
2019: 82%70%
2018: 64%
Meeting ROI metrics: Social media: Use of sharing economy suppliers:
And over 80% have adopted policies that centralize contracting with preferred vendors
69% 73%
2018
2018 2019
2019
For most companies, these meeting policy components have yet to be clearly defi ned:
Source: North American Survey from American Express Meetings & Events, 2019.
With an explicitly defi ned approval process
Organizations have a formal meeting policy in place
agreed, although with a caveat: “As long as the economy stays stable, I believe the meetings industry will flourish.”
The largest increase in predicted number of attendees is 3.1% in the US, for client and customer advisory board meetings. Respondents in Canada expect their biggest increase in number of attendees to be product launches, with 2.3% more attendees. Even though Canadian respondents predict a large increase in senior leadership and board meetings in 2020, they don’t expect more people to attend them. With just a 0.6% increase in that category, it’s likely that this type of meeting will not be changing much in format.
Meeting length is expected to be similar to previous years, with no real expectations of growth in any categories other than a 1.8% increase in length for incentives in the US, and a 1.8% increase in client and customer advisory board meetings in Canada. Meeting professionals are likely mindful that adding more time to meetings means people are away from their desks—and primary work responsibilities—for that much longer, so the emphasis appears to be on making the most of the time already allotted.
Meetings Budgets and PlanningNote: New in this year’s Forecast, cost per attendee is now on a per day basis, not a per event basis.
Overall, cost per attendee per day is lower in the US than in Canada. Both US and Canadian respondents expect to spend the least at internal and team meetings, at $539 and $606 per person per day, respectively. There is a larger difference in spend at the higher-cost events: US respondents predict that the highest amount per attendee will be at incentives, at $685 per person per day, while in Canada, the highest expected spend is at product launches, at $798 per person. It is apparent that US organizations spend the most per attendee at events for their employees and top customers—people who are already familiar with and, presumably, loyal to the organization—while in Canada the biggest spend is on marketing/sales events, where the focus is on attracting new customers. This is not a new trend for either region, as attendee costs are expected to be stable in 2020, with low, if any, growth.
Daily hotel rates are expected to be up significantly in the US, by 4.3% over 2019. Canadian respondents predict a more modest increase of 1.4%. When combined with an expected rise of 3.2% in the region for group air rates, the increase in flights and lodging may put pressure on professionals to cut costs in other areas. Almost one-third of respondents chose “number of nights” as the first area they would cut if budgets demanded it; reducing offsite evening events came in second, with 12% of respondents choosing this as the best area to cut.
Overall meetings budgets in North America are expected to rise only moderately in 2020—in the US, by 1.8%, and in Canada, just 0.7%. The projected increases are greater than the previous year’s Forecast, but are likely not enough to cover the increase in air and hotel rates. If additional funds did become available, 35% of respondents would prioritize improving the onsite experience for attendees.
30 AMERICAN EXPRESS MEETINGS & EVENTS
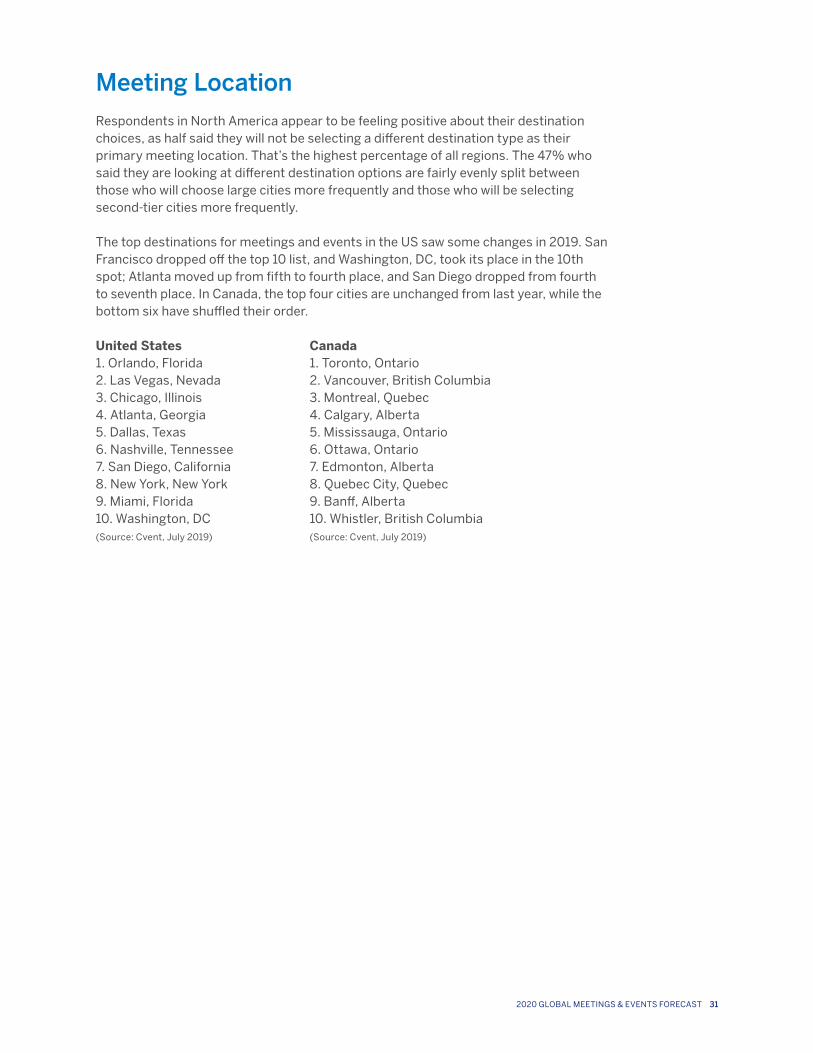
Meeting LocationRespondents in North America appear to be feeling positive about their destination choices, as half said they will not be selecting a different destination type as their primary meeting location. That’s the highest percentage of all regions. The 47% who said they are looking at different destination options are fairly evenly split between those who will choose large cities more frequently and those who will be selecting second-tier cities more frequently.
The top destinations for meetings and events in the US saw some changes in 2019. San Francisco dropped off the top 10 list, and Washington, DC, took its place in the 10th spot; Atlanta moved up from fifth to fourth place, and San Diego dropped from fourth to seventh place. In Canada, the top four cities are unchanged from last year, while the bottom six have shuffled their order.
United States1. Orlando, Florida2. Las Vegas, Nevada3. Chicago, Illinois4. Atlanta, Georgia5. Dallas, Texas6. Nashville, Tennessee7. San Diego, California8. New York, New York9. Miami, Florida10. Washington, DC (Source: Cvent, July 2019)
Canada1. Toronto, Ontario2. Vancouver, British Columbia3. Montreal, Quebec4. Calgary, Alberta5. Mississauga, Ontario6. Ottawa, Ontario7. Edmonton, Alberta8. Quebec City, Quebec9. Banff, Alberta10. Whistler, British Columbia (Source: Cvent, July 2019)
2020 GLOBAL MEETINGS & EVENTS FORECAST 31
Europe
M eetings and events professionals in Europe are generally optimistic about the industry in 2020, although this feeling is tempered with caution about political instability in the region. As we would expect, there are some
variations in the survey numbers once broken down by country, but the overall picture is one of modest growth for the coming year.
Meetings ActivityAs in every other region we surveyed, internal team meetings are expected to be the most common type of meeting across Europe in 2020, although their prevalence is more pronounced in some regions than others. By country, all but France and Poland are predicting between 22% and 24% of meetings in 2020 will be internal; in France, product launches are expected to be in the top position and in Poland the most common type of meeting is expected to be advisory boards. The United Kingdom bucks the regional figures in several meeting types, with fewer product launches and more conferences and tradeshows predicted than the regional averages.
Meeting activity levels are not predicted to grow much, if at all, across the region when compared to 2019 levels—with a few exceptions. French respondents expect to see a growth of 2.5% in product launches and 2.6% in incentives; Spanish respondents predict there will be an increase of 2.4% in internal team meetings. In the UK, decreases are expected in internal team meetings and conferences and tradeshows. In general, though, the number of meetings in 2020 is expected to grow moderately, with an increase of 1.0% to 1.8% overall.
Professionals in Europe say they believe that the worst of the last economic slowdown appears to be over, but Brexit looms large. Respondents in the UK, in particular, indicated that next year’s meetings and events activity is hard to predict because of the uncertainty over what will happen with the United Kingdom’s impending exit from the European Union. As one professional explained, “The outlook is strong, but Brexit could impact budgets and planning for 2020 onwards.” Another respondent said that it is already having an impact, with cost-cutting resulting in less travel already.
There are significant increases predicted in the number of attendees at a variety of meeting types. Professionals in France predict that incentives will see a 3.2% jump in the number of attendees, while Poland expects 3.1% more attendees at advisory boards. In Spain,
32 AMERICAN EXPRESS MEETINGS & EVENTS
2020 GLOBAL MEETINGS & EVENTS FORECAST 33
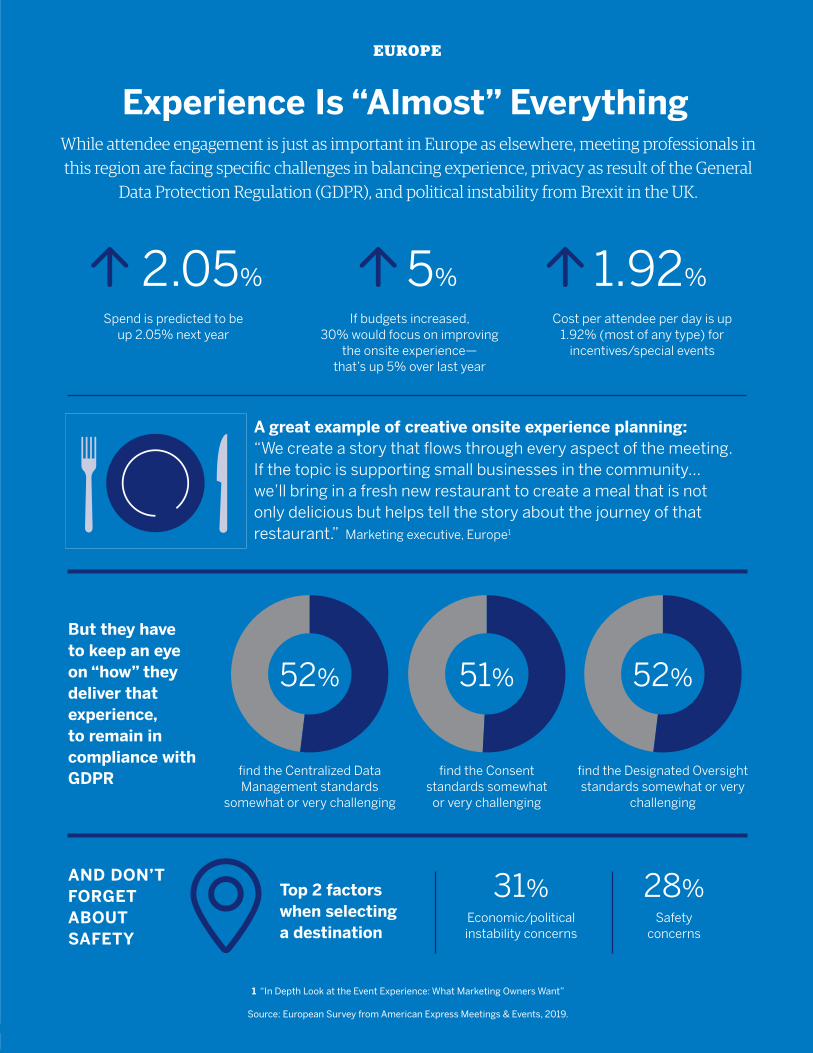
Experience Is “Almost” Everything
EUROPE
While attendee engagement is just as important in Europe as elsewhere, meeting professionals in this region are facing specifi c challenges in balancing experience, privacy as result of the General
Data Protection Regulation (GDPR), and political instability from Brexit in the UK.
But they have to keep an eye on “how” they deliver that experience, to remain in compliance with GDPR
AND DON’T FORGET ABOUT SAFETY
51% 52%
Cost per attendee per day is up 1.92% (most of any type) for
incentives/special events
Economic/political instability concerns
Safety concerns
If budgets increased, 30% would focus on improving
the onsite experience—that’s up 5% over last year
fi nd the Centralized Data Management standards
somewhat or very challenging
fi nd the Consent standards somewhat
or very challenging
fi nd the Designated Oversight standards somewhat or very
challenging
A great example of creative onsite experience planning: “We create a story that fl ows through every aspect of the meeting. If the topic is supporting small businesses in the community…we’ll bring in a fresh new restaurant to create a meal that is not only delicious but helps tell the story about the journey of that restaurant.” Marketing executive, Europe1
Spend is predicted to be up 2.05% next year
2.05% 5%
31% 28%
1.92%
1 “In Depth Look at the Event Experience: What Marketing Owners Want”
Top 2 factors when selecting a destination
52%
Source: European Survey from American Express Meetings & Events, 2019.
the numbers are higher across the board for every category, ranging from 1.9% to 2.6%. German professionals, who for 2019 predicted a decrease of 1.6% in conference and tradeshow attendees, continue to expect the number of people at those events to stay flat, with a decrease of 0.4%. However, in all other meeting types respondents from Germany say they will see an increase in attendees ranging from 0.9% to 2.6%.
Meeting professionals in Europe expect modest increases in the number of days per meeting for 2020, although the responses do vary considerably by country. French respondents predict growth of anywhere from 1.5% more days for product launches
and internal meetings to 3.1% for incentives. Meeting professionals in Denmark and Sweden, who in our previous Forecast indicated that meeting lengths would decrease across the board, continue to be conservative in their predictions and do not expect any increases in meeting lengths other than an uptick of 1.9% for product launches.
Meetings Budgets and Planning Note: New in this year’s Forecast, cost per attendee is now on a per day basis, not a per event basis.
In Europe, as a whole, incentives and special events are predicted to cost the most per attendee per day, at $745 regionally (in US dollars), although when looking at the by-country responses, the incentives category is the highest in only three countries—the UK, Germany, and Spain. Respondents in Spain expect to spend substantially more per day on incentive attendees than in other categories, at $791 compared to $684 for product launches, which are ranked second in the attendee spend. Not surprisingly, the lowest per attendee spend for the region is in internal team meetings, with the lowest of all being $482 in Poland.
With the change in the way the cost per attendee was collected for this year’s Forecast, it is difficult to directly compare the numbers with previous years, but we can see directional shifts. It is notable that in Belgium and the Netherlands, product launches were predicted to be the second highest per attendee spend in 2019, but the lowest in 2020. Professionals expect the per attendee spend to remain stable, or only increase moderately in Europe as a whole. Most meetings types will not see any growth in costs per day per attendee.
When it comes to the areas where respondents would cut costs firsts if budgets required, the number one pick is reducing the number of nights, with second and third choices being cutting offsite optional activities and offsite evening events. If budgets increased, the preferred choice among respondents, at 30%, was “improve the onsite
Respondents in the UK, in particular, indicated that next year’s meetings and events activity is hard to predict because of the uncertainty over what will happen with their country’s impending exit from the European Union.
34 AMERICAN EXPRESS MEETINGS & EVENTS
experience”—which suggests that for planners, the core function of meetings and events is to deliver on attendee engagement.
Group air rates are expected to increase by 2.2% overall. Hotel rates are also expected to be up in every country, although the increase ranges from a modest 0.6% in Belgium and the Netherlands to a high of 3.1% in Germany.
Overall meeting spend is predicted to be up in Germany, Spain and France, by 3.4%, 3.1% and 2.5% respectively. In the rest of the region, meeting spend is flat, rising between 0.5% and 0.75%. Last year’s Forecast predicted decreases in every country but Spain, so this year’s numbers, while flat, do bolster the professionals’ observations that the economic outlook is more stable.
As far as trends go in how meetings are planned, several respondents indicated that they are seeing more use of online booking. A professional in Germany said, “Booking portals are definitely a trend that stands out, and are changing the way small and simple meetings are sourced and booked.” Almost three-quarters surveyed said they have meetings management policies in place, although when it comes to following those policies there are still some challenges. One professional in the Nordics explained that, “Overall adoption of meetings policy is low, but we see improvement year over year in this area. There has been an increasing focus on being ‘GLocal,’ which means a global overarching strategy with local adoption.”
Not surprisingly, General Data Protection Regulation (GDPR) compliance is highest in Europe compared with all other regions, with respondents showing the most familiarity with GDPR requirements, and the highest levels of adoption in the three specific areas we asked about: centralized data management, consent and designated oversight.
Meeting LocationProviding a great attendee experience continues to be top-of-mind for meeting professionals when they are choosing the locations for their meetings and events, and this is driving a shift from traditional meeting facilities to newer, fresher spaces. However, with the growth of boutique hotel brands showing no signs of slowing down, it can be challenging to find appropriate meeting spaces, particularly for larger events. As a meeting professional in Germany explained, “Trendy and individually designed meeting spaces are mostly for smaller groups.” Meeting planners are also becoming more demanding in what type of venue they would like: “More and more are asking for new creative locations, in outside-the-box venues,” according to a professional in France.
Respondents are fairly evenly split about the type of destinations they expect to choose, with 39% saying they will not be changing, 29% saying they will be choosing second-tier cities more frequently, and 31% saying they will be selecting large cities more frequently. Although the increase in flight routes has opened up many new possible meeting locations across the continent, respondents indicate that they need to continue to factor in safety and security. Safety is also an issue when it comes to using sharing economy suppliers along with concern about the consistency of available services, which means that organizations are not using them in any significant number.
2020 GLOBAL MEETINGS & EVENTS FORECAST 35
The top destinations for 2020 are similar to previous years, with Prague joining the list and Lisbon dropping off.
Europe1. London, England 2. Berlin, Germany 3. Barcelona, Spain 4. Paris, France 5. Amsterdam, Netherlands 6. Madrid, Spain 7. Frankfurt, Germany 8. Rome, Italy 9. Prague, Czech Republic 10. Munich, Germany (Source: Cvent, July 2019)
36 AMERICAN EXPRESS MEETINGS & EVENTS

2020 GLOBAL MEETINGS & EVENTS FORECAST 37
45094EYME_UAE_DCT02_AMEX GBT_11x8.5w_in_Jul_EN_#150.indd 1 18/7/19 10:53 PM
Asia Pacific
T he mood in Asia Pacific according to our survey respondents in China/Hong Kong, Australia, and Japan, can be characterized as somewhat split: professionals in Australia and China/Hong Kong appear to expect fairly strong
growth in the meetings and events industry in 2020, while those in Japan appear to be expecting the year to be flat. This may be due to the fact that economic forecasts for Japan have been subdued—they were recently cut to just 0.9% GDP growth for the coming year.1 And even though the 2020 Summer Olympics in Tokyo will likely bring an influx of visitors, that is not expected to translate into sustained economic growth.2
Meetings ActivityRegionally, internal team meetings are expected to be the most prevalent type of meeting. However, there is no clear leader in Japan, with a range of between 13% and 18%. Respondents in Australia and China/Hong Kong report much more variation among meeting types, with conferences and tradeshows among the top three, and senior leadership and board meetings at the bottom.
In Australia and China/Hong Kong, activity levels are predicted to be up significantly in several categories over 2019 numbers, particularly in advisory boards in China/Hong Kong, by 4.8%, and incentives in Australia, by 3.1%. Explaining why they are optimistic about growth in incentives, a professional in the region commented, “Companies are placing more importance on education and reward and recognition.”
The number of attendees in the two countries is expected to be up across all meeting types; product launches lead the pack with increases of 4.0% in Australia and 3.7% in China/Hong Kong. Similarly, the number of days per meeting is also expected to be up in every category, ranging from a small 1.0% increase for incentives in China/Hong Kong to a substantial 4.5% increase in meeting length for product launches in Australia.
As professional in Australia said, “I feel there is always a need for events and this is an evolving and growing industry.” But the same interviewee noted that, “the economy in Australia is not strong and this could have impact on our industry here.”
By contrast, respondents in Japan are much more conservative in their expectations. Internal team, advisory boards, and incentives are all predicted to be either flat or slightly down; only conferences and tradeshows are expected to see any significant increase in activity level, by an anticipated 2.1%. Planners expect the number of
38 AMERICAN EXPRESS MEETINGS & EVENTS
2020 GLOBAL MEETINGS & EVENTS FORECAST 39
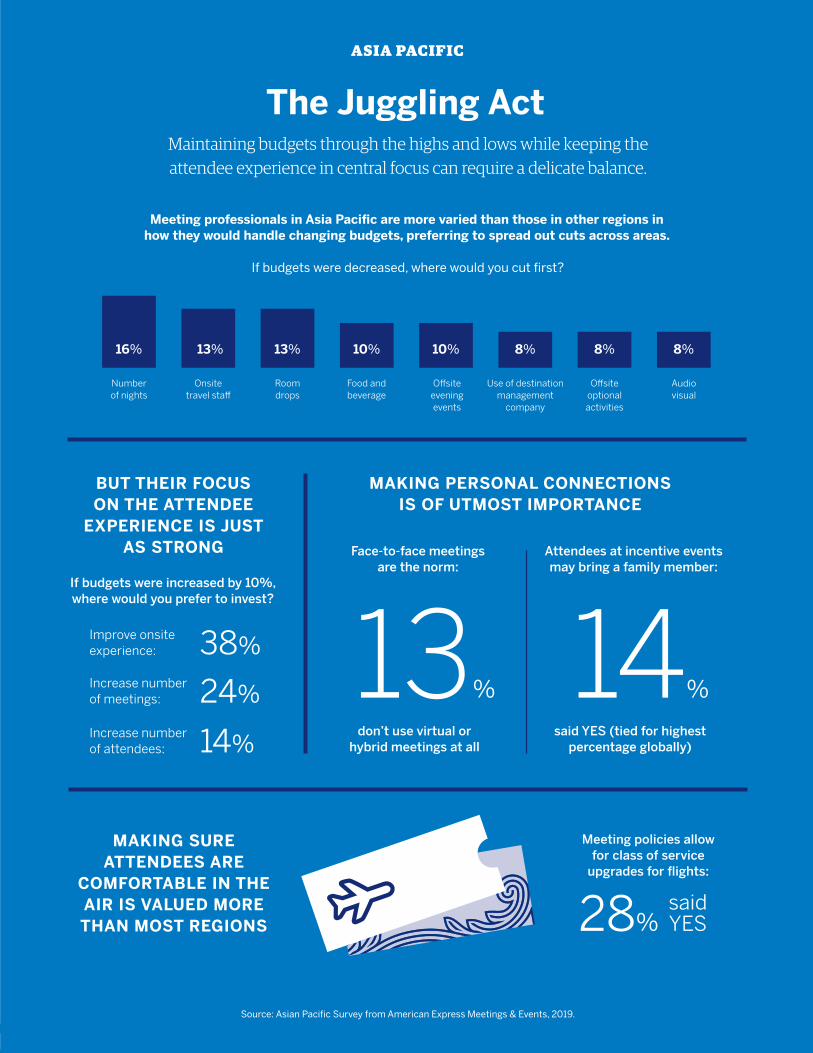
The Juggling Act
ASIA PACIFIC
Maintaining budgets through the highs and lows while keeping the attendee experience in central focus can require a delicate balance.
Meeting professionals in Asia Pacifi c are more varied than those in other regions in how they would handle changing budgets, preferring to spread out cuts across areas.
BUT THEIR FOCUS ON THE ATTENDEE
EXPERIENCE IS JUST AS STRONG
MAKING PERSONAL CONNECTIONS IS OF UTMOST IMPORTANCE
MAKING SURE ATTENDEES ARE
COMFORTABLE IN THE AIR IS VALUED MORE THAN MOST REGIONS
If budgets were decreased, where would you cut fi rst?
Improve onsite experience:
Increase number of meetings:
Increase number of attendees:
Use of destination management
company
Off site optional activities
Audio visual
Number of nights
Onsite travel staff
Room drops
Food and beverage
Off site evening events
38%
24%
14%
If budgets were increased by 10%, where would you prefer to invest?
Meeting policies allow for class of service
upgrades for fl ights:
said YES
Face-to-face meetings are the norm:
Attendees at incentive events may bring a family member:
don’t use virtual or hybrid meetings at all
said YES (tied for highest percentage globally)
13%
28%
14%
Source: Asian Pacifi c Survey from American Express Meetings & Events, 2019.
8% 8%16% 13% 13% 10% 10% 8%
attendees to stay flat or decline for every meeting type other than product launches, which have a predicted increase in attendees of 2.0%. Meeting length is also flat or down for all types other than conferences and tradeshows and product launches. The general feeling in Japan appears to be that internally focused meetings will not see growth and that budgets and time will be allocated toward the externally focused (i.e., more likely to produce revenue) events instead.
Meetings Budgets and PlanningNote: New in this year’s Forecast, cost per attendee is now on a per day basis, not a per event basis.
There is quite a variation in expected costs per attendee in the region, with the highest overall numbers in China/Hong Kong, which range from $713 to $860 per day, and the lowest in Australia, at $472 to $672. Internal team meetings are generally the meeting type with the lowest per attendee cost, although in Japan it’s incentives that are expected to have the lowest spend. On a year-over-year basis, cost per attendee is expected to rise significantly in Australia, by 2.3% to 4.5%, and moderately in China/Hong Kong, by 1.2% to 2.9%. Japanese respondents predict costs will stay stable when compared to last year.
Group air rates are expected to be up 1.7% in the region, which may be causing a shift in the type of flights planners are booking. A meeting professional in Singapore said, “We are seeing an increase in requests for low-cost carriers when we are managing the air component of a meeting. Meeting owners are citing this as one area that can yield a significant savings.”
Hotel rates are also expected to be up across the region, by 2.0% in China/Hong Kong and 3.7% in Australia. Even with the 2020 Summer Olympics in Tokyo, professionals in Japan predict group hotel rates to rise by a relatively modest 1.3%, which likely means that the increase in tourist traffic is not expected to affect space and availability for meetings and events.
Regionally, the overall meeting spend for 2020 is expected to be modestly higher than it was in 2019, by 1.3%. By country, that breaks down into an increase in Australia of 2.3%, an increase in China/Hong Kong of 1.5%, and no increase in Japan. When asked where they would cut costs first if their budgets were reduced, respondents were more likely than those in other regions to cut in a variety of areas, including number of nights, onsite travel staff and room drops. If their budgets increased, a solid 38% of planners say they would invest in improving onsite experience, while 24% would increase the number of meetings.
Meeting management policies are strongly in place in Asia Pacific, with respondents saying they have adopted policies that cover the main components in more than three-quarters of responses. They are also most likely of all regions to have explicit policies in place for capturing return on investment (ROI) metrics and procuring goods and services.
40 AMERICAN EXPRESS MEETINGS & EVENTS
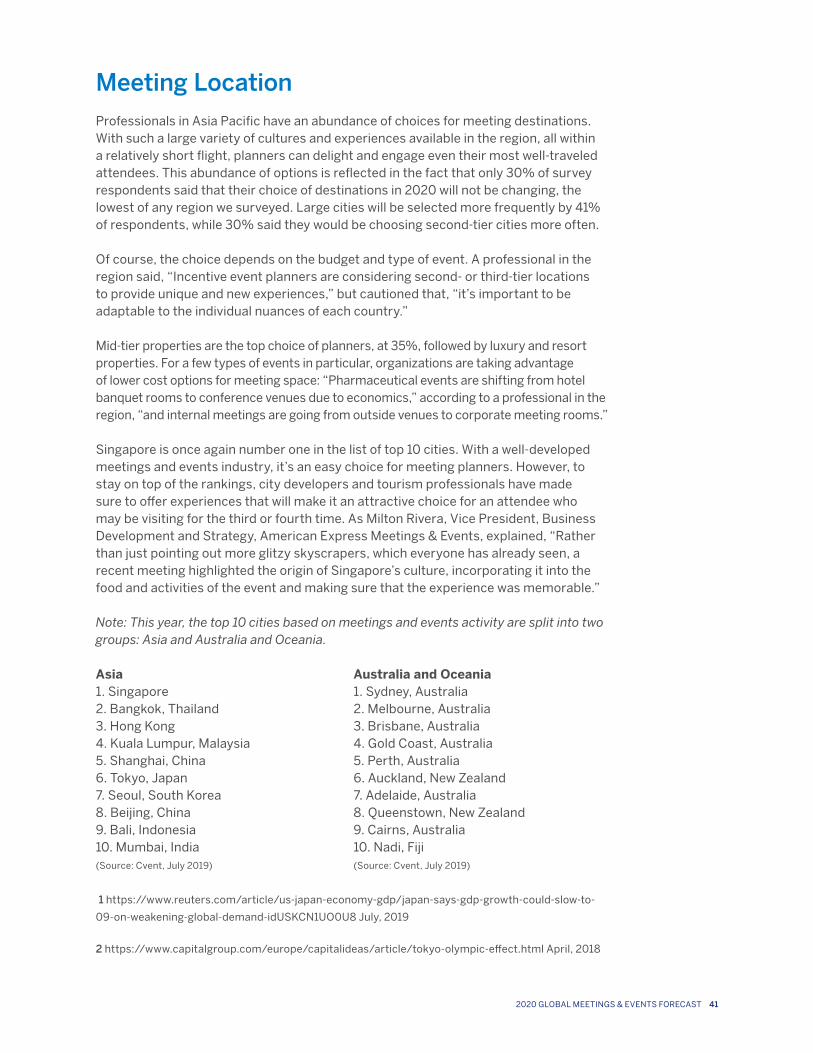
Meeting LocationProfessionals in Asia Pacific have an abundance of choices for meeting destinations. With such a large variety of cultures and experiences available in the region, all within a relatively short flight, planners can delight and engage even their most well-traveled attendees. This abundance of options is reflected in the fact that only 30% of survey respondents said that their choice of destinations in 2020 will not be changing, the lowest of any region we surveyed. Large cities will be selected more frequently by 41% of respondents, while 30% said they would be choosing second-tier cities more often.
Of course, the choice depends on the budget and type of event. A professional in the region said, “Incentive event planners are considering second- or third-tier locations to provide unique and new experiences,” but cautioned that, “it’s important to be adaptable to the individual nuances of each country.”
Mid-tier properties are the top choice of planners, at 35%, followed by luxury and resort properties. For a few types of events in particular, organizations are taking advantage of lower cost options for meeting space: “Pharmaceutical events are shifting from hotel banquet rooms to conference venues due to economics,” according to a professional in the region, “and internal meetings are going from outside venues to corporate meeting rooms.”
Singapore is once again number one in the list of top 10 cities. With a well-developed meetings and events industry, it’s an easy choice for meeting planners. However, to stay on top of the rankings, city developers and tourism professionals have made sure to offer experiences that will make it an attractive choice for an attendee who may be visiting for the third or fourth time. As Milton Rivera, Vice President, Business Development and Strategy, American Express Meetings & Events, explained, “Rather than just pointing out more glitzy skyscrapers, which everyone has already seen, a recent meeting highlighted the origin of Singapore’s culture, incorporating it into the food and activities of the event and making sure that the experience was memorable.”
Note: This year, the top 10 cities based on meetings and events activity are split into two groups: Asia and Australia and Oceania.
Asia1. Singapore 2. Bangkok, Thailand 3. Hong Kong 4. Kuala Lumpur, Malaysia 5. Shanghai, China 6. Tokyo, Japan 7. Seoul, South Korea 8. Beijing, China 9. Bali, Indonesia 10. Mumbai, India (Source: Cvent, July 2019)
Australia and Oceania1. Sydney, Australia 2. Melbourne, Australia 3. Brisbane, Australia 4. Gold Coast, Australia 5. Perth, Australia 6. Auckland, New Zealand 7. Adelaide, Australia 8. Queenstown, New Zealand 9. Cairns, Australia 10. Nadi, Fiji (Source: Cvent, July 2019)
1 https://www.reuters.com/article/us-japan-economy-gdp/japan-says-gdp-growth-could-slow-to-
09-on-weakening-global-demand-idUSKCN1UO0U8 July, 2019
2 https://www.capitalgroup.com/europe/capitalideas/article/tokyo-olympic-effect.html April, 2018
2020 GLOBAL MEETINGS & EVENTS FORECAST 41
42 AMERICAN EXPRESS MEETINGS & EVENTS
Looking for a great meeting space? Look no further than the
Moon Palace collection of luxury all-inclusive resorts.. With flexible
meeting spaces, stunning locations, and a concept that redefines
all-inclusive, blowing your clients’ minds has never been easier.
And when we say all-inclusive, we mean everything: room, tax,
and tips; unlimited gourmet dining, 24-hour room service; top-
shelf liquor (on site and in-room); fast, reliable Wi-Fi; free phone
calls to the U.S. and Canada; non-motorized watersports; nightly
entertainment and more. Nothing even comes close.
1-888-731-7625 Meetings.PalaceResorts.com
Moon Palace Cancun• 140,000 sq. ft. arena (10,000-person capacity)
• 90,000 sq. ft. expo center with ballroom and breakout rooms
• 45,000 sq. ft. convention center with banquet and exhibition halls and breakout rooms
The Grand at Moon Palace Cancun• 135,000 total sq. ft. of meeting and event space
• 32,000 sq. ft. Grand Ballroom divides into eight smaller rooms
Moon Palace Jamaica• 21,000 sq. ft. of event space
• Close to Jamaica’s most popular attractions
HOST THE BEST EVENTS UNDER THE SUN AT MOON
• Adults-only resorts
• Luxury all-inclusive
• No setup fees
• Expansive, flexible spaces
• Spectacular settings
• Private butler service
• Airport transfers included
• Luxe guest rooms
• World-class spas
• Epicurean restaurants
• Chic bars
1-888-731-7625
Meetings.PalaceResorts.com
FOR YOUR NEXT MEETING, PLAN ON BREATHTAKING
Central and South America
The overall portrait emerging from Central and South America is one of a region with a maturing meetings and events industry and an economy that is strong enough to drive growth. As a meeting professional in Latin America said, “I
think people are regaining their enthusiasm to attend meeting and events; they are recovering from bad economic times.”
Meetings ActivityUnlike the other regions surveyed for this Forecast, no type of meeting in Central and South America is expected to be particularly prevalent in 2020. With near parity between meeting types in both the region and in the country breakdowns, percentages range from 15% to 19% in Brazil, and 13% to 19% in Mexico. This is a change from last year, when internal team meetings were the clear leader, particularly in Mexico, where they were predicted to make up 31% of all meetings.
Respondents expect to see growth in the levels of every meeting type in 2020, although that growth will be more subdued in Mexico. The biggest year-over-year increase is predicted to be in Brazil, at 2.8% for product launches. That category is also the leader for the predicted increase in number of attendees in Brazil. There is growth expected in the number of attendees across the board with notable increases of 3.3% for advisory boards in Mexico and 3.0% for senior leadership and board meetings in Brazil.
Meeting length is expected to see moderate growth in 2020, although with increases mostly between 1.0% and 2.0% there will not be much practical difference in meeting length, compared to 2019. None of the meeting types show a decrease, though, which indicates that professionals are likely content with the current length of their meetings.
Meetings Budgets and PlanningNote: New in this year’s Forecast, cost per attendee is now on a per day basis, not a per event basis.
With a few exceptions, the cost per attendee per day is fairly consistent across meeting types. The lowest per-attendee cost predicted in countries surveyed is for internal team meetings, with Brazil predicting $598 per attendee, per day, and Mexico a little higher at $673. Only two types of meetings crack the $800 mark: product launches in Brazil, and incentives in Mexico. Both of those categories are expected to be higher due
2020 GLOBAL MEETINGS & EVENTS FORECAST 43
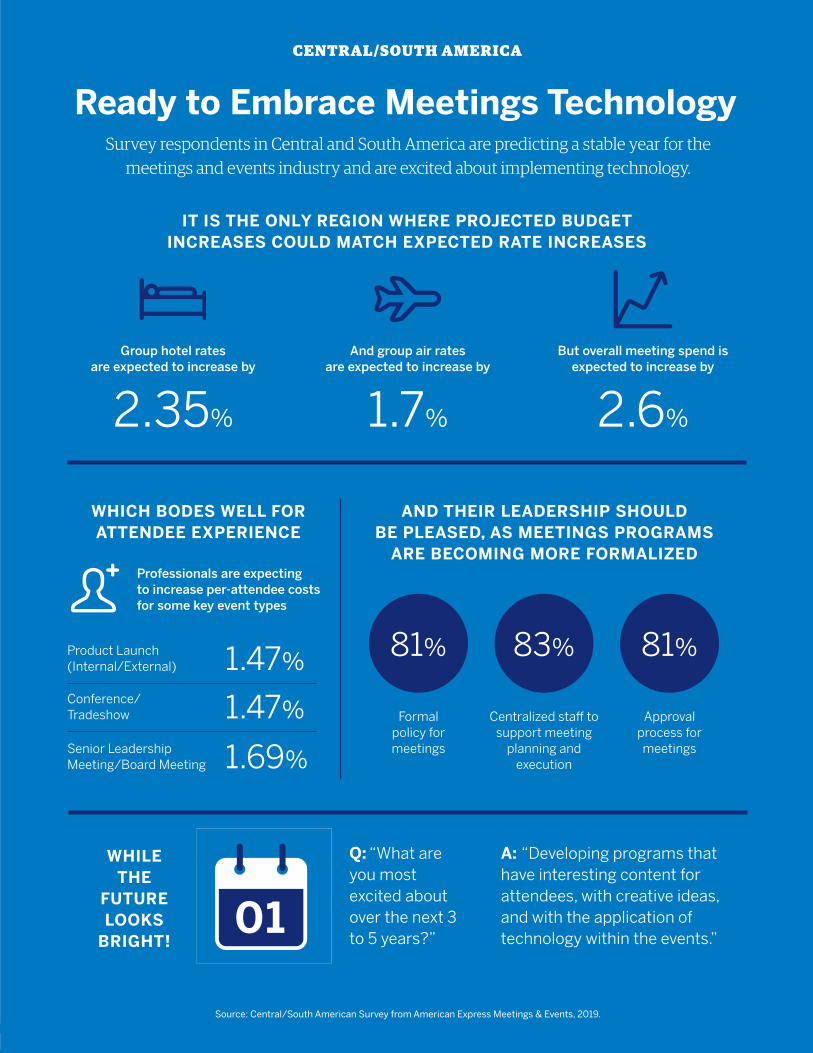
44 AMERICAN EXPRESS MEETINGS & EVENTS
Ready to Embrace Meetings Technology
CENTRAL/SOUTH AMERICA
Survey respondents in Central and South America are predicting a stable year for the meetings and events industry and are excited about implementing technology.
IT IS THE ONLY REGION WHERE PROJECTED BUDGET INCREASES COULD MATCH EXPECTED RATE INCREASES
WHICH BODES WELL FOR ATTENDEE EXPERIENCE
AND THEIR LEADERSHIP SHOULD BE PLEASED, AS MEETINGS PROGRAMS
ARE BECOMING MORE FORMALIZED
WHILE THE
FUTURE LOOKS
BRIGHT!
Product Launch (Internal/External)
Conference/Tradeshow
Senior Leadership Meeting/Board Meeting
Formal policy for meetings
Centralized staff to support meeting
planning and execution
Approval process for meetings
1.47%
1.47%
1.69%
Professionals are expecting to increase per-attendee costs for some key event types
Group hotel rates are expected to increase by
And group air rates are expected to increase by
But overall meeting spend is expected to increase by
2.35% 1.7% 2.6%
81% 83% 81%
A: “Developing programs that have interesting content for attendees, with creative ideas, and with the application of technology within the events.”
Q: “What are you most excited about over the next 3 to 5 years?”
Source: Central/South American Survey from American Express Meetings & Events, 2019.
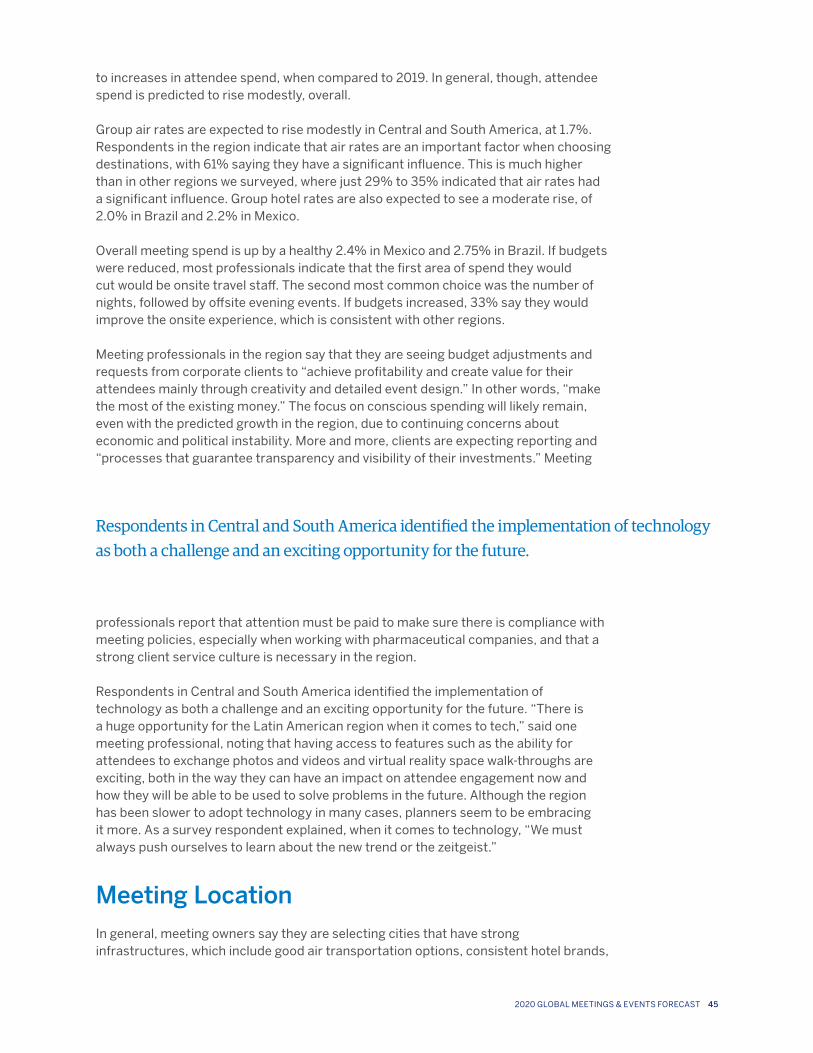
to increases in attendee spend, when compared to 2019. In general, though, attendee spend is predicted to rise modestly, overall.
Group air rates are expected to rise modestly in Central and South America, at 1.7%. Respondents in the region indicate that air rates are an important factor when choosing destinations, with 61% saying they have a significant influence. This is much higher than in other regions we surveyed, where just 29% to 35% indicated that air rates had a significant influence. Group hotel rates are also expected to see a moderate rise, of 2.0% in Brazil and 2.2% in Mexico.
Overall meeting spend is up by a healthy 2.4% in Mexico and 2.75% in Brazil. If budgets were reduced, most professionals indicate that the first area of spend they would cut would be onsite travel staff. The second most common choice was the number of nights, followed by offsite evening events. If budgets increased, 33% say they would improve the onsite experience, which is consistent with other regions.
Meeting professionals in the region say that they are seeing budget adjustments and requests from corporate clients to “achieve profitability and create value for their attendees mainly through creativity and detailed event design.” In other words, “make the most of the existing money.” The focus on conscious spending will likely remain, even with the predicted growth in the region, due to continuing concerns about economic and political instability. More and more, clients are expecting reporting and “processes that guarantee transparency and visibility of their investments.” Meeting
professionals report that attention must be paid to make sure there is compliance with meeting policies, especially when working with pharmaceutical companies, and that a strong client service culture is necessary in the region.
Respondents in Central and South America identified the implementation of technology as both a challenge and an exciting opportunity for the future. “There is a huge opportunity for the Latin American region when it comes to tech,” said one meeting professional, noting that having access to features such as the ability for attendees to exchange photos and videos and virtual reality space walk-throughs are exciting, both in the way they can have an impact on attendee engagement now and how they will be able to be used to solve problems in the future. Although the region has been slower to adopt technology in many cases, planners seem to be embracing it more. As a survey respondent explained, when it comes to technology, “We must always push ourselves to learn about the new trend or the zeitgeist.”
Meeting LocationIn general, meeting owners say they are selecting cities that have strong infrastructures, which include good air transportation options, consistent hotel brands,
Respondents in Central and South America identified the implementation of technology as both a challenge and an exciting opportunity for the future.
2020 GLOBAL MEETINGS & EVENTS FORECAST 45
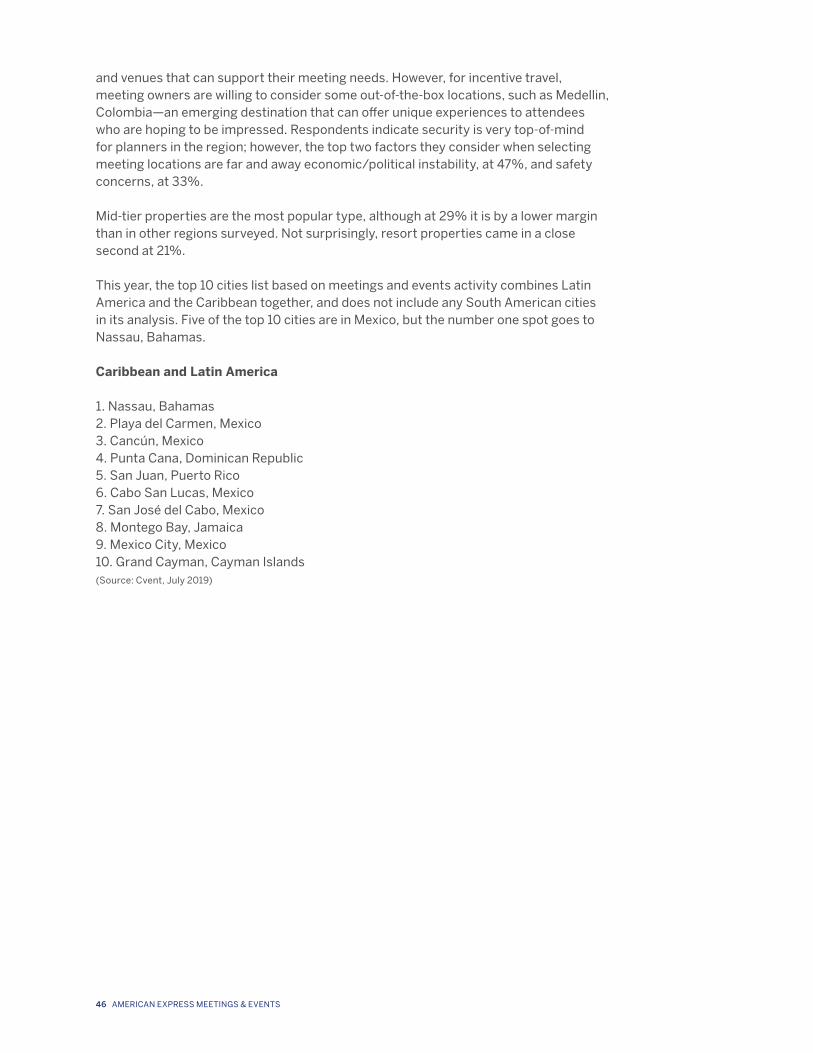
and venues that can support their meeting needs. However, for incentive travel, meeting owners are willing to consider some out-of-the-box locations, such as Medellin, Colombia—an emerging destination that can offer unique experiences to attendees who are hoping to be impressed. Respondents indicate security is very top-of-mind for planners in the region; however, the top two factors they consider when selecting meeting locations are far and away economic/political instability, at 47%, and safety concerns, at 33%.
Mid-tier properties are the most popular type, although at 29% it is by a lower margin than in other regions surveyed. Not surprisingly, resort properties came in a close second at 21%.
This year, the top 10 cities list based on meetings and events activity combines Latin America and the Caribbean together, and does not include any South American cities in its analysis. Five of the top 10 cities are in Mexico, but the number one spot goes to Nassau, Bahamas.
Caribbean and Latin America
1. Nassau, Bahamas 2. Playa del Carmen, Mexico 3. Cancún, Mexico 4. Punta Cana, Dominican Republic 5. San Juan, Puerto Rico 6. Cabo San Lucas, Mexico 7. San José del Cabo, Mexico 8. Montego Bay, Jamaica 9. Mexico City, Mexico 10. Grand Cayman, Cayman Islands (Source: Cvent, July 2019)
46 AMERICAN EXPRESS MEETINGS & EVENTS

Special Sections
SECTION 4
2020 GLOBAL MEETINGS & EVENTS FORECAST 47

48 AMERICAN EXPRESS MEETINGS & EVENTS
hen you think of a corporate reward trip, you’re likely to
picture a remote tropical island, white sands, and floating
villas. However, if you asked your participants what
their dream holiday would entail, you would be unlikely
to receive one single consistent answer. Rather, you would find some
seeking adventure into the unknown, others looking for five-star luxury, or
many wishing to tick off a location on their bucket list. And that’s without
considering a host of smaller details, preferred method of transport;
Airbnb vs hotel; or all-inclusive vs self-catering. So why then, would we
often offer just one option when it comes to incentive travel?
Delivering a Personalised Incentive Travel Programme – Why and HowBy Banks Sadler
S P E C I A L S E C T I O N S
2020 GLOBAL MEETINGS & EVENTS FORECAST 49
In our modern world, travel is much more accessible, with destinations that once seemed too luxurious now more attainable for the average
traveller. Social media and online platforms, such as TripAdvisor, provide leisure travellers an overload of options and information to completely tailor their trips.
How then can we design incentive travel programmes that deliver on consumer expectations to personalise an experience but also create a trip of a lifetime that would otherwise be unattainable?
According to a recent Salesforce report, 73% of customers expect companies to understand their needs and expectations – to be recognized and understood as an individual.1 This same notion should be replicated in the workplace with brands investing in getting to know their people and adapting their recognition programs accordingly. To help participants feel valued, inspired, and driven to perform, experiences should incorporate individual preferences; whilst luxury and exclusivity remain important, personalisation is of equal significance. In this paper, we will explore how to deliver a tailored incentive to maximise participant motivation and ultimately deliver against business objectives.
Ask the questions
Before you consider the details of your incentive programme, it is essential to get to know your participants and ask that initial question of what their dream trip would entail. Running a survey before you make any key decisions may offer surprising results, such as their preferred trip duration, favoured destinations, or style of itinerary. This is also a perfect opportunity to uncover the people behind the role – are they already keen travellers? Have they earned incentives previously? How do they prefer to travel? You’ll also want to gather feedback following the trip, closing the loop for programmes that extend over multiple years.
When winners have been selected, use the full scope of registration platforms to further identify individual preferences. Going the extra mile to ask participants ahead of time about their preferred amenities, favourite beverages, room temperature, and more allows for personal touches throughout their stay.
By collecting this data – and curating your incentive accordingly – you’ll demonstrate your company’s interest and investment in your employees. Revealing a trip that they themselves have designed will raise the performance bar, increase the desire to earn, and set a strong foundation for a truly personalised programme.
Take communication to the next level
An incentive starts the moment any form of detail is announced to the workforce, typically 6-12 months before the event. From teaser campaigns to
destination reveals, invitations to registration, this planning process is almost as important as the trip itself. Many of these elements are a standard point of call for simple personalisation, so how can we take communication to the next level?
A bespoke event identity is a simple, yet effective way to weave a personalised thread through your incentive communications. Promoting an air of exclusivity with an analogy such as President’s Club or Club 100 is a powerful method of heightening your incentive programme’s desirability. However, you can tap into this even further by playing on
A bespoke event identity is a
simple, yet effective way to weave
a personalised thread through
your incentive communications.
Promoting an air of exclusivity with
an analogy such as President’s Club
or Club 100 is a powerful method
of heightening your incentive
programme’s desirability.
S P E C I A L S E C T I O N S
50 AMERICAN EXPRESS MEETINGS & EVENTS
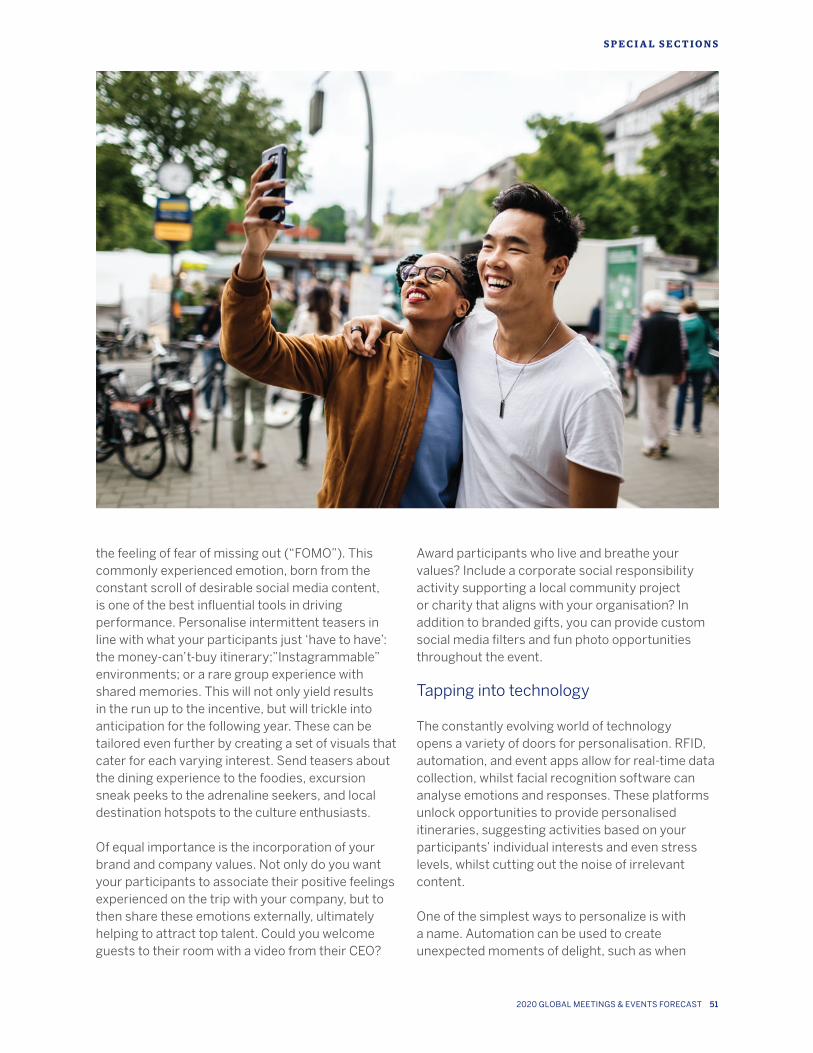
the feeling of fear of missing out (“FOMO”). This commonly experienced emotion, born from the constant scroll of desirable social media content, is one of the best influential tools in driving performance. Personalise intermittent teasers in line with what your participants just ‘have to have’: the money-can’t-buy itinerary;”Instagrammable” environments; or a rare group experience with shared memories. This will not only yield results in the run up to the incentive, but will trickle into anticipation for the following year. These can be tailored even further by creating a set of visuals that cater for each varying interest. Send teasers about the dining experience to the foodies, excursion sneak peeks to the adrenaline seekers, and local destination hotspots to the culture enthusiasts.
Of equal importance is the incorporation of your brand and company values. Not only do you want your participants to associate their positive feelings experienced on the trip with your company, but to then share these emotions externally, ultimately helping to attract top talent. Could you welcome guests to their room with a video from their CEO?
Award participants who live and breathe your values? Include a corporate social responsibility activity supporting a local community project or charity that aligns with your organisation? In addition to branded gifts, you can provide custom social media filters and fun photo opportunities throughout the event.
Tapping into technology
The constantly evolving world of technology opens a variety of doors for personalisation. RFID, automation, and event apps allow for real-time data collection, whilst facial recognition software can analyse emotions and responses. These platforms unlock opportunities to provide personalised itineraries, suggesting activities based on your participants’ individual interests and even stress levels, whilst cutting out the noise of irrelevant content.
One of the simplest ways to personalize is with a name. Automation can be used to create unexpected moments of delight, such as when
S P E C I A L S E C T I O N S
2020 GLOBAL MEETINGS & EVENTS FORECAST 51
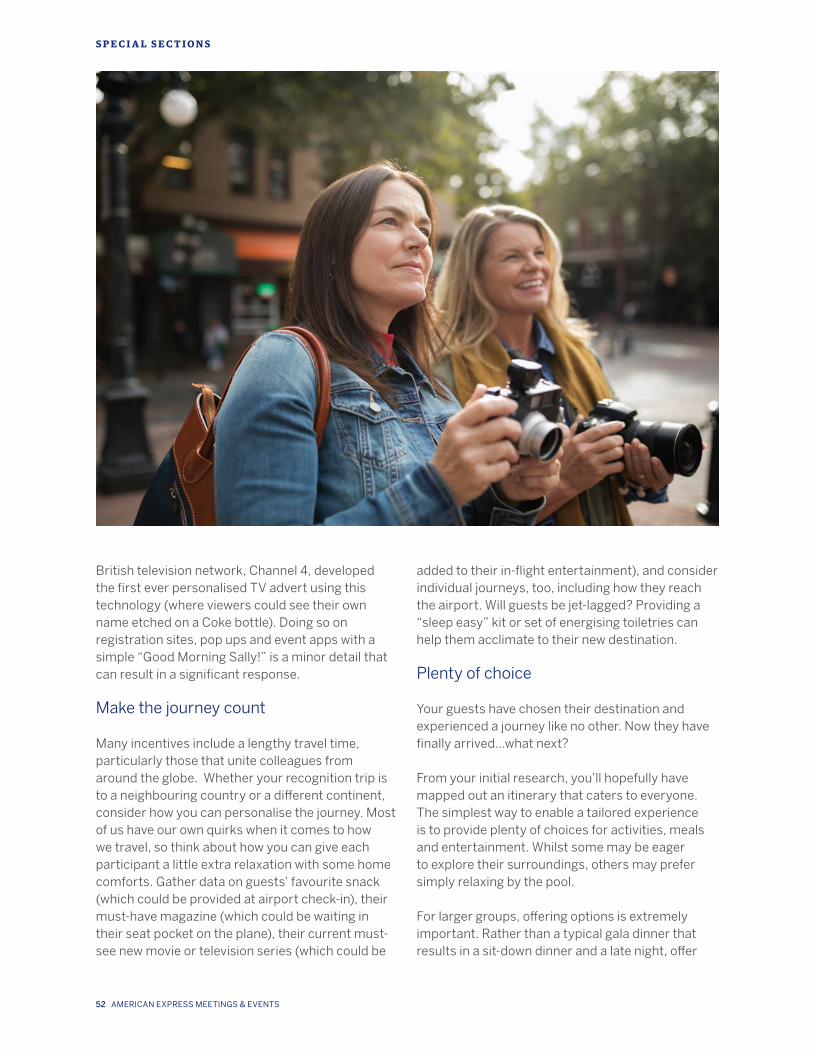
British television network, Channel 4, developed the first ever personalised TV advert using this technology (where viewers could see their own name etched on a Coke bottle). Doing so on registration sites, pop ups and event apps with a simple “Good Morning Sally!” is a minor detail that can result in a significant response.
Make the journey count
Many incentives include a lengthy travel time, particularly those that unite colleagues from around the globe. Whether your recognition trip is to a neighbouring country or a different continent, consider how you can personalise the journey. Most of us have our own quirks when it comes to how we travel, so think about how you can give each participant a little extra relaxation with some home comforts. Gather data on guests’ favourite snack (which could be provided at airport check-in), their must-have magazine (which could be waiting in their seat pocket on the plane), their current must-see new movie or television series (which could be
added to their in-flight entertainment), and consider individual journeys, too, including how they reach the airport. Will guests be jet-lagged? Providing a “sleep easy” kit or set of energising toiletries can help them acclimate to their new destination.
Plenty of choice
Your guests have chosen their destination and experienced a journey like no other. Now they have finally arrived…what next?
From your initial research, you’ll hopefully have mapped out an itinerary that caters to everyone. The simplest way to enable a tailored experience is to provide plenty of choices for activities, meals and entertainment. Whilst some may be eager to explore their surroundings, others may prefer simply relaxing by the pool.
For larger groups, offering options is extremely important. Rather than a typical gala dinner that results in a sit-down dinner and a late night, offer
S P E C I A L S E C T I O N S
52 AMERICAN EXPRESS MEETINGS & EVENTS
up alternatives for those who’d prefer a quieter evening. Similarly, providing a food and beverage allowances instead of selecting a set restaurant for each meal enables guests to eat the cuisine of their choice at a restaurant they want to be in, at a time that suits them.
A personal touch goes a long way
One of the most successful methods of stimulating positive emotion is with surprise. Deliver unexpected moments both during the incentive and post-trip and use gifts to create a permanent memory of their experience. A pop-up gift shop allows guests to pick their own luxury item; gifts
such as Nike trainers or designer sunglasses can be individually designed, and a framed print from the trip given on the return home creates longevity.
Don’t forget to involve your suppliers, from the hotel staff to the activity organisers. Whether it’s remembering guests’ names or bringing them an item they forgot to pack, these little touches turn a group holiday into a personalised reward. Additionally, many leading hotel chains have Internet-of- Things-enabled bedrooms which enhance personalised experiences from a guest’s preferred mini-bar stock or pillow choice to their favourite TV channel. Begin early conversations
with your accommodation provider to discover how they can go the extra mile for your participants. And if your guests are bringing their partners, consider their preferences too. This important group will be allies when it comes to motivating participants to win a place at next year’s incentive – their enthusiasm and loyalty is crucial in supporting your winners!
Conclusion
Personalisation can be incorporated into almost any element of an incentive programme - from high-tech solutions to tailored itineraries, to small personal touches and simply using the impact of a name. There is a wealth of opportunities to deliver an experience that is not just a structured trip but, is in fact, a considered, individually designed reward made specifically for your participants. Ultimately, these methods combine to intensify positive emotions associated with your brand, leading to heightened motivation, loyalty, and performance.
1 Third Edition: State of the Connected Customer Report (Salesforce Research, June 2019) https://www.salesforce.com/blog/2019/06/customer-engagement-trends.html
Don’t forget to involve
your suppliers, from the hotel
staff to the activity organisers.
Whether it’s remembering guests’
names or bringing them an item
they forgot to pack, these little
touches turn a group holiday into a
personalised reward.
S P E C I A L S E C T I O N S
2020 GLOBAL MEETINGS & EVENTS FORECAST 53

54 AMERICAN EXPRESS MEETINGS & EVENTS
S P E C I A L S E C T I O N S
hen we think of the meetings and events industry, our
minds are often cast to large-scale conferences or
complex and exciting incentive trips. However, according
to a recent study by the Global Business Travel
Association (GBTA) – How Do Companies Approach Simple Meetings?
– 50% of all corporate meetings are “simple meetings.”1 What’s more,
some of our own clients report small meetings make up to 80% of their
meetings portfolio.
Small Meetings - The Next Frontier of Meetings ManagementSmall and Simple Meetings Coming into Focus
2020 GLOBAL MEETINGS & EVENTS FORECAST 55
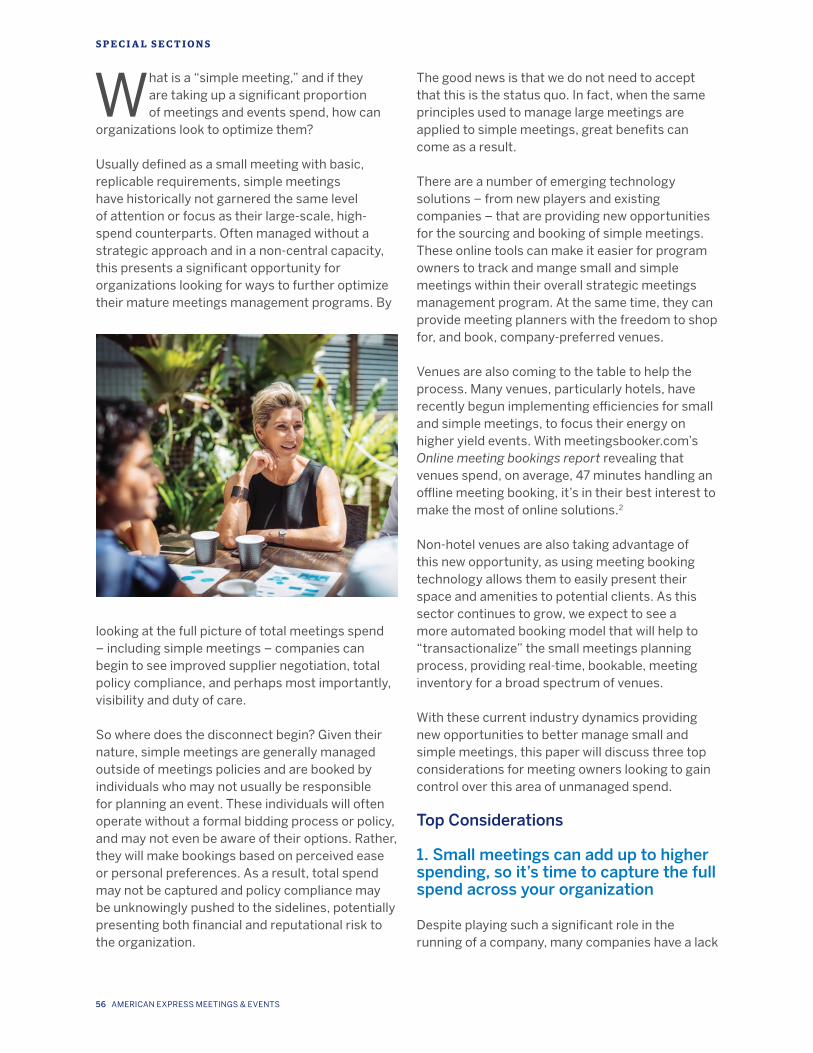
What is a “simple meeting,” and if they are taking up a significant proportion of meetings and events spend, how can
organizations look to optimize them?
Usually defined as a small meeting with basic, replicable requirements, simple meetings have historically not garnered the same level of attention or focus as their large-scale, high-spend counterparts. Often managed without a strategic approach and in a non-central capacity, this presents a significant opportunity for organizations looking for ways to further optimize their mature meetings management programs. By
looking at the full picture of total meetings spend – including simple meetings – companies can begin to see improved supplier negotiation, total policy compliance, and perhaps most importantly, visibility and duty of care.
So where does the disconnect begin? Given their nature, simple meetings are generally managed outside of meetings policies and are booked by individuals who may not usually be responsible for planning an event. These individuals will often operate without a formal bidding process or policy, and may not even be aware of their options. Rather, they will make bookings based on perceived ease or personal preferences. As a result, total spend may not be captured and policy compliance may be unknowingly pushed to the sidelines, potentially presenting both financial and reputational risk to the organization.
The good news is that we do not need to accept that this is the status quo. In fact, when the same principles used to manage large meetings are applied to simple meetings, great benefits can come as a result.
There are a number of emerging technology solutions – from new players and existing companies – that are providing new opportunities for the sourcing and booking of simple meetings. These online tools can make it easier for program owners to track and mange small and simple meetings within their overall strategic meetings management program. At the same time, they can provide meeting planners with the freedom to shop for, and book, company-preferred venues.
Venues are also coming to the table to help the process. Many venues, particularly hotels, have recently begun implementing efficiencies for small and simple meetings, to focus their energy on higher yield events. With meetingsbooker.com’s Online meeting bookings report revealing that venues spend, on average, 47 minutes handling an offline meeting booking, it’s in their best interest to make the most of online solutions.2
Non-hotel venues are also taking advantage of this new opportunity, as using meeting booking technology allows them to easily present their space and amenities to potential clients. As this sector continues to grow, we expect to see a more automated booking model that will help to “transactionalize” the small meetings planning process, providing real-time, bookable, meeting inventory for a broad spectrum of venues.
With these current industry dynamics providing new opportunities to better manage small and simple meetings, this paper will discuss three top considerations for meeting owners looking to gain control over this area of unmanaged spend.
Top Considerations
1. Small meetings can add up to higher spending, so it’s time to capture the full spend across your organization
Despite playing such a significant role in the running of a company, many companies have a lack
S P E C I A L S E C T I O N S
56 AMERICAN EXPRESS MEETINGS & EVENTS
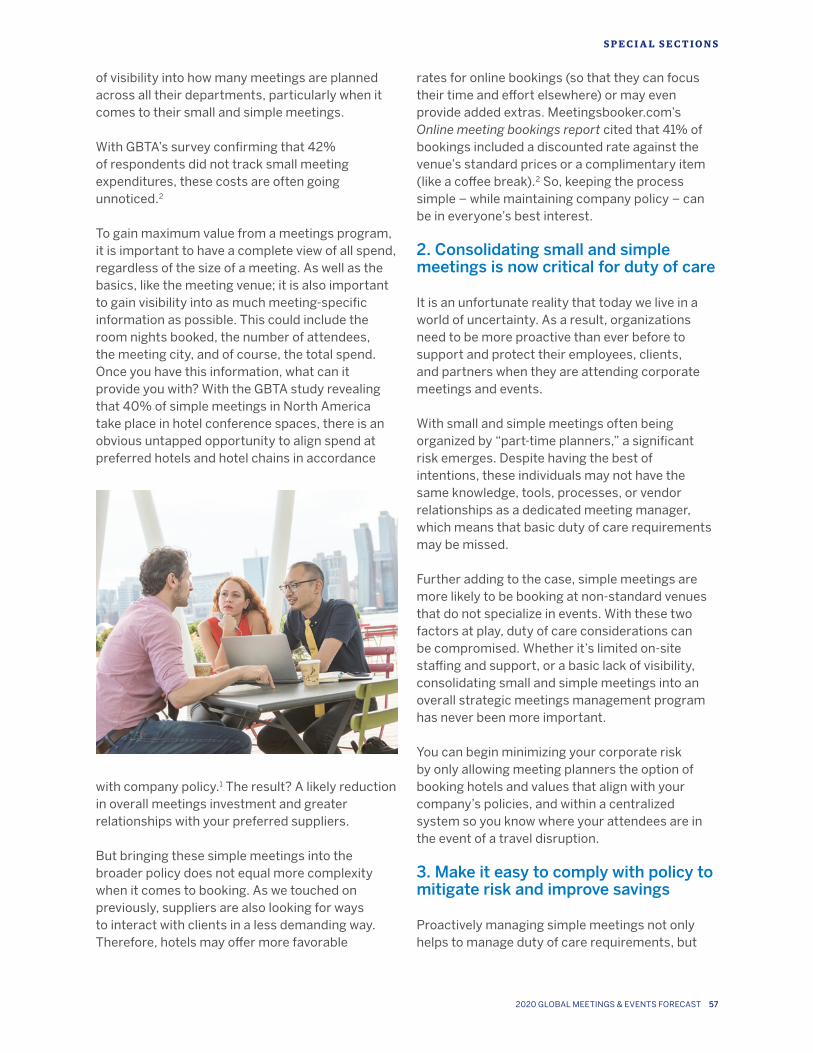
of visibility into how many meetings are planned across all their departments, particularly when it comes to their small and simple meetings.
With GBTA’s survey confirming that 42% of respondents did not track small meeting expenditures, these costs are often going unnoticed.2
To gain maximum value from a meetings program, it is important to have a complete view of all spend, regardless of the size of a meeting. As well as the basics, like the meeting venue; it is also important to gain visibility into as much meeting-specific information as possible. This could include the room nights booked, the number of attendees, the meeting city, and of course, the total spend. Once you have this information, what can it provide you with? With the GBTA study revealing that 40% of simple meetings in North America take place in hotel conference spaces, there is an obvious untapped opportunity to align spend at preferred hotels and hotel chains in accordance
with company policy.1 The result? A likely reduction in overall meetings investment and greater relationships with your preferred suppliers.
But bringing these simple meetings into the broader policy does not equal more complexity when it comes to booking. As we touched on previously, suppliers are also looking for ways to interact with clients in a less demanding way. Therefore, hotels may offer more favorable
rates for online bookings (so that they can focus their time and effort elsewhere) or may even provide added extras. Meetingsbooker.com’s Online meeting bookings report cited that 41% of bookings included a discounted rate against the venue’s standard prices or a complimentary item (like a coffee break).2 So, keeping the process simple – while maintaining company policy – can be in everyone’s best interest.
2. Consolidating small and simple meetings is now critical for duty of care
It is an unfortunate reality that today we live in a world of uncertainty. As a result, organizations need to be more proactive than ever before to support and protect their employees, clients, and partners when they are attending corporate meetings and events.
With small and simple meetings often being organized by “part-time planners,” a significant risk emerges. Despite having the best of intentions, these individuals may not have the same knowledge, tools, processes, or vendor relationships as a dedicated meeting manager, which means that basic duty of care requirements may be missed.
Further adding to the case, simple meetings are more likely to be booking at non-standard venues that do not specialize in events. With these two factors at play, duty of care considerations can be compromised. Whether it’s limited on-site staffing and support, or a basic lack of visibility, consolidating small and simple meetings into an overall strategic meetings management program has never been more important.
You can begin minimizing your corporate risk by only allowing meeting planners the option of booking hotels and values that align with your company’s policies, and within a centralized system so you know where your attendees are in the event of a travel disruption.
3. Make it easy to comply with policy to mitigate risk and improve savings
Proactively managing simple meetings not only helps to manage duty of care requirements, but
S P E C I A L S E C T I O N S
2020 GLOBAL MEETINGS & EVENTS FORECAST 57
can also help to mitigate other risks, including, but not limited to financial risks associated with appropriate cancellation and attrition terms, food and beverage minimum clauses, or legal risks arising from poorly written contracts (or worse, no contract in place at all). The key to making this work? Making it easy for meeting organizers to comply.
When looking at simple meetings, organizers are typically non-sourcing professionals, so extra care needs to be taken, with proper guardrails in place, to improve program effectiveness. Whether it’s an HR professional, a marketing executive, salesperson, or administrative team member managing the meeting, it’s important they make decisions that are in your company’s best interests, otherwise they could unknowingly be costing your organization more money while increasing your risk exposure.
A recent article from Corporate & Incentive Travel magazine, titled “The Costs and Benefits of Managing Small Meetings,” explored whether it was worth the effort and cost to manage small meetings. The answer they came to? It depends. But if your organization has risk management and cost savings as a focus, it’s a yes.
Much of the article focused on risk and an organization’s tolerance for risk. This includes where meetings take place, who the attendees are, and how much is spent. The article showcases that the sector is large and seemingly untapped. They cite Groupize, a small meetings technology provider, whose e-book, Small Meetings are the Wild, Wild West, showcased that 66% of all meetings in the United States have fewer than 50 attendees, which represents a huge $124 billion in annual spend.3
To help improve compliance to policy, organizations should make it as simple as possible for employees to follow the rules. It’s worth investing in processes that make things easy. Every day, we are seeing the increasing digitalization of meetings, so it’s time to take advantage of it. Using online booking tools can help meet your organizational needs, but it’s also meeting your employees where they’re at. As consumers, your team members are likely used to booking their
leisure and business travel online, so similar “shopping” experiences when booking meetings should be the norm.
It shouldn’t come as a surprise that this is what team members are already doing. According to the GBTA study, almost half (48%) of simple meeting planners do not use a “managed” meetings channel when booking. When asked how they source information for potential hotels and venues for simple meetings, 77% of respondents said they used only consumer channels.1
Further proving the point, 72% of respondents who have an e-RFP tool available to them for sourcing small meetings say they prefer to use it for submitting RFPs for their simple meetings. This shows there is a significant opportunity to align activities with the booking tools that are available.1 While there may not yet be one single tool to manage the integration between small meetings tools and sourcing functionalities, there are a variety of platforms that can be mapped together to provide the continuity and coverage that organizations seek.
With new and improved technology solutions available for venue sourcing – many of which have high functionality, are consumer-like in look and feel and can provide meeting planners with one global interface – program owners can tackle tracking and managing all meetings, even small and simple ones.
1 How Do Companies Approach Simple Meetings? Global Business Travel Association (GBTA), July 2018
2 Online meeting bookings report Meetingsbooker.com, March 2018
3 The Costs and Benefits of Managing Small Meetings The MeetingMagazines.com, Corporate & Incentive Travel, October 2017
S P E C I A L S E C T I O N S
58 AMERICAN EXPRESS MEETINGS & EVENTS
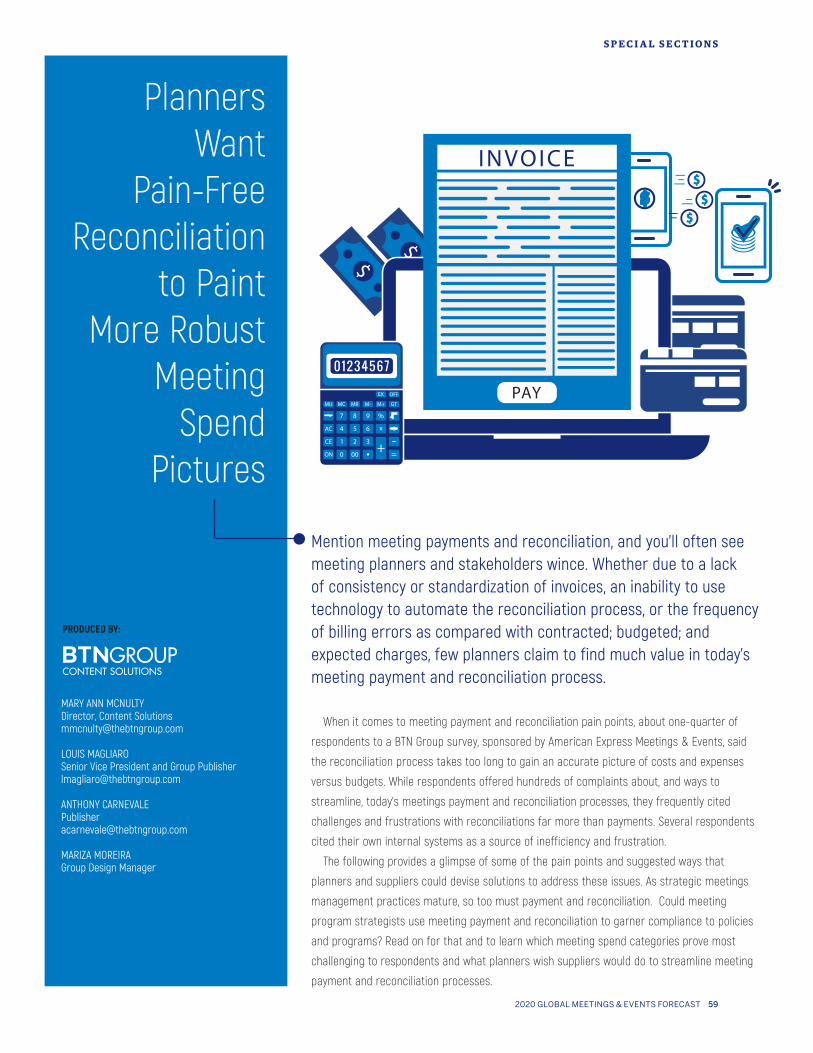
Pain-Free
Planners Want
Pain-Free Reconciliation
to Paint More Robust
Meeting Spend
Pictures
Mention meeting payments and reconciliation, and you’ll often see meeting planners and stakeholders wince. Whether due to a lack of consistency or standardization of invoices, an inability to use technology to automate the reconciliation process, or the frequency of billing errors as compared with contracted; budgeted; and expected charges, few planners claim to find much value in today’s meeting payment and reconciliation process.
When it comes to meeting payment and reconciliation pain points, about one-quarter of
respondents to a BTN Group survey, sponsored by American Express Meetings & Events, said
the reconciliation process takes too long to gain an accurate picture of costs and expenses
versus budgets. While respondents offered hundreds of complaints about, and ways to
streamline, today’s meetings payment and reconciliation processes, they frequently cited
challenges and frustrations with reconciliations far more than payments. Several respondents
cited their own internal systems as a source of inefficiency and frustration.
The following provides a glimpse of some of the pain points and suggested ways that
planners and suppliers could devise solutions to address these issues. As strategic meetings
management practices mature, so too must payment and reconciliation. Could meeting
program strategists use meeting payment and reconciliation to garner compliance to policies
and programs? Read on for that and to learn which meeting spend categories prove most
challenging to respondents and what planners wish suppliers would do to streamline meeting
payment and reconciliation processes.
MARY ANN MCNULTYDirector, Content [email protected]
LOUIS MAGLIAROSenior Vice President and Group [email protected]
ANTHONY [email protected]
MARIZA MOREIRAGroup Design Manager
PRODUCED BY:
2020 GLOBAL MEETINGS & EVENTS FORECAST 59
S P E C I A L S E C T I O N S
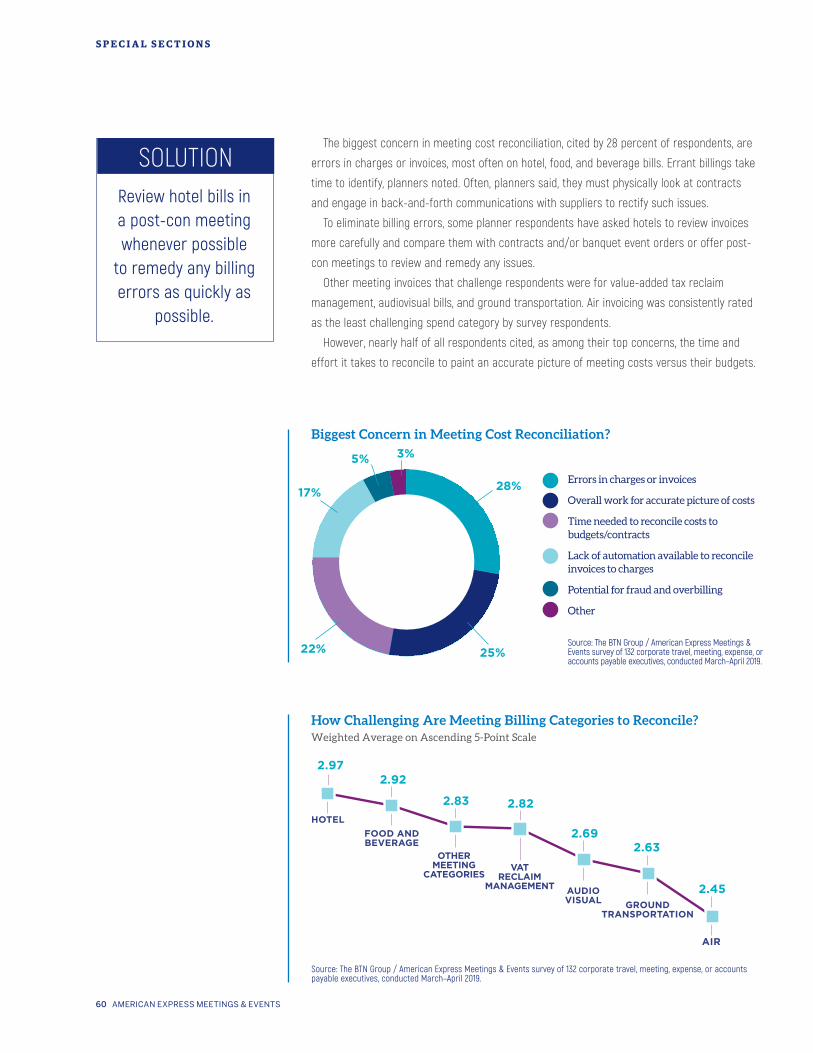
The biggest concern in meeting cost reconciliation, cited by 28 percent of respondents, are
errors in charges or invoices, most often on hotel, food, and beverage bills. Errant billings take
time to identify, planners noted. Often, planners said, they must physically look at contracts
and engage in back-and-forth communications with suppliers to rectify such issues.
To eliminate billing errors, some planner respondents have asked hotels to review invoices
more carefully and compare them with contracts and/or banquet event orders or offer post-
con meetings to review and remedy any issues.
Other meeting invoices that challenge respondents were for value-added tax reclaim
management, audiovisual bills, and ground transportation. Air invoicing was consistently rated
as the least challenging spend category by survey respondents.
However, nearly half of all respondents cited, as among their top concerns, the time and
effort it takes to reconcile to paint an accurate picture of meeting costs versus their budgets.
Errors in charges or invoices
Overall work for accurate picture of costs
Time needed to reconcile costs to budgets/contracts
Lack of automation available to reconcile invoices to charges
Potential for fraud and overbilling
Other
Source: The BTN Group / American Express Meetings & Events survey of 132 corporate travel, meeting, expense, or accounts payable executives, conducted March–April 2019.
Biggest Concern in Meeting Cost Reconciliation?
How Challenging Are Meeting Billing Categories to Reconcile? Weighted Average on Ascending 5-Point Scale
GROUND TRANSPORTATION
AIR
OTHER MEETING
CATEGORIES
FOOD AND BEVERAGE
HOTEL
2.97
17%
22% 25%
28%
3%5%
2.92
2.83 2.82
2.692.63
2.45AUDIO VISUAL
VAT RECLAIM
MANAGEMENT
Source: The BTN Group / American Express Meetings & Events survey of 132 corporate travel, meeting, expense, or accounts payable executives, conducted March–April 2019.
SOLUTIONReview hotel bills in a post-con meeting whenever possible
to remedy any billing errors as quickly as
possible.
60 AMERICAN EXPRESS MEETINGS & EVENTS
S P E C I A L S E C T I O N S
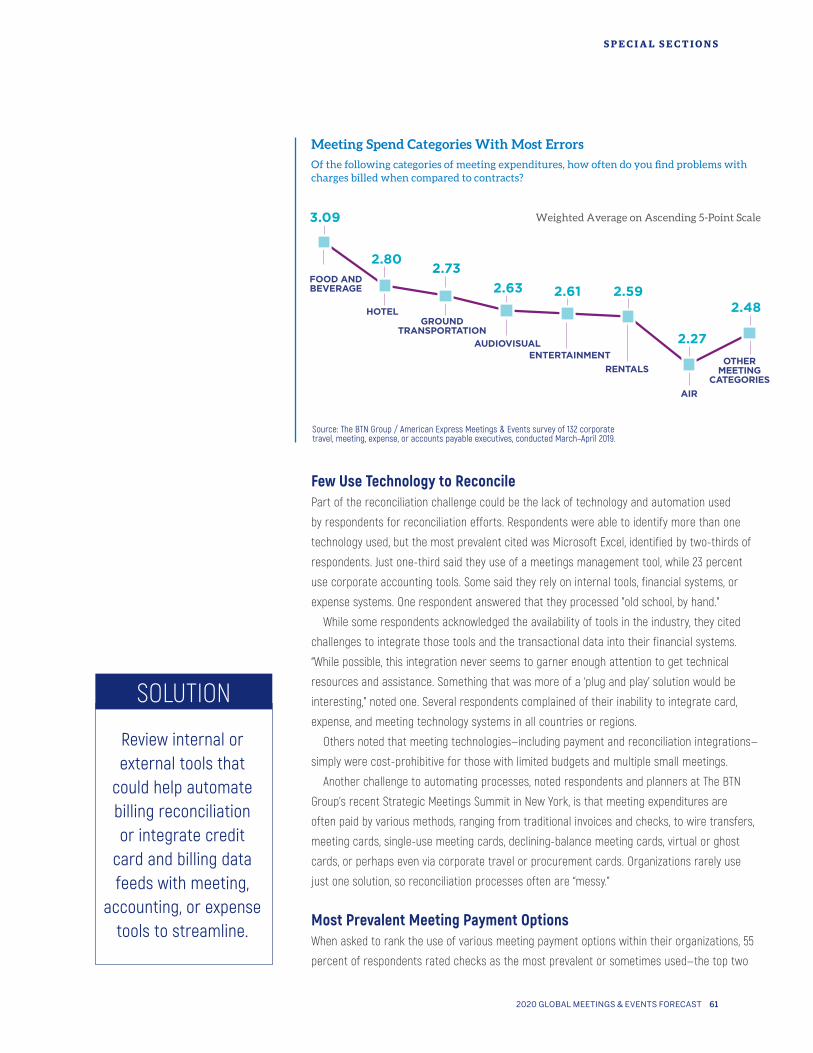
Meeting Spend Categories With Most Errors
Of the following categories of meeting expenditures, how often do you find problems with charges billed when compared to contracts?
Few Use Technology to ReconcilePart of the reconciliation challenge could be the lack of technology and automation used
by respondents for reconciliation efforts. Respondents were able to identify more than one
technology used, but the most prevalent cited was Microsoft Excel, identified by two-thirds of
respondents. Just one-third said they use of a meetings management tool, while 23 percent
use corporate accounting tools. Some said they rely on internal tools, financial systems, or
expense systems. One respondent answered that they processed "old school, by hand."
While some respondents acknowledged the availability of tools in the industry, they cited
challenges to integrate those tools and the transactional data into their financial systems.
“While possible, this integration never seems to garner enough attention to get technical
resources and assistance. Something that was more of a ‘plug and play’ solution would be
interesting,” noted one. Several respondents complained of their inability to integrate card,
expense, and meeting technology systems in all countries or regions.
Others noted that meeting technologies—including payment and reconciliation integrations—
simply were cost-prohibitive for those with limited budgets and multiple small meetings.
Another challenge to automating processes, noted respondents and planners at The BTN
Group’s recent Strategic Meetings Summit in New York, is that meeting expenditures are
often paid by various methods, ranging from traditional invoices and checks, to wire transfers,
meeting cards, single-use meeting cards, declining-balance meeting cards, virtual or ghost
cards, or perhaps even via corporate travel or procurement cards. Organizations rarely use
just one solution, so reconciliation processes often are “messy.”
Most Prevalent Meeting Payment OptionsWhen asked to rank the use of various meeting payment options within their organizations, 55
percent of respondents rated checks as the most prevalent or sometimes used—the top two
3.09
2.802.73
2.63 2.61 2.59
2.27
2.48
Source: The BTN Group / American Express Meetings & Events survey of 132 corporate travel, meeting, expense, or accounts payable executives, conducted March–April 2019.
FOOD AND BEVERAGE
HOTELGROUND
TRANSPORTATION
AUDIOVISUALENTERTAINMENT
RENTALS
AIR
OTHER MEETING
CATEGORIES
Weighted Average on Ascending 5-Point Scale
SOLUTION
Review internal or external tools that
could help automate billing reconciliation or integrate credit
card and billing data feeds with meeting,
accounting, or expense tools to streamline.
2020 GLOBAL MEETINGS & EVENTS FORECAST 61
S P E C I A L S E C T I O N S
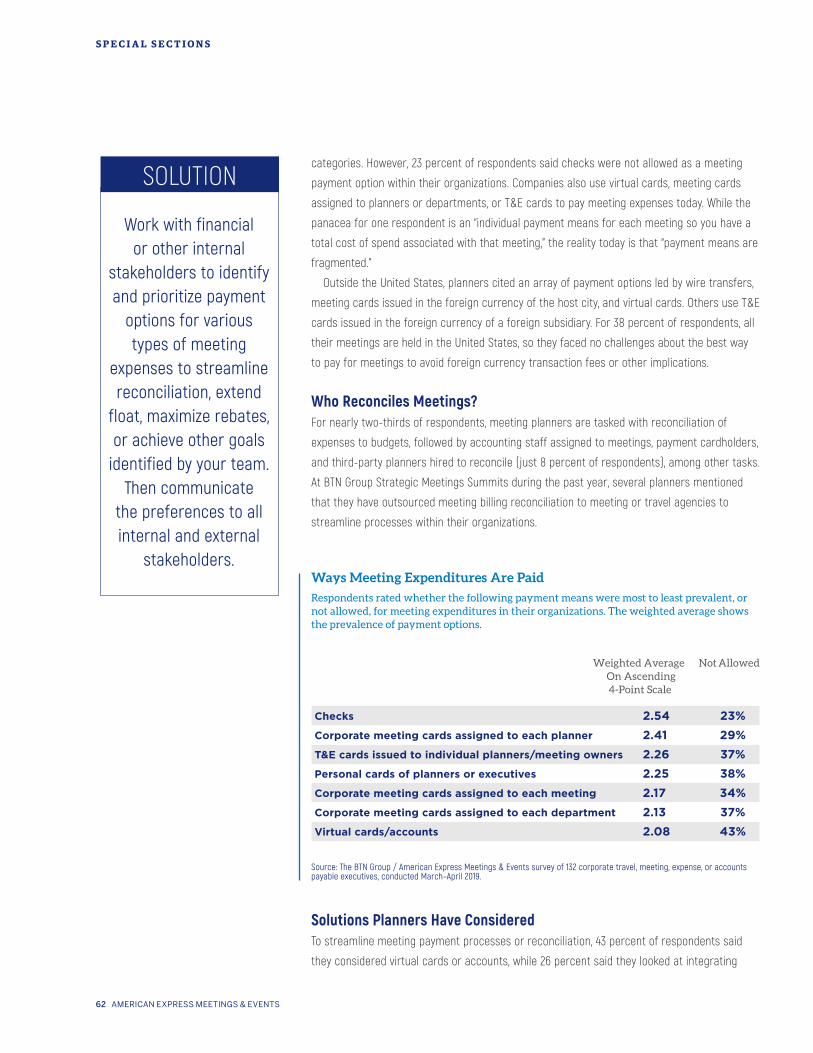
categories. However, 23 percent of respondents said checks were not allowed as a meeting
payment option within their organizations. Companies also use virtual cards, meeting cards
assigned to planners or departments, or T&E cards to pay meeting expenses today. While the
panacea for one respondent is an “individual payment means for each meeting so you have a
total cost of spend associated with that meeting,” the reality today is that “payment means are
fragmented.”
Outside the United States, planners cited an array of payment options led by wire transfers,
meeting cards issued in the foreign currency of the host city, and virtual cards. Others use T&E
cards issued in the foreign currency of a foreign subsidiary. For 38 percent of respondents, all
their meetings are held in the United States, so they faced no challenges about the best way
to pay for meetings to avoid foreign currency transaction fees or other implications.
Who Reconciles Meetings?For nearly two-thirds of respondents, meeting planners are tasked with reconciliation of
expenses to budgets, followed by accounting staff assigned to meetings, payment cardholders,
and third-party planners hired to reconcile (just 8 percent of respondents), among other tasks.
At BTN Group Strategic Meetings Summits during the past year, several planners mentioned
that they have outsourced meeting billing reconciliation to meeting or travel agencies to
streamline processes within their organizations.
Ways Meeting Expenditures Are Paid
Respondents rated whether the following payment means were most to least prevalent, or not allowed, for meeting expenditures in their organizations. The weighted average shows the prevalence of payment options.
Weighted Average Not Allowed On Ascending 4-Point Scale
Checks 2.54 23%
Corporate meeting cards assigned to each planner 2.41 29%
T&E cards issued to individual planners/meeting owners 2.26 37%
Personal cards of planners or executives 2.25 38%
Corporate meeting cards assigned to each meeting 2.17 34%
Corporate meeting cards assigned to each department 2.13 37%
Virtual cards/accounts 2.08 43%
Source: The BTN Group / American Express Meetings & Events survey of 132 corporate travel, meeting, expense, or accounts payable executives, conducted March–April 2019.
Solutions Planners Have ConsideredTo streamline meeting payment processes or reconciliation, 43 percent of respondents said
they considered virtual cards or accounts, while 26 percent said they looked at integrating
SOLUTION
Work with financial or other internal
stakeholders to identify and prioritize payment
options for various types of meeting
expenses to streamline reconciliation, extend
float, maximize rebates, or achieve other goals
identified by your team. Then communicate
the preferences to all internal and external
stakeholders.
62 AMERICAN EXPRESS MEETINGS & EVENTS
S P E C I A L S E C T I O N S
payment cards to meeting planning tools. About 20 percent said they looked at meeting
payment providers, while 13 percent said they considered outsourcing all payment and
reconciliation to a third-party provider. Nearly 10 percent of respondents said they looked at
whether bitcoin could solve their woes, but one-third of respondents said they hadn’t looked at
other solutions.
Streamling Payment and ReconciliationOne automated solution that GE SmartMeetings Senior Operations Manager Brenda Crocker-
Pierce is anxious to use is integration of an American Express Meeting card, Cvent, and
Concur to allow planners to reconcile meeting card charges in both Cvent and Concur with
just a few clicks, she noted at a recent BTN Group conference. If planners source or contract
through GE SmartMeetings, reconciliation will be completed for them in Cvent by an assigned
Sourcing Reconciliation Specialist, she added. Others have tweaked Concur drop-downs or
general ledger codes to tie expenses to specific meetings, said Estee Lauder Global Travel
and Meetings Services Director, Jami Stapelmann. “In some instances, employees
are finding solutions on their own, with Apple Pay, Venmo, or whatever,” she said. “When
that happens, you lose control. You have to be ready to explore new options, because
there is no one solution.”
Indeed, some companies are exploring streamlined payment and reconciliation processes to
garner greater compliance with travel and meeting policies or improve employee satisfaction.
For example, at GE, a meeting planner who registers a meeting or sources through a designed
tool or channel could be issued a virtual card number to pay for a meeting. Brenda Crocker-
Pierce said she also plans to use the benefit of virtual cards to gain more adoption to GE’s
SmartMeetings program.
What Would Improve the Meetings Payment and Reconciliation Process? A simple process or new payment vehicle that details all aspects of overall meeting costs
tops the planner wish list of more than 60 requests offered in the survey. Others wish that
integration would work in the meeting technology and expense systems they have. Some cited
efforts to convince suppliers, internal technology, finance stakeholders, or others, to integrate
systems as a means to solve their concerns.
Next Steps As meetings management programs mature, most industry experts agree that payment and
reconciliation options will be an increasingly important method of driving compliance and collecting
data about individual and overall meeting expenditures. The dozens of payment options and/or
configurations available in the industry today are designed to provide the varying levels of payment
controls and flexibility that finance or corporate executives demand. The trick for meeting program
stakeholders is to match the levels of control, flexibility, rebates, or convenience required in their
corporate culture with the options available. But they must also heed the advancements in product
SOLUTION
In multiple ways, planners asked for more streamlined
processes and standardization of
fields that would allow them to automate
input. They want more efficiencies and less manual intervention required for meeting
payments and reconciliation, along with more accurate
bills delivered faster.
2020 GLOBAL MEETINGS & EVENTS FORECAST 63
S P E C I A L S E C T I O N S
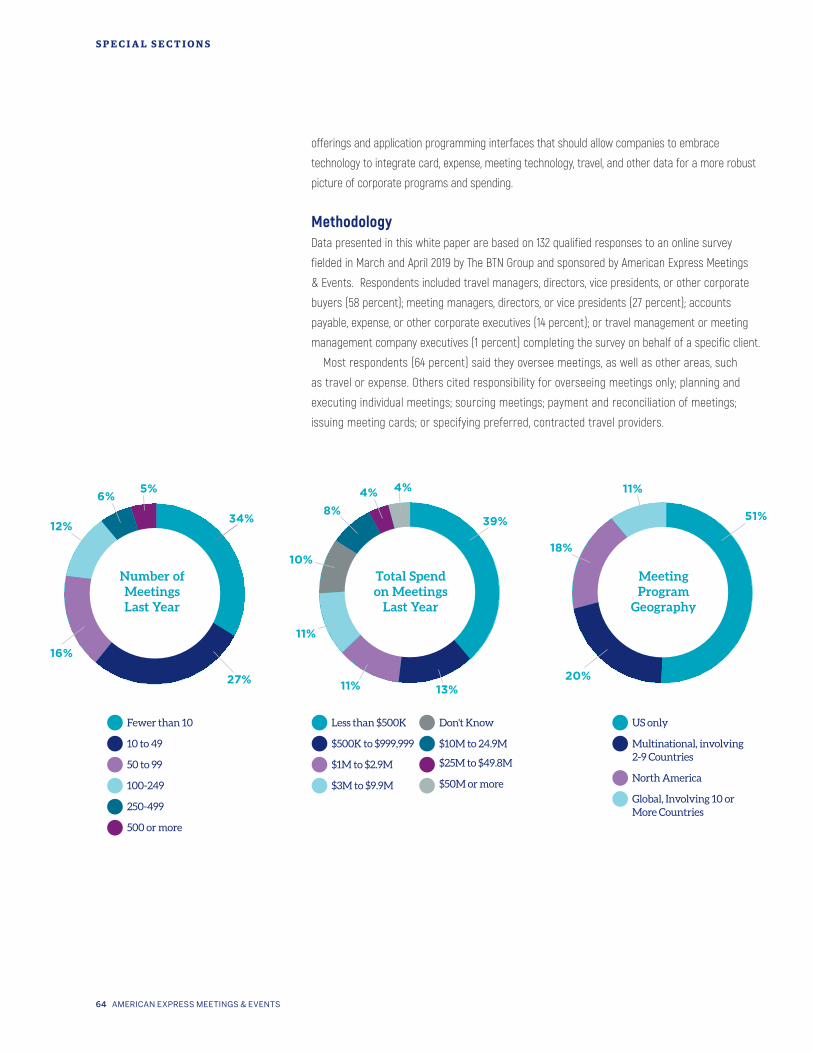
offerings and application programming interfaces that should allow companies to embrace
technology to integrate card, expense, meeting technology, travel, and other data for a more robust
picture of corporate programs and spending.
MethodologyData presented in this white paper are based on 132 qualified responses to an online survey
fielded in March and April 2019 by The BTN Group and sponsored by American Express Meetings
& Events. Respondents included travel managers, directors, vice presidents, or other corporate
buyers (58 percent); meeting managers, directors, or vice presidents (27 percent); accounts
payable, expense, or other corporate executives (14 percent); or travel management or meeting
management company executives (1 percent) completing the survey on behalf of a specific client.
Most respondents (64 percent) said they oversee meetings, as well as other areas, such
as travel or expense. Others cited responsibility for overseeing meetings only; planning and
executing individual meetings; sourcing meetings; payment and reconciliation of meetings;
issuing meeting cards; or specifying preferred, contracted travel providers.
Fewer than 10
10 to 49
50 to 99
100-249
250-499
500 or more
US only
Multinational, involving 2-9 Countries
North America
Global, Involving 10 or More Countries
Less than $500K
$500K to $999,999
$1M to $2.9M
$3M to $9.9M
Don't Know
$10M to 24.9M
$25M to $49.8M
$50M or more
Number of Meetings Last Year
Total Spend on Meetings
Last Year
Meeting Program
Geography
12%
11%
18%
16%
13%20%27%
34% 39% 51%
5%
10%
8%
4% 4% 11%6%
11%
64 AMERICAN EXPRESS MEETINGS & EVENTS
S P E C I A L S E C T I O N S
T
Table of Contents
Global
MEETING ACTIVITY 66
HOTELS AND MEETING SPACE 69
AIR 73
TRENDS 76
MEETING MANAGEMENT 79
Regional
NORTH AMERICA 81
EUROPE 85
ASIA PACIFIC 89
CENTRAL AND SOUTH AMERICA 94
Methodology
To develop this 2020 Global Meetings and Events Forecast, a number of sources were used, including proprietary American Express Meetings & Events data sources, licensed third party data and industry information, as well as interviews with industry leaders. Information and data was gathered from actual and planned meetings activity of American Express Meetings & Events globally. Proprietary surveys of meeting professionals were conducted to gather trends across North America, Europe, Asia Pacific, and Central and South America. A survey of leading hotel and airline suppliers as well as follow-up interviews were also used to inform the findings in this Forecast. Data was collected based on US Dollars across all regions and dollar amounts in tables throughout this Forecast indicate amounts in US Dollars.
Data Tables
SECTION 5
2020 GLOBAL MEETINGS & EVENTS FORECAST 65
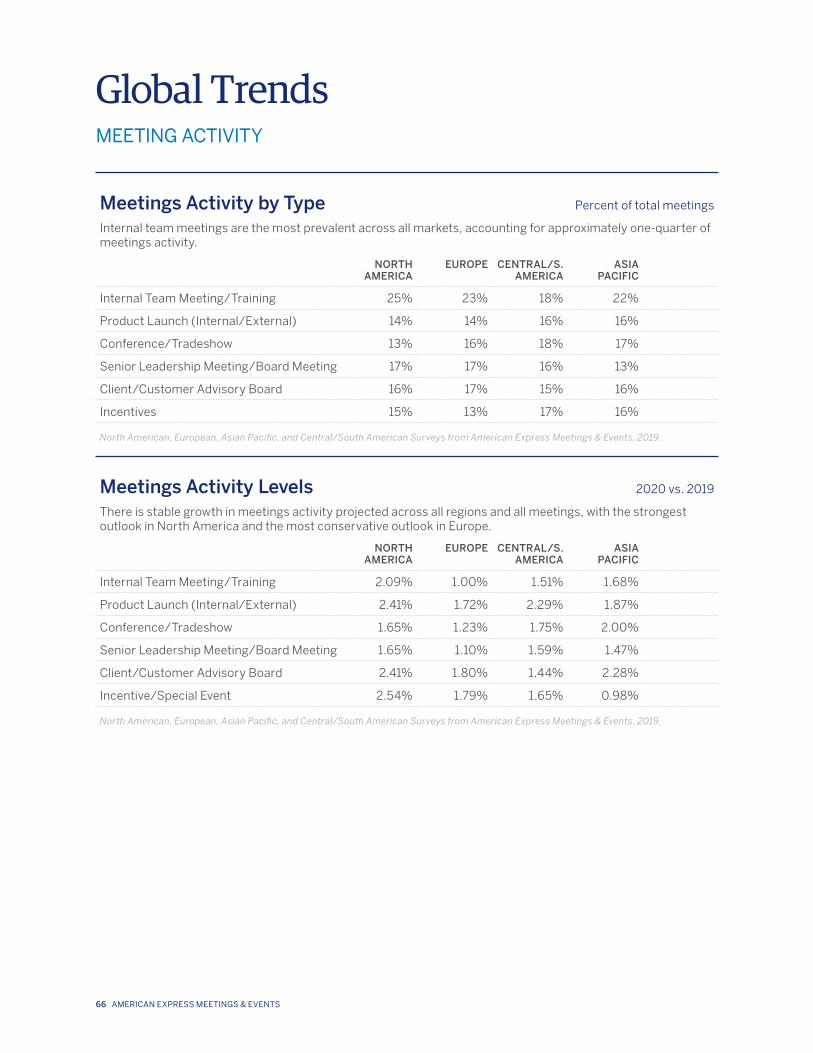
Global TrendsMEETING ACTIVITY
Meetings Activity by Type Percent of total meetings
Internal team meetings are the most prevalent across all markets, accounting for approximately one-quarter of meetings activity.
NORTH AMERICA
EUROPE CENTRAL/S. AMERICA
ASIA PACIFIC
Internal Team Meeting/Training 25% 23% 18% 22%
Product Launch (Internal/External) 14% 14% 16% 16%
Conference/Tradeshow 13% 16% 18% 17%
Senior Leadership Meeting/Board Meeting 17% 17% 16% 13%
Client/Customer Advisory Board 16% 17% 15% 16%
Incentives 15% 13% 17% 16%
North American, European, Asian Pacific, and Central/South American Surveys from American Express Meetings & Events, 2019.
Meetings Activity Levels 2020 vs. 2019
There is stable growth in meetings activity projected across all regions and all meetings, with the strongest outlook in North America and the most conservative outlook in Europe.
NORTH AMERICA
EUROPE CENTRAL/S. AMERICA
ASIA PACIFIC
Internal Team Meeting/Training 2.09% 1.00% 1.51% 1.68%
Product Launch (Internal/External) 2.41% 1.72% 2.29% 1.87%
Conference/Tradeshow 1.65% 1.23% 1.75% 2.00%
Senior Leadership Meeting/Board Meeting 1.65% 1.10% 1.59% 1.47%
Client/Customer Advisory Board 2.41% 1.80% 1.44% 2.28%
Incentive/Special Event 2.54% 1.79% 1.65% 0.98%
North American, European, Asian Pacific, and Central/South American Surveys from American Express Meetings & Events, 2019.
66 AMERICAN EXPRESS MEETINGS & EVENTS
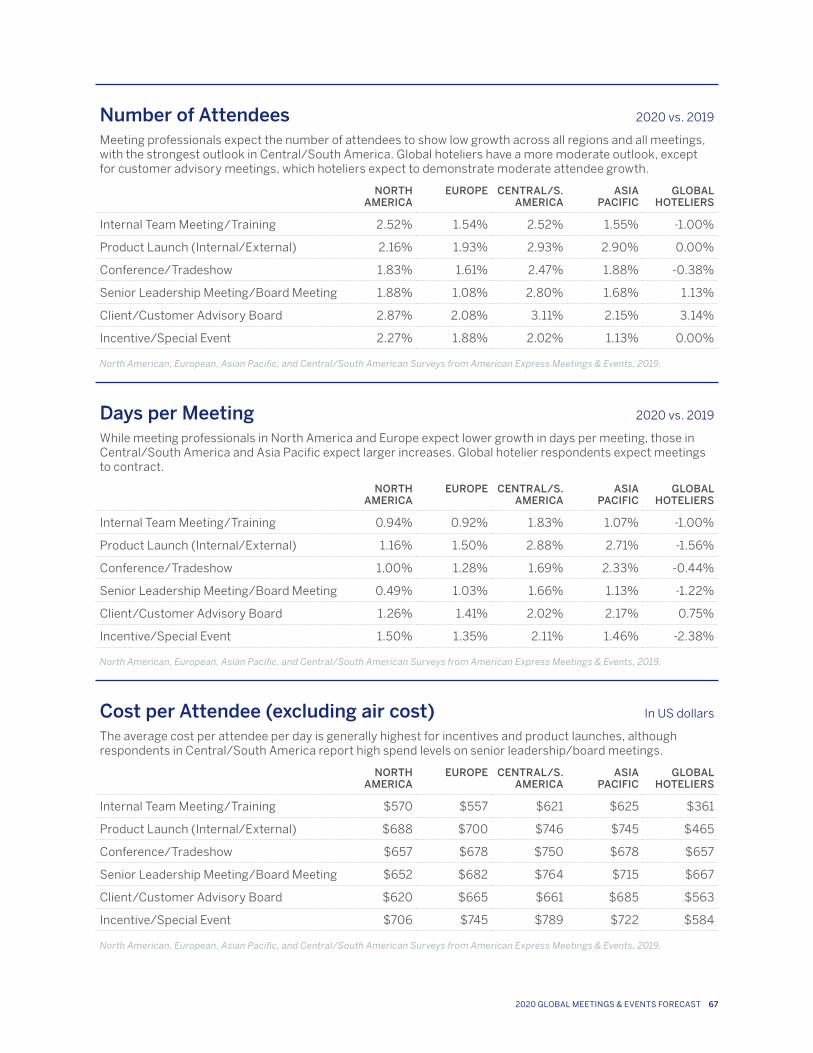
Number of Attendees 2020 vs. 2019
Meeting professionals expect the number of attendees to show low growth across all regions and all meetings, with the strongest outlook in Central/South America. Global hoteliers have a more moderate outlook, except for customer advisory meetings, which hoteliers expect to demonstrate moderate attendee growth.
NORTH AMERICA
EUROPE CENTRAL/S. AMERICA
ASIA PACIFIC
GLOBAL HOTELIERS
Internal Team Meeting/Training 2.52% 1.54% 2.52% 1.55% -1.00%
Product Launch (Internal/External) 2.16% 1.93% 2.93% 2.90% 0.00%
Conference/Tradeshow 1.83% 1.61% 2.47% 1.88% -0.38%
Senior Leadership Meeting/Board Meeting 1.88% 1.08% 2.80% 1.68% 1.13%
Client/Customer Advisory Board 2.87% 2.08% 3.11% 2.15% 3.14%
Incentive/Special Event 2.27% 1.88% 2.02% 1.13% 0.00%
North American, European, Asian Pacific, and Central/South American Surveys from American Express Meetings & Events, 2019.
Days per Meeting 2020 vs. 2019
While meeting professionals in North America and Europe expect lower growth in days per meeting, those in Central/South America and Asia Pacific expect larger increases. Global hotelier respondents expect meetings to contract.
NORTH AMERICA
EUROPE CENTRAL/S. AMERICA
ASIA PACIFIC
GLOBAL HOTELIERS
Internal Team Meeting/Training 0.94% 0.92% 1.83% 1.07% -1.00%
Product Launch (Internal/External) 1.16% 1.50% 2.88% 2.71% -1.56%
Conference/Tradeshow 1.00% 1.28% 1.69% 2.33% -0.44%
Senior Leadership Meeting/Board Meeting 0.49% 1.03% 1.66% 1.13% -1.22%
Client/Customer Advisory Board 1.26% 1.41% 2.02% 2.17% 0.75%
Incentive/Special Event 1.50% 1.35% 2.11% 1.46% -2.38%
North American, European, Asian Pacific, and Central/South American Surveys from American Express Meetings & Events, 2019.
Cost per Attendee (excluding air cost) In US dollars
The average cost per attendee per day is generally highest for incentives and product launches, although respondents in Central/South America report high spend levels on senior leadership/board meetings.
NORTH AMERICA
EUROPE CENTRAL/S. AMERICA
ASIA PACIFIC
GLOBAL HOTELIERS
Internal Team Meeting/Training $570 $557 $621 $625 $361
Product Launch (Internal/External) $688 $700 $746 $745 $465
Conference/Tradeshow $657 $678 $750 $678 $657
Senior Leadership Meeting/Board Meeting $652 $682 $764 $715 $667
Client/Customer Advisory Board $620 $665 $661 $685 $563
Incentive/Special Event $706 $745 $789 $722 $584
North American, European, Asian Pacific, and Central/South American Surveys from American Express Meetings & Events, 2019.
2020 GLOBAL MEETINGS & EVENTS FORECAST 67
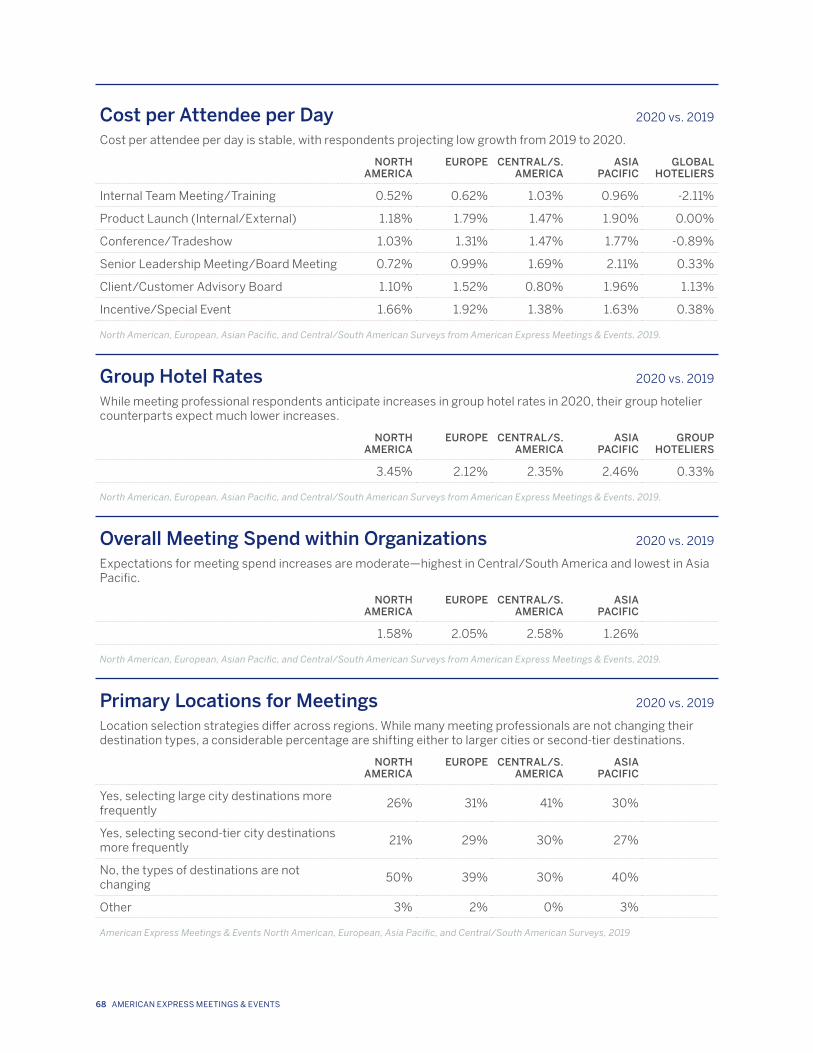
Cost per Attendee per Day 2020 vs. 2019
Cost per attendee per day is stable, with respondents projecting low growth from 2019 to 2020.
NORTH AMERICA
EUROPE CENTRAL/S. AMERICA
ASIA PACIFIC
GLOBAL HOTELIERS
Internal Team Meeting/Training 0.52% 0.62% 1.03% 0.96% -2.11%
Product Launch (Internal/External) 1.18% 1.79% 1.47% 1.90% 0.00%
Conference/Tradeshow 1.03% 1.31% 1.47% 1.77% -0.89%
Senior Leadership Meeting/Board Meeting 0.72% 0.99% 1.69% 2.11% 0.33%
Client/Customer Advisory Board 1.10% 1.52% 0.80% 1.96% 1.13%
Incentive/Special Event 1.66% 1.92% 1.38% 1.63% 0.38%
North American, European, Asian Pacific, and Central/South American Surveys from American Express Meetings & Events, 2019.
Group Hotel Rates 2020 vs. 2019
While meeting professional respondents anticipate increases in group hotel rates in 2020, their group hotelier counterparts expect much lower increases.
NORTH AMERICA
EUROPE CENTRAL/S. AMERICA
ASIA PACIFIC
GROUP HOTELIERS
3.45% 2.12% 2.35% 2.46% 0.33%
North American, European, Asian Pacific, and Central/South American Surveys from American Express Meetings & Events, 2019.
Overall Meeting Spend within Organizations 2020 vs. 2019
Expectations for meeting spend increases are moderate—highest in Central/South America and lowest in Asia Pacific.
NORTH AMERICA
EUROPE CENTRAL/S. AMERICA
ASIA PACIFIC
1.58% 2.05% 2.58% 1.26%
North American, European, Asian Pacific, and Central/South American Surveys from American Express Meetings & Events, 2019.
Primary Locations for Meetings 2020 vs. 2019
Location selection strategies differ across regions. While many meeting professionals are not changing their destination types, a considerable percentage are shifting either to larger cities or second-tier destinations.
NORTH AMERICA
EUROPE CENTRAL/S. AMERICA
ASIA PACIFIC
Yes, selecting large city destinations more frequently
26% 31% 41% 30%
Yes, selecting second-tier city destinations more frequently
21% 29% 30% 27%
No, the types of destinations are not changing
50% 39% 30% 40%
Other 3% 2% 0% 3%
American Express Meetings & Events North American, European, Asia Pacific, and Central/South American Surveys, 2019
68 AMERICAN EXPRESS MEETINGS & EVENTS
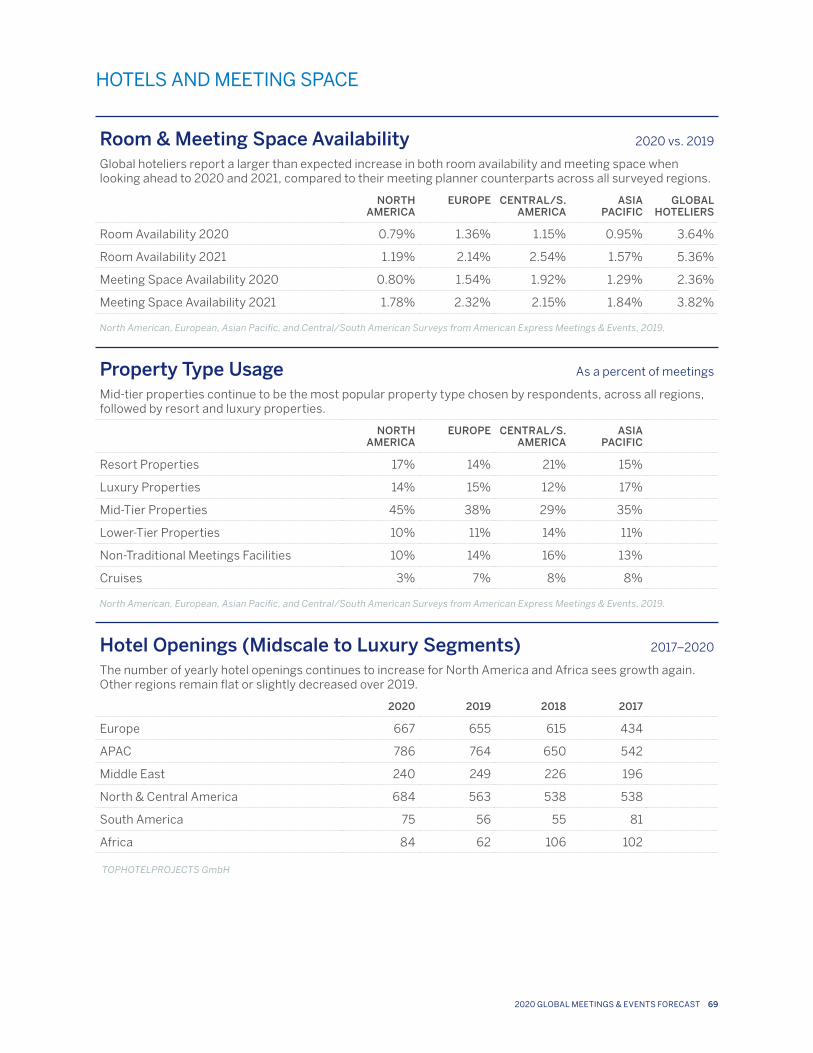
HOTELS AND MEETING SPACE
Room & Meeting Space Availability 2020 vs. 2019
Global hoteliers report a larger than expected increase in both room availability and meeting space when looking ahead to 2020 and 2021, compared to their meeting planner counterparts across all surveyed regions.
NORTH AMERICA
EUROPE CENTRAL/S. AMERICA
ASIA PACIFIC
GLOBAL HOTELIERS
Room Availability 2020 0.79% 1.36% 1.15% 0.95% 3.64%
Room Availability 2021 1.19% 2.14% 2.54% 1.57% 5.36%
Meeting Space Availability 2020 0.80% 1.54% 1.92% 1.29% 2.36%
Meeting Space Availability 2021 1.78% 2.32% 2.15% 1.84% 3.82%
North American, European, Asian Pacific, and Central/South American Surveys from American Express Meetings & Events, 2019.
Property Type Usage As a percent of meetings
Mid-tier properties continue to be the most popular property type chosen by respondents, across all regions, followed by resort and luxury properties.
NORTH AMERICA
EUROPE CENTRAL/S. AMERICA
ASIA PACIFIC
Resort Properties 17% 14% 21% 15%
Luxury Properties 14% 15% 12% 17%
Mid-Tier Properties 45% 38% 29% 35%
Lower-Tier Properties 10% 11% 14% 11%
Non-Traditional Meetings Facilities 10% 14% 16% 13%
Cruises 3% 7% 8% 8%
North American, European, Asian Pacific, and Central/South American Surveys from American Express Meetings & Events, 2019.
Hotel Openings (Midscale to Luxury Segments) 2017–2020
The number of yearly hotel openings continues to increase for North America and Africa sees growth again. Other regions remain flat or slightly decreased over 2019.
2020 2019 2018 2017
Europe 667 655 615 434
APAC 786 764 650 542
Middle East 240 249 226 196
North & Central America 684 563 538 538
South America 75 56 55 81
Africa 84 62 106 102
TOPHOTELPROJECTS GmbH
2020 GLOBAL MEETINGS & EVENTS FORECAST 69
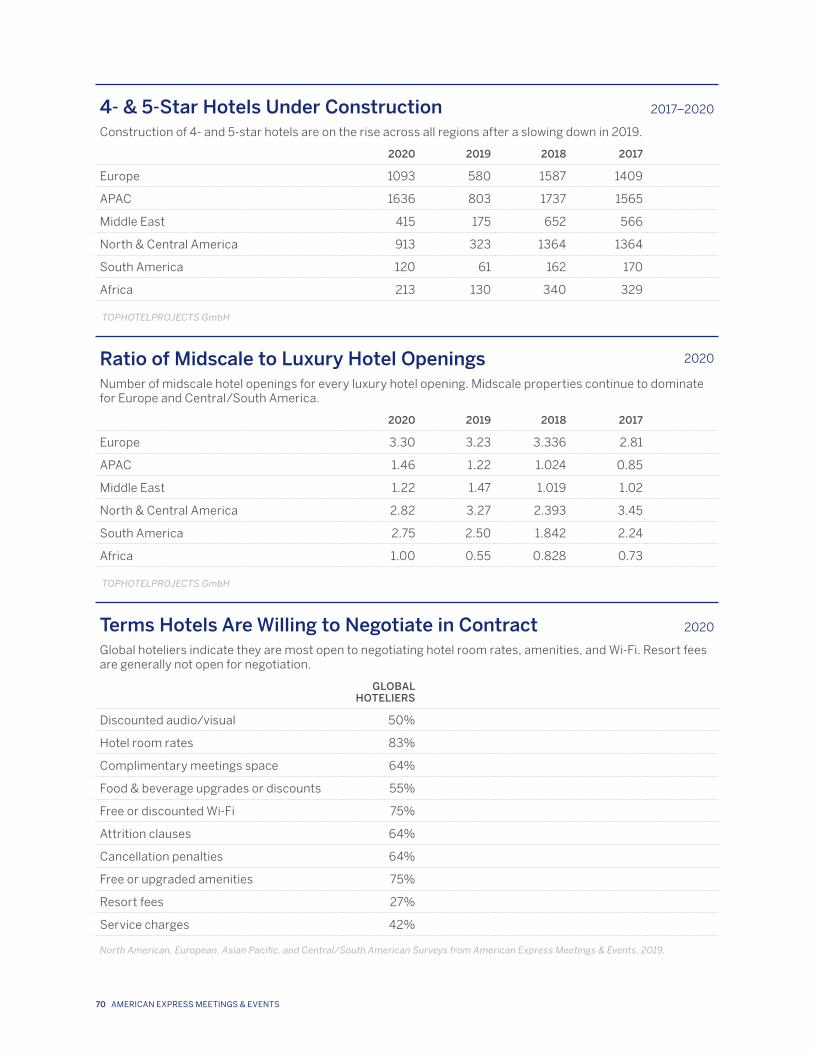
4- & 5-Star Hotels Under Construction 2017–2020
Construction of 4- and 5-star hotels are on the rise across all regions after a slowing down in 2019.
2020 2019 2018 2017
Europe 1093 580 1587 1409
APAC 1636 803 1737 1565
Middle East 415 175 652 566
North & Central America 913 323 1364 1364
South America 120 61 162 170
Africa 213 130 340 329
TOPHOTELPROJECTS GmbH
Ratio of Midscale to Luxury Hotel Openings 2020
Number of midscale hotel openings for every luxury hotel opening. Midscale properties continue to dominate for Europe and Central/South America.
2020 2019 2018 2017
Europe 3.30 3.23 3.336 2.81
APAC 1.46 1.22 1.024 0.85
Middle East 1.22 1.47 1.019 1.02
North & Central America 2.82 3.27 2.393 3.45
South America 2.75 2.50 1.842 2.24
Africa 1.00 0.55 0.828 0.73
TOPHOTELPROJECTS GmbH
Terms Hotels Are Willing to Negotiate in Contract 2020
Global hoteliers indicate they are most open to negotiating hotel room rates, amenities, and Wi-Fi. Resort fees are generally not open for negotiation.
GLOBAL HOTELIERS
Discounted audio/visual 50%
Hotel room rates 83%
Complimentary meetings space 64%
Food & beverage upgrades or discounts 55%
Free or discounted Wi-Fi 75%
Attrition clauses 64%
Cancellation penalties 64%
Free or upgraded amenities 75%
Resort fees 27%
Service charges 42%
North American, European, Asian Pacific, and Central/South American Surveys from American Express Meetings & Events, 2019.
70 AMERICAN EXPRESS MEETINGS & EVENTS
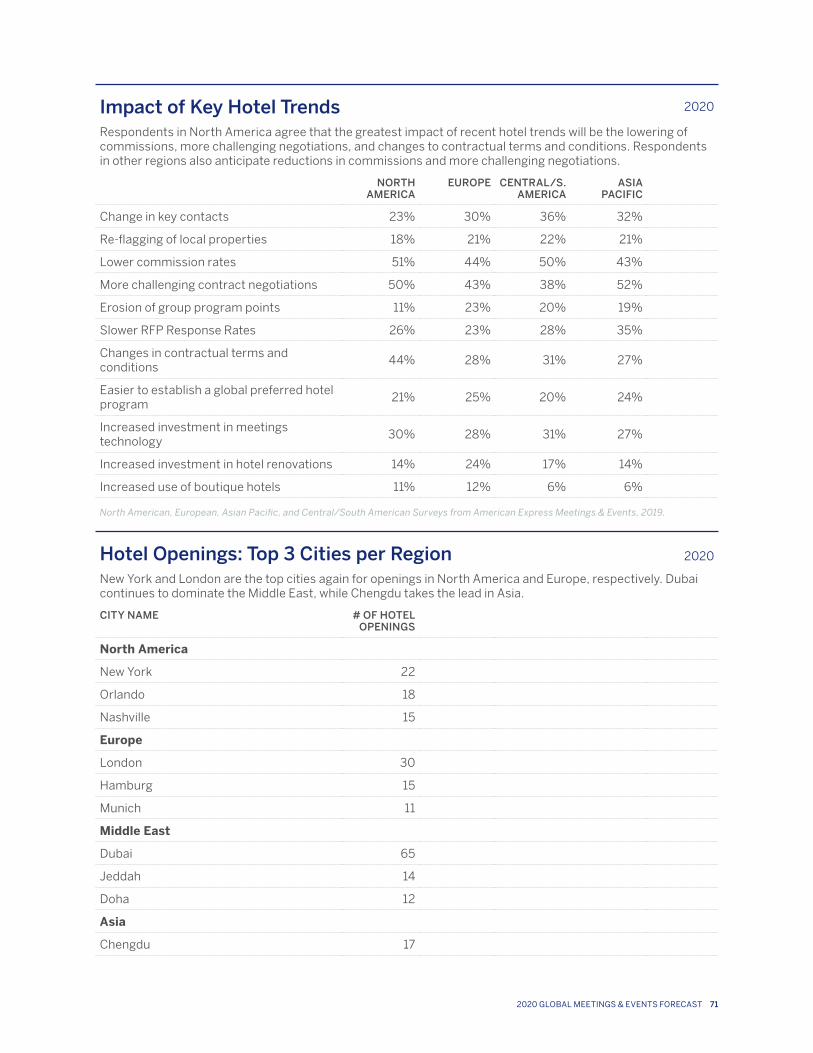
Impact of Key Hotel Trends 2020
Respondents in North America agree that the greatest impact of recent hotel trends will be the lowering of commissions, more challenging negotiations, and changes to contractual terms and conditions. Respondents in other regions also anticipate reductions in commissions and more challenging negotiations.
NORTH AMERICA
EUROPE CENTRAL/S. AMERICA
ASIA PACIFIC
Change in key contacts 23% 30% 36% 32%
Re-flagging of local properties 18% 21% 22% 21%
Lower commission rates 51% 44% 50% 43%
More challenging contract negotiations 50% 43% 38% 52%
Erosion of group program points 11% 23% 20% 19%
Slower RFP Response Rates 26% 23% 28% 35%
Changes in contractual terms and conditions
44% 28% 31% 27%
Easier to establish a global preferred hotel program
21% 25% 20% 24%
Increased investment in meetings technology
30% 28% 31% 27%
Increased investment in hotel renovations 14% 24% 17% 14%
Increased use of boutique hotels 11% 12% 6% 6%
North American, European, Asian Pacific, and Central/South American Surveys from American Express Meetings & Events, 2019.
Hotel Openings: Top 3 Cities per Region 2020
New York and London are the top cities again for openings in North America and Europe, respectively. Dubai continues to dominate the Middle East, while Chengdu takes the lead in Asia.
CITY NAME # OF HOTEL OPENINGS
North America
New York 22
Orlando 18
Nashville 15
Europe
London 30
Hamburg 15
Munich 11
Middle East
Dubai 65
Jeddah 14
Doha 12
Asia
Chengdu 17
2020 GLOBAL MEETINGS & EVENTS FORECAST 71
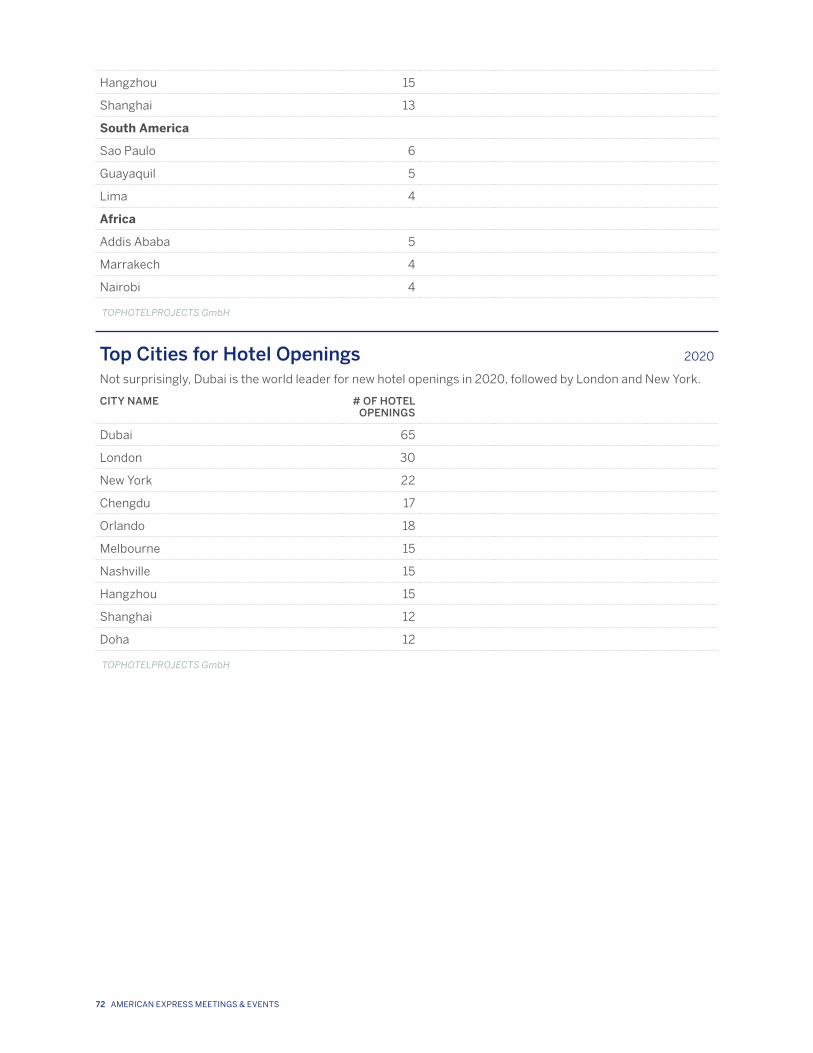
Hangzhou 15
Shanghai 13
South America
Sao Paulo 6
Guayaquil 5
Lima 4
Africa
Addis Ababa 5
Marrakech 4
Nairobi 4
TOPHOTELPROJECTS GmbH
Top Cities for Hotel Openings 2020
Not surprisingly, Dubai is the world leader for new hotel openings in 2020, followed by London and New York.
CITY NAME # OF HOTEL OPENINGS
Dubai 65
London 30
New York 22
Chengdu 17
Orlando 18
Melbourne 15
Nashville 15
Hangzhou 15
Shanghai 12
Doha 12
TOPHOTELPROJECTS GmbH
72 AMERICAN EXPRESS MEETINGS & EVENTS
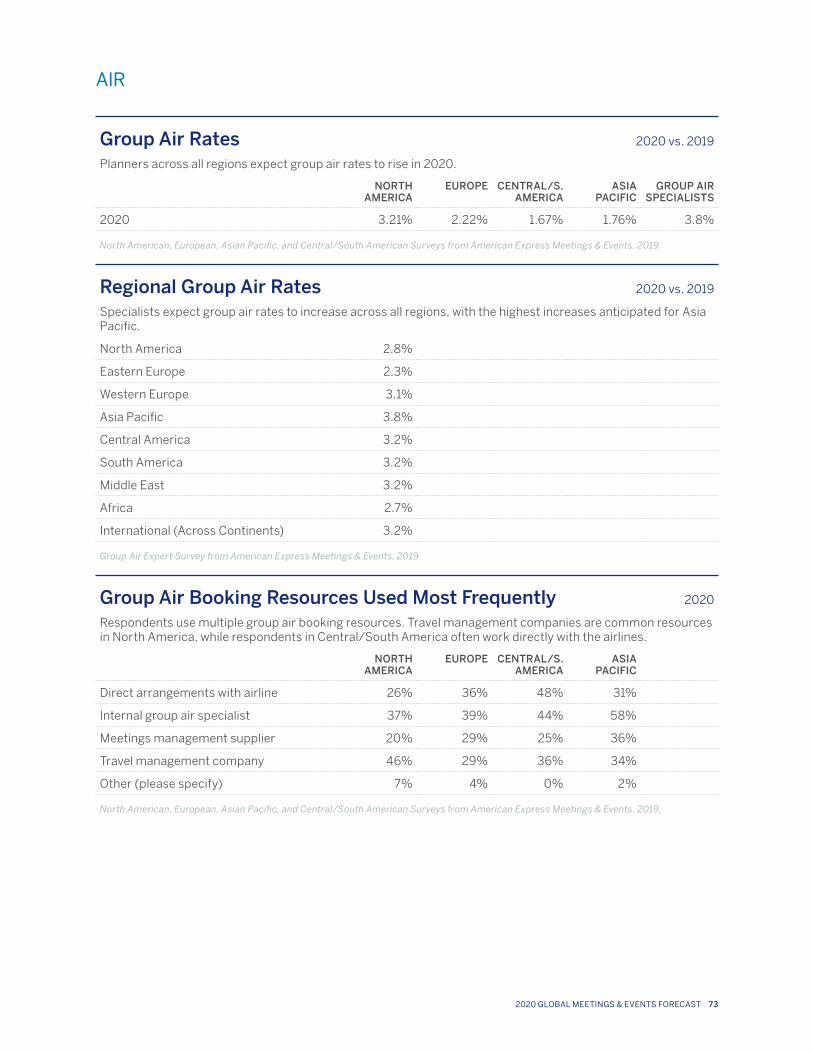
AIR
Group Air Rates 2020 vs. 2019
Planners across all regions expect group air rates to rise in 2020.
NORTH AMERICA
EUROPE CENTRAL/S. AMERICA
ASIA PACIFIC
GROUP AIR SPECIALISTS
2020 3.21% 2.22% 1.67% 1.76% 3.8%
North American, European, Asian Pacific, and Central/South American Surveys from American Express Meetings & Events, 2019.
Regional Group Air Rates 2020 vs. 2019
Specialists expect group air rates to increase across all regions, with the highest increases anticipated for Asia Pacific.
North America 2.8%
Eastern Europe 2.3%
Western Europe 3.1%
Asia Pacific 3.8%
Central America 3.2%
South America 3.2%
Middle East 3.2%
Africa 2.7%
International (Across Continents) 3.2%
Group Air Expert Survey from American Express Meetings & Events, 2019
Group Air Booking Resources Used Most Frequently 2020
Respondents use multiple group air booking resources. Travel management companies are common resources in North America, while respondents in Central/South America often work directly with the airlines.
NORTH AMERICA
EUROPE CENTRAL/S. AMERICA
ASIA PACIFIC
Direct arrangements with airline 26% 36% 48% 31%
Internal group air specialist 37% 39% 44% 58%
Meetings management supplier 20% 29% 25% 36%
Travel management company 46% 29% 36% 34%
Other (please specify) 7% 4% 0% 2%
North American, European, Asian Pacific, and Central/South American Surveys from American Express Meetings & Events, 2019.
2020 GLOBAL MEETINGS & EVENTS FORECAST 73
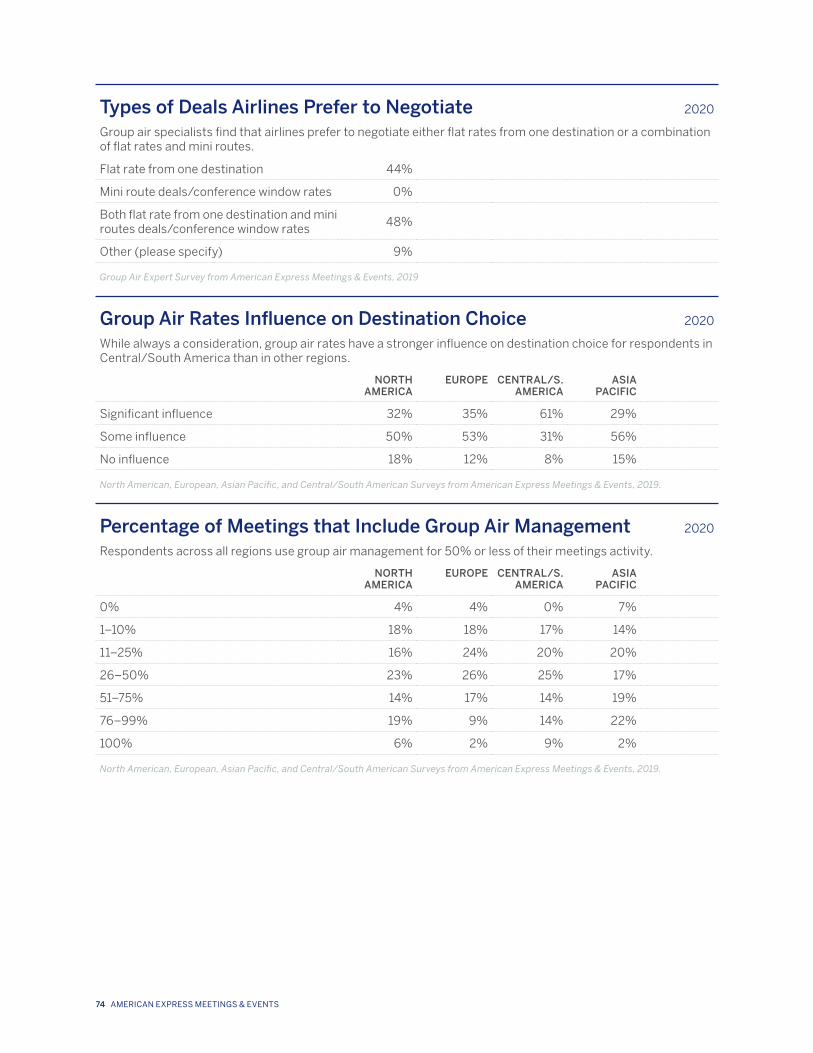
Types of Deals Airlines Prefer to Negotiate 2020
Group air specialists find that airlines prefer to negotiate either flat rates from one destination or a combination of flat rates and mini routes.
Flat rate from one destination 44%
Mini route deals/conference window rates 0%
Both flat rate from one destination and mini routes deals/conference window rates
48%
Other (please specify) 9%
Group Air Expert Survey from American Express Meetings & Events, 2019
Group Air Rates Influence on Destination Choice 2020
While always a consideration, group air rates have a stronger influence on destination choice for respondents in Central/South America than in other regions.
NORTH AMERICA
EUROPE CENTRAL/S. AMERICA
ASIA PACIFIC
Significant influence 32% 35% 61% 29%
Some influence 50% 53% 31% 56%
No influence 18% 12% 8% 15%
North American, European, Asian Pacific, and Central/South American Surveys from American Express Meetings & Events, 2019.
Percentage of Meetings that Include Group Air Management 2020
Respondents across all regions use group air management for 50% or less of their meetings activity.
NORTH AMERICA
EUROPE CENTRAL/S. AMERICA
ASIA PACIFIC
0% 4% 4% 0% 7%
1–10% 18% 18% 17% 14%
11–25% 16% 24% 20% 20%
26–50% 23% 26% 25% 17%
51–75% 14% 17% 14% 19%
76–99% 19% 9% 14% 22%
100% 6% 2% 9% 2%
North American, European, Asian Pacific, and Central/South American Surveys from American Express Meetings & Events, 2019.
74 AMERICAN EXPRESS MEETINGS & EVENTS
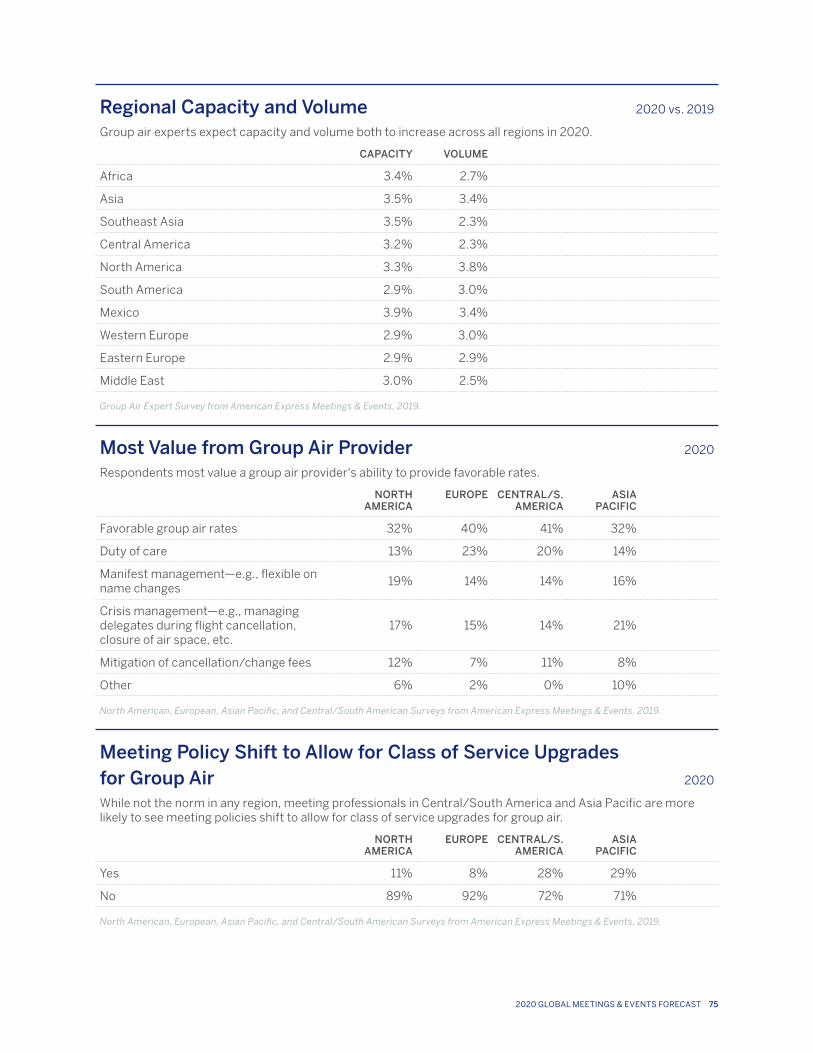
Regional Capacity and Volume 2020 vs. 2019
Group air experts expect capacity and volume both to increase across all regions in 2020.
CAPACITY VOLUME
Africa 3.4% 2.7%
Asia 3.5% 3.4%
Southeast Asia 3.5% 2.3%
Central America 3.2% 2.3%
North America 3.3% 3.8%
South America 2.9% 3.0%
Mexico 3.9% 3.4%
Western Europe 2.9% 3.0%
Eastern Europe 2.9% 2.9%
Middle East 3.0% 2.5%
Group Air Expert Survey from American Express Meetings & Events, 2019.
Most Value from Group Air Provider 2020
Respondents most value a group air provider's ability to provide favorable rates.
NORTH AMERICA
EUROPE CENTRAL/S. AMERICA
ASIA PACIFIC
Favorable group air rates 32% 40% 41% 32%
Duty of care 13% 23% 20% 14%
Manifest management—e.g., flexible on name changes
19% 14% 14% 16%
Crisis management—e.g., managing delegates during flight cancellation, closure of air space, etc.
17% 15% 14% 21%
Mitigation of cancellation/change fees 12% 7% 11% 8%
Other 6% 2% 0% 10%
North American, European, Asian Pacific, and Central/South American Surveys from American Express Meetings & Events, 2019.
Meeting Policy Shift to Allow for Class of Service Upgrades for Group Air 2020
While not the norm in any region, meeting professionals in Central/South America and Asia Pacific are more likely to see meeting policies shift to allow for class of service upgrades for group air.
NORTH AMERICA
EUROPE CENTRAL/S. AMERICA
ASIA PACIFIC
Yes 11% 8% 28% 29%
No 89% 92% 72% 71%
North American, European, Asian Pacific, and Central/South American Surveys from American Express Meetings & Events, 2019.
2020 GLOBAL MEETINGS & EVENTS FORECAST 75
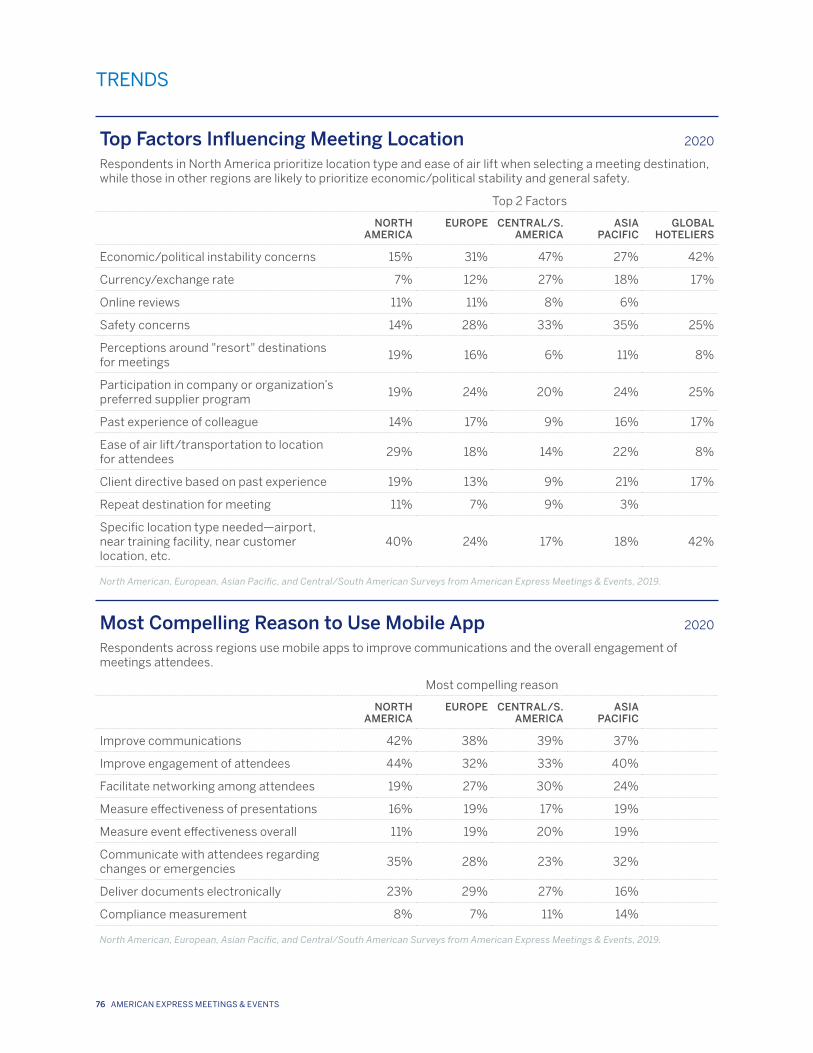
TRENDS
Top Factors Influencing Meeting Location 2020
Respondents in North America prioritize location type and ease of air lift when selecting a meeting destination, while those in other regions are likely to prioritize economic/political stability and general safety.
Top 2 Factors
NORTH AMERICA
EUROPE CENTRAL/S. AMERICA
ASIA PACIFIC
GLOBAL HOTELIERS
Economic/political instability concerns 15% 31% 47% 27% 42%
Currency/exchange rate 7% 12% 27% 18% 17%
Online reviews 11% 11% 8% 6%
Safety concerns 14% 28% 33% 35% 25%
Perceptions around "resort" destinations for meetings
19% 16% 6% 11% 8%
Participation in company or organization’s preferred supplier program
19% 24% 20% 24% 25%
Past experience of colleague 14% 17% 9% 16% 17%
Ease of air lift/transportation to location for attendees
29% 18% 14% 22% 8%
Client directive based on past experience 19% 13% 9% 21% 17%
Repeat destination for meeting 11% 7% 9% 3%
Specific location type needed—airport, near training facility, near customer location, etc.
40% 24% 17% 18% 42%
North American, European, Asian Pacific, and Central/South American Surveys from American Express Meetings & Events, 2019.
Most Compelling Reason to Use Mobile App 2020
Respondents across regions use mobile apps to improve communications and the overall engagement of meetings attendees.
Most compelling reason
NORTH AMERICA
EUROPE CENTRAL/S. AMERICA
ASIA PACIFIC
Improve communications 42% 38% 39% 37%
Improve engagement of attendees 44% 32% 33% 40%
Facilitate networking among attendees 19% 27% 30% 24%
Measure effectiveness of presentations 16% 19% 17% 19%
Measure event effectiveness overall 11% 19% 20% 19%
Communicate with attendees regarding changes or emergencies
35% 28% 23% 32%
Deliver documents electronically 23% 29% 27% 16%
Compliance measurement 8% 7% 11% 14%
North American, European, Asian Pacific, and Central/South American Surveys from American Express Meetings & Events, 2019.
76 AMERICAN EXPRESS MEETINGS & EVENTS
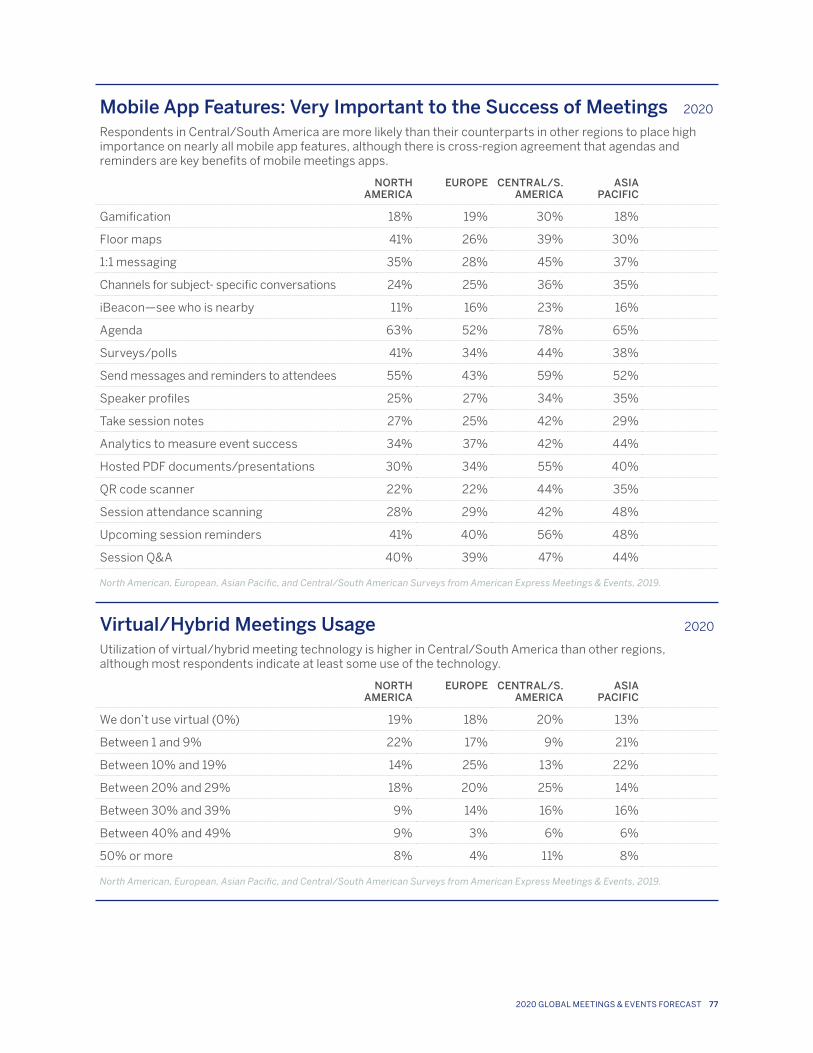
Mobile App Features: Very Important to the Success of Meetings 2020
Respondents in Central/South America are more likely than their counterparts in other regions to place high importance on nearly all mobile app features, although there is cross-region agreement that agendas and reminders are key benefits of mobile meetings apps.
NORTH AMERICA
EUROPE CENTRAL/S. AMERICA
ASIA PACIFIC
Gamification 18% 19% 30% 18%
Floor maps 41% 26% 39% 30%
1:1 messaging 35% 28% 45% 37%
Channels for subject- specific conversations 24% 25% 36% 35%
iBeacon—see who is nearby 11% 16% 23% 16%
Agenda 63% 52% 78% 65%
Surveys/polls 41% 34% 44% 38%
Send messages and reminders to attendees 55% 43% 59% 52%
Speaker profiles 25% 27% 34% 35%
Take session notes 27% 25% 42% 29%
Analytics to measure event success 34% 37% 42% 44%
Hosted PDF documents/presentations 30% 34% 55% 40%
QR code scanner 22% 22% 44% 35%
Session attendance scanning 28% 29% 42% 48%
Upcoming session reminders 41% 40% 56% 48%
Session Q&A 40% 39% 47% 44%
North American, European, Asian Pacific, and Central/South American Surveys from American Express Meetings & Events, 2019.
Virtual/Hybrid Meetings Usage 2020
Utilization of virtual/hybrid meeting technology is higher in Central/South America than other regions, although most respondents indicate at least some use of the technology.
NORTH AMERICA
EUROPE CENTRAL/S. AMERICA
ASIA PACIFIC
We don’t use virtual (0%) 19% 18% 20% 13%
Between 1 and 9% 22% 17% 9% 21%
Between 10% and 19% 14% 25% 13% 22%
Between 20% and 29% 18% 20% 25% 14%
Between 30% and 39% 9% 14% 16% 16%
Between 40% and 49% 9% 3% 6% 6%
50% or more 8% 4% 11% 8%
North American, European, Asian Pacific, and Central/South American Surveys from American Express Meetings & Events, 2019.
2020 GLOBAL MEETINGS & EVENTS FORECAST 77
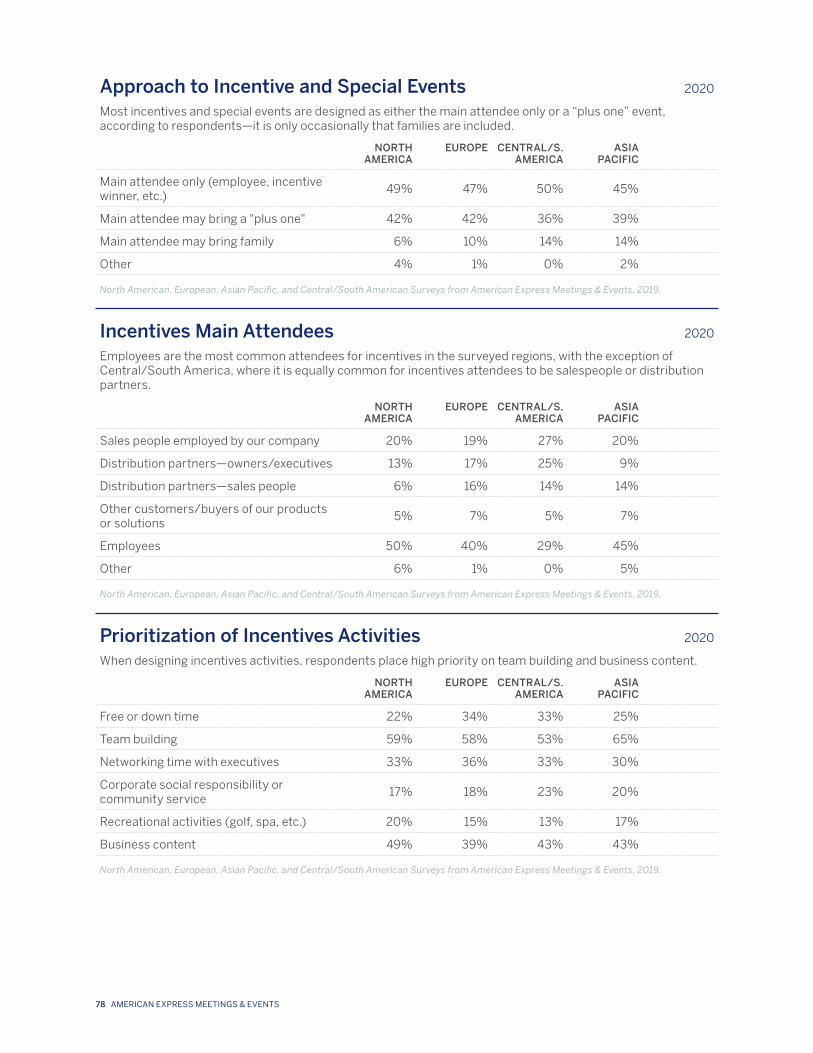
Approach to Incentive and Special Events 2020
Most incentives and special events are designed as either the main attendee only or a “plus one” event, according to respondents—it is only occasionally that families are included.
NORTH AMERICA
EUROPE CENTRAL/S. AMERICA
ASIA PACIFIC
Main attendee only (employee, incentive winner, etc.)
49% 47% 50% 45%
Main attendee may bring a "plus one" 42% 42% 36% 39%
Main attendee may bring family 6% 10% 14% 14%
Other 4% 1% 0% 2%
North American, European, Asian Pacific, and Central/South American Surveys from American Express Meetings & Events, 2019.
Incentives Main Attendees 2020
Employees are the most common attendees for incentives in the surveyed regions, with the exception of Central/South America, where it is equally common for incentives attendees to be salespeople or distribution partners.
NORTH AMERICA
EUROPE CENTRAL/S. AMERICA
ASIA PACIFIC
Sales people employed by our company 20% 19% 27% 20%
Distribution partners—owners/executives 13% 17% 25% 9%
Distribution partners—sales people 6% 16% 14% 14%
Other customers/buyers of our products or solutions
5% 7% 5% 7%
Employees 50% 40% 29% 45%
Other 6% 1% 0% 5%
North American, European, Asian Pacific, and Central/South American Surveys from American Express Meetings & Events, 2019.
Prioritization of Incentives Activities 2020
When designing incentives activities, respondents place high priority on team building and business content.
NORTH AMERICA
EUROPE CENTRAL/S. AMERICA
ASIA PACIFIC
Free or down time 22% 34% 33% 25%
Team building 59% 58% 53% 65%
Networking time with executives 33% 36% 33% 30%
Corporate social responsibility or community service
17% 18% 23% 20%
Recreational activities (golf, spa, etc.) 20% 15% 13% 17%
Business content 49% 39% 43% 43%
North American, European, Asian Pacific, and Central/South American Surveys from American Express Meetings & Events, 2019.
78 AMERICAN EXPRESS MEETINGS & EVENTS
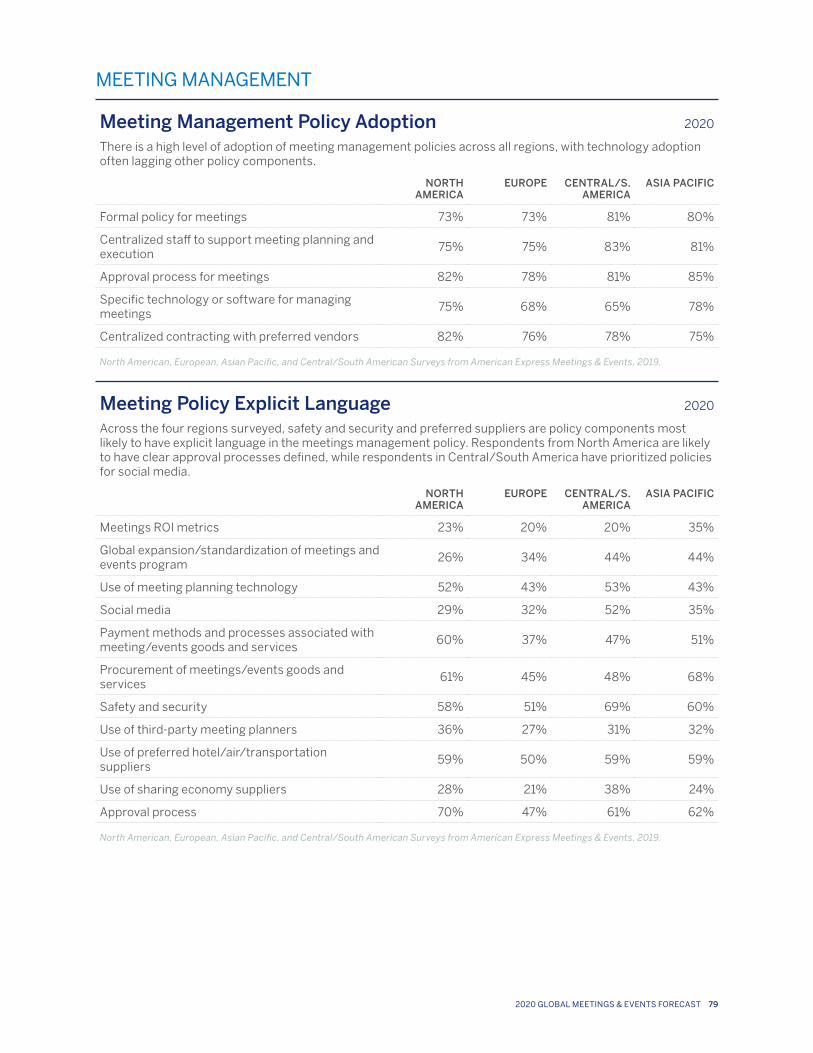
MEETING MANAGEMENT
Meeting Management Policy Adoption 2020
There is a high level of adoption of meeting management policies across all regions, with technology adoption often lagging other policy components.
NORTH AMERICA
EUROPE CENTRAL/S. AMERICA
ASIA PACIFIC
Formal policy for meetings 73% 73% 81% 80%
Centralized staff to support meeting planning and execution
75% 75% 83% 81%
Approval process for meetings 82% 78% 81% 85%
Specific technology or software for managing meetings
75% 68% 65% 78%
Centralized contracting with preferred vendors 82% 76% 78% 75%
North American, European, Asian Pacific, and Central/South American Surveys from American Express Meetings & Events, 2019.
Meeting Policy Explicit Language 2020
Across the four regions surveyed, safety and security and preferred suppliers are policy components most likely to have explicit language in the meetings management policy. Respondents from North America are likely to have clear approval processes defined, while respondents in Central/South America have prioritized policies for social media.
NORTH AMERICA
EUROPE CENTRAL/S. AMERICA
ASIA PACIFIC
Meetings ROI metrics 23% 20% 20% 35%
Global expansion/standardization of meetings and events program
26% 34% 44% 44%
Use of meeting planning technology 52% 43% 53% 43%
Social media 29% 32% 52% 35%
Payment methods and processes associated with meeting/events goods and services
60% 37% 47% 51%
Procurement of meetings/events goods and services
61% 45% 48% 68%
Safety and security 58% 51% 69% 60%
Use of third-party meeting planners 36% 27% 31% 32%
Use of preferred hotel/air/transportation suppliers
59% 50% 59% 59%
Use of sharing economy suppliers 28% 21% 38% 24%
Approval process 70% 47% 61% 62%
North American, European, Asian Pacific, and Central/South American Surveys from American Express Meetings & Events, 2019.
2020 GLOBAL MEETINGS & EVENTS FORECAST 79
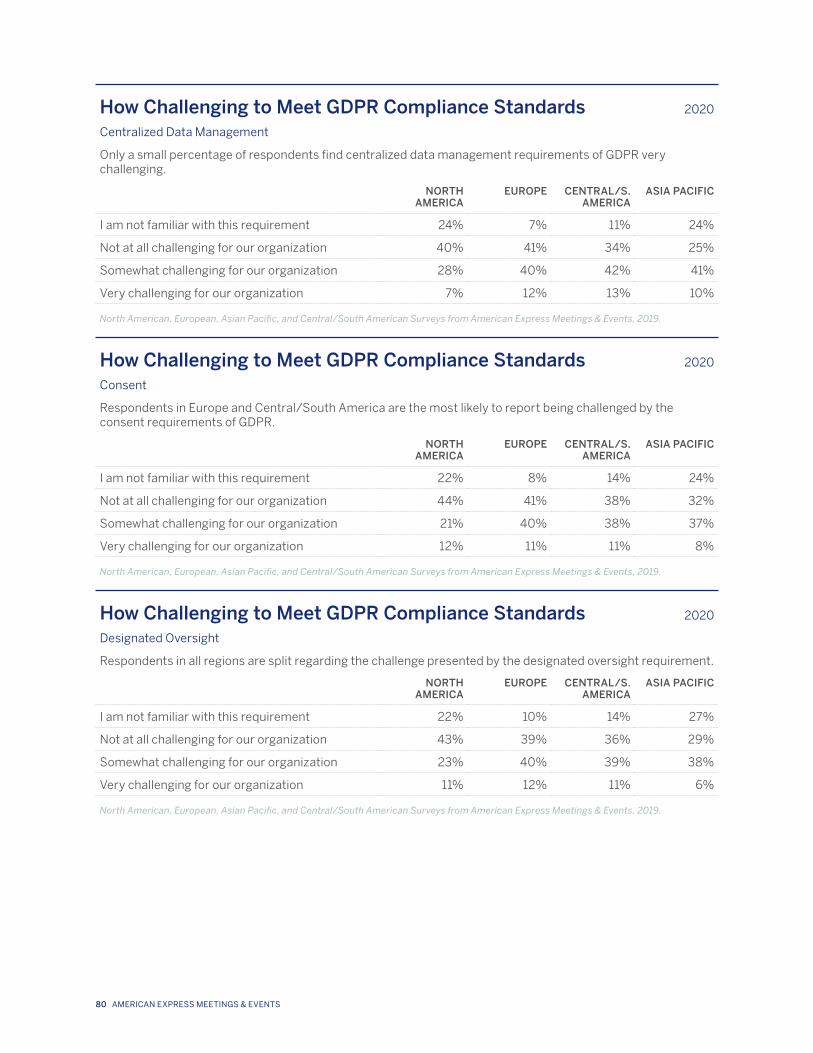
How Challenging to Meet GDPR Compliance Standards 2020
Centralized Data Management
Only a small percentage of respondents find centralized data management requirements of GDPR very challenging.
NORTH AMERICA
EUROPE CENTRAL/S. AMERICA
ASIA PACIFIC
I am not familiar with this requirement 24% 7% 11% 24%
Not at all challenging for our organization 40% 41% 34% 25%
Somewhat challenging for our organization 28% 40% 42% 41%
Very challenging for our organization 7% 12% 13% 10%
North American, European, Asian Pacific, and Central/South American Surveys from American Express Meetings & Events, 2019.
How Challenging to Meet GDPR Compliance Standards 2020
Consent
Respondents in Europe and Central/South America are the most likely to report being challenged by the consent requirements of GDPR.
NORTH AMERICA
EUROPE CENTRAL/S. AMERICA
ASIA PACIFIC
I am not familiar with this requirement 22% 8% 14% 24%
Not at all challenging for our organization 44% 41% 38% 32%
Somewhat challenging for our organization 21% 40% 38% 37%
Very challenging for our organization 12% 11% 11% 8%
North American, European, Asian Pacific, and Central/South American Surveys from American Express Meetings & Events, 2019.
How Challenging to Meet GDPR Compliance Standards 2020
Designated Oversight
Respondents in all regions are split regarding the challenge presented by the designated oversight requirement.
NORTH AMERICA
EUROPE CENTRAL/S. AMERICA
ASIA PACIFIC
I am not familiar with this requirement 22% 10% 14% 27%
Not at all challenging for our organization 43% 39% 36% 29%
Somewhat challenging for our organization 23% 40% 39% 38%
Very challenging for our organization 11% 12% 11% 6%
North American, European, Asian Pacific, and Central/South American Surveys from American Express Meetings & Events, 2019.
80 AMERICAN EXPRESS MEETINGS & EVENTS
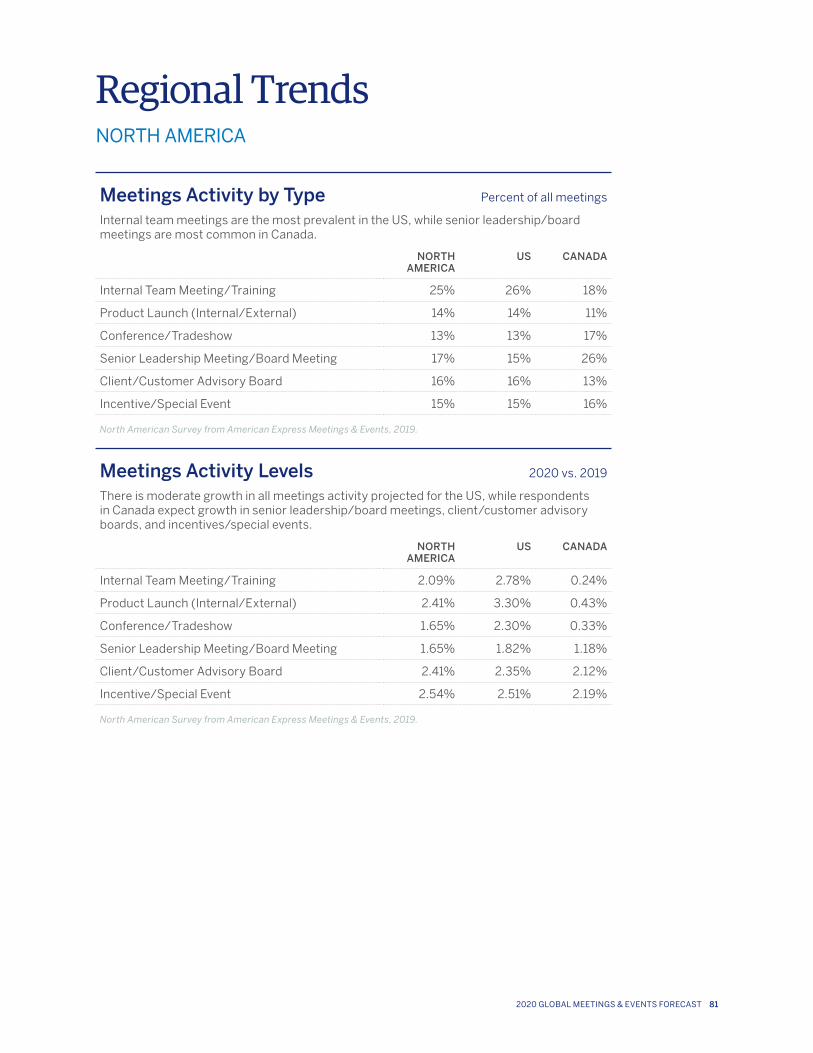
Regional TrendsNORTH AMERICA
Meetings Activity by Type Percent of all meetings
Internal team meetings are the most prevalent in the US, while senior leadership/board meetings are most common in Canada.
NORTH AMERICA
US CANADA
Internal Team Meeting/Training 25% 26% 18%
Product Launch (Internal/External) 14% 14% 11%
Conference/Tradeshow 13% 13% 17%
Senior Leadership Meeting/Board Meeting 17% 15% 26%
Client/Customer Advisory Board 16% 16% 13%
Incentive/Special Event 15% 15% 16%
North American Survey from American Express Meetings & Events, 2019.
Meetings Activity Levels 2020 vs. 2019
There is moderate growth in all meetings activity projected for the US, while respondents in Canada expect growth in senior leadership/board meetings, client/customer advisory boards, and incentives/special events.
NORTH AMERICA
US CANADA
Internal Team Meeting/Training 2.09% 2.78% 0.24%
Product Launch (Internal/External) 2.41% 3.30% 0.43%
Conference/Tradeshow 1.65% 2.30% 0.33%
Senior Leadership Meeting/Board Meeting 1.65% 1.82% 1.18%
Client/Customer Advisory Board 2.41% 2.35% 2.12%
Incentive/Special Event 2.54% 2.51% 2.19%
North American Survey from American Express Meetings & Events, 2019.
2020 GLOBAL MEETINGS & EVENTS FORECAST 81
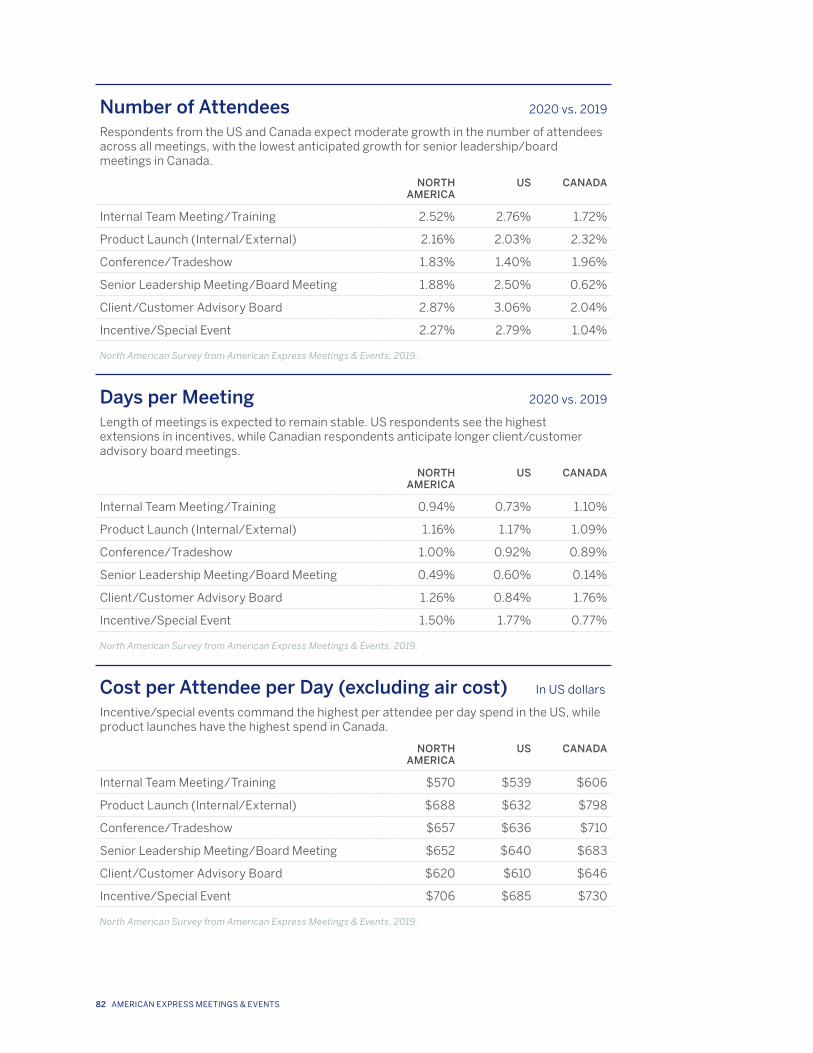
Number of Attendees 2020 vs. 2019
Respondents from the US and Canada expect moderate growth in the number of attendees across all meetings, with the lowest anticipated growth for senior leadership/board meetings in Canada.
NORTH AMERICA
US CANADA
Internal Team Meeting/Training 2.52% 2.76% 1.72%
Product Launch (Internal/External) 2.16% 2.03% 2.32%
Conference/Tradeshow 1.83% 1.40% 1.96%
Senior Leadership Meeting/Board Meeting 1.88% 2.50% 0.62%
Client/Customer Advisory Board 2.87% 3.06% 2.04%
Incentive/Special Event 2.27% 2.79% 1.04%
North American Survey from American Express Meetings & Events, 2019.
Days per Meeting 2020 vs. 2019
Length of meetings is expected to remain stable. US respondents see the highest extensions in incentives, while Canadian respondents anticipate longer client/customer advisory board meetings.
NORTH AMERICA
US CANADA
Internal Team Meeting/Training 0.94% 0.73% 1.10%
Product Launch (Internal/External) 1.16% 1.17% 1.09%
Conference/Tradeshow 1.00% 0.92% 0.89%
Senior Leadership Meeting/Board Meeting 0.49% 0.60% 0.14%
Client/Customer Advisory Board 1.26% 0.84% 1.76%
Incentive/Special Event 1.50% 1.77% 0.77%
North American Survey from American Express Meetings & Events, 2019.
Cost per Attendee per Day (excluding air cost) In US dollars
Incentive/special events command the highest per attendee per day spend in the US, while product launches have the highest spend in Canada.
NORTH AMERICA
US CANADA
Internal Team Meeting/Training $570 $539 $606
Product Launch (Internal/External) $688 $632 $798
Conference/Tradeshow $657 $636 $710
Senior Leadership Meeting/Board Meeting $652 $640 $683
Client/Customer Advisory Board $620 $610 $646
Incentive/Special Event $706 $685 $730
North American Survey from American Express Meetings & Events, 2019.
82 AMERICAN EXPRESS MEETINGS & EVENTS
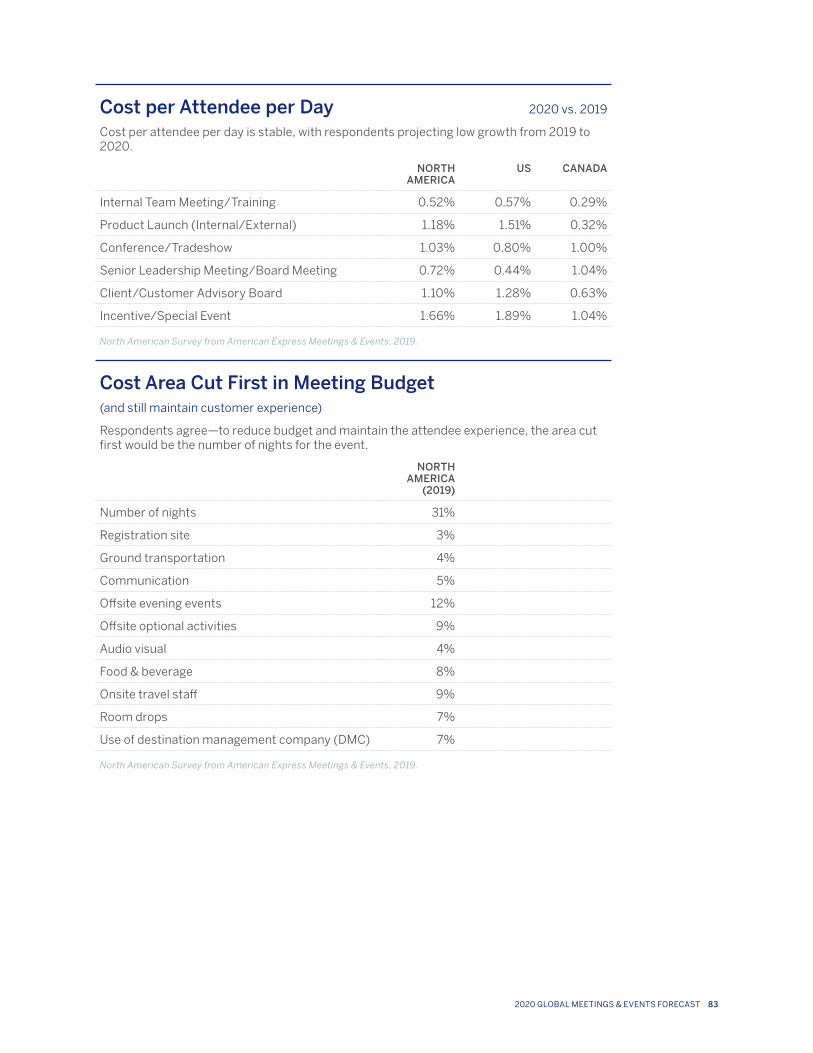
Cost per Attendee per Day 2020 vs. 2019
Cost per attendee per day is stable, with respondents projecting low growth from 2019 to 2020.
NORTH AMERICA
US CANADA
Internal Team Meeting/Training 0.52% 0.57% 0.29%
Product Launch (Internal/External) 1.18% 1.51% 0.32%
Conference/Tradeshow 1.03% 0.80% 1.00%
Senior Leadership Meeting/Board Meeting 0.72% 0.44% 1.04%
Client/Customer Advisory Board 1.10% 1.28% 0.63%
Incentive/Special Event 1.66% 1.89% 1.04%
North American Survey from American Express Meetings & Events, 2019.
Cost Area Cut First in Meeting Budget(and still maintain customer experience)
Respondents agree—to reduce budget and maintain the attendee experience, the area cut first would be the number of nights for the event.
NORTH AMERICA
(2019)
Number of nights 31%
Registration site 3%
Ground transportation 4%
Communication 5%
Offsite evening events 12%
Offsite optional activities 9%
Audio visual 4%
Food & beverage 8%
Onsite travel staff 9%
Room drops 7%
Use of destination management company (DMC) 7%
North American Survey from American Express Meetings & Events, 2019.
2020 GLOBAL MEETINGS & EVENTS FORECAST 83
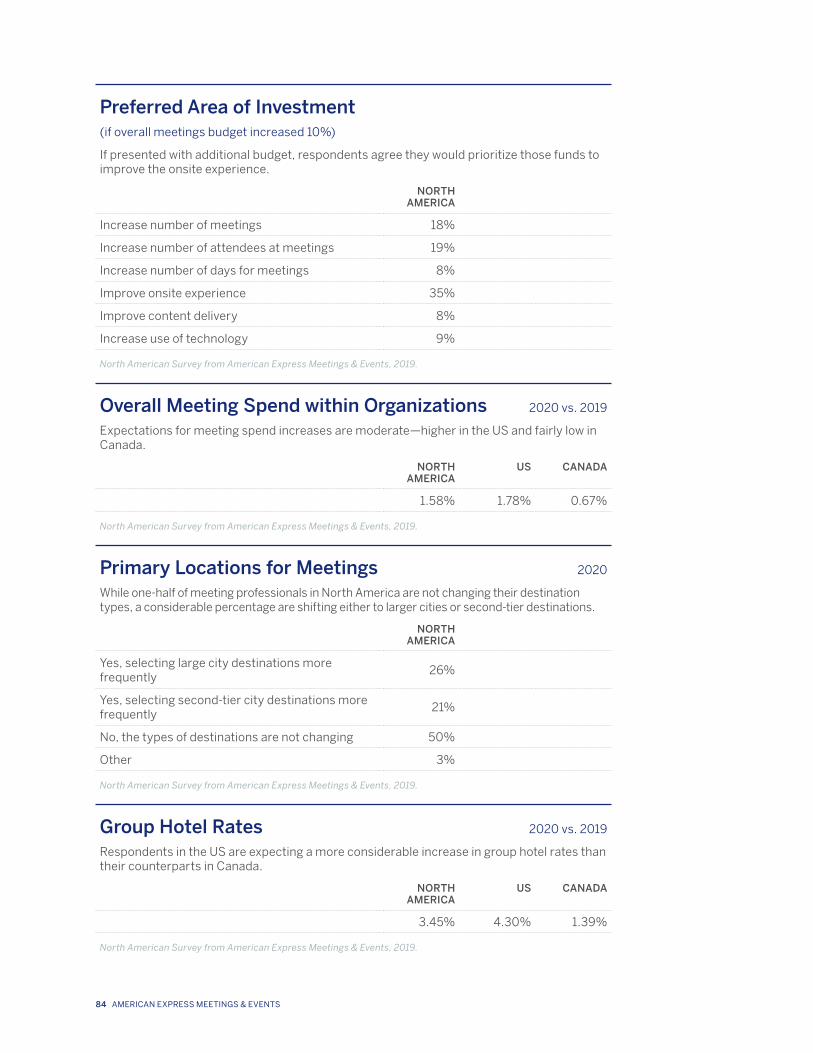
Preferred Area of Investment(if overall meetings budget increased 10%)
If presented with additional budget, respondents agree they would prioritize those funds to improve the onsite experience.
NORTH AMERICA
Increase number of meetings 18%
Increase number of attendees at meetings 19%
Increase number of days for meetings 8%
Improve onsite experience 35%
Improve content delivery 8%
Increase use of technology 9%
North American Survey from American Express Meetings & Events, 2019.
Overall Meeting Spend within Organizations 2020 vs. 2019
Expectations for meeting spend increases are moderate—higher in the US and fairly low in Canada.
NORTH AMERICA
US CANADA
1.58% 1.78% 0.67%
North American Survey from American Express Meetings & Events, 2019.
Primary Locations for Meetings 2020
While one-half of meeting professionals in North America are not changing their destination types, a considerable percentage are shifting either to larger cities or second-tier destinations.
NORTH AMERICA
Yes, selecting large city destinations more frequently
26%
Yes, selecting second-tier city destinations more frequently
21%
No, the types of destinations are not changing 50%
Other 3%
North American Survey from American Express Meetings & Events, 2019.
Group Hotel Rates 2020 vs. 2019
Respondents in the US are expecting a more considerable increase in group hotel rates than their counterparts in Canada.
NORTH AMERICA
US CANADA
3.45% 4.30% 1.39%
North American Survey from American Express Meetings & Events, 2019.
84 AMERICAN EXPRESS MEETINGS & EVENTS
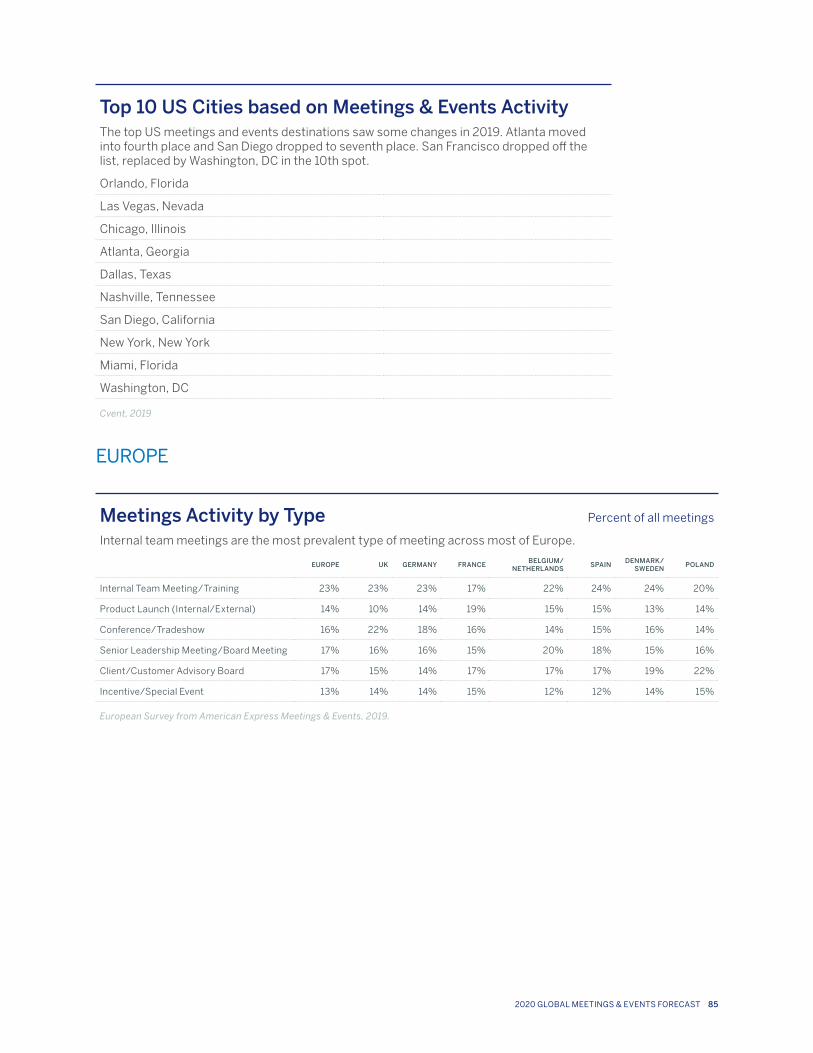
Top 10 US Cities based on Meetings & Events ActivityThe top US meetings and events destinations saw some changes in 2019. Atlanta moved into fourth place and San Diego dropped to seventh place. San Francisco dropped off the list, replaced by Washington, DC in the 10th spot.
Orlando, Florida
Las Vegas, Nevada
Chicago, Illinois
Atlanta, Georgia
Dallas, Texas
Nashville, Tennessee
San Diego, California
New York, New York
Miami, Florida
Washington, DC
Cvent, 2019
EUROPE
Meetings Activity by Type Percent of all meetings
Internal team meetings are the most prevalent type of meeting across most of Europe.
EUROPE UK GERMANY FRANCEBELGIUM/
NETHERLANDSSPAIN
DENMARK/ SWEDEN
POLAND
Internal Team Meeting/Training 23% 23% 23% 17% 22% 24% 24% 20%
Product Launch (Internal/External) 14% 10% 14% 19% 15% 15% 13% 14%
Conference/Tradeshow 16% 22% 18% 16% 14% 15% 16% 14%
Senior Leadership Meeting/Board Meeting 17% 16% 16% 15% 20% 18% 15% 16%
Client/Customer Advisory Board 17% 15% 14% 17% 17% 17% 19% 22%
Incentive/Special Event 13% 14% 14% 15% 12% 12% 14% 15%
European Survey from American Express Meetings & Events, 2019.
2020 GLOBAL MEETINGS & EVENTS FORECAST 85
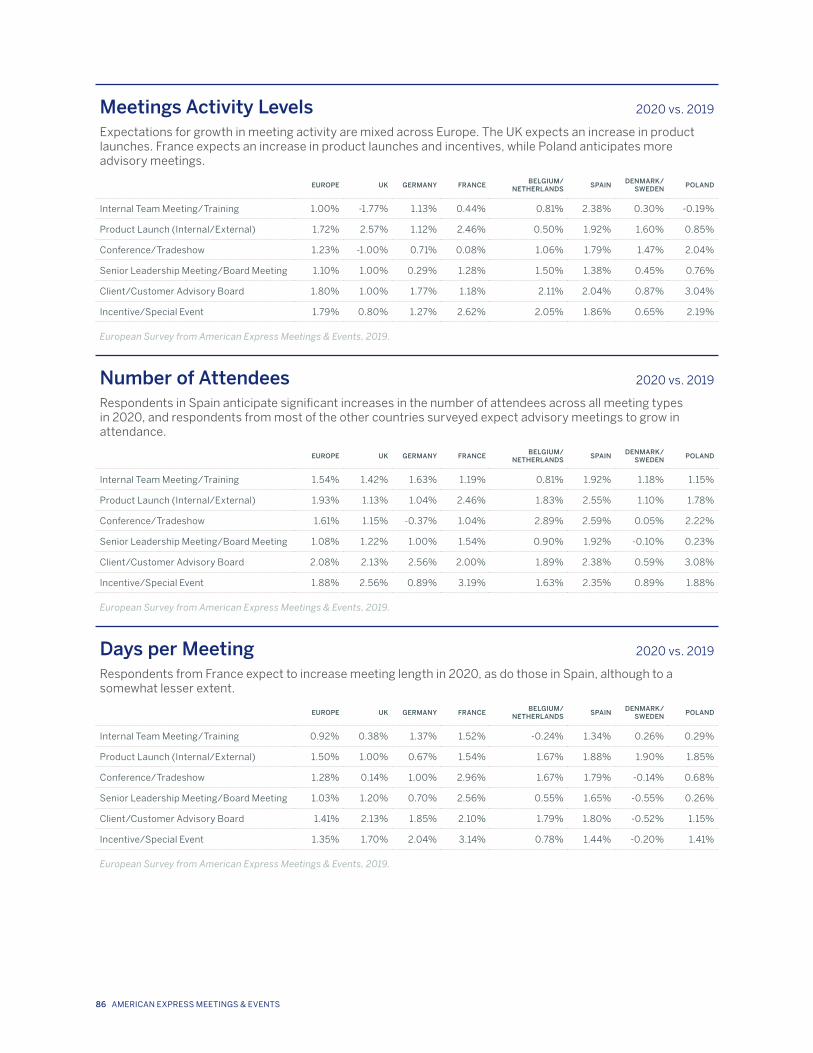
Meetings Activity Levels 2020 vs. 2019
Expectations for growth in meeting activity are mixed across Europe. The UK expects an increase in product launches. France expects an increase in product launches and incentives, while Poland anticipates more advisory meetings.
EUROPE UK GERMANY FRANCEBELGIUM/
NETHERLANDSSPAIN
DENMARK/ SWEDEN
POLAND
Internal Team Meeting/Training 1.00% -1.77% 1.13% 0.44% 0.81% 2.38% 0.30% -0.19%
Product Launch (Internal/External) 1.72% 2.57% 1.12% 2.46% 0.50% 1.92% 1.60% 0.85%
Conference/Tradeshow 1.23% -1.00% 0.71% 0.08% 1.06% 1.79% 1.47% 2.04%
Senior Leadership Meeting/Board Meeting 1.10% 1.00% 0.29% 1.28% 1.50% 1.38% 0.45% 0.76%
Client/Customer Advisory Board 1.80% 1.00% 1.77% 1.18% 2.11% 2.04% 0.87% 3.04%
Incentive/Special Event 1.79% 0.80% 1.27% 2.62% 2.05% 1.86% 0.65% 2.19%
European Survey from American Express Meetings & Events, 2019.
Number of Attendees 2020 vs. 2019
Respondents in Spain anticipate significant increases in the number of attendees across all meeting types in 2020, and respondents from most of the other countries surveyed expect advisory meetings to grow in attendance.
EUROPE UK GERMANY FRANCEBELGIUM/
NETHERLANDSSPAIN
DENMARK/ SWEDEN
POLAND
Internal Team Meeting/Training 1.54% 1.42% 1.63% 1.19% 0.81% 1.92% 1.18% 1.15%
Product Launch (Internal/External) 1.93% 1.13% 1.04% 2.46% 1.83% 2.55% 1.10% 1.78%
Conference/Tradeshow 1.61% 1.15% -0.37% 1.04% 2.89% 2.59% 0.05% 2.22%
Senior Leadership Meeting/Board Meeting 1.08% 1.22% 1.00% 1.54% 0.90% 1.92% -0.10% 0.23%
Client/Customer Advisory Board 2.08% 2.13% 2.56% 2.00% 1.89% 2.38% 0.59% 3.08%
Incentive/Special Event 1.88% 2.56% 0.89% 3.19% 1.63% 2.35% 0.89% 1.88%
European Survey from American Express Meetings & Events, 2019.
Days per Meeting 2020 vs. 2019
Respondents from France expect to increase meeting length in 2020, as do those in Spain, although to a somewhat lesser extent.
EUROPE UK GERMANY FRANCEBELGIUM/
NETHERLANDSSPAIN
DENMARK/ SWEDEN
POLAND
Internal Team Meeting/Training 0.92% 0.38% 1.37% 1.52% -0.24% 1.34% 0.26% 0.29%
Product Launch (Internal/External) 1.50% 1.00% 0.67% 1.54% 1.67% 1.88% 1.90% 1.85%
Conference/Tradeshow 1.28% 0.14% 1.00% 2.96% 1.67% 1.79% -0.14% 0.68%
Senior Leadership Meeting/Board Meeting 1.03% 1.20% 0.70% 2.56% 0.55% 1.65% -0.55% 0.26%
Client/Customer Advisory Board 1.41% 2.13% 1.85% 2.10% 1.79% 1.80% -0.52% 1.15%
Incentive/Special Event 1.35% 1.70% 2.04% 3.14% 0.78% 1.44% -0.20% 1.41%
European Survey from American Express Meetings & Events, 2019.
86 AMERICAN EXPRESS MEETINGS & EVENTS
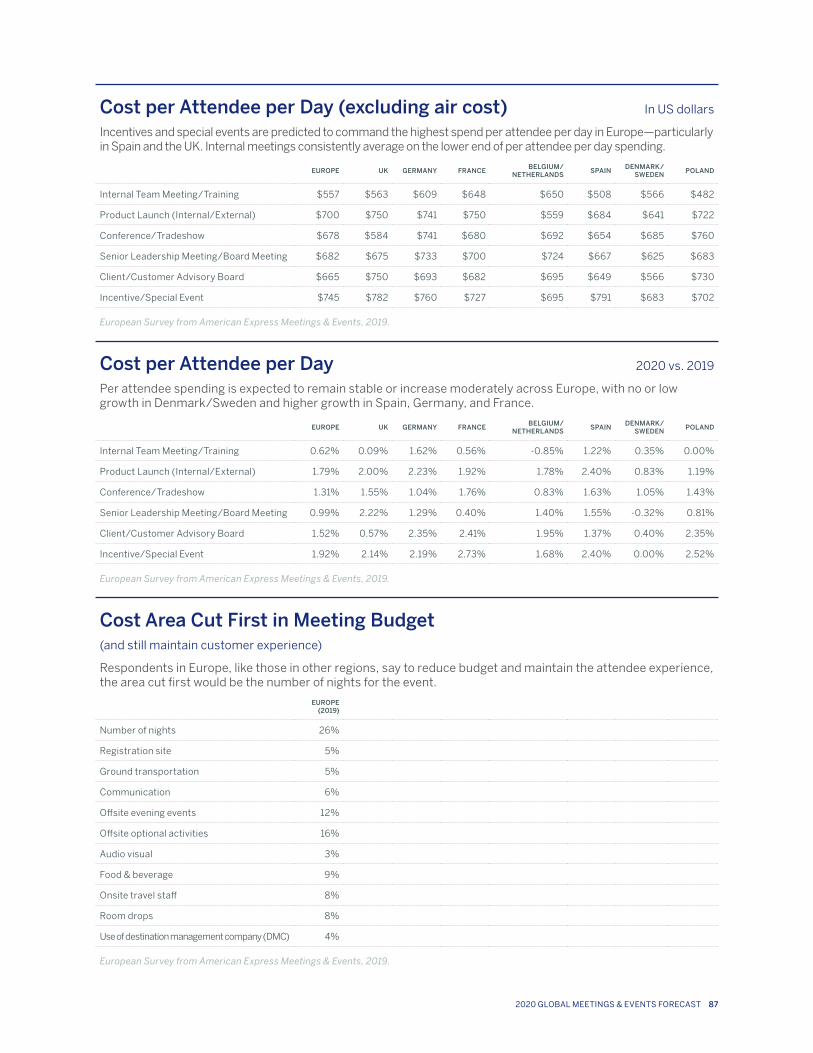
Cost per Attendee per Day (excluding air cost) In US dollars
Incentives and special events are predicted to command the highest spend per attendee per day in Europe—particularly in Spain and the UK. Internal meetings consistently average on the lower end of per attendee per day spending.
EUROPE UK GERMANY FRANCEBELGIUM/
NETHERLANDSSPAIN
DENMARK/ SWEDEN
POLAND
Internal Team Meeting/Training $557 $563 $609 $648 $650 $508 $566 $482
Product Launch (Internal/External) $700 $750 $741 $750 $559 $684 $641 $722
Conference/Tradeshow $678 $584 $741 $680 $692 $654 $685 $760
Senior Leadership Meeting/Board Meeting $682 $675 $733 $700 $724 $667 $625 $683
Client/Customer Advisory Board $665 $750 $693 $682 $695 $649 $566 $730
Incentive/Special Event $745 $782 $760 $727 $695 $791 $683 $702
European Survey from American Express Meetings & Events, 2019.
Cost per Attendee per Day 2020 vs. 2019
Per attendee spending is expected to remain stable or increase moderately across Europe, with no or low growth in Denmark/Sweden and higher growth in Spain, Germany, and France.
EUROPE UK GERMANY FRANCEBELGIUM/
NETHERLANDSSPAIN
DENMARK/ SWEDEN
POLAND
Internal Team Meeting/Training 0.62% 0.09% 1.62% 0.56% -0.85% 1.22% 0.35% 0.00%
Product Launch (Internal/External) 1.79% 2.00% 2.23% 1.92% 1.78% 2.40% 0.83% 1.19%
Conference/Tradeshow 1.31% 1.55% 1.04% 1.76% 0.83% 1.63% 1.05% 1.43%
Senior Leadership Meeting/Board Meeting 0.99% 2.22% 1.29% 0.40% 1.40% 1.55% -0.32% 0.81%
Client/Customer Advisory Board 1.52% 0.57% 2.35% 2.41% 1.95% 1.37% 0.40% 2.35%
Incentive/Special Event 1.92% 2.14% 2.19% 2.73% 1.68% 2.40% 0.00% 2.52%
European Survey from American Express Meetings & Events, 2019.
Cost Area Cut First in Meeting Budget(and still maintain customer experience)
Respondents in Europe, like those in other regions, say to reduce budget and maintain the attendee experience, the area cut first would be the number of nights for the event.
EUROPE (2019)
Number of nights 26%
Registration site 5%
Ground transportation 5%
Communication 6%
Offsite evening events 12%
Offsite optional activities 16%
Audio visual 3%
Food & beverage 9%
Onsite travel staff 8%
Room drops 8%
Use of destination management company (DMC) 4%
European Survey from American Express Meetings & Events, 2019.
2020 GLOBAL MEETINGS & EVENTS FORECAST 87
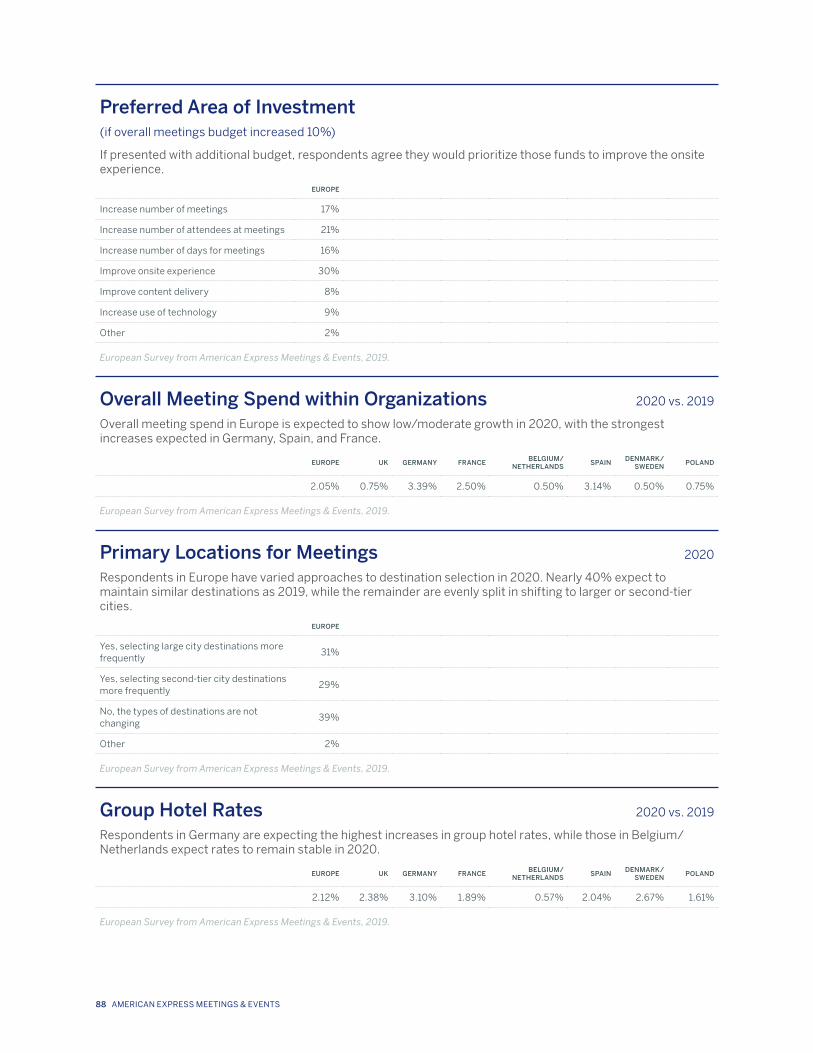
Preferred Area of Investment(if overall meetings budget increased 10%)
If presented with additional budget, respondents agree they would prioritize those funds to improve the onsite experience.
EUROPE
Increase number of meetings 17%
Increase number of attendees at meetings 21%
Increase number of days for meetings 16%
Improve onsite experience 30%
Improve content delivery 8%
Increase use of technology 9%
Other 2%
European Survey from American Express Meetings & Events, 2019.
Overall Meeting Spend within Organizations 2020 vs. 2019
Overall meeting spend in Europe is expected to show low/moderate growth in 2020, with the strongest increases expected in Germany, Spain, and France.
EUROPE UK GERMANY FRANCEBELGIUM/
NETHERLANDSSPAIN
DENMARK/ SWEDEN
POLAND
2.05% 0.75% 3.39% 2.50% 0.50% 3.14% 0.50% 0.75%
European Survey from American Express Meetings & Events, 2019.
Primary Locations for Meetings 2020
Respondents in Europe have varied approaches to destination selection in 2020. Nearly 40% expect to maintain similar destinations as 2019, while the remainder are evenly split in shifting to larger or second-tier cities.
EUROPE
Yes, selecting large city destinations more frequently
31%
Yes, selecting second-tier city destinations more frequently
29%
No, the types of destinations are not changing
39%
Other 2%
European Survey from American Express Meetings & Events, 2019.
Group Hotel Rates 2020 vs. 2019
Respondents in Germany are expecting the highest increases in group hotel rates, while those in Belgium/Netherlands expect rates to remain stable in 2020.
EUROPE UK GERMANY FRANCEBELGIUM/
NETHERLANDSSPAIN
DENMARK/ SWEDEN
POLAND
2.12% 2.38% 3.10% 1.89% 0.57% 2.04% 2.67% 1.61%
European Survey from American Express Meetings & Events, 2019.
88 AMERICAN EXPRESS MEETINGS & EVENTS
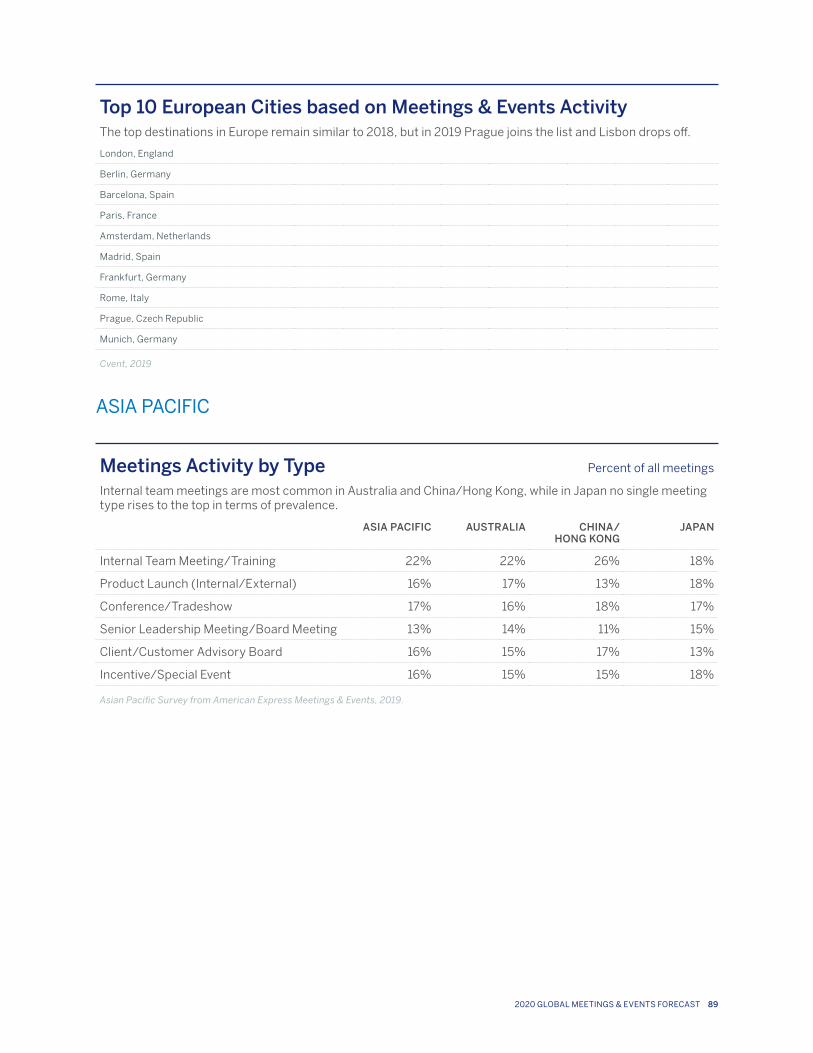
Top 10 European Cities based on Meetings & Events ActivityThe top destinations in Europe remain similar to 2018, but in 2019 Prague joins the list and Lisbon drops off.
London, England
Berlin, Germany
Barcelona, Spain
Paris, France
Amsterdam, Netherlands
Madrid, Spain
Frankfurt, Germany
Rome, Italy
Prague, Czech Republic
Munich, Germany
Cvent, 2019
ASIA PACIFIC
Meetings Activity by Type Percent of all meetings
Internal team meetings are most common in Australia and China/Hong Kong, while in Japan no single meeting type rises to the top in terms of prevalence.
ASIA PACIFIC AUSTRALIA CHINA/ HONG KONG
JAPAN
Internal Team Meeting/Training 22% 22% 26% 18%
Product Launch (Internal/External) 16% 17% 13% 18%
Conference/Tradeshow 17% 16% 18% 17%
Senior Leadership Meeting/Board Meeting 13% 14% 11% 15%
Client/Customer Advisory Board 16% 15% 17% 13%
Incentive/Special Event 16% 15% 15% 18%
Asian Pacific Survey from American Express Meetings & Events, 2019.
2020 GLOBAL MEETINGS & EVENTS FORECAST 89
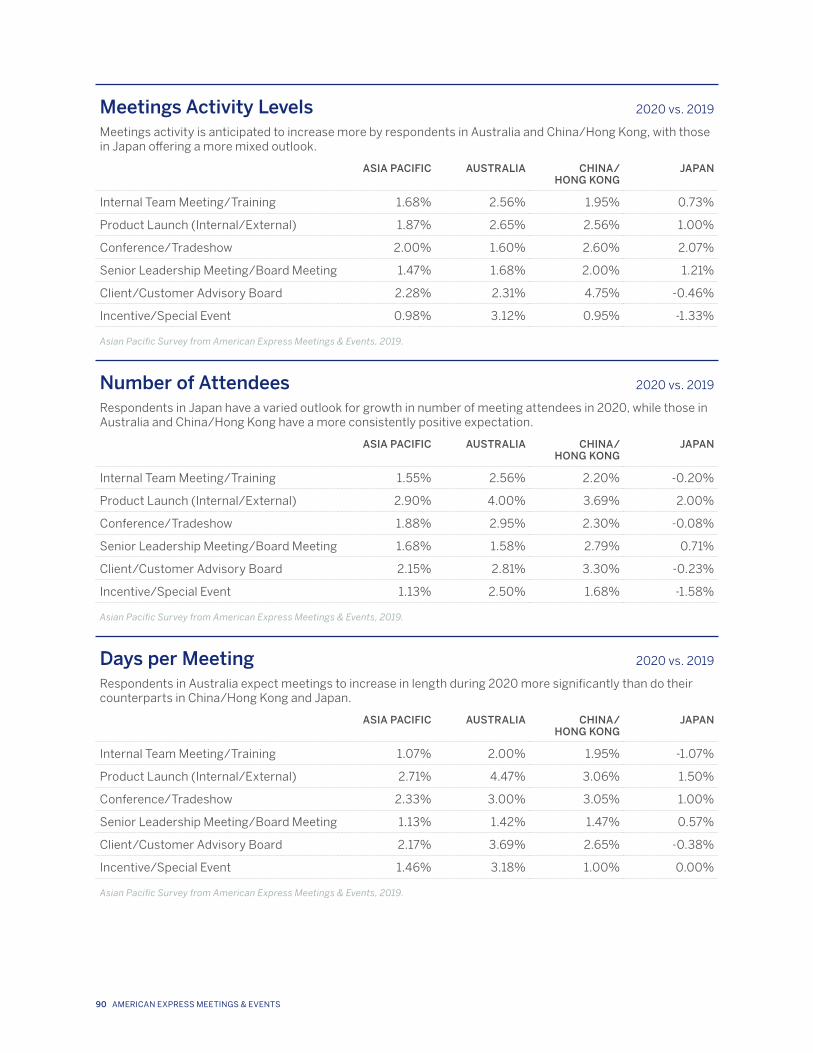
Meetings Activity Levels 2020 vs. 2019
Meetings activity is anticipated to increase more by respondents in Australia and China/Hong Kong, with those in Japan offering a more mixed outlook.
ASIA PACIFIC AUSTRALIA CHINA/ HONG KONG
JAPAN
Internal Team Meeting/Training 1.68% 2.56% 1.95% 0.73%
Product Launch (Internal/External) 1.87% 2.65% 2.56% 1.00%
Conference/Tradeshow 2.00% 1.60% 2.60% 2.07%
Senior Leadership Meeting/Board Meeting 1.47% 1.68% 2.00% 1.21%
Client/Customer Advisory Board 2.28% 2.31% 4.75% -0.46%
Incentive/Special Event 0.98% 3.12% 0.95% -1.33%
Asian Pacific Survey from American Express Meetings & Events, 2019.
Number of Attendees 2020 vs. 2019
Respondents in Japan have a varied outlook for growth in number of meeting attendees in 2020, while those in Australia and China/Hong Kong have a more consistently positive expectation.
ASIA PACIFIC AUSTRALIA CHINA/ HONG KONG
JAPAN
Internal Team Meeting/Training 1.55% 2.56% 2.20% -0.20%
Product Launch (Internal/External) 2.90% 4.00% 3.69% 2.00%
Conference/Tradeshow 1.88% 2.95% 2.30% -0.08%
Senior Leadership Meeting/Board Meeting 1.68% 1.58% 2.79% 0.71%
Client/Customer Advisory Board 2.15% 2.81% 3.30% -0.23%
Incentive/Special Event 1.13% 2.50% 1.68% -1.58%
Asian Pacific Survey from American Express Meetings & Events, 2019.
Days per Meeting 2020 vs. 2019
Respondents in Australia expect meetings to increase in length during 2020 more significantly than do their counterparts in China/Hong Kong and Japan.
ASIA PACIFIC AUSTRALIA CHINA/ HONG KONG
JAPAN
Internal Team Meeting/Training 1.07% 2.00% 1.95% -1.07%
Product Launch (Internal/External) 2.71% 4.47% 3.06% 1.50%
Conference/Tradeshow 2.33% 3.00% 3.05% 1.00%
Senior Leadership Meeting/Board Meeting 1.13% 1.42% 1.47% 0.57%
Client/Customer Advisory Board 2.17% 3.69% 2.65% -0.38%
Incentive/Special Event 1.46% 3.18% 1.00% 0.00%
Asian Pacific Survey from American Express Meetings & Events, 2019.
90 AMERICAN EXPRESS MEETINGS & EVENTS
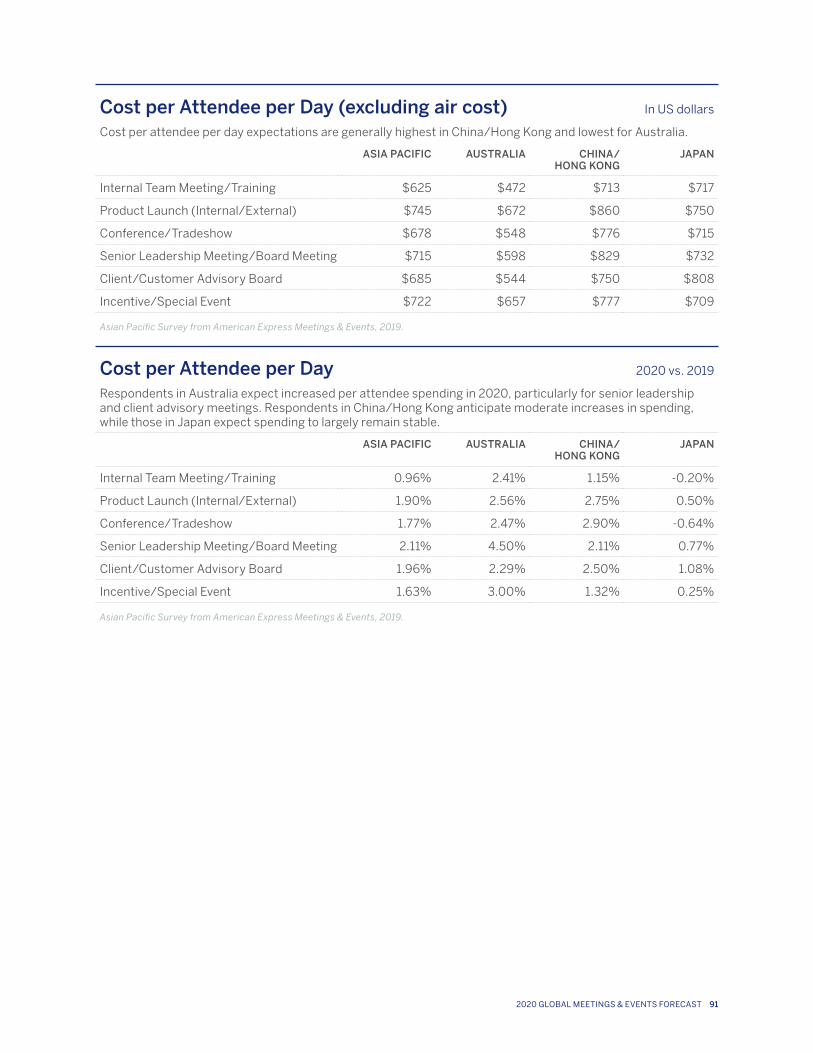
Cost per Attendee per Day (excluding air cost) In US dollars
Cost per attendee per day expectations are generally highest in China/Hong Kong and lowest for Australia.
ASIA PACIFIC AUSTRALIA CHINA/ HONG KONG
JAPAN
Internal Team Meeting/Training $625 $472 $713 $717
Product Launch (Internal/External) $745 $672 $860 $750
Conference/Tradeshow $678 $548 $776 $715
Senior Leadership Meeting/Board Meeting $715 $598 $829 $732
Client/Customer Advisory Board $685 $544 $750 $808
Incentive/Special Event $722 $657 $777 $709
Asian Pacific Survey from American Express Meetings & Events, 2019.
Cost per Attendee per Day 2020 vs. 2019
Respondents in Australia expect increased per attendee spending in 2020, particularly for senior leadership and client advisory meetings. Respondents in China/Hong Kong anticipate moderate increases in spending, while those in Japan expect spending to largely remain stable.
ASIA PACIFIC AUSTRALIA CHINA/ HONG KONG
JAPAN
Internal Team Meeting/Training 0.96% 2.41% 1.15% -0.20%
Product Launch (Internal/External) 1.90% 2.56% 2.75% 0.50%
Conference/Tradeshow 1.77% 2.47% 2.90% -0.64%
Senior Leadership Meeting/Board Meeting 2.11% 4.50% 2.11% 0.77%
Client/Customer Advisory Board 1.96% 2.29% 2.50% 1.08%
Incentive/Special Event 1.63% 3.00% 1.32% 0.25%
Asian Pacific Survey from American Express Meetings & Events, 2019.
2020 GLOBAL MEETINGS & EVENTS FORECAST 91
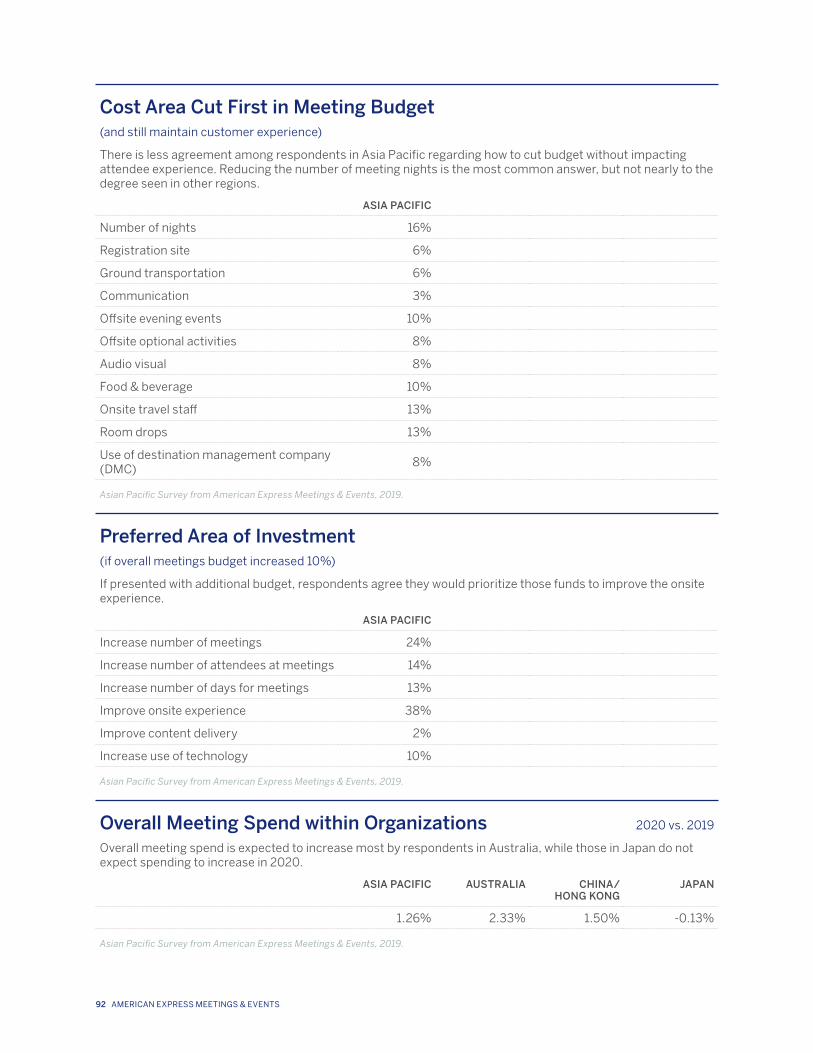
Cost Area Cut First in Meeting Budget(and still maintain customer experience)
There is less agreement among respondents in Asia Pacific regarding how to cut budget without impacting attendee experience. Reducing the number of meeting nights is the most common answer, but not nearly to the degree seen in other regions.
ASIA PACIFIC
Number of nights 16%
Registration site 6%
Ground transportation 6%
Communication 3%
Offsite evening events 10%
Offsite optional activities 8%
Audio visual 8%
Food & beverage 10%
Onsite travel staff 13%
Room drops 13%
Use of destination management company (DMC)
8%
Asian Pacific Survey from American Express Meetings & Events, 2019.
Preferred Area of Investment(if overall meetings budget increased 10%)
If presented with additional budget, respondents agree they would prioritize those funds to improve the onsite experience.
ASIA PACIFIC
Increase number of meetings 24%
Increase number of attendees at meetings 14%
Increase number of days for meetings 13%
Improve onsite experience 38%
Improve content delivery 2%
Increase use of technology 10%
Asian Pacific Survey from American Express Meetings & Events, 2019.
Overall Meeting Spend within Organizations 2020 vs. 2019
Overall meeting spend is expected to increase most by respondents in Australia, while those in Japan do not expect spending to increase in 2020.
ASIA PACIFIC AUSTRALIA CHINA/ HONG KONG
JAPAN
1.26% 2.33% 1.50% -0.13%
Asian Pacific Survey from American Express Meetings & Events, 2019.
92 AMERICAN EXPRESS MEETINGS & EVENTS
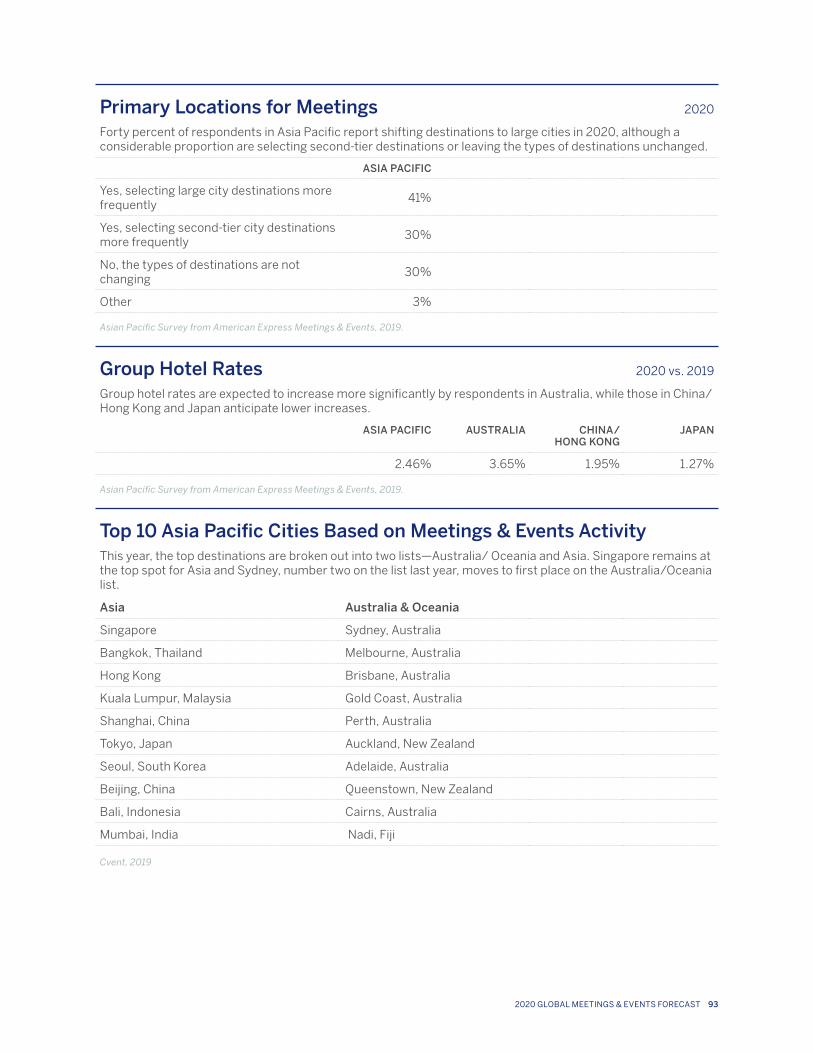
Primary Locations for Meetings 2020
Forty percent of respondents in Asia Pacific report shifting destinations to large cities in 2020, although a considerable proportion are selecting second-tier destinations or leaving the types of destinations unchanged.
ASIA PACIFIC
Yes, selecting large city destinations more frequently
41%
Yes, selecting second-tier city destinations more frequently
30%
No, the types of destinations are not changing
30%
Other 3%
Asian Pacific Survey from American Express Meetings & Events, 2019.
Group Hotel Rates 2020 vs. 2019
Group hotel rates are expected to increase more significantly by respondents in Australia, while those in China/Hong Kong and Japan anticipate lower increases.
ASIA PACIFIC AUSTRALIA CHINA/ HONG KONG
JAPAN
2.46% 3.65% 1.95% 1.27%
Asian Pacific Survey from American Express Meetings & Events, 2019.
Top 10 Asia Pacific Cities Based on Meetings & Events ActivityThis year, the top destinations are broken out into two lists—Australia/ Oceania and Asia. Singapore remains at the top spot for Asia and Sydney, number two on the list last year, moves to first place on the Australia/Oceania list.
Asia Australia & Oceania
Singapore Sydney, Australia
Bangkok, Thailand Melbourne, Australia
Hong Kong Brisbane, Australia
Kuala Lumpur, Malaysia Gold Coast, Australia
Shanghai, China Perth, Australia
Tokyo, Japan Auckland, New Zealand
Seoul, South Korea Adelaide, Australia
Beijing, China Queenstown, New Zealand
Bali, Indonesia Cairns, Australia
Mumbai, India Nadi, Fiji
Cvent, 2019
2020 GLOBAL MEETINGS & EVENTS FORECAST 93
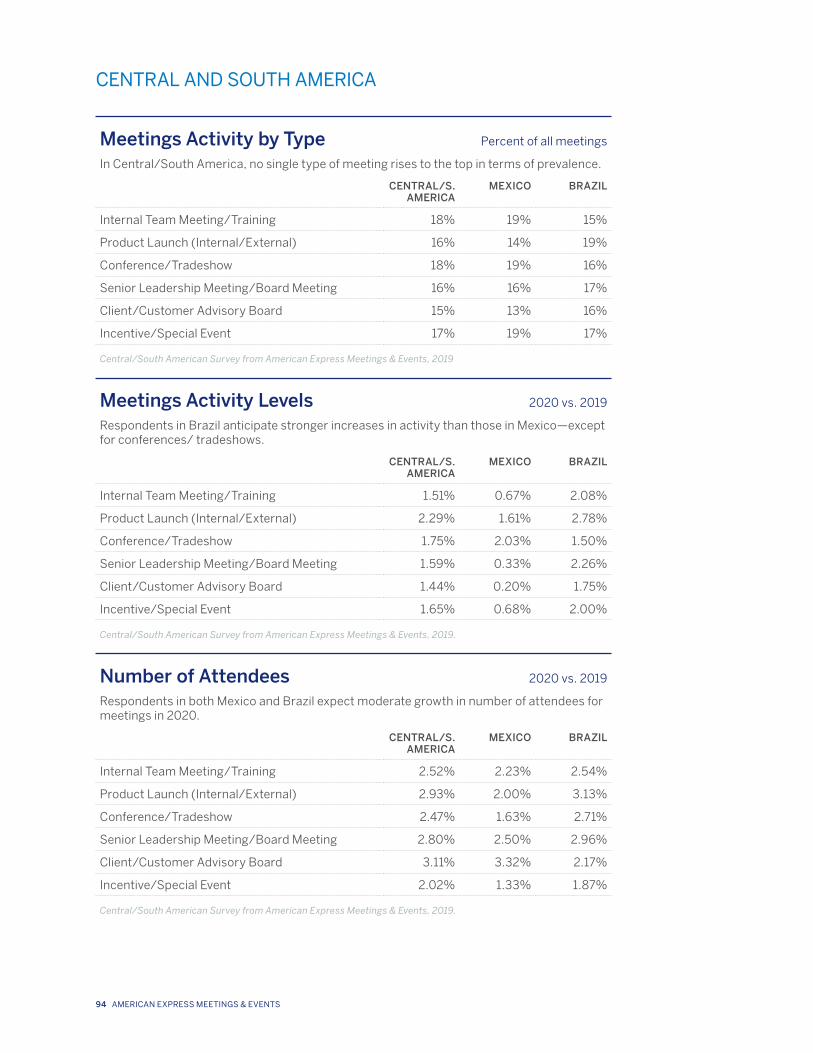
CENTRAL AND SOUTH AMERICA
Meetings Activity by Type Percent of all meetings
In Central/South America, no single type of meeting rises to the top in terms of prevalence.
CENTRAL/S. AMERICA
MEXICO BRAZIL
Internal Team Meeting/Training 18% 19% 15%
Product Launch (Internal/External) 16% 14% 19%
Conference/Tradeshow 18% 19% 16%
Senior Leadership Meeting/Board Meeting 16% 16% 17%
Client/Customer Advisory Board 15% 13% 16%
Incentive/Special Event 17% 19% 17%
Central/South American Survey from American Express Meetings & Events, 2019
Meetings Activity Levels 2020 vs. 2019
Respondents in Brazil anticipate stronger increases in activity than those in Mexico—except for conferences/ tradeshows.
CENTRAL/S. AMERICA
MEXICO BRAZIL
Internal Team Meeting/Training 1.51% 0.67% 2.08%
Product Launch (Internal/External) 2.29% 1.61% 2.78%
Conference/Tradeshow 1.75% 2.03% 1.50%
Senior Leadership Meeting/Board Meeting 1.59% 0.33% 2.26%
Client/Customer Advisory Board 1.44% 0.20% 1.75%
Incentive/Special Event 1.65% 0.68% 2.00%
Central/South American Survey from American Express Meetings & Events, 2019.
Number of Attendees 2020 vs. 2019
Respondents in both Mexico and Brazil expect moderate growth in number of attendees for meetings in 2020.
CENTRAL/S. AMERICA
MEXICO BRAZIL
Internal Team Meeting/Training 2.52% 2.23% 2.54%
Product Launch (Internal/External) 2.93% 2.00% 3.13%
Conference/Tradeshow 2.47% 1.63% 2.71%
Senior Leadership Meeting/Board Meeting 2.80% 2.50% 2.96%
Client/Customer Advisory Board 3.11% 3.32% 2.17%
Incentive/Special Event 2.02% 1.33% 1.87%
Central/South American Survey from American Express Meetings & Events, 2019.
94 AMERICAN EXPRESS MEETINGS & EVENTS
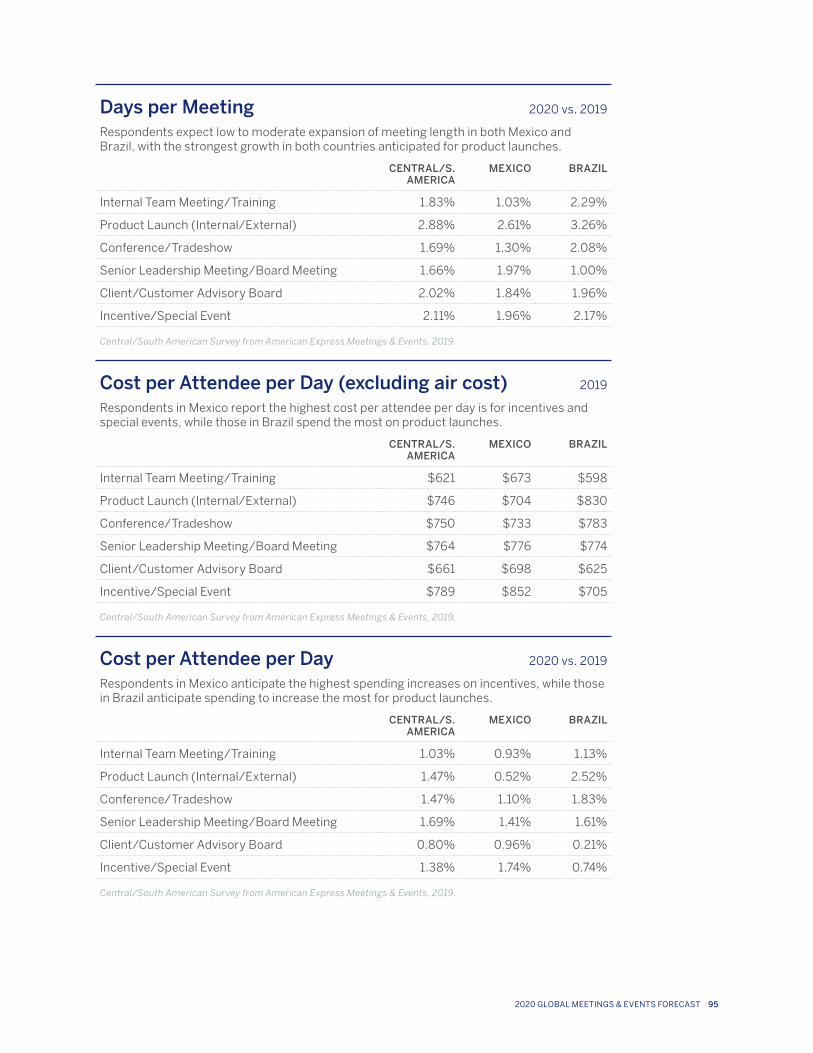
Days per Meeting 2020 vs. 2019
Respondents expect low to moderate expansion of meeting length in both Mexico and Brazil, with the strongest growth in both countries anticipated for product launches.
CENTRAL/S. AMERICA
MEXICO BRAZIL
Internal Team Meeting/Training 1.83% 1.03% 2.29%
Product Launch (Internal/External) 2.88% 2.61% 3.26%
Conference/Tradeshow 1.69% 1.30% 2.08%
Senior Leadership Meeting/Board Meeting 1.66% 1.97% 1.00%
Client/Customer Advisory Board 2.02% 1.84% 1.96%
Incentive/Special Event 2.11% 1.96% 2.17%
Central/South American Survey from American Express Meetings & Events, 2019.
Cost per Attendee per Day (excluding air cost) 2019
Respondents in Mexico report the highest cost per attendee per day is for incentives and special events, while those in Brazil spend the most on product launches.
CENTRAL/S. AMERICA
MEXICO BRAZIL
Internal Team Meeting/Training $621 $673 $598
Product Launch (Internal/External) $746 $704 $830
Conference/Tradeshow $750 $733 $783
Senior Leadership Meeting/Board Meeting $764 $776 $774
Client/Customer Advisory Board $661 $698 $625
Incentive/Special Event $789 $852 $705
Central/South American Survey from American Express Meetings & Events, 2019.
Cost per Attendee per Day 2020 vs. 2019
Respondents in Mexico anticipate the highest spending increases on incentives, while those in Brazil anticipate spending to increase the most for product launches.
CENTRAL/S. AMERICA
MEXICO BRAZIL
Internal Team Meeting/Training 1.03% 0.93% 1.13%
Product Launch (Internal/External) 1.47% 0.52% 2.52%
Conference/Tradeshow 1.47% 1.10% 1.83%
Senior Leadership Meeting/Board Meeting 1.69% 1.41% 1.61%
Client/Customer Advisory Board 0.80% 0.96% 0.21%
Incentive/Special Event 1.38% 1.74% 0.74%
Central/South American Survey from American Express Meetings & Events, 2019.
2020 GLOBAL MEETINGS & EVENTS FORECAST 95
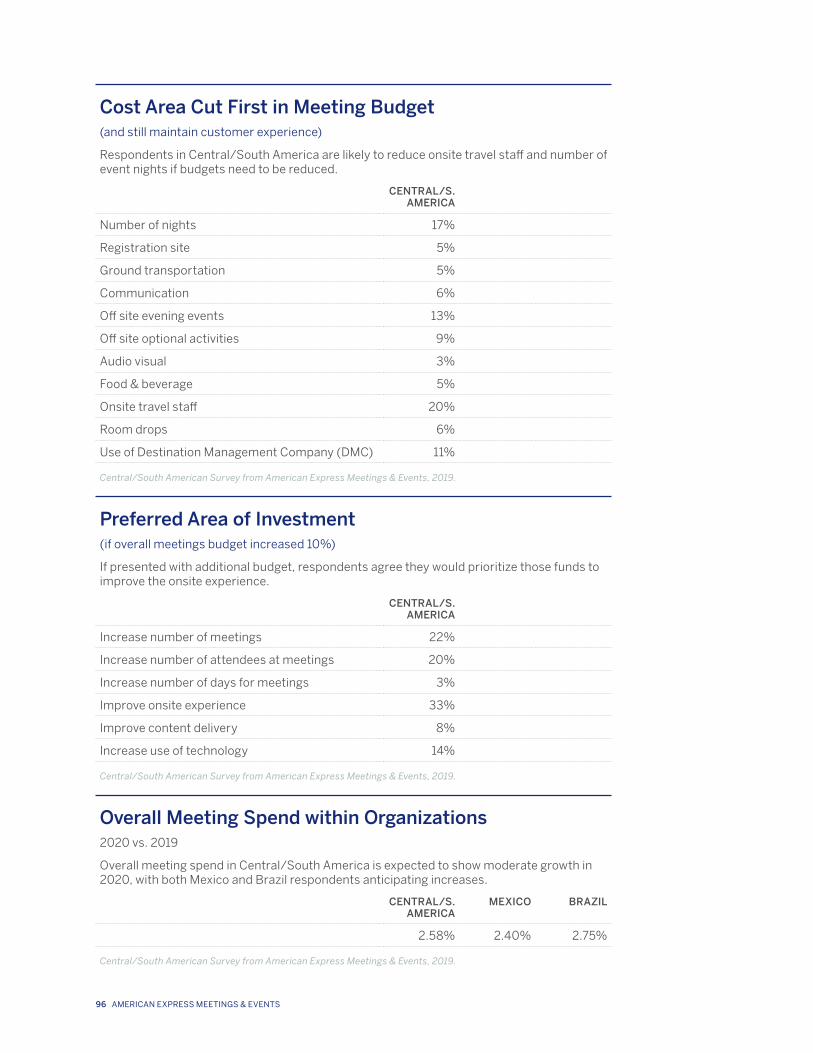
Cost Area Cut First in Meeting Budget(and still maintain customer experience)
Respondents in Central/South America are likely to reduce onsite travel staff and number of event nights if budgets need to be reduced.
CENTRAL/S. AMERICA
Number of nights 17%
Registration site 5%
Ground transportation 5%
Communication 6%
Off site evening events 13%
Off site optional activities 9%
Audio visual 3%
Food & beverage 5%
Onsite travel staff 20%
Room drops 6%
Use of Destination Management Company (DMC) 11%
Central/South American Survey from American Express Meetings & Events, 2019.
Preferred Area of Investment(if overall meetings budget increased 10%)
If presented with additional budget, respondents agree they would prioritize those funds to improve the onsite experience.
CENTRAL/S. AMERICA
Increase number of meetings 22%
Increase number of attendees at meetings 20%
Increase number of days for meetings 3%
Improve onsite experience 33%
Improve content delivery 8%
Increase use of technology 14%
Central/South American Survey from American Express Meetings & Events, 2019.
Overall Meeting Spend within Organizations2020 vs. 2019
Overall meeting spend in Central/South America is expected to show moderate growth in 2020, with both Mexico and Brazil respondents anticipating increases.
CENTRAL/S. AMERICA
MEXICO BRAZIL
2.58% 2.40% 2.75%
Central/South American Survey from American Express Meetings & Events, 2019.
96 AMERICAN EXPRESS MEETINGS & EVENTS
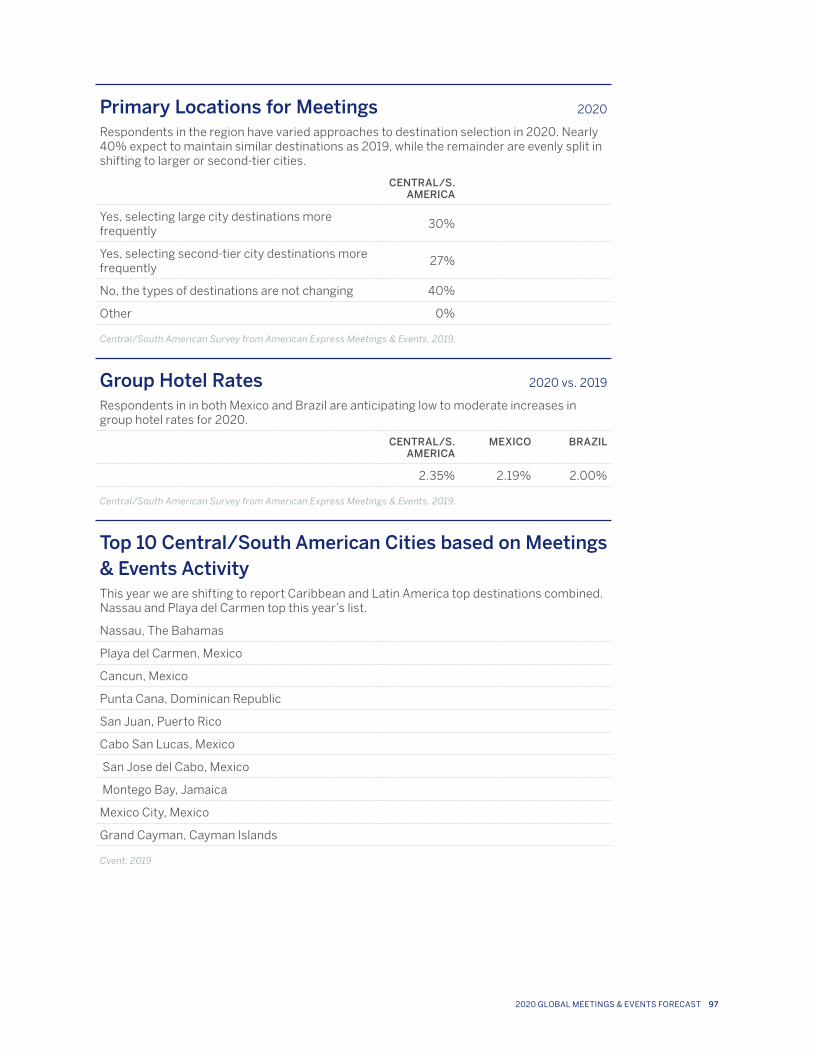
Primary Locations for Meetings 2020
Respondents in the region have varied approaches to destination selection in 2020. Nearly 40% expect to maintain similar destinations as 2019, while the remainder are evenly split in shifting to larger or second-tier cities.
CENTRAL/S. AMERICA
Yes, selecting large city destinations more frequently
30%
Yes, selecting second-tier city destinations more frequently
27%
No, the types of destinations are not changing 40%
Other 0%
Central/South American Survey from American Express Meetings & Events, 2019.
Group Hotel Rates 2020 vs. 2019
Respondents in in both Mexico and Brazil are anticipating low to moderate increases in group hotel rates for 2020.
CENTRAL/S. AMERICA
MEXICO BRAZIL
2.35% 2.19% 2.00%
Central/South American Survey from American Express Meetings & Events, 2019.
Top 10 Central/South American Cities based on Meetings & Events ActivityThis year we are shifting to report Caribbean and Latin America top destinations combined. Nassau and Playa del Carmen top this year’s list.
Nassau, The Bahamas
Playa del Carmen, Mexico
Cancun, Mexico
Punta Cana, Dominican Republic
San Juan, Puerto Rico
Cabo San Lucas, Mexico
San Jose del Cabo, Mexico
Montego Bay, Jamaica
Mexico City, Mexico
Grand Cayman, Cayman Islands
Cvent, 2019
2020 GLOBAL MEETINGS & EVENTS FORECAST 97
ContributorsIn addition to the meetings and events professionals from around the world who completed the American Express Meetings & Events May and June 2019 survey, the following contributors provided their expertise and perspective for this Forecast:
Reggie Aggarwal, CventSue Cavanaugh, Altitude Management Paul Cavanaugh, Altitude Management Aileen Furlong, United AirlinesJosé Miguel Moreno, Meliá Hotels International Bryan Reid, Altitude Management Rolf Schmidt, TOPHOTELPROJECTS GmbHSara Tedford, Altitude Management Megg Withinton, Intellective Group
American Express Meetings & Events and Banks SadlerAgnes BenvenisteAlex ContrerasMikael Ek Joanne ForseyRoberto GarciaLisa GoldingAna Yuly GrossoStephanie HarrisAdeline KangRalph KnoblauchEmily LauLinda McNairyWei MingRoberto OrtizErin O’ShannessyGeorgina PachecoKaori Pereyra-LagoMilton RiveraJaime RoseburghPatrick RushEppie ShepherdYma SherryHarold SpohrKumi TanabeMarcela TorresHatty WilmothCarrie WintonSandra Zanardi
98 AMERICAN EXPRESS MEETINGS & EVENTS
2020 GLOBAL MEETINGS & EVENTS FORECAST 99
We know meetings. Meetings are a part of life, but great meetings can change lives.
We know how to make meetings work for your company, your attendees, and your brand. We design experiences that matter – and we have the team, technology, and supplier network to deliver them. We’ll help you make the most of your meetings based on your goals, then help you measure and talk about the value delivered whether for a single meeting or your full meetings portfolio.
Responsible for more than 76,000 experiential events, meetings, and incentives annually, we can assist you end-to-end, or at any point in the meetings and events process. Our expertise is comprehensive – including in-person, digital, and hybrid solutions.
amexglobalbusinesstravel.com/meetings-and-events
“American Express Meetings & Events” is a division of American Express Global Business Travel (GBT). Banks Sadler is wholly owned by GBT.
GBT is a joint venture that is not wholly owned by American Express Company or any of its subsidiaries (American Express). “American Express Global Business Travel”, “American Express” and the American Express logo are trademarks of American Express, and are used under limited license. Please note that all information stated within the 2019 Global Meetings and Events Forecast is based on a survey distributed by American Express Meetings & Events to industry professionals and suppliers during the months of May and June 2019. In some instances, figures from the 2018 Global Meetings and Events Forecast have been included for reference only and noted accordingly.
100 AMERICAN EXPRESS MEETINGS & EVENTS