Embed Size (px)
Citation preview

2020 CSAH DISTRIBUTION
DATA
January 2020
This document is made available electronically by the Minnesota Legislative Reference Library as part of an ongoing digital archiving project. http://www.leg.state.mn.us/lrl/lrl.asp

TABLE OF CONTENTS
DISTRIBUTION DATA Pages 1-25 Highway User Tax Distribution Fund ............................................................................................ 2-5 Equalization Apportionment .......................................................................................................... 6-7 Motor Vehicle Registration Apportionment ................................................................................... 8-9 Lane Mile Apportionment .......................................................................................................... 10-11 Money Needs ............................................................................................................................ 12-13 Excess Sum .............................................................................................................................. 14-15 Construction and Maintenance Distribution .............................................................................. 16-17 Town Road Distribution ............................................................................................................. 18-19 Town Bridge Distribution ........................................................................................................... 20-22 Screening Board’s Recommendation to the Commissioner .......................................................... 23 Annual County State Aid Highway Money Needs ..................................................................... 24-25 ADJUSTMENTS Pages 27-45 Basic 25 year Construction Needs 2014-2018 Projects ........................................................... 28-29 Restriction of the 25 year Construction Needs ......................................................................... 30-31 County State Aid Construction Fund Balance Needs Deductions ............................................ 32-33 Mill Levy Deduction ................................................................................................................... 34-36 Minimum County Apportionments .................................................................................................. 37 Minimum County Adjustment ......................................................................................................... 38 Preliminary Components of the Distribution.............................................................................. 40-41 Screening Board Minimum County Adjustment ........................................................................ 42-43 Money Needs Adjustment ......................................................................................................... 44-45 Final Components of the Distribution ........................................................................................ 46-47 REFERENCE MATERIAL Pages 49-69 Comparison of the 2019 to the 2020 CSAH Distribution .......................................................... 50-51 2020 CSAH Distribution Earnings .................................................................................................. 52 Money Needs Distribution Earned per $1,000 of Adjusted Needs ................................................ 53 Regular Account, Municipal Account, Total CSAH Apportionment Fund & Distribution % ...... 54-57 Needs Calculation System Summary Document ...................................................................... 58-63 Current Resolutions of the County Screening Board ................................................................ 64-69 If you wish to obtain more copies of this report you can do so from our website: http://www.dot.state.mn.us/stateaid/csah-janbooks.html


1

ESTIMATED Gross Income from November Statewide Forecast(7-1-19 to 10-31-19 actual; 11-1-19 to 6-30-20 estimated) Total
Motor Fuel Tax 946,100,000$ Motor Vehicle Tax 835,900,000 Fee on Rental Vehicles 1,336,000 Motor Vehicle Fees 950,000 Motor Vehicle Sales Tax 60% 505,680,000 Interest Earned on Highway User Tax Distribution Fund 3,097,000 Sales Tax on Auto Parts 145,644,000 MV Rental Tax 9.2% 29,086,000 MV Rental Tax 6.5% 20,550,000 MVLST 10,747,000
Total Highway Users Income 2,499,090,000$
Less Transfer to: DEPARTMENT OF PUBLIC SAFETY Motor Vehicle Division Collection Costs 8,676,000 General Fund Reimbursement - Trunk Highway Reimbursement - DEPARTMENT OF REVENUE - Petroleum Division 2,195,000 Petroleum Division - Highway Refund Interest 20,000 MINNESOTA MANAGEMENT & BUDGET - Contingent Account - Statewide Indirect Costs (Estimated) 135,000 DEPARTMENT OF NATURAL RESOURCES - Non-refunded Marine Gas Tax 11,287,000 Non-refunded Snowmobile Gas Tax 7,524,000 Non-refunded All Terrain Vehicle Gas Tax 2,032,000 Non-refunded Forest Road 1,041,000 Non-refunded Off-Road Motorcycle Gas Tax 346,000 Non-refunded Off-Road Vehicle Gas Tax 1,234,000 DEPARTMENT OF TRANSPORTAION - Workplace Telework Program -
Subtotal Appropriations and Transfers 34,490,000 (34,490,000)$ Reserve for Fund Balance - MnDOT Budget Practice (12,000,000)$
Total Funds Available for Distribution in Calendar Year 2020 2,452,600,000$
DISTRIBUTION OF HIGHWAY USERS FUND Base *Excess Sum Total
95% Distribution per Minnesota Constitution Art. XIV, Sect. 5$2,452,600,000 x 95% = $2,329,970,000 1,584,379,600$ 745,590,400$ 2,329,970,000$
Trunk Highway Fund 62% 1,444,581,400 1,444,581,400 County State Aid Highway Fund 29% 459,470,084 216,221,216 675,691,300 Municipal State Aid Street Fund 9% 209,697,300 209,697,300
2,113,748,784 216,221,216 2,329,970,000 5% Distribution - per M.S. 161.081$2,452,600,000 x 5% = $122,630,000 83,388,400$ 39,241,600$ 122,630,000$
Town Road Account 30.5% 37,402,150 37,402,150 Town Bridge Account 16.0% 19,620,800 19,620,800 Flexible Highway Account 53.5% 65,607,050 65,607,050
122,630,000 122,630,000
Total Highway User Funds Available for Distribution 2,236,378,784$ 216,221,216$ 2,452,600,000$ *With the exception of the County State Aid Highway Fund and County Turnback Fund the "Excess Sum" amount becomes part of the "Base" amount.
The Distribution is split 68% Base and 32% Excess Sum.
SCHEDULE "A"Minnesota Department of Transportation
Funds Available for Distribution in Calendar Year 2020From Highway User Tax Distribution Fund
2

INCOME: Regular Excess Sum Total
County State Aid Highway Fund (95% Distribution x 29%) 459,470,084$ 216,221,216$ 675,691,300$ Motor Fuel Taxes - actual vs estimate 1,038,621 488,763 1,527,384 Motor Vehicle Taxes - actual vs estimate (1,130,720) (532,103) (1,662,823) Motor Vehicle Sales Taxes - actual vs estimate 1,307,416 615,255 1,922,671 Interest on Investments (CY estimate) 8,305,520 3,908,480 12,214,000 Investment Interest - actual vs estimate (96,303) (45,319) (141,622) Fund Balance Reserve - actual vs estimate 2,248,080 1,057,920 3,306,000 General Fund Transfers - actual vs estimate 138,468 65,162 203,630 Unexpended Balance of Admin Account 2,949,496 1,387,998 4,337,494 Unexpended Balance of Research Account - - - Release of Unencumbered State Park Road Account - - - Federal Reimburse for State Planning and Research Program 192,333 90,510 282,843
Total Funds Available 474,422,995$ 223,257,882$ 697,680,877$
LESS: DEDUCTIONS
Administrative Account (2% of total funds available) 9,488,460 4,465,158 13,953,618
Disaster Fund Legal Limit 9,174,161 4,317,252 13,491,413 Year End Account Balance 8,506,945 4,003,268 12,510,213
1% Distribution or Amount to Reach Legal Limit 667,216 313,984 981,200
Research Account (1/2 of 1% of the prior year Distribution Sum) $615,574,528 x .50% 2,092,954 984,919 3,077,873
State Park Road Fund After deducting for the Administrative Account, Disaster Fund, and Research Account, a sum of 3/4 of 1% of the remainder shall be set aside for use as prescribed by law. 3,466,307 1,631,204 5,097,511
Total Deductions 15,714,937 7,395,265 23,110,202
458,708,058$ 215,862,617$ 674,570,675$
Base Excess Sum TotalEqualization 10% = 45,870,806$ 45,870,806$ Registration 10% = 45,870,806 Registration 40% 86,345,047$ 132,215,853
Lane Mileage 30% = 137,612,417 137,612,417 Money Needs 50% = 229,354,029 Money Needs 60% 129,517,570 358,871,599
458,708,058$ 215,862,617$ 674,570,675$
RegularFY 2019 Actual in excess of forecast 293,968 FY 2020 Forecast Population (100%) 37,126,000 Total 37,419,968$ Total Distribution to Counties 711,990,643$
SCHEDULE "B"Minnesota Department of Transportation
Funds Available for Distribution in Calendar Year 2020
Counties
Funds Available for Distribution tothe Counties in 2020
Motor Vehicle Lease Sales Tax Revenue (M.S. 297A.815, Subd.3)
3

INCOME:
Highway Users Fund ( 95% Distribution x 9%) 209,697,300$ Motor Fuel Taxes - actual vs estimate 474,016 Motor Vehicle Taxes - actual vs estimate (516,048) Motor Vehicle Sales Taxes - actual vs estimate 596,691 Interest on Investments (CY estimate) 3,080,000 Investment Interest - actual vs estimate 31,187 Fund Balance Reserve - actual vs estimate 1,026,000 General Fund Transfers - actual vs estimate 63,195 Unexpended balance of Administrative Account 1,364,462 Unexpended balance of Research Account - Federal Reimbursements for State Planning and Research Program 245,913
Total Funds Available 216,062,716$
LESS: DEDUCTIONS
Administrative Account (2% of total funds available) 4,321,254
Disaster Fund
Legal Limit 6,307,372 Year End Account Balance 5,773,975
2% Distribution or Amount to Reach Legal Limit 533,397
NOTE: After deducting for the admistrative account, 2% of the remaining funds available, provided that the total amount in the account shall not exceed 3% of the total apportionment sum.
Research Account (1/2 of 1% of the prior year Apportionment Sum) $192,465,830 x .50%
(As determined by previous years Screening Board) 962,329
Total Deductions 5,816,980
Total Distribution to the Cities 210,245,736$
Population 50% = 105,122,868$ Money Needs 50% = 105,122,868
Total 210,245,736$
SCHEDULE "C"Minnesota Department of Transportation
Funds Available for Distribution in Calendar Year 2020
Municipalities
4

Income to Town Road Account (5% Distribution x 30.5%) 37,402,150$ Income - Actual vs Estimate 294,935 Town Road - General Funds -
37,697,085$
Income to Town Bridge Account (5% Distribution x 16%) 19,620,800$ Income - actual vs estimate 154,720
Subtotal 19,775,520$
Less Unallocated Account (30% of Subtotal - per State Aid) 5,932,656
13,842,864$
Income TotalFlexible Account 65,607,050$ (5% Distribution x 53.5%)Income-acutal vs estimate 517,345
Turnback Available for Distribution 66,124,395$
Greater MN Metro District TotalMunicipal Turnback - - - Trunk highway Turnback - - - County Turnback (Remaining Balance) 33,062,198$ 22,482,294$ 55,544,492$
33,062,198$ 22,482,294$ 55,544,492$
Population Excess TurnbackCounty Population Percentage DistributionAnoka 357,851 15.087453% 1,596,238$ Carver 105,970 4.467830% 472,692 Dakota 428,558 18.068550% 1,911,635
Hennepin * 832,621 35.104360% 3,714,007 Ramsey * 239,222 10.085904% 1,067,079 Scott 146,111 6.160225% 651,746 Washington 261,512 11.025678% 1,166,506
2,371,845 100.000000% 10,579,903$
* Reduced by cities of the First Class (Minneapolis & St.Paul)From Minnesota State Demographer - 2018 Populations published July 2019
INCOMESales Tax on Leases - FY 2020 forecast $37,126,000
Sales Tax on Leases - FY 2019 actual vs estimate 293,968
Total County Vehicle Lease Sales Tax Avail for Distribution $37,419,968
County Population Population % Add to Reg Const Dist.Anoka 357,851 27.52696% 10,300,579$ Carver 105,970 8.15153% 3,050,298 Dakota 428,558 32.96595% 12,335,848 Scott 146,111 11.23929% 4,205,739 Washington 261,512 20.11628% 7,527,504
1,300,002 100.00000% 37,419,968$
SCHEDULE "D"Minnesota Department of Transportation
Funds Available for Distribution in Calendar Year 2020
Town Bridge Account & Town Road Account
Motor Vehicle Lease Sales Tax Revenue
Total Town Road Funds Available for Distribution in 2020
Total Town Bridge Funds Available for Distribution in 2020
Flexible Apportionments
5

Equalization Apportionment
Pursuant to Minnesota Statutes, Chapter 162.07, Subdivision 1b(b) which reads as follows:
2020 2020Equalization Equalization
County Apportionment County ApportionmentCarlton $527,251 Becker $527,251Cook 527,251 Big Stone 527,251Itasca 527,251 Clay 527,251Koochiching 527,251 Douglas 527,251Lake 527,251 Grant 527,251Pine 527,251 Mahnomen 527,251St. Louis 527,251 Otter Tail 527,251 District 1 Totals $3,690,757 Pope 527,251
Stevens 527,251Beltrami $527,251 Swift 527,251Clearwater 527,251 Traverse 527,251Hubbard 527,251 Wilkin 527,251Kittson 527,251 District 4 Totals $6,327,012Lake of the Woods 527,251Marshall 527,251 Anoka $527,251Norman 527,251 Carver 527,251Pennington 527,251 Hennepin 527,251Polk 527,251 Scott 527,251Red Lake 527,251 District 5 Totals $2,109,004Roseau 527,251 District 2 Totals $5,799,761 Dodge $527,251
Fillmore 527,251Aitkin $527,251 Freeborn 527,251Benton 527,251 Goodhue 527,251Cass 527,251 Houston 527,251Crow Wing 527,251 Mower 527,251Isanti 527,251 Olmsted 527,251Kanabec 527,251 Rice 527,251Mille Lacs 527,251 Steele 527,251Morrison 527,251 Wabasha 527,250Sherburne 527,251 Winona 527,250Stearns 527,251 District 6 Totals $5,799,759Todd 527,251Wadena 527,251Wright 527,251 District 3 Totals $6,854,263
January 2020
"An amount equal to ten percent of the apportionment sum shall be apportioned equally among 87 counties."
6

Equalization Apportionment
2020 2020Equalization Equalization
County Apportionment County ApportionmentBlue Earth $527,250 Chisago $527,250Brown 527,250 Dakota 527,250Cottonwood 527,250 Ramsey 527,250Faribault 527,250 Washington 527,250Jackson 527,250 District 9 Totals $2,109,000Le Sueur 527,250Martin 527,250Nicollet 527,250Nobles 527,250Rock 527,250Sibley 527,250Waseca 527,250Watonwan 527,250 District 7 Totals $6,854,250
Chippewa $527,250Kandiyohi 527,250Lac Qui Parle 527,250Lincoln 527,250Lyon 527,250Mc Leod 527,250Meeker 527,250Murray 527,250Pipestone 527,250Redwood 527,250Renville 527,250Yellow Medicine 527,250 District 8 Totals $6,327,000 STATE TOTALS $45,870,806
January 2020
7

Motor Vehicle Registration Apportionment
20202016* Motor Motor Vehicle Motor Vehicle
Vehicle Registration Registration County Registration Factor ApportionmentCarlton 56,244 0.7831 $359,214Cook 10,103 0.1407 64,540Itasca 82,702 1.1514 528,156Koochiching 25,358 0.3530 161,924Lake 19,004 0.2646 121,374Pine 49,089 0.6834 313,481St. Louis 284,169 3.9564 1,814,833District 1 Totals 526,669 7.3326 $3,363,522
Beltrami 63,084 0.8783 $402,883Clearwater 17,778 0.2475 113,530Hubbard 37,805 0.5263 241,418Kittson 9,460 0.1317 60,412Lake of the Woods 8,706 0.1212 55,595Marshall 19,510 0.2716 124,585Norman 12,965 0.1805 82,797Pennington 23,302 0.3244 148,805Polk 51,782 0.7209 330,683Red Lake 8,512 0.1185 54,357Roseau 31,139 0.4335 198,850District 2 Totals 284,043 3.9544 $1,813,915
Aitkin 33,362 0.4645 $213,070Benton 54,921 0.7646 350,728Cass 52,302 0.7282 334,031Crow Wing 115,153 1.6032 735,401Isanti 60,724 0.8454 387,792Kanabec 26,739 0.3723 170,777Mille Lacs 48,764 0.6789 311,417Morrison 62,951 0.8764 402,012Sherburne 139,902 1.9478 893,472Stearns 232,004 3.2301 1,481,673Todd 41,859 0.5828 267,335Wadena 27,335 0.3806 174,584Wright 193,964 2.7005 1,238,741District 3 Totals 1,089,980 15.1753 $6,961,033
Becker 59,762 0.8320 $381,645Big Stone 11,129 0.1549 71,054Clay 75,750 1.0546 483,754Douglas 68,849 0.9586 439,718Grant 13,130 0.1828 83,852Mahnomen 6,967 0.0970 44,495Otter Tail 106,507 1.4829 680,218Pope 21,766 0.3030 138,989Stevens 16,978 0.2364 108,439Swift 19,489 0.2713 124,447Traverse 7,510 0.1046 47,981Wilkin 13,445 0.1872 85,870District 4 Totals 421,282 5.8653 $2,690,462
*Due to issues with MNLARS, Screening Board has agreed to use the 2016 number again for 2020 distribution.
January 2020
Pursuant to Minnesota Statutes, Chapter 162.07, Subdivision 1b(c) which reads as follows:
"An amount equal to ten percent of the apportionment sum shall be apportioned among the several counties so that each county shall receive of such amount the percentage that its motor vehicle registration for the calendar year preceding the one last past, determined by residence of registrants, bears to the total statewide motor vehicle registration."
8

Motor Vehicle Registration ApportionmentJanuary 2020
20202016* Motor Motor Vehicle Motor Vehicle
Vehicle Registration Registration County Registration Factor ApportionmentAnoka 427,147 5.9470 $2,727,937Carver 114,455 1.5935 730,951Hennepin 1,212,554 16.8819 7,743,864Scott 167,251 2.3286 1,068,148Metro Totals 1,921,407 26.7510 $12,270,900
Dodge 33,068 0.4604 $211,189Fillmore 37,844 0.5269 241,693Freeborn 48,922 0.6811 312,426Goodhue 77,325 1.0766 493,845Houston 31,362 0.4366 200,272Mower 55,394 0.7712 353,756Olmsted 173,430 2.4146 1,107,596Rice 87,172 1.2137 556,734Steele 52,899 0.7365 337,838Wabasha 40,011 0.5571 255,546Winona 61,903 0.8619 395,360District 6 Totals 699,330 9.7366 $4,466,255
Blue Earth 82,581 1.1497 $527,377Brown 49,858 0.6942 318,435Cottonwood 21,238 0.2957 135,640Faribault 26,931 0.3749 171,970Jackson 19,237 0.2678 122,842Le Sueur 53,022 0.7382 338,618Martin 35,674 0.4967 227,840Nicollet 42,023 0.5851 268,390Nobles 32,749 0.4560 209,171Rock 16,767 0.2334 107,062Sibley 26,507 0.3690 169,263Waseca 30,031 0.4181 191,786Watonwan 18,959 0.2640 121,099District 7 Totals 455,577 6.3428 $2,909,493
Chippewa 22,385 0.3117 $142,979Kandiyohi 70,362 0.9796 449,350Lac Qui Parle 14,783 0.2058 94,402Lincoln 12,460 0.1735 79,586Lyon 40,177 0.5594 256,601Mc Leod 61,455 0.8556 392,471Meeker 40,867 0.5690 261,005Murray 17,589 0.2449 112,338Pipestone 18,346 0.2554 117,154Redwood 29,624 0.4124 189,171Renville 31,162 0.4339 199,033Yellow Medicine 19,865 0.2766 126,879District 8 Totals 379,075 5.2778 $2,420,969
Chisago 95,807 1.3339 $611,871Dakota 476,440 6.6333 3,042,748Ramsey 523,862 7.2936 3,345,633Washington 309,090 4.3034 1,974,005Metro Totals 1,405,199 19.5642 $8,974,257
STATE TOTALS 7,182,562 100.0000 $45,870,806
9

Total ActualTotal CSAH Lane 2020CSAH Lane Mile Lane Mile
County Mileage Miles Factor ApportionmentCarlton 292.21 595.34 0.9432 $1,297,960Cook 178.39 356.78 0.5652 777,785Itasca 648.45 1,295.50 2.0524 2,824,357Koochiching 254.51 509.02 0.8064 1,109,707Lake 232.09 457.04 0.7241 996,452Pine 482.26 964.52 1.5280 2,102,718St. Louis 1,387.93 2,791.41 4.4223 6,085,634 District 1 Totals 3,475.84 6,969.61 11.0416 $15,194,613
Beltrami 465.08 930.62 1.4743 $2,028,820Clearwater 326.27 652.54 1.0338 1,422,637Hubbard 324.02 648.04 1.0266 1,412,729Kittson 373.46 746.92 1.1833 1,628,368Lake of 'Woods 194.82 389.64 0.6173 849,481Marshall 639.65 1,279.30 2.0267 2,788,991Norman 390.89 783.02 1.2405 1,707,082Pennington 260.02 519.56 0.8231 1,132,688Polk 805.84 1,611.68 2.5533 3,513,658Red Lake 186.16 372.32 0.5898 811,638Roseau 481.92 963.84 1.5269 2,101,204 District 2 Totals 4,448.13 8,897.48 14.0956 $19,397,296
Aitkin 383.04 766.68 1.2146 $1,671,440Benton 225.20 456.02 0.7224 994,112Cass 531.80 1,062.02 1.6825 2,315,329Crow Wing 376.23 756.43 1.1984 1,649,147Isanti 226.78 454.76 0.7204 991,360Kanabec 211.40 422.80 0.6698 921,728Mille Lacs 256.83 513.66 0.8138 1,119,890Morrison 450.25 906.30 1.4358 1,975,839Sherburne 242.22 491.32 0.7784 1,071,175Stearns 642.34 1,330.16 2.1073 2,899,906Todd 412.32 824.64 1.3064 1,797,769Wadena 235.41 470.82 0.7459 1,026,451Wright 406.44 830.76 1.3161 1,811,117 District 3 Totals 4,600.26 9,286.37 14.7118 $20,245,263
Becker 479.21 958.56 1.5186 $2,089,782Big Stone 210.80 421.60 0.6679 919,113Clay 403.66 807.44 1.2792 1,760,338Douglas 397.52 795.04 1.2595 1,733,228Grant 228.25 456.50 0.7232 995,213Mahnomen 194.37 388.74 0.6159 847,555Otter Tail 934.39 1,868.78 2.9606 4,074,153Pope 298.12 596.24 0.9446 1,299,887Stevens 244.31 488.62 0.7741 1,065,258Swift 329.11 659.96 1.0455 1,438,738Traverse 245.29 490.58 0.7772 1,069,524Wilkin 312.26 625.68 0.9912 1,364,014 District 4 Totals 4,277.29 8,557.74 13.5575 $18,656,803
"An amount equal to 30 percent of the apportionment sum shall be apportioned among the several counties so that each county shall receive of such amount the percentage that its total lane miles of approved county state-aid highways bears to the total lane miles of approved statewide county state-aid highways. In 1997 and subsequent years no county may receive, as a result of an apportionment under this clause based on lane miles rather than miles of approved county state aid highways, apportionment that is less than its apportionment in 1996."
Pursuant to Minnesota Statues, Chapter 162.07, Subdivision 1b(d) which reads as follows:
Lane Mile ApportionmentJanuary 2020
*****AS REVISED BY THE 1996 LEGISLATION*****
10

Lane Mile ApportionmentJanuary 2020
Total ActualTotal CSAH Lane 2020CSAH Lane Mile Lane Mile
County Mileage Miles Factor ApportionmentAnoka 312.27 844.60 1.3380 $1,841,254Carver 234.06 489.60 0.7756 1,067,322Hennepin 531.15 1,563.94 2.4776 3,409,485Scott 232.02 577.24 0.9145 1,258,466 Metro Totals 1,309.50 3,475.38 5.5057 $7,576,527
Dodge 256.65 513.80 0.8140 $1,120,165Fillmore 411.80 823.60 1.3048 1,795,567Freeborn 446.55 894.74 1.4175 1,950,656Goodhue 322.63 645.12 1.0220 1,406,399Houston 249.59 499.62 0.7915 1,089,202Mower 373.79 750.84 1.1895 1,636,900Olmsted 308.75 669.82 1.0612 1,460,343Rice 282.26 566.80 0.8979 1,235,622Steele 300.54 606.96 0.9616 1,323,281Wabasha 273.86 547.72 0.8677 1,194,063Winona 315.49 631.04 0.9997 1,375,711 District 6 Totals 3,541.91 7,150.06 11.3274 $15,587,909
Blue Earth 438.76 897.98 1.4226 $1,957,674Brown 328.21 657.42 1.0415 1,433,233Cottonwood 317.57 635.14 1.0062 1,384,656Faribault 349.25 699.14 1.1076 1,524,195Jackson 370.82 741.64 1.1749 1,616,808Le Sueur 281.38 562.38 0.8909 1,225,989Martin 380.04 761.32 1.2061 1,659,743Nicollet 245.71 491.82 0.7792 1,072,276Nobles 360.48 723.48 1.1462 1,577,314Rock 262.77 525.20 0.8320 1,144,935Sibley 288.77 579.84 0.9186 1,264,108Waseca 267.68 535.36 0.8481 1,167,091Watonwan 234.30 468.60 0.7424 1,021,635 District 7 Totals 4,125.74 8,279.32 13.1163 $18,049,657
Chippewa 244.14 488.28 0.7736 $1,064,570Kandiyohi 434.46 879.03 1.3926 1,916,391Lac Qui Parle 364.23 728.46 1.1541 1,588,185Lincoln 254.15 508.30 0.8053 1,108,193Lyon 318.93 637.86 1.0105 1,390,573Mc Leod 253.40 506.74 0.8028 1,104,752Meeker 273.54 547.08 0.8667 1,192,687Murray 352.37 704.74 1.1165 1,536,443Pipestone 240.72 481.44 0.7627 1,049,570Redwood 390.73 781.94 1.2388 1,704,743Renville 445.87 891.74 1.4127 1,944,051Yellow Medicine 345.79 691.58 1.0956 1,507,682 District 8 Totals 3,918.33 7,847.19 12.4319 $17,107,840
Chisago 236.99 472.80 0.7490 $1,030,717Dakota 341.25 921.26 1.4595 2,008,453Ramsey 262.37 753.77 1.1941 1,643,230Washington 222.06 510.96 0.8096 1,114,109 Metro Totals 1,062.67 2,658.79 4.2122 $5,796,509
STATE TOTALS 30,759.67 63,121.94 100.0000 $137,612,417
11

2019 Restricted State Aid Annual CountyBasic 2019 Construction Adjusted State Aid
25 Year Screening 25-Year Fund 25 Year Annual Mill Money Construction Board Construction Balance Construction Consruction Levy Needs
County Needs Restriction Needs Deduction Needs Needs Deduction Excess SumCarlton $174,930,705 $0 $174,930,705 $0 $174,930,705 $6,997,228 ($453,317) $6,543,911Cook 87,243,818 1,793,095 89,036,913 0 89,036,913 3,561,477 (252,491) 3,308,986Itasca 311,763,459 0 311,763,459 0 311,763,459 12,470,538 (870,689) 11,599,849Koochiching 144,863,426 (10,924,866) 133,938,560 0 133,938,560 5,357,542 (172,436) 5,185,106Lake 134,192,216 0 134,192,216 0 134,192,216 5,367,689 (277,738) 5,089,951Pine 259,689,805 0 259,689,805 0 259,689,805 10,387,592 (438,162) 9,949,430St. Louis 828,470,590 0 828,470,590 0 828,470,590 33,138,824 (1,649,554) 31,489,270 District 1 Totals $1,941,154,019 $1,932,022,248 $0 $1,932,022,248 $77,280,890 ($4,114,387) $73,166,503
Beltrami $256,139,043 $0 $256,139,043 $0 $256,139,043 $10,245,562 ($540,166) $9,705,396Clearwater 123,309,782 0 123,309,782 0 123,309,782 4,932,391 (175,973) 4,756,418Hubbard 142,057,010 0 142,057,010 0 142,057,010 5,682,280 (546,401) 5,135,879Kittson 104,561,769 0 104,561,769 0 104,561,769 4,182,471 (221,426) 3,961,045Lake of the Woods 60,300,371 1,148,673 61,449,044 0 61,449,044 2,457,962 (94,427) 2,363,535Marshall 166,596,137 0 166,596,137 0 166,596,137 6,663,845 (382,732) 6,281,113Norman 128,750,649 0 128,750,649 0 128,750,649 5,150,026 (279,315) 4,870,711Pennington 86,904,672 0 86,904,672 0 86,904,672 3,476,187 (237,781) 3,238,406Polk 259,995,468 0 259,995,468 0 259,995,468 10,399,819 (869,275) 9,530,544Red Lake 56,696,201 0 56,696,201 0 56,696,201 2,267,848 (109,636) 2,158,212Roseau 159,006,000 0 159,006,000 0 159,006,000 6,360,240 (223,484) 6,136,756 District 2 Totals $1,544,317,102 $1,545,465,775 $0 $1,545,465,775 $61,818,631 ($3,680,616) $58,138,015
Aitkin $162,450,582 $0 $162,450,582 $0 $162,450,582 $6,498,023 ($458,674) $6,039,349Benton 116,018,779 0 116,018,779 0 116,018,779 4,640,751 (483,636) 4,157,115Cass 189,773,817 0 189,773,817 0 189,773,817 7,590,953 (1,069,782) 6,521,171Crow Wing 192,264,432 0 192,264,432 0 192,264,432 7,690,577 (1,662,830) 6,027,747Isanti 120,738,866 0 120,738,866 0 120,738,866 4,829,555 (528,699) 4,300,856Kanabec 107,842,352 0 107,842,352 0 107,842,352 4,313,694 (206,673) 4,107,021Mille Lacs 124,715,031 0 124,715,031 0 124,715,031 4,988,601 (340,962) 4,647,639Morrison 170,405,043 0 170,405,043 0 170,405,043 6,816,202 (566,615) 6,249,587Sherburne 157,622,305 0 157,622,305 0 157,622,305 6,304,892 (1,394,276) 4,910,616Stearns 404,267,640 0 404,267,640 0 404,267,640 16,170,706 (2,287,962) 13,882,744Todd 151,145,404 (3,131,368) 148,014,036 0 148,014,036 5,920,561 (391,502) 5,529,059Wadena 108,193,009 0 108,193,009 0 108,193,009 4,327,720 (174,919) 4,152,801Wright 384,815,567 0 384,815,567 0 384,815,567 15,392,623 (2,387,540) 13,005,083 District 3 Totals $2,390,252,827 $2,387,121,459 $0 $2,387,121,459 $95,484,858 ($11,954,070) $83,530,788
Becker $207,387,028 $0 $207,387,028 $0 $207,387,028 $8,295,481 ($903,512) $7,391,969Big Stone 97,221,848 (1,149,450) 96,072,398 (211,003) 95,861,395 3,834,456 (231,745) 3,602,711Clay 196,837,867 0 196,837,867 0 196,837,867 7,873,515 (1,037,590) 6,835,925Douglas 248,125,191 0 248,125,191 0 248,125,191 9,925,008 (900,451) 9,024,557Grant 102,130,686 (4,690,338) 97,440,348 0 97,440,348 3,897,614 (295,163) 3,602,451Mahnomen 56,011,956 0 56,011,956 0 56,011,956 2,240,478 (110,737) 2,129,741Otter Tail 474,561,895 0 474,561,895 0 474,561,895 18,982,476 (1,576,761) 17,405,715Pope 131,560,421 0 131,560,421 0 131,560,421 5,262,417 (371,139) 4,891,278Stevens 107,732,101 (4,431,438) 103,300,663 0 103,300,663 4,132,027 (368,030) 3,763,997Swift 136,359,885 0 136,359,885 0 136,359,885 5,454,395 (446,871) 5,007,524Traverse 101,037,429 (3,623,641) 97,413,788 0 97,413,788 3,896,552 (308,190) 3,588,362Wilkin 124,514,786 0 124,514,786 0 124,514,786 4,980,591 (338,496) 4,642,095 District 4 Totals $1,983,481,093 $1,969,586,226 ($211,003) $1,969,375,223 $78,775,010 ($6,888,685) $71,886,325
Anoka $533,328,504 $0 $533,328,504 $0 $533,328,504 $21,333,140 ($3,160,830) $18,172,310Carver 329,782,969 0 329,782,969 0 329,782,969 13,191,319 (2,223,240) 10,968,079Hennepin 1,345,064,083 0 1,345,064,083 0 1,345,064,083 53,802,563 (16,748,099) 37,054,464Scott 276,215,253 0 276,215,253 0 276,215,253 11,048,610 (2,845,997) 8,202,613 Metro Totals $2,484,390,809 $2,484,390,809 $0 $2,484,390,809 $99,375,632 ($24,978,166) $74,397,466
Dodge $157,538,775 $0 $157,538,775 $0 $157,538,775 $6,301,551 ($486,334) $5,815,217Fillmore 243,368,073 (2,833,034) 240,535,039 0 240,535,039 9,621,402 (614,710) 9,006,692Freeborn 252,365,684 0 252,365,684 0 252,365,684 10,094,627 (646,749) 9,447,878Goodhue 224,450,461 0 224,450,461 0 224,450,461 8,978,018 (1,155,342) 7,822,676Houston 154,439,551 0 154,439,551 0 154,439,551 6,177,582 (351,243) 5,826,339Mower 232,617,656 0 232,617,656 0 232,617,656 9,304,706 (719,160) 8,585,546Olmsted 277,716,513 0 277,716,513 0 277,716,513 11,108,661 (2,764,682) 8,343,979Rice 202,096,738 0 202,096,738 0 202,096,738 8,083,870 (1,007,063) 7,076,807Steele 207,004,937 0 207,004,937 0 207,004,937 8,280,197 (633,380) 7,646,817Wabasha 167,736,277 0 167,736,277 0 167,736,277 6,709,451 (497,024) 6,212,427Winona 207,066,961 0 207,066,961 0 207,066,961 8,282,678 (755,057) 7,527,621 District 6 Totals $2,326,401,626 $2,323,568,592 $0 $2,323,568,592 $92,942,743 ($9,630,744) $83,311,999
Blue Earth $372,151,138 ($3,409,105) $368,742,033 $0 $368,742,033 $14,749,681 ($1,302,712) $13,446,969Brown 177,125,027 0 177,125,027 0 177,125,027 7,085,001 (600,014) 6,484,987Cottonwood 134,847,794 0 134,847,794 0 134,847,794 5,393,912 (512,082) 4,881,830Faribault 228,993,206 0 228,993,206 0 228,993,206 9,159,728 (548,019) 8,611,709Jackson 223,808,467 0 223,808,467 0 223,808,467 8,952,339 (550,495) 8,401,844Le Sueur 219,262,920 (1,147,496) 218,115,424 0 218,115,424 8,724,617 (645,253) 8,079,364Martin 221,662,377 0 * 221,662,377 0 221,662,377 8,866,495 (689,102) 8,177,393Nicollet 150,109,446 0 150,109,446 0 150,109,446 6,004,378 (678,540) 5,325,838Nobles 223,418,978 0 223,418,978 0 223,418,978 8,936,759 (695,550) 8,241,209Rock 149,326,331 0 149,326,331 0 149,326,331 5,973,053 (476,424) 5,496,629Sibley 171,465,736 (10,757,832) 160,707,904 0 160,707,904 6,428,316 (487,897) 5,940,419Waseca 166,093,034 (3,604,611) 162,488,423 0 162,488,423 6,499,537 (440,526) 6,059,011Watonwan 144,299,962 0 144,299,962 0 144,299,962 5,771,998 (328,510) 5,443,488 District 7 Totals $2,582,564,416 $2,563,645,372 $0 $2,563,645,372 $102,545,814 ($7,955,124) $94,590,690
Chippewa $101,065,733 $0 $101,065,733 $0 $101,065,733 $4,042,629 ($433,870) $3,608,759Kandiyohi 223,745,789 0 223,745,789 0 223,745,789 8,949,832 (896,847) 8,052,985Lac Qui Parle 146,180,927 (3,490,802) 142,690,125 0 142,690,125 5,707,605 (375,386) 5,332,219Lincoln 113,328,949 0 113,328,949 0 113,328,949 4,533,158 (277,434) 4,255,724Lyon 159,870,199 0 159,870,199 0 159,870,199 6,394,808 (648,418) 5,746,390Mc Leod 176,770,692 0 176,770,692 0 176,770,692 7,070,828 (620,734) 6,450,094Meeker 125,532,778 0 125,532,778 0 125,532,778 5,021,311 (518,868) 4,502,443Murray 151,428,381 0 151,428,381 0 151,428,381 6,057,135 (509,456) 5,547,679Pipestone 118,348,426 (1,809,403) 116,539,023 (92,511) 116,446,512 4,657,860 (328,973) 4,328,887Redwood 192,352,070 0 192,352,070 0 192,352,070 7,694,083 (658,102) 7,035,981Renville 234,434,167 0 234,434,167 0 234,434,167 9,377,367 (719,142) 8,658,225Yellow Medicine 157,296,749 0 157,296,749 0 157,296,749 6,291,870 (448,548) 5,843,322 District 8 Totals $1,900,354,860 $1,895,054,655 ($92,511) $1,894,962,144 $75,798,486 ($6,435,778) $69,362,708
Chisago $169,343,509 $0 $169,343,509 $0 $169,343,509 $6,773,740 ($854,683) $5,919,057Dakota 537,845,106 0 537,845,106 0 537,845,106 21,513,804 (4,635,676) 16,878,128Ramsey 609,784,928 0 609,784,928 0 609,784,928 24,391,397 (4,990,604) 19,400,793Washington 287,027,246 0 287,027,246 0 287,027,246 11,481,090 (3,103,627) 8,377,463 Metro Totals $1,604,000,789 $1,604,000,789 $0 $1,604,000,789 $64,160,031 ($13,584,590) $50,575,441
STATE TOTALS $18,756,917,541 ($52,061,616) $18,704,855,925 ($303,514) $18,704,552,411 $748,182,095 ($89,222,160) $658,959,935
For the purpose of this section, money needs of each county are defined as the estimated total annual costs of constructing, over a period of 25 years, the county state aid highway system in that county. Costs incidental to construction, or a specified portion therof as set forth in the commissioner's rules may be included in determining money needs. To avoid variances in costs due to differences in construction policy, construction costs shall be estimated on the basis of the engineering standards developed cooperativley by the commissioner and the county engineers of the seveeral counties.
January 2020 Money Needs
Pusuant to Minnesota Statutes, Chapter 162.07, Subdivision 2 Money Needs Defined:
12

Excess Maximum Minimum Annual CountySum Tentative Adjustment Factor County State Aid
Money Money to for Other Adjustment Money Money Money NeedsNeeds Needs Minimum 82 for Other Needs Needs ApportionmentFactor Apportionment Counties Counties 82 Counties Apportionment Factors Sum COUNTY0.993067 $2,277,639 1.011231 ($37,438) 2,240,201 0.9767 $6,436,062 Carlton0.502153 1,151,708 0.511338 (18,931) 1,132,777 0.4939 3,254,603 Cook1.760327 4,037,381 1.792525 (66,364) 3,971,017 1.7314 11,409,232 Itasca0.786862 1,804,700 $1,441,289 3,245,989 1.4153 9,326,260 Koochiching0.772422 1,771,581 0.786550 (29,120) 1,742,461 0.7597 5,006,119 Lake1.509869 3,462,945 1.537486 (56,921) 3,406,024 1.4851 9,786,214 Pine4.778632 10,959,985 4.866038 (180,152) 10,779,833 4.7001 30,971,776 St. Louis
11.103332 $25,465,939 $1,441,289 10.505168 ($388,926) $26,518,302 11.5622 $76,190,266 District 1 Totals
1.472836 $3,378,009 1.499776 ($55,525) 3,322,484 1.4486 $9,545,694 Beltrami0.721807 1,655,493 0.735009 (27,212) 1,628,281 0.7099 4,677,957 Clearwater0.779392 1,787,567 0.793648 (29,383) 1,758,184 0.7666 5,051,587 Hubbard0.601106 1,378,661 0.612101 (22,661) 1,356,000 0.5912 3,895,771 Kittson0.358677 822,640 1,182,706 2,005,346 0.8743 5,761,287 Lake of the Woods0.953186 2,186,170 0.970621 (35,935) 2,150,235 0.9375 6,177,749 Marshall0.739151 1,695,273 0.752671 (27,866) 1,667,407 0.7270 4,790,639 Norman0.491442 1,127,142 0.500431 (18,527) 1,108,615 0.4834 3,185,412 Pennington1.446301 3,317,150 1.472756 (54,525) 3,262,625 1.4225 9,373,705 Polk0.327518 751,176 547,194 1,298,370 0.5661 3,730,372 Red Lake0.931279 2,135,926 0.948313 (35,109) 2,100,817 0.9160 6,036,073 Roseau8.822695 $20,235,207 $1,729,900 8.285326 ($306,743) $21,658,364 9.4431 $62,226,246 District 2 Totals
0.916497 $2,102,023 0.933261 ($34,552) 2,067,471 0.9014 $5,939,865 Aitkin0.630860 1,446,903 0.642399 (23,783) 1,423,120 0.6205 4,088,846 Benton0.989616 2,269,724 1.007717 (37,308) 2,232,416 0.9733 6,413,657 Cass0.914736 2,097,984 0.931468 (34,485) 2,063,499 0.8997 5,928,663 Crow Wing0.652673 1,496,932 0.664611 (24,605) 1,472,327 0.6419 4,229,864 Isanti0.623258 1,429,467 0.634658 (23,497) 1,405,970 0.6130 4,039,424 Kanabec0.705299 1,617,632 0.718200 (26,589) 1,591,043 0.6937 4,571,205 Mille Lacs0.948402 2,175,198 0.965749 (35,754) 2,139,444 0.9328 6,146,778 Morrison0.745207 1,709,162 0.758838 (28,094) 1,681,068 0.7330 4,830,176 Sherburne2.106766 4,831,953 2.145301 (79,424) 4,752,529 2.0721 13,654,309 Stearns0.839058 1,924,413 0.854405 (31,632) 1,892,781 0.8253 5,438,396 Todd0.630205 1,445,401 0.641732 (23,758) 1,421,643 0.6198 4,084,234 Wadena1.973577 4,526,478 2.009676 (74,403) 4,452,075 1.9411 12,791,071 Wright
12.676154 $29,073,270 $0 12.908015 ($477,884) $28,595,386 12.4676 $82,156,488 District 3 Totals
1.121763 $2,572,809 1.142281 ($42,290) 2,530,519 1.1033 $7,270,305 Becker0.546727 1,253,940 0 0.556727 ($20,611) 1,233,329 0.5377 3,543,228 Big Stone1.037381 2,379,275 1.056356 (39,109) 2,340,166 1.0203 6,723,368 Clay1.369515 3,141,038 1.394565 (51,630) 3,089,408 1.3470 8,876,190 Douglas0.546687 1,253,849 0.556687 (20,610) 1,233,239 0.5377 3,543,228 Grant0.323197 741,265 531,050 1,272,315 0.5547 3,655,251 Mahnomen2.641392 6,058,139 2.689706 (99,579) 5,958,560 2.5980 17,119,779 Otter Tail0.742272 1,702,431 0.755849 (27,983) 1,674,448 0.7301 4,811,066 Pope0.571203 1,310,077 0.581651 (21,534) 1,288,543 0.5618 3,702,037 Stevens0.759913 1,742,891 0.773813 (28,648) 1,714,243 0.7474 4,925,067 Swift0.544549 1,248,945 0.554509 (20,529) 1,228,416 0.5356 3,529,389 Traverse0.704458 1,615,703 0.717343 (26,558) 1,589,145 0.6929 4,565,933 Wilkin
10.909057 $25,020,362 $531,050 10.779487 ($399,081) $25,152,331 10.9665 $72,264,841 District 4 Totals
2.757726 $6,324,956 2.808168 ($103,965) 6,220,991 2.7124 $17,873,629 Anoka1.664453 3,817,490 1.694898 (62,749) 3,754,741 1.6371 10,787,833 Carver5.623174 12,896,976 5.726028 (211,991) 12,684,985 5.5307 36,445,097 Hennepin1.244782 2,854,958 1.267551 (46,928) 2,808,030 1.2243 8,067,646 Scott
11.290135 $25,894,380 $0 11.496645 ($425,633) $25,468,747 11.1045 $73,174,205 Metro Totals
0.882484 $2,024,013 0.898626 ($33,269) 1,990,744 0.8680 $5,719,772 Dodge1.366804 3,134,820 1.391804 (51,528) 3,083,292 1.3443 8,858,398 Fillmore1.433756 3,288,377 1.459981 (54,052) 3,234,325 1.4102 9,292,653 Freeborn1.187125 2,722,719 1.208839 (44,754) 2,677,965 1.1676 7,694,016 Goodhue0.884172 2,027,884 0.900344 (33,333) 1,994,551 0.8696 5,730,316 Houston1.302893 2,988,238 1.326725 (49,119) 2,939,119 1.2815 8,444,572 Mower1.266235 2,904,161 1.289396 (47,737) 2,856,424 1.2454 8,206,687 Olmsted1.073936 2,463,115 1.093579 (40,487) 2,422,628 1.0563 6,960,594 Rice1.160437 2,661,509 1.181663 (43,748) 2,617,761 1.1414 7,521,369 Steele0.942762 2,162,263 0.960006 (35,542) 2,126,721 0.9273 6,110,535 Wabasha1.142349 2,620,023 1.163244 (43,066) 2,576,957 1.1236 7,404,074 Winona
12.642953 $28,997,122 $0 12.874207 ($476,635) $28,520,487 12.4352 $81,942,986 District 6 Totals
2.040635 $4,680,279 2.077961 ($76,931) 4,603,348 2.0071 $13,225,985 Blue Earth0.984125 2,257,130 1.002126 (37,101) 2,220,029 0.9679 6,378,073 Brown0.740839 1,699,144 0.754390 (27,929) 1,671,215 0.7287 4,801,841 Cottonwood1.306864 2,997,345 1.330768 (49,268) 2,948,077 1.2854 8,470,271 Faribault1.275016 2,924,301 1.298338 (48,068) 2,876,233 1.2541 8,264,017 Jackson1.226078 2,812,059 1.248504 (46,223) 2,765,836 1.2059 7,946,398 Le Sueur
1.240955 2,846,180 1.263653 (46,783) 2,799,397 1.2206 8,043,265 Martin0.808219 1,853,683 0.823002 (30,470) 1,823,213 0.7949 5,238,073 Nicollet1.250639 2,868,391 1.273515 (47,149) 2,821,242 1.2301 8,105,866 Nobles0.834137 1,913,127 0.849394 (31,447) 1,881,680 0.8204 5,406,107 Rock0.901484 2,067,590 0.917973 (33,986) 2,033,604 0.8867 5,842,998 Sibley0.919481 2,108,867 0.936299 (34,664) 2,074,203 0.9044 5,959,634 Waseca0.826073 1,894,632 0.841183 (31,143) 1,863,489 0.8125 5,354,049 Watonwan
14.354545 $32,922,728 $0 14.617106 ($541,162) $32,381,566 14.1187 $93,036,577 District 7 Totals
0.547645 $1,256,046 0.557662 ($20,646) 1,235,400 0.5386 $3,549,158 Chippewa1.222075 2,802,878 1.244428 (46,072) 2,756,806 1.2020 7,920,698 Kandiyohi0.809187 1,855,903 0.823988 (30,506) 1,825,397 0.7959 5,244,662 Lac Qui Parle0.645824 1,481,223 0.657637 (24,347) 1,456,876 0.6352 4,185,714 Lincoln0.872039 2,000,057 0.887990 (32,876) 1,967,181 0.8577 5,651,899 Lyon0.978829 2,244,984 0.996733 (36,901) 2,208,083 0.9627 6,343,807 Mc Leod0.683265 1,567,096 0.695763 (25,759) 1,541,337 0.6720 4,428,211 Meeker0.841884 1,930,895 0.857283 (31,739) 1,899,156 0.8280 5,456,188 Murray0.656927 1,506,689 0.668943 (24,766) 1,481,923 0.6461 4,257,540 Pipestone1.067740 2,448,905 1.087270 (40,253) 2,408,652 1.0502 6,920,397 Redwood1.313923 3,013,535 1.337956 (49,534) 2,964,001 1.2923 8,515,739 Renville0.886749 2,033,795 0.902969 (33,430) 2,000,365 0.8722 5,747,449 Yellow Medicine
10.526087 $24,142,006 $0 10.718622 ($396,829) $23,745,177 10.3529 $68,221,462 District 8 Totals
0.898242 2,060,154 0.914672 ($33,863) 2,026,291 0.8836 $5,822,570 Chisago2.561328 5,874,508 2.608177 (96,561) 5,777,947 2.5193 16,601,178 Dakota2.944155 6,752,537 2.998006 (110,993) 6,641,544 2.8959 19,082,821 Ramsey1.271317 2,915,816 1.294569 (47,929) 2,867,887 1.2505 8,240,295 Washington7.675042 $17,603,015 $0 7.815424 ($289,346) $17,313,669 7.5493 $49,746,864 Metro Totals
100.000000 $229,354,029 $3,702,239 100.000000 ($3,702,239) $229,354,029 100.0000 $658,959,935 STATE TOTALS
13

Vehicle Money 60% Total
Registration 40% Needs Money Excess
County Factor Registration Factors Needs Sum
Carlton 0.7831 $676,168 0.9931 $1,286,196 $1,962,364Cook 0.1407 121,487 0.5022 650,376 771,863Itasca 1.1514 994,177 1.7603 2,279,933 3,274,110Koochiching 0.3530 304,798 0.7869 1,019,125 1,323,923Lake 0.2646 228,469 0.7724 1,000,422 1,228,891Pine 0.6834 590,082 1.5099 1,955,546 2,545,628St. Louis 3.9564 3,416,155 4.7786 6,189,168 9,605,323 District 1 Totals 7.3326 $6,331,336 11.1033 $14,380,766 $20,712,102
Beltrami 0.8783 $758,369 1.4728 $1,907,581 $2,665,950Clearwater 0.2475 213,704 0.7218 934,867 1,148,571Hubbard 0.5263 454,434 0.7794 1,009,450 1,463,884Kittson 0.1317 113,716 0.6011 778,538 892,254Lake of Woods 0.1212 104,650 0.3587 464,550 569,200Marshall 0.2716 234,513 0.9532 1,234,543 1,469,056Norman 0.1805 155,853 0.7392 957,330 1,113,183Pennington 0.3244 280,103 0.4914 636,504 916,607Polk 0.7209 622,461 1.4463 1,873,214 2,495,675Red Lake 0.1185 102,319 0.3275 424,193 526,512Roseau 0.4335 374,306 0.9313 1,206,170 1,580,476 District 2 Totals 3.9544 $3,414,428 8.8227 $11,426,940 $14,841,368
Aitkin 0.4645 $401,073 0.9165 $1,187,025 $1,588,098Benton 0.7646 660,194 0.6309 817,075 1,477,269Cass 0.7282 628,765 0.9896 1,281,727 1,910,492Crow Wing 1.6032 1,384,284 0.9147 1,184,744 2,569,028Isanti 0.8454 729,961 0.6527 845,326 1,575,287Kanabec 0.3723 321,463 0.6233 807,229 1,128,692Mille Lacs 0.6789 586,197 0.7053 913,486 1,499,683Morrison 0.8764 756,728 0.9484 1,228,347 1,985,075Sherburne 1.9478 1,681,829 0.7452 965,174 2,647,003Stearns 3.2301 2,789,031 2.1068 2,728,632 5,517,663Todd 0.5828 503,219 0.8391 1,086,728 1,589,947Wadena 0.3806 328,629 0.6302 816,226 1,144,855Wright 2.7005 2,331,748 1.9736 2,556,129 4,887,877 District 3 Totals 15.1753 $13,103,121 12.6762 $16,417,848 $29,520,969
Becker 0.8320 $718,391 1.1218 $1,452,880 $2,171,271Big Stone 0.1549 133,748 0.5467 708,108 841,856Clay 1.0546 910,595 1.0374 1,343,591 2,254,186Douglas 0.9586 827,704 1.3695 1,773,763 2,601,467Grant 0.1828 157,839 0.5467 708,056 865,895Mahnomen 0.0970 83,755 0.3232 418,597 502,352Otter Tail 1.4829 1,280,411 2.6414 3,421,067 4,701,478Pope 0.3030 261,625 0.7423 961,373 1,222,998Stevens 0.2364 204,120 0.5712 739,808 943,928Swift 0.2713 234,254 0.7599 984,221 1,218,475Traverse 0.1046 90,317 0.5445 705,287 795,604Wilkin 0.1872 161,638 0.7045 912,397 1,074,035 District 4 Totals 5.8653 $5,064,397 10.9091 $14,129,148 $19,193,545
Excess SumJanuary 2020
Pursuant to Minnesota Statutes, Chapter 162.07, Subdivision 1c which reads as follows:
Excess sum. (a) The commissioner shall apportion the excess sum, as calculated in subdivsion 1a, to the several counties as provided in paragraphs (b) and (c). (b) An amount equal to 40 percent must be apportioned among the several counties so that each county receives of that amount the percentage that its motor vehicle registration for the calendar year preceeding the one last past, determined by residence of regisstrants, bears to the total statewide motor vehicle reigstration. (c) An amount equal to 60 percent must be apportioned among the several counties so that each county receives of that amount the percentage that its money needs bears to the sum of the money needs of all the individual counties.
14

Excess SumJanuary 2020
Vehicle Money 60% Total
Registration 40% Needs Money Excess
County Factor Registration Factors Needs Sum
Anoka 5.9470 $5,134,940 2.7577 $3,571,740 $8,706,680Carver 1.5935 1,375,908 1.6645 2,155,759 3,531,667Hennepin 16.8819 14,576,684 5.6232 7,282,998 21,859,682Scott 2.3286 2,010,631 1.2448 1,612,211 3,622,842 District 5 Totals 26.7510 $23,098,163 11.2901 $14,622,708 $37,720,871
Dodge 0.4604 $397,533 0.8825 $1,142,972 $1,540,505Fillmore 0.5269 454,952 1.3668 1,770,251 2,225,203Freeborn 0.6811 588,096 1.4338 1,856,966 2,445,062Goodhue 1.0766 929,591 1.1871 1,537,535 2,467,126Houston 0.4366 376,982 0.8842 1,145,158 1,522,140Mower 0.7712 665,893 1.3029 1,687,475 2,353,368Olmsted 2.4146 2,084,888 1.2662 1,639,997 3,724,885Rice 1.2137 1,047,970 1.0739 1,390,936 2,438,906Steele 0.7365 635,931 1.1604 1,502,970 2,138,901Wabasha 0.5571 481,028 0.9428 1,221,042 1,702,070Winona 0.8619 744,208 1.1423 1,479,543 2,223,751 District 6 Totals 9.7366 $8,407,072 12.6430 $16,374,845 $24,781,917
Blue Earth 1.1497 $992,709 2.0406 $2,642,981 $3,635,690Brown 0.6942 599,407 0.9841 1,274,615 1,874,022Cottonwood 0.2957 255,322 0.7408 959,517 1,214,839Faribault 0.3749 323,708 1.3069 1,692,618 2,016,326Jackson 0.2678 231,232 1.2750 1,651,370 1,882,602Le Sueur 0.7382 637,399 1.2261 1,587,986 2,225,385Martin 0.4967 428,876 1.2410 1,607,255 2,036,131Nicollet 0.5851 505,205 0.8082 1,046,786 1,551,991Nobles 0.4560 393,733 1.2506 1,619,797 2,013,530Rock 0.2334 201,529 0.8341 1,080,354 1,281,883Sibley 0.3690 318,613 0.9015 1,167,580 1,486,193Waseca 0.4181 361,009 0.9195 1,190,889 1,551,898Watonwan 0.2640 227,951 0.8261 1,069,910 1,297,861 District 7 Totals 6.3428 $5,476,693 14.3545 $18,591,658 $24,068,351
Chippewa 0.3117 $269,138 0.5476 $709,296 $978,434Kandiyohi 0.9796 845,836 1.2221 1,582,802 2,428,638Lac Qui Parle 0.2058 177,698 0.8092 1,048,039 1,225,737Lincoln 0.1735 149,809 0.6458 836,456 986,265Lyon 0.5594 483,014 0.8720 1,129,444 1,612,458Mc Leod 0.8556 738,768 0.9788 1,267,756 2,006,524Meeker 0.5690 491,303 0.6833 884,948 1,376,251Murray 0.2449 211,459 0.8419 1,090,388 1,301,847Pipestone 0.2554 220,525 0.6569 850,836 1,071,361Redwood 0.4124 356,087 1.0677 1,382,911 1,738,998Renville 0.4339 374,651 1.3139 1,701,761 2,076,412Yellow Medicine 0.2766 238,830 0.8867 1,148,496 1,387,326 District 8 Totals 5.2778 $4,557,118 10.5261 $13,633,133 $18,190,251
Chisago 1.3339 $1,151,757 0.8982 $1,163,380 $2,315,137Dakota 6.6333 5,727,526 2.5613 3,317,369 9,044,895Ramsey 7.2936 6,297,662 2.9442 3,813,197 10,110,859Washington 4.3034 3,715,774 1.2713 1,646,578 5,362,352 District 9 Totals 19.5642 $16,892,719 7.6750 $9,940,524 $26,833,243
STATE TOTALS 100.0000 $86,345,047 100.0000 $129,517,570 $215,862,617
15

Final Regular Municipal2020 Regular Regular Distribution Municipal Municipal Distribution
County Distribution Maintenance Construction Account Maintenance Construction AccountCarlton $6,193,465 $2,197,937 $3,296,905 $5,494,842 $279,449 $419,174 $698,623Cook 3,710,139 1,346,780 2,020,171 3,366,951 137,275 205,913 343,188Itasca 11,109,848 3,916,888 5,875,332 9,792,220 527,051 790,577 1,317,628Koochiching 6,315,261 2,336,141 3,504,212 5,840,353 189,963 284,945 474,908Lake 4,823,340 1,665,982 2,498,972 4,164,954 263,354 395,032 658,386Pine 8,791,620 2,904,400 4,356,599 7,260,999 612,248 918,373 1,530,621St. Louis 32,341,386 10,953,381 16,430,071 27,383,452 1,983,174 2,974,760 4,957,934 District 1 Totals $73,285,059 $25,321,509 $37,982,262 $63,303,771 $3,992,514 $5,988,774 $9,981,288
Beltrami $8,661,605 $3,349,962 $5,024,944 $8,374,906 $114,680 $172,019 $286,699Clearwater 4,699,112 1,716,304 2,574,455 4,290,759 163,341 245,012 408,353Hubbard 5,250,642 $1,966,890 $2,950,336 4,917,226 133,366 200,050 333,416Kittson 4,345,691 1,560,798 2,341,198 3,901,996 177,478 266,217 443,695Lake of the Woods 3,982,550 $1,461,596 $2,192,394 3,653,990 131,424 197,136 328,560Marshall 6,872,110 2,513,818 3,770,727 6,284,545 235,026 352,539 587,565Norman 4,952,828 $1,829,971 $2,744,956 4,574,927 151,160 226,741 377,901Pennington 3,736,582 1,465,188 2,197,783 3,662,971 29,444 44,167 73,611Polk 9,846,036 $3,628,067 $5,442,101 9,070,168 310,347 465,521 775,868Red Lake 3,710,139 1,311,608 1,967,413 3,279,021 172,447 258,671 431,118Roseau 6,325,854 $2,295,779 $3,443,668 5,739,447 234,563 351,844 586,407 District 2 Totals $62,383,149 $23,099,981 $34,649,975 $57,749,956 $1,853,276 $2,779,917 $4,633,193
Aitkin $5,888,296 $2,229,073 $3,343,610 $5,572,683 $126,245 $189,368 $315,613Benton 4,689,690 1,723,180 2,584,769 4,307,949 152,696 229,045 381,741Cass 7,124,381 2,556,513 3,834,769 6,391,282 293,240 439,859 733,099Crow Wing 7,758,334 2,442,324 3,663,485 6,105,809 661,010 991,515 1,652,525Isanti 4,825,042 1,900,874 2,851,310 4,752,184 29,143 43,715 72,858Kanabec 4,032,603 1,504,645 2,256,967 3,761,612 108,396 162,595 270,991Mille Lacs 5,234,518 1,838,991 2,758,486 4,597,477 254,816 382,225 637,041Morrison 7,322,639 2,648,159 3,972,239 6,620,398 280,896 421,345 702,241Sherburne 6,669,994 2,490,842 3,736,264 6,227,106 177,155 265,733 442,888Stearns 14,764,677 5,070,190 7,605,285 12,675,475 835,681 1,253,521 2,089,202Todd 5,909,945 2,178,878 3,268,318 5,447,196 185,100 277,649 462,749Wadena 4,171,387 1,418,438 2,127,658 3,546,096 250,116 375,175 625,291Wright 12,532,003 4,569,670 6,854,504 11,424,174 443,132 664,697 1,107,829 District 3 Totals $90,923,509 $32,571,777 $48,857,664 $81,429,441 $3,797,626 $5,696,442 $9,494,068
Becker $7,480,699 $2,820,224 $4,230,335 $7,050,559 $172,056 $258,084 $430,140Big Stone 3,710,139 1,243,638 1,865,458 3,109,096 240,417 360,626 601,043Clay 7,161,893 2,647,609 3,971,413 6,619,022 217,148 325,723 542,871Douglas 8,125,176 2,922,138 4,383,208 7,305,346 327,932 491,898 819,830Grant 3,710,139 1,330,456 1,995,684 3,326,140 153,600 230,399 383,999Mahnomen 3,710,139 1,375,274 2,062,912 3,438,186 108,781 163,172 271,953Otter Tail 15,429,379 5,731,706 8,597,558 14,329,264 440,046 660,069 1,100,115Pope 4,718,690 1,733,836 2,600,753 4,334,589 153,640 230,461 384,101Stevens 3,821,470 1,420,822 2,131,234 3,552,056 107,766 161,648 269,414Swift 4,874,718 1,785,902 2,678,852 4,464,754 163,986 245,978 409,964Traverse 3,710,139 1,351,084 2,026,627 3,377,711 132,971 199,457 332,428Wilkin 4,502,746 1,583,526 2,375,288 3,958,814 217,573 326,359 543,932 District 4 Totals $70,955,327 $25,946,215 $38,919,322 $64,865,537 $2,435,916 $3,653,874 $6,089,790
This tabulation was completed pursuant to the regulations and procedures set forth in the Rules of the Minnesota Department of Transportation and the Resolutions of the County Engineers Screening Board. Upon determination that $674,570,675 is available to the County State Aid Fund, the following apportionments have been made in accordance with the formula prescribed by law:
Construction and Maintenance DistributionJanuary 2020
16

Construction and Maintenance DistributionJanuary 2020
Final Regular Municipal2020 Regular Regular Distribution Municipal Municipal Distribution
County Distribution Maintenance Construction Account Maintenance Construction AccountAnoka $21,892,364 $7,999,470 $11,999,205 $19,998,675 $757,476 $1,136,213 $1,893,689Carver 9,290,204 3,228,160 4,842,240 8,070,400 487,922 731,882 1,219,804Hennepin 48,823,122 18,250,083 27,375,125 45,625,208 1,279,166 1,918,748 3,197,914Scott 11,069,372 4,316,170 6,474,254 10,790,424 111,579 167,369 278,948 District 5 Totals $91,075,062 $33,793,883 $50,690,824 $84,484,707 $2,636,143 $3,954,212 $6,590,355
Dodge $5,251,893 $1,918,412 $2,877,617 $4,796,029 $182,346 $273,518 $455,864Fillmore 7,608,805 2,627,472 3,941,209 6,568,681 416,050 624,074 1,040,124Freeborn 8,192,083 3,038,935 4,558,403 7,597,338 237,898 356,847 594,745Goodhue 7,341,404 2,652,302 3,978,454 6,630,756 284,259 426,389 710,648Houston 5,174,635 1,926,827 2,890,241 4,817,068 143,027 214,540 357,567Mower 7,557,835 2,758,308 4,137,461 6,895,769 264,826 397,240 662,066Olmsted 9,426,174 3,676,208 5,514,312 9,190,520 94,262 141,392 235,654Rice 6,971,227 2,586,604 3,879,906 6,466,510 201,887 302,830 504,717Steele 6,772,886 2,529,266 3,793,900 6,323,166 179,888 269,832 449,720Wabasha 5,622,532 1,951,918 2,927,878 4,879,796 297,094 445,642 742,736Winona 6,926,238 2,507,575 3,761,363 6,268,938 262,920 394,380 657,300 District 6 Totals $76,845,712 $28,173,827 $42,260,744 $70,434,571 $2,564,457 $3,846,684 $6,411,141
Blue Earth $10,858,116 $3,964,515 $5,946,773 $9,911,288 $378,731 $568,097 $946,828Brown 6,181,078 2,262,027 3,393,041 5,655,068 210,404 315,606 526,010Cottonwood 4,788,805 1,610,571 2,415,856 4,026,427 304,951 457,427 762,378Faribault 6,936,008 2,268,075 3,402,112 5,670,187 506,328 759,493 1,265,821Jackson 6,780,023 2,434,571 3,651,856 6,086,427 277,438 416,158 693,596Le Sueur 6,846,048 2,144,456 3,216,684 5,361,140 593,963 890,945 1,484,908Martin 7,010,245 2,611,737 3,917,605 6,529,342 192,361 288,542 480,903Nicollet 5,119,963 1,952,140 2,928,209 4,880,349 95,846 143,768 239,614Nobles 6,906,892 2,526,541 3,789,812 6,316,353 236,216 354,323 590,539Rock 4,781,238 1,591,578 2,387,368 3,978,946 320,917 481,375 802,292Sibley 5,305,477 1,929,072 2,893,607 4,822,679 193,119 289,679 482,798Waseca 5,333,983 1,988,082 2,982,123 4,970,205 145,511 218,267 363,778Watonwan 4,671,478 1,451,335 2,177,002 3,628,337 417,256 625,885 1,043,141 District 7 Totals $81,519,354 $28,734,700 $43,102,048 $71,836,748 $3,873,041 $5,809,565 $9,682,606
Chippewa $3,840,883 $1,414,213 $2,121,320 $3,535,533 $122,140 $183,210 $305,350Kandiyohi 7,839,761 2,884,718 4,327,078 7,211,796 251,186 376,779 627,965Lac Qui Parle 5,103,115 1,891,214 2,836,822 4,728,036 150,032 225,047 375,079Lincoln 4,032,281 1,443,395 2,165,093 3,608,488 169,517 254,276 423,793Lyon 5,583,768 1,903,395 2,855,092 4,758,487 330,112 495,169 825,281Mc Leod 6,048,470 2,139,465 3,209,197 5,348,662 279,923 419,885 699,808Meeker 4,764,176 1,786,947 2,680,421 4,467,368 118,723 178,085 296,808Murray 5,213,032 1,958,849 2,938,273 4,897,122 126,364 189,546 315,910Pipestone 4,119,168 1,280,073 1,920,109 3,200,182 367,594 551,392 918,986Redwood 6,361,422 2,268,738 3,403,106 5,671,844 275,831 413,747 689,578Renville 7,456,423 2,791,088 4,186,633 6,977,721 191,481 287,221 478,702Yellow Medicine 5,377,035 1,917,236 2,875,853 4,793,089 233,578 350,368 583,946 District 8 Totals $65,739,534 $23,679,331 $35,518,997 $59,198,328 $2,616,481 $3,924,725 $6,541,206
Chisago $7,171,706 $2,088,114 $3,132,171 $5,220,285 $780,568 $1,170,853 $1,951,421Dakota 19,893,080 7,693,052 11,539,578 19,232,630 264,180 396,270 660,450Ramsey 21,976,016 8,557,461 12,836,191 21,393,652 232,946 349,418 582,364Washington 12,803,167 3,876,287 5,814,430 9,690,717 1,244,980 1,867,470 3,112,450 District 9 Totals $61,843,969 $22,214,914 $33,322,370 $55,537,284 $2,522,674 $3,784,011 $6,306,685
STATE TOTALS $674,570,675 $243,536,137 $365,304,206 $608,840,343 $26,292,128 $39,438,204 $65,730,332
NOTE: For the determination of the regular and municipal accounts, see the "Reference Material" portion of this report.
17

Eligible 2020 Eligible 2020Township Town Road Township Town Road
County Mileage Distribution County Mileage DistributionAitkin 724.671 $491,979 Lac Qui Parle 912.180 $619,278Anoka 56.750 38,528 Lake 136.168 92,444Becker 1,119.232 759,846 Lake of the Woods 337.290 * 228,986
Beltrami 789.450 535,957 Le Sueur 310.350 210,696Benton 307.000 208,422 Lincoln 557.940 378,785Big Stone 355.070 241,057 Lyon 703.230 477,422
Blue Earth 631.190 428,514 Mc Leod 470.920 319,707Brown 638.249 433,307 Mahnomen 264.952 179,876Carlton 395.170 268,281 Marshall 1,808.640 1,227,884
Carver 323.670 219,739 Martin 769.090 522,135Cass 886.510 601,851 Meeker 779.420 529,148Chippewa 686.540 466,091 Mille Lacs 439.040 298,064
Chisago 440.370 298,967 Morrison 895.760 608,131Clay 940.000 638,165 Mower 847.320 575,245Clearwater 395.870 268,756 Murray 802.750 544,986
Cook 5.060 3,435 Nicollet 349.230 237,092Cottonwood 696.721 473,003 Nobles 813.000 551,945Crow Wing 727.322 493,778 Norman 649.630 441,033
Dakota 370.991 251,865 Olmsted 603.140 409,471Dodge 447.645 303,906 Otter Tail 2,443.140 1,658,646Douglas 725.260 492,378 Pennington 372.450 252,856
Faribault 787.807 534,842 Pine 784.059 532,297Fillmore 846.180 574,471 Pipestone 572.890 388,935Freeborn 639.830 434,380 Polk 2,103.300 1,427,929
Goodhue 826.100 560,839 Pope 673.390 457,164Grant 428.310 290,779 Ramsey 43.280 29,383Hennepin 0 Red Lake 303.970 206,365
Houston 445.060 302,151 Redwood 950.801 645,498Hubbard 604.220 410,204 Renville 974.490 661,580Isanti 537.870 365,159 Rice 520.820 * 353,584
Itasca 595.050 403,979 Rock 552.640 375,187Jackson 714.326 484,955 Roseau 1,240.110 841,910Kanabec 298.050 202,346 St. Louis 839.160 569,705
Kandiyohi 720.446 489,110 Scott 402.763 273,435Kittson 925.600 628,389 Sherburne 487.380 330,882Koochiching 129.690 88,046 Sibley 571.784 388,184
Town Road DistributionJanuary 2020
In accordance with Minnesota Statute 162.081, Subd 1 and Admin Rule 8820.2300, a town road account is created in the county state aid highway fund. These funds may be used for the construction, reconstruction and maintenance of town roads. The following listing shows the eligible township mileage, as certified by the county engineers, and the current year town road allotments, which have been made in accordance with the formula as prescribed by law.
18

Eligible 2020 Eligible 2020Township Town Road Township Town Road
County Mileage Distribution County Mileage DistributionStearns 1,434.200 $973,677 Washington 174.740 $118,631Steele 391.665 265,901 Watonwan 395.490 268,498Stevens 534.155 362,637 Wilkin 695.630 472,263
Swift 735.990 * 499,663 Winona 446.654 * 303,233Todd 1,038.407 704,974 Wright 872.480 592,325Traverse 460.121 312,376 Yellow Medicine 796.581 540,797
Wabasha 367.590 249,557Wadena 366.210 248,620Waseca 369.112 250,590
STATE TOTAL 55,526.782 $37,697,085
* Certified in 2019
19

# Proposed# of Actual Town Deficient New
Deficient 2019 Bridge Bridges "Eligible" 2020Township Estimated Town Bridge Balance Times Estimated Town BridgeBridges County Needs Apportionment 12/31/19 $211,322 Needs Distribution
3 Aitkin $502,944 $48,515 $57,813 $633,966 $502,944 $88,8290 Anoka 0 0 3,063 0 0 01 Becker 232,960 28,800 78,068 211,322 232,960 41,145
1 Beltrami 172,224 21,292 21,292 211,322 172,224 30,4186 Benton 1,054,393 77,254 486,037 1,267,932 1,054,393 186,2241 Big Stone 168,064 20,777 40,577 211,322 168,064 29,683
0 Blue Earth 0 0 0 0 0 06 Brown 666,888 48,846 0 1,267,932 666,888 117,7843 Carlton 1,074,640 167,884 136,164 633,966 1,074,640 189,800
4 Carver 1,577,800 260,081 0 845,288 1,577,800 278,6671 Cass 149,760 18,515 74,420 211,322 149,760 26,450
12 Chippewa 2,212,451 460,529 0 2,535,864 2,212,451 390,757
3 Chisago 803,520 115,821 247,943 633,966 803,520 141,91611 Clay 2,830,648 274,216 167,894 2,324,542 2,830,648 499,9421 Clearwater 203,840 0 0 211,322 203,840 36,002
0 Cook 0 0 0 0 0 012 Cottonwood 1,907,576 179,632 0 2,535,864 1,907,576 336,9112 Crow Wing 564,424 71,157 161,270 422,644 564,424 99,687
2 Dakota 751,088 133,360 306,993 422,644 751,088 132,65511 Dodge 1,579,350 154,983 390,929 2,324,542 1,579,350 278,9410 Douglas 0 0 0 0 0 0
19 Faribault 4,126,533 579,404 318,962 4,015,118 4,126,533 728,81723 Fillmore 4,464,106 891,453 628,822 4,860,406 4,464,106 788,4393 Freeborn 539,136 0 2,410 633,966 539,136 95,221
16 Goodhue 3,588,344 673,940 161,622 3,381,152 3,588,344 633,7641 Grant 430,000 0 542,488 211,322 0 00 Hennepin 0 0 0 0 0 0
10 Houston 2,346,320 460,062 24,895 2,113,220 2,346,320 414,4011 Hubbard 112,000 18,462 65,422 211,322 112,000 19,7810 Isanti 0 0 42,987 0 0 0
4 Itasca 536,485 269,509 614,652 845,288 536,485 94,7538 Jackson 2,209,800 293,489 59,313 1,690,576 2,209,800 390,2890 Kanabec 0 30,446 175,567 0 0 0
5 Kandiyohi 1,252,355 144,348 411,764 1,056,610 1,252,355 221,1885 Kittson 685,944 128,738 298,542 1,056,610 685,944 121,1500 Koochiching 0 0 8,041 0 0 0
11 Lac Qui Parle 2,331,942 324,778 570,965 2,324,542 2,331,942 411,8610 Lake 0 0 0 0 0 03 Lake of the Woods 449,103 72,238 132,425 633,966 449,103 79,319
1 Le Sueur 424,570 64,986 126,913 211,322 424,570 74,98616 Lincoln 1,750,500 313,645 24,629 3,381,152 1,750,500 309,1695 Lyon 1,120,480 127,915 127,915 1,056,610 1,120,480 197,896
0 Mc Leod 0 0 0 0 0 03 Mahnomen 628,326 83,610 521,330 633,966 628,326 110,9735 Marshall 1,488,240 189,860 603,959 1,056,610 1,488,240 262,849
Town Bridge DistributionJanuary 2020
20

# Proposed# of Actual Town Deficient New
Deficient 2019 Bridge Bridges "Eligible" 2020Township Estimated Town Bridge Balance Times Estimated Town BridgeBridges County Needs Apportionment 12/31/19 $211,322 Needs Distribution
Town Bridge DistributionJanuary 2020
15 Martin $2,896,231 $0 $519,364 $3,169,830 $2,896,231 $511,5253 Meeker 1,075,213 0 704,301 633,966 0 00 Mille Lacs 0 0 17,531 0 0 0
3 Morrison 500,000 237,051 254,921 633,966 500,000 88,30918 Mower 3,758,870 633,644 74,507 3,803,796 3,758,870 663,8824 Murray 1,263,200 245,113 94,978 845,288 1,263,200 223,103
1 Nicollet 104,832 12,960 12,960 211,322 104,832 18,5154 Nobles 840,694 86,679 0 845,288 840,694 148,4812 Norman 372,528 0 616,398 422,644 0 0
0 Olmsted 0 0 0 0 0 02 Otter Tail 184,714 15,412 22,953 422,644 184,714 32,6240 Pennington 0 0 1,805 0 0 0
1 Pine 219,638 33,618 0 211,322 219,638 38,79220 Pipestone 3,290,000 311,906 27,734 4,226,440 3,290,000 581,0717 Polk 1,554,592 177,133 0 1,479,254 1,554,592 274,568
1 Pope 275,000 45,330 309,826 211,322 0 00 Ramsey 0 0 0 0 0 02 Red Lake 217,152 58,732 284,419 422,644 217,152 38,353
33 Redwood 5,417,941 822,451 373,720 6,973,626 5,417,941 956,90214 Renville 2,694,575 459,237 0 2,958,508 2,694,575 475,9091 Rice 145,152 0 0 211,322 145,152 25,636
3 Rock 446,600 91,518 0 633,966 446,600 78,8775 Roseau 712,000 156,972 432,829 1,056,610 712,000 125,7524 St. Louis 1,100,000 594,899 0 845,288 1,100,000 194,279
1 Scott 166,400 20,572 51,420 211,322 166,400 29,3890 Sherburne 0 22,253 97,129 0 0 01 Sibley 460,000 75,825 0 211,322 460,000 81,244
3 Stearns 604,771 37,955 0 633,966 604,771 106,8133 Steele 370,000 230,126 0 633,966 370,000 65,3481 Stevens 227,968 28,183 296,652 211,322 0 0
4 Swift 553,344 23,737 23,737 845,288 553,344 97,7300 Todd 0 0 0 0 0 02 Traverse 434,000 92,128 408,468 422,644 434,000 76,652
1 Wabasha 100,000 65,935 0 211,322 100,000 17,6623 Wadena 685,568 225,093 814,439 633,966 0 03 Waseca 827,154 87,049 429,922 633,966 827,154 146,090
0 Washington 0 0 215,534 0 0 03 Watonwan 794,016 185,442 0 633,966 794,016 140,2376 Wilkin 1,054,856 254,091 645,067 1,267,932 1,054,856 186,305
5 Winona 815,360 100,288 70,780 1,056,610 815,360 144,0061 Wright 770,000 126,926 323,578 211,322 0 07 Yellow Medicine 2,344,864 233,680 498,097 1,479,254 2,344,864 414,143
406 STATE TOTAL $82,213,987 $12,540,483 $15,259,155 $85,796,732 $78,377,710 $13,842,864
Actual 2020 Allotment = $19,775,520The 30% for the Unallocated Account = $5,932,656Average 2019 Township Bridge Cost = $211,322
21

2020 Town Bridge Distribution January 2020
The Town Bridge Distribution will be handled in the following manner this year:
1) 30% of the town bridge account is put into an unallocated account whichcan be used by any county who does not have enough of their own townbridge money to build a town bridge. (The % and individual bridgeeligibility will be determined at the discretion of the State Aid Engineerbased on previous year’s activities.)
2) Any county with a balance of $700,000 or more will receive NO townbridge allotment in the 2020 distribution. Also, any county whose balanceequals more than their number of deficient bridges times the statewideaverage township bridge cost from the previous year ($211,322 in 2019)will receive NO town bridge allotment in the 2020 distribution.
3) The remaining 70% of the Town Bridge account is distributed to theremaining counties (those not eliminated in #2 above) proportionatelybased on the estimated needs of their deficient township bridges.
For more information see Minnesota Statute 161.082.
22

October 24, 2019
Margaret Anderson Kelliher Minnesota Department of Transportation MS 100, Transportation Building St. Paul, Minnesota 55155
Dear Commissioner Anderson Kelliher:
We, the undersigned, as members of the 2019 County Screening Board, have reviewed all information available in relation to the mileage, lane miles and money needs of the County State Aid Highway System. Do hereby submit our findings on the attached sheets.
In making this recommendation, we have considered the needs impact resulting from actions taken by previous screening boards. After determining the annual needs, adjustments as required by law and Screening Board Resolutions were made to arrive at the money needs as listed. Due to construction fund balances as of December 31, 2019; and any action taken by this Screening Board, adjustments to the mileage, lane miles and money needs may be necessary before January 1, 2020.
This Board therefore recommends that the mileage, lane miles and money needs as listed be modified as required and used as the basis for apportioning to the counties the 2020 Distribution provided in Minnesota Statutes, Chapter 162.07, Subdivision 5.
Respectfully submitted,
County Screening Board
APPROVED
�wi � , Gi auv:L@ -' Karin Grandia, District 1
J Nordin, District 2
/------<JIL---Ryan Odden, District 3
�'/4---. Brian Pogodzfhskf District 6
('-1 cvJ.-s:- ,__\ ti,...L�carlaStueve, Urban
��T'ed Schoenecker, Urban
.��·
Enclosures: Mileage, Lane Miles and Annual Money Needs Listing
23

Annual County Annual CountyCounty State County State State Aid Highway State Aid Highway Aid Highway Aid Highway Money Needs for the Money Needs for the
County Mileage Lane Miles Apportionment Sum Excess SumCarlton 292.21 595.34 $6,436,062 $6,543,911Cook 178.39 356.78 3,254,603 3,308,986Itasca 648.45 1,295.50 11,409,232 11,599,849Koochiching 254.51 509.02 9,326,260 5,185,106Lake 232.09 457.04 5,006,119 5,089,951Pine 482.26 964.52 9,786,214 9,949,430St. Louis 1,387.93 2,791.41 30,971,776 31,489,270 District 1 Totals 3,475.84 6,969.61 $76,190,266 $73,166,503
Beltrami 465.08 930.62 $9,545,694 $9,705,396Clearwater 326.27 652.54 4,677,957 4,756,418Hubbard 324.02 648.04 5,051,587 5,135,879Kittson 373.46 746.92 3,895,771 3,961,045Lake of the Woods 194.82 389.64 5,761,287 2,363,535Marshall 639.65 1,279.30 6,177,749 6,281,113Norman 390.89 783.02 4,790,639 4,870,711Pennington 260.02 519.56 3,185,412 3,238,406Polk 805.84 1,611.68 9,373,705 9,530,544Red Lake 186.16 372.32 3,730,372 2,158,212Roseau 481.92 963.84 6,036,073 6,136,756 District 2 Totals 4,448.13 8,897.48 $62,226,246 $58,138,015
Aitkin 383.04 766.68 $5,939,865 $6,039,349Benton 225.20 456.02 4,088,846 4,157,115Cass 531.80 1,062.02 6,413,657 6,521,171Crow Wing 376.23 756.43 5,928,663 6,027,747Isanti 226.78 454.76 4,229,864 4,300,856Kanabec 211.40 422.80 4,039,424 4,107,021Mille Lacs 256.83 513.66 4,571,205 4,647,639Morrison 450.25 906.30 6,146,778 6,249,587Sherburne 242.22 491.32 4,830,176 4,910,616Stearns 642.34 1,330.16 13,654,309 13,882,744Todd 412.32 824.64 5,438,396 5,529,059Wadena 235.41 470.82 4,084,234 4,152,801Wright 406.44 830.76 12,791,071 13,005,083 District 3 Totals 4,600.26 9,286.37 $82,156,488 $83,530,788
Becker 479.21 958.56 $7,270,305 $7,391,969Big Stone 210.80 421.60 3,543,228 3,602,711Clay 403.66 807.44 6,723,368 6,835,925Douglas 397.52 795.04 8,876,190 9,024,557Grant 228.25 456.50 3,543,228 3,602,451Mahnomen 194.37 388.74 3,655,251 2,129,741Otter Tail 934.39 1,868.78 17,119,779 17,405,715Pope 298.12 596.24 4,811,066 4,891,278Stevens 244.31 488.62 3,702,037 3,763,997Swift 329.11 659.96 4,925,067 5,007,524Traverse 245.29 490.58 3,529,389 3,588,362Wilkin 312.26 625.68 4,565,933 4,642,095 District 4 Totals 4,277.29 8,557.74 $72,264,841 $71,886,325
Annual County State Aid Highway Money NeedsJanaury 2020
Tabulation of the county state aid highway mileage, lane miles and money needs as recommended by the County Engineers' Screening Board for use by the Commissioner of Transportation in distributing the 2020 CSAH fund.
24

Annual County State Aid Highway Money NeedsJanaury 2020
Annual County Annual CountyCounty State County State State Aid Highway State Aid Highway Aid Highway Aid Highway Money Needs for the Money Needs for the
County Mileage Lane Miles Apportionment Sum Excess SumAnoka 312.27 844.60 $17,873,629 $18,172,310Carver 234.06 489.60 10,787,833 10,968,079Hennepin 531.15 1,563.94 36,445,097 37,054,464Scott 232.02 577.24 8,067,646 8,202,613 Metro Totals 1,309.50 3,475.38 $73,174,205 $74,397,466
Dodge 256.65 513.80 $5,719,772 $5,815,217Fillmore 411.80 823.60 8,858,398 9,006,692Freeborn 446.55 894.74 9,292,653 9,447,878Goodhue 322.63 645.12 7,694,016 7,822,676Houston 249.59 499.62 5,730,316 5,826,339Mower 373.79 750.84 8,444,572 8,585,546Olmsted 308.75 669.82 8,206,687 8,343,979Rice 282.26 566.80 6,960,594 7,076,807Steele 300.54 606.96 7,521,369 7,646,817Wabasha 273.86 547.72 6,110,535 6,212,427Winona 315.49 631.04 7,404,074 7,527,621 District 6 Totals 3,541.91 7,150.06 $81,942,986 $83,311,999
Blue Earth 438.76 897.98 $13,225,985 $13,446,969Brown 328.21 657.42 6,378,073 6,484,987Cottonwood 317.57 635.14 4,801,841 4,881,830Faribault 349.25 699.14 8,470,271 8,611,709Jackson 370.82 741.64 8,264,017 8,401,844Le Sueur 281.38 562.38 7,946,398 8,079,364Martin 380.04 761.32 8,043,265 8,177,393Nicollet 245.71 491.82 5,238,073 5,325,838Nobles 360.48 723.48 8,105,866 8,241,209Rock 262.77 525.20 5,406,107 5,496,629Sibley 288.77 579.84 5,842,998 5,940,419Waseca 267.68 535.36 5,959,634 6,059,011Watonwan 234.30 468.60 5,354,049 5,443,488 District 7 Totals 4,125.74 8,279.32 $93,036,577 $94,590,690
Chippewa 244.14 488.28 $3,549,158 $3,608,759Kandiyohi 434.46 879.03 7,920,698 8,052,985Lac Qui Parle 364.23 728.46 5,244,662 5,332,219Lincoln 254.15 508.30 4,185,714 4,255,724Lyon 318.93 637.86 5,651,899 5,746,390Mc Leod 253.40 506.74 6,343,807 6,450,094Meeker 273.54 547.08 4,428,211 4,502,443Murray 352.37 704.74 5,456,188 5,547,679Pipestone 240.72 481.44 4,257,540 4,328,887Redwood 390.73 781.94 6,920,397 7,035,981Renville 445.87 891.74 8,515,739 8,658,225Yellow Medicine 345.79 691.58 5,747,449 5,843,322 District 8 Totals 3,918.33 7,847.19 $68,221,462 $69,362,708
Chisago 236.99 472.80 $5,822,570 $5,919,057Dakota 341.25 921.26 16,601,178 16,878,128Ramsey 262.37 753.77 19,082,821 19,400,793Washington 222.06 510.96 8,240,295 8,377,463 Metro Totals 1,062.67 2,658.79 $49,746,864 $50,575,441
STATE TOTALS 30,759.67 63,121.94 $658,959,935 $658,959,935
25

NOTES and COMMENTS
26

ADJUSTMENTS
27

County Total Miles Construction ROW Preservation Structures
RR X-ing Protection / Surfacing Signals
Interchange/Off Sys Bridge Total Needs
Carlton 292.21 $122,733,082 70.16% $5,206,451 2.98% $36,927,348 21.11% $8,054,132 4.60% $1,763,600 1.01% $246,092 0.14% $0 0.00% $174,930,705Cook 178.39 62,093,402 71.17% 1,226,169 1.41% 21,878,054 25.08% 1,975,881 2.26% - 0.00% 70,312 0.08% - 0.00% 87,243,818 Itasca 648.45 216,494,753 69.44% 4,840,668 1.55% 70,113,233 22.49% 14,851,319 4.76% 5,252,550 1.68% 210,936 0.07% - 0.00% 311,763,459 Koochiching 254.51 98,107,320 67.72% 2,423,474 1.67% 36,961,715 25.51% 4,917,143 3.39% 2,313,150 1.60% 140,624 0.10% - 0.00% 144,863,426 Lake 232.09 89,244,763 66.51% 2,413,082 1.80% 33,629,250 25.06% 6,483,527 4.83% 1,736,600 1.29% 246,092 0.18% 438,902 0.33% 134,192,216 Pine 482.26 180,375,181 69.46% 6,835,143 2.63% 55,850,601 21.51% 11,271,536 4.34% 4,970,625 1.91% 386,719 0.15% - 0.00% 259,689,805 St. Louis 1,387.93 577,520,318 69.71% 21,146,337 2.55% 171,001,984 20.64% 37,189,287 4.49% 19,257,200 2.32% 2,355,464 0.28% - 0.00% 828,470,590
District 1 Totals 3,475.84 $1,346,568,819 69.37% $44,091,324 2.27% $426,362,185 21.96% $84,742,825 4.37% $35,293,725 1.82% $3,656,239 0.19% $438,902 0.02% $1,941,154,019
Beltrami 465.08 $181,184,539 70.74% $6,192,222 2.42% $59,666,941 23.29% $6,794,836 2.65% $1,984,100 0.77% $316,405 0.12% $0 0.00% $256,139,043Clearwater 326.27 82,563,595 66.96% 3,345,577 2.71% 34,412,716 27.91% 2,043,144 1.66% 944,750 0.77% - 0.00% - 0.00% 123,309,782 Hubbard 324.02 93,951,847 66.14% 5,664,803 3.99% 38,795,872 27.31% 3,184,376 2.24% 389,800 0.27% 70,312 0.05% - 0.00% 142,057,010 Kittson 373.46 54,317,186 51.95% 2,363,050 2.26% 39,725,069 37.99% 4,981,464 4.76% 3,175,000 3.04% - 0.00% - 0.00% 104,561,769 Lake of 'Woods 194.82 32,053,620 53.16% 1,851,372 3.07% 21,822,052 36.19% 3,058,527 5.07% 1,514,800 2.51% - 0.00% - 0.00% 60,300,371 Marshall 639.65 87,947,783 52.79% 2,579,549 1.55% 62,759,856 37.67% 9,832,849 5.90% 3,476,100 2.09% - 0.00% - 0.00% 166,596,137 Norman 390.89 71,930,195 55.87% 2,108,385 1.64% 40,983,907 31.83% 13,400,562 10.41% 327,600 0.25% - 0.00% - 0.00% 128,750,649 Pennington 260.02 54,437,708 62.64% 2,006,091 2.31% 25,615,036 29.47% 3,432,737 3.95% 1,413,100 1.63% - 0.00% - 0.00% 86,904,672 Polk 805.84 142,029,443 54.63% 5,519,991 2.12% 91,965,054 35.37% 14,253,606 5.48% 6,086,750 2.34% 140,624 0.05% - 0.00% 259,995,468 Red Lake 186.16 29,636,694 52.27% 998,363 1.76% 20,210,552 35.65% 4,692,892 8.28% 1,157,700 2.04% - 0.00% - 0.00% 56,696,201 Roseau 481.92 93,707,008 58.93% 2,158,906 1.36% 53,534,082 33.67% 6,514,592 4.10% 3,021,100 1.90% 70,312 0.04% - 0.00% 159,006,000
District 2 Totals 4,448.13 $923,759,618 59.82% $34,788,309 2.25% $489,491,137 31.70% $72,189,585 4.67% $23,490,800 1.52% $597,653 0.04% $0 0.00% $1,544,317,102
Aitkin 383.04 $111,034,095 68.35% $2,851,141 1.76% $39,736,630 24.46% $6,966,160 4.29% $1,827,400 1.12% $35,156 0.02% $0 0.00% $162,450,582Benton 225.20 71,907,832 61.98% 3,730,066 3.22% 33,832,185 29.16% 5,820,384 5.02% 658,000 0.57% 70,312 0.06% - 0.00% 116,018,779 Cass 531.80 117,443,057 61.89% 2,361,454 1.24% 62,606,879 32.99% 5,921,090 3.12% 1,230,400 0.65% 210,937 0.11% - 0.00% 189,773,817 Crow Wing 376.23 131,754,497 68.53% 9,173,329 4.77% 43,963,881 22.87% 5,490,659 2.86% 1,214,100 0.63% 667,966 0.35% - 0.00% 192,264,432 Isanti 226.78 82,201,289 68.08% 5,145,606 4.26% 27,424,686 22.71% 3,784,398 3.13% 1,971,950 1.63% 210,937 0.17% - 0.00% 120,738,866 Kanabec 211.40 73,308,683 67.98% 3,858,372 3.58% 25,089,710 23.27% 5,484,037 5.09% 101,550 0.09% - 0.00% - 0.00% 107,842,352 Mille Lacs 256.83 81,626,891 65.45% 5,489,336 4.40% 30,779,872 24.68% 6,643,151 5.33% - 0.00% 175,781 0.14% - 0.00% 124,715,031 Morrison 450.25 104,134,917 61.11% 2,703,663 1.59% 53,068,017 31.14% 7,876,528 4.62% 2,516,450 1.48% 105,468 0.06% - 0.00% 170,405,043 Sherburne 242.22 104,771,539 66.47% 6,539,454 4.15% 36,513,329 23.17% 5,238,637 3.32% 3,715,600 2.36% 843,746 0.54% - 0.00% 157,622,305 Stearns 642.34 261,148,342 64.60% 22,195,822 5.49% 99,224,961 24.54% 16,041,907 3.97% 1,253,350 0.31% 3,726,562 0.92% 676,696 0.17% 404,267,640 Todd 412.32 100,588,615 66.55% 2,083,229 1.38% 42,110,522 27.86% 5,591,482 3.70% 736,400 0.49% 35,156 0.02% - 0.00% 151,145,404 Wadena 235.41 65,261,708 60.32% 1,653,007 1.53% 32,151,280 29.72% 7,524,608 6.95% 1,567,250 1.45% 35,156 0.03% - 0.00% 108,193,009 Wright 406.44 276,454,320 71.84% 29,374,726 7.63% 62,217,529 16.17% 7,157,931 1.86% 6,411,850 1.67% 3,199,211 0.83% - 0.00% 384,815,567
District 3 Totals 4,600.26 $1,581,635,785 66.17% $97,159,205 4.06% $588,719,481 24.63% $89,540,972 3.75% $23,204,300 0.97% $9,316,388 0.39% $676,696 0.03% $2,390,252,827
Becker 479.21 $141,284,772 68.13% $6,549,207 3.16% $54,726,006 26.39% $2,507,923 1.21% $1,932,400 0.93% $386,720 0.19% $0 0.00% $207,387,028Big Stone 210.80 69,342,750 71.32% 2,488,413 2.56% 23,545,069 24.22% 854,716 0.88% 990,900 1.02% - 0.00% - 0.00% 97,221,848 Clay 403.66 120,042,464 60.99% 4,108,082 2.09% 48,387,377 24.58% 19,396,863 9.85% 4,446,050 2.26% 457,031 0.23% - 0.00% 196,837,867 Douglas 397.52 172,037,334 69.33% 14,298,543 5.76% 55,687,813 22.44% 1,814,350 0.73% 3,724,650 1.50% 562,501 0.23% - 0.00% 248,125,191 Grant 228.25 68,586,066 67.16% 4,130,591 4.04% 27,794,523 27.21% 272,706 0.27% 1,346,800 1.32% - 0.00% - 0.00% 102,130,686 Mahnomen 194.37 31,626,342 56.46% 899,914 1.61% 20,758,116 37.06% 1,991,234 3.56% 736,350 1.31% - 0.00% - 0.00% 56,011,956 Otter Tail 934.39 331,285,616 69.81% 16,103,825 3.39% 112,897,884 23.79% 9,845,270 2.07% 4,429,300 0.93% - 0.00% - 0.00% 474,561,895 Pope 298.12 90,262,097 68.61% 5,058,042 3.84% 33,274,757 25.29% 1,703,875 1.30% 1,261,650 0.96% - 0.00% - 0.00% 131,560,421 Stevens 244.31 75,444,118 70.03% 3,992,170 3.71% 25,416,772 23.59% 1,351,041 1.25% 1,528,000 1.42% - 0.00% - 0.00% 107,732,101 Swift 329.11 85,647,225 62.81% 3,341,326 2.45% 39,059,824 28.64% 5,224,310 3.83% 3,087,200 2.26% - 0.00% - 0.00% 136,359,885 Traverse 245.29 66,116,300 65.44% 2,761,793 2.73% 28,032,742 27.74% 3,390,194 3.36% 736,400 0.73% - 0.00% - 0.00% 101,037,429 Wilkin 312.26 78,081,792 62.71% 3,967,732 3.19% 31,574,541 25.36% 8,343,421 6.70% 2,547,300 2.05% - 0.00% - 0.00% 124,514,786
District 4 Totals 4,277.29 $1,329,756,876 67.04% $67,699,638 3.41% $501,155,424 25.27% $56,695,903 2.86% $26,767,000 1.35% $1,406,252 0.07% $0 0.00% $1,983,481,093
Basic 25 year Construction Needs 2014-2018 ProjectsJanuary 2020
28

County Total Miles Construction ROW Preservation Structures
RR X-ing Protection / Surfacing Signals
Interchange/Off Sys Bridge Total Needs
Basic 25 year Construction Needs 2014-2018 ProjectsJanuary 2020
Dodge 256.65 $107,406,656 68.18% $1,670,374 1.06% $39,257,035 24.92% $8,105,610 5.15% $1,099,100 0.70% $0 0.00% $0 0.00% $157,538,775Fillmore 411.80 155,853,618 64.04% 2,063,985 0.85% 63,738,767 26.19% 21,711,703 8.92% - 0.00% - 0.00% - 0.00% 243,368,073 Freeborn 446.55 178,862,567 70.87% 1,542,507 0.61% 59,527,068 23.59% 6,578,611 2.61% 5,397,900 2.14% 457,031 0.18% - 0.00% 252,365,684 Goodhue 322.63 151,307,748 67.41% 5,336,900 2.38% 49,107,959 21.88% 15,771,281 7.03% 1,224,750 0.55% 35,156 0.02% 1,666,667 0.74% 224,450,461 Houston 249.59 102,420,323 66.32% 1,583,932 1.03% 40,263,121 26.07% 10,066,706 6.52% - 0.00% 105,469 0.07% - 0.00% 154,439,551 Mower 373.79 161,428,975 69.40% 2,343,398 1.01% 54,730,486 23.53% 12,124,997 5.21% 1,989,800 0.86% - 0.00% - 0.00% 232,617,656 Olmsted 308.75 174,113,997 62.69% 9,074,939 3.27% 59,711,934 21.50% 24,947,810 8.98% 2,347,000 0.85% 2,812,499 1.01% 4,708,334 1.70% 277,716,513 Rice 282.26 143,613,792 71.06% 5,820,497 2.88% 42,943,707 21.25% 8,454,505 4.18% 1,053,300 0.52% 210,937 0.10% - 0.00% 202,096,738 Steele 300.54 147,505,831 71.26% 3,185,541 1.54% 41,513,627 20.05% 9,491,307 4.59% 4,007,850 1.94% 1,300,781 0.63% - 0.00% 207,004,937 Wabasha 273.86 111,359,141 66.39% 1,798,072 1.07% 41,323,321 24.64% 11,687,093 6.97% 1,568,650 0.94% - 0.00% - 0.00% 167,736,277 Winona 315.49 140,213,630 67.71% 2,022,359 0.98% 52,143,644 25.18% 9,947,040 4.80% 2,529,350 1.22% 210,938 0.10% - 0.00% 207,066,961
District 6 Totals 3,541.91 $1,574,086,278 67.66% $36,442,504 1.57% $544,260,669 23.39% $138,886,663 5.97% $21,217,700 0.91% $5,132,811 0.22% $6,375,001 0.27% $2,326,401,626
Blue Earth 438.76 $231,326,847 62.16% $35,230,172 9.47% $69,841,225 18.77% $28,272,386 7.60% $4,934,050 1.33% $984,375 0.26% $1,562,083 0.42% $372,151,138Brown 328.21 110,531,588 62.40% 9,781,845 5.52% 41,643,151 23.51% 12,793,612 7.22% 2,199,050 1.24% 175,781 0.10% - 0.00% 177,125,027 Cottonwood 317.57 83,607,131 62.00% 1,763,573 1.31% 41,191,655 30.55% 5,864,079 4.35% 2,386,200 1.77% 35,156 0.03% - 0.00% 134,847,794 Faribault 349.25 152,113,793 66.43% 10,383,799 4.53% 49,756,345 21.73% 11,992,719 5.24% 4,746,550 2.07% - 0.00% - 0.00% 228,993,206 Jackson 370.82 148,382,529 66.30% 14,015,531 6.26% 53,883,886 24.08% 6,718,571 3.00% 807,950 0.36% - 0.00% - 0.00% 223,808,467 Le Sueur 281.38 154,674,689 70.54% 15,537,855 7.09% 44,207,618 20.16% 3,519,002 1.60% 1,288,600 0.59% 35,156 0.02% - 0.00% 219,262,920 Martin 380.04 149,217,624 67.32% 13,960,212 6.30% 50,295,338 22.69% 5,853,053 2.64% 2,336,150 1.05% - 0.00% - 0.00% 221,662,377 Nicollet 245.71 100,568,244 67.00% 10,381,662 6.92% 31,360,096 20.89% 5,985,267 3.99% - 0.00% - 0.00% 1,814,177 1.21% 150,109,446 Nobles 360.48 153,180,059 68.56% 13,785,132 6.17% 46,402,065 20.77% 6,641,165 2.97% 3,094,150 1.38% 316,407 0.14% - 0.00% 223,418,978 Rock 262.77 98,684,039 66.09% 7,344,500 4.92% 32,131,655 21.52% 9,904,550 6.63% 1,050,650 0.70% 210,937 0.14% - 0.00% 149,326,331 Sibley 288.77 113,516,418 66.20% 11,122,131 6.49% 39,752,768 23.18% 5,454,613 3.18% 1,584,650 0.92% 35,156 0.02% - 0.00% 171,465,736 Waseca 267.68 120,205,708 72.37% 9,011,631 5.43% 31,964,494 19.24% 3,559,751 2.14% 1,351,450 0.81% - 0.00% - 0.00% 166,093,034 Watonwan 234.30 94,468,597 65.47% 5,558,399 3.85% 34,853,159 24.15% 6,463,695 4.48% 2,885,800 2.00% 70,312 0.05% - 0.00% 144,299,962
District 7 Totals 4,125.74 $1,710,477,266 66.23% $157,876,442 6.11% $567,283,455 21.97% $113,022,463 4.38% $28,665,250 1.11% $1,863,280 0.07% $3,376,260 0.13% $2,582,564,416
Chippewa 244.14 $64,598,004 63.92% $3,122,623 3.09% $23,890,137 23.64% $5,810,601 5.75% $3,538,900 3.50% $105,468 0.10% $0 0.00% $101,065,733Kandiyohi 434.46 147,653,160 65.99% 11,331,858 5.06% 57,596,006 25.74% 3,215,365 1.44% 3,949,400 1.77% - 0.00% - 0.00% 223,745,789 Lac Qui Parle 364.23 93,803,454 64.17% 2,618,755 1.79% 38,667,149 26.45% 9,805,969 6.71% 1,285,600 0.88% - 0.00% - 0.00% 146,180,927 Lincoln 254.15 71,848,529 63.40% 3,512,206 3.10% 32,365,463 28.56% 3,376,551 2.98% 2,226,200 1.96% - 0.00% - 0.00% 113,328,949 Lyon 318.93 97,628,297 61.07% 4,648,464 2.91% 41,842,162 26.17% 10,105,726 6.32% 5,645,550 3.53% - 0.00% - 0.00% 159,870,199 Mc Leod 253.40 116,407,586 65.85% 11,999,058 6.79% 38,219,625 21.62% 8,134,467 4.60% 1,974,800 1.12% 35,156 0.02% - 0.00% 176,770,692 Meeker 273.54 82,455,594 65.68% 6,379,354 5.08% 31,982,619 25.48% 2,782,461 2.22% 1,932,750 1.54% - 0.00% - 0.00% 125,532,778 Murray 352.37 102,578,601 67.74% 5,139,007 3.39% 38,749,547 25.59% 4,961,226 3.28% - 0.00% - 0.00% - 0.00% 151,428,381 Pipestone 240.72 70,301,302 59.40% 3,782,404 3.20% 31,989,717 27.03% 7,556,066 6.38% 4,508,000 3.81% 210,937 0.18% - 0.00% 118,348,426 Redwood 390.73 120,145,671 62.46% 9,716,604 5.05% 47,401,039 24.64% 12,851,106 6.68% 2,237,650 1.16% - 0.00% - 0.00% 192,352,070 Renville 445.87 150,753,638 64.31% 18,349,940 7.83% 52,627,478 22.45% 8,850,086 3.78% 3,712,400 1.58% 140,625 0.06% - 0.00% 234,434,167 Yellow Medicine 345.79 97,173,561 61.78% 4,302,500 2.74% 43,280,342 27.52% 9,934,390 6.32% 2,570,800 1.63% 35,156 0.02% - 0.00% 157,296,749
District 8 Totals 3,918.33 $1,215,347,397 63.95% $84,902,773 4.47% $478,611,284 25.19% $87,384,014 4.60% $33,582,050 1.77% $527,342 0.03% $0 0.00% $1,900,354,860
Anoka 312.27 $334,962,034 62.81% $55,433,342 10.39% $85,103,569 15.96% $27,345,667 5.13% $7,288,750 1.37% $16,875,009 3.16% $6,320,133 1.19% $533,328,504Carver 234.06 217,413,849 65.93% 25,993,473 7.88% 52,765,020 16.00% 26,553,767 8.05% 3,049,050 0.92% 4,007,810 1.22% - 0.00% 329,782,969 Chisago 236.99 109,482,009 64.65% 9,562,554 5.65% 41,597,560 24.56% 3,680,090 2.17% 1,884,300 1.11% 914,058 0.54% 2,222,938 1.31% 169,343,509 Dakota 341.25 332,284,563 61.78% 61,172,320 11.37% 79,107,977 14.71% 8,919,045 1.66% 6,302,800 1.17% 14,835,943 2.76% 35,222,458 6.55% 537,845,106 Hennepin 531.15 859,645,288 63.91% 141,673,351 10.53% 159,594,292 11.87% 93,304,208 6.94% 17,481,525 1.30% 70,207,086 5.22% 3,158,333 0.23% 1,345,064,083 Ramsey 262.37 389,436,766 63.86% 45,647,494 7.49% 86,007,934 14.10% 43,506,339 7.13% 8,583,500 1.41% 30,269,562 4.96% 6,333,333 1.04% 609,784,928 Scott 232.02 183,490,862 66.43% 26,152,493 9.47% 46,923,885 16.99% 8,989,602 3.25% 2,161,300 0.78% 4,746,095 1.72% 3,751,016 1.36% 276,215,253 Washington 222.06 194,231,670 67.67% 24,047,370 8.38% 54,122,697 18.86% 1,742,295 0.61% 4,410,550 1.54% 8,472,664 2.95% - 0.00% 287,027,246
Metro Total 2,372.17 $2,620,947,041 64.11% $389,682,397 9.53% $605,222,934 14.80% $214,041,013 5.24% $51,161,775 1.25% $150,328,227 3.68% $57,008,211 1.39% $4,088,391,598
30,759.67 $12,302,579,080 65.59% $912,642,592 4.87% $4,201,106,569 22.40% $856,503,438 4.57% $243,382,600 1.30% $172,828,192 0.92% $67,875,070 0.36% $18,756,917,541
29

Restricted 2019 Adjustments Revised Basic Change % Change Restricted2018 Basic After Fall 2019 25-Year from from 2019 2019
25-Year 25-Year Screening Construction Previous Previous Restricted 25 Year ScreeningConstruction Construction Board Needs with Years Years % Construction Board
County Needs Needs Meeting Adjustments Needs Needs Change Needs Restriction
Carlton $170,015,256 $174,930,705 $174,930,705 $4,915,449 2.9% $0 $0Cook 96,979,537 87,243,818 87,243,818 (9,735,719) -10.0% -8.2% 89,036,913 1,793,095Itasca 319,346,397 311,763,459 311,763,459 (7,582,938) -2.4% 0 0Koochiching 119,791,217 144,863,426 144,863,426 25,072,209 20.9% 11.8% 133,938,560 (10,924,866)Lake 142,048,569 134,192,216 134,192,216 (7,856,353) -5.5% 0 0Pine 256,425,417 259,689,805 259,689,805 3,264,388 1.3% 0 0St. Louis 895,085,788 828,470,590 828,470,590 (66,615,198) -7.4% 0 0 District 1 Totals $1,999,692,181 $1,941,154,019 $0 $1,941,154,019 ($58,538,162) -2.9% $222,975,473 ($9,131,771)
Beltrami $254,747,690 $256,139,043 $256,139,043 $1,391,353 0.6% $0 $0Clearwater 122,364,857 123,309,782 123,309,782 944,925 0.8% 0 0Hubbard 138,937,770 142,057,010 142,057,010 3,119,240 2.3% 0 0Kittson 104,360,360 104,561,769 104,561,769 201,409 0.2% 0 0Lake of 'Woods 66,930,666 60,300,371 60,300,371 (6,630,295) -9.9% -8.2% 61,449,044 1,148,673Marshall 169,307,703 166,596,137 166,596,137 (2,711,566) -1.6% 0 0Norman 126,618,192 128,750,649 128,750,649 2,132,457 1.7% 0 0Pennington 86,047,832 86,904,672 86,904,672 856,840 1.0% 0 0Polk 260,216,795 259,995,468 259,995,468 (221,327) -0.1% 0 0Red Lake 56,112,009 56,696,201 56,696,201 584,192 1.0% 0 0Roseau 149,887,241 159,006,000 159,006,000 9,118,759 6.1% 0 0 District 2 Totals $1,535,531,115 $1,544,317,102 $0 $1,544,317,102 $8,785,987 0.6% $61,449,044 $1,148,673
Aitkin $154,472,057 $162,450,582 $162,450,582 $7,978,525 5.2% $0 $0Benton 119,859,149 116,018,779 116,018,779 (3,840,370) -3.2% 0 0Cass 193,782,465 189,773,817 189,773,817 (4,008,648) -2.1% 0 0Crow Wing 186,689,598 192,264,432 192,264,432 5,574,834 3.0% 0 0Isanti 117,701,541 120,738,866 120,738,866 3,037,325 2.6% 0 0Kanabec 102,499,827 107,842,352 107,842,352 5,342,525 5.2% 0 0Mille Lacs 120,366,655 124,715,031 124,715,031 4,348,376 3.6% 0 0Morrison 174,910,173 170,405,043 170,405,043 (4,505,130) -2.6% 0 0Sherburne 157,040,697 157,622,305 157,622,305 581,608 0.4% 0 0Stearns 372,182,373 404,267,640 404,267,640 32,085,267 8.6% 0 0Todd 132,379,962 151,145,404 151,145,404 18,765,442 14.2% 11.8% 148,014,036 (3,131,368)Wadena 103,346,855 108,193,009 108,193,009 4,846,154 4.7% 0 0Wright 349,026,933 384,815,567 384,815,567 35,788,634 10.3% 0 0 District 3 Totals $2,284,258,285 $2,390,252,827 $0 $2,390,252,827 $105,994,542 4.6% $148,014,036 ($3,131,368)
Becker $206,535,585 $207,387,028 $207,387,028 $851,443 0.4% $0 $0Big Stone 85,924,692 97,221,848 97,221,848 11,297,156 13.2% 11.8% 96,072,398 (1,149,450)Clay 200,678,607 196,837,867 196,837,867 (3,840,740) -1.9% 0 0Douglas 228,287,578 248,125,191 248,125,191 19,837,613 8.7% 0 0Grant 87,148,151 102,130,686 102,130,686 14,982,535 17.2% 11.8% 97,440,348 (4,690,338)Mahnomen 57,227,757 56,011,956 56,011,956 (1,215,801) -2.1% 0 0Otter Tail 456,485,993 474,561,895 474,561,895 18,075,902 4.0% 0 0Pope 129,743,972 131,560,421 131,560,421 1,816,449 1.4% 0 0Stevens 92,389,467 107,732,101 107,732,101 15,342,634 16.6% 11.8% 103,300,663 (4,431,438)Swift 136,322,037 136,359,885 136,359,885 37,848 0.0% 0 0Traverse 87,124,397 101,037,429 101,037,429 13,913,032 16.0% 11.8% 97,413,788 (3,623,641)Wilkin 121,093,138 124,514,786 124,514,786 3,421,648 2.8% 0 0 District 4 Totals $1,888,961,374 $1,983,481,093 $0 $1,983,481,093 $94,519,719 5.0% $394,227,197 ($13,894,867)
The resolution below was adopted by the Screening Board at the October 2015 meeting.That the CSAH construction needs change in any one county from the previous year's restricted CSAH needs to the current year's basic 25-year CSAH construction needs shall be restricted to 10 percentage points greater than or 10 percentage points less than the statewide average percent change from the previous year's restricted CSAH needs to the current year's 25-year CSAH construction needs.
Restriction of the 25 Year Construction NeedsJanuary 2020
30

Restriction of the 25 Year Construction NeedsJanuary 2020
Restricted 2019 Adjustments Revised Basic Change % Change Restricted
2018 Basic After Fall 2018 25-Year from from 2019 2019
25-Year 25-Year Screening Construction Previous Previous Restricted 25 Year Screening
Construction Construction Board Needs with Years Years % Construction Board
COUNTY Needs Needs Meeting Adjustments Needs Needs Change Needs Restriction
Anoka $502,851,752 $533,328,504 $533,328,504 $30,476,752 6.1% $0 $0Carver 314,014,954 329,782,969 329,782,969 15,768,015 5.0% 0 0Hennepin 1,349,139,787 1,345,064,083 1,345,064,083 (4,075,704) -0.3% 0 0Scott 282,847,642 276,215,253 276,215,253 (6,632,389) -2.3% 0 0 Metro Totals $2,448,854,135 $2,484,390,809 $0 $2,484,390,809 $35,536,674 1.5% $0 $0
Dodge $158,037,119 $157,538,775 $157,538,775 ($498,344) -0.3% $0 $0Fillmore 215,128,378 243,368,073 243,368,073 28,239,695 13.1% 11.8% 240,535,039 (2,833,034)Freeborn 263,569,620 252,365,684 252,365,684 (11,203,936) -4.3% 0 0Goodhue 227,612,239 224,450,461 224,450,461 (3,161,778) -1.4% 0 0Houston 156,222,031 154,439,551 154,439,551 (1,782,480) -1.1% 0 0Mower 234,490,883 232,617,656 232,617,656 (1,873,227) -0.8% 0 0Olmsted 276,990,436 277,716,513 277,716,513 726,077 0.3% 0 0Rice 204,639,983 202,096,738 202,096,738 (2,543,245) -1.2% 0 0Steele 207,132,147 207,004,937 207,004,937 (127,210) -0.1% 0 0Wabasha 162,300,792 167,736,277 167,736,277 5,435,485 3.4% 0 0Winona 208,044,611 207,066,961 207,066,961 (977,650) -0.5% 0 0 District 6 Totals $2,314,168,239 $2,326,401,626 $0 $2,326,401,626 $12,233,387 0.5% $240,535,039 ($2,833,034)
Blue Earth $329,793,429 $372,151,138 $372,151,138 $42,357,709 12.8% 11.8% $368,742,033 ($3,409,105)Brown 190,391,118 177,125,027 177,125,027 (13,266,091) -7.0% 0 0Cottonwood 138,532,763 134,847,794 134,847,794 (3,684,969) -2.7% 0 0Faribault 216,852,339 228,993,206 228,993,206 12,140,867 5.6% 0 0Jackson 205,963,817 223,808,467 223,808,467 17,844,650 8.7% 0 0Le Sueur 195,076,848 219,262,920 219,262,920 24,186,072 12.4% 11.8% 218,115,424 (1,147,496)Martin 237,939,940 221,662,377 221,662,377 (16,277,563) -6.8% 0 0Nicollet 142,134,553 150,109,446 150,109,446 7,974,893 5.6% 0 0Nobles 231,496,673 223,418,978 223,418,978 (8,077,695) -3.5% 0 0Rock 137,282,516 149,326,331 149,326,331 12,043,815 8.8% 0 0Sibley 143,733,033 171,465,736 171,465,736 27,732,703 19.3% 11.8% 160,707,904 (10,757,832)Waseca 145,325,483 166,093,034 166,093,034 20,767,551 14.3% 11.8% 162,488,423 (3,604,611)Watonwan 150,368,576 144,299,962 144,299,962 (6,068,614) -4.0% 0 0 District 7 Totals $2,464,891,088 $2,582,564,416 $0 $2,582,564,416 $117,673,328 4.8% $910,053,783 ($18,919,044)
Chippewa $107,994,449 $101,065,733 $101,065,733 ($6,928,716) -6.4% $0 $0Kandiyohi 222,804,032 223,745,789 223,745,789 941,757 0.4% 0 0Lac Qui Parle 127,618,393 146,180,927 146,180,927 18,562,534 14.6% 11.8% 142,690,125 (3,490,802)Lincoln 111,129,272 113,328,949 113,328,949 2,199,677 2.0% 0 0Lyon 166,594,440 159,870,199 159,870,199 (6,724,241) -4.0% 0 0Mc Leod 161,433,104 176,770,692 176,770,692 15,337,588 9.5% 0 0Meeker 130,654,185 125,532,778 125,532,778 (5,121,407) -3.9% 0 0Murray 137,760,830 151,428,381 151,428,381 13,667,551 9.9% 0 0Pipestone 104,229,517 118,348,426 118,348,426 14,118,909 13.6% 11.8% 116,539,023 (1,809,403)Redwood 199,063,037 192,352,070 192,352,070 (6,710,967) -3.4% 0 0Renville 218,197,007 234,434,167 234,434,167 16,237,160 7.4% 0 0Yellow Medicine 150,527,663 157,296,749 157,296,749 6,769,086 4.5% 0 0 District 8 Totals $1,838,005,929 $1,900,354,860 $0 $1,900,354,860 $62,348,931 3.4% $259,229,148 ($5,300,205)
Chisago $166,739,013 $169,343,509 $169,343,509 $2,604,496 1.6% $0 $0Dakota 540,163,382 537,845,106 537,845,106 (2,318,276) -0.4% 0 0Ramsey 657,208,542 609,784,928 609,784,928 (47,423,614) -7.2% 0 0Washington 284,121,950 287,027,246 287,027,246 2,905,296 1.0% 0 0 Metro Totals $1,648,232,887 $1,604,000,789 $0 $1,604,000,789 ($44,232,098) -2.7% $0 $0
STATE TOTALS $18,422,595,233 $18,756,917,541 $0 $18,756,917,541 $334,322,308 1.8% $2,236,483,721 ($52,061,616)
31

Total
Unencumbered Maximum Regular Unencumbered Maximum Balance Muni State Aid
Construction Balance Construction Construction Larger of Either Construction Construction
Fund Balance 2 Year Fund Balance Fund Balance or $500,000 Fund Balance Fund Balance
as of 2018-2019 Const. Needs as of 2017-2019 Needs Needs
County 12/31/19 Apportionment Deduction 12/31/19 Const. Apport. Deduction Deduction
Carlton $784,523 $6,153,382 $0 $552 $1,219,799 $0 $0Cook 682,269 3,615,451 0 530,970 616,012 0 0Itasca 2,725,005 11,112,781 0 365,177 2,155,081 0 0Koochiching 1,102,812 6,178,391 0 532,717 710,220 0 0Lake 2,102,031 4,570,594 0 1,300,522 1,342,041 0 0Pine 0 8,256,285 0 509,419 2,519,288 0 0St. Louis 0 31,643,827 0 491 7,657,781 0 0 District 1 Totals $7,396,640 $71,530,711 $0 $3,239,848 $16,220,222 $0 $0
Beltrami 1,106,134 $9,120,678 $0 155,950 $500,000 $0 $0Clearwater 1,886,194 4,771,457 0 600,046 600,046 0 0Hubbard 477,577 5,323,702 0 273,804 537,830 0 0Kittson 975,192 4,378,343 0 372,562 684,017 0 0Lake of the Woods 3,403,083 4,048,652 0 328,955 500,000 0 0Marshall 185,163 6,954,945 0 46 852,605 0 0Norman 1,470,590 5,060,314 0 422,390 566,904 0 0Pennington 0 4,021,363 0 81,036 500,000 0 0Polk 0 10,032,120 0 243,642 1,231,168 0 0Red Lake 3,000,000 3,598,698 0 500,000 649,605 0 0Roseau 1,196,873 6,143,935 0 909,688 911,168 0 0 District 2 Totals $13,700,806 $63,454,207 $0 $3,888,119 $7,533,343 $0 $0
Aitkin $1,903,812 $5,944,965 $0 $401,203 $527,594 $0 $0Benton 66,025 4,898,986 0 239,078 579,089 0 0Cass 1,078,817 7,060,788 0 500,000 1,179,481 0 0Crow Wing 635,401 6,913,107 0 960,733 2,701,429 0 0Isanti 650,930 5,152,915 0 374,842 500,000 0 0Kanabec 19,166 3,966,030 0 396,729 500,000 0 0Mille Lacs 3,576,173 5,240,002 0 709,675 1,005,378 0 0Morrison 27,132 7,524,554 0 761,963 1,108,693 0 0Sherburne 1,495,430 6,893,396 0 502,961 636,918 0 0Stearns 335,928 14,188,529 0 1,160,979 3,188,951 0 0Todd 1,144,971 5,560,640 0 440,897 663,460 0 0Wadena 0 3,704,063 0 73,354 920,940 0 0Wright 2,507,403 12,710,457 0 1,485,560 1,697,404 0 0 District 3 Totals $13,441,188 $89,758,432 $0 $8,007,974 $15,209,337 $0 $0
Becker $2,253,137 $7,320,037 $0 $602,551 $640,842 $0 $0Big Stone 1,018,961 3,422,900 0 1,092,503 881,500 211,003 211,003Clay 21,075 7,410,303 0 35,309 742,221 0 0Douglas 641,037 7,397,916 0 5,887 1,081,797 0 0Grant 3,435,015 3,568,740 0 338,116 707,245 0 0Mahnomen 2,141,715 3,764,093 0 286,589 500,000 0 0Otter Tail 5,750,401 14,666,956 0 570,020 1,634,968 0 0Pope 904,343 4,697,821 0 572,335 572,335 0 0Stevens 551,125 3,771,300 0 278,731 500,000 0 0Swift 1,391,745 4,643,828 0 476,926 576,712 0 0Traverse 674,747 3,703,219 0 461,215 500,000 0 0Wilkin 662,092 4,331,298 0 662,025 772,688 0 0 District 4 Totals $19,445,393 $68,698,411 $0 $5,382,207 $9,110,308 $211,003 $211,003
Regular Account Municipal Account
January 2020County State Aid Construction Fund Balance Needs Deductions
This resolution was adopted by the Screening Board at the October 2015 meeting.Be it Resolved: That, for the determination of County State Aid Highway needs, the amount of the unencumbered construction fund balance as of December 31 of the current year; not including the last two years regular account construction apportionment and not including the last three years of municipal account construction apportionment or $500,000 whichever is greater; shall be deducted from the 25-year construction needs of each individual county. Except, that when a County Board Resolution justifying said construction fund balance in excess of said limits is provided to and approved by the State Aid Office by December 15; no deduction shall be made.
32

January 2020County State Aid Construction Fund Balance Needs Deductions
Total
Unencumbered Maximum Regular Unencumbered Maximum Balance Muni State Aid
Construction Balance Construction Construction Larger of Either Construction Construction
Fund Balance 2 Year Fund Balance Fund Balance or $500,000 Fund Balance Fund Balance
as of 2018-2019 Const. Needs as of 2017-2019 Needs Needs
County 12/31/19 Apportionment Deduction 12/31/19 Const. Apport. Deduction Deduction
Anoka $0 $43,987,432 $0 $35,460 $3,299,601 $0 $0Carver 13,982,167 14,527,885 0 1,629,951 1,629,951 0 0Hennepin 2,106,315 51,652,011 0 3,219,617 5,240,984 0 0Scott 859,106 21,043,407 0 300,716 500,000 0 0 Metro Totals $16,947,588 $131,210,735 $0 $5,185,744 $10,670,536 $0 $0
Dodge $0 $5,513,468 $0 $32,703 $638,221 $0 $0Fillmore 2,593,783 6,916,049 0 537,134 1,537,397 0 0Freeborn 0 8,304,149 0 218,382 775,134 0 0Goodhue 4,070,907 7,463,567 0 500,000 1,081,917 0 0Houston 46,629 5,513,618 0 7,327 530,167 0 0Mower 804,077 7,512,050 0 145,301 922,927 0 0Olmsted 0 10,392,886 0 396,466 500,000 0 0Rice 1,495,837 7,299,008 0 677,725 768,615 0 0Steele 856,674 7,245,784 0 500,000 643,690 0 0Wabasha 0 5,619,167 0 43,491 1,058,810 0 0Winona 2,162,914 7,188,308 0 682,432 967,002 0 0 District 6 Totals $12,030,821 $78,968,054 $0 $3,740,961 $9,423,880 $0 $0
Blue Earth $4,516,556 $10,201,510 $0 $1,312,333 $1,312,333 $0 $0Brown 1,701,406 6,427,209 0 544,738 690,889 0 0Cottonwood 1,373,487 4,397,712 0 791,425 920,113 0 0Faribault 1,016,767 5,995,394 0 0 1,639,386 0 0Jackson 5,573,747 5,908,560 0 94,451 1,039,602 0 0Le Sueur 87,560 5,335,380 0 520,598 1,827,238 0 0Martin 5,338,979 7,508,618 0 467,389 660,212 0 0Nicollet 5,144,298 5,548,489 0 301,469 500,000 0 0Nobles 0 6,746,972 0 600,611 773,057 0 0Rock 0 4,105,751 0 0 1,046,773 0 0Sibley 406,841 4,718,432 0 569,539 569,539 0 0Waseca 0 4,818,488 0 500,000 500,000 0 0Watonwan 2,856,101 4,157,071 0 1,307,485 1,307,485 0 0 District 7 Totals $28,015,742 $75,869,586 $0 $7,010,038 $12,786,627 $0 $0
Chippewa $3,208,679 $3,827,273 $0 $0 $512,569 $0 $0Kandiyohi 0 8,028,003 0 865,015 1,005,208 0 0Lac Qui Parle 3,856,095 4,568,171 0 40,212 573,255 0 0Lincoln 3,333,393 3,724,254 0 439,327 607,465 0 0Lyon 2,313,163 5,270,443 0 717,578 1,197,383 0 0Mc Leod 687,149 5,635,043 0 761,528 1,064,722 0 0Meeker 793,250 4,806,391 0 465,961 500,000 0 0Murray 1,181,826 5,101,861 0 0 607,691 0 0Pipestone 2,610,167 3,376,286 0 1,571,324 1,478,813 92,511 92,511Redwood 409,814 6,003,913 0 293,457 1,065,165 0 0Renville 0 6,790,881 0 207,473 750,616 0 0Yellow Medicine 1,042,112 4,713,401 0 273,484 994,968 0 0 District 8 Totals $19,435,648 $61,845,920 $0 $5,635,359 $10,357,855 $92,511 $92,511
Chisago $0 $5,872,782 $0 $0 $3,279,010 $0 $0Dakota 3,122,543 $46,682,756 0 844,608 1,047,679 0 0Ramsey 11,672,695 $24,136,279 0 681,994 971,282 0 0Washington 3,906,828 $26,351,957 0 636,122 5,299,317 0 0 Metro Totals $18,702,066 $103,043,774 $0 $2,162,724 $10,597,288 $0 $0
STATE TOTALS $149,115,892 $744,379,830 $0 $44,252,974 $101,909,396 $303,514 $303,514
Regular Account Municipal Account
33

Mill Levy DeductionJanuary 2020
Minnesota Statutes, Chapter 162.07, Subdivision 3 and 4 requires that a two-mill levy on each rural county, and a one and two-tenths mill levy on each urban county be computed and subtracted from such county's total estimated construction cost.
The 1971 Legislature amended Laws pertaining to taxation and assessment of property valuations. Previously, the term "full and true" (1/3 of market value) was interpreted to mean Taxable Value. The 1971 Legislature deleted the term "full and true" and inserted "market" value where applicable. Also, all adjustments made to market value to arrive at the full and true value were negated. The result of this change in legislation was an increase in Taxable Value by approximately 300%.
To obviate any conflict, the 1971 Legislature enacted the following:
Chapter 273.1102 RATE OF TAXATION, TERMINOLOGY OF LAWS OF CHARTERS. The rate of taxation by any political subdivision or of the public corporation for any purpose for which any law or charter now provides a maximum tax rate expressed in mills times the assessed value times the full and true value of taxable property (except any value determined by the state equalization aid review committee) shall not exceed 33 1/3 percent of such maximum tax rate until and unless such law or charter is amended to provide a different maximum tax rate. (1971 C 427 S 24)
We have therefore, reduced the mill rate by the required 33 1/3% to equal a 0.6667 mill levy for rural counties and a 0.4000 mill levy of urban counties.
THE 1985 LEGISLATURE REVISED THE DEFINITION OF URBAN COUNTIES FROM THOSE HAVING A POPULATION OF 200,000 OR MORE TO THOSE HAVING A POPULATION OF 175,000 OR MORE. THIS LEGISLATION GIVES URBAN COUNTY STATUS TO ANOKA AND DAKOTA COUNTIES IN ADDITION TO HENNEPIN, RAMSEY AND ST. LOUIS WHICH WERE CONSIDERED URBAN COUNTIES PRIOR TO 1985.
Action at the 1989 Legislative session resulted in the elimination of references to "Mill Rates". In order to continue the Mill Levy Deduction procedure the Legislature enacted the following:
Chapter 277, Article 4 MILL RATE Conversions, Section 12 & 13 converts Mill Rate Levy limits based on the old assessed value system to an equivalent percentage of taxable market value limit in order to conform to the new tax capacity system. (Rural counties - 0.01596%, Urban counties - 0.00967%)
The following listed figures comply with the above requirements of computation.
The enactment of the “Homestead Exclusion” (MS 273.13, subd. 35) by the 2011 Legislature will be effective for the CSAH distribution in 2013. The effect will be to reduce the taxable market values provided to you be the Dept. of Revenue to compute the mill levy deduction and thus the mill levy deduction itself from what they would have otherwise been before the enactment of the homestead exclusion. The reduction will be relatively greater in those largely rural counties with lower home values than it will be for the urbanized counties with higher home values.
34

County Total Real &Personal Market Value Mill Levy
County (Taxes Payable 2019) DeductionCarlton $2,840,334,434 $453,317Cook 1,582,023,029 252,491Itasca 5,455,446,657 870,689Koochiching 1,080,424,064 172,436Lake 1,740,214,749 277,738Pine 2,745,375,899 438,162St. Louis* 17,058,467,275 1,649,554 District 1 Totals $32,502,286,107 $4,114,387
Beltrami $3,384,496,998 $540,166Clearwater 1,102,590,700 175,973Hubbard 3,423,562,049 546,401Kittson 1,387,378,400 221,426Lake of the Woods 591,649,165 94,427Marshall 2,398,070,507 382,732Norman 1,750,096,592 279,315Pennington 1,489,855,498 237,781Polk 5,446,583,000 869,275Red Lake 686,944,913 109,636Roseau 1,400,277,700 223,484 District 2 Totals $23,061,505,522 $3,680,616
Aitkin $2,873,894,711 $458,674Benton 3,030,298,200 483,636Cass 6,702,897,432 1,069,782Crow Wing 10,418,734,354 1,662,830Isanti 3,312,647,400 528,699Kanabec 1,294,941,493 206,673Mille Lacs 2,136,354,296 340,962Morrison 3,550,218,300 566,615Sherburne 8,736,066,101 1,394,276Stearns 14,335,602,100 2,287,962Todd 2,453,021,444 391,502Wadena 1,095,983,524 174,919Wright 14,959,522,976 2,387,540 District 3 Totals $74,900,182,331 $11,954,070
Becker $5,661,103,100 $903,512Big Stone 1,452,039,347 231,745Clay 6,501,187,700 1,037,590Douglas 5,641,924,266 900,451Grant 1,849,391,523 295,163Mahnomen 693,843,342 110,737Otter Tail 9,879,455,097 1,576,761Pope 2,325,430,674 371,139Stevens 2,305,952,075 368,030Swift 2,799,944,354 446,871Traverse 1,931,017,049 308,190Wilkin 2,120,904,014 338,496 District 4 Totals $43,162,192,541 $6,888,685
Mill Levy DeductionJanuary 2020
35

County Total Real &Personal Market Value Mill Levy
County (Taxes Payable 2019) Deduction
Mill Levy DeductionJanuary 2020
Anoka* $32,686,968,724 $3,160,830Carver 13,930,075,800 2,223,240Hennepin* 173,196,471,080 16,748,099Scott 17,832,061,900 2,845,997 Metro Totals $237,645,577,504 $24,978,166
Dodge $3,047,206,400 $486,334Fillmore 3,851,568,750 614,710Freeborn 4,052,314,749 646,749Goodhue 7,238,983,700 1,155,342Houston 2,200,772,107 351,243Mower 4,506,017,750 719,160Olmsted 17,322,570,166 2,764,682Rice 6,309,916,100 1,007,063Steele 3,968,544,161 633,380Wabasha 3,114,187,400 497,024Winona 4,730,933,496 755,057 District 6 Totals $60,343,014,779 $9,630,744
Blue Earth $8,162,358,500 $1,302,712Brown 3,759,488,382 600,014Cottonwood 3,208,532,462 512,082Faribault 3,433,704,501 548,019Jackson 3,449,215,898 550,495Le Sueur 4,042,940,555 645,253Martin 4,317,684,400 689,102Nicollet 4,251,503,100 678,540Nobles 4,358,083,708 695,550Rock 2,985,114,518 476,424Sibley 3,057,000,199 487,897Waseca 2,760,189,100 440,526Watonwan 2,058,336,100 328,510 District 7 Totals $49,844,151,423 $7,955,124
Chippewa $2,718,486,127 $433,870Kandiyohi 5,619,341,662 896,847Lac Qui Parle 2,352,041,753 375,386Lincoln 1,738,307,852 277,434Lyon 4,062,772,348 648,418Mc Leod 3,889,309,100 620,734Meeker 3,251,052,297 518,868Murray 3,192,082,216 509,456Pipestone 2,061,237,264 328,973Redwood 4,123,449,059 658,102Renville 4,505,904,191 719,142Yellow Medicine 2,810,449,771 448,548 District 8 Totals $40,324,433,640 $6,435,778
Chisago $5,355,153,900 $854,683Dakota* 47,938,736,952 4,635,676Ramsey* 51,609,139,200 4,990,604Washington* 32,095,423,603 3,103,627 Metro Totals $136,998,453,655 $13,584,590
STATE TOTALS $698,781,797,502 $89,222,160
* Denotes Urban County.
36

Pursuant to Minnesota Statutes, Chapter 162.07, Subdivision 1b
2020 Apportionment Apportionment Minimum Apportionment
County Sum Percentage Apportionment Sum
Big Stone 0.00586782 $2,691,616 $2,691,616
Koochiching 0.01099800 $5,044,871 $5,044,871$458,708,058
Lake of the Woods 0.00749425 $3,437,673 $3,437,673
Mahnomen 0.00586782 $2,691,616 $2,691,616
Red Lake 0.00586782 $2,691,616 $2,691,616
In complying with this statute and resolution, the below listed counties whose money needs were thus adjusted shall henceforth receive not less than the percentage of the apportionment sum as listed until such time as the statute or resolution is changed.
Minimum County ApportionmentsJanaury 2020
An amount equal to 50 percent of the apportionment sum shall be apportioned among the several counties so that each county shall receive of such amount the percentage that its money needs bears to the sum of the money needs of all of the individual counties; provided, that the percentage of such amount that each county is to receive shall be adjusted so that each county shall receive in 1958 a total apportionment at least 10 percent greater than the total 1956 apportionments from the State Road and Bridge Fund; and provided further, that those counties whose money needs are thus adjusted shall never receive a percentage of the apportionment sum less than the percentage that such county received in 1958.
37

Koochiching - Equalizaton - $527,251 $5,044,871------------------------------ Motor Vehicle - 161,924 1,798,882 *
Lane Mileage - 1,109,707 ------------------------------------------------- 3,245,989
$1,798,882 * 1,804,700 Fig. A Money Needs------------------------
$1,441,289 =Adjustment
Lake of the Woods - Equalizaton - $527,251 $3,437,673------------------------------ Motor Vehicle - 55,595 1,432,327 *
Lane Mileage - 849,481 ------------------------------------------------- 2,005,346
$1,432,327 * 822,640 Fig. A Money Needs------------------------
$1,182,706 =Adjustment
Red Lake - Equalizaton - $527,251 $2,691,616------------------------------ Motor Vehicle - 54,357 1,393,246 *
Lane Mileage - 811,638 ------------------------------------------------- 1,298,370
$1,393,246 751,176 Fig. A Money Needs------------------------
$547,194 =Adjustment
Big Stone - Equalizaton - $527,251 $2,691,616------------------------------ Motor Vehicle - 71,054 1,517,418 *
Lane Mileage - 919,113 ------------------------------------------------- 1,174,198
$1,517,418 * 1,253,940 Fig. A Money Needs------------------------
$0 =Adjustment
Mahnomen - Equalizaton - $527,251 $2,691,616------------------------------ Motor Vehicle - 44,495 1,419,301 *
Lane Mileage - 847,555 ------------------------------------------------- 1,272,315
$1,419,301 * 741,265 Fig. A Money Needs
$531,050 =Adjustment
Total; Adjustments for all Counties$3,702,239
Minimum County AdjustmentJanuary 2020
38

NOTES and COMMENTS
39
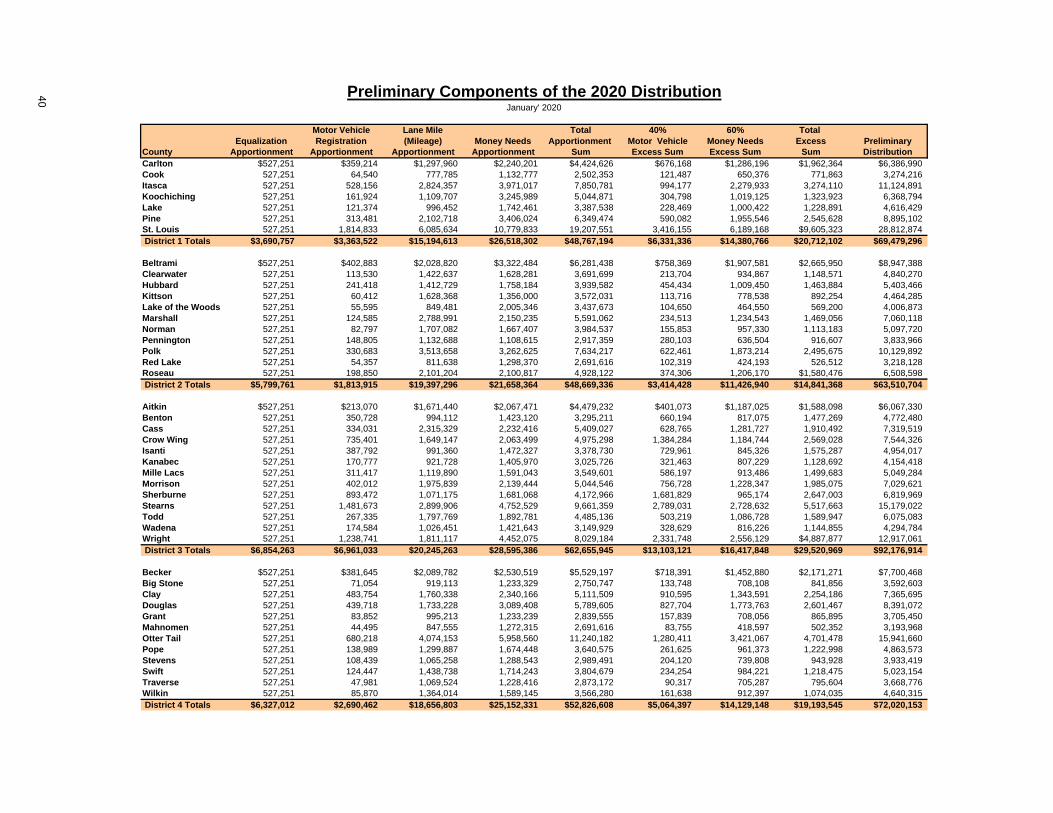
Motor Vehicle Lane Mile Total 40% 60% Total Equalization Registration (Mileage) Money Needs Apportionment Motor Vehicle Money Needs Excess Preliminary
County Apportionment Apportionment Apportionment Apportionment Sum Excess Sum Excess Sum Sum DistributionCarlton $527,251 $359,214 $1,297,960 $2,240,201 $4,424,626 $676,168 $1,286,196 $1,962,364 $6,386,990Cook 527,251 64,540 777,785 1,132,777 2,502,353 121,487 650,376 771,863 3,274,216Itasca 527,251 528,156 2,824,357 3,971,017 7,850,781 994,177 2,279,933 3,274,110 11,124,891Koochiching 527,251 161,924 1,109,707 3,245,989 5,044,871 304,798 1,019,125 1,323,923 6,368,794Lake 527,251 121,374 996,452 1,742,461 3,387,538 228,469 1,000,422 1,228,891 4,616,429Pine 527,251 313,481 2,102,718 3,406,024 6,349,474 590,082 1,955,546 2,545,628 8,895,102St. Louis 527,251 1,814,833 6,085,634 10,779,833 19,207,551 3,416,155 6,189,168 $9,605,323 28,812,874 District 1 Totals $3,690,757 $3,363,522 $15,194,613 $26,518,302 $48,767,194 $6,331,336 $14,380,766 $20,712,102 $69,479,296
Beltrami $527,251 $402,883 $2,028,820 $3,322,484 $6,281,438 $758,369 $1,907,581 $2,665,950 $8,947,388Clearwater 527,251 113,530 1,422,637 1,628,281 3,691,699 213,704 934,867 1,148,571 4,840,270Hubbard 527,251 241,418 1,412,729 1,758,184 3,939,582 454,434 1,009,450 1,463,884 5,403,466Kittson 527,251 60,412 1,628,368 1,356,000 3,572,031 113,716 778,538 892,254 4,464,285Lake of the Woods 527,251 55,595 849,481 2,005,346 3,437,673 104,650 464,550 569,200 4,006,873Marshall 527,251 124,585 2,788,991 2,150,235 5,591,062 234,513 1,234,543 1,469,056 7,060,118Norman 527,251 82,797 1,707,082 1,667,407 3,984,537 155,853 957,330 1,113,183 5,097,720Pennington 527,251 148,805 1,132,688 1,108,615 2,917,359 280,103 636,504 916,607 3,833,966Polk 527,251 330,683 3,513,658 3,262,625 7,634,217 622,461 1,873,214 2,495,675 10,129,892Red Lake 527,251 54,357 811,638 1,298,370 2,691,616 102,319 424,193 526,512 3,218,128Roseau 527,251 198,850 2,101,204 2,100,817 4,928,122 374,306 1,206,170 $1,580,476 6,508,598 District 2 Totals $5,799,761 $1,813,915 $19,397,296 $21,658,364 $48,669,336 $3,414,428 $11,426,940 $14,841,368 $63,510,704
Aitkin $527,251 $213,070 $1,671,440 $2,067,471 $4,479,232 $401,073 $1,187,025 $1,588,098 $6,067,330Benton 527,251 350,728 994,112 1,423,120 3,295,211 660,194 817,075 1,477,269 4,772,480Cass 527,251 334,031 2,315,329 2,232,416 5,409,027 628,765 1,281,727 1,910,492 7,319,519Crow Wing 527,251 735,401 1,649,147 2,063,499 4,975,298 1,384,284 1,184,744 2,569,028 7,544,326Isanti 527,251 387,792 991,360 1,472,327 3,378,730 729,961 845,326 1,575,287 4,954,017Kanabec 527,251 170,777 921,728 1,405,970 3,025,726 321,463 807,229 1,128,692 4,154,418Mille Lacs 527,251 311,417 1,119,890 1,591,043 3,549,601 586,197 913,486 1,499,683 5,049,284Morrison 527,251 402,012 1,975,839 2,139,444 5,044,546 756,728 1,228,347 1,985,075 7,029,621Sherburne 527,251 893,472 1,071,175 1,681,068 4,172,966 1,681,829 965,174 2,647,003 6,819,969Stearns 527,251 1,481,673 2,899,906 4,752,529 9,661,359 2,789,031 2,728,632 5,517,663 15,179,022Todd 527,251 267,335 1,797,769 1,892,781 4,485,136 503,219 1,086,728 1,589,947 6,075,083Wadena 527,251 174,584 1,026,451 1,421,643 3,149,929 328,629 816,226 1,144,855 4,294,784Wright 527,251 1,238,741 1,811,117 4,452,075 8,029,184 2,331,748 2,556,129 $4,887,877 12,917,061 District 3 Totals $6,854,263 $6,961,033 $20,245,263 $28,595,386 $62,655,945 $13,103,121 $16,417,848 $29,520,969 $92,176,914
Becker $527,251 $381,645 $2,089,782 $2,530,519 $5,529,197 $718,391 $1,452,880 $2,171,271 $7,700,468Big Stone 527,251 71,054 919,113 1,233,329 2,750,747 133,748 708,108 841,856 3,592,603Clay 527,251 483,754 1,760,338 2,340,166 5,111,509 910,595 1,343,591 2,254,186 7,365,695Douglas 527,251 439,718 1,733,228 3,089,408 5,789,605 827,704 1,773,763 2,601,467 8,391,072Grant 527,251 83,852 995,213 1,233,239 2,839,555 157,839 708,056 865,895 3,705,450Mahnomen 527,251 44,495 847,555 1,272,315 2,691,616 83,755 418,597 502,352 3,193,968Otter Tail 527,251 680,218 4,074,153 5,958,560 11,240,182 1,280,411 3,421,067 4,701,478 15,941,660Pope 527,251 138,989 1,299,887 1,674,448 3,640,575 261,625 961,373 1,222,998 4,863,573Stevens 527,251 108,439 1,065,258 1,288,543 2,989,491 204,120 739,808 943,928 3,933,419Swift 527,251 124,447 1,438,738 1,714,243 3,804,679 234,254 984,221 1,218,475 5,023,154Traverse 527,251 47,981 1,069,524 1,228,416 2,873,172 90,317 705,287 795,604 3,668,776Wilkin 527,251 85,870 1,364,014 1,589,145 3,566,280 161,638 912,397 1,074,035 4,640,315 District 4 Totals $6,327,012 $2,690,462 $18,656,803 $25,152,331 $52,826,608 $5,064,397 $14,129,148 $19,193,545 $72,020,153
Preliminary Components of the 2020 DistributionJanuary' 2020
40

Motor Vehicle Lane Mile Total 40% 60% Total Equalization Registration (Mileage) Money Needs Apportionment Motor Vehicle Money Needs Excess Preliminary
County Apportionment Apportionment Apportionment Apportionment Sum Excess Sum Excess Sum Sum Distribution
Preliminary Components of the 2020 DistributionJanuary' 2020
Anoka $527,251 $2,727,937 $1,841,254 $6,220,991 $11,317,433 $5,134,940 $3,571,740 $8,706,680 $20,024,113Carver 527,251 730,951 1,067,322 3,754,741 6,080,265 1,375,908 2,155,759 3,531,667 9,611,932Hennepin 527,251 7,743,864 3,409,485 12,684,985 24,365,585 14,576,684 7,282,998 21,859,682 46,225,267Scott 527,251 1,068,148 1,258,466 2,808,030 5,661,895 2,010,631 1,612,211 3,622,842 9,284,737 Metro Totals $2,109,004 $12,270,900 $7,576,527 $25,468,747 $47,425,178 $23,098,163 $14,622,708 $37,720,871 $85,146,049
Dodge $527,251 $211,189 $1,120,165 $1,990,744 $3,849,349 $397,533 $1,142,972 $1,540,505 $5,389,854Fillmore 527,251 241,693 1,795,567 3,083,292 5,647,803 454,952 1,770,251 2,225,203 7,873,006Freeborn 527,251 312,426 1,950,656 3,234,325 6,024,658 588,096 1,856,966 2,445,062 8,469,720Goodhue 527,251 493,845 1,406,399 2,677,965 5,105,460 929,591 1,537,535 2,467,126 7,572,586Houston 527,251 200,272 1,089,202 1,994,551 3,811,276 376,982 1,145,158 1,522,140 5,333,416Mower 527,251 353,756 1,636,900 2,939,119 5,457,026 665,893 1,687,475 2,353,368 7,810,394Olmsted 527,251 1,107,596 1,460,343 2,856,424 5,951,614 2,084,888 1,639,997 3,724,885 9,676,499Rice 527,251 556,734 1,235,622 2,422,628 4,742,235 1,047,970 1,390,936 2,438,906 7,181,141Steele 527,251 337,838 1,323,281 2,617,761 4,806,131 635,931 1,502,970 2,138,901 6,945,032Wabasha 527,250 255,546 1,194,063 2,126,721 4,103,580 481,028 1,221,042 1,702,070 5,805,650Winona 527,250 395,360 1,375,711 2,576,957 4,875,278 744,208 1,479,543 2,223,751 7,099,029 District 6 Totals $5,799,759 $4,466,255 $15,587,909 $28,520,487 $54,374,410 $8,407,072 $16,374,845 $24,781,917 $79,156,327
Blue Earth $527,250 $527,377 $1,957,674 $4,603,348 $7,615,649 $992,709 $2,642,981 $3,635,690 $11,251,339Brown 527,250 318,435 1,433,233 2,220,029 4,498,947 599,407 1,274,615 1,874,022 6,372,969Cottonwood 527,250 135,640 1,384,656 1,671,215 3,718,761 255,322 959,517 1,214,839 4,933,600Faribault 527,250 171,970 1,524,195 2,948,077 5,171,492 323,708 1,692,618 2,016,326 7,187,818Jackson 527,250 122,842 1,616,808 2,876,233 5,143,133 231,232 1,651,370 1,882,602 7,025,735Le Sueur 527,250 338,618 1,225,989 2,765,836 4,857,693 637,399 1,587,986 2,225,385 7,083,078Martin 527,250 227,840 1,659,743 2,799,397 5,214,230 428,876 1,607,255 2,036,131 7,250,361Nicollet 527,250 268,390 1,072,276 1,823,213 3,691,129 505,205 1,046,786 1,551,991 5,243,120Nobles 527,250 209,171 1,577,314 2,821,242 5,134,977 393,733 1,619,797 2,013,530 7,148,507Rock 527,250 107,062 1,144,935 1,881,680 3,660,927 201,529 1,080,354 1,281,883 4,942,810Sibley 527,250 169,263 1,264,108 2,033,604 3,994,225 318,613 1,167,580 1,486,193 5,480,418Waseca 527,250 191,786 1,167,091 2,074,203 3,960,330 361,009 1,190,889 1,551,898 5,512,228Watonwan 527,250 121,099 1,021,635 1,863,489 3,533,473 227,951 1,069,910 1,297,861 4,831,334 District 7 Totals $6,854,250 $2,909,493 $18,049,657 $32,381,566 $60,194,966 $5,476,693 $18,591,658 $24,068,351 $84,263,317
Chippewa $527,250 $142,979 $1,064,570 $1,235,400 $2,970,199 $269,138 $709,296 $978,434 $3,948,633Kandiyohi 527,250 449,350 1,916,391 2,756,806 5,649,797 845,836 1,582,802 2,428,638 8,078,435Lac Qui Parle 527,250 94,402 1,588,185 1,825,397 4,035,234 177,698 1,048,039 1,225,737 5,260,971Lincoln 527,250 79,586 1,108,193 1,456,876 3,171,905 149,809 836,456 986,265 4,158,170Lyon 527,250 256,601 1,390,573 1,967,181 4,141,605 483,014 1,129,444 1,612,458 5,754,063Mc Leod 527,250 392,471 1,104,752 2,208,083 4,232,556 738,768 1,267,756 2,006,524 6,239,080Meeker 527,250 261,005 1,192,687 1,541,337 3,522,279 491,303 884,948 1,376,251 4,898,530Murray 527,250 112,338 1,536,443 1,899,156 4,075,187 211,459 1,090,388 1,301,847 5,377,034Pipestone 527,250 117,154 1,049,570 1,481,923 3,175,897 220,525 850,836 1,071,361 4,247,258Redwood 527,250 189,171 1,704,743 2,408,652 4,829,816 356,087 1,382,911 1,738,998 6,568,814Renville 527,250 199,033 1,944,051 2,964,001 5,634,335 374,651 1,701,761 2,076,412 7,710,747Yellow Medicine 527,250 126,879 1,507,682 2,000,365 4,162,176 238,830 1,148,496 1,387,326 5,549,502 District 8 Totals $6,327,000 $2,420,969 $17,107,840 $23,745,177 $49,600,986 $4,557,118 $13,633,133 $18,190,251 $67,791,237
Chisago $527,250 $611,871 $1,030,717 $2,026,291 $4,196,129 $1,151,757 $1,163,380 $2,315,137 $6,511,266Dakota 527,250 3,042,748 2,008,453 5,777,947 11,356,398 5,727,526 3,317,369 9,044,895 20,401,293Ramsey 527,250 3,345,633 1,643,230 6,641,544 12,157,657 6,297,662 3,813,197 10,110,859 22,268,516Washington 527,250 1,974,005 1,114,109 2,867,887 6,483,251 3,715,774 1,646,578 5,362,352 11,845,603 Metro Totals $2,109,000 $8,974,257 $5,796,509 $17,313,669 $34,193,435 $16,892,719 $9,940,524 $26,833,243 $61,026,678
STATE TOTALS $45,870,806 $45,870,806 $137,612,417 $229,354,029 $458,708,058 $86,345,047 $129,517,570 $215,862,617 $674,570,675
41

Tentative Tentative Tentative Minimum Statutory 0.55% SB Total Apportionment Excess Final Final Final
Apportionment Sum Excess Sum Total Distribution Minimum Minimum Minimum Sum Sum Apportionment Sum Excess Sum Total
County Distribution Distribution Distribution 0.5500% Adjustment Adjustment Adjustment Adjustment Adjustment Distribution Distribution Distribution
Carlton $4,424,626 $1,962,364 $6,386,990 $3,710,139 $0 $0 $0 ($11,149) ($4,772) $4,413,477 $1,957,592 $6,371,069Cook 2,502,353 771,863 3,274,216 3,710,139 0 435,923 435,923 296,428 139,495 2,798,781 911,358 3,710,139Itasca 7,850,781 3,274,110 11,124,891 3,710,139 0 0 0 (19,781) (7,962) 7,831,000 3,266,148 11,097,148Koochiching 5,044,871 1,323,923 6,368,794 3,710,139 1,441,289 0 1,441,289 0 (3,219) 5,044,871 1,320,704 6,365,575Lake 3,387,538 1,228,891 4,616,429 3,710,139 0 0 0 (8,536) (2,988) 3,379,002 1,225,903 4,604,905Pine 6,349,474 2,545,628 8,895,102 3,710,139 0 0 0 (15,999) (6,190) 6,333,475 2,539,438 8,872,913St. Louis 19,207,551 9,605,323 28,812,874 3,710,139 0 0 0 (48,397) (23,358) 19,159,154 9,581,965 28,741,119 District 1 Totals $48,767,194 $20,712,102 $69,479,296 $48,959,760 $20,803,108 $69,762,868
Beltrami $6,281,438 $2,665,950 $8,947,388 $3,710,139 $0 $0 $0 ($15,827) ($6,483) $6,265,611 $2,659,467 $8,925,078Clearwater 3,691,699 1,148,571 4,840,270 3,710,139 0 0 0 (9,302) (2,793) 3,682,397 1,145,778 4,828,175Hubbard 3,939,582 1,463,884 5,403,466 3,710,139 0 0 0 (9,926) (3,560) 3,929,656 1,460,324 5,389,980Kittson 3,572,031 892,254 4,464,285 3,710,139 0 0 0 (9,000) (2,170) 3,563,031 890,084 4,453,115Lake of the Woods 3,437,673 569,200 4,006,873 3,710,139 1,182,706 0 1,182,706 0 (1,384) 3,437,673 567,816 4,005,489Marshall 5,591,062 1,469,056 7,060,118 3,710,139 0 0 0 (14,088) (3,572) 5,576,974 1,465,484 7,042,458Norman 3,984,537 1,113,183 5,097,720 3,710,139 0 0 0 (10,040) (2,707) 3,974,497 1,110,476 5,084,973Pennington 2,917,359 916,607 3,833,966 3,710,139 0 0 0 (7,351) (2,229) 2,910,008 914,378 3,824,386Polk 7,634,217 2,495,675 10,129,892 3,710,139 0 0 0 (19,236) (6,069) 7,614,981 2,489,606 10,104,587Red Lake 2,691,616 526,512 3,218,128 3,710,139 547,194 492,011 1,039,205 334,567 157,444 3,026,183 683,956 3,710,139Roseau 4,928,122 1,580,476 6,508,598 3,710,139 0 0 0 (12,417) (3,843) 4,915,705 1,576,633 6,492,338 District 2 Totals $48,669,336 $14,841,368 $63,510,704 $48,896,716 $14,964,002 $63,860,718
Aitkin $4,479,232 $1,588,098 $6,067,330 $3,710,139 $0 $0 $0 ($11,286) ($3,862) $4,467,946 $1,584,236 $6,052,182Benton 3,295,211 1,477,269 4,772,480 3,710,139 0 0 0 (8,303) (3,592) 3,286,908 1,473,677 4,760,585Cass 5,409,027 1,910,492 7,319,519 3,710,139 0 0 0 (13,629) (4,646) 5,395,398 1,905,846 7,301,244Crow Wing 4,975,298 2,569,028 7,544,326 3,710,139 0 0 0 (12,536) (6,247) 4,962,762 2,562,781 7,525,543Isanti 3,378,730 1,575,287 4,954,017 3,710,139 0 0 0 (8,513) (3,831) 3,370,217 1,571,456 4,941,673Kanabec 3,025,726 1,128,692 4,154,418 3,710,139 0 0 0 (7,624) (2,745) 3,018,102 1,125,947 4,144,049Mille Lacs 3,549,601 1,499,683 5,049,284 3,710,139 0 0 0 (8,944) (3,647) 3,540,657 1,496,036 5,036,693Morrison 5,044,546 1,985,075 7,029,621 3,710,139 0 0 0 (12,711) (4,827) 5,031,835 1,980,248 7,012,083Sherburne 4,172,966 2,647,003 6,819,969 3,710,139 0 0 0 (10,515) (6,437) 4,162,451 2,640,566 6,803,017Stearns 9,661,359 5,517,663 15,179,022 3,710,139 0 0 0 (24,344) (13,418) 9,637,015 5,504,245 15,141,260Todd 4,485,136 1,589,947 6,075,083 3,710,139 0 0 0 (11,301) (3,866) 4,473,835 1,586,081 6,059,916Wadena 3,149,929 1,144,855 4,294,784 3,710,139 0 0 0 (7,937) (2,784) 3,141,992 1,142,071 4,284,063Wright 8,029,184 4,887,877 12,917,061 3,710,139 0 0 0 (20,231) (11,886) 8,008,953 4,875,991 12,884,944 District 3 Totals $62,655,945 $29,520,969 $92,176,914 $62,498,071 $29,449,181 $91,947,252
Becker $5,529,197 $2,171,271 $7,700,468 $3,710,139 $0 $0 $0 ($13,932) ($5,280) $5,515,265 $2,165,991 $7,681,256Big Stone 2,750,747 841,856 3,592,603 3,710,139 0 117,536 117,536 79,924 37,612 2,830,671 879,468 3,710,139Clay 5,111,509 2,254,186 7,365,695 3,710,139 0 0 0 (12,879) (5,482) 5,098,630 2,248,704 7,347,334Douglas 5,789,605 2,601,467 8,391,072 3,710,139 0 0 0 (14,588) (6,326) 5,775,017 2,595,141 8,370,158Grant 2,839,555 865,895 3,705,450 3,710,139 0 4,689 4,689 3,189 1,500 2,842,744 867,395 3,710,139Mahnomen 2,691,616 502,352 3,193,968 3,710,139 531,050 516,171 1,047,221 350,996 165,175 3,042,612 667,527 3,710,139Otter Tail 11,240,182 4,701,478 15,941,660 3,710,139 0 0 0 (28,322) (11,433) 11,211,860 4,690,045 15,901,905Pope 3,640,575 1,222,998 4,863,573 3,710,139 0 0 0 (9,173) (2,974) 3,631,402 1,220,024 4,851,426Stevens 2,989,491 943,928 3,933,419 3,710,139 0 0 0 (7,533) (2,295) 2,981,958 941,633 3,923,591Swift 3,804,679 1,218,475 5,023,154 3,710,139 0 0 0 (9,587) (2,963) 3,795,092 1,215,512 5,010,604Traverse 2,873,172 795,604 3,668,776 3,710,139 0 41,363 41,363 28,127 13,236 2,901,299 808,840 3,710,139Wilkin 3,566,280 1,074,035 4,640,315 3,710,139 0 0 0 (8,986) (2,612) 3,557,294 1,071,423 4,628,717 District 4 Totals $52,826,608 $19,193,545 $72,020,153 $53,183,844 $19,371,703 $72,555,547
Anoka $11,317,433 $8,706,680 $20,024,113 $3,710,139 $0 $0 $0 ($28,516) ($21,173) $11,288,917 $8,685,507 $19,974,424Carver 6,080,265 3,531,667 9,611,932 3,710,139 0 0 0 (15,320) (8,588) 6,064,945 3,523,079 9,588,024Hennepin 24,365,585 21,859,682 46,225,267 3,710,139 0 0 0 (61,394) (53,158) 24,304,191 21,806,524 46,110,715Scott 5,661,895 3,622,842 9,284,737 3,710,139 0 0 0 (14,266) (8,810) 5,647,629 3,614,032 9,261,661 Metro Totals $47,425,178 $37,720,871 $85,146,049 $47,305,682 $37,629,142 $84,934,824
As per the October 2015 Screening Board Resolution:
Screening Board Minimum County AdjustmentJanuary 2020
Further, that an adjustment be made to the money needs such that no county receives a total distribution lass than 0.55% of the statewide total distribution, notwithstanding the minimum apportionment percentages established for specific counties by MN Statute. Said adjustments shall be made to both the apportionment sum and excess sum money needs distribution of the apportionment sum and excess sum, respectfully.
42

Screening Board Minimum County AdjustmentJanuary 2020
Tentative Tentative Tentative Minimum Statutory 0.55% SB Total Apportionment Excess Final Final Final
Apportionment Sum Excess Sum Total Distribution Minimum Minimum Minimum Sum Sum Apportionment Sum Excess Sum Total
County Distribution Distribution Distribution 0.5500% Adjustment Adjustment Adjustment Adjustment Adjustment Distribution Distribution Distribution
Dodge $3,849,349 $1,540,505 $5,389,854 $3,710,139 $0 $0 $0 ($9,699) ($3,746) $3,839,650 $1,536,759 $5,376,409Fillmore 5,647,803 2,225,203 7,873,006 3,710,139 0 0 0 (14,231) (5,411) 5,633,572 2,219,792 7,853,364Freeborn 6,024,658 2,445,062 8,469,720 3,710,139 0 0 0 (15,180) (5,946) 6,009,478 2,439,116 8,448,594Goodhue 5,105,460 2,467,126 7,572,586 3,710,139 0 0 0 (12,864) (5,999) 5,092,596 2,461,127 7,553,723Houston 3,811,276 1,522,140 5,333,416 3,710,139 0 0 0 (9,603) (3,701) 3,801,673 1,518,439 5,320,112Mower 5,457,026 2,353,368 7,810,394 3,710,139 0 0 0 (13,750) (5,723) 5,443,276 2,347,645 7,790,921Olmsted 5,951,614 3,724,885 9,676,499 3,710,139 0 0 0 (14,996) (9,058) 5,936,618 3,715,827 9,652,445Rice 4,742,235 2,438,906 7,181,141 3,710,139 0 0 0 (11,949) (5,931) 4,730,286 2,432,975 7,163,261Steele 4,806,131 2,138,901 6,945,032 3,710,139 0 0 0 (12,110) (5,201) 4,794,021 2,133,700 6,927,721Wabasha 4,103,580 1,702,070 5,805,650 3,710,139 0 0 0 (10,340) (4,139) 4,093,240 1,697,931 5,791,171Winona 4,875,278 2,223,751 7,099,029 3,710,139 0 0 0 (12,284) (5,408) 4,862,994 2,218,343 7,081,337 District 6 Totals $54,374,410 $24,781,917 $79,156,327 $54,237,404 $24,721,654 $78,959,058
Blue Earth $7,615,649 $3,635,690 $11,251,339 $3,710,139 $0 $0 $0 ($19,189) ($8,841) $7,596,460 $3,626,849 $11,223,309Brown 4,498,947 1,874,022 6,372,969 3,710,139 0 0 0 (11,336) (4,557) 4,487,611 1,869,465 6,357,076Cottonwood 3,718,761 1,214,839 4,933,600 3,710,139 0 0 0 (9,370) (2,954) 3,709,391 1,211,885 4,921,276Faribault 5,171,492 2,016,326 7,187,818 3,710,139 0 0 0 (13,031) (4,903) 5,158,461 2,011,423 7,169,884Jackson 5,143,133 1,882,602 7,025,735 3,710,139 0 0 0 (12,959) (4,578) 5,130,174 1,878,024 7,008,198Le Sueur 4,857,693 2,225,385 7,083,078 3,710,139 0 0 0 (12,240) (5,412) 4,845,453 2,219,973 7,065,426Martin 5,214,230 2,036,131 7,250,361 3,710,139 0 0 0 (13,138) (4,951) 5,201,092 2,031,180 7,232,272Nicollet 3,691,129 1,551,991 5,243,120 3,710,139 0 0 0 (9,300) (3,774) 3,681,829 1,548,217 5,230,046Nobles 5,134,977 2,013,530 7,148,507 3,710,139 0 0 0 (12,939) (4,896) 5,122,038 2,008,634 7,130,672Rock 3,660,927 1,281,883 4,942,810 3,710,139 0 0 0 (9,224) (3,117) 3,651,703 1,278,766 4,930,469Sibley 3,994,225 1,486,193 5,480,418 3,710,139 0 0 0 (10,064) (3,614) 3,984,161 1,482,579 5,466,740Waseca 3,960,330 1,551,898 5,512,228 3,710,139 0 0 0 (9,979) (3,774) 3,950,351 1,548,124 5,498,475Watonwan 3,533,473 1,297,861 4,831,334 3,710,139 0 0 0 (8,903) (3,156) 3,524,570 1,294,705 4,819,275 District 7 Totals $60,194,966 $24,068,351 $84,263,317 $60,043,294 $24,009,824 $84,053,118
Chippewa $2,970,199 $978,434 $3,948,633 $3,710,139 $0 $0 $0 ($7,484) ($2,379) $2,962,715 $976,055 $3,938,770Kandiyohi 5,649,797 2,428,638 8,078,435 3,710,139 0 0 0 (14,236) (5,906) 5,635,561 2,422,732 8,058,293Lac Qui Parle 4,035,234 1,225,737 5,260,971 3,710,139 0 0 0 (10,168) (2,981) 4,025,066 1,222,756 5,247,822Lincoln 3,171,905 986,265 4,158,170 3,710,139 0 0 0 (7,992) (2,398) 3,163,913 983,867 4,147,780Lyon 4,141,605 1,612,458 5,754,063 3,710,139 0 0 0 (10,436) (3,921) 4,131,169 1,608,537 5,739,706Mc Leod 4,232,556 2,006,524 6,239,080 3,710,139 0 0 0 (10,665) (4,879) 4,221,891 2,001,645 6,223,536Meeker 3,522,279 1,376,251 4,898,530 3,710,139 0 0 0 (8,875) (3,347) 3,513,404 1,372,904 4,886,308Murray 4,075,187 1,301,847 5,377,034 3,710,139 0 0 0 (10,268) (3,166) 4,064,919 1,298,681 5,363,600Pipestone 3,175,897 1,071,361 4,247,258 3,710,139 0 0 0 (8,002) (2,605) 3,167,895 1,068,756 4,236,651Redwood 4,829,816 1,738,998 6,568,814 3,710,139 0 0 0 (12,170) (4,229) 4,817,646 1,734,769 6,552,415Renville 5,634,335 2,076,412 7,710,747 3,710,139 0 0 0 (14,197) (5,049) 5,620,138 2,071,363 7,691,501Yellow Medicine 4,162,176 1,387,326 5,549,502 3,710,139 0 0 0 (10,487) (3,375) 4,151,689 1,383,951 5,535,640 District 8 Totals $49,600,986 $18,190,251 $67,791,237 $49,476,006 $18,146,016 $67,622,022
Chisago $4,196,129 $2,315,137 $6,511,266 $3,710,139 $0 $0 $0 ($10,573) ($5,631) $4,185,556 $2,309,506 $6,495,062Dakota 11,356,398 9,044,895 20,401,293 3,710,139 0 0 0 (28,614) (21,996) 11,327,784 9,022,899 20,350,683Ramsey 12,157,657 10,110,859 22,268,516 3,710,139 0 0 0 (30,632) (24,588) 12,127,025 10,086,271 22,213,296Washington 6,483,251 5,362,352 11,845,603 3,710,139 0 0 0 (16,335) (13,041) 6,466,916 5,349,311 11,816,227 Metro Totals $34,193,435 $26,833,243 $61,026,678 $34,107,281 $26,767,987 $60,875,268
STATE TOTALS $458,708,058 $215,862,617 $674,570,675 $3,702,239 $1,607,693 $0 $0 $458,708,058 $215,862,617 $674,570,675
43

Final 2019 Final 2019 Final 2019 2020 2020 Total Needs Needs Money Needs Needs 2020
Apportionemnt Excess Needs Apportionemnt Excess Money Needs Difference % ChangeCounty Sum Sum Distribution Sum Sum Distribution 2019-2020 2019-2020
Carlton $2,056,989 $1,183,290 $3,240,279 $2,229,052 $1,281,424 $3,510,476 $270,197 0.0770Cook 1,291,472 726,867 2,018,339 1,429,205 789,871 2,219,076 200,737 0.0905Itasca 3,865,954 2,224,096 6,090,050 3,951,236 2,271,971 6,223,207 133,157 0.0214Koochiching 2,960,471 727,178 3,687,649 3,245,989 1,015,906 4,261,895 574,246 0.1347Lake 1,828,952 1,051,847 2,880,799 1,733,925 997,434 2,731,359 (149,440) -0.0547Pine 3,260,065 1,875,037 5,135,102 3,390,025 1,949,356 5,339,381 204,279 0.0383St. Louis 12,722,011 7,296,069 20,018,080 10,731,436 6,165,810 16,897,246 (3,120,834) -0.1847
Beltrami 2,844,640 1,641,930 4,486,570 3,306,657 1,901,098 5,207,755 721,185 0.1385Clearwater 1,435,570 829,354 2,264,924 1,618,979 932,074 2,551,053 286,129 0.1122Hubbard 1,477,430 853,629 2,331,059 1,748,258 1,005,890 2,754,148 423,089 0.1536Kittson 1,222,683 706,964 1,929,647 1,347,000 776,368 2,123,368 193,721 0.0912Lake of the Woods 1,832,245 417,582 2,249,827 2,005,346 463,166 2,468,512 218,685 0.0886Marshall 1,870,705 1,082,714 2,953,419 2,136,147 1,230,971 3,367,118 413,699 0.1229Norman 1,458,899 843,250 2,302,149 1,657,367 954,623 2,611,990 309,841 0.1186Pennington 961,036 555,632 1,516,668 1,101,264 634,275 1,735,539 218,871 0.1261Polk 2,870,723 1,658,580 4,529,303 3,243,389 1,867,145 5,110,534 581,231 0.1137Red Lake 1,514,628 505,638 2,020,266 1,632,937 581,637 2,214,574 194,308 0.0877Roseau 1,735,263 1,002,918 2,738,181 2,088,400 1,202,327 3,290,727 552,546 0.1679
Aitkin 1,712,045 988,995 2,701,040 2,056,185 1,183,163 3,239,348 538,308 0.1662Benton 1,336,351 770,593 2,106,944 1,414,817 813,483 2,228,300 121,356 0.0545Cass 1,961,825 1,133,966 3,095,791 2,218,787 1,277,081 3,495,868 400,077 0.1144Crow Wing 2,148,613 1,232,657 3,381,270 2,050,963 1,178,497 3,229,460 (151,810) -0.0470Isanti 1,244,135 717,952 1,962,087 1,463,814 841,495 2,305,309 343,222 0.1489Kanabec 1,121,327 648,741 1,770,068 1,398,346 804,484 2,202,830 432,762 0.1965Mille Lacs 1,668,789 958,061 2,626,850 1,582,099 909,839 2,491,938 (134,912) -0.0541Morrison 2,270,240 1,304,943 3,575,183 2,126,733 1,223,520 3,350,253 (224,930) -0.0671Sherburne 1,502,369 864,938 2,367,307 1,670,553 958,737 2,629,290 261,983 0.0996Stearns 4,217,583 2,421,992 6,639,575 4,728,185 2,715,214 7,443,399 803,824 0.1080Todd 1,402,471 812,114 2,214,585 1,881,480 1,082,862 2,964,342 749,757 0.2529Wadena 1,108,132 641,683 1,749,815 1,413,706 813,442 2,227,148 477,333 0.2143Wright 3,931,698 2,256,526 6,188,224 4,431,844 2,544,243 6,976,087 787,863 0.1129
Becker 2,006,565 1,163,162 3,169,727 2,516,587 1,447,600 3,964,187 794,460 0.2004Big Stone 1,224,767 653,505 1,878,272 1,313,253 745,720 2,058,973 180,701 0.0878Clay 2,085,571 1,203,526 3,289,097 2,327,287 1,338,109 3,665,396 376,299 0.1027Douglas 2,282,661 1,321,459 3,604,120 3,074,820 1,767,437 4,842,257 1,238,137 0.2557Grant 1,135,767 639,273 1,775,040 1,236,428 709,556 1,945,984 170,944 0.0878Mahnomen 1,471,679 541,877 2,013,556 1,623,311 583,772 2,207,083 193,527 0.0877Otter Tail 4,554,880 2,638,795 7,193,675 5,930,238 3,409,634 9,339,872 2,146,197 0.2298Pope 1,413,834 817,134 2,230,968 1,665,275 958,399 2,623,674 392,706 0.1497Stevens 1,043,842 602,609 1,646,451 1,281,010 737,513 2,018,523 372,072 0.1843Swift 1,357,125 787,378 2,144,503 1,704,656 981,258 2,685,914 541,411 0.2016Traverse 1,154,121 647,458 1,801,579 1,256,543 718,523 1,975,066 173,487 0.0878Wilkin 1,349,122 779,794 2,128,916 1,580,159 909,785 2,489,944 361,028 0.1450
Anoka 7,247,342 4,140,892 11,388,234 6,192,475 3,550,567 9,743,042 (1,645,192) -0.1689Carver 2,890,177 1,670,911 4,561,088 3,739,421 2,147,171 5,886,592 1,325,504 0.2252Hennepin 14,020,540 8,017,487 22,038,027 12,623,591 7,229,840 19,853,431 (2,184,596) -0.1100Scott 3,855,904 2,203,841 6,059,745 2,793,764 1,603,401 4,397,165 (1,662,580) -0.3781
Dodge 1,856,812 1,068,873 2,925,685 1,981,045 1,139,226 3,120,271 194,586 0.0624Fillmore 2,487,475 1,434,747 3,922,222 3,069,061 1,764,840 4,833,901 911,679 0.1886Freeborn 2,737,105 1,584,874 4,321,979 3,219,145 1,851,020 5,070,165 748,186 0.1476Goodhue 2,400,032 1,383,960 3,783,992 2,665,101 1,531,536 4,196,637 412,645 0.0983Houston 1,846,516 1,064,689 2,911,205 1,984,948 1,141,457 3,126,405 215,200 0.0688Mower 2,481,049 1,434,156 3,915,205 2,925,369 1,681,752 4,607,121 691,916 0.1502Olmsted 2,631,814 1,514,681 4,146,495 2,841,428 1,630,939 4,472,367 325,872 0.0729Rice 2,204,763 1,270,625 3,475,388 2,410,679 1,385,005 3,795,684 320,296 0.0844Steele 2,446,905 1,409,323 3,856,228 2,605,651 1,497,769 4,103,420 247,192 0.0602Wabasha 1,948,029 1,120,846 3,068,875 2,116,381 1,216,903 3,333,284 264,409 0.0793Winona 2,406,699 1,386,171 3,792,870 2,564,673 1,474,135 4,038,808 245,938 0.0609
Blue Earth 3,558,378 2,052,112 5,610,490 4,584,159 2,634,140 7,218,299 1,607,809 0.2227Brown 1,992,119 1,151,907 3,144,026 2,208,693 1,270,058 3,478,751 334,725 0.0962Cottonwood 1,363,734 791,089 2,154,823 1,661,845 956,563 2,618,408 463,585 0.1771Faribault 2,302,338 1,331,694 3,634,032 2,935,046 1,687,715 4,622,761 988,729 0.2139Jackson 2,078,382 1,204,820 3,283,202 2,863,274 1,646,792 4,510,066 1,226,864 0.2720Le Sueur 1,951,010 1,129,844 3,080,854 2,753,596 1,582,574 4,336,170 1,255,316 0.2895Martin 2,574,830 1,486,789 4,061,619 2,786,259 1,602,304 4,388,563 326,944 0.0745Nicollet 1,703,283 979,311 2,682,594 1,813,913 1,043,012 2,856,925 174,331 0.0610Nobles 2,328,035 1,348,904 3,676,939 2,808,303 1,614,901 4,423,204 746,265 0.1687Rock 1,416,976 820,235 2,237,211 1,872,456 1,077,237 2,949,693 712,482 0.2415Sibley 1,428,957 828,545 2,257,502 2,023,540 1,163,966 3,187,506 930,004 0.2918Waseca 1,459,929 846,254 2,306,183 2,064,224 1,187,115 3,251,339 945,156 0.2907Watonwan 1,585,313 917,440 2,502,753 1,854,586 1,066,754 2,921,340 418,587 0.1433
Chippewa 1,054,886 611,908 1,666,794 1,227,916 706,917 1,934,833 268,039 0.1385Kandiyohi 2,448,722 1,412,404 3,861,126 2,742,570 1,576,896 4,319,466 458,340 0.1061Lac qui Parle 1,287,762 747,553 2,035,315 1,815,229 1,045,058 2,860,287 824,972 0.2884Lincoln 1,130,625 656,033 1,786,658 1,448,884 834,058 2,282,942 496,284 0.2174Lyon 1,704,286 985,923 2,690,209 1,956,745 1,125,523 3,082,268 392,059 0.1272Mc Leod 1,787,326 1,030,453 2,817,779 2,197,418 1,262,877 3,460,295 642,516 0.1857Meeker 1,279,596 741,769 2,021,365 1,532,462 881,601 2,414,063 392,698 0.1627Murray 1,531,130 884,439 2,415,569 1,888,888 1,087,222 2,976,110 560,541 0.1884Pipestone 1,230,997 709,285 1,940,282 1,473,921 848,231 2,322,152 381,870 0.1645Redwood 1,979,420 1,147,502 3,126,922 2,396,482 1,378,682 3,775,164 648,242 0.1717Renville 2,159,747 1,252,113 3,411,860 2,949,804 1,696,712 4,646,516 1,234,656 0.2657Yellow Medicine 1,508,646 875,111 2,383,757 1,989,878 1,145,121 3,134,999 751,242 0.2396
Chisago 2,389,930 1,370,128 3,760,058 2,015,718 1,157,749 3,173,467 (586,591) -0.1848Dakota 4,982,766 2,870,183 7,852,949 5,749,333 3,295,373 9,044,706 1,191,757 0.1318Ramsey 6,300,296 3,624,251 9,924,547 6,610,912 3,788,609 10,399,521 474,974 0.0457Washington 3,399,511 1,944,528 5,344,039 2,851,552 1,633,537 4,485,089 (858,950) -0.1915
STATE TOTALS $209,295,340 $118,190,309 $327,485,649 $229,354,029 $129,517,570 $358,871,599 $31,385,950 0.1
Money Needs AdjustmentJanuary 2020
See 'Current Resolutions of the County State Aid Screening Board'
44

Minimum Screening 2020 Statutory Board
Money Needs Minimum MinimumDistribution Adjustment Adjustment AS ES Total AS ES County
$3,317,884 $0 $0 $2,114,912 $1,217,960 $3,332,872 ($114,140) ($63,464) Carlton2,219,076 0 435,923 1,429,205 789,871 2,219,076 0 0 Cook6,235,907 0 0 3,959,353 2,276,554 6,235,907 8,117 4,583 Itasca3,775,968 1,441,289 0 3,245,989 965,592 4,211,581 0 (50,314) Koochiching2,949,794 0 0 1,873,526 1,076,268 2,949,794 139,601 78,834 Lake5,258,088 0 0 3,337,181 1,920,907 5,258,088 (52,844) (28,449) Pine
20,497,513 0 0 13,032,359 7,465,154 20,497,513 2,300,923 1,299,344 St. Louis
4,594,023 0 0 3,137,338 1,806,944 4,944,282 (169,319) (94,154) Beltrami2,319,169 0 0 1,536,078 885,912 2,421,990 (82,901) (46,162) Clearwater2,386,888 0 0 1,658,738 956,072 2,614,810 (89,520) (49,818) Hubbard1,975,862 0 0 1,278,026 737,918 2,015,944 (68,974) (38,450) Kittson2,303,710 1,182,706 0 2,005,346 440,227 2,445,573 0 (22,939) Lake of the Woods3,024,153 0 0 2,026,764 1,170,006 3,196,770 (109,383) (60,965) Marshall2,357,285 0 0 1,572,501 907,344 2,479,845 (84,866) (47,279) Norman1,621,292 0 0 1,044,873 602,862 1,647,735 (56,391) (31,413) Pennington4,637,780 0 0 3,077,310 1,774,673 4,851,983 (166,079) (92,472) Polk2,214,574 547,194 492,011 1,632,937 581,637 2,214,574 0 0 Red Lake2,803,760 0 0 1,981,463 1,142,780 3,124,243 (106,937) (59,547) Roseau
2,765,730 0 0 1,950,897 1,124,565 3,075,462 (105,288) (58,598) Aitkin2,157,405 0 0 1,369,134 788,271 2,157,405 (45,683) (25,212) Benton3,169,935 0 0 2,105,173 1,213,832 3,319,005 (113,614) (63,249) Cass3,462,251 0 0 2,199,739 1,262,512 3,462,251 148,776 84,015 Crow Wing2,009,079 0 0 1,388,859 799,819 2,188,678 (74,955) (41,676) Isanti1,812,461 0 0 1,326,743 764,641 2,091,384 (71,603) (39,843) Kanabec2,689,763 0 0 1,708,529 981,234 2,689,763 126,430 71,395 Mille Lacs3,660,809 0 0 2,325,209 1,335,600 3,660,809 198,476 112,080 Morrison2,424,004 0 0 1,585,012 911,255 2,496,267 (85,541) (47,482) Sherburne6,798,593 0 0 4,486,076 2,580,740 7,066,816 (242,109) (134,474) Stearns2,267,624 0 0 1,785,138 1,029,233 2,814,371 (96,342) (53,629) Todd1,791,723 0 0 1,341,316 773,156 2,114,472 (72,390) (40,286) Wadena6,336,432 0 0 4,204,909 2,418,237 6,623,146 (226,935) (126,006) Wright
3,245,642 0 0 2,387,724 1,375,906 3,763,630 (128,863) (71,694) Becker2,058,973 0 117,536 1,313,253 745,720 2,058,973 0 0 Big Stone3,367,871 0 0 2,208,117 1,271,838 3,479,955 (119,170) (66,271) Clay3,690,439 0 0 2,917,372 1,679,903 4,597,275 (157,448) (87,534) Douglas1,945,984 0 4,689 1,236,428 709,556 1,945,984 0 0 Grant2,207,083 531,050 516,171 1,623,311 583,772 2,207,083 0 0 Mahnomen7,365,964 0 0 5,626,577 3,240,769 8,867,346 (303,661) (168,865) Otter Tail2,284,400 0 0 1,580,004 910,934 2,490,938 (85,271) (47,465) Pope1,805,071 0 0 1,215,415 700,987 1,916,402 (65,595) (36,526) Stevens2,195,864 0 0 1,617,368 932,660 2,550,028 (87,288) (48,598) Swift1,975,066 0 41,363 1,256,543 718,523 1,975,066 0 0 Traverse2,179,904 0 0 1,499,246 864,727 2,363,973 (80,913) (45,058) Wilkin
11,660,982 0 0 7,418,226 4,242,756 11,660,982 1,225,751 692,189 Anoka
4,670,326 0 0 3,547,942 2,040,830 5,588,772 (191,479) (106,341) Carver22,565,838 0 0 14,357,084 8,208,754 22,565,838 1,733,493 978,914 Hennepin
6,204,876 0 0 3,949,068 2,255,808 6,204,876 1,155,304 652,407 Scott
2,995,755 0 0 1,900,949 1,094,806 2,995,755 (80,096) (44,420) Dodge4,016,159 0 0 2,911,908 1,677,434 4,589,342 (157,153) (87,406) Fillmore4,425,490 0 0 3,054,307 1,759,347 4,813,654 (164,838) (91,673) Freeborn3,874,619 0 0 2,528,633 1,455,685 3,984,318 (136,468) (75,851) Goodhue2,980,928 0 0 1,891,455 1,089,473 2,980,928 (93,493) (51,984) Houston4,008,974 0 0 2,775,574 1,598,461 4,374,035 (149,795) (83,291) Mower4,245,804 0 0 2,695,931 1,550,165 4,246,096 (145,497) (80,774) Olmsted3,558,624 0 0 2,287,239 1,316,411 3,603,650 (123,440) (68,594) Rice3,948,585 0 0 2,505,996 1,442,589 3,948,585 (99,655) (55,180) Steele3,142,375 0 0 2,008,010 1,156,635 3,164,645 (108,371) (60,268) Wabasha3,883,709 0 0 2,464,858 1,418,851 3,883,709 (99,815) (55,284) Winona
5,744,861 0 0 4,349,425 2,503,681 6,853,106 (234,734) (130,459) Blue Earth3,219,325 0 0 2,095,596 1,207,157 3,302,753 (113,097) (62,901) Brown2,206,431 0 0 1,576,749 909,188 2,485,937 (85,096) (47,375) Cottonwood3,721,067 0 0 2,784,755 1,604,130 4,388,885 (150,291) (83,585) Faribault3,361,835 0 0 2,716,658 1,565,233 4,281,891 (146,616) (81,559) Jackson3,154,640 0 0 2,612,596 1,504,196 4,116,792 (141,000) (78,378) Le Sueur4,158,895 0 0 2,643,588 1,522,948 4,166,536 (142,671) (79,356) Martin2,746,842 0 0 1,743,082 1,003,760 2,746,842 (70,831) (39,252) Nicollet3,765,002 0 0 2,664,502 1,534,922 4,199,424 (143,801) (79,979) Nobles2,290,792 0 0 1,776,576 1,023,886 2,800,462 (95,880) (53,351) Rock2,311,569 0 0 1,919,924 1,106,319 3,026,243 (103,616) (57,647) Sibley2,361,416 0 0 1,958,525 1,128,322 3,086,847 (105,699) (58,793) Waseca2,562,694 0 0 1,759,621 1,013,922 2,773,543 (94,965) (52,832) Watonwan
1,706,714 0 0 1,165,040 671,906 1,836,946 (62,876) (35,011) Chippewa3,953,600 0 0 2,602,136 1,498,798 4,100,934 (140,434) (78,098) Kandiyohi2,084,061 0 0 1,722,279 993,301 2,715,580 (92,950) (51,757) Lac qui Parle1,845,301 0 0 1,374,693 792,750 2,167,443 (74,191) (41,308) Lincoln2,754,640 0 0 1,856,549 1,069,781 2,926,330 (100,196) (55,742) Lyon2,885,265 0 0 2,084,898 1,200,331 3,285,229 (112,520) (62,546) Mc Leod2,069,777 0 0 1,453,992 837,939 2,291,931 (78,470) (43,662) Meeker2,473,422 0 0 1,792,166 1,033,376 2,825,542 (96,722) (53,846) Murray1,986,752 0 0 1,398,448 806,221 2,204,669 (75,473) (42,010) Pipestone3,201,812 0 0 2,273,769 1,310,402 3,584,171 (122,713) (68,280) Redwood3,493,574 0 0 2,798,758 1,612,680 4,411,438 (151,046) (84,032) Renville2,440,848 0 0 1,887,986 1,088,408 2,976,394 (101,892) (56,713) Yellow Medicine
3,850,111 0 0 2,448,160 1,401,951 3,850,111 432,442 244,202 Chisago8,041,027 0 0 5,454,937 3,132,166 8,587,103 (294,396) (163,207) Dakota
10,162,240 0 0 6,457,147 3,705,094 10,162,241 (153,765) (83,515) Ramsey5,472,029 0 0 3,482,303 1,989,726 5,472,029 630,751 356,189 Washington
$336,370,382 $3,702,239 $1,607,693 $229,354,029 $129,517,570 $358,871,599 $0 $0 STATE TOTALS
Revised Needs ApportionmentTo the Final ComponentsFinal Needs Adjustment
45

Motor Vehicle Lane Mile Money Final Total 40% 60% Money Final Total FinalEqualization Registration (Mileage) Money Needs SB Minimum Needs Money Needs Apportionment Motor Vehicle Money Needs SB Minimum Needs Money Needs Excess 2020 CSAH
County Apportionment Apportionment Apportionment Apportionment Adjustment Adjustment Apportionment Sum Excess Sum Excess Sum Adjustment Adjustment Excess Sum Sum DistributionCarlton $527,251 $359,214 $1,297,960 $2,240,201 ($11,149) ($114,140) $2,114,912 $4,299,337 $676,168 $1,286,196 ($4,772) ($63,464) $1,217,960 $1,894,128 $6,193,465Cook 527,251 64,540 777,785 1,132,777 296,428 0 1,429,205 2,798,781 121,487 650,376 139,495 0 789,871 911,358 3,710,139Itasca 527,251 528,156 2,824,357 3,971,017 (19,781) 8,117 3,959,353 7,839,117 994,177 2,279,933 (7,962) 4,583 2,276,554 3,270,731 11,109,848Koochiching 527,251 161,924 1,109,707 3,245,989 0 0 3,245,989 5,044,871 304,798 1,019,125 (3,219) (50,314) 965,592 1,270,390 6,315,261Lake 527,251 121,374 996,452 1,742,461 (8,536) 139,601 1,873,526 3,518,603 228,469 1,000,422 (2,988) 78,834 1,076,268 1,304,737 4,823,340Pine 527,251 313,481 2,102,718 3,406,024 (15,999) (52,844) 3,337,181 6,280,631 590,082 1,955,546 (6,190) (28,449) 1,920,907 2,510,989 8,791,620St. Louis 527,251 1,814,833 6,085,634 10,779,833 (48,397) 2,300,923 13,032,359 21,460,077 3,416,155 6,189,168 (23,358) 1,299,344 7,465,154 10,881,309 32,341,386 District 1 Totals $3,690,757 $3,363,522 $15,194,613 $26,518,302 $192,566 $2,281,657 $28,992,525 $51,241,417 $6,331,336 $14,380,766 $91,006 $1,240,534 $15,712,306 $22,043,642 $73,285,059
Beltrami $527,251 $402,883 $2,028,820 $3,322,484 ($15,827) ($169,319) $3,137,338 $6,096,292 $758,369 $1,907,581 ($6,483) ($94,154) $1,806,944 $2,565,313 $8,661,605Clearwater 527,251 113,530 1,422,637 1,628,281 (9,302) (82,901) 1,536,078 3,599,496 213,704 934,867 (2,793) (46,162) 885,912 1,099,616 4,699,112Hubbard 527,251 241,418 1,412,729 1,758,184 (9,926) (89,520) 1,658,738 3,840,136 454,434 1,009,450 (3,560) (49,818) 956,072 1,410,506 5,250,642Kittson 527,251 60,412 1,628,368 1,356,000 (9,000) (68,974) 1,278,026 3,494,057 113,716 778,538 (2,170) (38,450) 737,918 851,634 4,345,691Lake of the Woods 527,251 55,595 849,481 2,005,346 0 0 2,005,346 3,437,673 104,650 464,550 (1,384) (22,939) 440,227 544,877 3,982,550Marshall 527,251 124,585 2,788,991 2,150,235 (14,088) (109,383) 2,026,764 5,467,591 234,513 1,234,543 (3,572) (60,965) 1,170,006 1,404,519 6,872,110Norman 527,251 82,797 1,707,082 1,667,407 (10,040) (84,866) 1,572,501 3,889,631 155,853 957,330 (2,707) (47,279) 907,344 1,063,197 4,952,828Pennington 527,251 148,805 1,132,688 1,108,615 (7,351) (56,391) 1,044,873 2,853,617 280,103 636,504 (2,229) (31,413) 602,862 882,965 3,736,582Polk 527,251 330,683 3,513,658 3,262,625 (19,236) (166,079) 3,077,310 7,448,902 622,461 1,873,214 (6,069) (92,472) 1,774,673 2,397,134 9,846,036Red Lake 527,251 54,357 811,638 1,298,370 334,567 0 1,632,937 3,026,183 102,319 424,193 157,444 0 581,637 683,956 3,710,139Roseau 527,251 198,850 2,101,204 2,100,817 (12,417) (106,937) 1,981,463 4,808,768 374,306 1,206,170 (3,843) (59,547) 1,142,780 1,517,086 6,325,854 District 2 Totals $5,799,761 $1,813,915 $19,397,296 $21,658,364 $227,380 ($934,370) $20,951,374 $47,962,346 $3,414,428 $11,426,940 $122,634 ($543,199) $11,006,375 $14,420,803 $62,383,149
Aitkin $527,251 $213,070 $1,671,440 $2,067,471 ($11,286) ($105,288) $1,950,897 $4,362,658 $401,073 $1,187,025 ($3,862) ($58,598) $1,124,565 $1,525,638 $5,888,296Benton 527,251 350,728 994,112 1,423,120 (8,303) (45,683) 1,369,134 3,241,225 660,194 817,075 (3,592) (25,212) 788,271 1,448,465 4,689,690Cass 527,251 334,031 2,315,329 2,232,416 (13,629) (113,614) 2,105,173 5,281,784 628,765 1,281,727 (4,646) (63,249) 1,213,832 1,842,597 7,124,381Crow Wing 527,251 735,401 1,649,147 2,063,499 (12,536) 148,776 2,199,739 5,111,538 1,384,284 1,184,744 (6,247) 84,015 1,262,512 2,646,796 7,758,334Isanti 527,251 387,792 991,360 1,472,327 (8,513) (74,955) 1,388,859 3,295,262 729,961 845,326 (3,831) (41,676) 799,819 1,529,780 4,825,042Kanabec 527,251 170,777 921,728 1,405,970 (7,624) (71,603) 1,326,743 2,946,499 321,463 807,229 (2,745) (39,843) 764,641 1,086,104 4,032,603Mille Lacs 527,251 311,417 1,119,890 1,591,043 (8,944) 126,430 1,708,529 3,667,087 586,197 913,486 (3,647) 71,395 981,234 1,567,431 5,234,518Morrison 527,251 402,012 1,975,839 2,139,444 (12,711) 198,476 2,325,209 5,230,311 756,728 1,228,347 (4,827) 112,080 1,335,600 2,092,328 7,322,639Sherburne 527,251 893,472 1,071,175 1,681,068 (10,515) (85,541) 1,585,012 4,076,910 1,681,829 965,174 (6,437) (47,482) 911,255 2,593,084 6,669,994Stearns 527,251 1,481,673 2,899,906 4,752,529 (24,344) (242,109) 4,486,076 9,394,906 2,789,031 2,728,632 (13,418) (134,474) 2,580,740 5,369,771 14,764,677Todd 527,251 267,335 1,797,769 1,892,781 (11,301) (96,342) 1,785,138 4,377,493 503,219 1,086,728 (3,866) (53,629) 1,029,233 1,532,452 5,909,945Wadena 527,251 174,584 1,026,451 1,421,643 (7,937) (72,390) 1,341,316 3,069,602 328,629 816,226 (2,784) (40,286) 773,156 1,101,785 4,171,387Wright 527,251 1,238,741 1,811,117 4,452,075 (20,231) (226,935) 4,204,909 7,782,018 2,331,748 2,556,129 (11,886) (126,006) 2,418,237 4,749,985 12,532,003 District 3 Totals $6,854,263 $6,961,033 $20,245,263 $28,595,386 ($157,874) ($660,778) $27,776,734 $61,837,293 $13,103,121 $16,417,848 ($71,788) ($362,965) $15,983,095 $29,086,216 $90,923,509
Becker $527,251 $381,645 $2,089,782 $2,530,519 ($13,932) ($128,863) $2,387,724 $5,386,402 $718,391 $1,452,880 ($5,280) ($71,694) $1,375,906 $2,094,297 $7,480,699Big Stone 527,251 71,054 919,113 1,233,329 79,924 0 1,313,253 2,830,671 133,748 708,108 37,612 0 745,720 879,468 3,710,139Clay 527,251 483,754 1,760,338 2,340,166 (12,879) (119,170) 2,208,117 4,979,460 910,595 1,343,591 (5,482) (66,271) 1,271,838 2,182,433 7,161,893Douglas 527,251 439,718 1,733,228 3,089,408 (14,588) (157,448) 2,917,372 5,617,569 827,704 1,773,763 (6,326) (87,534) 1,679,903 2,507,607 8,125,176Grant 527,251 83,852 995,213 1,233,239 3,189 0 1,236,428 2,842,744 157,839 708,056 1,500 0 709,556 867,395 3,710,139Mahnomen 527,251 44,495 847,555 1,272,315 350,996 0 1,623,311 3,042,612 83,755 418,597 165,175 0 583,772 667,527 3,710,139Otter Tail 527,251 680,218 4,074,153 5,958,560 (28,322) (303,661) 5,626,577 10,908,199 1,280,411 3,421,067 (11,433) (168,865) 3,240,769 4,521,180 15,429,379Pope 527,251 138,989 1,299,887 1,674,448 (9,173) (85,271) 1,580,004 3,546,131 261,625 961,373 (2,974) (47,465) 910,934 1,172,559 4,718,690Stevens 527,251 108,439 1,065,258 1,288,543 (7,533) (65,595) 1,215,415 2,916,363 204,120 739,808 (2,295) (36,526) 700,987 905,107 3,821,470Swift 527,251 124,447 1,438,738 1,714,243 (9,587) (87,288) 1,617,368 3,707,804 234,254 984,221 (2,963) (48,598) 932,660 1,166,914 4,874,718Traverse 527,251 47,981 1,069,524 1,228,416 28,127 0 1,256,543 2,901,299 90,317 705,287 13,236 0 718,523 808,840 3,710,139Wilkin 527,251 85,870 1,364,014 1,589,145 (8,986) (80,913) 1,499,246 3,476,381 161,638 912,397 (2,612) (45,058) 864,727 1,026,365 4,502,746 District 4 Totals $6,327,012 $2,690,462 $18,656,803 $25,152,331 $357,236 ($1,028,209) $24,481,358 $52,155,635 $5,064,397 $14,129,148 $178,158 ($572,011) $13,735,295 $18,799,692 $70,955,327
Anoka $527,251 $2,727,937 $1,841,254 $6,220,991 ($28,516) $1,225,751 $7,418,226 $12,514,668 $5,134,940 $3,571,740 ($21,173) $692,189 $4,242,756 $9,377,696 $21,892,364Carver 527,251 730,951 1,067,322 3,754,741 (15,320) (191,479) 3,547,942 5,873,466 1,375,908 2,155,759 (8,588) (106,341) 2,040,830 3,416,738 9,290,204Hennepin 527,251 7,743,864 3,409,485 12,684,985 (61,394) 1,733,493 14,357,084 26,037,684 14,576,684 7,282,998 (53,158) 978,914 8,208,754 22,785,438 48,823,122Scott 527,251 1,068,148 1,258,466 2,808,030 (14,266) 1,155,304 3,949,068 6,802,933 2,010,631 1,612,211 (8,810) 652,407 2,255,808 4,266,439 11,069,372 Metro Totals $2,109,004 $12,270,900 $7,576,527 $25,468,747 ($119,496) $3,923,069 $29,272,320 $51,228,751 $23,098,163 $14,622,708 ($91,729) $2,217,169 $16,748,148 $39,846,311 $91,075,062
Final Components of the 2020 DistributionJanuary 2020
46

Motor Vehicle Lane Mile Money Final Total 40% 60% Money Final Total FinalEqualization Registration (Mileage) Money Needs SB Minimum Needs Money Needs Apportionment Motor Vehicle Money Needs SB Minimum Needs Money Needs Excess 2020 CSAH
County Apportionment Apportionment Apportionment Apportionment Adjustment Adjustment Apportionment Sum Excess Sum Excess Sum Adjustment Adjustment Excess Sum Sum Distribution
Final Components of the 2020 DistributionJanuary 2020
Dodge $527,251 $211,189 $1,120,165 $1,990,744 ($9,699) ($80,096) $1,900,949 $3,759,554 $397,533 $1,142,972 ($3,746) ($44,420) $1,094,806 $1,492,339 $5,251,893Fillmore 527,251 241,693 1,795,567 3,083,292 (14,231) (157,153) 2,911,908 5,476,419 454,952 1,770,251 (5,411) (87,406) 1,677,434 2,132,386 7,608,805Freeborn 527,251 312,426 1,950,656 3,234,325 (15,180) (164,838) 3,054,307 5,844,640 588,096 1,856,966 (5,946) (91,673) 1,759,347 2,347,443 8,192,083Goodhue 527,251 493,845 1,406,399 2,677,965 (12,864) (136,468) 2,528,633 4,956,128 929,591 1,537,535 (5,999) (75,851) 1,455,685 2,385,276 7,341,404Houston 527,251 200,272 1,089,202 1,994,551 (9,603) (93,493) 1,891,455 3,708,180 376,982 1,145,158 (3,701) (51,984) 1,089,473 1,466,455 5,174,635Mower 527,251 353,756 1,636,900 2,939,119 (13,750) (149,795) 2,775,574 5,293,481 665,893 1,687,475 (5,723) (83,291) 1,598,461 2,264,354 7,557,835Olmsted 527,251 1,107,596 1,460,343 2,856,424 (14,996) (145,497) 2,695,931 5,791,121 2,084,888 1,639,997 (9,058) (80,774) 1,550,165 3,635,053 9,426,174Rice 527,251 556,734 1,235,622 2,422,628 (11,949) (123,440) 2,287,239 4,606,846 1,047,970 1,390,936 (5,931) (68,594) 1,316,411 2,364,381 6,971,227Steele 527,251 337,838 1,323,281 2,617,761 (12,110) (99,655) 2,505,996 4,694,366 635,931 1,502,970 (5,201) (55,180) 1,442,589 2,078,520 6,772,886Wabasha 527,250 255,546 1,194,063 2,126,721 (10,340) (108,371) 2,008,010 3,984,869 481,028 1,221,042 (4,139) (60,268) 1,156,635 1,637,663 5,622,532Winona 527,250 395,360 1,375,711 2,576,957 (12,284) (99,815) 2,464,858 4,763,179 744,208 1,479,543 (5,408) (55,284) 1,418,851 2,163,059 6,926,238 District 6 Totals $5,799,759 $4,466,255 $15,587,909 $28,520,487 ($137,006) ($1,358,621) $27,024,860 $52,878,783 $8,407,072 $16,374,845 ($60,263) ($754,725) $15,559,857 $23,966,929 $76,845,712
Blue Earth $527,250 $527,377 $1,957,674 $4,603,348 ($19,189) ($234,734) $4,349,425 $7,361,726 $992,709 $2,642,981 ($8,841) ($130,459) $2,503,681 $3,496,390 $10,858,116Brown 527,250 318,435 1,433,233 2,220,029 (11,336) (113,097) 2,095,596 4,374,514 599,407 1,274,615 (4,557) (62,901) 1,207,157 1,806,564 6,181,078Cottonwood 527,250 135,640 1,384,656 1,671,215 (9,370) (85,096) 1,576,749 3,624,295 255,322 959,517 (2,954) (47,375) 909,188 1,164,510 4,788,805Faribault 527,250 171,970 1,524,195 2,948,077 (13,031) (150,291) 2,784,755 5,008,170 323,708 1,692,618 (4,903) (83,585) 1,604,130 1,927,838 6,936,008Jackson 527,250 122,842 1,616,808 2,876,233 (12,959) (146,616) 2,716,658 4,983,558 231,232 1,651,370 (4,578) (81,559) 1,565,233 1,796,465 6,780,023Le Sueur 527,250 338,618 1,225,989 2,765,836 (12,240) (141,000) 2,612,596 4,704,453 637,399 1,587,986 (5,412) (78,378) 1,504,196 2,141,595 6,846,048Martin 527,250 227,840 1,659,743 2,799,397 (13,138) (142,671) 2,643,588 5,058,421 428,876 1,607,255 (4,951) (79,356) 1,522,948 1,951,824 7,010,245Nicollet 527,250 268,390 1,072,276 1,823,213 (9,300) (70,831) 1,743,082 3,610,998 505,205 1,046,786 (3,774) (39,252) 1,003,760 1,508,965 5,119,963Nobles 527,250 209,171 1,577,314 2,821,242 (12,939) (143,801) 2,664,502 4,978,237 393,733 1,619,797 (4,896) (79,979) 1,534,922 1,928,655 6,906,892Rock 527,250 107,062 1,144,935 1,881,680 (9,224) (95,880) 1,776,576 3,555,823 201,529 1,080,354 (3,117) (53,351) 1,023,886 1,225,415 4,781,238Sibley 527,250 169,263 1,264,108 2,033,604 (10,064) (103,616) 1,919,924 3,880,545 318,613 1,167,580 (3,614) (57,647) 1,106,319 1,424,932 5,305,477Waseca 527,250 191,786 1,167,091 2,074,203 (9,979) (105,699) 1,958,525 3,844,652 361,009 1,190,889 (3,774) (58,793) 1,128,322 1,489,331 5,333,983Watonwan 527,250 121,099 1,021,635 1,863,489 (8,903) (94,965) 1,759,621 3,429,605 227,951 1,069,910 (3,156) (52,832) 1,013,922 1,241,873 4,671,478 District 7 Totals $6,854,250 $2,909,493 $18,049,657 $32,381,566 ($151,672) ($1,628,297) $30,601,597 $58,414,997 $5,476,693 $18,591,658 ($58,527) ($905,467) $17,627,664 $23,104,357 $81,519,354
Chippewa $527,250 $142,979 $1,064,570 $1,235,400 ($7,484) ($62,876) $1,165,040 $2,899,839 $269,138 $709,296 ($2,379) ($35,011) $671,906 $941,044 $3,840,883Kandiyohi 527,250 449,350 1,916,391 2,756,806 (14,236) (140,434) 2,602,136 5,495,127 845,836 1,582,802 (5,906) (78,098) 1,498,798 2,344,634 7,839,761Lac Qui Parle 527,250 94,402 1,588,185 1,825,397 (10,168) (92,950) 1,722,279 3,932,116 177,698 1,048,039 (2,981) (51,757) 993,301 1,170,999 5,103,115Lincoln 527,250 79,586 1,108,193 1,456,876 (7,992) (74,191) 1,374,693 3,089,722 149,809 836,456 (2,398) (41,308) 792,750 942,559 4,032,281Lyon 527,250 256,601 1,390,573 1,967,181 (10,436) (100,196) 1,856,549 4,030,973 483,014 1,129,444 (3,921) (55,742) 1,069,781 1,552,795 5,583,768Mc Leod 527,250 392,471 1,104,752 2,208,083 (10,665) (112,520) 2,084,898 4,109,371 738,768 1,267,756 (4,879) (62,546) 1,200,331 1,939,099 6,048,470Meeker 527,250 261,005 1,192,687 1,541,337 (8,875) (78,470) 1,453,992 3,434,934 491,303 884,948 (3,347) (43,662) 837,939 1,329,242 4,764,176Murray 527,250 112,338 1,536,443 1,899,156 (10,268) (96,722) 1,792,166 3,968,197 211,459 1,090,388 (3,166) (53,846) 1,033,376 1,244,835 5,213,032Pipestone 527,250 117,154 1,049,570 1,481,923 (8,002) (75,473) 1,398,448 3,092,422 220,525 850,836 (2,605) (42,010) 806,221 1,026,746 4,119,168Redwood 527,250 189,171 1,704,743 2,408,652 (12,170) (122,713) 2,273,769 4,694,933 356,087 1,382,911 (4,229) (68,280) 1,310,402 1,666,489 6,361,422Renville 527,250 199,033 1,944,051 2,964,001 (14,197) (151,046) 2,798,758 5,469,092 374,651 1,701,761 (5,049) (84,032) 1,612,680 1,987,331 7,456,423Yellow Medicine 527,250 126,879 1,507,682 2,000,365 (10,487) (101,892) 1,887,986 4,049,797 238,830 1,148,496 (3,375) (56,713) 1,088,408 1,327,238 5,377,035 District 8 Totals $6,327,000 $2,420,969 $17,107,840 $23,745,177 ($124,980) ($1,209,483) $22,410,714 $48,266,523 $4,557,118 $13,633,133 ($44,235) ($673,005) $12,915,893 $17,473,011 $65,739,534
Chisago $527,250 $611,871 $1,030,717 $2,026,291 ($10,573) $432,442 $2,448,160 $4,617,998 $1,151,757 $1,163,380 ($5,631) $244,202 $1,401,951 $2,553,708 $7,171,706Dakota 527,250 3,042,748 2,008,453 5,777,947 ($28,614) (294,396) 5,454,937 11,033,388 5,727,526 3,317,369 (21,996) (163,207) 3,132,166 8,859,692 19,893,080Ramsey 527,250 3,345,633 1,643,230 6,641,544 ($30,632) (153,765) 6,457,147 $11,973,260 6,297,662 3,813,197 (24,588) (83,515) 3,705,094 10,002,756 21,976,016Washington 527,250 1,974,005 1,114,109 2,867,887 ($16,335) 630,751 3,482,303 7,097,667 3,715,774 1,646,578 (13,041) 356,189 1,989,726 5,705,500 12,803,167 Metro Totals $2,109,000 $8,974,257 $5,796,509 $17,313,669 ($86,154) $615,032 $17,842,547 $34,722,313 $16,892,719 $9,940,524 ($65,256) $353,669 $10,228,937 $27,121,656 $61,843,969
STATE TOTALS $45,870,806 $45,870,806 $137,612,417 $229,354,029 $0 $0 $229,354,029 $458,708,058 $86,345,047 $129,517,570 $0 $0 $129,517,570 $215,862,617 $674,570,675
47

NOTES and COMMENTS
48

49

Increase2019 CSAH 2020 CSAH or %
County Distribution Distribution Decrease + or -Carlton $5,850,567 $6,193,465 $342,898 5.9%Cook 3,385,660 3,710,139 324,479 9.6%Itasca 10,539,739 11,109,848 570,109 5.4%Koochiching 5,608,979 6,315,261 706,282 12.6%Lake 4,588,229 4,823,340 235,111 5.1%Pine 8,360,982 8,791,620 430,638 5.2%St. Louis 30,835,794 32,341,386 1,505,592 4.9% District 1 Totals $69,169,950 $73,285,059 $4,115,109 6.0%
Beltrami $7,876,279 $8,661,605 $785,326 10.0%Clearwater 4,343,900 4,699,112 355,212 8.2%Hubbard 4,737,498 5,250,642 513,144 10.8%Kittson 4,056,770 4,345,691 288,921 7.1%Lake of the Woods 3,653,013 3,982,550 329,537 9.0%Marshall 6,309,211 6,872,110 562,899 8.9%Norman 4,560,107 4,952,828 392,721 8.6%Pennington 3,423,709 3,736,582 312,873 9.1%Polk 9,089,101 9,846,036 756,935 8.3%Red Lake 3,385,660 3,710,139 324,479 9.6%Roseau 5,661,541 6,325,854 664,313 11.7% District 2 Totals $57,096,789 $62,383,149 $5,286,360 9.3%
Aitkin $5,269,006 $5,888,296 $619,290 11.8%Benton 4,418,515 4,689,690 271,175 6.1%Cass 6,569,992 7,124,381 554,389 8.4%Crow Wing 7,304,392 7,758,334 453,942 6.2%Isanti 4,368,636 4,825,042 456,406 10.5%Kanabec 3,542,020 4,032,603 490,583 13.9%Mille Lacs 4,949,800 5,234,518 284,718 5.8%Morrison 6,918,261 7,322,639 404,378 5.9%Sherburne 6,176,884 6,669,994 493,110 8.0%Stearns 13,666,216 14,764,677 1,098,461 8.0%Todd 5,040,810 5,909,945 869,135 17.2%Wadena 3,627,592 4,171,387 543,795 15.0%Wright 11,581,690 12,532,003 950,313 8.2% District 3 Totals $83,433,814 $90,923,509 $7,489,695 9.0%
Becker $6,563,338 $7,480,699 $917,361 14.0%Big Stone 3,385,660 3,710,139 324,479 9.6%Clay 6,650,278 7,161,893 511,615 7.7%Douglas 6,824,615 8,125,176 1,300,561 19.1%Grant 3,385,660 3,710,139 324,479 9.6%Mahnomen 3,385,660 3,710,139 324,479 9.6%Otter Tail 13,184,578 15,429,379 2,244,801 17.0%Pope 4,264,765 4,718,690 453,925 10.6%Stevens 3,385,660 3,821,470 435,810 12.9%Swift 4,267,013 4,874,718 607,705 14.2%Traverse 3,385,660 3,710,139 324,479 9.6%Wilkin 4,081,643 4,502,746 421,103 10.3% District 4 Totals $62,764,530 $70,955,327 $8,190,797 13.1%
Anoka $20,708,748 $21,892,364 $1,183,616 5.7%Carver 7,921,604 9,290,204 1,368,600 17.3%Hennepin 46,024,095 48,823,122 2,799,027 6.1%Scott 10,499,684 11,069,372 569,688 5.4% Metro Totals $85,154,131 $91,075,062 $5,920,931 7.0%
Comparison of the 2019 to the 2020 CSAH DistributionJanaury 2020
50

Increase2019 CSAH 2020 CSAH or %
County Distribution Distribution Decrease + or -
Comparison of the 2019 to the 2020 CSAH DistributionJanaury 2020
Dodge $4,985,260 $5,251,893 $266,633 5.4%Fillmore 6,678,866 7,608,805 929,939 13.9%Freeborn 7,406,321 8,192,083 785,762 10.6%Goodhue 6,848,360 7,341,404 493,044 7.2%Houston 4,913,931 5,174,635 260,704 5.3%Mower 6,821,688 7,557,835 736,147 10.8%Olmsted 8,870,909 9,426,174 555,265 6.3%Rice 6,548,716 6,971,227 422,511 6.5%Steele 6,434,282 6,772,886 338,604 5.3%Wabasha 5,312,682 5,622,532 309,850 5.8%Winona 6,570,193 6,926,238 356,045 5.4% District 6 Totals $71,391,208 $76,845,712 $5,454,504 7.6%
Blue Earth $9,257,819 $10,858,116 $1,600,297 17.3%Brown 5,771,626 6,181,078 409,452 7.1%Cottonwood 4,257,292 4,788,805 531,513 12.5%Faribault 5,959,520 6,936,008 976,488 16.4%Jackson 5,564,110 6,780,023 1,215,913 21.9%Le Sueur 5,512,647 6,846,048 1,333,401 24.2%Martin 6,657,639 7,010,245 352,606 5.3%Nicollet 4,848,173 5,119,963 271,790 5.6%Nobles 6,149,251 6,906,892 757,641 12.3%Rock 4,045,633 4,781,238 735,605 18.2%Sibley 4,338,038 5,305,477 967,439 22.3%Waseca 4,357,669 5,333,983 976,314 22.4%Watonwan 4,235,453 4,671,478 436,025 10.3% District 7 Totals $70,954,870 $81,519,354 $10,564,484 14.9%
Chippewa $3,496,105 $3,840,883 $344,778 9.9%Kandiyohi 7,274,346 7,839,761 565,415 7.8%Lac Qui Parle 4,209,898 5,103,115 893,217 21.2%Lincoln 3,489,406 4,032,281 542,875 15.6%Lyon 5,115,487 5,583,768 468,281 9.2%Mc Leod 5,340,228 6,048,470 708,242 13.3%Meeker 4,278,273 4,764,176 485,903 11.4%Murray 4,595,385 5,213,032 617,647 13.4%Pipestone 3,689,479 4,119,168 429,689 11.7%Redwood 5,662,538 6,361,422 698,884 12.3%Renville 6,191,920 7,456,423 1,264,503 20.4%Yellow Medicine 4,575,574 5,377,035 801,461 17.5% District 8 Totals $57,918,639 $65,739,534 $7,820,895 13.5%
Chisago $6,791,787 $7,171,706 $379,919 5.6%Dakota 18,157,382 19,893,080 1,735,698 9.6%Ramsey 20,713,555 21,976,016 1,262,461 6.1%Washington 12,027,873 12,803,167 775,294 6.5% Metro Totals $57,690,597 $61,843,969 $4,153,372 7.2%
STATE TOTALS $615,574,528 $674,570,675 $58,996,147 9.6%
51

2020 CSAH Distribution Earnings January 2020
Each county receives $527,251 in equalization
Each motor vehicle registered earns $18.41
Each lane mile of CSAH earns $2,180
$1,000 in adjusted money needs earns about $19.19
52

Adjusted Money Distribution25 Year Needs Per $1000 of
Year Mileage Const. Needs Distribution Adjusted Needs1967 29,518.48 956,436,709 $19,528,261 $20.421968 29,614.63 920,824,895 22,622,474 24.57
1970 29,732.84 871,363,426 25,624,296 29.411971 29,763.66 872,716,257 28,153,312 32.261972 29,814.83 985,471,441 28,289,691 28.711973 29,806.67 1,154,838,282 28,333,195 24.531974 29,807.37 1,220,436,874 33,778,141 27.671975 29,857.90 1,596,084,465 34,730,323 21.761976 29,905.06 1,853,364,975 34,446,369 18.581977 29,929.57 1,995,381,940 42,110,691 21.101978 29,952.03 1,863,226,307 43,000,577 23.071979 30,008.47 1,934,116,556 46,741,003 24.17
1980 30,008.25 2,193,295,678 50,290,596 22.931981 30,072.55 2,492,190,699 52,001,896 20.87 1982 30,086.79 2,910,643,326 61,454,539 21.111983 30,084.16 3,171,578,527 63,655,086 20.071984 30,087.24 3,315,431,920 71,848,183 21.671985 30,089.03 3,742,822,880 85,566,885 22.861986 30,095.37 4,658,153,549 88,206,498 18.941987 30,095.26 4,595,651,198 84,588,456 18.411988 30,101.37 4,547,152,346 88,528,717 19.471989 30,119.91 4,752,045,566 112,048,340 23.58
1990 30,139.52 4,710,965,075 117,502,985 24.941991 30,144.88 4,927,846,604 114,216,993 23.181992 30,142.84 5,010,500,884 122,385,406 24.431993 30,130.03 5,358,303,906 122,276,603 22.821994 30,149.73 5,549,564,545 122,789,429 22.131995 30,200.17 5,738,251,809 124,963,096 21.781996 30,212.15 5,926,763,133 139,191,538 23.491997 30,272.41 6,341,979,229 140,412,086 22.141998 30,289.09 6,483,139,948 146,755,383 22.641999 30,322.88 6,989,213,942 155,427,142 22.24
2000 30,328.79 7,054,661,571 163,903,386 23.232001 30,356.26 7,372,660,405 171,039,754 23.192002 30,365.98 7,649,465,287 178,117,612 23.282003 30,386.86 8,034,749,831 167,823,257 20.892004 30,401.58 8,690,667,118 179,230,659 20.622005 30,427.62 9,117,963,299 179,300,922 19.662006 30,481.85 9,680,839,334 178,194,630 18.412007 30,506.59 10,688,558,772 180,378,728 16.88 2008 30,540.10 11,995,607,602 181,937,437 15.172009 30,545.95 12,168,327,832 196,760,563 16.17
2010 30,547.47 12,981,598,589 211,637,680 16.302011 30,567.28 13,422,552,370 229,873,841 17.132012 30,604.27 13,775,039,351 248,487,504 18.042013 30,609.08 13,621,117,681 254,926,487 18.722014 30,685.92 13,618,759,197 264,840,208 19.452015 30,705.87 13,620,457,545 280,458,025 20.592016 30,707.68 17,566,292,721 294,039,918 16.742017 30,741.82 18,181,295,089 295,537,491 16.262018 30,739.00 18,404,919,044 325,533,347 17.692019 30,739.00 18,417,370,310 327,485,649 17.78
2020 30,759.67 18,704,552,411 358,871,599 19.19
Money Needs DistributionEarned per $1,000 of Adjusted Needs
January 2020
53

Regular Account, Municipal Account, Total County State Aid Distribution and Percentage
January 2020
Pursuant to Minnesota Statutes, Chapter 162.08, Subdivision 1, this reads as follows:
162.08 ALLOCATION OF APPORTIONMENTS
Subdivision 1.Allocation for cities having less than 5,000 population. Upon determining the sum of money to be apportioned to each county as hereinbefore provided, the
commissioner shall allocate a percentage of such sum for expenditure solely on those portions of each county's county state-aid highways located within cities having a population of less than 5,000, according to the last federal decennial census, or, if incorporated during the ten-year period between federal decennial censuses, according to their incorporation census. The percentage so allocated shall equal the percentage that the total needs of the county state-aid highway system in such cities bears to the total county state-aid highway needs in each county. Money so allocated shall be set apart and credited to the municipal account of each county
54

2020 2020 Total TotalTotal Regular Total Municipal 2019 Final CSAH
Regular Distribution Municipal Distribution CSAH 2020 Distribution County Needs % Account Needs % Account Needs Distribution Percentage CountyCarlton $155,199,405 88.72% $5,494,842 8 $19,731,300 11.28% $698,623 $174,930,705 $6,193,465 0.91813% CarltonCook 80,799,792 90.75% 3,366,951 1 8,237,121 9.25% 343,188 89,036,913 3,710,139 0.55000% CookItasca 274,782,496 88.14% 9,792,220 13 36,980,963 11.86% 1,317,628 311,763,459 11,109,848 1.64695% ItascaKoochiching 123,863,803 92.48% 5,840,353 5 10,074,757 7.52% 474,908 133,938,560 6,315,261 0.93619% KoochichingLake 115,875,210 86.35% 4,164,954 3 18,317,006 13.65% 658,386 134,192,216 4,823,340 0.71502% LakePine 214,485,643 82.59% 7,260,999 14 45,204,162 17.41% 1,530,621 259,689,805 8,791,620 1.30329% PineSt. Louis 701,492,200 84.67% 27,383,452 21 126,978,390 15.33% 4,957,934 828,470,590 32,341,386 4.79437% St. Louis District 1 Totals $1,666,498,549 86.26% $63,303,771 65 $265,523,699 13.74% $9,981,288 $1,932,022,248 $73,285,059 10.86396% District 1 Totals
Beltrami $247,652,829 96.69% $8,374,906 6 $8,486,214 3.31% $286,699 $256,139,043 $8,661,605 1.28402% BeltramiClearwater 112,595,584 91.31% 4,290,759 5 10,714,198 8.69% 408,353 123,309,782 4,699,112 0.69661% ClearwaterHubbard 133,029,683 93.65% 4,917,226 4 9,027,327 6.35% 333,416 142,057,010 5,250,642 0.77837% HubbardKittson 93,883,134 89.79% 3,901,996 8 10,678,635 10.21% 443,695 104,561,769 4,345,691 0.64422% KittsonLake of the Woods 55,323,009 91.75% 3,653,990 2 4,977,362 8.25% 328,560 60,300,371 3,982,550 0.59038% Lake of WoodsMarshall 152,359,758 91.45% 6,284,545 11 14,236,379 8.55% 587,565 166,596,137 6,872,110 1.01874% MarshallNorman 118,925,815 92.37% 4,574,927 8 9,824,834 7.63% 377,901 128,750,649 4,952,828 0.73422% NormanPennington 85,191,383 98.03% 3,662,971 2 1,713,289 1.97% 73,611 86,904,672 3,736,582 0.55392% PenningtonPolk 239,516,461 92.12% 9,070,168 13 20,479,007 7.88% 775,868 259,995,468 9,846,036 1.45960% PolkRed Lake 50,107,500 88.38% 3,279,021 4 6,588,701 11.62% 431,118 56,696,201 3,710,139 0.55000% Red LakeRoseau 144,268,668 90.73% 5,739,447 6 14,737,332 9.27% 586,407 159,006,000 6,325,854 0.93776% Roseau District 2 Totals $1,432,853,824 92.78% $57,749,956 69 $111,463,278 7.22% $4,633,193 $1,544,317,102 $62,383,149 9.24783% District 2 Totals
Aitkin $153,742,322 94.64% $5,572,683 6 $8,708,260 5.36% $315,613 $162,450,582 $5,888,296 0.87290% AitkinBenton 106,576,650 91.86% 4,307,949 3 9,442,129 8.14% 381,741 116,018,779 4,689,690 0.69521% BentonCass 170,254,991 89.71% 6,391,282 13 19,518,826 10.29% 733,099 189,773,817 7,124,381 1.05614% CassCrow Wing 151,318,796 78.70% 6,105,809 14 40,945,636 21.30% 1,652,525 192,264,432 7,758,334 1.15011% Crow WingIsanti 118,912,237 98.49% 4,752,184 1 1,826,629 1.51% 72,858 120,738,866 4,825,042 0.71528% IsantiKanabec 100,598,186 93.28% 3,761,612 4 7,244,166 6.72% 270,991 107,842,352 4,032,603 0.59780% KanabecMille Lacs 109,538,877 87.83% 4,597,477 8 15,176,154 12.17% 637,041 124,715,031 5,234,518 0.77598% Mille LacsMorrison 154,057,485 90.41% 6,620,398 13 16,347,558 9.59% 702,241 170,405,043 7,322,639 1.08553% MorrisonSherburne 147,154,889 93.36% 6,227,106 2 10,467,416 6.64% 442,888 157,622,305 6,669,994 0.98878% SherburneStearns 347,049,800 85.85% 12,675,475 27 57,217,840 14.15% 2,089,202 404,267,640 14,764,677 2.18875% StearnsTodd 139,307,468 92.17% 5,447,196 12 11,837,936 7.83% 462,749 151,145,404 5,909,945 0.87611% ToddWadena 91,970,767 85.01% 3,546,096 7 16,222,242 14.99% 625,291 108,193,009 4,171,387 0.61838% WadenaWright 350,797,301 91.16% 11,424,174 10 34,018,266 8.84% 1,107,829 384,815,567 12,532,003 1.85778% Wright District 3 Totals $2,141,279,769 89.58% $81,429,441 120 $248,973,058 10.42% $9,494,068 $2,390,252,827 $90,923,509 13.47872% District 3 Totals
CSAH's
Regular Account, Municipal Account, Total County State Aid Apportionment Fund & Distribution PrecentageJanauary 2020
# of Munic.Under 5,000
Pop. With
55

2020 2020 Total TotalTotal Regular Total Municipal 2019 Final CSAH
Regular Distribution Municipal Distribution CSAH 2020 Distribution County Needs % Account Needs % Account Needs Distribution Percentage CountyCSAH's
Regular Account, Municipal Account, Total County State Aid Apportionment Fund & Distribution PrecentageJanauary 2020
# of Munic.Under 5,000
Pop. With
Becker $195,459,144 94.25% $7,050,559 6 $11,927,884 5.75% $430,140 $207,387,028 $7,480,699 1.10896% BeckerBig Stone 80,332,725 83.80% 3,109,096 8 15,528,670 16.20% 601,043 95,861,395 3,710,139 0.55000% Big StoneClay 181,920,203 92.42% 6,619,022 10 14,917,664 7.58% 542,871 196,837,867 7,161,893 1.06170% ClayDouglas 223,097,470 89.91% 7,305,346 10 25,027,721 10.09% 819,830 248,125,191 8,125,176 1.20450% DouglasGrant 87,353,887 89.65% 3,326,140 7 10,086,461 10.35% 383,999 97,440,348 3,710,139 0.55000% GrantMahnomen 51,906,890 92.67% 3,438,186 3 4,105,066 7.33% 271,953 56,011,956 3,710,139 0.55000% MahnomenOtter Tail 440,727,524 92.87% 14,329,264 20 33,834,371 7.13% 1,100,115 474,561,895 15,429,379 2.28729% Otter TailPope 120,849,668 91.86% 4,334,589 9 10,710,753 8.14% 384,101 131,560,421 4,718,690 0.69951% PopeStevens 96,013,502 92.95% 3,552,056 4 7,287,161 7.05% 269,414 103,300,663 3,821,470 0.56650% StevensSwift 124,895,690 91.59% 4,464,754 8 11,464,195 8.41% 409,964 136,359,885 4,874,718 0.72264% SwiftTraverse 88,681,422 91.04% 3,377,711 4 8,732,366 8.96% 332,428 97,413,788 3,710,139 0.55000% TraverseWilkin 109,467,914 87.92% 3,958,814 7 15,046,872 12.08% 543,932 124,514,786 4,502,746 0.66750% Wilkin District 4 Totals $1,800,706,039 91.44% $64,865,537 96 $168,669,184 8.56% $6,089,790 $1,969,375,223 $70,955,327 10.51859% District 4 Totals
Anoka $487,177,604 91.35% $19,998,675 6 $46,150,900 8.65% $1,893,689 $533,328,504 $21,892,364 3.24538% AnokaCarver 286,478,392 86.87% 8,070,400 7 43,304,577 13.13% 1,219,804 329,782,969 9,290,204 1.37720% CarverHennepin 1,256,975,356 93.45% 45,625,208 16 88,088,727 6.55% 3,197,914 1,345,064,083 48,823,122 7.23766% HennepinScott 269,260,593 97.48% 10,790,424 1 6,954,660 2.52% 278,948 276,215,253 11,069,372 1.64095% Scott District 5 Totals $2,299,891,945 92.57% $84,484,707 30 $184,498,864 7.43% $6,590,355 $2,484,390,809 $91,075,062 13.50119% District 5 Totals
Dodge $143,867,672 91.32% $4,796,029 5 $13,671,103 8.68% $455,864 $157,538,775 $5,251,893 0.77855% DodgeFillmore 207,651,560 86.33% 6,568,681 14 32,883,479 13.67% 1,040,124 240,535,039 7,608,805 1.12795% FillmoreFreeborn 234,037,760 92.74% 7,597,338 13 18,327,924 7.26% 594,745 252,365,684 8,192,083 1.21441% FreebornGoodhue 202,731,670 90.32% 6,630,756 8 21,718,791 9.68% 710,648 224,450,461 7,341,404 1.08831% GoodhueHouston 143,764,810 93.09% 4,817,068 6 10,674,741 6.91% 357,567 154,439,551 5,174,635 0.76710% HoustonMower 212,240,276 91.24% 6,895,769 13 20,377,380 8.76% 662,066 232,617,656 7,557,835 1.12039% MowerOlmsted 270,766,567 97.50% 9,190,520 5 6,949,946 2.50% 235,654 277,716,513 9,426,174 1.39736% OlmstedRice 187,470,397 92.76% 6,466,510 5 14,626,341 7.24% 504,717 202,096,738 6,971,227 1.03343% RiceSteele 193,255,891 93.36% 6,323,166 3 13,749,046 6.64% 449,720 207,004,937 6,772,886 1.00403% SteeleWabasha 145,578,934 86.79% 4,879,796 9 22,157,343 13.21% 742,736 167,736,277 5,622,532 0.83350% WabashaWinona 187,418,500 90.51% 6,268,938 11 19,648,461 9.49% 657,300 207,066,961 6,926,238 1.02676% Winona District 6 Totals $2,128,784,037 91.62% $70,434,571 92 $194,784,555 8.38% $6,411,141 $2,323,568,592 $76,845,712 11.39180% District 6 Totals
56

2020 2020 Total TotalTotal Regular Total Municipal 2019 Final CSAH
Regular Distribution Municipal Distribution CSAH 2020 Distribution County Needs % Account Needs % Account Needs Distribution Percentage CountyCSAH's
Regular Account, Municipal Account, Total County State Aid Apportionment Fund & Distribution PrecentageJanauary 2020
# of Munic.Under 5,000
Pop. With
Blue Earth $336,576,174 91.28% $9,911,288 9 $32,165,859 8.72% $946,828 $368,742,033 $10,858,116 1.60963% Blue EarthBrown 162,044,263 91.49% 5,655,068 6 15,080,764 8.51% 526,010 177,125,027 6,181,078 0.91630% BrownCottonwood 113,373,355 84.08% 4,026,427 6 21,474,439 15.92% 762,378 134,847,794 4,788,805 0.70990% CottonwoodFaribault 187,197,696 81.75% 5,670,187 11 41,795,510 18.25% 1,265,821 228,993,206 6,936,008 1.02821% FaribaultJackson 200,904,349 89.77% 6,086,427 6 22,904,118 10.23% 693,596 223,808,467 6,780,023 1.00509% JacksonLe Sueur 170,813,247 78.31% 5,361,140 9 47,302,177 21.69% 1,484,908 218,115,424 6,846,048 1.01488% Le SueurMartin 206,461,390 93.14% 6,529,342 9 15,200,987 6.86% 480,903 221,662,377 7,010,245 1.03922% MartinNicollet 143,077,207 95.32% 4,880,349 3 7,032,239 4.68% 239,614 150,109,446 5,119,963 0.75900% NicolletNobles 204,309,573 91.45% 6,316,353 10 19,109,405 8.55% 590,539 223,418,978 6,906,892 1.02389% NoblesRock 124,272,375 83.22% 3,978,946 7 25,053,956 16.78% 802,292 149,326,331 4,781,238 0.70878% RockSibley 146,083,773 90.90% 4,822,679 7 14,624,131 9.10% 482,798 160,707,904 5,305,477 0.78650% SibleyWaseca 151,411,920 93.18% 4,970,205 3 11,076,503 6.82% 363,778 162,488,423 5,333,983 0.79072% WasecaWatonwan 112,081,209 77.67% 3,628,337 8 32,218,753 22.33% 1,043,141 144,299,962 4,671,478 0.69251% Watonwan District 7 Totals $2,258,606,531 88.10% $71,836,748 94 $305,038,841 11.90% $9,682,606 $2,563,645,372 $81,519,354 12.08463% District 7 Totals
Chippewa $93,034,100 92.05% $3,535,533 5 $8,031,633 7.95% $305,350 $101,065,733 $3,840,883 0.56938% ChippewaKandiyohi 205,834,185 91.99% 7,211,796 11 17,911,604 8.01% 627,965 223,745,789 7,839,761 1.16219% KandiyohiLac Qui Parle 132,198,108 92.65% 4,728,036 7 10,492,017 7.35% 375,079 142,690,125 5,103,115 0.75650% Lac Qui ParleLincoln 101,418,958 89.49% 3,608,488 5 11,909,991 10.51% 423,793 113,328,949 4,032,281 0.59776% LincolnLyon 136,242,458 85.22% 4,758,487 10 23,627,741 14.78% 825,281 159,870,199 5,583,768 0.82775% LyonMc Leod 156,320,056 88.43% 5,348,662 7 20,450,636 11.57% 699,808 176,770,692 6,048,470 0.89664% Mc LeodMeeker 117,716,828 93.77% 4,467,368 8 7,815,950 6.23% 296,808 125,532,778 4,764,176 0.70625% MeekerMurray 142,254,881 93.94% 4,897,122 9 9,173,500 6.06% 315,910 151,428,381 5,213,032 0.77279% MurrayPipestone 90,468,515 77.69% 3,200,182 9 25,977,997 22.31% 918,986 116,446,512 4,119,168 0.61064% PipestoneRedwood 171,501,035 89.16% 5,671,844 14 20,851,035 10.84% 689,578 192,352,070 6,361,422 0.94303% RedwoodRenville 219,374,300 93.58% 6,977,721 10 15,059,867 6.42% 478,702 234,434,167 7,456,423 1.10536% RenvilleYellow Med. 140,219,647 89.14% 4,793,089 9 17,077,102 10.86% 583,946 157,296,749 5,377,035 0.79711% Yellow Med. District 8 Totals $1,706,583,071 90.06% $59,198,328 104 $188,379,073 9.94% $6,541,206 $1,894,962,144 $65,739,534 9.74539% District 8 Totals
Chisago $123,258,637 72.79% $5,220,285 7 $46,084,872 27.21% $1,951,421 $169,343,509 $7,171,706 1.06315% ChisagoDakota 519,980,270 96.68% 19,232,630 7 17,864,836 3.32% 660,450 537,845,106 19,893,080 2.94900% DakotaRamsey 593,609,324 97.35% 21,393,652 3 16,175,604 2.65% 582,364 609,784,928 21,976,016 3.25778% RamseyWashington 217,238,337 75.69% 9,690,717 13 69,788,909 24.31% 3,112,450 287,027,246 12,803,167 1.89797% Washington District 9 Totals $1,454,086,568 90.65% $55,537,284 30 $149,914,221 9.35% $6,306,685 $1,604,000,789 $61,843,969 9.16790% District 9 Totals
STATE TOTALS $16,889,290,333 90.29% $608,840,343 700 $1,817,244,773 9.71% $65,730,332 $18,706,535,106 $674,570,675 100.00000% STATE TOTALS
57

Needs Calculation System Summary Document
October 2015
In 2007 a Needs Task Force comprised of County Engineers from each MnDOT district as well as State Aid staff was created in order to, amongst other things, develop and recommend a new, revised Needs Calculation System to replace the original Needs Calculation System that was originally developed in 1958 and subsequently reviewed and modified by the Screening Board on a semi-annual basis. The goals of the new, revised Needs Calculation System are:
o Easier to understand and explaino More transparento Simplification of Needs formula,o Better reflection of actual needs based on infrastructure life cycleo Flexibility for future changes
The following description of the Needs Calculation System is the product of several years of research and development performed by the Minnesota Department of Transportation State Aid Office as well as the Minnesota County Engineers Association Needs Task Force and is recommended for adoption by the County State Aid Screening Board. In addition to the Needs Calculation System summary, the Needs Task Force has developed and recommends a complete list of Screening Board resolutions as attached to the summary document. It is expected that the Screening Board will continue to review and modify the adopted Needs Calculation System as authorized by Minnesota Statute 162.07.
NEEDS CALCULATION SYSTEM DESCRIPTION:
The existing horizontal lengths of all existing County State Aid Highways shall be determined and sorted into one of the following 8 categories:
o Category 1 – Rural ADT 0-149 (unpaved)o Category 2 – Rural ADT 150-1499 (plus existing paved highways <150 ADT)o Category 3 – Rural ADT 1500-6999o Category 4 – Rural ADT 7000+o Category 5 – Urban ADT 0-9999o Category 6 – Urban ADT 10,000-19,999o Category 7 – Urban ADT 20,000-34,999o Category 8 – Urban ADT 35,000+
Each existing mile of the CSAH system within each county shall be sorted into one of these 8 categories based on projected traffic volumes. Segment termini shall be
58
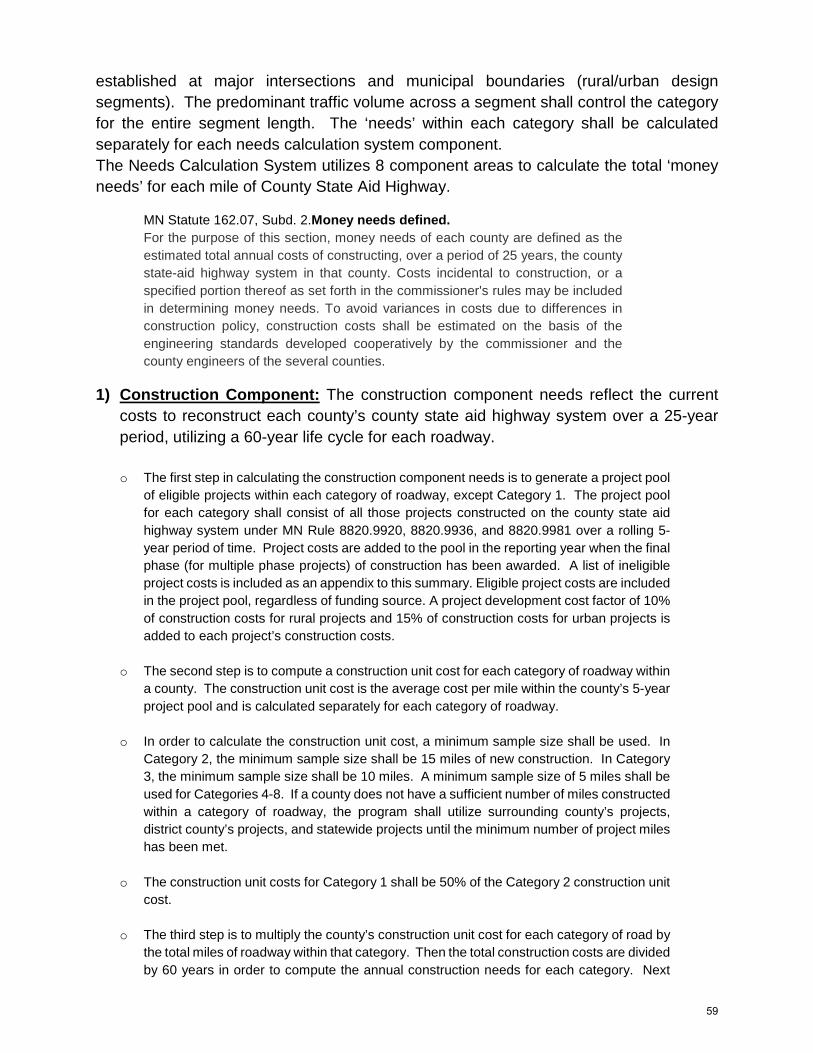
established at major intersections and municipal boundaries (rural/urban design segments). The predominant traffic volume across a segment shall control the category for the entire segment length. The ‘needs’ within each category shall be calculated separately for each needs calculation system component. The Needs Calculation System utilizes 8 component areas to calculate the total ‘money needs’ for each mile of County State Aid Highway.
MN Statute 162.07, Subd. 2.Money needs defined. For the purpose of this section, money needs of each county are defined as the estimated total annual costs of constructing, over a period of 25 years, the county state-aid highway system in that county. Costs incidental to construction, or a specified portion thereof as set forth in the commissioner's rules may be included in determining money needs. To avoid variances in costs due to differences in construction policy, construction costs shall be estimated on the basis of the engineering standards developed cooperatively by the commissioner and the county engineers of the several counties.
1) Construction Component: The construction component needs reflect the currentcosts to reconstruct each county’s county state aid highway system over a 25-yearperiod, utilizing a 60-year life cycle for each roadway.
o The first step in calculating the construction component needs is to generate a project poolof eligible projects within each category of roadway, except Category 1. The project poolfor each category shall consist of all those projects constructed on the county state aidhighway system under MN Rule 8820.9920, 8820.9936, and 8820.9981 over a rolling 5-year period of time. Project costs are added to the pool in the reporting year when the finalphase (for multiple phase projects) of construction has been awarded. A list of ineligibleproject costs is included as an appendix to this summary. Eligible project costs are includedin the project pool, regardless of funding source. A project development cost factor of 10%of construction costs for rural projects and 15% of construction costs for urban projects isadded to each project’s construction costs.
o The second step is to compute a construction unit cost for each category of roadway withina county. The construction unit cost is the average cost per mile within the county’s 5-yearproject pool and is calculated separately for each category of roadway.
o In order to calculate the construction unit cost, a minimum sample size shall be used. InCategory 2, the minimum sample size shall be 15 miles of new construction. In Category3, the minimum sample size shall be 10 miles. A minimum sample size of 5 miles shall beused for Categories 4-8. If a county does not have a sufficient number of miles constructedwithin a category of roadway, the program shall utilize surrounding county’s projects,district county’s projects, and statewide projects until the minimum number of project mileshas been met.
o The construction unit costs for Category 1 shall be 50% of the Category 2 construction unitcost.
o The third step is to multiply the county’s construction unit cost for each category of road bythe total miles of roadway within that category. Then the total construction costs are dividedby 60 years in order to compute the annual construction needs for each category. Next
59

the annual construction needs within each category are multiplied by 25 in order to get the 25-year construction needs for each category.
o The final step is to add the 25-year construction needs from each traffic category. Theresult is the county’s total needs for the construction component of the Needs CalculationSystem.
2) Right-of-Way Component: The right-of-way component needs reflect the currentcosts to acquire necessary right-of-way to reconstruct each county’s county state aidhighway system over a 25-year period, utilizing a 60-year life cycle for each roadway.
o The right-of-way component utilizes the same project pool as the construction componentas outlined above. It also utilizes the same formula to calculate the unit right-of-way costsand the total right-of-way needs.
o Eligible costs for the right-of-way needs are direct payments to landowners and utilities(including those awarded by court action) regardless of funding source. It does not includecosts incurred by the county for professional services or staff time for right-of-wayacquisition. These are accounted for in the project development costs added into theconstruction component needs.
3) Preservation Component: The preservation component needs reflect the currentcosts to preserve each county’s county state aid highway system over a 25-yearperiod, based on an assumed and uniform formula for each category of roadwayacross the state.
o The first step in calculating the preservation component needs is to compute a gravel andbituminous unit price for each county.
o The gravel unit price is established by a statewide average price for gravel surfacing overa 5-year period on statewide state aid construction projects.
(statewide total gravel surfacing cost/statewide gravel surfacing quantity)
o The bituminous unit price is established for each county based on the average unit pricefor bituminous on state aid projects within that county for the past 5 years. The minimumsample size for establishing a county’s bituminous unit cost is 50,000 tons. If a county hasnot paved a sufficient volume of bituminous over the 5-year period, the average unit priceof surrounding county’s shall be used to obtain the minimum sample size of 50,000 tons.
o Once a unit price is established for each county, the annual preservation needs per mileare computed for each category of roadway by a uniform formula across the state.
Category Preservation Quantity Preservation Life Cycle 1 546 tons gravel 2 years 2 2112 tons bituminous 20 years 3 2376 tons bituminous 20 years 4 3564 tons bituminous 20 years 5 2904 tons bituminous 15 years 6 3696 tons bituminous 15 years
60

7 4488 tons bituminous 15 years 8 6072 tons bituminous 15 years
o The annual county preservation needs for each category are computed by multiplying theestablished unit price by the preservation quantity, dividing by the preservation life cycle,and multiplying the result by the total miles within the category. Next the annualpreservation need are multiplied by 25 to obtain the 25-year preservation needs. The totalpreservation component needs are the summation of the preservation needs in eachcategory of roadway.
4) Structures Component: Utilizing an 85-year life cycle for bridges and a 100-year lifecycle for large culverts, the structure component needs reflect the current costs toreplace each county’s bridges on the county state aid highway system over a 25-yearperiod.
o The first step in calculating the structure component needs is to establish a statewide unitcost for replacing bridges across the state. The unit cost is per square foot of deck areafor bridges and per cubic foot of culvert volume for large culverts. The unit cost isrecommended by the General Sub-Committee and established by the Screening Board onan annual basis.
o For each county the total structure needs are calculated by multiplying the unit prices forbridges and culverts by the total existing bridge deck area and culvert volume, respectfully.A project development cost factor of 15% is then added. The results are divided by theestablished life cycles of 85 years for bridges and 100 years for culverts and subsequentlymultiplied by 25 to establish the total 25-year structure needs.
5) Railroad Crossing Component: The railroad crossing component needs reflect thecurrent costs to replace railroad crossing surfaces, signals, and gates on the countystate aid highway system over a 25-year period.
o The first step in calculating the railroad crossing component needs is to establish astatewide unit cost for replacing railroad crossings across the state. The unit cost is percrossing, regardless of the number of tracks or whether or not the crossing is protected bysignals and gates. The unit cost is recommended by the General Sub-Committee andestablished by the Screening Board on an annual basis.
o For each county the total railroad crossing needs are calculated by multiplying theestablished unit price by each crossing on a county’s state aid highway system. The resultsare divided by the established life cycle of 25 years to obtain the annual railroad crossingneeds for each county. Subsequently, the total is multiplied by 25 to establish the total 25-year railroad crossing needs.
6) Traffic Signal Component: The traffic signal component needs reflect the currentcosts to replace each county’s traffic signals on the county state aid highway systemover a 25-year period.
61

o The first step in calculating the traffic signal component needs is to establish a statewideunit cost for replacing traffic signals across the state. The unit cost is per signalized leg.The unit cost is recommended by the General Sub-Committee and established by theScreening Board on an annual basis.
o For each county the total traffic signal needs are calculated by multiplying the unit pricesfor traffic signal legs by the total number of signaled legs on the county’s state aid highwaysystem. The results are divided by the established life cycle of 40 years and subsequentlymultiplied by 25 to establish the total 25-year traffic signal component needs.
7) Additional Interchange Component: The additional interchange needs reflect acounty’s cost to construct or participate in the construction of an interchange that hasa direct relationship to the county state aid highway system.
o When a county constructs an interchange on the County State Aid Highway System orparticipates in the cost of an interchange due to the connection with a county state aidhighway, the county’s costs are eligible for additional needs.
o The additional needs component is calculated by establishing the county’s eligible costs(regardless of funding source) associated with an eligible project and dividing them by 60to annualize the county’s additional needs based on a 60-year life cycle. These annualneeds are then multiplied by 25 to establish the 25-year additional needs. In order not to‘double up’ on needs, the computed 25-year construction needs (if any) for the samesegment length are subtracted from the computed additional needs. If the result is lessthan 0, there are no additional needs for that segment location.
o The additional needs computed under this component are added to the total county needsfor a total of 60 years from the date of the eligible project or until the interchange isreconstructed, whichever is first.
8) Additional TH Bridge/RR Bridge/Municipal Bridge Component: The additionalbridge component needs reflect a county’s cost to construct or participate in theconstruction of a bridge that is not on the county state aid highway system, but has adirect relationship to the county state aid highway system.
o When a county participates in the cost of an off system bridge due to the connection witha county state aid highway, the county’s costs are eligible for additional needs.
o The additional needs component is calculated by establishing the county’s eligible costs(regardless of funding source) associated with an eligible project and dividing them by 85to annualize the county’s additional needs based on a 85-year life cycle. These annualneeds are then multiplied by 25 to establish the 25-year additional needs.
o The additional needs computed under this component are added to the total county needsfor a total of 85 years from the date of the eligible project or until the bridge is reconstructed,whichever is first.
62

o Note: Until a program is developed that includes the additional bridge component needs,these needs shall be included with the additional interchange component needs with a lifecycle of 60 years.
Restrictions and Adjustments:
A County’s total unadjusted, unrestricted money needs are calculated by the summation of all 25-year needs from each component in the Needs Calculation System.
The Needs Calculation System includes an annual restriction to the total annual money needs for each county. A county’s annual change in needs is restricted to be within 10% of the statewide annual change in needs. If a County’s calculated needs fall outside the restriction limits, their needs are adjusted to the limit.
Two separate criteria are evaluated in order to make minimum county adjustments. The first minimum county adjustment is made dependent on a minimum apportionment sum distribution to those counties specifically provided by MN Statute. A secondary minimum county adjustment is provided to all counties such that no county receive a total distribution less than 0.55% of the total statewide distribution. These adjustments are zero-sum adjustments that result in a re-distribution based on a prorated share of the money needs for each county.
After all other restrictions and adjustments have been made, a final adjustment is made to each county’s money needs (+/-) in order to provide a stable money needs allocation for each county based on statewide changes in the distribution amount. This adjustment provides that no county receive a percentage increase in money needs allotment less than 25% of a statewide percentage increase in money needs distribution from the year prior. It also provides that no county receive a percentage decrease in money needs allotment greater than 125% of a statewide percentage decrease in money needs distribution from the year prior. This adjustment is a zero-sum adjustment that results in a re-distribution based on a prorated share of the money needs for each county. Those county’s whose distribution percentage is at the minimum distribution percentage shall not be further reduced by this adjustment.
63

Current Resolutions of the County State Aid Screening Board
Fall 2019
BE IT RESOLVED:
ADMINISTRATIVE
Improper Needs Report
That the Office of State Aid be requested to recommend an adjustment in the needs reporting whenever there is reason to believe that said reports 1) have deviated from accepted standards or 2) have not been submitted on schedule. The Office of State Aid will submit their recommendations to the Screening Board with a copy to the county engineer involved.
Type of Needs Study
That the Screening Board shall, from time to time, make recommendations to the Commissioner of Transportation as to the extent and type of needs study to be subsequently made on the County State Aid Highway System consistent with the requirements of law.
Appearance at Screening Board
That any individual or delegation having items of concern regarding the study of State Aid Needs or State Aid Apportionment Amounts, and wishing to have consideration given to these items, shall, in a written report, communicate with the Commissioner of Transportation through proper channels. The Commissioner shall determine which requests are to be referred to the Screening Board for their consideration. This resolution does not abrogate the right of the Screening Board to call any person or persons to appear before the Screening Board for discussion purposes.
Construction Cut Off Date
That for the purpose of measuring the needs of the County State Aid Highway System, the annual cut off date for recording construction accomplishments based upon the project award date shall be December 31.
Screening Board Vice-chair
That at the first County Screening Board meeting held each year, a Vice-chair shall be elected and shall serve in that capacity until the following year when the Vice-chair shall succeed to the Chair.
Screening Board Meeting Dates and Locations
That the Screening Board Chair, with the assistance of State Aid personnel, determines the dates and the locations for that year’s Screening Board meetings.
64

Screening Board Secretary
That, annually, the Commissioner of Transportation may be requested to appoint a secretary, upon recommendation of the Minnesota County Engineers Association, as a non-voting member of the County Screening Board for the purpose of recording all Screening Board actions.
Research Account
That the Screening Board will annually consider setting aside a reasonable amount of County State Aid Highway Funds for the Research Account to continue local road research activity.
Annual District Meeting
That the District State Aid Engineer will call a minimum of one district meeting annually at the request of the District Screening Board Representative to review needs for consistency of reporting.
General Subcommittee
That the Screening Board Chair appoints a Subcommittee to:
- Annually study all unit prices and variations.- Annually study all money needs adjustments and restrictions.- Propose changes to the Needs system.- Propose Resolutions.
The Subcommittee will make recommendations to the Screening Board.
The Subcommittee will consist of five members. Three members with initial terms of one, two and three years, and representing the North (Districts 1, 2, 3 and 4), the South (Districts 6, 7 and 8) and the Metro area of the state. Two additional at-large members shall be appointed by the Screening Board Chair. An effort shall be made to appoint members that balances representation across the state geographically as well as the various sizes and population densities of the counties. Initially, the two at-large members of the subcommittee will consist of past members of the Needs Task Force for a full 3 year term. All subsequent terms will be for three years.
Mileage Subcommittee
That the Screening Board Chair will appoint a Subcommittee to review all additional mileage requests submitted and to make recommendations on these requests to the County Screening Board. The Subcommittee will consist of three members with initial terms of one, two and three years and representing the metro, the north (Districts 1, 2, 3 and 4) and the south area (Districts 6, 7 and 8) of the state respectively. Subsequent terms will be for three years and appointments will be made after each year's Fall Screening Board Meeting. Mileage requests must be in the District State Aid Engineer's Office by April 1 to be considered at the spring meeting and by August 1 to be considered at the fall meeting.
65

NEEDS ADJUSTMENTS
Restriction of 25-Year Construction Needs
That the CSAH construction needs change in any one county from the previous year's restricted CSAH needs to the current year's basic 25-year CSAH construction needs shall be restricted to 10 percentage points greater than or 10 percentage points less than the statewide average percent change from the previous year's restricted CSAH needs to the current year's 25-year CSAH construction needs.
County State Aid Construction Fund Balances
That, for the determination of County State Aid Highway needs, the amount of the unencumbered construction fund balance as of December 31 of the current year; not including the last two years regular account construction apportionment and not including the last three years of municipal account construction apportionment or $500,000 whichever is greater; shall be deducted from the 25-year construction needs of each individual county. Except, that when a County Board Resolutionjustifying said construction fund balance in excess of said limits is provided to and approved by theState Aid Office by December 15; no deduction shall be made.
Minimum County Adjustment
That an adjustment be made to the money needs within the Apportionment Sum in order to ensure a minimum apportionment sum allocation percentage be provided to Koochiching, Lake of the Woods, Red Lake, Mahnomen, and Big Stone Counties as defined by Minnesota Statute.
Further, that an adjustment be made to the money needs such that no county receives a total distribution less than 0.55% of the statewide total distribution, notwithstanding the minimum apportionment percentages established for specific counties by MN Statute.
Said adjustments shall be made to both the apportionment sum and excess sum money needs distribution, based on a prorated share of each sum as well as a prorated share of each county’s money needs distribution of the apportionment sum and excess sum, respectfully.
Money Needs Adjustment
That an adjustment be made to the money needs such that no county receives a percentage increase in money needs allotment less than 25% of any percentage increase in the statewide money needs distribution from the prior year; and
Further, that no county receives a percentage decrease in money needs allotment greater than 125% of any percentage decrease in the statewide money needs distribution from the prior year; and
Said adjustments shall be made to both the apportionment sum and excess sum money needs distribution, based on a prorated share of each sum as well as a prorated share of each county’s money needs distribution of the apportionment sum and excess sum, respectfully.
The money needs adjustments shall be applied after all other restrictions and adjustments. Those county’s whose distribution percentage is at the minimum distribution percentage shall not be further reduced by this adjustment.
66

MILEAGE
CSAH Mileage Limitations
That the existing mileage on the CSAH system shall be determined as the actual horizontal length of each CSAH segment. Non-existing and banked CSAH mileage shall not draw needs in the needs calculation system.
Initially, the mileage used for each segment shall be carried over from the mileage on record for the segments in the Legacy System.
Actual horizontal mileage for an entire CSAH system in a County may be verified. This shall replace any errors in mileage previously reported in the Legacy System.
Incidental changes (increases or decreases) in mileage due to construction that do not require a Commissioner’s Order, such as realignment of curves or existing intersections, shall be updated within the Needs Calculation System and shall not impact banked mileage.
Any revocation of CSAH mileage resulting in the reduction of existing CSAH mileage shall be reflected by the reduction of the same mileage within the appropriate traffic category in the Needs Calculation System. These revoked miles shall be deposited into a mileage bank and may be designated elsewhere.
Any revisions to the CSAH system that result in an increase in mileage, shall require Screening Board approval. Mileage approved by the Screening Board through a mileage request shall not be transferable or revoked and added to a county’s banked mileage, without approval of the Screening Board.
Revocation of Trunk Highway Turnback mileage shall not be transferable or revoked and added to a county’s banked mileage, without approval of the Screening Board.
Former Municipal State Aid Street mileage located within municipalities that fall below the 5000 population requirements for being a State Aid City shall be eligible for CSAH mileage within that municipality, but shall not be transferable or revoked and added to a county’s banked mileage, without approval of the Screening Board.
CSAH Mileage requests for the Spring Screening Board meeting must be received by the State Aid Office by April 1 of each year and requests for the Fall Screening Board meeting must be received by August 1. Requests after that date shall carry over to the next meeting.
TRAFFIC
Traffic Projection Factors
That new Traffic Projection Factors for the needs study be established for each county using a "least squares" projection of the vehicle miles from the last four traffic counts and in the case of the seven county metro area from the number of latest traffic counts which fall in a minimum of a twelve year period. This normal factor can never fall below 1.0. Also, new traffic factors will be computed whenever an approved traffic count is made. These normal factors may, however, be changed by the county engineer for any specific segments where a traffic count or a traffic study warrant a
67

change, with the approval of the District State Aid Engineer. Also, the adjustment to traffic projection factors shall be limited to a 0.3 point decrease per traffic count interval.
ROAD NEEDS
Method of Study
That, except as otherwise specifically provided, the “Instructions for Annual CSAH Needs Update” shall provide the format for estimating needs on the County State Aid Highway System.
Storm Sewer
That storm sewer mains may be located off the County State Aid Highway if, in so doing, it will satisfactorily accommodate the drainage problem of the County State Aid Highway.
Construction Accomplishments
That the final project costs for eligible items of a construction project shall be used in the reporting of construction accomplishments for the specified reporting year. Needs reporting shall be based on the awarded bid prices for projects that are not been completed prior to the time of the Needs reporting.
For projects that are “phased” over a series of years (Example: grading and aggregate in one project and paving in a second project in a later year), the needs reporting shall take place based on the award year of the last phase for a multiple year “phased” construction project.
Subsequent accomplishments in any projects, if any, will be updated in the following years of Needs reporting.
Additional Interchange Needs
That additional needs be calculated and added to those CSAH segments that contain an Interchange when the construction or reconstruction of an Interchange results in an annual county cost (calculated by taking the actual county share of total project costs divided by 60) in excess of the sum total of the calculated annual construction, right-of-way, structure, RR crossing, and signal needs (if applicable) for that same segment length of CSAH involved in the Interchange project.
The additional Annual Interchange/TH/RR/City/Twp Bridge Needs as calculated above shall be multiplied by 25 to obtain the 25 year Needs, consistent with the other Needs components.
The additional Interchange Needs shall be added for a period of 60 years from the date of construction or until reconstruction of said infrastructure, whichever is sooner.
Additional RR bridge over highway, MNDOT bridge, and Municipal bridge Needs
That additional needs be calculated and added to those CSAH segments that contain a TH Bridge, RR Bridge, City or Township Bridge when:
68

1) The construction or reconstruction of a TH Bridge that carries a CSAH route results in anannual county cost (calculated by taking the county share of the total project costs divided by85) in excess of the sum total of the calculated annual construction, right-of-way, structure,RR crossing, and signal needs (if applicable) for that same segment length of CSAH involvedin the TH Bridge project.
2) The construction or reconstruction of a Bridge that spans a CSAH route results in an annualcounty cost (calculated by taking the county share of the total project costs divided by 85). Inthis case, the segment length shall be treated as a node and no reduction in the actual countycosts shall be made by the calculated segment needs.
The additional Annual Interchange/TH/RR/City/Twp Bridge Needs as calculated above shall be multiplied by 25 to obtain the 25 year Needs, consistent with the other Needs components.
The additional Interchange/TH/RR/City/Twp Bridge Needs shall be added for a period of 85 years from the date of construction or until reconstruction of said infrastructure, whichever is sooner.
Note: The Additional Bridge Needs shall be calculated the same as Additional Interchange Needs with respect to life cycle until such time the needs calculation system is capable of separating the calculations.
69