Embed Size (px)
Citation preview
N O T I C E O F A N N U A L M E E T I N G O F S T O C K H O L D E R S
P R O X Y S T A T E M E N T
A N D
2 020 A N N U A L R E P O R T


Dear Fellow Pilgrim’s Stockholders:
I am pleased to invite you to our Annual Meeting of Stockholders. The attached Notice of Annual Meeting of Stockholders and Proxy Statement contain details of the business to be conducted. In addition to the business to be transacted at the meeting, members of management will present information about our operations and will be available to respond to your questions.
Your vote is very important to us and to our business. Prior to the meeting, I encourage you to sign and return your proxy card, or use telephone or Internet voting, so that your shares will be represented and voted at the meeting. You can find instructions on how to vote beginning on page one. You may also attend the meeting in person at Pilgrim’s Pride corporate headquarters, at 1770 Promontory Circle, Greeley, Colorado. If you plan to attend in person, please bring proof of Pilgrim’s Pride stock ownership and government-issued photo identification, as these will be required for admission.
I hope to see you at the meeting. Thank you in advance for voting and for your continued support of Pilgrim’s Pride. President and Chief Executive Officer March 29, 2021

This page intentionally left blank.

Pilgrim’s Pride Corporation1770 Promontory CircleGreeley, Colorado 80634
NOTICE OF ANNUAL MEETING OF STOCKHOLDERS
To Be Held April 28, 2021
The annual meeting of stockholders of Pilgrim’s Pride Corporation will be held at Pilgrim’s Pride corporate headquarters, at 1770 Promontory Circle, Greeley, Colorado, on Wednesday, April 28, 2021, at 8:00 a.m., local time, to consider and vote on the following matters:
1. To elect Gilberto Tomazoni, Wallim Cruz De Vasconcellos Junior, Vincent Trius, Andre Nogueira de Souza, Farha Aslam and Joanita Karoleski as the six JBS Directors;
2. To elect Michael L. Cooper, Arquimedes A. Celis and Ajay Menon as the three Equity Directors;
3. To conduct a stockholder advisory vote on executive compensation;
4. To ratify the appointment of KPMG LLP as our independent registered public accounting firm for 2021;
5. To approve an amendment to the Amended and Restated Certificate of Incorporation;
6. To vote on a stockholder proposal, if properly presented, to provide a report regarding the reduction of water of pollution;
7. To vote on a stockholder proposal, if properly presented, to integrate ESG metrics into executive compensation; and
8. To transact such other business as may properly be brought before the meeting or any adjournment thereof.
No other matters are expected to be voted on at the annual meeting.
The Board of Directors has fixed the close of business on March 9, 2021, as the record date for determining stockholders entitled to notice of, and to vote at, the annual meeting. If you owned shares of our common stock at the close of business on that date, you are cordially invited to attend the annual meeting. Whether or not you plan to attend the annual meeting, please vote at your earliest convenience. Most stockholders have three options for submitting their votes prior to the meeting:
(1) via the internet;
(2) by telephone; or
(3) by mail.
The health and well-being of our employees and stockholders are paramount. We are closely monitoring developments related to COVID-19 and there is a possibility that we may need to change the format of our meeting to allow shareholder participation by means of remote communication. If we determine it necessary to make changes to our annual meeting, we will announce the decision to do so in advance.
Please refer to the specific instructions set forth on the enclosed proxy card (if you are a stockholder of record) or voting instruction form (if you hold shares through a bank, broker or other nominee). Admission to the annual meeting will be limited to our stockholders, proxy holders and invited guests. All attendees will be required to wear masks and follow social distancing protocols. We reserve the right to implement other safety measures as we deem prudent or as required by any applicable laws or government orders. If you are a stockholder of record, please bring a form of government-issued photo identification to the annual meeting. If you hold shares through a

bank, broker or other nominee, please bring a form of government-issued photo identification and proof of beneficial ownership (such as a brokerage statement), and, if you wish to vote your shares in person, a signed legal proxy from the stockholder of record.
FABIO SANDRIGreeley, Colorado President andMarch 29, 2021 Chief Executive Officer
YOUR VOTE IS IMPORTANT!
PLEASE SIGN AND RETURN THE ACCOMPANYING PROXY CARD OR VOTING INSTRUCTION FORM OR VOTE YOUR SHARES ON THE INTERNET OR BY TELEPHONE BY FOLLOWING THE INSTRUCTIONS ON THE PROXY CARD OR VOTING INSTRUCTION FORM.
IMPORTANT NOTICE REGARDING THE AVAILABILITY OF PROXY MATERIALS FOR THE STOCKHOLDER MEETING TO BE HELD ON APRIL 28, 2021: The Proxy Statement and the 2020 Annual Report on Form 10-K are available at www.envisionreports.com/PPC. Enter the 15-digit control number located on the proxy card and click “View Stockholder Material.”
TABLE OF CONTENTS
PageGeneral Information 1Proposal 1. Election of JBS Directors 7Proposal 2. Election of Equity Directors 10
Corporate Governance 12Director Compensation Table 17
Proposal 3. Approval of the Advisory Vote on Executive Compensation 18Report of the Compensation Committee 19Compensation Discussion and Analysis 20Executive Compensation 30Compensation Risks 35
Compensation Committee Interlocks and Insider Participation 35Delinquent Section 16(a) Reports 35Security Ownership 36Related Party Transactions 37Proposal 4. Ratification of the Appointment of Independent Registered Public Accounting Firm 38
Report of the Audit Committee 39Independent Registered Public Accounting Firm Fee Information 40
Proposal 5. Approval of Amendment to the Certificate of Incorporation 42Proposal 6. Stockholder Proposal to Provide a Report Regarding the Reduction of Water Pollution 43Proposal 7. Stockholder Proposal to Integrate ESG Metrics Into Executive Compensation 45Householding of Stockholder Materials 47Stockholder Proposals for 2022 Annual Meeting of Stockholders 47Important Notice Regarding the Availability of Proxy Materials for the Stockholder Meeting to be Held on April 28, 2021 47Other Business 48Annex A - Reconciliation of GAAP Information to Non-GAAP Financial Measure 50Annex B - Proposed Amendment to Pilgrim’s Pride Corporation of the Amended and Restated Certificate of Incorporation 51

This page intentionally left blank.

Pilgrim’s Pride Corporation1770 Promontory CircleGreeley, Colorado 80634
PROXY STATEMENT
GENERAL INFORMATION
Why did I receive this proxy statement?
The Board of Directors (the “Board of Directors” or the “Board”) of Pilgrim’s Pride Corporation is soliciting stockholder proxies for use at our annual meeting of stockholders to be held at the Pilgrim’s Pride corporate headquarters, at 1770 Promontory Circle, Greeley, Colorado, on Wednesday, April 28, 2021, at 8:00 a.m., local time, and any adjournments thereof (the “Annual Meeting” or the “meeting”). This proxy statement, the accompanying proxy card and the 2020 annual report are being mailed to stockholders on or about March 29, 2021. Throughout this proxy statement, we will refer to Pilgrim’s Pride Corporation as “Pilgrim’s Pride,” “Pilgrim’s,” “PPC,” “we,” “us” or the “Company.”
What is the record date for the Annual Meeting and why is it important?
The Board of Directors has fixed March 9, 2021 as the record date for determining stockholders who are entitled to vote at the Annual Meeting (the “Record Date”). At the close of business on the Record Date, Pilgrim’s Pride had 243,666,063 shares of common stock, par value $0.01 per share, outstanding.
What is the difference between holding shares as a stockholder of record and as a beneficial owner?
Most stockholders of Pilgrim’s Pride hold their shares through a broker, bank or other nominee, rather than of record directly in their own name. As summarized below, there are some distinctions between shares held of record and those owned beneficially.
Stockholders of Record: If your shares are registered directly in your name with our transfer agent, you are considered a stockholder of record with respect to those shares. As a stockholder of record, you have the right to vote in person at the meeting.
Beneficial Owner: If your shares are held in a stock brokerage account or by a bank or other nominee, you are considered a beneficial owner of shares held in “street name.” As a beneficial owner, you have the right to direct your broker on how to vote your shares, and you are also invited to attend the meeting. Since you are not a stockholder of record, however, you may not vote your shares in person at the meeting unless you obtain a signed proxy from the holder of record giving you the right to vote the shares.
How do I attend and be admitted to the Annual Meeting?
You are entitled to attend the Annual Meeting only if you were a Pilgrim’s Pride stockholder as of the close of business on March 9, 2021 or if you hold a valid proxy for the Annual Meeting. If you plan to attend the physical meeting, please be aware of what you will need for admission as described below. If you do not provide a government-issued photo identification and comply with the other procedures described here for attending the Annual Meeting in person, you will not be admitted to the meeting location. All attendees will be required to wear masks and follow social distancing protocols. We reserve the right to deny admission to any person who may pose a threat to the health or safety of stockholders or other meeting participants, and we reserve the right to implement additional procedures to ensure the health, security and safety of meeting attendees.
Stockholders of Record: If your shares are registered directly in your name with our transfer agent, your shares will be on a list maintained by the inspector of elections. You must present a government-issued photo identification, such as a driver’s license, state-issued ID card, or passport.
1

Beneficial Owner: If your shares are held in a stock brokerage account or by a bank or other nominee, you must provide proof of beneficial ownership as of the record date, such as an account statement or similar evidence of ownership, along with a government-issued photo identification, such as a driver’s license, state-issued ID card, or passport.
For directions to the meeting, please contact our Corporate Counsel at Pilgrim’s Pride Corporation, 1770 Promontory Circle, Greeley, Colorado 80634.
Considerations Related to COVID-19
The health and well-being of our employees and stockholders are paramount. We are closely monitoring developments related to the novel coronavirus, or COVID-19, and there is a possibility that we may need to change the format of our meeting to allow shareholder participation by means of remote communication. If we determine it necessary to make changes to our annual meeting, we will announce the decision to do so in advance.
With respect to the stockholder proposals in this Proxy Statement, we intend to provide the proponents of these proposals and their representatives with the ability to present their proposals through alternative means, such as by phone, at the meeting.
What is a proxy?
A proxy is your legal designation of another person (the “proxy”) to vote on your behalf. By completing and returning the enclosed proxy card, you are giving the proxies appointed by the Board and identified on the proxy card the authority to vote your shares in the manner you indicate on your proxy card.
What if I receive more than one proxy card?
You will receive multiple proxy cards if you hold shares of our common stock in different ways (e.g., joint tenancy, trusts, custodial accounts) or in multiple accounts. If your shares are held in “street name” (i.e., by a broker, bank or other nominee), you will receive your proxy card or voting instruction form from your nominee, and you must return your voting instruction form to that nominee. You should complete, sign and return each proxy card or voting instruction form you receive.
What are the voting rights of the common stock?
Each holder of record of our common stock on the Record Date is entitled to cast one vote per share on each matter presented at the meeting.
What are the two categories of Directors?
The Company’s Amended and Restated Certificate of Incorporation (the “Certificate of Incorporation”) provides for a specified number of JBS S.A. (“JBS”) Directors and Equity Directors, based upon the percentage ownership of JBS in the Company.
JBS Directors are the six Directors designated as JBS Directors pursuant to the terms of the Company’s Certificate of Incorporation or their successors nominated or appointed by the JBS Directors’ nominating committee (the “JBS Nominating Committee”). The current JBS Directors are Gilberto Tomazoni, Denilson Molina, Wallim Cruz De Vasconcellos Junior, Vincent Trius, Andre Nogueira de Souza and Farha Aslam. As of the date this proxy statement is mailed to our stockholders, there are currently no vacancies with respect to the JBS Directors.
Equity Directors are the three Directors designated as Equity Directors pursuant to the terms of the Company’s Certificate of Incorporation or their successors nominated or appointed by the Equity Directors nominating committee (the “Equity Nominating Committee”) or any stockholders other than JBS and its affiliates (“Minority Investors”). The current Equity Directors are Michael L. Cooper, Arquimedes A. Celis and Ajay Menon.
What are the differences between the categories of Directors?
2

All of our Directors serve equal one-year terms. However, only JBS Directors can serve as members of the JBS Nominating Committee, and only Equity Directors can serve as members of the Equity Nominating Committee.
The stockholders agreement between us and an affiliate of JBS dated December 28, 2009 (as amended, the “JBS Stockholders Agreement”) requires JBS and its affiliates to vote all of Pilgrim’s Pride common stock that they hold in the same manner as the shares held by all Minority Investors with respect to the election or removal of Equity Directors. Consequently, the vote of the Minority Investors will determine the outcome of the election of Equity Directors.
With respect to all other matters submitted to a vote of holders of common stock, including the election or removal of any JBS Directors, JBS and its affiliates may vote shares of common stock held by them at their sole and absolute discretion.
What is the “Say-on-Pay” Vote?
With Proposal 3, the Board is providing stockholders with the opportunity to cast a non-binding, advisory vote on the compensation of our Named Executive Officers (“NEOs”) for 2020, as defined in “Compensation Discussion and Analysis”. This proposal, commonly known as a “Say-on-Pay” proposal, gives you, as a stockholder, the opportunity to endorse or not endorse our executive compensation programs and policies and the compensation paid to our NEOs in 2020.
How do I vote my shares?
If you are a “stockholder of record,” you have several choices. You can vote your proxy:
• via the internet;
• over the telephone; or
• by completing, dating, signing and mailing the enclosed proxy card;
Please refer to the specific instructions set forth on the enclosed proxy card.
If you are a stockholder of record, you also have the right to vote in person at the meeting. If you are a beneficial owner, your broker, bank or nominee will provide you with materials and instructions for voting your shares. In most instances, you will be able to do this on the internet, by telephone or by mail as indicated above. As a beneficial owner, you have the right to direct your broker on how to vote your shares. However, you may not vote your shares in person at the meeting unless you obtain a signed legal proxy from the holder of record giving you the right to vote the shares.
If you are a current or former employee of Pilgrim’s Pride who holds shares in either the Pilgrim’s Pride Corporation Retirement Savings Plan or the To-Ricos Employee Savings and Retirement Plan, your vote serves as a voting instruction to the trustee for this plan. To be timely, if you vote your shares in the Pilgrim’s Pride Corporation Retirement Savings Plan or the To-Ricos Employee Savings and Retirement Plan by telephone or internet, your vote must be received by 11:59 p.m., Mountain Time, on April 25, 2021. If you do not vote by telephone or internet, please return your proxy card as soon as possible. If you vote in a timely manner, the trustee will vote the shares as you have directed.
What are the Board’s recommendations on how I should vote my shares?
The Board recommends that you vote your shares as follows:
Proposal 1: FOR the election of all six nominees for JBS Director.
Proposal 2: FOR the election of all three nominees for Equity Director.
Proposal 3: FOR the approval of the advisory vote on executive compensation.
3

Proposal 4: FOR ratification of the appointment of KPMG LLP as our independent registered public accounting firm for 2021.
Proposal 5: FOR the approval of the amendment to the Certificate of Incorporation.
Proposal 6: AGAINST the stockholder proposal to provide a report regarding the reduction of water pollution.
Proposal 7: AGAINST the stockholder proposal to integrate ESG metrics into executive compensation.
What are my choices when voting?
With respect to:
Proposal 1: You may either (1) vote “FOR” the election of all JBS Director nominees as a group; (2) “WITHHOLD” your vote on all JBS Director nominees as a group; or (3) vote “FOR” the election of all JBS Director nominees as a group except for certain nominees identified by you in the appropriate area on the proxy card or voting instructions.
Proposal 2: You may either (1) vote “FOR” the election of all Equity Director nominees as a group; (2) WITHHOLD your vote on all Equity Director nominees as a group; or (3) vote “FOR” the election of all Equity Director nominees as a group except for certain nominees identified by you in the appropriate area on the proxy card or voting instructions.
Proposal 3: You may vote “FOR” or “AGAINST” the proposal, or you may elect to abstain from voting your shares. Abstaining will have the same effect as a vote against the proposal, as discussed below.
Proposal 4: You may vote “FOR” or “AGAINST” the proposal, or you may elect to abstain from voting your shares. Abstaining will have the same effect as a vote against the proposal, as discussed below.
Proposal 5: You may vote “FOR” or “AGAINST” the proposal, or you may elect to abstain from voting your shares. Abstaining will have the same effect as a vote against the proposal, as discussed below.
Proposal 6: You may vote “FOR” or “AGAINST” the proposal, or you may elect to abstain from voting your shares. Abstaining will have the same effect as a vote against the proposal, as discussed below.
Proposal 7: You may vote “FOR” or “AGAINST” the proposal, or you may elect to abstain from voting your shares. Abstaining will have the same effect as a vote against the proposal, as discussed below.
How will my shares be voted if I do not specify my voting instructions?
If you sign and return your proxy card without indicating how you want your shares to be voted, the proxies appointed by the Board will vote your shares as follows:
Proposal 1: FOR the election of all six nominees for JBS Director.
Proposal 2: FOR the election of all three nominees for Equity Director.
Proposal 3: FOR the approval of the advisory vote on executive compensation.
Proposal 4: FOR ratification of the appointment of KPMG LLP as our independent registered public accounting firm for 2021.
4

Proposal 5: FOR the approval of the amendment to the Certificate of Incorporation.
Proposal 6: AGAINST the stockholder proposal to provide a report regarding the reduction of water pollution.
Proposal 7: AGAINST the stockholder proposal to integrate ESG metrics into executive compensation.
If you are a current or former employee of Pilgrim’s Pride who holds shares through the Pilgrim’s Pride Corporation Retirement Savings Plan or the To-Ricos Employee Savings and Retirement Plan, you will be given the opportunity to provide instruction to the trustee with respect to how to vote your shares. Any shares for which instructions are not received (1) will be voted by the trustee in accordance with instructions provided by Pilgrim’s Pride with respect to shares held under the Pilgrim’s Pride Corporation Retirement Savings Plan and (2) will not be voted with respect to shares held under the To-Ricos Employee Savings and Retirement Plan.
What is a quorum?
A “quorum” is necessary to hold the meeting. A quorum consists of a majority of the voting power of our common stock issued and outstanding and entitled to vote at the meeting, including the voting power that is present in person or by proxy. The shares of a stockholder whose ballot on any or all proposals is marked as “abstain” and shares represented by broker “non-votes” will be included in the number of shares present at the Annual Meeting to determine whether a quorum is present.
What vote is required to approve the proposals for the election of the JBS Directors and the Equity Directors?
Directors will be elected by a plurality of the voting power of the shares entitled to vote in the election of Directors and represented in person or by proxy at a meeting of stockholders at which a quorum is present. This means that the director who receives the most votes will be elected.
Because JBS owned or controlled over 50% of the voting power of our outstanding common stock on the Record Date, it will be able to elect all of the nominees for JBS Directors and, with the exception described below, determine the outcome of all other matters presented to a vote of the stockholders. The JBS Stockholders Agreement, however, requires JBS and its affiliates to vote all of Pilgrim’s Pride common stock owned by them in the same manner as the shares held by the Minority Investors with respect to the election or removal of Equity Directors. Consequently, the vote of the Minority Investors will determine the outcome of Proposal 2. With respect to approval of any other item of business to be voted upon at the meeting, including the election or removal of any JBS Directors, JBS and its affiliates may vote shares of Pilgrim’s Pride common stock held by them at their sole and absolute discretion.
What vote is required for advisory approval of executive compensation?
With regard to Proposal 3, the stockholder advisory vote on executive compensation, the results of this vote are not binding on the Board, meaning that our Board will not be obligated to take any compensation actions or to adjust our executive compensation programs or policies, as a result of the vote. Notwithstanding the advisory nature of the vote, the resolution will be considered passed with the affirmative vote of a majority of the total outstanding voting power of capital stock, present in person or represented by proxy at the Annual Meeting.
What vote is required for the appointment of KPMG LLP, the stockholder proposals and to approve any other item of business to be voted upon at the meeting?
The affirmative vote of a majority of the total outstanding voting power of capital stock present in person or represented by proxy at the Annual Meeting is required to ratify the appointment of our independent registered public accounting firm, to approve the stockholder proposals and to approve any other item of business to be voted upon at the meeting.
What vote is required to approve the proposed amendment to our Certificate of Incorporation?
5
Our Board of Directors, the Equity Nominating Committee and the JBS Nominating Committee have each unanimously approved the amendment. At the Annual Meeting, in accordance with Delaware law, the amendment to our Certificate of Incorporation also requires approval by a majority of the outstanding shares of our Common Stock entitled to vote thereon.
How are abstentions treated?
Abstentions from voting on any matter will be counted in the tally of votes. Stockholders may only “withhold” votes and may not abstain with respect to the election of Directors in Proposals 1 and 2. However, stockholders may abstain from Proposals 3, 4, 5, 6 and 7, and an abstention will have the same effect as a vote against any of these proposals.
How are “broker non-votes” treated?
A “broker non-vote” occurs when a nominee (a bank, broker or other nominee) holding shares for a beneficial owner returns a proxy but does not vote on a particular proposal because the nominee does not have discretionary voting power for that particular item and has not received voting instructions from the beneficial owner. Under applicable rules, brokers have the discretion to vote such shares on routine matters, but not on non-routine matters. A broker non-vote will be deemed “present” at the Annual Meeting and will be counted for purposes of determining whether a quorum exists.
Your broker may vote your shares in its discretion without your instructions on Proposal 4, which is the only routine proposal to be voted on at the Annual Meeting. With regard to Proposal 1, Proposal 2, Proposal 3, Proposal 5, Proposal 6, and Proposal 7, brokers will have no discretion to vote uninstructed shares, and a “broker non-vote” may therefore occur where no voting instructions are received. Broker non-votes will have no effect on the elections of Directors in Proposals 1 and 2, because the election of Directors requires a plurality vote. Broker non-votes will have the same effect as a vote against Proposal 5, and no effect on Proposals 3, 6, and 7.
We urge you to vote on ALL voting items.
Can I change my vote after I have mailed in my proxy card?
Yes. You may revoke your proxy by doing one of the following:
• by sending to the Secretary of the Company a written notice of revocation that is received prior to the meeting;
• by submitting a new proxy card bearing a later date to the Secretary of the Company so that it is received prior to the meeting; or
• by attending the meeting and voting your shares in person.
If your shares are held in “street name,” you may submit new voting instructions by contacting your bank, broker or other nominee.
Who will pay the cost of this proxy solicitation?
We will pay the cost of preparing, printing and mailing this proxy statement and of soliciting proxies. We will request brokers, custodians, nominees and other like parties to forward copies of proxy materials to beneficial owners of our common stock and will reimburse these parties for their reasonable and customary charges or expenses.
Is this proxy statement the only way that proxies may be solicited?
No. In addition to mailing these proxy materials, certain of our Directors, officers or employees may solicit proxies by telephone, facsimile, e-mail or personal contact. They will not be specifically compensated for doing so.
6

PROPOSAL 1. ELECTION OF JBS DIRECTORS
Subject to limited exceptions, our Certificate of Incorporation specifies that the Board of Directors will consist of nine members, which is the number of Directors currently on our Board of Directors. Proxies cannot be voted for a greater number of persons than the nine nominees named.
Pursuant to our Certificate of Incorporation and our bylaws, our Board of Directors includes six JBS Directors, including the Chairman of the Board, who are designated by the JBS Nominating Committee. For more information, see “Corporate Governance—Committees of the Board of Directors—Special Nominating Committees.”
At the Annual Meeting, nine Directors, including six JBS Director nominees, are to be elected, each to hold office for one year or until his or her successor is duly elected and qualified. For more information on our relationship with JBS, see “Related Party Transactions” and “Security Ownership.” In connection with our efforts to refresh the composition of our Board, our current JBS Director, Denilson Molina, will not stand for re-election at the Annual Meeting, and the Board of Directors has nominated Joanita Karoleski, in addition to five current JBS Directors, for election by stockholders at the Annual Meeting. In the case of Ms. Karloeski, she was nominated for election to the Board at the Annual Meeting after certain directors identified her as a potential director candidate. Unless otherwise specified on the proxy card or voting instructions, the shares represented by the proxy will be voted for the election of the six JBS Director nominees named below. If any JBS Director nominee becomes unavailable for election, it is intended that such shares will be voted for the election of a substitute nominee selected by the JBS Nominating Committee. Our Board of Directors has no reason to believe that any substitute nominee or nominees will be required, and all of the nominees have indicated that they will be willing and able to serve as directors.
Nominees for JBS Directors
The following is information about our JBS Director nominees, including their ages as of March 29, 2021.
Gilberto Tomazoni, 62, has served as Chairman of the Board of Pilgrim’s Pride Corporation, since July 2013. Since 2018, Mr. Tomazoni has served as the Chief Executive Officer of JBS, and previously, Mr. Tomazoni served as president of the Global Poultry Division of JBS. Before joining JBS, Mr. Tomazoni spent four years with Bunge Alimentos S.A. as Vice President of Foods and Ingredients. Prior to that, Mr. Tomazoni served 27 years with Sadia S.A., a leading provider of both frozen and refrigerated food products in Brazil, in various roles, including Chief Executive Officer from 2004 to 2009. He earned an M.A. degree in management development in 1991 from Fundação de Ensino do Desenvolvimento and a B.Sc. degree in mechanical engineering in 1982 from the Universidade Federal de Santa Catarina. Mr. Tomazoni has served as a board member of Brazil Fast Food Corporation since 2009, a member of the International Advisory Council for Fundação Dom Cabral since 2009 and a member of the Chamber of Commerce, Industry and Tourism-Brazil/Russia since 2008.
Mr. Tomazoni brings over 30 years of diverse poultry, protein, and food industry experience to the Company. Mr. Tomazoni’s extensive experience and education in the global poultry industry provides invaluable direction to the Company’s strategies domestically and in international markets. As Chairman of the Board, Mr. Tomazoni has direct oversight of Pilgrim’s strategy and operations.
Wallim Cruz De Vasconcellos Junior, 63, has served as a Director since December 2009. He has served as a Partner of Iposeira Partners Ltd, a provider of advisory services for mergers and acquisitions and restructuring transactions, since 2003. Mr. Vasconcellos served as a Consultant to IFC/World Bank from 2003 to 2008. He is currently a board member of Oi S.A., a Brazilian telecommunications company listed on the New York Stock Exchange and was previously a board member of Santos Brasil S.A. from 2006 to 2016.
A business strategist, Mr. Vasconcellos brings to the Board real-time experience in the areas of mergers and acquisitions, capital markets, finance, restructurings, and offers unique insights into global market strategies. In addition, Mr. Vasconcellos’s experience working on behalf of public financial institutions enables him to provide perspective and oversight with regard to the Company’s financial strategies.
7
Vincent Trius, 63, has served as a Director since May 2019 and is currently the Head of Global Innovation of JBS. Mr. Trius served as the President and director of Loblaw Company Limited, Canada’s leader in food retail and pharmacy, from 2011 to 2014. Before joining Loblaw, he held various executive and directorship positions at Carrefour SA from 2010 to 2011, Wal-Mart Stores, Inc. from 1996 to 2009, Dairy Farm International from 1992 to 1996, REVCO Drugstores Inc. from 1985 to 1992, and EJKorvetes Forest City Enterprises from 1978 to 1985. During his employment with Wal-Mart Stores Inc., Mr. Trius was awarded the “Top Executive of the Year - Brazilian Retail Sector” for years 2007 and 2006 and “Sam M. Walton Entrepreneur” in 2005, the highest honor award to a Wal-Mart associate worldwide. He completed Executive General Manager Courses from Harvard Business School in 2001 and Darden School of Business in 1995. He also completed International Retail Management Course from Ashridge College, U.K. in 1993. He obtained his degree in Economics from University of Economics, Barcelona, Spain in 1978.
Mr. Trius brings excellent leadership and expertise in areas of retail to the Board. His extensive experience managing business operations located internationally are valuable to the Board with regard to both the Company’s domestic and international operations.
Andre Nogueira de Souza, 52, has served as a Director since October 2014. Since January 1, 2013, Mr. Nogueira has served as President and Chief Executive Officer of JBS USA. Mr. Nogueira began his career with JBS USA Holding Lux S.à.r.l. (formerly known as JBS USA Holdings Inc.) (“JBS USA Holding”) in 2007, serving as Chief Financial Officer through 2011. He then served as Chief Executive Officer of JBS Australia, a subsidiary of JBS, in 2012. Prior to working for JBS USA Holding, Mr. Nogueira worked for Banco do Brasil in corporate banking positions in the U.S. and Brazil. Mr. Nogueira currently serves on the Executive Committee and as a board member of American Meat Institute, the Deans’ Leadership Council of the College of Agricultural Sciences—Colorado State University and Rabobank’s North American Agribusiness Advisory Board. Mr. Nogueira has an M.B.A. from Fundação Dom Cabral, a Master’s degree in Economics from Brasilia University, and a B.A. in Economics from Federal Fluminense University, and completed the Advanced Management Program at the University of Chicago Booth School of Business.
Mr. Nogueira brings outstanding leadership to our Board through his experience gained as a Chief Executive Officer of JBS USA and JBS Australia and Chief Financial Officer of JBS USA Holding. In addition, Mr. Nogueira brings an extensive understanding of the protein industry and financial matters to the Board.
Farha Aslam, 52, has served as a Director since May 2019. Ms. Aslam is currently a board member of Calavo Growers, an avocado company listed in the Nasdaq stock market. Prior to her retirement in 2018, Ms. Aslam served as the Managing Director and Senior Analyst of Food and Agribusiness Research from 2004 to 2018 at Stephens Inc., an independent financial services firm that provides deep research and independent thinking to its clients. She also successfully positioned and co-managed numerous equity offerings involving leading companies in the poultry and food industries. Ms. Aslam was formerly Vice President of Food and Agribusiness Research at Merrill Lynch from 1999 to 2004. Ms. Aslam was also a Risk Management Associate at UBS from 1996 to 1998 where she marketed fixed income products to hedge fund and mutual fund clients, and Financial Services Representative at SunAmerica Financial from 1992 to 1994. Ms. Aslam completed her M.B.A. with a focus on Finance from Columbia Business School in 1996 and obtained her B.A. in Economics from University of California, Irvine, California in 1991.
Ms. Aslam’s expertise in food and agribusiness research brings value to our Board. In addition, her multi-faceted financial analysis skills provide key insight to the Company’s financial and business operations.
Joanita Karoleski, 60, is currently the President of JBS Amazon Fund since September 2020, a JBS initiative to advance forest conservation and develop local communities. Ms. Karoleski is also currently serving in the Advisory Board in Instituto Mulheres do Verajo where she mentors and inspires new generations of executives. Before joining JBS, Ms. Karoleski held various leadership roles, including Chief Executive Officer from 2013 to 2020, at Seara Alimentos LTDA, a privately held meat company in Brazil. Prior to that, Ms. Karoleski served 34 years with Bunge Brasil, a world leader in the processing and supply of products and ingredients for grains and oilseeds, in various leadership roles, including Chief Information Officer from 2000 to 2004. Ms. Karoleski earned her bachelor’s degree in computer science and information in 1982 from FURB - Universidade de Blumenau.
8

Ms. Karoleski brings to the Board 30 years of strong leadership in the food production industry. Her expertise in business generation value, product portfolio management, branding and partnership and market development provides a valuable contribution to the Board and direction to the Company’s operations.
The Board of Directors recommends that you vote “FOR” the election of all of the individuals who have been nominated to serve as JBS Directors. Proxies will be so voted unless stockholders specify otherwise or withhold authority to vote.
9

PROPOSAL 2. ELECTION OF EQUITY DIRECTORS
Pursuant to our Certificate of Incorporation and our bylaws, our Board of Directors includes three members designated by the Equity Nominating Committee, which we refer to as our Equity Directors. For more information, see “Corporate Governance—Committee of the Board of Directors—Special Nominating Committees.”
The JBS Stockholders Agreement requires JBS and its affiliates to vote all of the Pilgrim’s Pride common stock that they hold in the same manner as the shares held by the Minority Investors with respect to the election or removal of Equity Directors. Consequently, the vote of the Minority Investors will determine the outcome of this Proposal 2.
At the Annual Meeting, nine Director nominees, including the three Equity Directors on our Board listed below, are to be elected, each to hold office for one year or until his or her successor is duly elected and qualified. Mr. Menon, who was appointed to the Board effective March 24, 2021, was identified as a potential director candidate by certain directors on our Board to fill the vacancy left on the Board following the passing of longtime Board member Charles Macaluso. Unless otherwise specified on the proxy card or voting instruction form, the shares represented by the proxy will be voted for the election of the three nominees named below. If any of the nominees for Equity Director becomes unavailable for election, it is intended that such shares will be voted for the election of a substitute nominee selected by the Equity Nominating Committee. Our Board of Directors has no reason to believe that any substitute nominee or nominees will be required, and all of the nominees have indicated that they will be willing and able to serve as directors.
Nominees for Equity Directors
The following is information about our Equity Director nominees, including their ages as of March 29, 2021.
Michael L. Cooper, 71, has served as a Director since December 2009. Mr. Cooper is currently a Managing Director of Kincannon & Reed, an executive search firm for the food and agribusiness sectors, where he has been employed since July 2004. Mr. Cooper was a Managing Partner of Kincannon & Reed and served as the Executive Vice President & CFO and a member of the board from July 2004 to December 2014. From September 2002 to July 2004, Mr. Cooper served as the Chief Executive Officer of Meyer Natural Angus. From January 1996 to July 2002, Mr. Cooper was employed by Perdue Farms, Inc., where he served in various roles, including as President, Retail Products, from February 2000 to July 2002, and as Senior Vice President and Chief Financial Officer from January 1996 through February 2000. From August 1992 to January 1996, he served as Vice President, Chief Financial Officer, Secretary and Treasurer of Rocco Enterprises. Mr. Cooper also served in various senior financial roles with Dial Corporation over a 14-year career with that company.
Mr. Cooper brings to the Board significant senior leadership, management, operational, financial and brand management experience. His extensive poultry industry experience enables him to offer a valuable insight on the business, financial and regulatory issues currently being faced by the poultry industry.
Arquimedes A. Celis, 67, has served as a Director since May 2019. Mr. Celis currently serves as a board member of Grupo Lala, a Mexican dairy company listed on the Mexican Stock Exchange, and Borden Dairy, a private company. He also served as a board member of Aeromexico from 2014 to 2016, which is listed on the Mexican Stock Exchange. Mr. Celis worked at Grupo Lala as Chief Executive Officer from 2001 to 2015. He previously spent 5 years as Chief Executive Officer of Industrias Bachoco, from 1996 to 2001. Prior to that, he worked for 21 years at Grupo Bimbo, where he held various executive positions, including Chief Executive Officer of Barcel. Mr. Celis earned a bachelor’s degree in Industrial Engineering from Veracruz Tech. He is a graduate of the Advanced Management program at IPADE, Universidad Panamericana, School of Business.
Mr. Celis brings to the Board valuable and extensive experience in the consumer packaged goods industry, with a focus on branded food products. Furthermore, his experience and industry knowledge enable him to provide important contributions to the Company’s strategy and operations.
10

Ajay Menon, 59, has served as a Director since March 2021. Mr. Menon is currently the President and CEO of Colorado State University Research Foundation (“CSURF”), and has been in this role since October 2019, where he is responsible for the protection, management and commercialization of intellectual property resulting from research at Colorado State University (“CSU”) and oversees the services that CSURF provides to both CSU and its affiliated institutions. He is also a current board member of Liberty Media Acquisition Company, a newly incorporated company formed for the purpose of effecting business combinations with one or more businesses. Mr. Menon served as Dean at CSU Colleges of Agricultural Sciences from July 2015 to October 2019 and Business from July 2002 to June 2015. In both these roles, he served as the chief administrative and academic officer shaping each College’s strategic direction, academic programs, budgets, and external relationships. He served as Colorado’s first Chief Innovation Officer under then-Governor John Hickenlooper from November 2011 to August 2013, where he helped established and lead the Colorado Innovation Network to develop an ecosystem that cultivates entrepreneurial and innovative activities. Mr. Menon holds a Ph.D. in Marketing and joined CSU in 1991 as a member of the Marketing Department faculty.
Mr. Menon brings senior leadership and expertise in business strategy and innovation. His global network and unique perspective to business leaders brings value to our Board and the Company’s global operations.
The Board of Directors recommends that you vote “FOR” the election of all of the individuals who have been nominated to serve as Equity Directors. Proxies will be so voted unless stockholders specify otherwise or withhold authority to vote.
11

CORPORATE GOVERNANCE
Board of Directors
Our Board of Directors has the responsibility for establishing broad corporate policies and for monitoring our overall performance, but it is not involved in our day-to-day operating decisions. Members of the Board are informed of our business through discussions with the Chief Executive Officer (“CEO”) and other officers, and through their review of analyses and reports sent to them each month, as well as through participation in Board and committee meetings.
Board Leadership Structure
The position of our Chairman of the Board and the office of the President and CEO are held by different persons.
We separate the roles of CEO and Chairman of the Board in recognition of the differences between the two roles. The CEO is responsible for setting the strategic direction for the Company and the day-to-day leadership and performance of the Company, while the Chairman of the Board provides guidance to the CEO and sets the agenda for Board meetings and presides over meetings of the full Board. We believe the division of duties is especially appropriate as it facilitates the appropriate level of communication between the Board of Directors and executive management for Board oversight of the Company and its management. In addition, we believe that the current separation provides a more effective monitoring and objective evaluation of the performance of the CEO.
Pursuant to our Governance Policies (available on our website at www.pilgrims.com, under the “Investor Relations - Governance” caption), when the Chairman is not an independent Director, the Board will either designate an independent Director to preside at the meetings of the non-management and independent Directors or they will prescribe a procedure by which a presiding Director is selected for these meetings. In the absence of another procedure being adopted by the Board, the person appointed will be the independent Director with the longest tenure on the Board in attendance at the meeting.
Board Risk Oversight
The Company’s management is responsible for the ongoing assessment and management of the risks the Company faces, including risks relating to capital structure, strategy, liquidity and credit, financial reporting and public disclosure, legal and regulatory compliance, information technology, cybersecurity, operations and governance. We focus not only on operational risk, but financial and strategic risk as well. These areas of focus include input costs (commodity pricing, live and processed product cost and spoilage), revenue risk (sales price and mix), financial risk (adequate controls, timely and effective reporting systems and other management and governance systems) as well as competitive risks and market trends. We aim to identify, categorize and respond to these risks to manage as much of their impact on our business as possible.
The Board oversees management’s policies and procedures in addressing these and other risks. Our executive officers regularly report to the non-executive directors, the Audit Committee and the Compensation Committee to ensure effective and efficient oversight of our activities and to assist in proper risk management and the ongoing evaluation of management controls. With respect to cybersecurity, our Board receives updates from the appropriate executives on the primary cybersecurity risks facing the Company and the measures the Company is taking to mitigate such risks. Additionally, each of the Board’s four committees (the Audit Committee, the Compensation Committee and the two Special Nominating Committees) monitor and report to the Board those risks that fall within the scope of such committees’ respective areas of oversight responsibility. For example, the full Board directly oversees strategic risks. The Special Nominating Committees directly oversee risk management relating to Director nominations and independence. The Compensation Committee directly oversees risk management relating to employee compensation, including any risks of compensation programs encouraging excessive risk-taking. Finally, the Audit Committee directly oversees risk management relating to financial reporting, accounting and financial controls, public disclosure and legal and regulatory compliance. The Audit Committee is also responsible for assessing the steps management has taken to monitor and control these risks and
12

exposures and discussing guidelines and policies with respect to the Company’s risk assessment and risk management.
Board of Directors Independence
Our Board of Directors has affirmatively determined that each of Michael L. Cooper, Wallim Cruz De Vasconcellos Junior, Farha Aslam, Ajay Menon and Arquimedes A. Celis has (and, prior to his passing in February 2021, Charles Macaluso had) no relationship that would interfere with the exercise of independent judgment in carrying out the responsibilities of a director and is independent within the meaning of Nasdaq rules.
Board of Directors and Committee Meetings and Executive Sessions
During 2020, the Board of Directors held 13 meetings. During 2020, each member of the Board attended at least 75% of the aggregate number of meetings of the Board and of the Board committee or committees on which the Director served during their time on the Board. Generally, the Board holds executive sessions of non-management Directors four times per year and meetings of independent Directors four times per year.
The Board of Directors has established the following Board committees: Audit, Compensation and Special Nominating Committees.
The following table summarizes the current membership of each of the Board’s Committees.
Name Audit CompensationSpecial Nominating
JBS EquityFarha Aslam(a) XArquimedes A. Celis XMichael L. Cooper X* X XAjay Menon(b) XDenilson Molina XAndre Nogueira de Souza X XGilberto Tomazoni X* XVincent Trius(c) XWallim Cruz De Vasconcellos Junior XTotal meetings in 2020 4 1 None None
* Committee Chair(a) Ms. Aslam joined the Audit Committee in March 2021, filling the vacancy left by Mr. Macaluso after his passing.(b) Mr. Menon joined the Board of Directors in March 2021.(c) Mr. Trius joined the JBS Nominating Committee in March 2021, replacing Mr. Cruz de Vasconcellos Junior.
The Company has no formal policy regarding the attendance of Directors at annual meetings of stockholders but encourages each Director to attend the annual meeting of stockholders. Eight of our Directors who served on the Board at the time of our 2020 annual meeting of shareholders attended that meeting.
Committees of the Board of Directors
To assist in carrying out its duties, the Board of Directors has delegated certain authority to the Audit, Compensation, JBS Nominating and Equity Nominating Committees. Each committee of the Board meets to examine various facets of our operations and take appropriate action or make recommendations to the Board of Directors.
Audit Committee. Our Audit Committee’s responsibilities include selecting our independent registered public accounting firm, reviewing the plan and results of the audit performed by our independent registered public accounting firm and the adequacy of our systems of internal accounting controls, discussion of significant accounting matters with management, overseeing our internal audit function and other risk assessment items and monitoring compliance with our conflicts of interest and business ethics policies. The Audit Committee is composed entirely of Directors who the Board of Directors has determined to be independent within the meaning of the
13
Nasdaq standards applicable to audit committee members and Rule 10A-3 under the Securities Exchange Act of 1934, as amended (the “Exchange Act”). The Board has determined that each of the members of the Audit Committee is financially literate for purposes of the applicable standards of Nasdaq and that Michael L. Cooper is an “audit committee financial expert” within the meaning of the regulations of the Securities and Exchange Commission (the “SEC”). The Audit Committee has an Audit Committee Charter, which is available on our website www.pilgrims.com under the “Investor Relations - Governance” caption.
Compensation Committee. Our Compensation Committee reviews the remuneration policies and practices of our officers. For more information on the role of our Compensation Committee, see “Compensation Discussion and Analysis—Role of the Compensation Committee and Executive Officer in Compensation Decisions.”
In reliance on certain exemptions available to controlled companies under Nasdaq rules, the Compensation Committee does not have a Charter. For more information on this and the composition of our Compensation Committee, see “Controlled Company Exemption” below.
Special Nominating Committees. Under our Certificate of Incorporation, the Board has two Special Nominating Committees, which include the JBS Nominating Committee and the Equity Nominating Committee.
The JBS Nominating Committee has the exclusive authority to nominate the JBS Directors, fill JBS Director vacancies and select the members of the JBS Nominating Committee. The Equity Nominating Committee has the exclusive authority to nominate the Equity Directors, fill Equity Director vacancies, select the members of the Equity Nominating Committee, and to call a special meeting of stockholders under certain circumstances. The Equity Nominating Committee, acting by majority vote, also has the exclusive right to control the exercise of our rights and remedies under the JBS Stockholders Agreement. Any member or alternate member of the Equity Nominating Committee may be removed only by the approval of a majority of the members of the Equity Nominating Committee.
For so long as JBS and its affiliates beneficially own 35% or more of our outstanding common stock, no person may be nominated as an Equity Director by the Equity Nominating Committee if JBS reasonably determines that such person (1) is unethical or lacks integrity or (2) is a competitor or is affiliated with a competitor of the Company.
Two Equity Directors must satisfy the independence requirements of Rule 10A-3 under the Exchange Act, and be financially literate, and, for so long as there are two or more Equity Directors on the Board, at least one Equity Director must qualify as an “audit committee financial expert” as that term is used in Item 407 of Regulation S-K under the Exchange Act (or any successor rule). Mr. Cooper, one of our three Equity Directors, currently qualifies as an “audit committee financial expert”.
If JBS and its affiliates own at least 50% of our outstanding common stock, at least one JBS Director is required:
• to be an independent director under the Nasdaq listing standards,
• to satisfy the independence requirements of Rule 10A-3 under the Exchange Act, and
• to be financially literate.
Mr. Wallim Cruz De Vasconcellos Junior and Ms. Farha Aslam, two of our JBS Directors, currently satisfies each of these requirements as members of the Audit Committee.
Each of the Board’s Special Nominating Committees has a Charter, current copies of which are available on our website at www.pilgrims.com, under the “Investor Relations - Governance” caption.
Director Nomination Process
The Board and the Special Nominating Committees acknowledge the benefits of broad diversity throughout the Company, including at the level of the Board. Accordingly, the Special Nominating Committees strive to achieve a balance of knowledge, experience and perspective on the Board, selecting Directors based upon, among
14

other things, their integrity, diversity of experience, business or other relevant experience or expertise, proven leadership skills, their ability to exercise sound judgment, understanding of the Company’s business environment, and willingness to devote adequate time and effort to Board responsibilities.
The following demonstrates the diversity of our current Board in terms of age, tenure, gender and race/ethnic background:
In addition, each of the Special Nominating Committees will consider stockholder recommendations for candidates for the Board, whether as a JBS Director or Equity Director. Recommendations should be sent to Pilgrim’s Pride Corporation, Corporate Counsel, 1770 Promontory Circle, Greeley, Colorado 80634. Such recommendations must satisfy our bylaw requirements relating to director nominations, as described in “Stockholder Proposals for 2021 Annual Meeting of Stockholders.” The Special Nominating Committees utilize the same criteria for evaluating candidates regardless of the source of the referral (including stockholders).
Pursuant to the Governance Policies, the Board and the Special Nominating Committees from time to time review the experience and characteristics appropriate for board members and director candidates in light of the Board’s composition at the time and skills and expertise needed for effective operation of the Board and its committees. In identifying prospective director candidates, the Special Nominating Committees may use multiple sources, including their members’ contacts and referrals from other Directors, members of management, the Company’s advisors, executive search firms, and, in the case of the JBS Director nominees, employees of JBS and its affiliates. When considering director candidates, the Special Nominating Committees seek individuals with backgrounds and qualities that, when combined with those of our incumbent directors, provide a blend of skills and experience to further enhance the Board's effectiveness. In connection with their annual evaluation of a slate of
15

nominees, the Special Nominating Committees may also assess the contributions of those directors recommended for re-election in the context of the Board evaluation process and other perceived needs of the Board.
When considering whether the JBS Director nominees and Equity Director nominees have the experience, qualifications, attributes or skills, taken as a whole, to enable our Board to satisfy its oversight responsibilities effectively in light of our business and structure, the Special Nominating Committees focused primarily on each person’s background and experience as reflected in the information discussed in each of the directors’ individual biographies set forth above in Proposals 1 and 2. We believe that our directors provide an appropriate mix of experience and skills relevant to the size and nature of our business. This process resulted in the nomination by the JBS Nominating Committee and the Equity Nominating Committee of the JBS Director nominees named in Proposal 1 and the Equity Director nominees named in Proposal 2, respectively.
Communications with the Board of Directors
Stockholders and other interested parties may communicate directly with our Board of Directors, any of its committees, all independent Directors, all non-management Directors, or any one Director serving on the Board by sending written correspondence to the desired person or entity addressed to the attention of our Corporate Counsel at Pilgrim’s Pride Corporation, 1770 Promontory Circle, Greeley, Colorado 80634. Communications are distributed to the Board, any subset of its members or to any individual Director, as appropriate, depending on the facts and circumstances outlined in the communication.
Information about our Executive Officers
The following is information about our executive officers, including their ages as of March 29, 2021.
Fabio Sandri, 50, was named Chief Executive Officer in September 2020 and has served as our Chief Financial Officer since June 2011. From April 2010 to June 2011, Mr. Sandri served as the Chief Financial Officer of Estacio Participações, the private post-secondary educational institution in Brazil. From November 2008 until April 2010, he was the Chief Financial Officer of Imbra SA, a provider of dental services based in Sao Paolo, Brazil. Commencing in 2005 through October 2008, he was employed by Braskem S.A., a New York Stock Exchange-listed petrochemical company headquartered in Camaçari, Brazil, first from 2005 to 2007 as its strategy director, then from 2007 until his departure as its corporate controller. He earned his Master of Business Administration degree in 2001 from the Wharton School at the University of Pennsylvania and a degree in electrical engineering in 1993 from Escola Politécnica da Universidade de São Paulo.
Matthew Galvanoni, 49, has served as our CFO since March 15, 2020. In this role, he also succeeded Mr. Sandri as our principal financial officer, as defined by SEC rules. Prior to his appointment to the Company, Mr. Galvanoni served as the vice president, finance, of Ingredion Incorporated, a leading global ingredients solutions company, since 2016. In this position Mr. Galvanoni managed all financial-related responsibilities for the North American division of the Fortune 500 global manufacturing company. Mr. Galvanoni joined Ingredion in 2012, serving in the role of global corporate controller and chief accounting officer, where he managed the company's accounting-related and external financial reporting responsibilities. Mr. Galvanoni started his career at PricewaterhouseCoopers LLP in 1994 and subsequently held several financial leadership positions at Exelon Corporation, where he most recently served as assistant corporate controller. Mr. Galvanoni graduated from the University of Illinois with a bachelor's degree in accounting and later received a Master of Business Administration from the Kellogg School of Management at Northwestern University.
Code of Business Conduct and Ethics and Corporate Governance Policies
Our Board of Directors has adopted a Code of Business Conduct and Ethics and Corporate Governance Policies of the Board of Directors. The full texts of the Code of Business Conduct and Ethics and Corporate Governance Policies are posted on our website at www.pilgrims.com, under the “Investor Relations - Governance” caption. We intend to disclose, if required, future amendments to, or waivers from, certain provisions of the Code of Business Conduct and Ethics on our website within four business days following the date of such amendment or waiver.
16

Controlled Company Exemption
We are a “controlled company” under the Nasdaq listing standards because JBS owns or controls over 50% of the voting power for the election of directors as of the Record Date. Accordingly, we take advantage of certain exemptions from certain corporate governance requirements under Nasdaq rules, including the requirement to have a fully independent compensation committee with a charter and for Director nominations to be made or recommended to the Board solely by a group of independent Directors.
2020 DIRECTOR COMPENSATION
Our director compensation program provides that each non-employee Director will receive an annual cash retainer of $140,000, paid quarterly in arrears. Each non-employee Director will receive restricted stock units (“RSUs”) award with a value of $60,000 annually, calculated using a stock price to be determined as of the date of the Company’s annual meeting of stockholders and vesting in full upon termination of service with the Board of Directors. The Chairmen of the Audit Committee and Compensation Committee will also receive a $15,000 annual cash retainer and other members of those committees will also receive a $10,000 annual cash retainer per year. In addition, we provide reimbursement to our Directors for their reasonable expenses related to their service as members of the Board of Directors and any committees thereof.
The following table sets forth certain information with respect to our Director compensation for the fiscal year ended December 27, 2020. Gilberto Tomazoni, Andre Nogueira de Souza and Vincent Trius did not receive any compensation for their service as Directors.
DirectorFees Earned or Paid
in Cash Stock Awards(a)All Other
Compensation TotalFarha Aslam $ 140,000 $ 60,000 $ — $ 200,000 Arquimedes A. Celis 140,000 60,000 — 200,000 Michael L. Cooper 165,000 60,000 — 225,000 Charles Macaluso (b) 150,000 60,000 — 210,000 Wallim Cruz De Vasconcellos Junior 150,000 60,000 — 210,000
(a) Non-employee Directors were each granted 2,726 RSUs based on April 29, 2020 grant date share price of $22.01. The dollar amounts represent the aggregate grant date fair value of stock awards granted during fiscal year 2020. The grant date fair value of an award is measured in accordance with Financial Accounting Standards Board Accounting Standards Codification Topic 718 (“FASB ASC Topic 718”) using the assumptions discussed in Note 16 to our financial statements for the fiscal year ended December 27, 2020 included in the Company's Annual Report on Form 10-K filed with the SEC on February 11, 2021 (the “Form 10-K”).
The following table provides a summary of the aggregate number of unvested RSUs outstanding for each of our directors with RSUs in the table above as of December 27, 2020:
DirectorUnvested RSUs
Outstanding
Farha Aslam 4,960 Arquimedes A. Celis 4,960 Michael L. Cooper 7,746 Wallim Cruz De Vasconcellos Junior 7,746
(b) On February 22, 2021, we announced the passing of longtime board member Charles Macaluso; all of his 7,746 outstanding RSUs vested in full on that same date.
17

PROPOSAL 3. APPROVAL OF THE ADVISORY VOTE ON EXECUTIVE COMPENSATION
The Board is providing stockholders with the opportunity to cast an advisory vote on the compensation of our NEOs as required by Section 14A of the Exchange Act. This proposal, commonly known as a “Say-on-Pay” proposal, gives you, as a stockholder, the opportunity to endorse or not endorse our executive compensation programs and policies and the compensation paid to our NEOs.
The “Say-on-Pay” vote is advisory and thus not binding on the Compensation Committee or the Board. The advisory vote will not affect any compensation already paid or awarded to any NEO and will not overrule any decisions by the Compensation Committee or the Board. The Board values the opinions of the Company’s stockholders as expressed through their votes and other communications. Although the vote is non-binding, the Compensation Committee and the Board will review and carefully consider the outcome of the advisory vote on executive compensation and those opinions when making future decisions regarding executive compensation programs.
At the 2020 annual meeting, approximately 87.0% of votes present (including abstentions and broker non-votes) voted for the “Say-on-Pay” proposal related to NEOs. In consideration of the results, the Compensation Committee acknowledged the support received from our stockholders and viewed the results as a confirmation of the Company’s existing executive compensation policies and decisions. Accordingly, we did not significantly change our executive compensation principles and objectives in 2020 in response to the advisory vote of our stockholders.
We design our executive compensation programs to implement our core objectives of attracting key leaders, motivating our executives to remain with the Company for long and productive careers, rewarding sustained financial and operating performance and leadership excellence and aligning the long-term interests of our executives with those of our stockholders. Stockholders are encouraged to read the Compensation Discussion and Analysis (“CD&A”) section of this proxy statement. In the CD&A, we have provided stockholders with a description of our compensation programs, including the principles and policies underpinning the programs, the individual elements of the compensation programs and how our compensation plans are administered. The Board believes that the policies and practices described in the CD&A are effective in achieving the Company’s goals. In furtherance of these goals, among other things, our compensation programs have been designed so that a significant portion of each executive’s total compensation is tied not only to how well he performs individually, but also, where applicable, is “at risk” based on how well the Company performs relative to applicable financial objectives. We also believe that equity incentives are aligned with our core objectives of aligning the long-term interests of our executives with those of our stockholders, attracting and retaining key leaders, and rewarding sustained performance and leadership excellence. The vote on this proposal relates to the overall compensation of our NEOs, as described in this proxy statement, pursuant to Item 402 of Regulation S-K of the SEC (namely, the CD&A, compensation tables and accompanying narrative disclosures found on pages 20 to 33). Accordingly, the Board recommends that you vote in favor of the following resolution:
“RESOLVED, that the compensation of the Company’s named executive officers, as disclosed in the Company’s proxy statement relating to the 2021 Annual Meeting of Stockholders, pursuant to Item 402 of Regulation S-K of the Securities and Exchange Commission, including the Compensation Discussion and Analysis, the compensation tables and accompanying narrative disclosures, is hereby APPROVED in a non-binding vote.”
The advisory vote on executive compensation is non-binding, meaning that our Board will not be obligated to take any compensation actions, or to adjust our executive compensation programs or policies, as a result of the vote.
The Company’s current policy is to provide stockholders with an opportunity to approve the compensation of the NEOs each year at the annual meeting of stockholders. It is expected that the next such vote will occur at the 2022 annual meeting of stockholders.
The Board of Directors recommends that you vote “FOR” the approval of the advisory vote on executive compensation. Proxies will be so voted unless stockholders specify otherwise.
18

REPORT OF THE COMPENSATION COMMITTEE
The Compensation Committee of the Board of Directors of the Company has reviewed and discussed with management the following Compensation Discussion and Analysis. Based on this review and discussion, the Compensation Committee recommended to the Board of Directors that the Compensation Discussion and Analysis be included in this Proxy Statement and incorporated by reference into the Company’s Annual Report on Form 10-K for the fiscal year ended December 27, 2020.
Compensation Committee
Gilberto Tomazoni, ChairmanMichael L. CooperAndre Nogueira de Souza
The information contained in this report shall not be deemed to be “soliciting material” or “filed” or incorporated by reference in future filings with the SEC, or subject to the liabilities of Section 18 of the Securities Exchange Act of 1934, as amended, except to the extent that the Company specifically incorporates it by reference into a document filed under the Securities Act of 1933, as amended, or the Securities Exchange Act of 1934, as amended.
19

COMPENSATION DISCUSSION AND ANALYSIS
Executive Summary
The discussion below summarizes a number of our performance highlights and how these affect the variable compensation of our named executive officers. For fiscal year 2020, we achieved net sales of $12.1 billion while generating net income of $94.8 million, and GAAP earnings per diluted share of $0.39. Our adjusted earnings before interest, taxes, depreciation and amortization (“Adjusted EBITDA”) was $788.1 million, or a 6.5% margin.
Our NEOs for 2020 were Mr. Fabio Sandri, our current President and CEO; and Mr. Jayson Penn, our former President and CEO. On February 10, 2021, Mr. Galvanoni was appointed as our new Chief Financial Officer (“CFO”), effective March 15, 2021. Mr. Galvanoni is not an NEO, because he did not serve as an executive officer during 2020. For more information, see “Compensation of our New Chief Financial Officer” below.
Company Performance and Pay
The Compensation Committee has designed key elements of our executive compensation program to align pay with our performance. The Compensation Committee has structured the terms of executive officer compensation so that a significant amount of our NEO’s annual compensation would be tied to both the performance of the Company and his respective individual performance, and therefore, would be “at risk.” The Compensation Committee’s compensation decisions for 2020 reflect the Company’s strong performance in multiple financial areas.
The Company’s specific 2020 achievements included the following, among others:
• The Company achieved strong results relating to net sales of $12.1 billion, net income of $94.8 million, or $0.39 per diluted share and net cash provided by operations of $724.2 million.
• As of our fiscal year ended December 27, 2020, the Company had $548.4 million of cash and cash equivalents.
• The Company continued its efforts on cost reductions, more effective processes, training and its total quality management program.
For more information regarding our financial performance during fiscal year 2020, see our Annual Report on the Form 10-K. For a reconciliation of non-GAAP financial measures for fiscal year 2020, see Annex A at the end of this proxy statement.
Our Executive Compensation
The Company’s compensation principles are intended to implement our core objectives of aligning the long-term interests of our executives with those of our stockholders, attracting and retaining key leaders, and rewarding sustained financial and operating performance and leadership excellence. In pursuing these objectives, the Compensation Committee uses certain guiding principles in designing the specific elements of the executive compensation program. These guiding principles and policies are that:
• incentive compensation should represent a significant portion of total compensation;
• compensation should be performance-based;
• incentive compensation should balance short-term and long-term performance;
• compensation levels should be market competitive; and
• superior performance should be rewarded.
In order to further these guiding principles, the key components of our compensation in 2020 included (1) cash compensation, in the form of base salaries and cash incentive compensation; (2) long-term equity compensation, in the form of RSUs that are earned, if at all, based on the achievement of financial performance
20

metrics designed to reinforce our business objectives and restricted stock and RSUs that vest over time; and (3) other non-cash compensation, such as retirement, health and welfare benefits, and certain other limited perquisites and benefits.
The Compensation Committee believes a significant portion of the compensation to our NEOs should be performance-based. The Compensation Committee also believes that each NEO’s compensation should be balanced with long-term incentives. Accordingly, a significant portion of the compensation to our NEOs was awarded in performance RSUs, which were earned when specific performance targets were met and vest ratably over a three-year period, and, in Mr. Sandri’s case, in the form of time-vesting RSUs. The Compensation Committee believes these equity awards more closely align our NEOs’ incentives with the long-term interests of our stockholders, including growing our business and improving the Company’s profitability relative to its peers.
Additionally, the Company maintains the following policies and practices that support the Company’s “pay-for-performance” principles:
• the prohibition of Company personnel, including the NEOs, from engaging in any short-term trading, speculative securities transactions, engaging in short sales, and buying or selling put options, call options or other derivative securities;
• holding an annual say-on-pay advisory vote;
• aligning our executive pay with performance, including by awarding performance based equity awards;
• maintaining clawback provisions in our Long-Term Incentive Program; and
• our policy of not having any change-in-control payments or excise tax gross-ups.
Following the end of each fiscal year, the Compensation Committee conducts a review of all components of the Company’s compensation program. In conducting its review, the Compensation Committee reviews information related to each NEO’s individual performance, total compensation, each of the components of compensation, and the Company’s performance. Our compensation principles and objectives did not significantly change in 2020.
Executive Compensation Principles, Policies and Objectives
The Compensation Committee is responsible for establishing the principles that underlie our executive compensation program and guiding the design and administration of specific plans, agreements and arrangements for our executives. Our compensation principles are intended to implement our core objectives of attracting key leaders, motivating our executives to remain with the Company for long and productive careers, rewarding sustained financial and operating performance and leadership excellence and aligning the long-term interests of our executives with those of our stockholders. Our executive compensation principles and policies, which are established and refined from time to time by the Compensation Committee, are described below:
Incentive compensation should represent a significant portion of total compensation. A significant portion of our executive officers’ total compensation should be tied not only to how well they perform individually, but also, where applicable, should be “at risk” based on how well the Company performs relative to applicable financial objectives.
Compensation should be performance-based. Compensation should be subject to performance-based awards as an executive officer’s range of responsibility and ability to influence the Company’s results increase.
Incentive compensation should balance short-term and long-term performance. Executive compensation should be linked to building long-term stockholder value while remaining consistent with our business objectives and values. Our executive compensation program addresses this objective by including long-term incentives in the form of equity-based awards, such as restricted stock and RSUs.
Compensation levels should be market competitive. Compensation should be competitive in relation to the marketplace and the Compensation Committee therefore considers market compensation data compiled and prepared by management.
21

Superior performance should be rewarded. Outstanding achievement should be recognized. The Board and the Compensation Committee consider the Company’s strategies when identifying the appropriate incentive measures and when assigning individual goals and objectives to the NEO and evaluate the individual’s performance against those goals and objectives in setting compensation.
In addition, we believe that our compensation programs for executive officers should be appropriately tailored to encourage employees to grow our business, but not encourage them to do so in a way that poses unnecessary or excessive material risk to us. For 2020, the Compensation Committee believes that our CEO and CFO compensation is consistent with our performance and economic and competitive industry conditions, and equity incentives are aligned with our actions to grow our business and improve the Company’s profitability relative to similarly-situated companies.
Role of the Compensation Committee and Executive Officer in Compensation Decisions
The Compensation Committee and the Board had the overall responsibility for approving executive compensation and overseeing the administration of our incentive and employee benefit plans. The Compensation Committee is responsible for establishing and overseeing the overall compensation structure, policies and programs of the Company and assessing whether our compensation structure resulted in appropriate compensation levels and incentives for executive management of the Company. The Compensation Committee’s objective is to ensure that the total compensation paid to each executive officer was fair, reasonable, competitive and motivational. The Compensation Committee conducts a review of all compensation for our NEOs and works with our CEO to evaluate and approve compensation of our senior executives other than the CEO. To the extent the roles are not held by the same person, our CFO reports directly to our CEO, who supervises the day-to-day performance of the CFO. Accordingly, in that case, the CEO evaluates the CFO’s individual performance against the Company-based performance factors, and makes recommendations to the Compensation Committee regarding his compensation. The Compensation Committee strongly considers the compensation recommendations and the performance evaluations by our CEO and any recommendations of the Board of Directors with respect to any non-CEO compensation. Neither the Compensation Committee nor Company management engaged a compensation consultant in 2020 for the purpose of determining or recommending the amount or form of executive compensation.
In determining the components of compensation, the Compensation Committee discusses strategic goals for our compensation program and considers the role of each of the elements of compensation in relationship to the overall pay mix. The Compensation Committee considers the total compensation targeted for each of the NEOs, individual and Company performance and the relationship between pay and performance. The Compensation Committee works with the CEO and the Company’s human resources representative, who make recommendations consistent with the guidelines established by the Compensation Committee to each element of compensation of our executive officers. The Compensation Committee evaluates the total compensation packages for our senior executives after considering the recommendations of the CEO and the Company’s human resources representative and evaluating the competitive market for executive talent, the Company’s performance relative to its competitors and the past compensation paid to each of our NEOs. The CEO does not make recommendations or participate in the Compensation Committee’s process for establishing the compensation of the CEO.
In 2020, the Compensation Committee used a competitive market study prepared by Arthur J. Gallagher & Co. (“Gallagher”) that compared the compensation of the NEOs against two data sources:
• a group of similarly-situated public companies; and
• a survey of Russell 3000 index companies, sorted by size and industry.
The Compensation Committee used the Gallagher study in considering the market competitiveness of our executive compensation program, but did not use the Gallagher study for benchmarking or in setting executive compensation targets or levels. Further, Gallagher did not provide any advice to the Compensation Committee or management of the Company with respect to executive compensation decisions. Gallagher was engaged by the Company and the Gallagher study was prepared in 2017 at the direction of the Company. For 2020, the Compensation Committee reviewed the Gallagher study in considering the market competitiveness of our executive compensation program.
22

If the Compensation Committee determines that there is a misalignment in pay for performance or if the compensation of the NEOs is not appropriately aligned with the competitive market, the Committee may determine, in its discretion, to provide additional compensation to our NEOs in the form of cash or equity or combination thereof. The Compensation Committee believes that discretionary awards, where warranted, can be effective in motivating, rewarding and retaining our NEOs. For additional information, see “Additional Equity Awards” below.
Say-on-Pay
At the annual meeting of our stockholders held on April 28, 2017, our stockholders recommended in an advisory vote and the Compensation Committee subsequently approved that the Company holds an advisory vote on the compensation of the Company’s NEOs annually. At the annual meeting of our stockholders held on April 29, 2020, approximately 87.0% of votes present (including abstentions and broker non-votes) voted for the “Say-on-Pay” proposal related to our NEOs. In consideration of the results, the Compensation Committee acknowledged the support received from our stockholders and viewed the results as a confirmation of the Company’s existing executive compensation policies and decisions. Accordingly, we did not significantly change our compensation principles and objectives in 2020 in response to the advisory vote of our stockholders.
Compensation of our Current President and Chief Executive Officer
On June 14, 2020, the Compensation Committee recommended, and the Board approved, Mr. Sandri’s compensation package as our interim President and CEO and CFO effective as of June 15, 2020 (and effective September 22, 2020, as our President and CEO and CFO). Until then, Mr. Sandri had been our CFO. In connection with his appointment in June, Mr. Sandri became entitled to the Company’s compensation package awarded for the chief executive officer role. In particular, during fiscal year 2020, Mr. Sandri became entitled to an annual base salary for 2020 of $900,000 (increased from $550,000 from his role as CFO), an annual cash bonus pursuant to the Short-Term Management Incentive Plan (the “STIP”) and performance based equity grants under our long-term equity incentive programs (including an increased target award under the 2020 Program (as defined below) in line with chief executive officer compensation). Additionally, Mr. Sandri is eligible to participate in the Company’s other benefit plans that are generally available to the Company’s senior officers.
Our former CEO, Mr. Penn, began a paid leave of absence effective June 15, 2020, and as of September 22, 2020, Mr. Penn was no longer with the Company and accordingly, was no longer compensated after such date, forfeited his right to the STIP for 2020 and all unvested equity awards, and received no severance.
Compensation of our New Chief Financial Officer
On February 10, 2021, the Board appointed Matthew Galvanoni as CFO of the Company, effective Monday, March 15, 2021. Mr. Galvanoni is entitled to (i) a base salary of $500,000, (ii) after 60 days of employment, eligibility to participate in the Company’s benefits programs including group medical, vision and dental plans, life and long-term disability insurance and a 401(k) plan; (iii) a homeowner relocation package through CARTUS relocation services; (iv) eligibility to participate in the Company’s annual incentive program with an individual annual bonus target equal to 100% of base salary and a maximum payment of 200% of base salary, with such bonus pro-rated for any partial year of service; and (v) reimbursement for 60 days of COBRA premiums incurred by Mr. Galvanoni prior to his becoming a participant in the Company’s group health plans. In addition, as part of the compensation package, the Board approved two grants of equity to Mr. Galvanoni:
• a grant of fully vested shares of the Company on April 1, 2021 equal to the number of shares with a fair market value of $200,000 on the date of grant.
• a grant of performance vesting awards under the Company’s 2021 Long-Term Incentive Program (as further described below) equal to 27,350 performance stock units at target, with a maximum award size of 200% of target. Following a performance period ending December 26, 2021, the RSUs earned based on 2021 performance will vest ratably over a three-year service period and settle on each of December 31, 2022, December 31, 2023 and December 31, 2024.
23
Components of Compensation
The principal components of compensation for our NEOs were as follows:
• base salary;
• bonuses, including annual cash incentive compensation;
• long-term incentive compensation, including awards of RSUs earned based on the achievement of performance goals, time-vested restricted stock and RSUs;
• retirement, health and welfare benefit plans; and
• certain limited perquisites and other personal benefits.
Base Salary
We provide our NEOs and other employees with a base salary to provide a fixed amount of compensation for services during the fiscal year. Base salaries and any increases thereto are determined by the Compensation Committee for each of the executive officers on an individual basis, taking into consideration an assessment of individual contributions to Company performance, length of tenure, compensation levels for comparable positions, internal equities among positions and, with respect to executives other than the CEO, the recommendations of the CEO. During fiscal year 2020, our Compensation Committee approved an increase in the annual base salary of Mr. Sandri, from $550,000 as our CFO, to $900,000, in connection with his appointment effective June 15, 2020, as our interim President and CEO and CFO. Mr. Sandri’s base salary remained the same once he became our new President and CEO on September 22, 2020.
Annual Cash Incentive Compensation
Short-Term Management Incentive Plan
The Compensation Committee currently administers the STIP, which provides for the grant of annual incentive awards payable upon achievement of specified performance goals. The awards under the STIP may be paid, at the option of the Compensation Committee, in cash, or in the Company’s common stock, or in any combination of cash and common stock. For fiscal year 2020, all STIP awards were payable in cash. For each performance period, the Compensation Committee may establish one or more objectively determinable performance goals, based upon one or more of a variety of performance criteria specified in the STIP. In addition, for bonus awards not intended to qualify as qualified performance-based compensation, the Compensation Committee may establish performance goals based on other performance criteria as it deems appropriate in its sole discretion.
2020 STIP Goals. As part of developing the Company’s compensation strategy for the fiscal year ended December 27, 2020, the Compensation Committee established annual performance goals and payout amounts for our NEOs under the STIP based on income (loss) before income taxes as a percentage of the Company’s net revenues (“PBT Margin”). The Compensation Committee used each NEO’s base salary to establish his target payout amount under the STIP, except that it pro-rated Mr. Sandri’s target payout based on his transition during the fiscal year from our CFO to our President and CEO.
The Compensation Committee chose to utilize PBT Margin in setting performance goals and target payout amounts because PBT Margin has a higher correlation to cash flow and liquidity than EBITDA and because it aligns with the Company’s goals of driving overall operational results.
For fiscal year 2020, the Compensation Committee established the following PBT Margins for our NEOs:
24

PBT MarginCEO Bonus
as a % of Base SalaryCFO Bonus
as a % of Base Salary2% (Threshold) 25% 25%
3% 50% 50%4% 75% 75%
5% (Target) 100% 100%6% 125% 125%7% 150% 150%8% 175% 175%9% 200% 200%
2020 STIP Awards. For purposes of the NEOs’ bonuses pursuant to the STIP, the PBT Margin for 2020 was determined by the Compensation Committee in accordance with the Company’s audited financial statements. Following the end of 2020, the Compensation Committee determined the Company’s PBT Margin for 2020, totaled 50%. For these purposes, the Compensation Committee determined to exclude results from Pilgrim’s Pride Limited (“PPL”), which the Company acquired in October 2019, and certain non-recurring expenses such as the Company’s plea agreement with the Department of Justice (“DOJ agreement”) and settlement agreement relating to broiler chicken antitrust litigation in the STIP calculation for fiscal year 2020. For more information about how PBT Margin is calculated from our audited financial statements, see Annex A at the end of this proxy statement.
Consequently, after a review of the PBT Margin for 2020, the Compensation Committee awarded Mr. Sandri a cash bonus of $371,107 under the 2020 STIP.
Long-Term Incentive Compensation
The Company maintains the 2019 Long-Term Incentive Plan (which replaced the 2009 Long-Term Incentive Plan, and together are referred to herein as the “Plan”), which is administered by the Compensation Committee. The 2019 Long-Term Incentive Plan was approved by our stockholders at the 2019 Annual Stockholders Meeting and replaced the 2009 Long-Term Incentive Plan, which expired on December 28, 2019 pursuant to its terms. The programs described below describe the terms of our equity awards made pursuant to the Plan.
2020 Long-Term Incentive Program
For fiscal year 2020 compensation, the Compensation Committee adopted the 2020 Long-Term Incentive Program (the “2020 Program”) under the Plan. Grants under the 2020 Program were made to our NEOs in January 2020. The purpose of the 2020 Program is to demonstrate improvement against our competitors in the industry. Under the 2020 Program, participants received target awards equal to a specified percentage of their base salary, with such awards being converted to RSUs upon the Company’s achievement of the performance goals under the 2020 Program. Following the one-year performance period ended December 27, 2020, the RSUs that are earned will vest ratably over a three-year service period and settle on December 31, 2021, December 31, 2022 and December 31, 2023. When each RSU vests, it converts to one share of the Company’s common stock. Mr. Sandri participated in the 2020 Program. Mr. Penn forfeited his right to all awards made under the 2020 Program when he left the Company effective September 22, 2020, as none were vested as of such date.
Performance Metrics for 2020 Program. The Compensation Committee selected performance goals for the 2020 Program to measure the Company’s profitability as compared to the profitability of specified competitors in the Company’s three geographic business segments—the U.S., Mexico and the U.K. and Europe.
• U.S. Business Segment Performance Metric: The profitability metric selected by the Compensation Committee for the U.S. business segment is earnings before interest and taxes (“EBIT”) per processed pound, which is calculated as EBIT divided by the pounds of chicken products produced over the same period. The Compensation Committee selected a performance goal that compared EBIT per processed pound generated by our U.S. geographic business segment in 2020 to the average EBIT per processed pound generated in 2020 by the 21 U.S. poultry companies reported by Agri Stats, Inc, (the “Agri Stats Survey”).
25

• Mexico Business Segment Performance Metric: The profitability metric selected by the Compensation Committee for the Mexico geographic business segment is EBIT margin, which is calculated as EBIT divided by net sales. The Compensation Committee selected a performance goal that compared EBIT margin generated by our Mexico geographic business segment in 2020 to the EBIT margin generated by Industrias Bachoco S.A.B. de C.V. in 2020, a regional competitor.
• U.K. and Europe Business Segment Performance Metric: The profitability metric selected by the Compensation Committee for the U.K. and Europe geographic business segment is EBIT margin, which is calculated as EBIT divided by net sales. The Compensation Committee selected a performance goal that compared EBIT margin generated by our U.K. and Europe geographic business segment to the average EBIT margin generated by three regional competitors in 2020 2 Sisters Food Group Limited, Cranswick plc, and Scandi Standard AB. The Compensation Committee did not include PPL’s results in the U.K. and Europe geographic business segment’s EBIT margin for fiscal year 2020.
In evaluating the selection of the specified key competitors identified above, the Compensation Committee considered the financial comparative appropriateness of the Company’s competitors in Mexico and the U.K. and Europe. The Compensation Committee chose the EBIT metric under the Agri Stats Survey and the EBIT metric for Mexico and the U.K. and Europe because they provide a direct link between a NEO’s compensation and company performance, assessed in light of relevant peer companies and any positive and negative adjustments for unexpected market conditions.
2020 Program Grants. In January 2020, Mr. Sandri and Mr. Penn were granted performance-based awards under the 2020 Program that would be settled in RSUs if the awards were earned. The target award for Mr. Sandri was 16,602 RSUs and for Mr. Penn was 28,911 RSUs. Mr. Penn forfeited his right to all awards made under the 2020 Program when he left the Company. On September 22, 2020, the Board granted Mr. Sandri a target award of 28,911 RSUs, replacing his initial target award of 16,602 RSUs, in connection with his appointment as President and CEO effective as of that date and in recognition of the increased responsibilities of that role. Each NEO was entitled to receive a weighted percentage of his target award based on the Company’s achievement in each geographic business segment as follows:
Geographic Segment
Geographic Segment Weighted
% Performance MeasureU.S. 70% EBIT per processed pound (in cents) as reported in the Agri Stats
SurveyMexico 15% Percent performance of the Company’s EBIT margin relative to
selected competitor’s reported results for fiscal year 2020U.K. and Europe 15% Percent performance of the Company’s EBIT margin relative to
selected competitors’ reported results for fiscal year 2020
For the 2020 Program, the Compensation Committee set the target level of performance of the Company’s U.S. operations at the average set forth in the Agri Stats Survey, or two-and-a-half cents per processed pound. For the determination of percent performance of the Company relative to its competitor in Mexico, the Compensation Committee set the target level of performance at 4.00% higher than the reported EBIT margin of the Company’s competitor based on historical performance (including lower Company performance in fiscal year 2019) and expectations for fiscal year 2020 performance. For the determination of percent performance of the Company relative to its competitors in the U.K. and Europe, the Compensation Committee set the target level of performance at 1.00% higher than the reported average EBIT margin of the Company’s competitors based on historical performance (including lower Company performance in fiscal year 2019) and expectations for fiscal year 2020 performance. The Compensation Committee believes that these performance targets establish rigorous performance goals in each geographic business segment that are aligned with the Company’s short- and long-term operating and financial objectives.
The following table sets forth the performance targets for the 2020 Program grants:
26
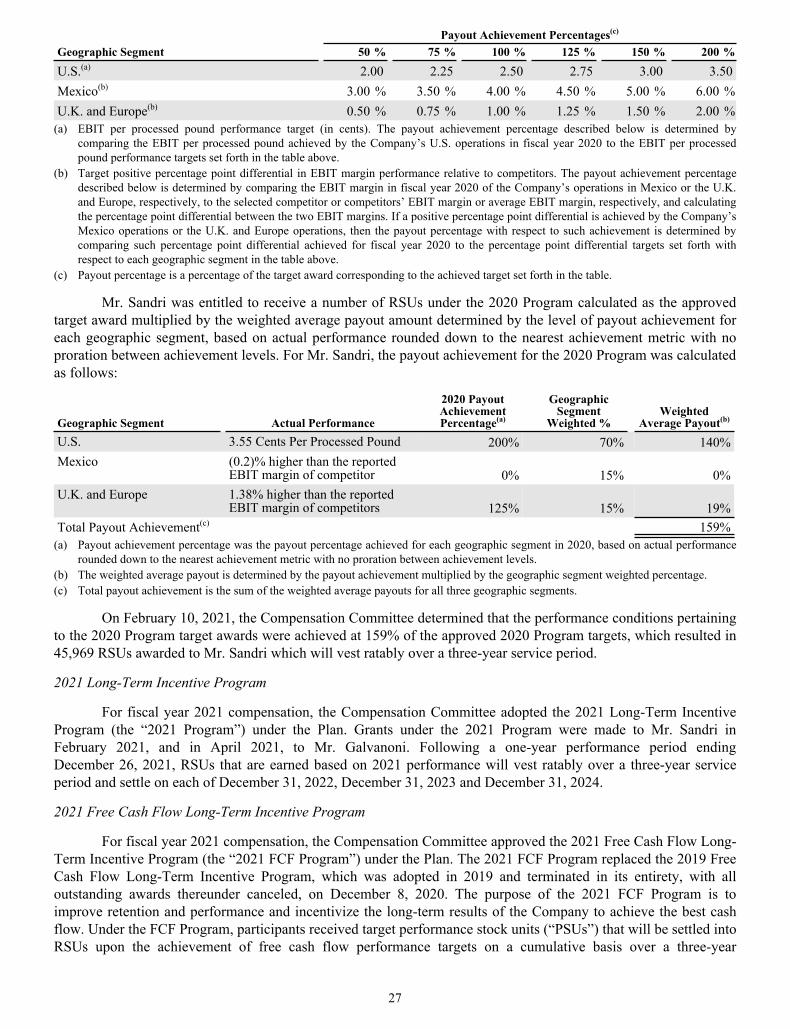
Payout Achievement Percentages(c)
Geographic Segment 50 % 75 % 100 % 125 % 150 % 200 %U.S.(a) 2.00 2.25 2.50 2.75 3.00 3.50Mexico(b) 3.00 % 3.50 % 4.00 % 4.50 % 5.00 % 6.00 %U.K. and Europe(b) 0.50 % 0.75 % 1.00 % 1.25 % 1.50 % 2.00 %
(a) EBIT per processed pound performance target (in cents). The payout achievement percentage described below is determined by comparing the EBIT per processed pound achieved by the Company’s U.S. operations in fiscal year 2020 to the EBIT per processed pound performance targets set forth in the table above.
(b) Target positive percentage point differential in EBIT margin performance relative to competitors. The payout achievement percentage described below is determined by comparing the EBIT margin in fiscal year 2020 of the Company’s operations in Mexico or the U.K. and Europe, respectively, to the selected competitor or competitors’ EBIT margin or average EBIT margin, respectively, and calculating the percentage point differential between the two EBIT margins. If a positive percentage point differential is achieved by the Company’s Mexico operations or the U.K. and Europe operations, then the payout percentage with respect to such achievement is determined by comparing such percentage point differential achieved for fiscal year 2020 to the percentage point differential targets set forth with respect to each geographic segment in the table above.
(c) Payout percentage is a percentage of the target award corresponding to the achieved target set forth in the table.
Mr. Sandri was entitled to receive a number of RSUs under the 2020 Program calculated as the approved target award multiplied by the weighted average payout amount determined by the level of payout achievement for each geographic segment, based on actual performance rounded down to the nearest achievement metric with no proration between achievement levels. For Mr. Sandri, the payout achievement for the 2020 Program was calculated as follows:
Geographic Segment Actual Performance
2020 Payout Achievement Percentage(a)
Geographic Segment
Weighted %Weighted
Average Payout(b)
U.S. 3.55 Cents Per Processed Pound 200% 70% 140%Mexico (0.2)% higher than the reported
EBIT margin of competitor 0% 15% 0%U.K. and Europe 1.38% higher than the reported
EBIT margin of competitors 125% 15% 19%Total Payout Achievement(c) 159%
(a) Payout achievement percentage was the payout percentage achieved for each geographic segment in 2020, based on actual performance rounded down to the nearest achievement metric with no proration between achievement levels.
(b) The weighted average payout is determined by the payout achievement multiplied by the geographic segment weighted percentage.(c) Total payout achievement is the sum of the weighted average payouts for all three geographic segments.
On February 10, 2021, the Compensation Committee determined that the performance conditions pertaining to the 2020 Program target awards were achieved at 159% of the approved 2020 Program targets, which resulted in 45,969 RSUs awarded to Mr. Sandri which will vest ratably over a three-year service period.
2021 Long-Term Incentive Program
For fiscal year 2021 compensation, the Compensation Committee adopted the 2021 Long-Term Incentive Program (the “2021 Program”) under the Plan. Grants under the 2021 Program were made to Mr. Sandri in February 2021, and in April 2021, to Mr. Galvanoni. Following a one-year performance period ending December 26, 2021, RSUs that are earned based on 2021 performance will vest ratably over a three-year service period and settle on each of December 31, 2022, December 31, 2023 and December 31, 2024.
2021 Free Cash Flow Long-Term Incentive Program
For fiscal year 2021 compensation, the Compensation Committee approved the 2021 Free Cash Flow Long-Term Incentive Program (the “2021 FCF Program”) under the Plan. The 2021 FCF Program replaced the 2019 Free Cash Flow Long-Term Incentive Program, which was adopted in 2019 and terminated in its entirety, with all outstanding awards thereunder canceled, on December 8, 2020. The purpose of the 2021 FCF Program is to improve retention and performance and incentivize the long-term results of the Company to achieve the best cash flow. Under the FCF Program, participants received target performance stock units (“PSUs”) that will be settled into RSUs upon the achievement of free cash flow performance targets on a cumulative basis over a three-year
27

performance period from January 1, 2021 to December 31, 2023. Following the three-year performance period ending December 31, 2023, the earned PSUs will vest ratably over a three-year service period and settle on July 1, 2024, July 1, 2025 and July 1, 2026. Mr. Sandri is a participant in the 2021 FCF Program.
Additional Equity Awards
2020 Time-Vesting RSUs
On December 8, 2020, the Compensation Committee recommended, and the Board approved, a grant of 70,000 time-vesting RSUs to Mr. Sandri. The RSUs represent a special retention bonus in connection with his appointment as our President and CEO on September 22, 2020 and is subject to continuous employment and compliance with restrictive covenants. The RSUs vests ratably over three years on July 1, 2022, July 1, 2023 and July 1, 2024.
Previously Granted Time-Vesting RSUs
On April 30, 2019, the Compensation Committee recommended, and the Board approved, a grant of 100,000 time-vesting RSUs to each of Messrs. Sandri and Penn. These RSUs vested on July 1, 2020. The Board elected to pay Mr. Sandri and Mr. Penn cash in lieu of shares of common stock, based on the closing market price of the Company’s common stock on August 4, 2020 of $15.12 per share.
Retirement, Health and Welfare Benefit Plans
401(k) Salary Deferral Plan. Our NEOs receive no special employee benefits. During 2020, our NEOs were eligible to participate on the same basis as other employees in the Company’s 401(k) salary deferral plan (the “401(k) Plan”). Contributions to the 401(k) Plan are made up of a 30% matching contribution on the first 6% of pay to the extent such contributions are not in excess of the Code limits on contributions to 401(k) plans. Under the 401(k) Plan, the Company may make additional matching contributions or other profit sharing contributions at its discretion. There were no discretionary contributions in 2020. We do not have any other pension plan for our NEOs. In 2020, Mr. Sandri and Mr. Penn participated in the 401(k) Plan.
Nonqualified Deferred Compensation. The Company sponsors the Pilgrim’s Pride Corporation 2015 Deferred Compensation Plan (the “Deferred Compensation Plan”) to help provide for the long-term financial security of our U.S. employees who meet the Internal Revenue Service definition of a “highly compensated employee,” which includes our NEOs and certain other key personnel. Under the Deferred Compensation Plan, participants may elect to defer up to 80% of their base salary and/or up to 80% of their annual cash bonus payment as part of their personal retirement or financial planning. Highly compensated employees who elect to defer compensation in the Deferred Compensation Plan must do so annually prior to the beginning of each calendar year and may direct the investment of the amount deferred and retained by us. The Deferred Compensation Plan is administered by the administrative committee appointed by our Board, and deferred compensation may be invested in authorized funds which are similar to the investment options available under our 401(k) Plan. Under the Deferred Compensation Plan, the Company may make additional matching contributions at its discretion and currently makes a matching contribution of up to 40% on the first 3% of pay. In 2020, Mr. Sandri was the only NEO who participated in the Deferred Compensation Plan.
Health and Welfare Benefit Plans. The Company also provides a variety of health and welfare benefit plans to all eligible employees to offer employees and their families protection against catastrophic loss and to encourage healthy lifestyles. The health and welfare programs include medical, wellness, pharmacy, dental, vision, life insurance and accidental death and disability. Our NEOs generally are eligible for the same benefit programs on the same basis as our other domestic employees.
Perquisites and Other Personal Benefits
The Company provides certain limited perquisites and other personal benefits that we believe to be reasonable and consistent with our overall compensation program to better enable us to attract and retain competent executives for key positions. The Compensation Committee considers all and periodically reviews the levels of perquisites and other personal benefits in establishing the total compensation of our executive officers. During 2020,
28

our NEOs were eligible to receive company-paid or company-subsidized life insurance and disability coverage on the same basis as our other U.S. employees. The Compensation Committee considered these perquisites and other personal benefits as essential and consistent with market practice in order to induce our NEOs to remain with the Company.
Severance Plan
The Company maintains the Pilgrim’s Pride Corporation Severance Plan (the “Severance Plan”) which provides severance payments to eligible employees if employment was terminated “without cause.” The Severance Plan does not cover termination due to death, disability or retirement, termination for cause or termination at the end of the leave of absence that exceeded the maximum permitted by the Company. Under the Severance Plan, in exchange for signing an enforceable waiver and release agreement, upon termination without cause, an NEO is entitled to receive as severance pay an amount equal to: 16 weeks of base pay plus two weeks of base pay per year of service in excess of two years up to a maximum of 52 weeks of base pay. In addition, if the Company provided less than two-weeks’ notice of termination without cause, an executive officer would have been entitled to up to two additional weeks of base pay in lieu of notice. Additional benefits available to eligible employees under the Severance Plan included career transition services as determined by the Company, including without limitation, written materials, company-sponsored training and job fairs. The terms of each NEO’s compensation do not provide for any change-in-control or retirement arrangements other than the vesting of RSUs granted to them under the Plan under certain circumstances in the case of a “change-in-control.” Mr. Penn has not received severance upon his departure from the Company on September 22, 2020. See the “2020 Potential Payments Upon Termination or Change-in-Control” table for additional information regarding the severance payable to our NEOs.
Policy on Hedging
The Company strongly discourages directors, officers and employees from engaging in hedging and monetization transactions with respect to Company securities. Hedging or monetization transactions can be accomplished through the use of various financial instruments, including prepaid variable forwards, equity swaps, collars and exchange funds. These transactions may permit continued ownership of the Company’s securities obtained through employee benefit plans or otherwise without the full risks and rewards of ownership. Any director, officer or employee wishing to enter into such an arrangement must first obtain pre-clearance from the Company’s CFO. However, if any hedging transaction is considered a short-sale under Company policy, then it is prohibited.
Policy on Pledging
The Company also strongly discourages directors, officers and employees from holding Company securities in a margin account or pledging such securities as collateral. Consequently, any director, officer or employee wishing to enter into such an arrangement must first obtain pre-clearance from the CFO.
29

EXECUTIVE COMPENSATION
Summary Compensation Table
The table below summarizes compensation paid to or earned by our NEOs for the fiscal years indicated.
Name and Principal Position YearSalary
($)Bonus
($)
Stock Awards(c)
($)
Non-EquityIncentive
PlanCompensation(f)
($)
All Other Compensation(g)
($)Total
($)Fabio Sandri(a) 2020 731,731 — 1,425,900 (d) 371,107 18,193 2,546,931
Current President and CEO 2019 507,615 — 2,691,000 (e) 507,125 11,075 3,716,815 2018 475,654 — 3,978,477 113,424 20,901 4,588,456
Jayson Penn(a)(b) 2020 720,000 — — — 3,665 723,665 Former President and CEO 2019 859,385 — 2,691,000 (e) 863,836 4,122 4,418,343
(a) As discussed above under “Compensation Discussion and Analysis - Compensation of our Current President and Chief Executive Officer,” effective June 15, 2020, Mr. Penn, our then-President and CEO began a paid leave of absence from the Company, and Mr. Sandri was appointed as our interim President and CEO and CFO. Until then, Mr. Sandri had been our CFO. On September 22, 2020, Mr. Sandri was appointed our new President and CEO. Mr. Sandri’s 2020 salary represents the sum of the prorated portions of his $550,000 base salary as CFO prior to his appointment as our interim President and CEO and CFO, and of his $900,000 base salary following his appointment to that role.
(b) Mr. Penn’s 2020 salary represents the prorated portion of his $900,000 base salary until the end of his paid leave of absence. Following this leave of absence, Mr. Penn was entitled to no further compensation, forfeited his right to the STIP for 2020 and all unvested equity awards, and received no severance.
(c) The dollar amounts represent the aggregate grant date fair value of stock awards granted during each of the years presented. The grant date fair value of an award is measured in accordance with FASB ASC Topic 718 using the assumptions discussed in Note 16 to the Form 10-K. For the awards subject to performance conditions, the grant date fair value is based upon the probable outcome of such conditions. For 2020, the dollar amounts include only the grant date value of 70,000 time-vesting RSUs granted to Mr. Sandri. These dollar amounts exclude the performance based equity granted in 2020 under the 2020 Program, because the awards were not deemed probable of achievement as of the grant dates. Assuming the highest level of performance conditions will be achieved, the aggregate grant date fair value of the equity granted under the 2020 Program was $1,027,332 for Mr. Sandri and $1,789,013 for Mr. Penn (who forfeited all such awards as of September 22, 2020).
(d) On February 10, 2021, the Compensation Committee determined that the performance conditions pertaining to the 2020 Program target awards were achieved at 159% of the approved 2020 Program targets, which resulted in 45,969 RSUs awarded to Mr. Sandri, which will vest ratably over a three-year service period.
(e) Represents grant date fair value of time-vesting equity granted in fiscal year 2019, settled in cash in lieu of shares of common stock, based on the closing market price of the Company’s common stock on August 4, 2020 of $15.12 per share.
(f) Reflects annual incentive cash compensation earned for each fiscal year of service pursuant to the STIP. See “Compensation Discussion and Analysis - Components of Compensation - Annual Cash Incentive Compensation” for a discussion of the 2020 STIP.
(g) The “All Other Compensation” column includes the following items of compensation:
Name Year
Group-term life insurance
($)
Long-term disability premium
($)
Company401(k) Match
($)
Deferred Compensation
Plan Contributions
($)Allowances
($)Total
($)
Fabio Sandri 2020 805 543 1,710 14,785 350 18,193 2019 799 543 1,680 7,453 600 11,075 2018 765 371 1,650 17,515 600 20,901
Jayson Penn 2020 955 — 1,710 — 1,000 3,665 2019 1,242 — 1,680 — 1,200 4,122
30
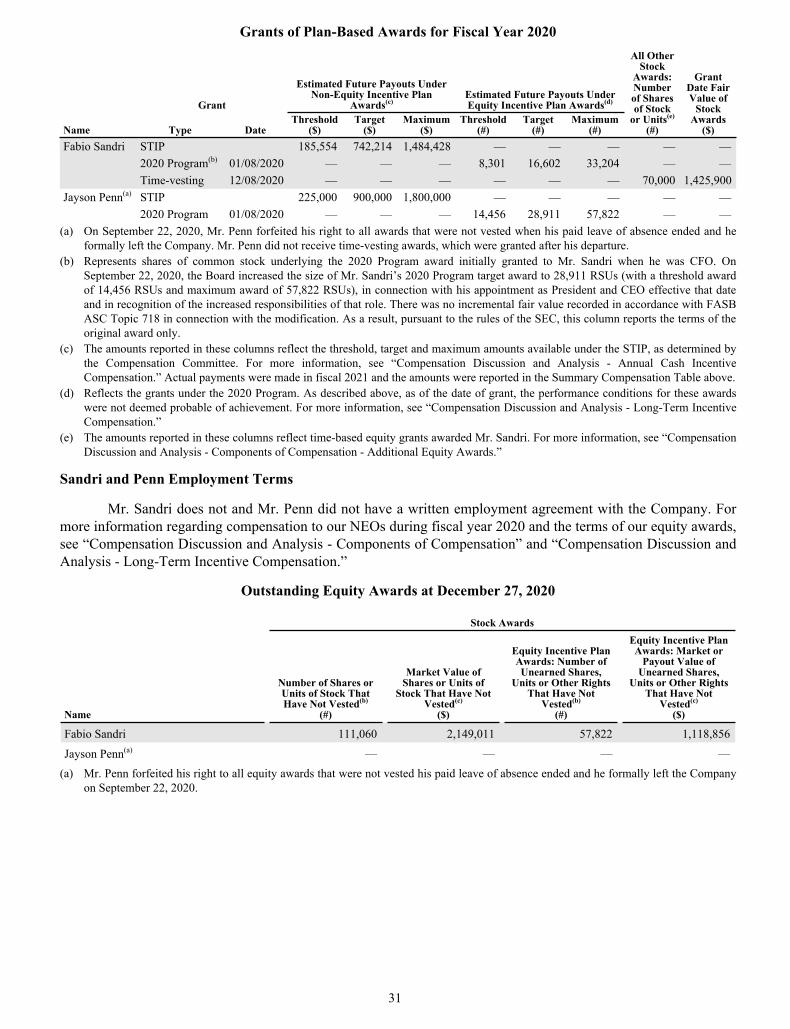
Grants of Plan-Based Awards for Fiscal Year 2020
Grant
Estimated Future Payouts Under Non-Equity Incentive Plan
Awards(c)Estimated Future Payouts Under Equity Incentive Plan Awards(d)
All Other Stock
Awards: Number of Shares of Stock
or Units(e)
(#)
Grant Date Fair Value of
Stock Awards
($)Name Type DateThreshold
($)Target
($)Maximum
($) Threshold
(#)Target
(#)Maximum
(#)
Fabio Sandri STIP 185,554 742,214 1,484,428 — — — — — 2020 Program(b) 01/08/2020 — — — 8,301 16,602 33,204 — — Time-vesting 12/08/2020 — — — — — — 70,000 1,425,900
Jayson Penn(a) STIP 225,000 900,000 1,800,000 — — — — — 2020 Program 01/08/2020 — — — 14,456 28,911 57,822 — —
(a) On September 22, 2020, Mr. Penn forfeited his right to all awards that were not vested when his paid leave of absence ended and he formally left the Company. Mr. Penn did not receive time-vesting awards, which were granted after his departure.
(b) Represents shares of common stock underlying the 2020 Program award initially granted to Mr. Sandri when he was CFO. On September 22, 2020, the Board increased the size of Mr. Sandri’s 2020 Program target award to 28,911 RSUs (with a threshold award of 14,456 RSUs and maximum award of 57,822 RSUs), in connection with his appointment as President and CEO effective that date and in recognition of the increased responsibilities of that role. There was no incremental fair value recorded in accordance with FASB ASC Topic 718 in connection with the modification. As a result, pursuant to the rules of the SEC, this column reports the terms of the original award only.
(c) The amounts reported in these columns reflect the threshold, target and maximum amounts available under the STIP, as determined by the Compensation Committee. For more information, see “Compensation Discussion and Analysis - Annual Cash Incentive Compensation.” Actual payments were made in fiscal 2021 and the amounts were reported in the Summary Compensation Table above.
(d) Reflects the grants under the 2020 Program. As described above, as of the date of grant, the performance conditions for these awards were not deemed probable of achievement. For more information, see “Compensation Discussion and Analysis - Long-Term Incentive Compensation.”
(e) The amounts reported in these columns reflect time-based equity grants awarded Mr. Sandri. For more information, see “Compensation Discussion and Analysis - Components of Compensation - Additional Equity Awards.”
Sandri and Penn Employment Terms
Mr. Sandri does not and Mr. Penn did not have a written employment agreement with the Company. For more information regarding compensation to our NEOs during fiscal year 2020 and the terms of our equity awards, see “Compensation Discussion and Analysis - Components of Compensation” and “Compensation Discussion and Analysis - Long-Term Incentive Compensation.”
Outstanding Equity Awards at December 27, 2020
Stock Awards
Name
Number of Shares or Units of Stock That Have Not Vested(b)
(#)
Market Value of Shares or Units of
Stock That Have Not Vested(c)
($)
Equity Incentive Plan Awards: Number of Unearned Shares,
Units or Other Rights That Have Not
Vested(b)
(#)
Equity Incentive Plan Awards: Market or
Payout Value of Unearned Shares,
Units or Other Rights That Have Not
Vested(c) ($)
Fabio Sandri 111,060 2,149,011 57,822 1,118,856
Jayson Penn(a) — — — — (a) Mr. Penn forfeited his right to all equity awards that were not vested his paid leave of absence ended and he formally left the Company
on September 22, 2020.
31

(b) Consists of the following outstanding shares of our restricted stock:
Name Award Grant Date Shares Outstanding Vesting
Fabio Sandri Time-vesting 03/01/2018 3,398 Vests on 12/31/2020
2018 Program 03/01/2018 6,272 Vests in equal installments on 12/31/2020 and 12/31/2021
2019 Program 01/07/2019 31,390
Vests ratably over three years in equal installments on 12/31/2020, 12/31/2021 and 12/31/2022
Time-vesting 12/08/2020 70,000
Vests ratably over three years in equal installments on 07/01/2022, 07/01/2023 and 07/01/2024
111,060
2020 Program(1) 01/08/2020 57,822
Vests ratably over three years in equal installments on 12/31/2021, 12/31/2022 and 12/31/2023
(1) In accordance with SEC rules, reflects the maximum payout of shares as the performance conditions pertaining to the 2020 Program target awards were achieved at 159% of the approved 2020 Program target for Mr. Sandri. On September 22, 2020, the Board increased the size of Mr. Sandri’s 2020 Program target award to 28,911 RSUs, in connection with his appointment as President and CEO effective that date and in recognition of the increased responsibilities of that role. In contrast with the “Grants of Plan-Based Awards Table,” which shows the original number of RSUs granted to Mr. Sandri in accordance with SEC rules, this table reflects the number of outstanding RSUs following the increase as of December 27, 2020.
(c) Values determined based on December 27, 2020 closing market price of our common stock of $19.35 per share.
Stock Vested in Fiscal Year 2020
The following table provides information regarding shares that vested during fiscal year 2020 of our NEOs:
Stock Awards(a)
Name
Number of SharesAcquired on Vesting
(#)
Value Realizedon Vesting(b)
($)
Fabio Sandri 106,533 1,725,727
Jayson Penn 108,869 1,802,149 (a) Reflects the vesting of equity awards during fiscal year 2020, as further described below:
Name Award Shares Date of Vesting
Fabio Sandri Time-vesting 3,398 12/31/2019
2018 Program 3,135 12/31/2019
Time-vesting(1) 100,000 07/01/2020
106,533
Jayson Penn Time-vesting 4,247 12/31/2019
2018 Program 4,622 12/31/2019
Time-vesting(1) 100,000 07/01/2020
108,869 (1) Settled in cash in lieu of shares of common stock, based on the closing market price of the Company’s common stock on August 4,
2020 of $15.12 per share.(b) Reflects the aggregate market value of shares of our common stock vested on the applicable dates of vesting (including, for awards
settled in cash, the aggregate cash value received from the Company).
Nonqualified Deferred Compensation for Fiscal Year 2020
The following table sets forth information regarding the deferral of components of our NEOs’ compensation on a basis that is not tax-qualified for the fiscal year 2020:
32

Name
Executive Contributions in
Last Fiscal Year(a)
($)
Registrant Contributions in
Last Fiscal Year(b)
($)
Aggregate Earnings (Loss) in Last Fiscal
Year(c)
($)
Aggregate Withdrawals/ Distributions
($)
Aggregate Balance at Last FiscalYear End
($)
Fabio Sandri 21,750 14,785 13,343 (62,151) 129,148 Jayson Penn — — — — —
(a) Amounts in this column for the Deferred Compensation Plan represent salary deferrals pursuant to the Deferred Compensation Plan and are included in the “Salary” amounts in the Summary Compensation Table above.
(b) Amounts in this column for the Deferred Compensation Plan represent company-matching awards pursuant to the Deferred Compensation Plan and are included in the “All Other Compensation” amounts in the Summary Compensation Table above. For 2019 and 2018, Mr. Sandri received $7,453 and $17,515 in matching contributions, respectively, and as a result, these sums were included as compensation in the Summary Compensation Table in previous years for the year earned, as applicable.
(c) There were no above-market or preferential earnings with respect to any deferred compensation balances.
2020 Potential Payments Upon Termination or Change-in-Control
The information below describes certain compensation that would be paid to our NEOs in the event of a termination of their respective employment with the Company or under certain circumstances in the event of a change-in-control of the Company as of the last business day of fiscal year 2020. Our NEOs would not receive any payments or benefits upon termination for cause. The Company also has no arrangements under which the NEOs would receive any payments or benefits upon a change-in-control of the Company other than immediate vesting under certain circumstances of RSUs granted to the NEOs under the Plan.
Named Executive Officer / Element of Compensation
Termination due to Death
($)
Termination due to Long-term Disability
($)
Termination Other than for Cause,
Death orDisability
($)Change-in-Control
($)
Fabio SandriSeverance payment(a) — — 536,538 — Self-insured payments 1,600,000 (b) 500,000 (c) — — Immediate vesting of RSUs(d) 3,267,867 — — 3,267,867
Total for Mr. Sandri 4,867,867 500,000 536,538 3,267,867 Jayson Penn(e)
Severance payment — — — — Self-insured payments — — — — Immediate vesting of RSUs — — — —
Total for Mr. Penn — — — — (a) Calculated pursuant to the Severance Plan, as described in the Compensation Discussion and Analysis.(b) For termination due to death not related to a business travel accident, the estate of Mr. Sandri would receive $1,000,000 from third-
party insurers. For termination due to death related to a business travel accident, the estate of Mr. Sandri would receive $1,600,000 from third-party insurers.
(c) For termination due to long-term disability, Mr. Sandri would also receive approximately $15,000 per month in long-term disability payments from third-party insurers. For termination due to long-term disability, Mr. Sandri may receive up to $500,000 as a lump-sum payment from third-party insurers.
(d) If a change-in-control occurs and the equity awards are not converted, assumed or replaced by a successor entity, then immediately prior to the change-in-control the awards will become fully exercisable and all forfeiture restrictions on the awards will lapse. At December 27, 2020, Mr. Sandri held 168,882 unvested RSUs that will vest immediately when a change-in-control occurs. The amount represents the closing price of the Company’s common stock on the last trading day of the fiscal year ended December 27, 2020 of $19.35. On September 22, 2020, Mr. Penn forfeited his right to all awards that were not vested when he ceased to be the President and CEO of the Company.
(e) Mr. Penn has received no severance since his departure from the Company on September 22, 2020. In addition, Mr. Penn’s short-term, long-term disability and life insurance coverages ended on September 22, 2020.
CEO Pay Ratio for Fiscal Year End 2020
Pay Ratio
Our CEO to median employee pay ratio has been calculated in accordance with SEC rules under the Dodd-Frank Wall Street Reform and Consumer Protection Act and in a manner consistent with Item 402(u) of Regulation
33

S-K. For purposes of this CEO Pay Ratio Disclosure, we annualized Mr. Sandri’s compensation as if he had served as CEO for the entire year, which resulted in annual total compensation of $2,794,093 and represents his compensation for CEO service disclosed in the Summary Compensation Table above, plus the additional base salary that would be earned for CEO service from the beginning of our fiscal year 2020. The median employee’s annual total compensation in 2020 was $22,537, calculated using the same methodology as used in the calculation of compensation for the Summary Compensation Table. As a result, the ratio of Mr. Sandri’s 2020 annual total compensation to the median employee’s 2020 annual total compensation was 124:1.
Identification of Median Employee
For purposes of identifying the median employee, we evaluated all employees, other than Mr. Sandri, employed by Pilgrim’s Pride as of December 27, 2020 and calculated each such employee’s total cash compensation as of December 27, 2020. Total cash compensation consists of annual base pay, annual wages (not including overtime), and target incentive compensation and bonuses at 100% of bonus opportunity. We did not make any material assumptions, adjustments, or estimates with respect to total cash compensation. The total compensation of each employee other than Mr. Sandri was then ranked lowest to highest to identify the median employee for 2020.
34

COMPENSATION RISKS
The Company has reviewed and assessed our compensation policies and practices to determine whether they are reasonably likely to have a material adverse effect on the Company. The Company’s management reviews compensation policies for the presence of certain elements that could encourage employees to take unnecessary or excessive risks; the ratios and level of incentive to fixed compensation, annual to long-term compensation and cash to equity compensation; and the comparison of compensation expense to earnings of the Company. Management’s assessment of the Company’s compensation policies is reviewed by the Compensation Committee as part of its risk oversight function.
The Company believes that its compensation programs for employees and executive officers are appropriately tailored to encourage employees to grow our business, but not to encourage them to do so in a way that poses unnecessary or excessive material risk. In particular, in 2020, the Company’s compensation programs were designed to provide the following:
• elements that balance short-term and long-term compensation;
• for our executive officers, incentive compensation that rewards performance-based on Company performance; and
• compensation with fixed and variable components.
As a result, the Company believes that executive officers and key employees receive a balance between competitive remuneration to encourage retention and compensation designed to provide opportunities to earn more by successfully executing our business strategy. The Company believes the design of these programs encourages our executive officers and key employees to perform at high levels and maximize Company performance without focusing exclusively on compensation performance metrics to the detriment of other important business metrics.
The Company also believes that its compensation program does not encourage excessive risk taking because the above compensation elements coupled with equity ownership in the Company provide a proper mix between long and short-term incentives. A significant portion of the NEOs’ total compensation is performance-based and tied to the profitability of the Company. Specifically, in 2020, Mr. Sandri was eligible to receive an annual cash bonus payable based on the Company’s PBT Margin. Additionally, Mr. Sandri has been granted equity awards and currently owns a level of equity that the Company believes provides sufficient long-term incentives. The Company believes that the NEOs’ beneficial ownership of Pilgrim’s Pride common stock, which encourages long-term focus on sustainable performance, aligns their interests with those of our stockholders. For 2020, approximately 63.7% of the total target compensation of our CEO was “at risk,” or dependent upon the Company’s performance.
Overall, the Company concluded that there were no risks arising from our compensation policies and practices that are reasonably likely to have a material adverse effect on the Company.
COMPENSATION COMMITTEE INTERLOCKS AND INSIDER PARTICIPATION
During 2020, the members of the Compensation Committee were Michael L. Cooper, Gilberto Tomazoni, and Andre Nogueira de Souza. No member of the Committee was, during 2020, an officer, former officer or employee of the Company or any of our subsidiaries. We did not have any compensation committee interlocks in 2020. See “Related Party Transactions - Reportable Transactions” for additional information on the Company’s transactions with JBS.
DELINQUENT SECTION 16(A) REPORTS
Section 16(a) of the Exchange Act requires our officers and Directors, and persons who own more than ten percent of our common stock (“Reporting Persons”), to file reports of ownership and changes in ownership with the SEC. Based on a review of such reports filed with the SEC during the most recent fiscal year, our internal records and any written representations from Reporting Persons, we believe that the Reporting Persons complied with all Section 16(a) filing requirements applicable to our Reporting Persons for the fiscal year ended December 27, 2020,
35

except for the following due to administrative oversight: two late Form 4s on behalf of Mr. Sandri, one of which was filed on March 27, 2020 to report restricted stock units earned upon the certification of certain performance metrics on February 20, 2020 and one of which was filed on January 7, 2021 to report restricted stock units granted on December 8, 2020; one late Form 4 was filed on behalf of each of Mr. Cruz de Vasconcellos, Mr. Cooper, and Ms. Aslam on May 13, 2020 to report restricted stock units granted on April 29, 2020; one late Form 4 was filed on behalf of Mr. Celis on May 19, 2020 to report restricted stock units granted on April 29, 2020; one late Form 4 was filed on behalf of Mr. Macaluso on May 28, 2020 to report restricted stock units granted on April 29, 2020; and one late Form 4 was filed on behalf of Mr. Penn on March 27, 2020 to report restricted stock units earned upon the certification of certain performance metrics on February 20, 2020.
SECURITY OWNERSHIP
The following table sets forth certain information with respect to the beneficial ownership of our common stock by (1) each person known by us to own more than 5% of the outstanding shares of our common stock (the only class of voting securities outstanding); (2) each of our Directors and Director nominees; (3) our NEOs; and (4) all of our current Directors and executive officers as a group. The information below is provided as of March 9, 2021, unless otherwise indicated below.
Name and Beneficial Owner(a)
Amount and Nature of Beneficial Ownership
of Common StockPercent of Outstanding
Common StockPercent of Voting
Power
JBS Wisconsin Properties, LLC(b) 195,445,936 80.21 % 80.21 %Fabio Sandri 493,323 * *Matthew Galvanoni — * *Jayson Penn(c) 279,101 * *Farha Aslam 4,960 * *Arquimedes A. Celis 4,960 * *Michael L. Cooper 15,131 * *Joanita Karoleski — * *Ajay Menon(d) — * *Denilson Molina — * *Gilberto Tomazoni — * *Vincent Trius — * *Andre Nogueira de Souza — * *Wallim Cruz De Vasconcellos Junior 7,746 * *All current executive officers and Directors as a group (10 persons)(a) 196,251,157 80.54 % 80.54 %
* Less than 1%.(a) Unless otherwise noted, the address for each individual is c/o Pilgrim’s Pride Corporation, 1770 Promontory Circle, Greeley, CO
80634-9038. To our knowledge, except as otherwise indicated, each of the persons listed above has sole voting and investment power with respect to shares beneficially owned.
(b) JBS Wisconsin Properties, LLC is a wholly owned, indirect subsidiary of JBS and indirectly beneficially owns 195,445,936 shares of our common stock. JBS is ultimately controlled by Joesley Mendonça Batista and Wesley Mendonça Batista, who jointly control and equally and indirectly own: (1) 100% of the equity interests in J&F Investimentos S.A., a Brazilian corporation, which owns approximately 36.52% of the outstanding capital of JBS; and (2) 100% of the equity interests in Fundo de Investimento em Participações Multiestratégia Formosa, a Brazilian investment fund, which owns approximately 5.84% of the outstanding capital of JBS. Additionally, Joesley Mendonça Batista and Wesley Mendonça Batista equally and indirectly own 49.99% of the common shares and 100% of the preferred shares of each of Banco Original S.A. and Banco Original do Agronegócio S.A., Brazilian financial institutions which own 0.001% and 0.023% of the outstanding capital of JBS, respectively. However, Joesley Mendonça Batista and Wesley Mendonça Batista do not control either entity. The address of JBS Wisconsin Properties, JBS and JBS Wisconsin Properties, LLC is 1770 Promontory Circle, Greeley, CO 80634-9038.
(c) Reflects the number of shares held as of September 22, 2020, the date Mr. Penn left the Company from his role as President and CEO.(d) Mr. Menon joined the Board of Directors in March 2021.
36

RELATED PARTY TRANSACTIONS
Related Party Transactions Policy
During 2020, in accordance with its Charter, our Audit Committee was responsible for reviewing and approving the terms and conditions of all proposed transactions required to be disclosed under Item 404 of Regulation S-K, including transactions between us and any of our officers or Directors, or relatives or affiliates of any such officers or Directors. Furthermore, our Certificate of Incorporation provides that all transactions required to be disclosed under Item 404 of Regulation S-K under the Exchange Act (“related party transactions”) must first be reviewed, evaluated and approved by the Audit Committee or other committee comprised solely of independent directors, such approval to be evidenced by a resolution stating that such committee has, in good faith, unanimously determined that such transaction complies with the provisions of our Certificate of Incorporation governing related party transactions. Any Audit Committee or other independent body member who was or is not independent with respect to a related party transaction under review has been required by our Audit Committee Charter to disclose his or her lack of independence to the remaining committee members and abstain from the review and approval of that transactions. Under our Certificate of Incorporation, neither we nor any of our subsidiaries may enter into certain sale and purchase transactions with or for the benefit of JBS and its affiliates, except on fair and reasonable terms that are no less favorable to us and/or our applicable subsidiary than those that could have been obtained in a comparable arm’s-length transaction with an unrelated third party. Additionally, pursuant to our Governance Policies, we will not make significant charitable contributions to organizations in which a Director or his/her family member is affiliated, enter into consulting contracts with (or otherwise provide indirect forms of compensation to) a Director, or enter into transactions (other than service as a Director) with the Director or any business or nonprofit entity in which the director is a general partner, controlling stockholder, officer, manager, or trustee, or materially financially interested, without the prior approval of a majority of disinterested members of the full Board, and, if required by Nasdaq rules, the Audit Committee.
Reportable Transactions
Since December 30, 2019, the start of our fiscal year 2020, these transactions, along with all other related party transactions, received the approval of our Audit Committee. With the assistance of our management’s analysis, the Audit Committee reviewed the terms of all contracts entered into with related parties and determined that they were substantially similar to, and contained terms not less favorable to us than, those obtainable from unaffiliated parties.
The following are our related party transactions with amounts shown for the fiscal year 2020 (in thousands):
Expenditures paid by JBS USA Food Company(a)(b) $ 39,025 Expenditures paid on behalf of JBS USA Food Company(b) 16,266 Sales to related parties(c) 17,880 Purchases from related parties(c) 151,582
(a) On January 19, 2010, we entered into an agreement with JBS USA, a subsidiary of JBS, in order to allocate costs associated with the procurement of SAP licenses and maintenance services by JBS USA for both JBS USA and the Company. Under this agreement, the fees associated with procuring SAP licenses and maintenance services are allocated between the Company and JBS USA in proportion to the percentage of licenses used by each company. The agreement expires on the date of expiration, or earlier termination, of each underlying SAP license agreement.
(b) On May 5, 2010, we entered into an agreement with JBS USA in order to allocate the costs of supporting the business operations by one consolidated corporate team, which had historically been supported by their respective corporate teams. Expenditures paid by JBS USA on behalf of the Company will be reimbursed by the Company, and expenditures paid by the Company on behalf of JBS USA will be reimbursed by JBS USA. This agreement will expire on December 31, 2021.
(c) We routinely enter into transactions to sell our products to JBS USA and its subsidiaries and purchase products from them. During 2020, we sold products to JBS USA of $14.2 million, JBS Australia Pty. Ltd. of $2.5 million, Combo, Mercado de Congelados of $0.9 million, and JBS Chile Ltda. of $0.2 million. In the same year, we purchased products from JBS USA of $142.6 million, Seara Meats B.V. of $8.1 million, JBS Global (UK) Ltd. of $0.7 million, and JBS Toledo NV of $0.2 million.
37

PROPOSAL 4. RATIFICATION OF THE APPOINTMENT OF INDEPENDENT REGISTERED PUBLIC ACCOUNTING FIRM
Our Board of Directors recommends the ratification of the appointment of KPMG LLP as our independent registered public accounting firm for 2021. If our stockholders fail to ratify the selection, it will be considered as notice to the Board and the Audit Committee to consider the selection of a different firm. Even if the selection is ratified, the Audit Committee, in its discretion, may select a different independent registered public accounting firm at any time during the year if it determines that such a change would be in the best interests of the Company and our stockholders. For information on the fees paid to KPMG LLP in fiscal years 2020 and 2019, see “Independent Registered Public Accounting Firm Fee Information.”
Representatives of KPMG LLP are expected to be present at the Annual Meeting and to be available to respond to appropriate questions. They will be given the opportunity to make a statement if they wish to do so.
Our Board of Directors recommends that you vote “FOR” the ratification of the appointment of KPMG LLP as our independent registered public accounting firm for 2021. Proxies will be so voted unless stockholders specify otherwise.
38

REPORT OF THE AUDIT COMMITTEE
The Audit Committee assists the Board in fulfilling its responsibilities for general oversight of the integrity of the Company’s financial statements, our compliance with legal and regulatory requirements, the independent registered public accounting firm’s qualifications and independence, the performance of our internal audit function and the independent registered public accounting firm, risk assessment and risk management. The Audit Committee manages the Company’s relationship with its independent registered public accounting firm (who reports directly to the Audit Committee). The Audit Committee has the authority to obtain advice and assistance from outside legal, accounting or other advisors as the Audit Committee deems necessary to carry out its duties and to receive appropriate funding, as determined by the Audit Committee, from the Company for such advice and assistance.
The Company’s management has primary responsibility for preparing our financial statements and for our financial reporting process. Our independent registered public accounting firm is responsible for auditing those annual financial statements and expressing an opinion on the conformity of the Company’s audited financial statements with U.S. GAAP. The Audit Committee’s responsibility is to monitor and review these processes and have direct responsibility for the appointment, compensation, retention and oversight of the independent registered public accounting firm retained to audit the Company’s financial statements, but not to verify independently the information provided to the Audit Committee.
In this context, the Audit Committee hereby reports as follows:
1. The Audit Committee has reviewed and discussed the audited financial statements with the Company’s management.
2. The Audit Committee has discussed with the independent registered public accounting firm the matters required to be discussed by the applicable requirements of the Public Company Accounting Oversight Board (the “PCAOB”) and the SEC.
3. The Audit Committee has received the written disclosures and the letter from the independent registered public accounting firm required by applicable requirements of the PCAOB regarding the independent registered public accounting firm’s communications with the Audit Committee concerning independence and has discussed with the independent registered public accounting firm the independent registered public accounting firm’s independence.
4. Based on the review and discussions set forth above, the Audit Committee recommended to the Board that the audited financial statements be included in the Company’s Annual Report on Form 10-K for the fiscal year ended December 27, 2020 for filing with the SEC.
The undersigned members of the Audit Committee have submitted this report to the Board of Directors.
Audit CommitteeMichael L. Cooper, ChairmanWallim Cruz De Vasconcellos Junior
39

INDEPENDENT REGISTERED PUBLIC ACCOUNTING FIRM FEE INFORMATION
The following table shows the aggregate fees for services rendered by KPMG LLP, the Company’s independent registered public accounting firm for the fiscal years indicated:
2020 2019Audit fees(a) $ 3,326,410 $ 3,002,177 Audit-related fees(b) — 12,520 Tax fees(c) 68,158 87,114 All other fees — —
Total $ 3,394,568 $ 3,101,811 (a) Audit fees incurred are for the annual audit of the Company’s financial statements, the audit of internal controls over financial reporting
(i.e., the Sarbanes-Oxley 404 Audit), the reviews of our quarterly reports on Form 10-Q, and statutory audits required in Mexico and the U.K. and Europe.
(b) Audit-related services principally include other attestation services such as agreed-upon procedures required for compliance with contracts or other statutes.
(c) Tax-related services included tax advice and return preparation related to our Mexico and U.K. and Europe subsidiaries.
The Audit Committee pre-approved all audit and non-audit fees of the independent registered public accounting firm during 2020 and 2019.
Pre-Approval Policies and Procedures
In accordance with its Charter, our Audit Committee has established policies and procedures by which it approves in advance any audit and permissible non-audit services to be provided by our independent registered public accounting firm. Under these procedures, prior to the engagement of the independent registered public accounting firm for pre-approved services, requests or applications for the independent registered public accounting firm to provide services must be submitted to our CFO, or his designee, and the Audit Committee and must include a detailed description of the services to be rendered. The CFO, or his designee, and the independent registered public accounting firm must ensure that the independent registered public accounting firm is not engaged to perform the proposed services unless those services are within the list of services that have received the Audit Committee’s pre-approval and must cause the Audit Committee to be informed in a timely manner of all services rendered by the independent registered public accounting firm and the related fees.
Requests or applications for the independent registered public accounting firm to provide services that require additions or revisions to the 2020 pre-approval will be submitted to the Audit Committee (or any Audit Committee members who have been delegated pre-approval authority) by the CFO or his designee. Each request or application must include:
• a recommendation by the CFO (or designee) as to whether the Audit Committee should approve the request or application; and
• a joint statement of the CFO (or designee) and the independent registered public accounting firm as to whether, in their view, the request or application is consistent with the SEC’s regulations and the requirements for auditor independence of the PCAOB.
The Audit Committee also will not permit the engagement to provide any services to the extent that the SEC has prohibited the provision of those services by independent registered public accounting firms.
The Audit Committee delegated authority to the Chairman of the Audit Committee to:
• pre-approve any services proposed to be provided by the independent registered public accounting firm and not already pre-approved or prohibited by this policy up to $25,000;
• increase any authorized fee limit for pre-approved services (but not by more than 30% of the initial amount that was pre-approved) before we or our subsidiaries engage the independent registered public accounting firm to perform services for any amount in excess of the fee limit; and
40

• investigate further the scope, necessity or advisability of any services as to which pre-approval is sought.
The Chairman of the Audit Committee is required to report any pre-approval or fee increase decisions to the Audit Committee at the following Audit Committee meeting.
41

PROPOSAL 5. APPROVAL OF AMENDMENT TO THE CERTIFICATE OF INCORPORATION
Our Board of Directors has approved, and recommends for approval by the stockholders, an amendment to Article Five, Section 5.2(b) of our Certificate of Incorporation.
Article Five of the Company’s Certificate of Incorporation provides for a specified number of JBS Directors and Equity Directors, based upon the percentage ownership of JBS in the Company. In particular, the Certificate of Incorporation provides that the JBS Stockholder will have seven (7) directors if it owns at least 80% of our issued and outstanding Common Stock and eight (8) directors if it owns at least 90% of our issued and outstanding Common Stock. Under the proposed amendment, the JBS Nominating Committee may choose to maintain only six (6) JBS Directors on the Board (rather than seven (7) or eight (8), respectively) if it beneficially owns at least 80% of our issued and outstanding Common Stock, in which case there would be three (3) Equity Directors (rather than two (2) Equity Directors or one (1) Equity Director, respectively).
The Company is proposing this amendment to the Certificate of Incorporation because it provides for more stability in the Company’s corporate governance as well as flexibility to determine the best corporate governance structure for the Board at a particular time. Moreover, we believe the amendment is in the best interests of all of our stockholders by providing the option in certain circumstances to maintain a larger number of Equity Directors on our Board and on the Equity Nominating Committee.
The amendment to Article Five of the Certificate of Incorporation is set forth in Annex B. The Board also has approved a corresponding amendment to the Company’s Bylaws. The Company’s Equity Nominating Committee and JBS Nominating Committee have also each unanimously approved the amendments to the Certificate of Incorporation and Bylaws. If adopted, the amendment will become effective upon the filing of a Certificate of Amendment with the Secretary of State of the State of Delaware, which we would expect to do as soon as practicable after the amendment is adopted by stockholders.
Our Board of Directors recommends that you vote “FOR” the approval of the amendment to the Certificate of Incorporation. Proxies will be so voted unless stockholders specify otherwise.

PROPOSAL 6. STOCKHOLDER PROPOSAL TO PROVIDE A REPORT REGARDING THE REDUCTION OF WATER POLLUTION
Mercy Investment Services, Inc., located at 2039 North Geyer Road, St. Louis, MO 63131, and Adrian Dominican Sisters, located at 1257 East Siena Heights Drive, Adrian, MI 49221, have advised us that they plan to introduce the following resolution (the “Co-filers”). The Company will furnish to stockholders information regarding the shares of common stock purportedly owned by each of these Co-filers promptly upon receiving an oral or written request for such information.
The Board of Directors recommends that the stockholders vote AGAINST the proposal submitted by the Co-filers. The Company takes no responsibility for the accuracy of the Co-filers’ statements.
WHEREAS: Meat production is the leading source of water pollution in the U.S., exposing 5.6 million Americans to nitrates in drinking water and toxic algal blooms.1 Cultivation of feed ingredients for the 45 million chickens2 produced weekly by Pilgrim’s is a source of water pollution from fertilizer washing off fields if improperly managed. Manure from over 4,900 poultry farms supplying Pilgrim’s3 may contain nutrients, antibiotic-resistant bacteria, and pathogens which can pollute waterways, endangering public health and the environment. Pilgrim’s is therefore vulnerable to regulatory actions to mitigate these pollution streams.
Several states where Pilgrim’s has processing operations4 have tightened requirements related to nutrient management, manure disposal, field application of manure, and groundwater monitoring for animal agriculture.5 At the federal level, the Farm System Reform Act would pose significant operational challenges to vertically integrated meat processors. Introduced in May 2020, the law is motivated by concerns pertaining to the health and environmental externalities associated with meat production.6
Pilgrim’s disclosures and policies lag those of its peers. Tyson Foods has committed to support improved fertilizer practices on two million acres of corn.7 Sanderson Farms now uses SASB standards to report its plans to manage risks specifically associated with supply chain water pollution.8 Sanderson’s disclosure renders Pilgrim’s the sole remaining large, publicly-traded poultry processor failing to report to shareholders how it intends to manage these risks.
Additionally, many of Pilgrim’s largest customers increasingly expect their meat suppliers to improve mitigation of pollution streams.9 Failing to address this risk may harm Pilgrim’s position as a competitive supplier.
Pilgrim’s is working to reduce the quantity of the water it uses and has a policy requiring “vendors” to comply with applicable environmental laws and regulations, encouraging them to “use best efforts to meet industry best practices and standards and responsibly manage the environmental impact of their operations.”10 However, neither Pilgrim’s disclosures nor its policies specifically address the primary drivers of the company’s water pollution footprint, including manure from contracted facilities and nutrient runoff from feed crops. Pilgrim’s disclosures lack sufficient detail to assure investors that it is adequately managing the risks associated with water pollution within its supply chain.
______________________1 https://www.epa.gov/nutrientpollution/sources-and-solutions; http://www.fao.org/3/CA0146EN/ca0146en.pdf; http://www.fao.org/3/CA0146EN/ca0146en.pdf; https://ehjournal.biomedcentral.com/articles/10.1186/s12940-018-0442-6.2 https://ir.pilgrims.com/static-files/e3600306-6cfa-4e6e-bae6-30bd760a13c5.3 Ibid.4 https://www.epa.gov/toxics-release-inventory-tri-program/tri-basic-data-files-calendar-years-1987-2017.5 https://www.opb.org/news/article/washington-dairy-pollution-regs/; https://www.environmentalintegrity.org/wp-content/uploads/2017/02/Shenandoah-Report.pdf; https://www.jsonline.com/story/news/politics/2017/01/07/state-wants-jump-start-manure-project/96212456/; https://www.nytimes.com/2018/07/09/us/algae-blooms-florida-nyt.html; https://www.flgov.com/wp-content/uploads/2019/01/EO-19-12-.pdf.6 https://www.congress.gov/bill/116th-congress/senate-bill/3221/text.7 https://www.tysonsustainability.com/environment/land-stewardship.8 https://ir.sandersonfarms.com/static-files/a11fcbd2-9dc4-441a-ae92-8258d316280d.9 https://www.walmartsustainabilityhub.com/project-gigaton/agriculture https://www.tescoplc.com/sustainability/planet/agriculture/ https://corporate.mcdonalds.com/corpmcd/scale-for-good/our-planet/protecting-water-resources.html; https://www.yum.com/wps/wcm/connect/yumbrands/badc9774-4800-4f50-93f2-c81344c279d9/2020-Water-Secuirty-09 0420.pdf?MOD=AJPERES&CVID=nhk.faI.10 https://sustainability.pilgrims.com/stories/supplier-code-of-conduct/.
43
RESOLVED: Shareholders of Pilgrim’s Pride Corporation request a report assessing if and how the company plans to increase the scale, pace, and rigor of its efforts to reduce water pollution from its supply chain. This report should omit proprietary information, be prepared at reasonable cost, and be made available to shareholders by December l, 2021.
Supporting statement: Although we defer to management for the precise contents, investors believe that meaningful disclosure within the report could include:
• requirements for manure management practices intended to prevent water pollution
• requirements for leading practices for nutrient management and pollutant limits throughout contract farms and feed suppliers, with a focus on verifiably reducing nitrate contamination
• plans to verify suppliers’ compliance with Pilgrim’s policies
Board of Directors’ Statement in Opposition to Stockholder Proposal to Provide a Report Regarding the Reduction of Water Pollution
The Board of Directors believes that the Company’s current practices and procedures sufficiently address the concerns raised in the proposal, and that providing the contemplated report is unnecessary and would impose costs on the Company that will not create value for our stockholders or the communities in which we operate. The Board of Directors further believes that a separate report is not an effective way to “increase the scale, pace and rigor of its efforts to reduce water pollution from its supply chain” as requested by the proposal.
We are committed to our role as a steward of the environment in the areas where we do business. As part of our commitment to the environment, we have been in the process of upgrading wastewater treatment facilities at a number of our facilities. Our wastewater facilities, whether owned or under contract, are operated in accordance with site-specific permit requirements, which are established by the local authorities governing these operations. We also expect responsible and efficient water stewardship from our industry partners, including our suppliers. We contract primarily with independent contract growers to raise the live chickens processed in our poultry operations.
We strive to support growers in their efforts to run their businesses wisely and to be independent and sustainable enterprises. While these contract growers are independent contractors responsible for their own farms and for day-to-day regulatory compliance, we require that our contract growers comply with all local, state, and federal environmental regulations applicable to their operations. Moreover, we are not aware of any court judgments or regulatory rulings finding that our live bird operations pose a danger to the environment or neighboring water sources.
We are proud of the water conservation and environmental measures that we currently have in place. Water is an essential component of our food safety and quality processes, and we take actions to protect and preserve water quality, particularly in and around our facilities. We have always valued and are committed to supporting improved environmental practices.
In light of current practices and continuous efforts with respect to water conservation and quality, the Board of Directors believes the Company is addressing the concerns raised in the proposal and a report is unnecessary and not in the best interests of our stockholders. Accordingly, the Board of Directors recommends that stockholders vote AGAINST this stockholder proposal.
Our Board of Directors recommends that you vote “AGAINST” this stockholder proposal. Proxies will be so voted unless stockholders specify otherwise.
44

PROPOSAL 7. STOCKHOLDER PROPOSAL TO INTEGRATE ESG METRICS INTO EXECUTIVE COMPENSATION
The Office of the Comptroller of the State of New York (the “NYS Comptroller”), located at 59 Maiden Lane, 30th Floor, New York, NY 10038, has advised us that it plans to introduce the following resolution. The NYS Comptroller purports to hold at least $2,000 of the Company’s common stock.
The Board of Directors recommends that the stockholders vote AGAINST the proposal submitted by the NYS Comptroller. The Company takes no responsibility for the accuracy of the NYS Comptroller’s statements.
RESOLVED: Shareholders of Pilgrim’s Pride Corporation (Pilgrim’s Pride) urge the Board of Directors to examine and report to shareholders, at reasonable cost and omitting proprietary information, describing if, and how, it plans to integrate ESG metrics into the performance measures of named executive officers under the Company’s incentive compensation plans. “ESG metrics” is defined as how environmental, social and governance considerations, and related financial impacts, are integrated into corporate strategy over the long-term.
Supporting Statement:
Strong management of ESG risks has a positive effect on long-term shareholder value, value creation, and sustainability. Conversely, failure to adequately manage and disclose performance on ESG issues can pose regulatory, legal, reputational, and financial risks to a company.
Investors are increasingly calling for improved corporate disclosure for performance on material ESG issues. According to the 2019 UN Global CEO Study, 84% of executives from the world’s largest companies cited a clear link between sustainability and business value.
Additionally, that study found 66% of CEOs would agree to have their compensation linked to sustainability performance. A recent Mercer survey of 135 U.S. and Canadian companies found 30% of respondents use ESG metrics in their incentive compensation plans and 21$ are considering incorporating metrics.
Effectively managing ESG issues offers positive opportunities for companies and should be a key metric by which executives are judged. By integrating ESG metrics into executive compensation, companies can reduce risk related to ESG underperformance by incentivizing executives to meet sustainability goals, thereby achieving greater long-term value for shareholders.
The Sustainability Accounting Standards Board identifies various material ESG issues at Pilgrim’s Pride, including greenhouse gas emissions, energy and water management, land use and ecological impacts, food safety, workforce, health and safety, animal care and welfare. While Pilgrim’s Pride has taken various steps to address some of these issues, significant problems remain, including:
• A criticized response to the COVID-19 pandemic, leading to legal action by employees, alleging plant operators disregarding health and safety guidelines.1
• Established record of severe disabling and life-threatening injuries and death among its employees at its poultry processing plants.2
• Repeated health and safety violations that have led to fines through regulatory violations and lawsuit settlements.3
______________________1 https://www.bloomberglaw.com/product/health/document/X9LUGD5G000000; https://www.startribune.com/pilgrim-s-pride-workers-protest-company-s-covid-19-policies/570022352/.2 https://www.hrw.org/report/2019/09/01/when-were-dead-and-buried-our-bones-will-keep-hurting/workers-rights-under-threat#; https://delauro.house.gov/media-center/press-releases/delauro-urges-comprehensive-osha-investigation-worker-fatality-jbs.3 https://www.osha.gov/news/newsreleases/region4/07272016; https://www.ehstoday.com/safety/article/21918131/pilgrims-pride-adds-to-flock-of-osha-violations; https://violationtracker.goodjobsfirst.org/prog.php?parent=&major_industry_sum=&primary_offense_sum=&agency_sum=&hq_id_sum=&company_op=starts&company=pilgrim%27s+pride.
45
• High-profile allegations, investigations, and lawsuits related to hiring discrimination and retaliation.4
• Lagging behind its peers in implementing best practices and disclosure relating to addressing the environmental impacts of its operations.5
• Criticized animal care and welfare practices.6
Recent events, including the COVID-19 pandemic and the struggle for racial equity, have illustrated the importance of ESG issues and their impact on companies. By integrating ESG metrics into executive compensation incentive plans, Pilgrim's Pride could incentivize its executives to improve ESG performance, thereby addressing risks and achieving greater long-term value for shareowners.
Board of Directors’ Statement in Opposition to Stockholder Proposal to Integrate ESG Metrics Into Executive Compensation
The Board of Directors believes that the Compensation Committee is in the best position to determine the appropriate metrics for executive compensation. As discussed in “Compensation Discussion and Analysis,” our compensation principles are intended to implement our core objectives of attracting key leaders, motivating our executives to remain with the Company for long and productive careers, rewarding sustained financial and operating performance and leadership excellence and aligning the long-term interests of our executives with those of our stockholders. We believe that executive compensation should be linked to building long-term stockholder value while remaining consistent with our business objectives and values, and should be competitive in relation to the marketplace. In determining the components of compensation, the Compensation Committee discusses these and other strategic goals for our compensation program, and considers the role of each of the elements of compensation in relationship to the overall pay mix.
The Compensation Committee considers the total compensation targeted for each of the NEOs, individual and Company performance and the relationship between pay and performance. The Compensation Committee works with the CEO and the Company’s human resources representative, who make recommendations consistent with the guidelines established by the Compensation Committee to each element of compensation of our executive officers. The Compensation Committee evaluates the total compensation packages for our senior executives after considering the recommendations of the CEO and the Company’s human resources representative and evaluating the competitive market for executive talent, the Company’s performance relative to its competitors and the past compensation paid to each of our NEOs. This flexible approach enables the Compensation Committee to use its discretion and business judgment to design and implement effective compensation packages that retain and attract highly qualified executive officers, while ensuring that those officers are properly incentivized to contribute substantially to our success, as our business evolves.
Because the Compensation Committee is in the best position to determine appropriate executive compensation and the Company has already put in place numerous ESG initiatives, including those detailed in “Part I, Item 1. Business—Human Capital Resources” in our Annual Report on Form 10-K, the Board of Directors believes that a report on the incorporation of ESG metrics into executive compensation is not necessary. Accordingly, the Board of Directors recommends that stockholders vote AGAINST this stockholder proposal.
Our Board of Directors recommends that you vote “AGAINST” this stockholder proposal. Proxies will be so voted unless stockholders specify otherwise.
______________________4 https://www.greeleytribune.com/2018/10/11/kentucky-woman-files-discrimination-lawsuit-against-greeley-based-pilgrims-pride-corporation/5 https://www.houstonpress.com/news/report-blames-tyson-pilgrims-pride-and-other-for-manure-in-texas-waters-8531516; https://www.environmentalintegrity.org/wp-content/uploads/2018/10/Slaughterhouse-report-2.14.2019.pdf; https://echo.epa.gov/enforcement-case-report?id=04-2016-45016 https://www.theguardian.com/environment/2019/jun/25/footage-chickens-big-uk-producer
46
HOUSEHOLDING OF STOCKHOLDER MATERIALS
Some banks, brokers and other nominee record holders may be participating in the practice of “householding” proxy statements and annual reports. This means that only one copy of this proxy statement or annual report to stockholders may have been sent to multiple stockholders in the same household. We will promptly deliver a separate copy of either document to any stockholder who requests orally or by writing to our Investor Relations Department at the following address: 1770 Promontory Circle, Greeley, Colorado 80634 or by telephone (970)506-8192. Any stockholder who currently is receiving multiple copies and would like to receive only one copy for his or her household should contact his or her bank, broker or other nominee record holder.
STOCKHOLDER PROPOSALS FOR 2022 ANNUAL MEETING OF STOCKHOLDERS
Pursuant to our bylaws, a stockholder must give our Secretary timely written notice in order to present a proposal (including nominations of Directors) at the 2022 annual meeting of stockholders. Such written notice must contain specified information prescribed in our bylaws and must be received at our principal executive offices by December 28, 2021 (but not before July 31, 2021). Additionally, for stockholder proposals submitted pursuant to Rule 14a-8 of the Exchange Act to be considered for inclusion in the proxy materials for the 2022 annual meeting of stockholders, they must be received by our Secretary at our principal executive offices no later than the close of business on November 29, 2021.
ANNUAL REPORT
Our 2020 annual report is being mailed concurrently with this proxy statement. Upon written request of a stockholder, the Company will furnish without charge a copy of our 2020 Annual Report on Form 10-K, including the financial statements and financial statement schedules. If you would like to request a copy, please contact Pilgrim’s Pride Corporation, at: 1770 Promontory Circle, Greeley, Colorado 80634 Attn: Investor Relations.
In addition, our financial reports and recent filings with the SEC are available at www.sec.gov and on our website at www.ir.pilgrims.com. Information contained on our website is not part of this proxy statement.
IMPORTANT NOTICE REGARDING THE AVAILABILITY OF PROXY MATERIALS FOR THE STOCKHOLDER MEETING TO BE HELD ON APRIL 28, 2021
This proxy statement and the Company’s 2020 annual report are also available electronically on our hosted website. You may view these directly at: www.envisionreports.com/PPC.
To access and review the materials made available electronically:
1. Go to www.envisionreports.com/PPC.
2. Enter the 15-digit control number located on the proxy card.
3. Click “View Stockholder Material.”
We encourage you to review all of the important information contained in the proxy materials before voting.
47

OTHER BUSINESS
The Board of Directors is not aware of, and it is not anticipated that there will be presented at the Annual Meeting, any business other than the proposals included in this Proxy Statement. If other matters properly come before the Annual Meeting, the persons named on the accompanying proxy card will vote the returned proxies as the Board of Directors recommends.
By order of the Board of Directors,
FABIO SANDRIGreeley, Colorado President andMarch 29, 2021 Chief Executive Officer
48

Forward-Looking Statements
Statements contained in this proxy statement that state the intentions, plans, hopes, beliefs, anticipations, expectations or predictions of the future of Pilgrim’s Pride Corporation and its management are considered forward-looking statements. Without limiting the foregoing, words such as “anticipates,” “believes,” “continues,” “estimates,” “expects,” “intends,” “may,” “plans,” “projects,” “should,” “targets,” “will” and the negative thereof and similar words and expressions are intended to identify forward-looking statements. It is important to note that actual results could differ materially from those projected in such forward-looking statements. Factors that could cause actual results to differ materially from those projected in such forward-looking statements include: the impact of the COVID-19 pandemic, efforts to contain the pandemic and resulting economic downturn on our operations and financial condition, including the risk that our health and safety measures at Pilgrim’s Pride production facilities will not be effective, the risk that we may be unable to prevent the infection of our employees at these facilities, and the risk that we may need to temporarily close one or more of our production facilities; the risk that we may experience decreased production and sales due to the changing demand for food products; the risk that we may face a significant increase in delayed payments from our customers; and additional risks related to COVID-19 set forth in our most recent Form 10-K and Form 10-Q filed with the SEC; matters affecting the poultry industry generally; the ability to execute the Company’s business plan to achieve desired cost savings and profitability; future pricing for feed ingredients and the Company’s products; outbreaks of avian influenza or other diseases, either in Pilgrim’s Pride’s flocks or elsewhere, affecting its ability to conduct its operations and/or demand for its poultry products; contamination of Pilgrim’s Pride’s products, which has previously and can in the future lead to product liability claims and product recalls; exposure to risks related to product liability, product recalls, property damage and injuries to persons, for which insurance coverage is expensive, limited and potentially inadequate; management of cash resources; restrictions imposed by, and as a result of, Pilgrim’s Pride’s leverage; changes in laws or regulations affecting Pilgrim’s Pride’s operations or the application thereof; risks relating to litigation, including litigation relating to alleged antitrust violations or arising in the ordinary course of business or otherwise; new immigration legislation or increased enforcement efforts in connection with existing immigration legislation that could cause the costs of doing business to increase, cause Pilgrim’s Pride to change the way in which it does business, or otherwise disrupt its operations; competitive factors and pricing pressures or the loss of one or more of Pilgrim’s Pride’s largest customers; currency exchange rate fluctuations, trade barriers, exchange controls, expropriation and other risks associated with foreign operations; disruptions in international markets and distribution channel, including anti-dumping proceedings and countervailing duty proceedings; and the impact of uncertainties of litigation and other legal matters described in our most recent Form 10-K and Form 10-Q, including the In re Broiler Chicken Antitrust Litigation, as well as other risks described under “Risk Factors” in the Company’s Annual Report on Form 10-K, Quarterly Reports on Form 10-Q and subsequent filings with the Securities and Exchange Commission. The forward-looking statements in this release speak only as of the date hereof, and the Company undertakes no obligation to update any such statement after the date of this proxy statement, whether as a result of new information, future developments or otherwise, except as may be required by applicable law.
49

Annex A
Reconciliation of GAAP Information to Non-GAAP Financial Measures
The following reconciles the GAAP information to the Non-GAAP financial measure included in this proxy statement for the fiscal year 2020:
Reconciliation of Adjusted EBITDA Amount
(In thousands)
Net income $ 95,070 Add:
Interest expense, net 118,813 Income tax expense 66,755 Depreciation and amortization 337,104
EBITDA 617,742 Add:
DOJ agreement 110,524 Nonrecurring legal settlement 75,000 Hometown Strong commitment 15,000 Foreign currency transaction loss 760 Transaction costs related to acquisitions 134 Restructuring activities 123
Minus:Shareholder litigation settlement 34,643 Negative adjustment to the previously recognized gain on bargain purchase (3,746) Net income attributable to noncontrolling interest 313
Adjusted EBITDA $ 788,073
The following table excludes the operating results of PPL:
Reconciliation of PBT Margin Amount(In thousands, except percentage data)
Income before tax, as reported $ 161,825 Income before tax, PPL operations 11,160 Income before tax, excluding PPL operations 150,665 Add:
DOJ agreement 110,524 Nonrecurring legal settlement 75,000
Income before tax, adjusted 336,189
Net sales, as reported 12,091,901 Net sales, PPL operations 1,363,290 Net sales, excluding PPL operations $ 10,728,611 Income before tax, adjusted, as a percent of net sales 3.13 %
50

Annex B
Proposed Amendment to Pilgrim’s Pride CorporationAmended and Restated Certificate of Incorporation
Set forth below are proposed changes to Article V, Section 5.2 of the Company’s Amended and Restated Certificate of Incorporation. Addition of new text is indicated in bold.
ARTICLE V
DIRECTORS
Section 5.1. General Powers. The business and affairs of the Corporation shall be managed by or under the direction of the Board. In addition to the powers and authority expressly conferred upon them by statute or by this Certificate of Incorporation or the bylaws of the Corporation (the “Bylaws”), the directors are hereby empowered to exercise all such powers and do all such acts and things as may be exercised or done by the Corporation.
Section 5.2. Number; Composition and Term of Office.
(a) Subject to Section 5.2(b), the number of directors shall be nine (9).
(b) The Board shall consist of six (6) JBS Directors, two (2) Equity Directors and one (1) Founder Director; provided that, if at any time the beneficial ownership by the JBS Stockholder of the issued and outstanding Common Stock as a percentage of the total issued and outstanding Common Stock changes to an amount set forth below, then there shall be the following changes in the composition of the Board:
% Owned by theJBS Stockholder
No. of JBSDirectors
No. of EquityDirectors
No. of FounderDirectors
≥ 90% 8 0 1≥ 80% but < 90% 7 1 1≥ 50% but < 80% 6 2 1≥ 40% but < 50% 5 3 1≥ 35% but < 40% 4 4 1> 10% but < 35% 3 5 1
≤ 10% 0 8 1
provided that, upon the occurrence of the Founder Triggering Event, there shall no longer be a Founder Director on the Board, and the number of Equity Directors on the Board as set forth above shall be increased by one (1); provided further that during the Exchange Period (defined in Section 8.2(a)) there shall be at least two (2) Equity Directors; provided further that, if applicable law or, at any time while the Corporation’s equity securities are traded on an Exchange, the rules of such Exchange require a greater number or proportion of independent directors on the Board, then
(i) if the JBS Stockholder beneficially owns at least 50% of the issued and outstanding Common Stock, then, at the option of the JBS Nominating Committee, either (A) one or more of the then-existing JBS Directors who are not independent directors shall be replaced with one or more JBS Directors who are independent directors such that, after such replacement, the number or proportion of independent directors on the Board will comply with such requirement or (B) the number of directors on the Board shall be increased by two (2) and the vacancies created by such increase shall be filled with persons designated by the JBS Nominating Committee who are independent directors such that the number or proportion of independent directors on the Board will comply with such requirement; or
(ii) if the JBS Stockholder beneficially owns less than 50% of the issued and outstanding Common Stock, then one or more of the then-existing JBS Directors who are not independent directors shall be replaced with one or more JBS Directors who are independent directors such that, after such replacement, the number or proportion of independent directors on the Board will comply with such requirement.
51

Notwithstanding anything in this Section 5.2(b) or Article XIII to the contrary, so long as the JBS Stockholder beneficially owns at least 80% of the issued and outstanding Common Stock, the JBS Nominating Committee may choose to maintain only six (6) JBS Directors on the Board, in which case there shall be two (2) Equity Directors and one (1) Founder Director on the Board.
In the event that the size of the Board is expanded pursuant to this Section 5.2, no person shall be nominated or appointed as a director if the Equity Nominating Committee reasonably determines that such person (A) is unethical or lacks integrity or (B) is a competitor or is affiliated with a competitor of the Corporation or any of its material subsidiaries. As used in this Certificate of Incorporation, a Person shall be deemed the “beneficial owner” of, shall be deemed to have “beneficial ownership” of and shall be deemed to “beneficially own” any Common Stock which such Person or any of such Person’s Affiliates is deemed to beneficially own, directly or indirectly, within the meaning of Rule 13d-3 of the Exchange Act; provided, however, that beneficial ownership by the JBS Stockholder will not include shares of Common Stock held by members of a “group” (as that term is used in Rule 13d-5 under the Exchange Act) other than JBS USA and its Affiliates.
(c) At each annual meeting of stockholders, each director elected to succeed a director whose term expires shall be elected for a term of office to expire at the next annual meeting of stockholders after his or her election, with each director to hold office until his or her successor shall have been duly elected and qualified or until the earlier of his or her death, resignation or removal in accordance with this Certificate of Incorporation and the Bylaws. The election of directors need not be by written ballot unless the Bylaws so provide. Directors need not be stockholders.
52

Dear Fellow Pilgrim’s Shareholders:
The year 2020 presented one of the most significant business challenges across many industries here in the United States and globally. Safety is paramount at Pilgrim’s and our team members responded admirably to the unprecedented conditions, guided by three principles: an uncompromising commitment to the safety of our team members; recognizing and embracing our responsibility to provide quality food for the world; and endeavoring to provide continued employment opportunities and benefits to our team members during a time of unprecedented economic upheaval.
We are continuously adapting our global operations to the changes in customer demand, while adjusting our facilities to be able to maintain operations at all our plants, diligently implementing precautionary and proactive steps to better safeguard the health and wellness of each team member. Countering the significant challenges of 2020, our portfolio strategy has continued to generate strong relative performance, outpace the competition and deliver solid results for the full-year. These results were driven by our resilient business models across all business units, including the United States, Mexico and Europe. The unique challenges as a result of Covid-19 presented an opportunity to demonstrate the value and strength of Pilgrim’s well-diversified portfolio strategy, and our ability to generate more consistent results despite specific volatility in our markets. We are continuing to further evolve our strategy of developing a differentiated portfolio of diverse, complementary business models, while continuing to relentlessly pursue operational excellence, becoming a more valued partner with our Key Customers, and creating an environment for safe people, safe products and healthy attitudes.
During 2020, our U.S. retail and QSR businesses performed extremely well due to strong demand from our Key Customers and across our broader customer base. Operationally, our commodity large bird deboning also continued to improve despite the tough market conditions. Our Prepared Foods business remained resilient considering the challenging demand environment, and we believe the business continues to develop in anticipation of stronger results in 2021, reflecting the investments made over the past few years. Our legacy European operations continued to evolve and we have further strengthened our ability to adapt a model aimed at improved mitigation of future input cost challenges. Integration of our newly acquired European operations is on track, and the business has continued to contribute robust positive results. In Mexico, the market was very weak in the first half of last year but rebounded strongly during the second half, once again producing a solid performance for the full year in 2020. We continue to develop our brands in all regions, fulfilling consumer demand with higher value offerings that help our customers to grow in alignment with new, emerging consumer trends.
For fiscal year 2020, we achieved net sales of $12.1 billion while generating net income of $94.8 million, and a GAAP EPS of $0.39. Our adjusted EBITDA* (Earnings Before Interest, Taxes Depreciation and Amortization) was $788 million, or a 6.5% margin.
Our strategy is making a measurable difference – we believe the results are evident in all regions and segments in which we operate. For the long term, we expect our competitive advantage to be sustainable, supporting our vision to become the best and most respected company in our industry, while creating the opportunity of a better future for our team members.
Thank you for your continued support. Fabio Sandri President and Chief Executive Officer
* For a reconciliation of this non-GAAP financial measure to the comparable GAAP measure, please see Annex A to this proxy statement.

This page intentionally left blank.

UNITED STATESSECURITIES AND EXCHANGE COMMISSION
Washington, D.C. 20549
FORM 10-K
☒ ANNUAL REPORT PURSUANT TO SECTION 13 OR 15(d) OF THE SECURITIES EXCHANGE ACT OF 1934For the fiscal year ended December 27, 2020
OR☐ TRANSITION REPORT PURSUANT TO SECTION 13 OR 15(d) OF THE SECURITIES EXCHANGE ACT OF 1934
For the transition period from to
Commission File number 1-9273
PILGRIM’S PRIDE CORPORATION
(Exact name of registrant as specified in its charter)
Delaware 75-1285071(State or other jurisdiction of incorporation or organization) (I.R.S. Employer Identification No.)
1770 Promontory Circle 80634-9038Greeley CO
(Address of principal executive offices) (Zip code)
Registrant’s telephone number, including area code: (970) 506-8000 Securities registered pursuant to Section 12(b) of the Act:
Title of each class Trading Symbol Name of each exchange on which registeredCommon Stock, par value $0.01 per share PPC The Nasdaq Stock Market LLC
Securities registered pursuant to Section 12(g) of the Act: NoneIndicate by check mark if the registrant is a well-known seasoned issuer, as defined in Rule 405 of the Securities Act. Yes xNo o
Indicate by check mark if the registrant is not required to file reports pursuant to Section 13 or Section 15(d) of the Exchange Act. Yes oNo xIndicate by check mark whether the registrant (1) has filed all reports required to be filed by Section 13 or 15(d) of the Securities Exchange Act of 1934 during the preceding 12 months (or for such shorter period that the registrant was required to file such reports), and (2) has been subject to such filing requirements for the past 90 days. Yes x No oIndicate by check mark whether the registrant has submitted electronically every Interactive Data File required to be submitted pursuant to Rule 405 of Regulation S-T (§232.405 of this chapter) during the preceding 12 months (or for such shorter period that the registrant was required to submit such files). Yes x No oIndicate by check mark whether the registrant is a large accelerated filer, an accelerated filer, a non-accelerated filer, a smaller reporting company, or an emerging growth company. See the definitions of “large accelerated filer,” “accelerated filer,” “smaller reporting company,” and “emerging growth company” in Rule 12b-2 of the Exchange Act.
Large Accelerated Filer x Accelerated Filer oNon-accelerated Filer o Smaller reporting company ☐
Emerging growth company ☐If an emerging growth company, indicate by check mark if the registrant has elected not to use the extended transition period for complying with any new or revised financial accounting standards provided pursuant to Section 13(a) of the Exchange Act. oIndicate by check mark whether the registrant has filed a report on and attestation to its management’s assessment of the effectiveness of its internal control over financial reporting under Section 404(b) of the Sarbanes-Oxley Act (15 U.S.C. 7262(b)) by the registered public accounting firm that prepared or issued its audit report. ☒ Indicate by check mark whether the registrant is a shell company (as defined in Rule 12b-2 of the Exchange Act). Yes ☐ No xThe aggregate market value of the registrant’s Common Stock, $0.01 par value, held by non-affiliates of the registrant as of June 28, 2020 was $824,401,315. The number of shares of the registrant’s Common Stock outstanding as of February 10, 2021 was 243512490 .
DOCUMENTS INCORPORATED BY REFERENCEPortions of the Company’s Proxy Statement for the 2021 Annual Meeting of Stockholders are incorporated by reference into Part III of this annual report.

PILGRIM’S PRIDE CORPORATIONFORM 10-K
TABLE OF CONTENTS
PART I PageItem 1. Business 1Item 1A. Risk Factors 6Item 1B. Unresolved Staff Comments 16Item 2. Properties 17Item 3. Legal Proceedings 18Item 4. Mine Safety Disclosures 18
PART IIItem 5. Market for Registrant’s Common Equity, Related Stockholder Matters and Issuer Purchases of Equity
Securities19
Item 6. Selected Financial Data 21Item 7. Management’s Discussion and Analysis of Financial Condition and Results of Operations 24Item 7A. Quantitative and Qualitative Disclosures about Market Risk 36Item 8. Financial Statements and Supplementary Data 39Item 9. Changes in and Disagreements with Accountants on Accounting and Financial Disclosure 92Item 9A. Controls and Procedures 92Item 9B. Other Information 95
PART IIIItem 10. Directors, Executive Officers and Corporate Governance 95Item 11. Executive Compensation 95Item 12. Security Ownership of Certain Beneficial Owners and Management and Related Stockholder Matters 95Item 13. Certain Relationships and Related Transactions, and Director Independence 95Item 14. Principal Accountant Fees and Services 95
PART IVItem 15. Exhibits and Financial Statement Schedules 96Item 16. Form 10-K Summary 98Signatures 98
i

PART I
Forward Looking Statements and Explanatory Note
This annual report contains, and management may make, certain “forward-looking statements” as defined under the Private Securities Litigation Reform Act of 1995. Statements of our intentions, beliefs, expectations or predictions for the future, denoted by the words “anticipate,” “believe,” “estimate,” “expect,” “plan,” “project,” “imply,” “intend,” “should,” “foresee” and similar expressions, are forward-looking statements that reflect our current views about future events and are subject to risks and uncertainties. Such risks and uncertainties include those described under “Risk Factors” below and elsewhere in this annual report. Actual results could differ materially from those expressed in, or implied or projected by these forward-looking statements as a result of these risks and uncertainties, many of which are difficult to predict and beyond our control. The Company’s forward-looking statements speak only as of the date of this report or as of the date they are made, and the Company undertakes no obligation to update its forward-looking statements. The risks described in this annual report are not the only risks we face, and additional risks and uncertainties may impair our business operations. The occurrence of any one or more of the factors described herein or other currently unknown factors could materially adversely affect our business and operating results.
Item 1. Business
Company Overview
Pilgrim’s Pride Corporation (referred to herein as “Pilgrim’s,” “PPC,” “the Company,” “we,” “us,” “our,” or similar terms) is primarily engaged in the production, processing, marketing and distribution of fresh, frozen and value-added chicken and pork products to retailers, distributors and foodservice operators. JBS S.A., through its indirect wholly-owned subsidiaries (together, “JBS”), beneficially owns 80.26% of our outstanding common stock.
We market our balanced portfolio of fresh, prepared and value-added meat products to a diverse set of over 6,100 customers across the U.S., the U.K. and Europe, Mexico and in approximately 115 other countries. Our sales efforts are largely targeted towards the foodservice industry, principally chain restaurants and food processors, such as Chick-fil-A® and retail customers, including grocery store chains and wholesale clubs, such as Kroger®, Costco®, Publix® and H-E-B® in the U.S., chain restaurants such as McDonald’s® and grocery store chains such as Tesco and Waitrose in the U.K. and Europe, and grocery store chains such as Wal-Mart® in Mexico.
As a vertically integrated company, we are able to control every phase of the production process, which helps us manage food safety and quality, control margins and improve customer service. Our plants are strategically located to ensure that customers timely receive fresh products. With our global network of approximately 5,100 growers, 39 feed mills, 48 hatcheries, 39 processing plants, 27 prepared foods cook plants, 25 distribution centers, ten rendering facilities and four pet food plants, we believe we are well-positioned to supply the growing demand for our products.
On October 15, 2019, the Company acquired 100% of the equity of Tulip Limited and its subsidiaries (together, “Tulip”) from Danish Crown AmbA for £311.3 million, or $393.3 million for cash. Tulip, which has subsequently changed its name to Pilgrim’s Pride Ltd. (“PPL”), is a leading, integrated prepared pork supplier headquartered in Warwick, U.K. This acquisition solidifies Pilgrim's as a leading European food company, creating one of the largest integrated prepared foods businesses in the U.K. The PPL operations are included in our U.K. and Europe reportable segment.
In 2017, we acquired (1) Granite Holdings Sàrl and its subsidiaries (together, “Moy Park”), which is one of the top-ten food companies in the U.K., Northern Ireland’s largest private sector business and one of Europe’s leading poultry producers and (2) JFC LLC and its subsidiaries (together, “GNP”), a vertically integrated poultry business that was based in Saint Cloud, Minnesota. Moy Park is included in our U.K. and Europe reportable segment and GNP is included in our U.S. reportable segment. In 2015, we acquired (3) Provemex Holdings, LLC and its subsidiaries (together, “Tyson Mexico”), a vertically integrated poultry business based in Gómez Palacio, Durango, Mexico. Tyson Mexico is included in our Mexico reportable segment.
We operate on the basis of a 52/53-week fiscal year that ends on the Sunday falling on or before December 31. Any reference we make to a particular year, for example, 2020, applies to our fiscal year and not the calendar year. Fiscal 2020 was a 52-week fiscal year.
Reportable Segments
We operate in three reportable segments: U.S., U.K. and Europe, and Mexico. We either produce or purchase for resale chicken and pork products through our operations in the U.S., the U.K. and continental Europe, and Mexico. We conduct separate operations in the U.S., the U.K., continental Europe, Puerto Rico and Mexico; however, for geographic reporting
1

purposes, we include Puerto Rico with our U.S. operations. See “Note 19. Reportable Segments” of our Consolidated Financial Statements included in this annual report for additional information.
Products and Markets
Fresh Chicken and Pork Overview. Our fresh products consist of refrigerated (nonfrozen) whole or cut-up chicken, either pre-marinated or non-marinated, frozen whole chickens, breast fillets, mini breast fillets and prepackaged case-ready chicken, primary pork cuts, added value pork and pork ribs. Our case-ready chicken includes various combinations of freshly refrigerated, whole chickens, chicken parts in trays, bags or other consumer packs labeled and priced ready for the retail grocer’s fresh meat counter. Additionally, we are an important player in the live market in Mexico. In 2020, our fresh chicken sales accounted for 85.7%, 46.9%, and 94.8% of our total U.S., U.K. and Europe, and Mexico chicken sales, respectively. In 2020, our fresh pork sales accounted for 56.8% of our total U.K. and Europe pork sales.
Prepared Chicken and Pork Overview. Our prepared chicken products include portion-controlled breast fillets, tenderloins and strips, delicatessen products, salads, formed nuggets and patties and bone-in chicken parts. These products are sold either refrigerated or frozen and may be fully cooked, partially cooked or raw. In addition, these products are breaded or non-breaded and either pre-marinated or non-marinated. Our prepared pork includes processed sausages, bacon, slow cooked, smoked meat, gammon joints, ready-to-cook variety of meat products, pre-packed meats, sandwich and deli counter meats, pulled pork balls, meatballs and coated foods. In 2020, our prepared chicken products sales accounted for 10.0%, 40.8%, and 5.2% of our total U.S., U.K. and Europe, and Mexico chicken sales, respectively. In 2020, our prepared pork products sales accounted for 37.8% of our total U.K. and Europe pork sales.
Exported Chicken and Pork Overview. Exported chicken and pork products primarily consist of whole chickens and chicken parts sold either refrigerated for distributors in the U.S. or frozen for distribution to export markets and primary pork cuts, hog heads and trotters frozen for distribution to export markets. In 2020, our export chicken products sales accounted for 4.3% and 12.3% of our total U.S. and U.K. and Europe chicken sales, respectively. In 2020, our export pork products sales accounted for 5.5% of our total U.K. and Europe pork sales.
Market Overview. Our foodservice market principally consists of chain restaurants, food processors, broad-line distributors and certain other institutions. Our retail market consists primarily of grocery store chains, wholesale clubs and other retail distributors. Our export market consists primarily of customers who purchase for distribution in the U.S., U.K. and continental Europe, or for export to Mexico, the Middle East, Asia, and other international markets.
Net Sales for Primary Product Lines and Markets
The following table sets forth, for the periods beginning with 2018, net sales attributable to each of our primary product lines and markets served with those products. We based the table on our internal sales reports and their classification of product types.
2

Year EndedDecember 27, 2020 December 29, 2019 December 30, 2018
(In thousands)
U.S. chicken:Fresh $ 6,137,265 $ 6,214,954 $ 5,959,458 Prepared 714,563 842,365 773,983 Export 306,478 282,791 258,732 Total U.S. chicken 7,158,306 7,340,110 6,992,173
U.K. and Europe chicken:Fresh 863,670 918,852 925,124 Prepared 751,196 817,292 865,864 Export 227,224 262,041 303,921 Total U.K. and Europe chicken 1,842,090 1,998,185 2,094,909
Mexico chicken:Fresh 1,210,952 1,245,976 1,252,403 Prepared 66,572 95,733 76,860 Total Mexico chicken 1,277,524 1,341,709 1,329,263
Total chicken 10,277,920 10,680,004 10,416,345 U.K. and Europe pork:
Fresh 730,703 135,985 — Prepared 486,290 134,426 — Export 70,190 16,174 — Total U.K. and Europe pork 1,287,183 286,585 —
Other products:U.S. 337,711 296,606 433,488 U.K. and Europe 145,019 99,023 53,757 Mexico 44,068 47,001 34,194
Total other products 526,798 442,630 521,439 Total net sales $ 12,091,901 $ 11,409,219 $ 10,937,784
Raw Materials
Grains. The Company utilizes various raw materials in its operations, including corn, soybean meal and wheat, along with various other ingredients from which the Company produces its own formulated feeds. In 2020, corn, soybean meal and wheat accounted for approximately 41.0%, 35.9% and 5.8% of our feed costs, respectively. The production of feed ingredients is positively or negatively affected primarily by the global level of supply inventories, demand for feed ingredients, the agricultural policies of the U.S. and foreign governments and weather patterns throughout the world. We attempt to mitigate the impact of price volatility on our profitability by decreasing the amount of our products that are sold under longer term fixed-price contracts, broadening our product portfolio and expanding the variety of contracts within our book of business. To also manage this risk, we purchase derivative financial instruments. The Company has long standing relationships with its sources of grain and other feed ingredients and expects to have an adequate supply for its present needs.
Live chicks. The Company’s chicken operations purchase one-day old chicks from a few major breeders. These chicks, when mature, serve as the grandparent and parent stock of the broilers that these operations process for consumption. Should breeder stock from its present suppliers not be available for any reason, the Company believes that it could obtain adequate breeder stock from other suppliers in the regions in which it operates.
Live pigs. The Company’s pork operations maintain a pig production base that makes up approximately 65% of the total number of pigs processed by the Company each year. Additionally, the Company’s pork operations procure live pigs for slaughter within a few days of purchase from numerous independent farmers throughout the U.K. Live pigs sourced from independent farmers make up approximately 35% of the total number of pigs processed by the Company each year. Although we generally expect adequate supply of live pigs in the U.K., there may be periods of imbalance in supply and demand.
3

Trademarks
We own registered trademarks which are used in connection with our activity in our business. The trademarks are important to the overall marketing and branding of our products. All major trademarks in our business are registered. In part, our success can be attributed to the existence and continued protection of these trademarks. As long as the Company continues to use its trademarks, they are renewed indefinitely. Some of the more significant owned or licensed trademarks used by the Company or its affiliates are Pilgrim’s®, Just BARE®, Gold’n Pump®, Gold Kist®, County Pride Chicken®, Pierce Chicken®, Pilgrim’s® Mexico, County Post®, Savoro, To-Ricos, Del Dia®, Moy Park, and O’Kane.
Seasonality
The demand for our chicken products generally is greatest during the spring and summer months and lowest during the winter months. The demand for our pork products generally is higher during the summer and peaks during the winter primarily due to the holiday season.
Key Customers
Our two largest customers accounted for approximately 13.1% and 12.9% of our net sales in 2020 and 2019, respectively. No single customer accounted for ten percent or more of our net sales in either 2020 or 2019.
Competition
The chicken and pork industry in the U.S., the U.K., continental Europe and Mexico is highly competitive. The competitive factors in our business include price, product quality, product development, brand identification, breadth of product line and customer service. We believe that being a vertically integrated chicken company and having a fully integrated supply chain in the pork business provides us with long-term cost and quality advantages over non-vertically integrated and other processors. We utilize numerous advertising and marketing techniques to develop and strengthen trade and consumer awareness and increase brand loyalty for consumer products. We believe our efforts to achieve and maintain brand awareness and loyalty help to achieve greater price premiums than would otherwise be the case in certain markets and support and expand our product distribution. We actively seek to identify and address consumer preferences by using sophisticated qualitative and quantitative consumer research techniques in key geographic markets to discover and validate new product ideas, packaging designs and methods. Although poultry and pork are relatively inexpensive in comparison with other meats, we compete indirectly with the producers of other meats and fish, since changes in the relative prices of these foods may alter consumer buying patterns.
Regulation and Environmental Matters
The poultry and pork industries are subject to government regulation, particularly in the health, workplace safety and environmental areas, including provisions relating to the discharge of materials into the environment, treatment and disposal of agricultural and food processing wastes, the use and maintenance of refrigeration systems, ammonia-based chillers, noise, odor and dust management, the operation of mechanized processing equipment and other operations, storm water, air emissions, treatment, storage and disposal of wastes, handling of hazardous substances and remediation of contaminated soil, surface water and groundwater, by the Centers for Disease Control, the United States Department of Agriculture (“USDA”), the Food and Drug Administration (“FDA”), the Environmental Protection Agency (“EPA”), the Occupational Safety and Health Administration and state and local regulatory authorities in the U.S. and by similar governmental agencies in the U.K., continental Europe and Mexico. Our chicken processing facilities in the U.S. are subject to on-site examination, inspection and regulation by the USDA. The FDA inspects the production of our feed mills in the U.S. Our food processing facilities and feed mills in the U.K., continental Europe and Mexico are subject to on-site examination, inspection and regulation by government agencies that perform functions similar to those performed by the USDA and FDA.
The EPA, environmental authorities in the U.K., continental Europe and Mexico, and/or other U.S. or Mexican state and local authorities may, from time to time, adopt revisions to environmental rules and regulations, and/or changes in the terms and conditions of our environmental permits, with which we must comply. Compliance with existing or new environmental requirements, including more stringent limitations imposed or expected in recently-renewed or soon-to be renewed environmental permits, may require capital expenditures and operating expenses which may be significant.
In the U.K., all Moy Park poultry farms which exceed a threshold size of 40,000 birds placed are required to carry out activities in compliance with their environmental permits and they must use Best Available Techniques in order to achieve a high level of environmental protection. PPL’s sites are independently audited and certified by the British Retail Consortium standard. Many of PPL’s sites are certified by additional and traceability schemes including Royal Society for the Prevention of Cruelty to Animals Assured, Soil Association, Organic Farmers and Growers and Assured Food Standards.
4

Human Capital Resources
As of December 27, 2020, we employed approximately 30,900 persons in the U.S., approximately 10,500 persons in Mexico and approximately 15,000 persons in the U.K. and Europe. Our success is largely dependent on the skills, experience and efforts of our employees. We rely on an adequate number of skilled employees to serve in critical production roles, such as processing workers and operations supervisors. In managing our business, we focus on a number of human capital measures or objectives, which are rooted in our core values and include the following items:
Health and Safety. A core tenet of our Company is the promotion of a healthy and safe working environment. Key examples of our focus and commitment include:
• We conduct safety audits of all facilities on an annual basis. These audits include auditing the physical state of the plant, policies, safety culture and our occupational health clinics.
• We engage with our team members through the use of safety committees and other safety initiatives to improve the overall safety of the workplace and advance a safety first culture.
• We seek to control ergonomic risks and prevent injuries by conducting focused annual ergonomic and physical hazard assessment at all facilities.
• Our efforts have resulted in year-over-year reductions in severe injuries, total recordable incident rate, lost time incident rate and days away restricted or transferred of 12%, 22%, 7% and 19%, respectively.
• As discussed in “Part II, Item 7—Management’s Discussion and Analysis of Financial Condition and Results of Operations—Impact of COVID-19,” we have implemented and continue to implement numerous health and safety policies and procedures focused on reducing the spread of novel coronavirus (“COVID-19”) and protecting our facility workers from risks of illness while maintaining our business continuity.
Diversity and Inclusion. We believe that promoting diversity and inclusion among our workforce helps to create a trusting and productive workplace. We encourage the management teams at each facility to hire from the local regions in which they are located. In addition:
• Our Equal Employment Opportunity Policy (“EEO Policy”) affirms our commitment to employ and support employees of all races, religions, colors, national origins, sexes, sexual orientations, gender identities and ages. Through the EEO Policy, we have been involved in diversity hiring initiatives and partnered with universities with an aim of recruiting from a diverse talent pool.
• We track our progress in our efforts to promote diversity and inclusion. For example, in 2019, women comprised 43%, 37% and 35% of our total workforce in the U.S., the U.K. and Europe, and Mexico, respectively, and 68% of our total workforce in the U.S. were minorities.
• Our management team members are expected to attend People First leadership training, which includes a model dedicated to training and awareness on diversity and inclusion.
• We provide workshops on diversity and inclusion for our employees and we engage in targeted recruitment at 20 of the nation’s largest historically black colleges and universities.
Retention and Career Development. We are committed to retaining talented employees at both production and management levels by offering competitive compensation and benefits, as well as leadership training and development opportunities.
• We strive to provide competitive pay to our team members and reward top performers. Our benefits offerings include a minimum paid time off and paid sick leave for salaried employees, life and disability insurance and Company-matching retirement plans.
• We have extensive leadership training programs, such as our Summit Program, designed to improve the skill set of our senior leadership, and our Supervisor Development Program, created to help identify and develop production workers into frontline supervisors. We have found that recognizing our employees’ efforts through training for continued advancement strengthens their performance and helps with our goals to achieve business results. Our employees completed over 390,000 training hours during 2019 and over 330,000 training hours during 2020 for our career development programs.
Community Support. We are focused on supporting the communities in which we operate and serve.
5
• Hometown Strong Initiative. During 2020, we launched our Hometown Strong initiative to help the communities in which we operate respond to the unexpected challenges on society, such as the COVID-19 pandemic. We believe the Hometown Strong initiative will provide consequential investment projects and help them prepare for unanticipated challenges and build for the future. For 2020, we committed to Hometown Strong donations of $20.0 million and during the year ended December 27, 2020 we recorded $15.0 million in incremental donations expense relating to this initiative.
• Tomorrow Fund. During 2019, we launched the Tomorrow Fund, a scholarship program designed to support the collegiate scholastic pursuits of our employees and their direct dependents. The Tomorrow Fund awards certain employees scholarships to an eligible university of their choice.
Employee Relations. We respect our team members’ rights of association, including by joining labor unions and collective bargaining. Approximately 35.2% of our workforce are covered by a collective bargaining agreement. For additional information, see “Item 1A. Risk Factors - Our performance depends on favorable labor relations with our employees and our compliance with labor laws. Any deterioration of those relations or increase in labor costs due to our compliance with labor laws could adversely affect our business.”
Available Information
The Company’s website is www.pilgrims.com. The Company makes available, free of charge, through its website, the Company’s annual reports on Form 10-K, quarterly reports on Form 10-Q, current reports on Form 8-K, directors and officers Forms 3, 4 and 5, and amendments to those reports, as soon as reasonably practicable after electronically filing such materials with, or furnishing them to, the SEC. The Company may use its website as a distribution channel of material company information. Financial and other important information regarding the Company is routinely posted on and accessible through the Company’s website at http://ir.pilgrims.com. Information contained on the Company’s website is not included as part of, or incorporated by reference into, this annual report.
Information about our Executive Officers
Name Age Background and Experience DatesFabio Sandri 49 President and Chief Executive Officer September 2020 to Present
Chief Financial Officer June 2011 to Present
Fabio Sandri was named the Chief Executive Officer in September 2020 and has served as our Chief Financial Officer since June 2011. From April 2010 to June 2011, Mr. Sandri served as the Chief Financial Officer of Estacio Participações, the private post-secondary educational institution in Brazil. From November 2008 until April 2010, he was the Chief Financial Officer of Imbra SA, a provider of dental services based in Sao Paolo, Brazil. Commencing in 2005 through October 2008, he was employed by Braskem S.A., a New York Stock Exchange-listed petrochemical company headquartered in Camaçari, Brazil, first from 2005 to 2007 as its strategy director, then from 2007 until his departure as its corporate controller. He earned his Masters in Business Administration in 2001 from the Wharton School at the University of Pennsylvania and a degree in electrical engineering in 1993 from Escola Politécnica da Universidade de São Paulo.
Item 1A. Risk Factors
The following risk factors should be read carefully in connection with evaluating our business and the forward-looking information contained in this annual report on Form 10-K. Any of the following risks could materially adversely affect our business, operations, industry or financial position or our future financial performance. While we believe we have identified and discussed below all risk factors affecting our business that we believe are material, there may be additional risks and uncertainties that are not presently known or that are not currently believed to be significant that may adversely affect our business, operations, industry, financial position and financial performance in the future.
Business and Operational Risk Factors
The COVID-19 pandemic and its impact on business and economic conditions have negatively affected, and could continue to negatively affect our business, results of operations, financial condition and the trading value of our securities.
The outbreak of COVID-19, which surfaced in Wuhan, China in December 2019, has since been declared a global pandemic. The impact of this pandemic has been and will likely continue to be extensive in many aspects of society, which has resulted in and will likely continue to result in significant disruptions to the global economy, as well as businesses and capital markets around the world. In an effort to halt the outbreak of COVID-19, a number of countries, states, counties and other
6

jurisdictions have imposed a number of measures, including but not limited to, voluntary and mandatory quarantines, stay-at-home orders, travel restrictions, limitations on gatherings of people, reduced operations and extended closures of businesses. On April 28, 2020, an executive order designated meat and poultry processing plants as critical infrastructure.
The COVID-19 outbreak has had, and a continuing outbreak or future outbreaks are likely to have, numerous adverse effects on our business and operations. As of February 10, 2021, all of our 60 production facilities are operating, although some facilities have reduced production levels and outputs due to increased health and safety measures and the decline in demand by restaurants and other foodservice businesses. There can be no assurance that the health and safety measures we have taken (which include adding temperature and symptom screening stations for employees prior to entering our facilities and increasing physical distancing of our employees) will eradicate the risks associated with working in a critical infrastructure industry, including but not limited to, infection of our employees or the temporary closure of a facility, which could, in turn, have a material adverse impact on our reputation, business, results of operations and financial condition.
We have and may continue to experience decreased production and sales due to the changing demand for food products. COVID-19 and the implementation of restricted living have led to a shift in demand from restaurants to retail grocery stores, with consumers eating more at home due to stay-at-home orders. In our U.S. and Mexico businesses, demand for parts and whole-birds (typically bound for restaurants) and prepared foods (distributed, in part, to schools) has declined, while our U.K. and European business, which is more retail focused, has generally seen less of an impact. Although we have taken and continue to take steps to shift our production and meet this changing demand, we may be unable to effectively implement our plans to adjust our supply of products, which could materially adversely impact our business and results of operations.
Our brand or reputation could be negatively impacted. The meat production industry has recently been the focus of negative press reports in light of the spread of COVID-19 at certain companies’ facilities. Although we have not been the focus of such reports, our brand or reputation could be negatively impacted by such reports.
In addition to the risks described above, the COVID-19 pandemic could have additional adverse effects on our business and financial condition, including, but not limited to, the following:
• a significant increase in the cost or the difficulty to obtain debt or equity financing, or to refinance our debt in the future, or the risk that we may be unable to meet the requirements of the covenants in our existing credit facilities, which could negatively affect our liquidity position and our ability to fund operations or future investment opportunities;
• an impairment in the carrying value of goodwill or intangible assets or a change in the useful life of definite-lived intangible assets;
• significant volatility or decline in the trading price of our securities; and• our inability to execute strategic business activities including acquisitions and divestiture.
The situation surrounding COVID-19 remains fluid and the full extent to which the COVID-19 pandemic will negatively affect our results of operations, financial condition and cash flows will depend on future development in the countries where we operate, including the U.S., the U.K. and Mexico. Therefore, it is difficult to predict with certainty the full potential impact of the virus on the Company’s business, operations and financial condition.
Industry cyclicality can affect our earnings, especially due to fluctuations in commodity prices of feed ingredients, chicken and pork.
Profitability in the chicken and pork industries is materially affected by the commodity prices of feed ingredients and the market prices of chicken and pork, which are determined by supply and demand factors. As a result, the chicken and pork industries are subject to cyclical earnings fluctuations.
The price of feed ingredients is positively or negatively affected primarily by the global level of supply inventories and demand for feed ingredients, the agricultural policies of the U.S. and foreign governments and weather patterns throughout the world. In particular, weather patterns often change agricultural conditions in an unpredictable manner. A significant change in weather patterns could affect supplies of feed ingredients, as well as both the industry’s and our ability to obtain feed ingredients, grow chickens and pigs or deliver products. We have recently benefited from low market prices for feed ingredients, but market prices for feed ingredients remain volatile. Consequently, there can be no assurance that the price of grains will not rise as a result of, among other things, increasing demand for these products around the world and alternative uses of these products, such as ethanol and biodiesel production.
Volatility in feed ingredient prices has had, and may continue to have, a materially adverse effect on our operating results, which has resulted in, and may continue to result in, additional noncash expenses due to impairment of the carrying amounts of certain of our assets. We periodically seek, to the extent available, to enter into advance purchase commitments or
7

financial derivative contracts for the purchase of feed ingredients in an effort to manage our feed ingredient costs. The use of these instruments may not be successful. In addition, we have not designated the derivative financial instruments that we have purchased to mitigate commodity purchase exposures as cash flow hedges. Therefore, we recognize changes in the fair value of these derivative financial instruments immediately in earnings. Unexpected changes in the fair value of these instruments could adversely affect the results of our operations. Although we attempt to mitigate the impact of feed price volatility on our profitability by decreasing the amount of our products that are sold under longer term fixed-price contracts, these changes will not eliminate the impact of changes in feed ingredient prices on our profitability and would prevent us from profiting on such contracts during times of declining market prices for chicken and/or pork.
Outbreaks of livestock diseases in general and poultry and pig diseases in particular, including avian influenza and African swine fever, can significantly and adversely affect our ability to conduct our operations and the demand for our products.
We take precautions designed to ensure that our flocks and herds are healthy and that our processing plants and other facilities operate in a sanitary and environmentally-sound manner. However, events beyond our control, such as the outbreaks of disease, either in our own flocks and herds or elsewhere, could significantly affect the demand for our products or our ability to conduct our operations. Furthermore, an outbreak of disease could result in governmental restrictions on the import and export of our fresh chicken, fresh pork or other products to or from our suppliers, facilities or customers, or require us to destroy one or more of our flocks or herds. This could also result in the cancellation of orders by our customers and create adverse publicity that may have a material adverse effect on our ability to market our products successfully and on our business, reputation and prospects.
There have been recent outbreaks of both high- and low-pathogenic strains of avian influenza in the U.S., and in Mexico outbreaks of both high and low-pathogenic strains of avian influenza are a fairly common occurrence. Historically, the outbreaks of low pathogenic strains of avian influenza have not generated the same level of concern, or received the same level of publicity or been accompanied by the same reduction in demand for poultry products in certain countries as that associated with highly pathogenic strains such as HPAI H5 and H7N3 or highly infectious strains such as H7N9. Even if no further highly pathogenic or highly contagious strains of avian influenza are confirmed in the U.S., the U.K. or Mexico, there can be no assurance that outbreaks of these strains in other countries will not materially adversely affect international demand for poultry produced in our operating countries, and, if any of these strains were to spread to the U.S., the U.K. or Mexico, there can be no assurance that it would not significantly affect our ability to conduct our operations and/or demand for our products, in each case in a manner having a material adverse effect on our business, reputation and/or prospects.
The outbreak of African swine fever in China and its spread across the world has had a significant effect on both the global supply of pork and on pork prices. Given its island status, the U.K. has an element of built-in biosecurity, but there are risks, mainly as a result of human movement of infected meat from the European Union. The National Pig Association and the British Meat Processors Association are pressing the U.K. government to increase the level of communication to travelers of the risks. The Company’s own pig production is geographically dispersed. In the event of an outbreak of African Swine Fever in the U.K., we believe the Company’s risks are limited to infection. However, there can be no assurance that it would not significantly affect our ability to conduct our operations and/or demand for our products, in each case in a manner having a material adverse effect on our business, reputation and/or prospects.
If our products become contaminated, we may be subject to product liability claims and product recalls. Such product liability claims or product recalls can adversely affect our business reputation, expose us to increased scrutiny by federal and state regulators and may not be fully covered by insurance.
Poultry and pork products may be subject to contamination by disease-producing organisms, or pathogens, such as Listeria monocytogenes, Salmonella, generic E.coli, Yersinia enterocolitica and Staphylococcus aureus. These pathogens are generally found in the environment and there is a risk that, as a result of food processing, they could be present in our processed poultry products. These pathogens can also be introduced as a result of improper handling at the further processing, foodservice or consumer level. These risks may be controlled, although not eliminated, by adherence to good manufacturing practices and finished product testing. We have little, if any, control over proper handling once the product has been shipped. Illness and death may result if the pathogens are not eliminated at the further processing, foodservice or consumer level. Even an inadvertent shipment of contaminated products is a violation of law and may lead to increased risk of exposure to product liability claims, product recalls and increased scrutiny by federal and state regulatory agencies and may have a material adverse effect on our business, reputation and prospects. The packaging, marketing and distribution of food products entail an inherent risk of product liability and product recall and the resultant adverse publicity. We may be subject to significant liability if the consumption of any of our products causes injury, illness or death.
8

We could be required to recall certain products in the event of contamination or damage to the products. In addition to the risks of product liability or product recall due to deficiencies caused by our production or processing operations, we may encounter the same risks if any third party tampers with our products. We cannot assure you that we will not be required to perform product recalls, or that product liability claims will not be asserted against us, in the future. Any claims that may be made may create adverse publicity that would have a material adverse effect on our ability to market our products successfully or on our business, reputation, prospects, financial condition and results of operations. If our products become contaminated, spoiled, are tampered with or are mislabeled, we may be subject to product liability claims and product recalls. A widespread product recall could result in significant losses due to the cost of a recall, the destruction of product inventory and lost sales due to the unavailability of product for a period of time. Such a product recall also could result in adverse publicity, damage to our reputation and a loss of consumer confidence in our products, which could have a material adverse effect on our business results.
We currently maintain insurance with respect to certain of these risks, including product liability insurance, business interruption insurance and general liability insurance, but in many cases such insurance is expensive, difficult to obtain and no assurance can be given that such insurance can be maintained in the future on acceptable terms, or in sufficient amounts to protect us against losses due to any such events, or at all. Moreover, even though our insurance coverage may be designed to protect us from losses attributable to certain events, it may not adequately protect us from liability and expenses we incur in connection with such events.
Our foreign operations and commerce in international markets pose special risks to our business and operations.
We have significant operations and assets located in Mexico, the U.K. and continental Europe and may participate in or acquire operations and assets in other foreign countries in the future. Foreign operations are subject to a number of special risks such as currency exchange rate fluctuations, trade barriers, exchange controls, expropriation and changes in laws and policies, including tax laws and laws governing foreign-owned operations. Currency exchange rate fluctuations have adversely affected us in the past. Exchange rate fluctuations or one or more other risks may have a material adverse effect on our business or operations in the future. Our operations in Mexico, the U.K. and continental Europe are conducted through subsidiaries organized under non-U.S. laws. Claims of creditors of our subsidiaries, including trade creditors, will generally have priority as to the assets of our subsidiaries over our claims. Additionally, the ability of these subsidiaries to make payments and distributions to us can be limited by terms of subsidiary financing arrangements and will be subject to, among other things, the laws applicable to these subsidiaries. In the past, these laws have not had a material adverse effect on the ability of these subsidiaries to make these payments and distributions. However, laws such as these may have a material adverse effect on the ability of these subsidiaries to make these payments and distributions in the future.
To conduct our operations, we regularly move data across national borders (including data related to business, financial, marketing and regulatory matters) and must comply with increasingly complex and rigorous regulatory standards enacted to protect business and personal data in the U.S. and elsewhere. For example, in 2018, the European Union (the “EU”) recently commenced enforcement of the General Data Protection Regulation (the “GDPR”). The GDPR imposes significant additional compliance obligations on companies regarding the handling of personal data and provides certain individual privacy rights to persons whose data is stored. The GDPR grants enforcement powers to certain EU regulators including extra-territorial powers in some cases. These enforcement powers enable regulators to conduct investigations and dawn raids, to issue penalties up to the greater of €20 million or 4% of worldwide turnover for the most serious violations, and to require changes to the way that organizations (including the Company) use personal data. Due to the geographic scope of our operations, the GDPR may increase our responsibility and liability in relation to personal data that we process, and we may be required to put in place additional mechanisms to minimize the risk of non-compliance with applicable privacy laws and regulations. Compliance with existing, proposed and recently enacted laws and regulations can be costly; any failure to comply with these regulatory standards could subject us to legal and reputational risks including proceedings against the Company by governmental entities or others, fines and penalties, damage to our reputation and credibility and could have a negative impact on our business and results of operations.
Historically, we have targeted international markets to generate additional demand for our products. In particular, given the general preference for white chicken meat by U.S. and U.K. consumers, we have targeted international markets for the sale of dark chicken meat and parts, such as chicken paws, which are generally not consumed in the U.S. or U.K. We have also targeted international markets for excess primary pork cuts and parts, such as hog heads and trotters, which are generally not consumed in the U.K. As part of this initiative, we have created a significant international distribution network into several markets in Mexico, the Middle East and Asia. Our success in these markets may be, and our success in recent periods has been, adversely affected by disruptions in export markets. A significant risk is disruption due to import restrictions and tariffs, other trade protection measures, and import or export licensing requirements regarding food products imposed by foreign countries. Significant political or regulatory developments in the jurisdictions in which we sell our products, such as those stemming from the presidential administration in the United States, are difficult to predict and may have a material adverse effect on us. For
9

example, the implementation of new tariff schemes by various governments, such as those implemented by the United States and China in recent years, could increase the costs of our operations and ultimately increase the cost of products sold from one country into another country. In addition, disruptions may be caused by outbreaks of diseases, either in our flocks and herds or elsewhere in the world, and resulting changes in consumer preferences. One or more of these or other disruptions in the international markets and distribution channels could adversely affect our business.
Competition in the chicken and pork industries with other vertically integrated chicken or pork companies may make us unable to compete successfully in this industry, which could adversely affect our business.
Both the chicken and pork industries are highly competitive. In the U.S., Mexico, the U.K. and continental Europe, we primarily compete with other vertically integrated chicken and pork companies. In general, the competitive factors in these industries include price, product quality, product development, brand identification, breadth of product line and customer service. Competitive factors vary by major market. In the foodservice market, competition is based on consistent quality, product development, service and price. In the U.S. retail market, competition is based on product quality, brand awareness, customer service and price. Further, there is some competition with non-vertically integrated further processors in the prepared chicken business. In the Mexico retail and foodservice markets, where product differentiation has traditionally been limited, product quality and price have been the most critical competitive factors. In the U.K. and continental Europe retail and food service markets, key competitive factors include price, delivering consistent levels of the highest quality, service level and delivering strong innovation. The fresh U.K. and continental Europe market is almost exclusively retailer private label. The U.K. fresh market is almost exclusively sourced from within the U.K., making vertical integration a prerequisite for operating in that market. The U.K. prepared foods market is less exclusively sourced from within the U.K. so vertical integration is less of a consideration and competition is opened up to other processors, some of whom produce or source from abroad. Our success depends in part on our ability to manage costs and be efficient in the highly competitive poultry and pork industries, and our failure to manage costs and be efficient could materially and adversely affect our business, financial condition and results of operations.
Media campaigns related to food production and regulatory and customer focus on environmental, social and governance responsibility could expose us to additional costs or risks.
Individuals or organizations can use social media platforms to publicize inappropriate or inaccurate stories or perceptions about the food production industry or our company. Such practices could cause damage to the reputations of our company and/or the food production industry in general. This damage could adversely affect our financial results. In addition, regulators, stockholders, customers and other interested parties have focused increasingly on the environmental, social and governance practices of companies. This has led to an increase in regulations and may continue to cause us to be subject to additional regulations in the future. Our customers or other interested parties may also require us to implement certain environmental, social or governance procedures or standards before doing or continuing to do business with us. This increased attention on environmental, social and governance practices could cause us to incur additional compliance costs, divert management attention from operating our business, impair our access to capital among certain investors and subject us to litigation risk for disclosures we make and practices we adopt regarding these issues. This in turn could have a material adverse effect on our business, financial condition and results of operations.
We are increasingly dependent on information technology, and our business and reputation could suffer if we are unable to protect our information technology systems against, or effectively respond to, cyber-attacks, other cyber incidents or security breaches or if our information technology systems are otherwise disrupted.
The proper functioning of our information systems is critical to the successful operation of our business. We rely on information technology networks and systems, including the Internet, to process, transmit, and store electronic and financial information, to manage a variety of business processes and activities, and to comply with regulatory, legal, and tax requirements. We also depend on our information technology infrastructure for digital marketing activities and for electronic communications among our locations, personnel, customers, and suppliers. Although our information systems are protected with robust backup systems, including physical and software safeguards and remote processing capabilities, information systems are still vulnerable to cyber-attacks, natural disasters, power losses, unauthorized access, telecommunication failures, and other problems. In addition, certain software used by us is licensed from, and certain services related to our information systems are provided by, third parties who could choose to discontinue their relationship with us. If critical information systems fail or these systems or related software or services are otherwise unavailable, our ability to process orders, maintain proper levels of inventories, collect accounts receivable, pay expenses, and maintain the security of Company and customer data could be adversely affected. Cyber-attacks and other cyber incidents are occurring more frequently and are constantly evolving in nature and sophistication. We have experienced and expect to continue to experience actual or attempted cyber-attacks of our information technology systems or networks. However, none of these actual or attempted cyber-attacks has had a material effect on our operations or financial condition. Our failure to maintain our cyber-security measures and keep abreast of new and
10

evolving threats may make our systems vulnerable. The potential consequences of a material cyber-security incident include reputational damage, litigation with third parties, regulatory actions, disruption of plant operations, and increased cyber-security protection and remediation costs. There can be no assurance that we will be able to prevent all of the rapidly evolving forms of increasingly sophisticated and frequent cyber-attacks. Moreover, our efforts to address network security vulnerabilities may not be successful, resulting potentially in the theft, loss, destruction or corruption of information we store electronically, as well as unexpected interruptions, delays or cessation of service, any of which would cause harm to our business operations. The vulnerability of our systems and our failure to identify or respond timely to cyber incidents could have an adverse effect on our operations and reputation and expose us to liability or regulatory enforcement actions.
Our operations are subject to general risks of litigation.
We are involved on an ongoing basis in litigation relating to alleged antitrust violations or arising in the ordinary course of business or otherwise. Trends in litigation may include class actions involving consumers, shareholders, employees or injured persons, and claims relating to commercial, labor, employment, antitrust, securities or environmental matters. Litigation trends and the outcome of litigation cannot be predicted with certainty, and adverse litigation trends and outcomes could result in material damages, which could adversely affect our financial condition and results of operations.
For example, between September 2, 2016 and October 13, 2016, a series of purported class action lawsuits were brought against PPC and 19 other defendants by and on behalf of direct and indirect purchasers of broiler chickens alleging violations of federal and state antitrust and unfair competition laws. The complaints seek, among other relief, treble damages for an alleged conspiracy among defendants to reduce output and increase prices of broiler chickens from the period of January 2008 to the present. The class plaintiffs have filed three consolidated amended complaints: one on behalf of direct purchasers (“the Direct Purchaser Plaintiff Class”) and two on behalf of distinct groups of indirect purchasers. On January 11, 2021, PPC announced that it had entered into an agreement to settle all claims made by the putative Direct Purchaser Plaintiff Class, which is subject to court approval. Pursuant to this agreement, PPC agreed to pay the Direct Purchaser Plaintiff Class $75.0 million, which PPC recognized as an expense during the fourth quarter of fiscal 2020. In addition, on October 13, 2020, the Company announced that it had entered into a plea agreement with the U.S. Department of Justice (the “DOJ”) pursuant to which the Company agreed to (1) plead guilty to one count of conspiracy in restraint of competition involving sales of broiler chicken products in the U.S. in violation of the Sherman Antitrust Act, 15 U.S.C. § 1, and (2) pay a fine of $110,524,140. For additional information, see Part II, Item 8, Notes to Consolidated Financial Statements, “Note 20. Commitments and Contingencies” in this annual report. The consequences of the litigation matters PPC faces are inherently uncertain, and adverse actions, judgments or settlements in some or all of these matters has resulted and may in the future result in materially adverse monetary damages, fines, penalties, or injunctive relief against PPC. Any claims or litigation, even if fully indemnified or insured, could damage PPC’s reputation and make it more difficult to compete effectively or to obtain adequate insurance in the future.
We may not be able to successfully integrate the operations of companies we acquire or benefit from growth opportunities.
We continue to pursue selective acquisitions of complementary businesses, such as PPL, which we acquired in 2019. Inherent in any future acquisitions are certain risks such as increasing leverage and debt service requirements and combining company cultures and facilities, which could have a material adverse effect on our operating results, particularly during the period immediately following such acquisitions. Additional debt or equity capital may be required to complete future acquisitions, and there can be no assurance that we will be able to raise the required capital. These opportunities may expose us to successor liability relating to actions involving any acquired entities, their respective management or contingent liabilities incurred prior to our involvement and will expose us to liabilities associated with ongoing operations, in particular to the extent we are unable to adequately and safely manage such acquired operations. A material liability associated with these types of opportunities, or our failure to successfully integrate any acquired entities into our business, could adversely affect our reputation and have a material adverse effect on us.
We may not be able to successfully integrate any growth opportunities we may undertake in the future or successfully implement appropriate operational, financial and administrative systems and controls to achieve the benefits that we expect to result therefrom. These risks include: (1) failure of the acquired entities to achieve expected results; (2) possible inability to retain or hire key personnel of the acquired entities; and (3) possible inability to achieve expected synergies and/or economies of scale. In addition, the process of integrating businesses could cause interruption of, or loss of momentum in, the activities of our existing business. The diversion of our management’s attention, the lack of experience in operating in the geographical market of the acquired business and any delays or difficulties encountered in connection with the integration of these businesses could adversely affect our business, results of operations and prospects.
The consolidation of customers and/or the loss of one or more of our largest customers could adversely affect our business.
11

Our customers, such as supermarkets, warehouse clubs and food distributors, have consolidated in recent years, and consolidation is expected to continue throughout the U.S. and in other major markets. These consolidations have produced large, sophisticated customers with increased buying power who are more capable of operating with reduced inventories, opposing price increases, and demanding lower pricing, increased promotional programs and specifically tailored products. These customers also may use shelf space currently used for our products for their own private label products. Because of these trends, our volume growth could slow or we may need to lower prices or increase promotional spending for our products, any of which could adversely affect our financial results.
Our two largest customers accounted for approximately 13.1% of our net sales in 2020. Our business could suffer significant setbacks in revenues and operating income if we lost one or more of our largest customers, or if our customers’ plans and/or markets should change significantly.
We depend on contract growers and independent producers to supply us with livestock.
We contract primarily with independent contract growers to raise the live chickens and pigs processed in our operations. If we do not attract and maintain contracts with growers or maintain marketing and purchasing relationships with independent producers, our production operations could be negatively affected.
Changes in consumer preference could negatively impact our business.
The food industry in general is subject to changing consumer trends, demands and preferences. Trends within the food industry change often, and failure to identify and react to changes in these trends could lead to, among other things, reduced demand and price reductions for our products, and could have an adverse effect on our financial results. For example, consumer concerns related to human health, climate change, resource conservation and animal welfare of animal-based protein sources have driven consumer interest in plant-based protein sources. Because we primarily produce chicken and pork products, we may be limited in our ability to respond to changes in consumer preferences towards other animal-based proteins or away from animal-based proteins entirely.
Legal and Regulatory Risk Factors
Regulation, present and future, is a constant factor affecting our business.
Our operations will continue to be subject to or otherwise affected by federal, state and local governmental legislation and regulation, including in the health, safety and environmental areas. Changes in laws or regulations or the application thereof regarding areas such as wage and hour and environmental compliance may lead to government enforcement actions and resulting litigation by private litigants. In addition, unknown matters, new laws and regulations, or stricter interpretations of existing laws or regulations may also materially affect our business or operations in the future.
Immigration
Immigration reform continues to attract significant attention in the public arena and the U.S. Congress. Despite our past and continuing efforts to hire only U.S. citizens and/or persons legally authorized to work in the U.S., we may be unable to ensure that all of our employees are U.S. citizens and/or persons legally authorized to work in the U.S. No assurances can be given that enforcement efforts by governmental authorities will not disrupt a portion of our workforce or operations at one or more facilities, thereby negatively impacting our business. Also, no assurance can be given that further enforcement efforts by governmental authorities will not result in the assessment of fines that could adversely affect our financial position, operating results or cash flows.
Environmental, Health and Safety
Our operations are subject to extensive and increasingly stringent federal, state, local and foreign laws and regulations pertaining to the protection of the environment, including those relating to the discharge of materials into the environment, the handling, treatment and disposal of wastes and remediation of soil and groundwater contamination. Failure to comply with these requirements could have serious consequences for us, including criminal as well as civil and administrative penalties, claims for property damage, personal injury and damage to natural resources and negative publicity. Compliance with existing or changing environmental requirements, including more stringent limitations imposed or expected to be imposed in recently-renewed or soon-to be renewed environmental permits, will require capital expenditures for installation of new or upgraded pollution control equipment at some of our facilities.
Operations at many of our facilities require the treatment and disposal of wastewater, stormwater and agricultural and food processing wastes, the use and maintenance of refrigeration systems, including ammonia-based chillers, noise, odor and dust management, the operation of mechanized processing equipment, and other operations that potentially could affect the
12

environment, health and safety. Some of our facilities have been operating for many years, and were built before current environmental standards were imposed, and/or in areas that recently have become subject to residential and commercial development pressures. Failure to comply with current and future environmental, health and safety standards could result in the imposition of fines and penalties, and we have been subject to such sanctions from time to time. We are upgrading wastewater treatment facilities at a number of these locations, either pursuant to consent agreements with regulatory authorities or on a voluntary basis in anticipation of future permit requirements.
In the past, we have acquired businesses with operations such as pesticide and fertilizer production that involved greater use of hazardous materials and generation of more hazardous wastes than our current operations. While many of those operations have been sold or closed, some environmental laws impose strict and, in certain circumstances, joint and several liability for costs of investigation and remediation of contaminated sites on current and former owners and operators of the sites, and on persons who arranged for disposal of wastes at such sites. In addition, current owners or operators of such contaminated sites may seek to recover cleanup costs from us based on past operations or contractual indemnifications.
Additionally, we have from time to time had incidents at our plants involving worker health and safety. These have included ammonia releases due to mechanical failures in chiller systems and worker injuries and fatalities involving processing equipment and vehicle accidents. We have taken preventive measures in response; however, we can make no assurance that similar incidents will not arise in the future. New environmental, health and safety requirements, stricter interpretations of existing requirements, or obligations related to the investigation or clean-up of contaminated sites, may materially affect our business or operations in the future.
Anti-Corruption
We are subject to a number of anti-corruption laws, including the U.S. Foreign Corrupt Practices Act (“FCPA”) and the UK Bribery Act. The FCPA and similar anti-bribery laws generally prohibit companies and their intermediaries from making improper payments or improperly providing anything of value to foreign officials, directly or indirectly, for the purpose of obtaining or keeping business and/or other benefits. Some of these laws have legal effect outside the jurisdictions in which they are adopted under certain circumstances. The FCPA also requires maintenance of adequate record-keeping and internal accounting practices to accurately reflect transactions. Under the FCPA, companies operating in the United States may be held liable for actions taken by their strategic or local partners or representatives. The UK Bribery Act is broader in scope than the FCPA in that it directly prohibits commercial bribery (i.e. bribing others than government officials) in addition to bribery of government officials and it does not recognize certain exceptions, notably for facilitation payments, that are permitted by the FCPA. The UK Bribery Act also has wide jurisdiction. It covers any offense committed in the United Kingdom, but proceedings can also be brought if a person who has a close connection with the United Kingdom commits the relevant acts or omissions outside the United Kingdom. The UK Bribery Act defines a person with a close connection to include British citizens, individuals ordinarily resident in the United Kingdom and bodies incorporated in the United Kingdom. The UK Bribery Act also provides that any organization that conducts part of its business in the United Kingdom, even if it is not incorporated in the United Kingdom, can be prosecuted for the corporate offense of failing to prevent bribery by an associated person, even if the bribery took place entirely outside the United Kingdom and the associated person had no connection with the United Kingdom. Other jurisdictions in which we operate have adopted similar anti-corruption, anti-bribery and anti-kickback laws to which we are subject. Civil and criminal penalties may be imposed for violations of these laws.
Despite our ongoing efforts to ensure compliance with the FCPA, the UK Bribery Act and similar laws, there can be no assurance that our directors, officers, employees, agents, third-party intermediaries and the companies to which we outsource certain of our business operations, have previously complied or will comply with those laws and our anti-corruption policies or that our compliance program will be sufficient to prevent or detect bribery, and we may be ultimately held responsible for any such non-compliance. If we or our directors or officers violate anti-corruption laws or other laws governing the conduct of business with government entities (including local laws), we or our directors or officers may be subject to criminal and civil penalties or other remedial measures, which could harm our reputation and have a material adverse impact on our business, financial condition, results of operations and prospects. Any actual or alleged violations of such laws could also harm our reputation or have an adverse impact on our business, financial condition, results of operations and prospects.
Our operations may be adversely impacted by the U.K.’s recent exit from the European Union.
On January 31, 2020, the U.K. withdrew from the European Union, which is commonly referred to as Brexit. A transition period ended on December 31, 2020, during which the U.K. and European Union negotiated the terms of the U.K.’s relationship with the European Union going forward. Despite the implementation of the EU-U.K. Trade and Cooperation Agreement beginning on January 1, 2021, it is still unclear how Brexit will ultimately impact relationships within the U.K. and between the U.K. and other countries on many aspects of fiscal policy, cross-border trade and international relations. The effects of and the perceptions as to the impact from the withdrawal of the U.K. from the European Union has and may continue to adversely affect business activity and economic and market conditions in the U.K., Europe and globally, and could contribute
13

to instability in global financial and foreign exchange markets, including volatility in the value of the pound sterling and the euro. In addition, Brexit could lead to additional political, legal and economic instability in the European Union. Any of these effects of Brexit, and others we cannot anticipate, could adversely affect our business in the U.K., as well as our financial condition, results of operations and cash flows. It is also unclear what long-term economic, financial, trade and legal implications the withdrawal of the U.K. from the EU will have and how such withdrawal will affect our customers and our operations in the U.K. and Europe. If the U.K. were to significantly alter its regulations affecting the food industry, we could face significant new costs. Any of the effects of Brexit could adversely affect our business, business opportunities, results of operations, financial condition and cash flows. In addition, the U.K.’s withdrawal from the European Union will result in changes to the interactions that the Company has with regulators, as the U.K.’s domestic regulators will no longer participate in the EU’s regulatory enforcement structure. This may affect relationships that the Company has developed with its regulators to date.
Labor and Employment Risk Factors
Our performance depends on favorable labor relations with our employees and our compliance with labor laws. Any deterioration of those relations or increase in labor costs due to our compliance with labor laws could adversely affect our business.
As of December 27, 2020, we employed approximately 30,900 persons in the U.S., approximately 10,500 persons in Mexico and approximately 15,000 persons in the U.K. and Europe. Approximately 35.2% of our workforce are covered by a collective bargaining agreement. Substantially all employees covered under collective bargaining agreements are covered under agreements that expire in 2021 or later. We have not experienced any labor-related work stoppage at any location in over ten years. We believe our relationship with our employees and union leadership is satisfactory. At any given time, we will likely be in some stage of contract negotiations with various collective bargaining units. In the absence of an agreement, we may become subject to labor disruption at one or more of these locations, which could have an adverse effect on our financial results.
Loss of essential employees or material increase in employee turnover could have a significant negative impact on our business.
Our success is largely dependent on the skills, experience, and efforts of our management and other employees. The loss of the services of one or more members of our senior management or of numerous employees with essential skills could have a negative effect on our business, financial condition and results of operations. If we are not able to retain or attract talented, committed individuals to fill vacant positions when needs arise, it may adversely affect our ability to achieve our business objectives.
We also rely on an adequate supply of skilled employees at our processing and food facilities. Trained and experienced personnel in our industry are in high demand, and we have experienced high turnover and difficulty retaining employees with appropriate training and skills. We cannot predict whether we will be able to attract, motivate and maintain an adequate skilled workforce necessary to operate our existing and future facilities efficiently, or that labor expenses will not increase as a result of a shortage in the supply of skilled personnel, thereby adversely impacting our financial performance. While our industry generally operates with high employee turnover, any material increases in employee turnover rates or any widespread employee dissatisfaction could also have a material adverse effect on our business, financial condition and results of operations.
Stock Ownership and Financial Risk Factors
JBS USA beneficially owns a majority of our common stock and has the ability to control the vote on most matters brought before the holders of our common stock.
JBS USA beneficially owns a majority of the shares and voting power of our common stock and is entitled to appoint a majority of the members of our Board of Directors. As a result, subject to restrictions on its voting power and actions in a stockholders agreement between JBS USA and us and our organization documents, JBS USA has and will have the ability to control our management, policies and financing decisions, elect a majority of the members of our Board of Directors at the annual meeting and control the vote on most matters coming before the holders of our common stock. Under the stockholders agreement between JBS USA and us, JBS USA has the ability to elect up to seven members of our Board of Directors and the other holders of our common stock have the ability to elect up to two members of our Board of Directors.
JBS USA may have interests that are different from other shareholders and may vote in a way that may be adverse to our other shareholders’ interests. JBS USA’s concentration of ownership could also have the effect of delaying or preventing a change in control or otherwise discouraging a potential acquirer from attempting to obtain control of us, which could cause the market price of our common stock to decline or prevent our shareholders from realizing a premium over the market price for their common stock.
14
Our future financial and operating flexibility may be adversely affected by significant leverage.
On a consolidated basis, as of December 27, 2020, we had approximately $451.7 million in secured indebtedness, $1.8 billion of unsecured indebtedness and had the ability to borrow approximately $933.6 million under our credit agreements. Significant amounts of cash flow will be necessary to make payments of interest and repay the principal amount of such indebtedness. The degree to which we are leveraged could have important consequences because (1) it could affect our ability to satisfy our obligations under our credit agreements, (2) a substantial portion of our cash flow from operations is required to be dedicated to interest and principal payments and may not be available for operations, working capital, capital expenditures, expansion, acquisitions or general corporate or other purposes, (3) our ability to obtain additional financing and to fund working capital, capital expenditures and other general corporate requirements in the future may be impaired; (4) we may be more highly leveraged than some of our competitors, which may place us at a competitive disadvantage, (5) our flexibility in planning for, or reacting to, changes in our business may be limited, (6) it may limit our ability to pursue acquisitions and sell assets and (7) it may make us more vulnerable in the event of a continued or new downturn in our business or the economy in general.
Our ability to make payments on and to refinance our debt, including our credit facilities, will depend on our ability to generate cash in the future. This, to a certain extent, is subject to various business factors (including, among others, the commodity prices of feed ingredients, chicken and pork) and general economic, financial, competitive, legislative, regulatory, and other factors that are beyond our control.
There can be no assurance that we will be able to generate sufficient cash flow from operations or that future borrowings will be available under our credit facilities in an amount sufficient to enable us to pay our debt obligations, including obligations under our credit facilities, or to fund our other liquidity needs. We may need to refinance all or a portion of their debt on or before maturity. There can be no assurance that we will be able to refinance any of their debt on commercially reasonable terms or at all.
The interest rates of our credit facilities are priced using a spread over LIBOR.
The London Interbank Offered Rate (“LIBOR”), is the basic rate of interest used in lending between banks on the London interbank market and is widely used as a reference for setting the interest rate on loans globally. We typically use LIBOR as a reference rate in our term loans such that the interest due to our creditors pursuant to a term loan extended to us is calculated using LIBOR. Some of our term loan agreements and revolving credit facilities contain a stated minimum value for LIBOR, and as of December 27, 2020, the Company had $450.0 million in outstanding indebtedness tied to LIBOR.
In 2017, the U.K.’s Financial Conduct Authority, which regulates LIBOR, announced that it intends to phase out LIBOR by the end of 2021. It is unclear if at that time whether or not LIBOR will cease to exist, or if new methods of calculating LIBOR will be established such that it continues to exist after 2021 or if replacement conventions will be developed. The U.S. Federal Reserve, in conjunction with the Alternative Reference Rates Committee, a steering committee comprised of large U.S. financial institutions, is considering replacing U.S. dollar LIBOR with a new index calculated by short-term repurchase agreements, backed by Treasury securities (“SOFR”). SOFR is observed and backward-looking, which stands in contrast with LIBOR under the current methodology, which is an estimated forward-looking rate and relies, to some degree, on the expert judgment of submitting panel members. Given that SOFR is a secured rate backed by government securities, it will be a rate that does not take into account bank credit risk (as is the case with LIBOR). Whether or not SOFR attains market traction as a LIBOR replacement tool remains in question. As such, the future of LIBOR at this time is uncertain. At this time, due to a lack of consensus existing as to what rate or rates may become accepted alternatives to LIBOR, it is impossible to predict the effect of any such alternatives on our liquidity. However, if LIBOR ceases to exist, we may need to renegotiate our credit agreements that utilize LIBOR as a factor in determining the interest rate to replace LIBOR with the new standard that is established. Additionally, these changes may have an adverse impact on the value of or interest earned on any LIBOR-based marketable securities, loans and derivatives that are included in our financial assets and liabilities.
Impairment in the carrying value of goodwill could negatively affect our operating results.
We have a significant amount of goodwill on our Consolidated Balance Sheets. Under the accounting principles generally accepted in the U.S. (“U.S. GAAP”), goodwill must be evaluated for impairment annually or more frequently if events indicate it is warranted. If the carrying value of our reporting units exceeds their current fair value as determined based on the discounted future cash flows of the related business, the goodwill is considered impaired and is reduced to fair value by a non-cash charge to earnings. Events and conditions that could result in impairment in the value of our goodwill include changes in the industry in which we operate, particularly the impact of a downturn in the global economy or the economies of geographic regions or countries in which we operate, as well as competition, adverse changes in the regulatory environment, or other factors leading to reduction in expected long-term sales or profitability.
15
General Risk Factors
Extreme weather, natural disasters or other events beyond our control could negatively impact our business.
Bioterrorism, fire, pandemic, extreme weather or natural disasters, including droughts, floods, excessive cold or heat, hurricanes or other storms, could impair the health or growth of our flocks, production or availability of feed ingredients, or interfere with our operations due to power outages, fuel shortages, damage to our production and processing facilities or disruption of transportation channels, among other things. Any of these factors could have an adverse effect on our financial results. Moreover, climate change, including the impact of global warming, has resulted in risks that include changes in weather conditions, extreme weather events and adverse impacts on agricultural production, as well as potential regulatory compliance risks, all of which could have a material adverse effect on our results of operations, financial condition and liquidity.
Item 1B. Unresolved Staff Comments
None.
16

Item 2. Properties
Operating Facilities
Our main operating facilities are as follows:
Number of Facilities(a)
Owned Leased Total Capacity(b) Unit of Measure
Average Capacity
Utilization
Chicken Operations:Fresh processing facilities 35 1 36 8.6 million Birds per day 83.9 %Prepared foods facilities 13 2 15 32.5 million Tons per year 68.1 %Hatcheries 47 1 48 3.2 billion Eggs per year 76.2 %Other operation facilities(c) 51 3 54 17.1 million Tons per year 64.4 %Grain elevator 1 — 1 8.6 million Bushels per year 23.6 %
Pork Operations:Fresh processing facilities 3 — 3 9,900 Pigs per day 82.9 %Prepared foods facilities 12 — 12 246,144 Tons per year 70.4 %
Distribution centers and other facilities 10 16 26 N/A N/A(a) Substantially all of our U.S. property, plant and equipment is used as collateral for our secured U.S. credit facility. See Part II, Item 8, Notes to
Consolidated Financial Statements, “Note 13. Debt.”(b) Capacity and utilization numbers do not include idled facilities.(c) Other operation facilities includes feed mills, protein conversion and rendering facilities, pet food facilities and one freezer in the U.S.
17

Item 3. Legal Proceedings
The information required with respect to this item can be found in Part II, Item 8, Notes to Consolidated Financial Statements, “Note 20. Commitments and Contingencies” in this annual report and is incorporated by reference into this Item 3.
Item 4. Mine Safety Disclosures
None.
18

PART II
Item 5. Market for the Registrant’s Common Equity, Related Stockholder Matters and Issuer Purchases of Equity Securities
Market Information
Our common stock is listed on the Nasdaq Global Select Market (“Nasdaq”) under the symbol “PPC.”
Holders
The Company estimates that there were approximately 52,600 holders (including individual participants in security position listings) of the Company’s common stock as of February 10, 2021.
Dividends
The Company has no current intention to pay any dividends to its stockholders. Any change in dividend policy will depend upon future conditions, including earnings and financial condition, general business conditions, any applicable contractual limitations and other factors deemed relevant by our Board of Directors in its discretion.
Both the U.S. Credit Facility and the indentures governing the Company’s senior notes restrict, but do not prohibit, the Company from declaring dividends. In addition, the terms of the Moy Park Multicurrency Revolving Facility Agreement restrict Moy Park’s ability and the ability of certain of Moy Park’s subsidiaries to, among other things, make payments and distributions to us, which could in turn impair our ability to pay dividends to our stockholders. See "Note 13. Debt” of our Consolidated Financial Statements included in this annual report for additional information.
Issuer Purchases of Equity Securities
On October 31, 2018, the Company’s Board of Directors approved a $200.0 million share repurchase authorization. The Company plans to repurchase shares through various means, which may include but are not limited to open market purchases, privately negotiated transactions, the use of derivative instruments and/or accelerated share repurchase programs. The extent to which the Company repurchases its share and the timing of such repurchases will vary and depend upon market conditions and other corporate considerations, as determined by the Company’s management team. The Company reserves the right to limit or terminate the repurchase program at any time without notice. As of December 27, 2020, the Company had repurchased 6,257,135 shares under this program for an aggregate cost of $113.4 million and an average price of $18.1195 per share. Set forth below is information regarding our stock repurchases for the three months ended December 27, 2020.
Issuer Purchases of Equity Securities
Period
Total Number of Shares
PurchasedAverage Price Paid per Share
Total Number of Shares Purchased as Part of Publicly Announced Plans
or Programs
Approximate Dollar Value of the Shares That May Yet Be Purchased Under the Plans or
Programs (a)
September 28, 2020 through October 25, 2020 49,700 $ 15.62 6,155,144 $ 88,283,745 October 26, 2020 through November 29, 2020 101,991 16.27 6,257,135 86,624,088 November 30, 2020 through December 27, 2020 — — 6,257,135 86,624,088
Total 151,691 $ 16.06 6,257,135 $ 86,624,088 (a) Reflects the remaining dollar value of shares that may yet be repurchased under our share repurchase authorization, the parameters of which are
described above. The plan was announced on October 31, 2018.
Performance Graph
The graph below shows a comparison from December 27, 2015 through December 27, 2020 of the cumulative 5-year total stockholder return of holders of the Company’s common stock with the cumulative total returns of the Russell 2000 index and a customized peer group of three companies: Hormel Foods Corp, Sanderson Farms Inc. and Tyson Foods Inc. The graph assumes that the value of the investment in our common stock, in each index, and in the peer group (including reinvestment of dividends) was $100 on December 27, 2015 and tracks it through December 27, 2020.
19

The graph covers the period from December 27, 2015 to December 27, 2020, and reflects the performance of the Company’s single class of common stock. The stock price performance represented by this graph is not necessarily indicative of future stock performance.
12/27/15 06/30/16 12/25/16 06/30/17 12/31/17 06/30/18 12/30/18 06/30/19 12/29/19 06/01/20 12/27/20
PPC $ 100.00 $ 125.88 $ 93.96 $ 108.29 $ 153.44 $ 99.45 $ 77.02 $ 125.43 $ 162.88 $ 83.44 $ 95.59
Russell 2000 100.00 102.22 121.31 127.36 139.08 149.73 123.76 144.78 155.35 135.19 186.36
Peer Group 100.00 106.20 102.35 102.92 122.77 113.35 108.34 131.79 150.91 127.43 132.33
20

Item 6. Selected Financial Data
2020 2019(c) 2018(c) 2017(c) 2016Operating Results Data: (In thousands, except ratios and per share data)
Net sales $ 12,091,901 $ 11,409,219 $ 10,937,784 $ 10,767,863 $ 9,878,564 Gross profit 838,196 1,070,394 843,476 1,471,614 1,103,983 Operating income 245,463 690,568 495,686 1,072,322 792,082 Interest expense, net(a) 118,813 118,353 149,001 99,453 73,335 Gain on bargain purchase 3,746 (56,880) — — — Loss on early extinguishment of debt — — 16,758 166 — Income before income taxes 161,825 617,545 332,227 982,066 724,036 Income tax expense 66,755 161,009 85,423 263,899 243,919 Net income 95,070 456,536 246,804 718,167 480,117 Net income (loss) attributable to noncontrolling interest 313 612 (1,141) 102 (803) Net income attributable to Pilgrim’s Pride Corporation 94,757 455,924 247,945 694,579 440,532
Per Common Diluted Share Data:Net income attributable to Pilgrim’s Pride Corporation $ 0.39 $ 1.83 $ 1.00 $ 2.79 $ 1.73 Adjusted net income attributable to Pilgrim’s Pride Corporation(b) 1.02 1.62 1.28 2.89 1.75 Book value 10.52 10.11 8.06 7.45 8.21
Balance Sheet Summary:Working capital $ 965,131 $ 950,081 $ 938,434 $ 1,063,765 $ 624,728 Total assets 7,474,497 7,102,364 5,931,202 6,248,652 5,021,942 Notes payable and current maturities of long-term debt 25,455 26,392 30,405 47,775 15,712 Long-term debt, less current maturities 2,255,546 2,276,029 2,295,190 2,635,617 1,396,124 Total stockholders’ equity 2,575,347 2,536,060 2,019,585 1,855.661 2,086,132
Cash Flow Summary:Cash flows from operating activities $ 724,247 $ 666,521 $ 491,650 $ 801,321 $ 795,362 Depreciation and amortization 337,104 287,230 274,088 271,824 226,384 Impairment of property, plant and equipment — — 3,504 5,156 790 Acquisitions of property, plant and equipment (354,762) (348,120) (348,666) (339,872) (340,960) Purchase of acquired business, net of cash acquired (4,216) (384,694) — (658,520) — Payment of cash dividends — — — — (714,785) Cash flows from financing activities (136,708) (34,526) (384,246) 466,395 (828,219)
Other Data:EBITDA(d) $ 617,742 $ 1,023,128 $ 755,316 $ 1,353,343 $ 1,023,755 Adjusted EBITDA(d) 788,073 973,771 798,187 1,388,029 1,029,682
Key Indicators (as a percent of net sales):Gross profit 6.9 % 9.4 % 7.7 % 13.7 % 11.2 %Selling, general and administrative expenses 4.9 % 3.3 % 3.1 % 3.6 % 3.1 %Operating income 2.0 % 6.1 % 4.5 % 10.0 % 8.0 %Interest expense, net 1.0 % 1.0 % 1.4 % 0.9 % 0.7 %Net income 0.8 % 4.0 % 2.3 % 6.5 % 4.5 %
(a) Interest expense, net, consists of interest expense less interest income. (b) Adjusted net income attributable to Pilgrim’s Pride Corporation is calculated by adding to net income attributable to Pilgrim’s certain items of
expense and deducting from net income attributable to Pilgrim’s certain items of income, as shown in the reconciliation table below. Adjusted net income attributable to Pilgrim’s Pride Corporation per common diluted share is presented because it is used by us, and we believe it is frequently used by securities analysts, investors and other interested parties, in addition to and not in lieu of results prepared in conformity with U.S. GAAP, to compare the performance of companies. We also believe that this non-U.S. GAAP financial measure, in combination with our financial results calculated in accordance with U.S. GAAP, provides investors with additional perspective regarding the impact of such charges on net income attributable to Pilgrim’s Pride Corporation per common diluted share. Adjusted net income attributable to Pilgrim’s Pride Corporation per common diluted share is not a measurement of financial performance under U.S. GAAP, has limitations as an analytical tool and should not be considered in isolation or as a substitute for an analysis of our results as reported under U.S. GAAP. Management believes that presentation of adjusted net income attributable to Pilgrim’s provides useful supplemental information about our operating performance and enables comparison of our performance between periods because certain costs shown below are not indicative of our current operating performance.
A reconciliation of net income attributable to Pilgrim’s Pride Corporation per common diluted share to adjusted net income attributable to Pilgrim’s Pride Corporation per common diluted share is as follows:
21

2020 2019 2018 2017 2016(In thousands except per share data)
Net income attributable to Pilgrim’s Pride Corporation $ 94,757 $ 455,924 $ 247,945 $ 694,579 $ 440,532 Adjustments, net of tax:
Loss on early extinguishment of debt — — 16,758 166 — Other nonrecurring losses — — 19,486 8,066 — Foreign currency transaction losses (gains) 760 6,917 17,160 (2,659) 4,055 Restructuring activities and transaction costs related to acquisitions 257 1,218 5,085 29,381 1,069
DOJ agreement 110,524 — — — — Nonrecurring legal settlement 75,000 — — — — Hometown Strong commitment 15,000 — — — — Gain on bargain purchase 3,746 (56,880) — — — Shareholder litigation settlement (34,643) Net tax expense of adjustments (14,976) (2,122) (15,039) (9,402) (1,773)
250,425 405,057 291,395 720,131 443,883 U.S. Tax Cuts & Jobs Act transition tax — — 26,400 — — Adjusted net income attributable to Pilgrim’s Pride Corporation 250,425 405,057 317,795 720,131 443,883 Weighted average diluted shares of common stock outstanding 246,124 249,709 249,149 248,971 254,126 Adjusted net income attributable to Pilgrim’s Pride Corporation per common diluted share $ 1.02 $ 1.62 $ 1.28 $ 2.89 $ 1.75
(c) Includes the material impact of new business acquisitions as follows:• Fiscal 2019 includes approximately two and one-half months of operating results from the acquisition of PPL, acquired for cash of
$391.5 million on October 15, 2019. • Fiscal 2017 includes approximately three and one-half months of operating results from the acquisition of Moy Park, acquired for cash of
$301.3 million and a note payable to the seller in the amount of £562.5 million on September 8, 2017. Fiscal 2018 and thereafter includes a full year of operating results.
• Fiscal 2017 includes approximately eleven and one-half months of operating results from the acquisition of GNP, acquired for a cash purchase price of $350 million on January 6, 2017. Fiscal 2018 and thereafter includes a full year of operating results.
(d) “EBITDA” is defined as the sum of net income (loss) plus interest, taxes, depreciation and amortization. “Adjusted EBITDA” is calculated by adding to EBITDA certain items of expense and deducting from EBITDA certain items of income that we believe are not indicative of our ongoing operating performance consisting of: (1) foreign currency transaction losses (gains), (2) transaction costs from business acquisitions, (3) DOJ agreement, (4) nonrecurring legal settlement, (5) restructuring activities, (6) Hometown Strong initiative expenses, (7) gain on bargain purchase, (8) shareholder litigation settlement, (9) net income (loss) attributable to noncontrolling interests and (10) other nonrecurring losses. EBITDA is presented because it is used by us and we believe it is frequently used by securities analysts, investors and other interested parties, in addition to and not in lieu of results prepared in conformity with U.S. GAAP, to compare the performance of companies. We believe investors would be interested in our Adjusted EBITDA because this is how our management analyzes EBITDA applicable to continuing operations. We also believe that Adjusted EBITDA, in combination with our financial results calculated in accordance with U.S. GAAP, provides investors with additional perspective regarding the impact of certain significant items on EBITDA and facilitates a more direct comparison of its performance with its competitors. EBITDA and Adjusted EBITDA are not measurements of financial performance under U.S. GAAP. EBITDA and Adjusted EBITDA have limitations as analytical tools and should not be considered in isolation or as substitutes for an analysis of our results as reported under U.S. GAAP. Some of the limitations of these measures are:• They do not reflect our cash expenditures, future requirements for capital expenditures or contractual commitments;• They do not reflect changes in, or cash requirements for, our working capital needs;• They do not reflect the significant interest expense or the cash requirements necessary to service interest or principal payments on our debt;• Although depreciation and amortization are non-cash charges, the assets being depreciated and amortized will often have to be replaced in the
future, and EBITDA and Adjusted EBITDA do not reflect any cash requirements for such replacements;• They are not adjusted for all non-cash income or expense items that are reflected in our statements of cash flows;• EBITDA does not reflect the impact of earnings or charges attributable to noncontrolling interests;• They do not reflect the impact of earnings or charges resulting from matters we consider to not be indicative of our ongoing operations; and• They do not reflect limitations on or costs related to transferring earnings from our subsidiaries to us.In addition, other companies in our industry may calculate these measures differently than we do, limiting their usefulness as a comparative measure. Because of these limitations, EBITDA and Adjusted EBITDA should not be considered as an alternative to net income as indicators of our operating performance or any other measures of performance derived in accordance with U.S. GAAP. You should compensate for these limitations by relying primarily on our U.S. GAAP results and using EBITDA and Adjusted EBITDA only on a supplemental basis.
22

A reconciliation of net income to EBITDA and Adjusted EBITDA is as follows:
2020 2019 2018 2017 2016 (In thousands)
Net income $ 95,070 $ 456,536 $ 246,804 $ 718,167 $ 480,117 Add:
Interest expense, net(a) 118,813 118,353 149,001 99,453 73,335 Income tax expense 66,755 161,009 85,423 263,899 243,919 Depreciation and amortization 337,104 287,230 274,088 271,824 226,384
EBITDA 617,742 1,023,128 755,316 1,353,343 1,023,755 Add:
Other nonrecurring losses(b) — — 19,485 8,066 — Foreign currency transaction loss (gain)(c) 760 6,917 17,160 (2,659) 4,055 Transaction costs related to acquisitions(d) 134 1,302 320 19,606 — DOJ agreement(e) 110,524 — — — — Nonrecurring legal settlement(f) 75,000 — — — — Restructuring activities loss (gain)(g) 123 (84) 4,765 9,775 1,069 Hometown Strong commitment(h) 15,000 — — — —
Minus:
Gain on bargain purchase(i) (3,746) 56,880 — — — Shareholder litigation settlement(j) 34,643 — — — — Net income (loss) attributable to noncontrolling interest 313 612 (1,141) 102 (803)
Adjusted EBITDA $ 788,073 $ 973,771 $ 798,187 $ 1,388,029 $ 1,029,682
(a) Interest expense, net, consists of interest expense less interest income. (b) Other nonrecurring losses include expenses incurred for Hurricane Maria in Puerto Rico, Hurricane Michael in Florida and certain Moy Park
severance charges.(c) The Company measures the financial statements of its Mexico reportable segment as if the U.S. dollar were the functional currency. Accordingly,
we remeasure assets and liabilities, other than nonmonetary assets, of the Mexico reportable segment at current exchange rates. We remeasure nonmonetary assets using the historical exchange rate in effect on the date of each asset’s acquisition. Currency exchange gains or losses resulting from these remeasurements, as well as, from our U.K. and Europe reportable segment are included in the line item Foreign currency transaction losses (gains) in the Consolidated Statements of Income.
(d) Transaction costs related to acquisitions includes those charges that are incurred in conjunction with business acquisitions. See Part II, Item 8, Notes to Consolidated Financial Statements, “Note 2. Business Acquisitions” for more information regarding recent business acquisitions.
(e) On October 13, 2020, Pilgrims announced that we have entered into a plea agreement (the “Plea Agreement”) with the DOJ. As a result of the Plea Agreement, we recognized a fine of $110,524,140.
(f) On January 11, 2021, we announced that we have entered an agreement to settle all claims made by the putative Direct Purchaser Plaintiff Class relating to broiler chicken antitrust litigation. As a result of the settlement, we recognized an expense of $75.0 million.
(g) Restructuring charges includes tangible asset impairment, severance, change-in-control compensation costs and losses incurred on both the sale of unneeded broiler eggs and flock depletion.
(h) The Hometown Strong initiative was developed to help communities in which we operate respond to unexpected challenges. For the year ended December 27, 2020, we recorded $15.0 million in incremental donations expense relating to this initiative.
(i) The gain on bargain purchase was recognized as a result of the PPL acquisition in October 2019. See Part II, Item 8, Notes to Consolidated Financial Statements, “Note 2. Business Acquisitions” for more information regarding this acquisition.
(j) Shareholder litigation settlement is income received as a result of a settlement in the first quarter of 2020. See Part II, Item 8, Notes to Consolidated Financial Statements, “Note 20. Commitments and Contingencies” for more information regarding this settlement.
23

Item 7. Management’s Discussion and Analysis of Financial Condition and Results of Operations
Executive Summary
Overview
We are one of the largest chicken producers in the world, and as a vertically integrated company, we are able to control every phase of the production process, which helps us manage food safety and quality, control margins and improve customer service. This gives us the opportunity to continue to create growth and development opportunities, further increasing our position as a leading domestic and global protein company. With the acquisition of Pilgrim’s Pride Ltd. (“PPL”) and Moy Park in 2019 and 2017, respectively, we solidified ourselves as a leading European food company while diversifying our product mix with introduction into the pork market. With the acquisition of GNP in 2017, we further solidified ourselves as a leading poultry company within the U.S. See “Note 2. Business Acquisitions” of our Consolidated Financial Statements included in this annual report for additional information relating to these acquisitions.
We reported net income attributable to Pilgrim’s Pride Corporation of $94.8 million, or $0.39 per diluted common share, and profit before tax totaling $161.8 million, for 2020. These operating results included gross profit of $838.2 million and generated $724.2 million of cash from operations. We generated operating margins of 2.0% with operating margins of 0.9%, 3.1% and 5.5% in our U.S., U.K. and Europe, and Mexico reportable segments, respectively. During 2020, we generated EBITDA and Adjusted EBITDA of $617.7 million and $788.1 million, respectively. A reconciliation of net income to EBITDA and Adjusted EBITDA is included in “Item 6. Selected Financial Data” in this annual report.
As discussed in “Note 20. Commitments and Contingencies”, on October 13, 2020, we announced that we have entered into the Plea Agreement with the DOJ. As a result of the Plea Agreement, we recognized a fine of $110,524,140 as expense during the third quarter of fiscal 2020. On January 11, 2021, we announced that we have entered an agreement to settle all claims made by the putative Direct Purchaser Plaintiff Class in the In re Broiler Chicken Antitrust Litigation. As a result of the settlement, we recognized a fine of $75.0 million as expense during the fourth quarter of fiscal 2020. The Plea Agreement and Direct Purchaser Plaintiff Class settlement are included in Selling, general and administrative expense in the Consolidated Statements of Income for the year ended December 27, 2020. In addition, as discussed below under “Hometown Strong Initiative”, we launched an initiative during 2020 to support the communities in which we operate with unexpected challenges, such as the novel coronavirus (“COVID-19”) pandemic, and as a result, we recorded $15.0 million in incremental donation expense related to this initiative during the third quarter of fiscal 2020. Adjusted net income for the year ended December 27, 2020, which excludes the DOJ antitrust fine, the Direct Purchaser Plaintiff Class settlement, increase in donation expense and other items shown in the “Reconciliation of Adjusted Net Income”, was $250.4 million. See “Item 6. Selected Financial Data” section for a reconciliation of Net income attributable to Pilgrim's to Adjusted net income attributable to Pilgrim's.
We operate on the basis of a 52/53-week fiscal year that ends on the Sunday falling on or before December 31. Any reference we make to a particular year applies to our fiscal year and not the calendar year. Fiscal 2019 and 2018 were 52-week accounting cycles.
Impact of COVID-19
The extensive impact of the pandemic caused by COVID-19 has resulted and will likely continue to result in significant disruptions to the global economy, as well as businesses and capital markets around the world. In an effort to halt the outbreak of COVID-19, a number of countries, states, counties and other jurisdictions have imposed various measures, including but not limited to, voluntary and mandatory quarantines, stay-at-home orders, travel restrictions, limitations on gatherings of people, reduced operations and extended closures of businesses. On April 28, 2020, an executive order designated meat and poultry processing plants as critical infrastructure.
As the global spread of the virus began to accelerate late in March of 2020, we began to experience adverse impacts to our business and financial results. The impact of the COVID-19 pandemic included disruptions in supply chain, an increase in both broiler and chick costs and an increase in payroll and benefits costs. During the second quarter of 2020, the impact of the COVID-19 pandemic on our financial results generally decreased because of increased demand for our products at retail grocery stores and quick service restaurants and our ability to meet this demand through our transitioned business operations, as further discussed below. We believe that we will continue to experience disruptions and other changes to our business due to the COVID-19 pandemic into 2021.
The impact of COVID-19 and measures to prevent its spread have affected and continue to affect our business in a number of ways.
24

• Our workforce. Employee health and safety is our priority. As an essential business in a critical infrastructure industry, we continue to produce chicken and pork products, while coordinating with and implementing guidance from the U.S. Centers for Disease Control and Prevention, the National Institute of Occupational Safety and Health, and local and regional Departments of Health in an effort to keep our employees safe and healthy. Measures we have implemented include, but are not limited to: increasing physical distancing of our employees, where possible, by staggering start and shift breaks, placing on-site tents to create more space for employees at break and at meal times, and installing physical barriers to distance employees while working on production lines; adding temperature and symptom screening stations for employees prior to entering our facilities; increasing personal hygiene practices and providing our employees additional personal protective equipment and sanitation stations; and increasing sanitation of our facilities. In the U.S., we provided appreciation bonuses to eligible employees in April and May of 2020 and expanded certain sick leave policies to provide more flexibility. In addition, we implemented global travel restrictions and work-from-home policies for employees who have the ability to work remotely.
• Our operations. All of our 60 production facilities are operating, although some facilities have reduced production levels and outputs due to increased health and safety measures, employee absenteeism and as a consequence of the decline in demand by restaurants and other foodservice businesses. To date, we have not experienced a material impact from a plant closure and our facilities have largely been exempt from government closure orders.
• Demand for our products. COVID-19 and the implementation of restricted living have led to a shift in demand from restaurants to retail grocery stores, with consumers eating more at home due to stay-at-home orders. In our U.S. and Mexico businesses, demand for parts and whole-birds (typically bound for restaurants) and prepared foods (distributed, in part, to schools) has declined, while our U.K. and Europe business, which is more retail focused, has generally seen less of an impact. In an effort to counter the adverse effects of COVID-19, we have transitioned, where commercially reasonable and possible to do so, our business operations to be in the best position to supply COVID-19 market demands. These efforts have included transferring live supply to case ready, shifting production form and mix from foodservice to retail, increasing capacity utilization of retail packaging equipment, and analyzing export positions.
• Liquidity. Our liquidity position is strong and we have taken additional measures to increase liquidity to prepare for the challenging environment ahead. On March 20, 2020 and March 25, 2020, we elected to borrow $200.0 million and $150.0 million, respectively, under the U.S. Credit Facility as a precautionary measure in order to increase our cash position and preserve financial flexibility in light of current uncertainty in the global markets resulting from the COVID-19 outbreak. The draw-down proceeds borrowed on March 20, 2020 and March 25, 2020 were repaid during the fourth quarter of 2020.
• Foreign currency exchange rates and commodity prices. During the year ended December 27, 2020, we experienced increased volatility in foreign currency exchange rates and commodity prices, in part related to the uncertainty from COVID-19, as well as actions taken by governments and central banks in response to COVID-19.
• CARES Act. On March 27, 2020, the U.S. government enacted the CARES Act, which includes modifications to the limitation on business interest expense and net operating loss provisions, and provides a payment delay of employer payroll taxes during 2020 after the date of enactment. We estimate the payment of approximately $51 million of employer payroll taxes otherwise due in 2020 will be delayed with 50% due by December 31, 2021 and the remaining 50% by December 31, 2022.
Raw Materials
Our profitability is materially affected by the commodity prices of feed ingredients and chicken. Our U.S. and Mexico reportable segments use corn and soybean meal as the main ingredients for feed production, while our U.K. and Europe reportable segment uses wheat, soybean meal and barley as the main ingredients for feed production.
During fiscal 2020, chicken prices in the market were volatile, beginning the fiscal year on the low end and then subsequently stabilizing and improving by the end of the fiscal year. In particular, during the first quarter of 2020, market prices for chicken trended near the bottom of the historical range while sustaining prices sufficiently higher than the cost of feed and ingredients to provide positive margins. During this time, the industry experienced increased production compared to the first quarter of 2019. The spread of COVID-19 and subsequent market reactions late into the first quarter of 2020 resulted in an unexpected shift in demand from foodservice to retail markets, triggering a shift in supply and demand, causing volatility in market prices. The industry adjusted through reductions of egg sets and chick placements, which continued to trend throughout the year ended December 27, 2020, resulting in reduced broiler production in the last half of 2020. Reduced broiler production coincided with robust retail demand, quickly recovering foodservice throughout the second half of 2020, which had
25

significantly improved over the low point during the second quarter of 2020. As a result, chicken market prices stabilized moving into the third quarter, and even improved in the fourth quarter compared to the previous year.
While chicken prices have improved in the second half of 2020, prices in 2021 will depend on the recovery of the foodservice industry, influenced by factors such as the COVID-19 pandemic, government regulation, uncertainty surrounding the general economy and protein supply.
Hometown Strong Initiative
The Hometown Strong initiative was developed in order to help the communities in which we operate respond to the unexpected challenges on society, such as the COVID-19 pandemic. We believe the Hometown Strong initiative will provide consequential investment projects for a lasting impact on these communities and help them prepare for unanticipated challenges and build for the future. For 2020, we committed to Hometown Strong donations of $20.0 million and during the year ended December 27, 2020, we recorded $15.0 million in incremental donations expense relating to this initiative.
Potential Impact of Tariffs
We continue to monitor recent trade and tariff activity and its potential impact to exports and inputs costs across our reportable segments. Currently, we are experiencing impacts to domestic and export prices of chicken resulting from uncertainty in trade policies and increased tariffs. With the implementation of the EU-U.K Trade and Cooperation Agreement, there is uncertainty regarding the processing of imports and administration costs that will follow. This could lead to potential new tariffs and regulations from both the European Union and the U.K. We are unable to give any assurance as to the scope, duration, or impact of any changes in trade policies or tariffs, how successful any mitigation efforts will be, or the extent to which mitigation will be necessary, and accordingly, changes in trade policies and increased tariffs could have a material adverse effect on our business and results of operations.
Reportable Segments
We operate in three reportable segments: the U.S., the U.K. and Europe, and Mexico. We measure segment profit as operating income. Corporate expenses are allocated to Mexico and U.K. and Europe reportable segments based upon various apportionment methods for specific expenditures incurred related thereto with the remaining amounts allocated to the U.S. For additional information, see “Note 19. Reportable Segments” of our Consolidated Financial Statements included in this annual report.
Results of Operations
2020 Compared to 2019
Net sales. Net sales for 2020 increased $682.7 million, or 6.0%, from $11.4 billion generated in 2019 to $12.1 billion generated in 2020. The following table provides additional information regarding net sales:
Change from 2019Sources of net sales 2020 Amount Percent (In thousands, except percent data)
U.S. $ 7,496,017 $ (140,699) (1.8) %U.K. and Europe 3,274,292 890,499 37.4 %Mexico 1,321,592 (67,118) (4.8) %
Total net sales $ 12,091,901 $ 682,682 6.0 %
U.S. Reportable Segment. U.S. net sales generated in 2020 decreased $140.7 million, or 1.8%, from U.S. net sales generated in 2019 primarily because of a decrease in net sales per pound, contributing $188.2 million, or 2.4 percentage points, to the decrease in net sales. This decrease in net sales per pound was partially offset by $47.5 million, or 0.6 percentage points, due to an increase in sales volume.
U.K. and Europe Reportable Segment. U.K. and Europe sales generated in 2020 increased $890.5 million, or 37.4%, from U.K. and Europe sales generated in 2019, primarily because of the recently acquired PPL operations, partially offset by a decrease in net sales by our existing U.K. and Europe operations. The impact of the acquired business contributed $1.1 billion, or 44.3 percentage points, to the increase in net sales. The decrease in our existing U.K. and Europe operations was driven by a decrease in sales volume and a decrease in net sales per pound, contributing $159.6 million, or 6.7 percentage points, and $14.5 million, or 0.6 percentage points, respectively, to the decrease in net sales. These decreases in sales volume and net sales
26
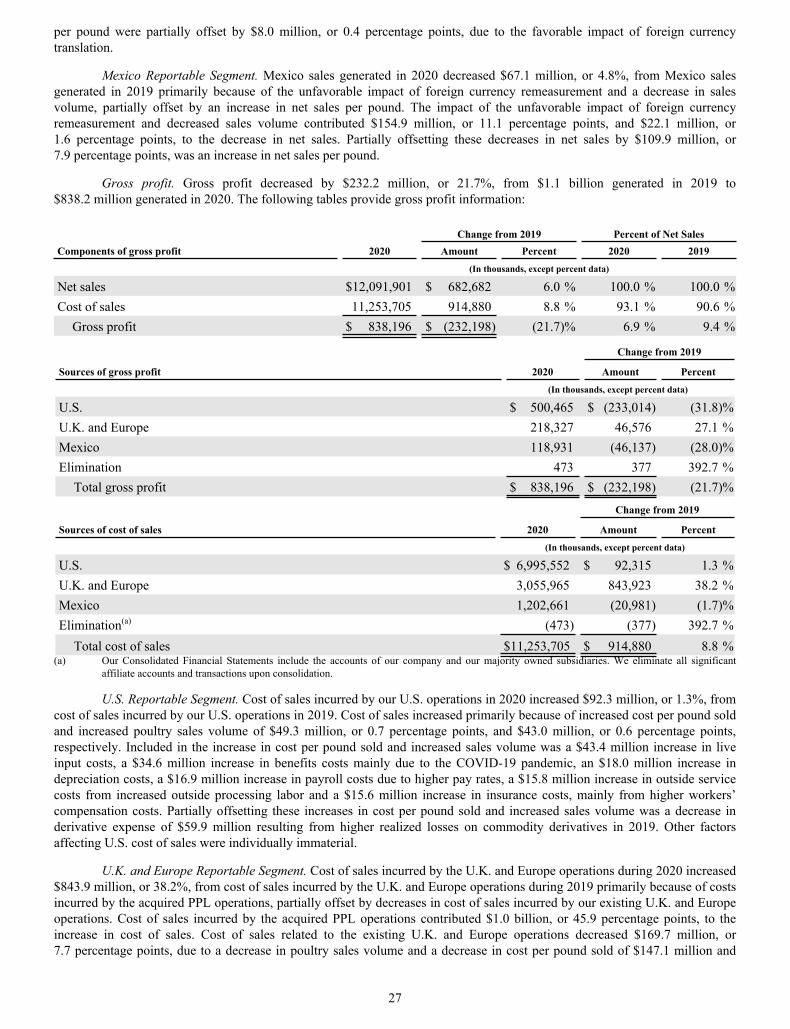
per pound were partially offset by $8.0 million, or 0.4 percentage points, due to the favorable impact of foreign currency translation.
Mexico Reportable Segment. Mexico sales generated in 2020 decreased $67.1 million, or 4.8%, from Mexico sales generated in 2019 primarily because of the unfavorable impact of foreign currency remeasurement and a decrease in sales volume, partially offset by an increase in net sales per pound. The impact of the unfavorable impact of foreign currency remeasurement and decreased sales volume contributed $154.9 million, or 11.1 percentage points, and $22.1 million, or 1.6 percentage points, to the decrease in net sales. Partially offsetting these decreases in net sales by $109.9 million, or 7.9 percentage points, was an increase in net sales per pound.
Gross profit. Gross profit decreased by $232.2 million, or 21.7%, from $1.1 billion generated in 2019 to $838.2 million generated in 2020. The following tables provide gross profit information:
Change from 2019 Percent of Net SalesComponents of gross profit 2020 Amount Percent 2020 2019 (In thousands, except percent data)
Net sales $ 12,091,901 $ 682,682 6.0 % 100.0 % 100.0 %Cost of sales 11,253,705 914,880 8.8 % 93.1 % 90.6 %
Gross profit $ 838,196 $ (232,198) (21.7) % 6.9 % 9.4 %
Sources of gross profit 2020
Change from 2019
Amount Percent (In thousands, except percent data)
U.S. $ 500,465 $ (233,014) (31.8) %U.K. and Europe 218,327 46,576 27.1 %Mexico 118,931 (46,137) (28.0) %Elimination 473 377 392.7 %
Total gross profit $ 838,196 $ (232,198) (21.7) %
Sources of cost of sales 2020
Change from 2019
Amount Percent (In thousands, except percent data)
U.S. $ 6,995,552 $ 92,315 1.3 %U.K. and Europe 3,055,965 843,923 38.2 %Mexico 1,202,661 (20,981) (1.7) %Elimination(a) (473) (377) 392.7 %
Total cost of sales $ 11,253,705 $ 914,880 8.8 %(a) Our Consolidated Financial Statements include the accounts of our company and our majority owned subsidiaries. We eliminate all significant
affiliate accounts and transactions upon consolidation.
U.S. Reportable Segment. Cost of sales incurred by our U.S. operations in 2020 increased $92.3 million, or 1.3%, from cost of sales incurred by our U.S. operations in 2019. Cost of sales increased primarily because of increased cost per pound sold and increased poultry sales volume of $49.3 million, or 0.7 percentage points, and $43.0 million, or 0.6 percentage points, respectively. Included in the increase in cost per pound sold and increased sales volume was a $43.4 million increase in live input costs, a $34.6 million increase in benefits costs mainly due to the COVID-19 pandemic, an $18.0 million increase in depreciation costs, a $16.9 million increase in payroll costs due to higher pay rates, a $15.8 million increase in outside service costs from increased outside processing labor and a $15.6 million increase in insurance costs, mainly from higher workers’ compensation costs. Partially offsetting these increases in cost per pound sold and increased sales volume was a decrease in derivative expense of $59.9 million resulting from higher realized losses on commodity derivatives in 2019. Other factors affecting U.S. cost of sales were individually immaterial.
U.K. and Europe Reportable Segment. Cost of sales incurred by the U.K. and Europe operations during 2020 increased $843.9 million, or 38.2%, from cost of sales incurred by the U.K. and Europe operations during 2019 primarily because of costs incurred by the acquired PPL operations, partially offset by decreases in cost of sales incurred by our existing U.K. and Europe operations. Cost of sales incurred by the acquired PPL operations contributed $1.0 billion, or 45.9 percentage points, to the increase in cost of sales. Cost of sales related to the existing U.K. and Europe operations decreased $169.7 million, or 7.7 percentage points, due to a decrease in poultry sales volume and a decrease in cost per pound sold of $147.1 million and
27
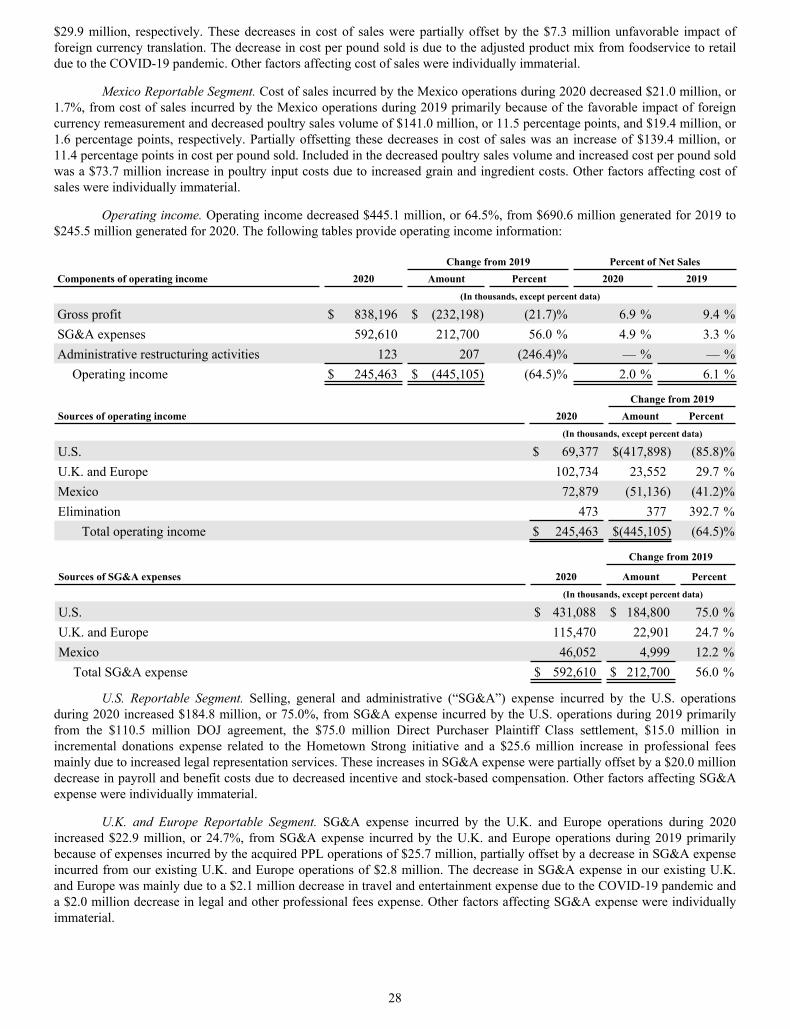
$29.9 million, respectively. These decreases in cost of sales were partially offset by the $7.3 million unfavorable impact of foreign currency translation. The decrease in cost per pound sold is due to the adjusted product mix from foodservice to retail due to the COVID-19 pandemic. Other factors affecting cost of sales were individually immaterial.
Mexico Reportable Segment. Cost of sales incurred by the Mexico operations during 2020 decreased $21.0 million, or 1.7%, from cost of sales incurred by the Mexico operations during 2019 primarily because of the favorable impact of foreign currency remeasurement and decreased poultry sales volume of $141.0 million, or 11.5 percentage points, and $19.4 million, or 1.6 percentage points, respectively. Partially offsetting these decreases in cost of sales was an increase of $139.4 million, or 11.4 percentage points in cost per pound sold. Included in the decreased poultry sales volume and increased cost per pound sold was a $73.7 million increase in poultry input costs due to increased grain and ingredient costs. Other factors affecting cost of sales were individually immaterial.
Operating income. Operating income decreased $445.1 million, or 64.5%, from $690.6 million generated for 2019 to $245.5 million generated for 2020. The following tables provide operating income information:
Change from 2019 Percent of Net SalesComponents of operating income 2020 Amount Percent 2020 2019 (In thousands, except percent data)
Gross profit $ 838,196 $ (232,198) (21.7) % 6.9 % 9.4 %SG&A expenses 592,610 212,700 56.0 % 4.9 % 3.3 %Administrative restructuring activities 123 207 (246.4) % — % — %
Operating income $ 245,463 $ (445,105) (64.5) % 2.0 % 6.1 %
Change from 2019Sources of operating income 2020 Amount Percent (In thousands, except percent data)
U.S. $ 69,377 $ (417,898) (85.8) %U.K. and Europe 102,734 23,552 29.7 %Mexico 72,879 (51,136) (41.2) %Elimination 473 377 392.7 %
Total operating income $ 245,463 $ (445,105) (64.5) %
Sources of SG&A expenses 2020
Change from 2019
Amount Percent (In thousands, except percent data)
U.S. $ 431,088 $ 184,800 75.0 %U.K. and Europe 115,470 22,901 24.7 %Mexico 46,052 4,999 12.2 %
Total SG&A expense $ 592,610 $ 212,700 56.0 %
U.S. Reportable Segment. Selling, general and administrative (“SG&A”) expense incurred by the U.S. operations during 2020 increased $184.8 million, or 75.0%, from SG&A expense incurred by the U.S. operations during 2019 primarily from the $110.5 million DOJ agreement, the $75.0 million Direct Purchaser Plaintiff Class settlement, $15.0 million in incremental donations expense related to the Hometown Strong initiative and a $25.6 million increase in professional fees mainly due to increased legal representation services. These increases in SG&A expense were partially offset by a $20.0 million decrease in payroll and benefit costs due to decreased incentive and stock-based compensation. Other factors affecting SG&A expense were individually immaterial.
U.K. and Europe Reportable Segment. SG&A expense incurred by the U.K. and Europe operations during 2020 increased $22.9 million, or 24.7%, from SG&A expense incurred by the U.K. and Europe operations during 2019 primarily because of expenses incurred by the acquired PPL operations of $25.7 million, partially offset by a decrease in SG&A expense incurred from our existing U.K. and Europe operations of $2.8 million. The decrease in SG&A expense in our existing U.K. and Europe was mainly due to a $2.1 million decrease in travel and entertainment expense due to the COVID-19 pandemic and a $2.0 million decrease in legal and other professional fees expense. Other factors affecting SG&A expense were individually immaterial.
28

Mexico Reportable Segment. SG&A expense incurred by the Mexico operations during 2020 increased $5.0 million, or 12.2%, from SG&A expense incurred by the Mexico operations during 2019 primarily because of a $2.4 million increase in employee relations expenses and a $1.5 million increase in professional fees expense. Other factors affecting SG&A expense were individually immaterial.
Interest expense. Consolidated interest expense decreased 4.9% to $126.1 million in 2020 from $132.6 million in 2019, primarily because of a decrease in weighted average interest rates to 4.7% in 2020 from 5.3% in 2019. As a percent of net sales, interest expense in 2020 and 2019 was 1.0% and 1.2%, respectively.
Income taxes. Our consolidated income tax expense in 2020 was $66.8 million, compared to income tax expense of $161.0 million in 2019. The decrease in income tax expense in 2020 resulted from a decrease in pre-tax income during 2020.
2019 Compared to 2018
Net sales. Net sales for 2019 increased $471.4 million, or 4.3%, from $10.9 billion generated in 2018 to $11.4 billion generated in 2019. The following table provides additional information regarding net sales:
Change from 2018Sources of net sales 2019 Amount Percent (In thousands, except percent data)
U.S. $ 7,636,716 $ 211,055 2.8 %U.K. and Europe 2,383,793 235,127 10.9 %Mexico 1,388,710 25,253 1.9 %
Total net sales $ 11,409,219 $ 471,435 4.3 %
U.S. Reportable Segment. U.S. net sales generated in 2019 increased $211.1 million, or 2.8%, from U.S. net sales generated in 2018 primarily because of an increase in sales volume and an increase in net sales per pound. The increase in sales volume contributed $139.6 million, or 1.8 percentage points, to the increase in net sales. The increase in net sales per pound contributed $71.5 million, or 1.0 percentage points, to the increase in net sales.
U.K. and Europe Reportable Segment. U.K. and Europe sales generated in 2019 increased $235.1 million, or 10.9%, from U.K. and Europe sales generated in 2018, primarily because of the recently acquired PPL operations, partially offset by a decrease in net sales by our existing U.K. and Europe operations. The impact of the acquired business contributed $306.7 million, or 14.2 percentage points, to the increase in net sales. The decrease in our existing U.K. and Europe operations was mainly due to the unfavorable impact of foreign currency translation of $94.4 million, or 4.4 percentage points. The unfavorable impact of foreign currency translation was partially offset by an increase in sales volume and net sales per pound of $15.3 million, or 0.7 percentage points, and $7.6 million, or 0.4 percentage points, respectively.
Mexico Reportable Segment. Mexico sales generated in 2019 increased $25.3 million, or 1.9%, from Mexico sales generated in 2018 primarily because of an increase in net sales per pound, partially offset by a decrease in sales volume and the unfavorable impact of foreign currency remeasurement. The increase in net sales per pound contributed $59.2 million, or 4.4 percentage points, to the increase in Mexico net sales. The decrease in sales volume and unfavorable impact of foreign currency remeasurement partially offset the increase in net sales per pound by $32.1 million, or 2.4 percentage points, and $1.8 million, or 0.1 percentage points, respectively.
Gross profit. Gross profit increased by $226.9 million, or 26.9%, from $843.5 million generated in 2018 to $1.1 billion generated in 2019. The following tables provide gross profit information:
Change from 2018 Percent of Net SalesComponents of gross profit 2019 Amount Percent 2019 2018 (In thousands, except percent data)
Net sales $ 11,409,219 $ 471,435 4.3 % 100.0 % 100.0 %Cost of sales 10,338,825 244,517 2.4 % 90.6 % 92.3 %
Gross profit $ 1,070,394 $ 226,918 26.9 % 9.4 % 7.7 %
29

Sources of gross profit 2019
Change from 2018
Amount Percent (In thousands, except percent data)
U.S. $ 733,479 $ 217,597 42.2 %U.K. and Europe 171,751 923 0.5 %Mexico 165,068 8,434 5.4 %Elimination 96 (36) (27.3) %
Total gross profit $ 1,070,394 $ 226,918 26.9 %
Sources of cost of sales 2019
Change from 2018
Amount Percent (In thousands, except percent data)
U.S. $ 6,903,237 $ (6,542) (0.1) %U.K. and Europe 2,212,042 234,204 11.8 %Mexico 1,223,642 16,819 1.4 %Elimination(a) (96) 36 (27.3) %
Total cost of sales $ 10,338,825 $ 244,517 2.4 %(a) Our Consolidated Financial Statements include the accounts of our company and our majority owned subsidiaries. We eliminate all significant
affiliate accounts and transactions upon consolidation.
U.S. Reportable Segment. Cost of sales incurred by our U.S. operations in 2019 decreased $6.5 million, or 0.1%, from cost of sales incurred by our U.S. operations in 2018. Cost of sales primarily decreased because of reduced cost per pound sold, partially offset by increased poultry sales volume. The decrease in cost per pound sold contributed $92.6 million to the decrease in cost of sales. This decrease is partially offset by an increase in poultry sales volume of $86.0 million. Included in the decrease in cost per pound sold and increased sales volume was an $81.2 million increase in hourly labor due to an increase in required labor for reduced use of third-party poultry processors and a $15.1 million increase in contracted processing labor. Partially offsetting these increases in cost of sales was a $16.0 million decrease in freight cost due to decreased contract rates, $14.9 million in costs in 2018 relating to Hurricane Michael and Hurricane Maria, a $14.8 million decrease in commodity and currency derivative losses, an $11.3 million decrease in feed costs, a $9.2 million decrease in cost relating to third-party poultry processors and a $5.7 million decrease in property taxes. Other factors affecting U.S. cost of sales were individually immaterial.
U.K. and Europe Reportable Segment. Cost of sales incurred by the U.K. and Europe operations during 2019 increased $234.2 million, or 11.8%, from cost of sales incurred by the U.K. and Europe operations during 2018 primarily because of costs incurred by the acquired PPL operations, partially offset by decreases in cost of sales incurred by our existing U.K. and Europe operations. Cost of sales incurred by the acquired PPL operations contributed $297.5 million to the increase in cost of sales. Cost of sales related to the existing U.K. and Europe operations decreased due to the favorable impact of foreign currency translation of $87.1 million, partially offset by an increase in poultry sales volume of $14.1 million and an increase in cost per pound sold of $9.6 million. Included in the increase in sales volume and cost per pound was a $22.8 million increase in payroll cost due to national minimum wage increases, a $7.8 million increase in maintenance costs due to additional equipment and production lines and a $4.4 million increase in utilities as a result of increased rates. Partially offsetting these increases in cost of sales was a $12.7 million decrease in live costs mainly due to increased efficiencies. Other factors affecting cost of sales were individually immaterial.
Mexico Reportable Segment. Cost of sales incurred by the Mexico operations during 2019 increased $16.8 million, or 1.4%, from cost of sales incurred by the Mexico operations during 2018 primarily because of increased cost per pound sold. The increase in cost per pound sold was partially offset by a decrease in sales volume and the favorable impact of foreign currency remeasurement. The increase in cost per pound sold contributed $46.8 million to the increase in cost of sales. Partially offsetting this increase in cost of sales was the decrease in sales volume of $28.4 million and favorable impact of foreign currency remeasurement of $1.6 million. Included in the increase in cost per pound sold and sales volume decrease was a $16.1 million increase in grower pay due to increased live operations and a $5.7 million increase in freight costs. Partially offsetting these increases in cost of sales was a $6.6 million increase in gains on sale of assets during 2019. Other factors affecting cost of sales were individually immaterial.
Operating income. Operating income increased $194.9 million, or 39.3%, from $495.7 million generated for 2018 to $690.6 million generated for 2019. The following tables provide operating income information:
30
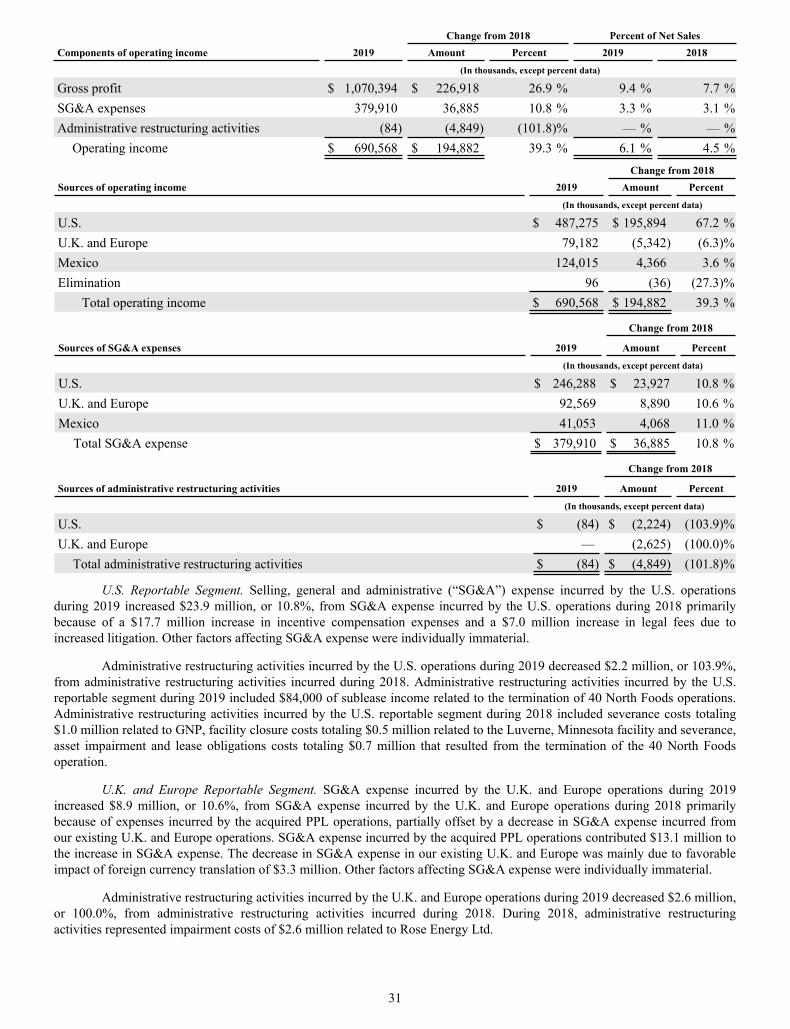
Change from 2018 Percent of Net SalesComponents of operating income 2019 Amount Percent 2019 2018 (In thousands, except percent data)
Gross profit $ 1,070,394 $ 226,918 26.9 % 9.4 % 7.7 %SG&A expenses 379,910 36,885 10.8 % 3.3 % 3.1 %Administrative restructuring activities (84) (4,849) (101.8) % — % — %
Operating income $ 690,568 $ 194,882 39.3 % 6.1 % 4.5 % Change from 2018Sources of operating income 2019 Amount Percent (In thousands, except percent data)
U.S. $ 487,275 $ 195,894 67.2 %U.K. and Europe 79,182 (5,342) (6.3) %Mexico 124,015 4,366 3.6 %Elimination 96 (36) (27.3) %
Total operating income $ 690,568 $ 194,882 39.3 %
Sources of SG&A expenses 2019
Change from 2018
Amount Percent (In thousands, except percent data)
U.S. $ 246,288 $ 23,927 10.8 %U.K. and Europe 92,569 8,890 10.6 %Mexico 41,053 4,068 11.0 %
Total SG&A expense $ 379,910 $ 36,885 10.8 %
Sources of administrative restructuring activities 2019
Change from 2018
Amount Percent (In thousands, except percent data)
U.S. $ (84) $ (2,224) (103.9) %U.K. and Europe — (2,625) (100.0) %
Total administrative restructuring activities $ (84) $ (4,849) (101.8) %
U.S. Reportable Segment. Selling, general and administrative (“SG&A”) expense incurred by the U.S. operations during 2019 increased $23.9 million, or 10.8%, from SG&A expense incurred by the U.S. operations during 2018 primarily because of a $17.7 million increase in incentive compensation expenses and a $7.0 million increase in legal fees due to increased litigation. Other factors affecting SG&A expense were individually immaterial.
Administrative restructuring activities incurred by the U.S. operations during 2019 decreased $2.2 million, or 103.9%, from administrative restructuring activities incurred during 2018. Administrative restructuring activities incurred by the U.S. reportable segment during 2019 included $84,000 of sublease income related to the termination of 40 North Foods operations. Administrative restructuring activities incurred by the U.S. reportable segment during 2018 included severance costs totaling $1.0 million related to GNP, facility closure costs totaling $0.5 million related to the Luverne, Minnesota facility and severance, asset impairment and lease obligations costs totaling $0.7 million that resulted from the termination of the 40 North Foods operation.
U.K. and Europe Reportable Segment. SG&A expense incurred by the U.K. and Europe operations during 2019 increased $8.9 million, or 10.6%, from SG&A expense incurred by the U.K. and Europe operations during 2018 primarily because of expenses incurred by the acquired PPL operations, partially offset by a decrease in SG&A expense incurred from our existing U.K. and Europe operations. SG&A expense incurred by the acquired PPL operations contributed $13.1 million to the increase in SG&A expense. The decrease in SG&A expense in our existing U.K. and Europe was mainly due to favorable impact of foreign currency translation of $3.3 million. Other factors affecting SG&A expense were individually immaterial.
Administrative restructuring activities incurred by the U.K. and Europe operations during 2019 decreased $2.6 million, or 100.0%, from administrative restructuring activities incurred during 2018. During 2018, administrative restructuring activities represented impairment costs of $2.6 million related to Rose Energy Ltd.
31
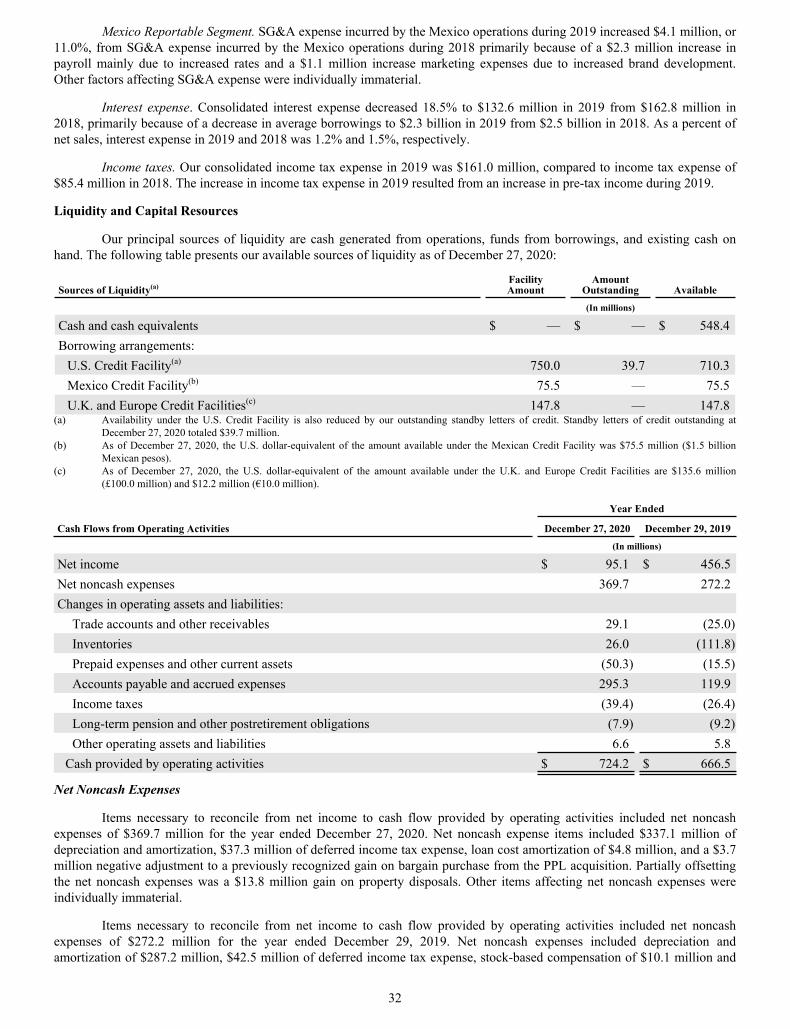
Mexico Reportable Segment. SG&A expense incurred by the Mexico operations during 2019 increased $4.1 million, or 11.0%, from SG&A expense incurred by the Mexico operations during 2018 primarily because of a $2.3 million increase in payroll mainly due to increased rates and a $1.1 million increase marketing expenses due to increased brand development. Other factors affecting SG&A expense were individually immaterial.
Interest expense. Consolidated interest expense decreased 18.5% to $132.6 million in 2019 from $162.8 million in 2018, primarily because of a decrease in average borrowings to $2.3 billion in 2019 from $2.5 billion in 2018. As a percent of net sales, interest expense in 2019 and 2018 was 1.2% and 1.5%, respectively.
Income taxes. Our consolidated income tax expense in 2019 was $161.0 million, compared to income tax expense of $85.4 million in 2018. The increase in income tax expense in 2019 resulted from an increase in pre-tax income during 2019.
Liquidity and Capital Resources
Our principal sources of liquidity are cash generated from operations, funds from borrowings, and existing cash on hand. The following table presents our available sources of liquidity as of December 27, 2020:
Sources of Liquidity(a)FacilityAmount
AmountOutstanding Available
(In millions)
Cash and cash equivalents $ — $ — $ 548.4 Borrowing arrangements:
U.S. Credit Facility(a) 750.0 39.7 710.3 Mexico Credit Facility(b) 75.5 — 75.5 U.K. and Europe Credit Facilities(c) 147.8 — 147.8
(a) Availability under the U.S. Credit Facility is also reduced by our outstanding standby letters of credit. Standby letters of credit outstanding at December 27, 2020 totaled $39.7 million.
(b) As of December 27, 2020, the U.S. dollar-equivalent of the amount available under the Mexican Credit Facility was $75.5 million ($1.5 billion Mexican pesos).
(c) As of December 27, 2020, the U.S. dollar-equivalent of the amount available under the U.K. and Europe Credit Facilities are $135.6 million (£100.0 million) and $12.2 million (€10.0 million).
Year Ended
Cash Flows from Operating Activities December 27, 2020 December 29, 2019 (In millions)
Net income $ 95.1 $ 456.5 Net noncash expenses 369.7 272.2 Changes in operating assets and liabilities:
Trade accounts and other receivables 29.1 (25.0) Inventories 26.0 (111.8) Prepaid expenses and other current assets (50.3) (15.5) Accounts payable and accrued expenses 295.3 119.9 Income taxes (39.4) (26.4) Long-term pension and other postretirement obligations (7.9) (9.2) Other operating assets and liabilities 6.6 5.8
Cash provided by operating activities $ 724.2 $ 666.5
Net Noncash Expenses
Items necessary to reconcile from net income to cash flow provided by operating activities included net noncash expenses of $369.7 million for the year ended December 27, 2020. Net noncash expense items included $337.1 million of depreciation and amortization, $37.3 million of deferred income tax expense, loan cost amortization of $4.8 million, and a $3.7 million negative adjustment to a previously recognized gain on bargain purchase from the PPL acquisition. Partially offsetting the net noncash expenses was a $13.8 million gain on property disposals. Other items affecting net noncash expenses were individually immaterial.
Items necessary to reconcile from net income to cash flow provided by operating activities included net noncash expenses of $272.2 million for the year ended December 29, 2019. Net noncash expenses included depreciation and amortization of $287.2 million, $42.5 million of deferred income tax expense, stock-based compensation of $10.1 million and
32
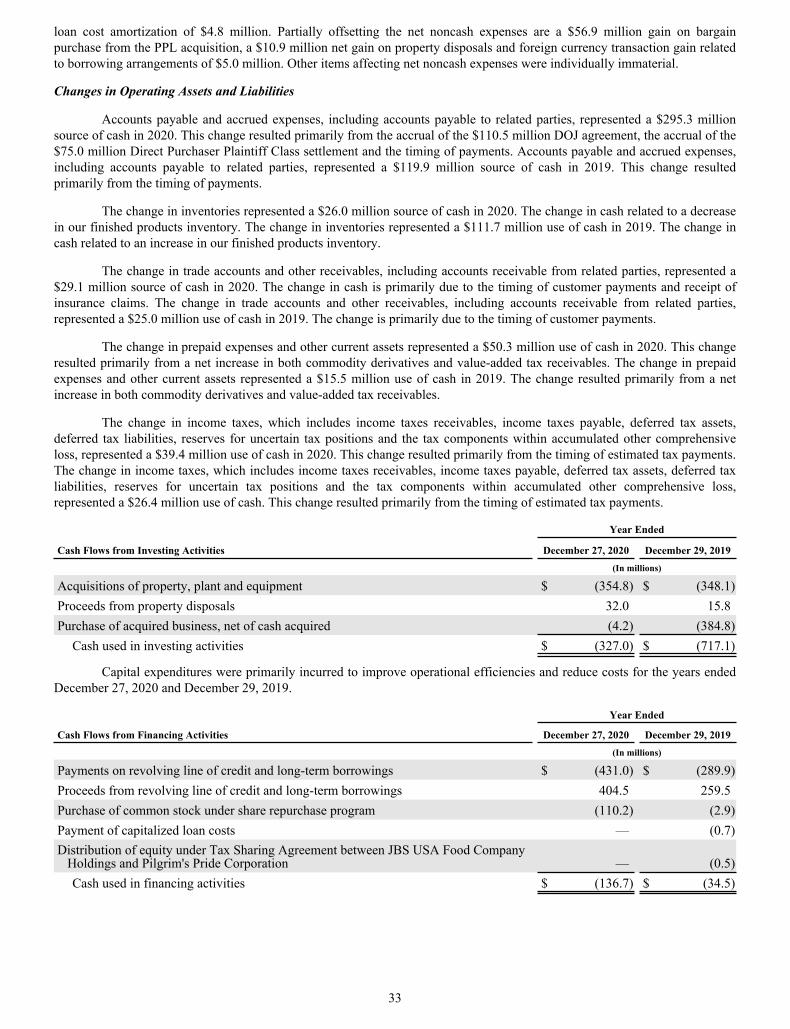
loan cost amortization of $4.8 million. Partially offsetting the net noncash expenses are a $56.9 million gain on bargain purchase from the PPL acquisition, a $10.9 million net gain on property disposals and foreign currency transaction gain related to borrowing arrangements of $5.0 million. Other items affecting net noncash expenses were individually immaterial.
Changes in Operating Assets and Liabilities
Accounts payable and accrued expenses, including accounts payable to related parties, represented a $295.3 million source of cash in 2020. This change resulted primarily from the accrual of the $110.5 million DOJ agreement, the accrual of the $75.0 million Direct Purchaser Plaintiff Class settlement and the timing of payments. Accounts payable and accrued expenses, including accounts payable to related parties, represented a $119.9 million source of cash in 2019. This change resulted primarily from the timing of payments.
The change in inventories represented a $26.0 million source of cash in 2020. The change in cash related to a decrease in our finished products inventory. The change in inventories represented a $111.7 million use of cash in 2019. The change in cash related to an increase in our finished products inventory.
The change in trade accounts and other receivables, including accounts receivable from related parties, represented a $29.1 million source of cash in 2020. The change in cash is primarily due to the timing of customer payments and receipt of insurance claims. The change in trade accounts and other receivables, including accounts receivable from related parties, represented a $25.0 million use of cash in 2019. The change is primarily due to the timing of customer payments.
The change in prepaid expenses and other current assets represented a $50.3 million use of cash in 2020. This change resulted primarily from a net increase in both commodity derivatives and value-added tax receivables. The change in prepaid expenses and other current assets represented a $15.5 million use of cash in 2019. The change resulted primarily from a net increase in both commodity derivatives and value-added tax receivables.
The change in income taxes, which includes income taxes receivables, income taxes payable, deferred tax assets, deferred tax liabilities, reserves for uncertain tax positions and the tax components within accumulated other comprehensive loss, represented a $39.4 million use of cash in 2020. This change resulted primarily from the timing of estimated tax payments. The change in income taxes, which includes income taxes receivables, income taxes payable, deferred tax assets, deferred tax liabilities, reserves for uncertain tax positions and the tax components within accumulated other comprehensive loss, represented a $26.4 million use of cash. This change resulted primarily from the timing of estimated tax payments.
Year Ended
Cash Flows from Investing Activities December 27, 2020 December 29, 2019 (In millions)
Acquisitions of property, plant and equipment $ (354.8) $ (348.1) Proceeds from property disposals 32.0 15.8 Purchase of acquired business, net of cash acquired (4.2) (384.8)
Cash used in investing activities $ (327.0) $ (717.1)
Capital expenditures were primarily incurred to improve operational efficiencies and reduce costs for the years ended December 27, 2020 and December 29, 2019.
Year Ended
Cash Flows from Financing Activities December 27, 2020 December 29, 2019 (In millions)
Payments on revolving line of credit and long-term borrowings $ (431.0) $ (289.9) Proceeds from revolving line of credit and long-term borrowings 404.5 259.5 Purchase of common stock under share repurchase program (110.2) (2.9) Payment of capitalized loan costs — (0.7) Distribution of equity under Tax Sharing Agreement between JBS USA Food Company Holdings and Pilgrim's Pride Corporation — (0.5)
Cash used in financing activities $ (136.7) $ (34.5)
33

Proceeds from revolving line of credit and long-term borrowings and payments on revolving line of credit and long-term borrowings are mainly due to borrowings and payments on our U.S. Credit Facility and Mexico Credit Facility. Shares repurchased under the share repurchase program during the year ended December 27, 2020 totaled 6.3 million. For further information on the share repurchase program, refer to Part II, Item 8, Notes to Consolidated Financial Statements, “Note 14. Stockholders’ Equity.”
Long-Term Debt and Other Borrowing Arrangements
Our long-term debt and other borrowing arrangements consist of senior notes, revolving credit facilities and other term loan agreements. For a description, refer to Part II, Item 8, Notes to Consolidated Financial Statements, “Note 13. Debt.”
Collateral
Substantially all of our domestic inventories and domestic fixed assets are pledged as collateral to secure the obligations under the U.S. Credit Facility.
Capital Expenditures
We anticipate spending between $375 million and $400 million on the acquisition of property, plant and equipment in 2021. Capital expenditures will primarily be incurred to improve efficiencies and reduce costs. We expect to fund these capital expenditures with cash flow from operations and proceeds from the revolving lines of credit under our various debt facilities.
Contractual Obligations
In addition to our debt commitments at December 27, 2020, we had other commitments and contractual obligations that require us to make specified payments in the future. The following table summarizes the total amounts due as of December 27, 2020 under all debt agreements, commitments and other contractual obligations. The table indicates the years in which payments are due under the contractual obligations.
Payments Due By Period
Contractual Obligations(a) TotalLess than One Year
One toThree Years
Three to Five Years
Greater thanFive Years
(In thousands)
Long-term debt(b) $ 2,300,038 $ 25,035 $ 425,003 $ 1,000,000 $ 850,000 Interest(c) 623,566 113,620 223,946 186,125 99,875 Finance leases 1,829 494 988 347 — Operating leases 326,203 83,116 124,608 71,589 46,890 Derivative liabilities 7,599 7,599 — — — Purchase obligations(d) 450,558 450,356 202 — —
Total $ 3,709,793 $ 680,220 $ 774,747 $ 1,258,061 $ 996,765 (a) The total amount of unrecognized tax benefits at December 27, 2020 was $13.3 million. We did not include this amount in the contractual
obligations table above as reasonable estimates cannot be made at this time of the amounts or timing of future cash outflows.(b) Long-term debt is presented at face value and excludes $39.7 million in letters of credit outstanding related to normal business transactions. (c) Interest expense in the table above assumes the continuation of interest rates and outstanding borrowings as of December 27, 2020.(d) Includes agreements to purchase goods or services that are enforceable and legally binding on us and that specify all significant terms, including
fixed or minimum quantities to be purchased; fixed, minimum, or variable price provisions; and the approximate timing of the transaction.
We expect cash flows from operations, combined with availability under the U.S. Credit Facility, and U.K. and Europe Credit Facilities to provide sufficient liquidity to fund current obligations, projected working capital requirements, maturities of long-term debt and capital spending for at least the next twelve months.
Recent Accounting Pronouncements
Refer to Part II, Item 8, Notes to Consolidated Financial Statements, “Note 1. General.”
Critical Accounting Policies and Estimates
General. Our discussion and analysis of our financial condition and results of operations are based upon our financial statements, which have been prepared in accordance with U.S. GAAP. The preparation of these financial statements requires us to make estimates and judgments that affect the reported amounts of assets, liabilities, revenues and expenses. On an ongoing basis, we evaluate our estimates, including those related to revenue recognition, inventory, goodwill and other intangible assets, litigation and income taxes. We base our estimates on historical experience and on various other assumptions that are believed
34

to be reasonable under the circumstances, the results of which form the basis for making judgments about the carrying values of assets and liabilities that are not readily apparent from other sources. Actual results may differ from these estimates under different assumptions or conditions.
We believe the following critical accounting policies affect our more significant judgments and estimates used in the preparation of our financial statements.
Revenue Recognition. The vast majority of our revenue is derived from contracts which are based upon a customer ordering our products. While there may be master agreements, the contract is only established when the customer’s order is accepted by us. We account for a contract, which may be verbal or written, when it is approved and committed by both parties, the rights of the parties are identified along with payment terms, the contract has commercial substance and collectability is probable.
We evaluate the transaction for distinct performance obligations, which are the sale of our products to customers. Since our products are commodity market-priced, the sales price is representative of the observable, standalone selling price. Each performance obligation is recognized based upon a pattern of recognition that reflects the transfer of control to the customer at a point in time, which is upon destination (customer location or port of destination) and depicts the transfer of control and recognition of revenue. There are instances of customer pick-up at our facilities, in which case control transfers to the customer at that point and we recognize revenue. Our performance obligations are typically fulfilled within days to weeks of the acceptance of the order.
We make judgments regarding the nature, amount, timing and uncertainty of revenue and cash flows arising from revenue and cash flows with customers. Determination of a contract requires evaluation and judgment along with the estimation of the total contract value and if any of the contract value is constrained. Due to the nature of our business, there is minimal variable consideration, as the contract is established at the acceptance of the order from the customer. When applicable, variable consideration is estimated at contract inception and updated on a regular basis until the contract is completed. Allocating the transaction price to a specific performance obligation based upon the relative standalone selling prices includes estimating the standalone selling prices including discounts and variable consideration.
Inventory. Live chicken inventories are stated at the lower of cost or net realizable value and breeder hen inventories at the lower of cost, less accumulated amortization, or net realizable value. The costs associated with breeder hen inventories are accumulated up to the production stage and amortized over their productive lives using the unit-of-production method. Finished poultry products, feed, eggs and other inventories are stated at the lower of cost (average) or net realizable value. Inventory typically transfers from one stage of production to another at a standard cost, where it accumulates additional cost directly incurred with the production of inventory, including overhead. The standard cost at which each type of inventory transfers is set by management to reflect the actual costs incurred in the prior steps. We monitor and adjust standard costs throughout the year to ensure that standard costs reasonably reflect the actual average cost of the inventory produced.
We allocate meat costs between our various finished chicken products based on a by-product costing technique that reduces the cost of the whole bird by estimated yields and amounts to be recovered for certain by-product parts. This primarily includes leg quarters, wings, tenders and offal, which are carried in inventory at the estimated recovery amounts, with the remaining amount being reflected as our breast meat cost. Generally, we perform an evaluation of whether any lower of cost or market adjustments are required at the country level based on a number of factors, including: (1) pools of related inventory, (2) product continuation or discontinuation, (3) estimated market selling prices and (4) expected distribution channels. If actual market conditions or other factors are less favorable than those projected by management, additional inventory adjustments may be required.
We also record valuation adjustments, when necessary, for estimated obsolescence at or equal to the difference between the cost of inventory and the estimated market value based upon known conditions affecting inventory obsolescence, including significantly aged products, discontinued product lines, or damaged or obsolete products.
Goodwill and Other Intangibles, net. Goodwill represents the excess of the aggregate purchase price over the fair value of the net identifiable assets acquired in a business combination. Identified intangible assets represent trade names, customer relationships and non-compete agreements arising from acquisitions that are recorded at fair value as of the date acquired less accumulated amortization, if any. We use various market valuation techniques to determine the fair value of its identified intangible assets.
Goodwill and other intangible assets with indefinite lives are not amortized but are tested for impairment on an annual basis in the fourth quarter of each fiscal year or more frequently if impairment indicators arise. For goodwill, an impairment loss is recognized for any excess of the carrying amount of a reporting unit’s goodwill over the implied fair value of that goodwill. Management first reviews relevant qualitative factors to determine if an indication of impairment exists for a
35

reporting unit. If management determines there is an indication that the carrying amount of reporting unit goodwill might be impaired, a quantitative analysis is performed. Management performed a qualitative analysis noting no indications of goodwill impairment in any of its reporting units as of December 27, 2020. For indefinite-lived intangible assets, an impairment loss is recognized if the carrying amount of an indefinite-lived intangible asset exceeds the estimated fair value of that intangible asset. Management first reviews relevant qualitative factors to determine if an indication of impairment exists. If management determines there is an indication that the carrying amount of the intangible asset might be impaired, and quantitative analysis is performed. Management performed a qualitative analysis noting no indications of impairment for any of its indefinite-lived intangible assets as of December 27, 2020.
Identifiable intangible assets with definite lives, such as customer relationships, non-compete agreements and trade names that we expect to use for a limited amount of time, are amortized over their estimated useful lives on a straight-line basis. The useful lives range from three to 20 years for non-compete agreements and trade names and three to 16 years for customer relationships. Identified intangible assets with definite lives are tested for recoverability whenever events or changes in circumstances indicate that their carrying amount may not be recoverable. Management assessed if events or changes in circumstances indicated that the aggregate carrying amount of its identified intangible assets with definite lives might not be recoverable and determined that there were no impairment indicators during the year ended December 27, 2020 and year ended December 29, 2019.
Litigation and Contingent Liabilities. We are subject to lawsuits, investigations and other claims related to employment, environmental, product, and other matters. We are required to assess the likelihood of any adverse judgments or outcomes, as well as potential ranges of probable losses, to these matters. We estimate the amount of reserves required for these contingencies when losses are determined to be probable and after considerable analysis of each individual issue. We expense legal costs related to such loss contingencies as they are incurred. With respect to our environmental remediation obligations, the accrual for environmental remediation liabilities is measured on an undiscounted basis. These reserves may change in the future due to changes in our assumptions, the effectiveness of strategies, or other factors beyond our control.
Income Taxes. We follow provisions under ASC No. 740-10-30-27 in the Expenses-Income Taxes topic with regard to members of a group that file a consolidated tax return but issue separate financial statements. We file our U.S. federal tax return and certain state unitary returns with JBS USA Holdings. Our income tax expense is computed using the separate return method. The provision for income taxes has been determined using the asset and liability approach of accounting for income taxes. For the unitary states, we have an obligation to make tax payments to JBS USA Holdings for our share of the unitary taxable income, which is included in taxes payable in our Consolidated Balance Sheets. Under this approach, deferred income taxes reflect the net tax effect of temporary differences between the book and tax bases of recorded assets and liabilities, net operating losses and tax credit carry forwards. The amount of deferred tax on these temporary differences is determined using the tax rates expected to apply to the period when the asset is realized or the liability is settled, as applicable, based on the tax rates and laws in the respective tax jurisdiction enacted as of the balance sheet date. We recognize potential interest and penalties related to income tax positions as a part of the income tax provision.
Item 7A. Quantitative and Qualitative Disclosures about Market Risk
Market Risk-Sensitive Instruments and Positions
The risk inherent in our market risk-sensitive instruments and positions is primarily the potential loss arising from adverse changes in commodity prices, foreign currency exchange rates, interest rates and the credit quality of available-for-sale securities as discussed below. The sensitivity analyses presented do not consider the effects that such adverse changes may have on overall economic activity, nor do they consider additional actions our management may take to mitigate our exposure to such changes. Actual results may differ from those described below.
Commodity Prices
We purchase certain commodities, primarily corn, soybean meal, soybean oil, and wheat, for use as ingredients in the feed we either sell commercially or consume in our live operations. As a result, our earnings are affected by changes in the price and availability of such feed ingredients. We have from time to time attempted to minimize our exposure to the changing price and availability of such feed ingredients using various techniques, including, but not limited to, (1) executing purchase agreements with suppliers for future physical delivery of feed ingredients at established prices and (2) purchasing or selling derivative financial instruments such as futures and options.
For this sensitivity analysis, market risk is estimated as a hypothetical 10% increase in the weighted-average cost of our primary feed ingredients as of the periods presented. The impact of this fluctuation, if realized, could be mitigated by related commodity hedging activity. However, fluctuations greater than 10% could occur.
36

Year Ended December 27, 2020
AmountImpact of 10% Increase in Feed
Ingredient Prices(In thousands)
Feed purchases(a) $ 2,989,963 $ 298,996 Feed inventory(b) 132,937 13,294
(a) Based on our feed consumption, a 10% increase in the price of our feed purchases will increase cost of sales for the year ended December 27, 2020.(b) A 10% increase in ending feed ingredient prices will increase inventories as of December 27, 2020.
December 27, 2020
AmountImpact of 10% Increase to the Fair Value
of Commodity Derivative Assets(In thousands)
Commodity derivative assets(a) $ 19,446 $ 1,945 (a) We purchase commodity derivative financial instruments, specifically exchange-traded futures and options, in an attempt to mitigate price risk
related to our anticipated consumption of commodity inputs for the next 12 months. A 10% increase in corn, soybean meal, soybean oil and wheat prices would have resulted in an increase in the fair value of our net commodity derivative asset position, including margin cash, as of December 27, 2020.
Interest Rates
Fixed-rate debt. Market risk for fixed-rate debt is estimated as the potential decrease in fair value resulting from a hypothetical increase in interest rates of 10%. Using a discounted cash flow analysis, a hypothetical 10% increase in interest rates would have decreased the fair value of our fixed-rate debt by $47.7 million as of December 27, 2020.
Variable-rate debt. Our variable-rate debt instruments represent approximately 20.0% of our total debt as of December 27, 2020. Holding other variables constant, including levels of indebtedness, an increase in interest rates of 25 basis points would have increased our interest expense by an immaterial amount for the year ended December 27, 2020.
Foreign Currency
Mexico Subsidiaries
Our earnings are also affected by foreign exchange rate fluctuations related to the Mexican peso net monetary position of our Mexico subsidiaries. We manage this exposure primarily by attempting to minimize our Mexican peso net monetary position. We are also exposed to the effect of potential currency exchange rate fluctuations to the extent that amounts are repatriated from Mexico to the U.S. We currently anticipate that the future cash flows of our Mexico subsidiaries will be reinvested in our Mexico operations.
The Mexican peso exchange rate can directly and indirectly impact our financial condition and results of operations. For this sensitivity analysis, market risk is estimated as a hypothetical 10% change in the current exchange rate used to convert Mexican pesos to U.S. dollars as of December 27, 2020. However, fluctuations greater than 10% could occur. No assurance can be given as to how future movements in the Mexican peso could affect our future financial condition or results of operations.
Year Ended December 27, 2020Impact of 10% Deterioration in
Exchange Rate(a)Impact of 10% Appreciation in
Exchange Rate(b)
(In thousands, except for exchange rate data)
Foreign currency remeasurement gain (loss) $ (22,256) $ 27,201 Exchange rate of Mexican pesos to the U.S. dollar:
As reported 19.86 19.86 Hypothetical 10% change 21.85 17.87
(a) Based on the net monetary asset position of our Mexican subsidiaries, a 10% weakening in the exchange rate of Mexican pesos to U.S. dollar will result in recognition of foreign currency remeasurement loss for the year ended December 27, 2020.
(b) Based on the net monetary asset position of our Mexican subsidiaries, a 10% strengthening in the exchange rate of Mexican pesos to U.S. dollar will result in recognition of foreign currency remeasurement gain for the year ended December 27, 2020.
37

U.K. and Europe Subsidiaries
We are exposed to foreign exchange-related variability of investments and earnings from our U.K. and Europe subsidiaries. Foreign currency market risk is the possibility that our financial results or financial position could be better or worse than planned because of changes in foreign currency exchange rates. For this sensitivity analysis, market risk is estimated as a hypothetical 10% change in exchange rates used to convert U.S. dollars to British pound and to euro, and the effect of this change on our U.K. and Europe subsidiaries.
Net assets. As of December 27, 2020, our U.K. and Europe subsidiaries that are denominated in British pound had net assets of $2.2 billion. A 10% weakening in U.S. dollar against the British pound exchange rate would cause a decrease in the net assets of our U.K. and Europe subsidiaries by $202.5 million. A 10% strengthening in U.S. dollar against the British pound exchange rate would cause an increase in the net assets of our U.K. and Europe subsidiaries by $247.5 million.
Cash flow hedging transactions. We periodically enter into foreign currency forward contracts, which are designated and qualify as cash flow hedges, to hedge foreign currency risk on a portion of sales generated and purchases made by our U.K. and Europe subsidiaries. A 10% weakening or strengthening of the U.S. dollar against the British pound and U.S. dollar against the euro would result in immaterial changes in the fair values of these derivative instruments. No assurance can be given as to how future movements in currency rates could affect our future financial condition or results of operations.
Quality of Investments
Certain retirement plans that we sponsor invest in a variety of financial instruments. We have analyzed our portfolios of investments and, to the best of our knowledge, none of our investments, including money market funds units, commercial paper and municipal securities, have been downgraded, and neither we nor any fund in which we participate hold significant amounts of structured investment vehicles, auction rate securities, collateralized debt obligations, credit derivatives, hedge funds investments, fund of funds investments or perpetual preferred securities. Certain postretirement funds in which we participate hold significant amounts of mortgage-backed securities. However, none of the mortgages collateralizing these securities are considered subprime.
Impact of Inflation
Due to low to moderate inflation in the U.S., the U.K., continental Europe and Mexico and our rapid inventory turnover rate, the results of operations have not been significantly affected by inflation during the past three-year period.
38
Item 8. Financial Statements and Supplementary DataReport of Independent Registered Public Accounting Firm
To the Stockholders and Board of DirectorsPilgrim's Pride Corporation:
Opinion on the Consolidated Financial Statements
We have audited the accompanying consolidated balance sheets of Pilgrim's Pride Corporation and subsidiaries (the Company) as of December 27, 2020 and December 29, 2019, the related consolidated statements of income, comprehensive income, stockholders’ equity, and cash flows for each of the fiscal years in the three-year period ended December 27, 2020 and the related notes and financial statement schedule II (collectively, the consolidated financial statements). In our opinion, the consolidated financial statements present fairly, in all material respects, the financial position of the Company as of December 27, 2020 and December 29, 2019, and the results of its operations and its cash flows for each of the fiscal years in the three-year period ended December 27, 2020 in conformity with U.S. generally accepted accounting principles.
We also have audited, in accordance with the standards of the Public Company Accounting Oversight Board (United States) (PCAOB), the Company’s internal control over financial reporting as of December 27, 2020, based on criteria established in Internal Control – Integrated Framework (2013) issued by the Committee of Sponsoring Organizations of the Treadway Commission, and our report dated February 10, 2021 expressed an unqualified opinion on the effectiveness of the Company’s internal control over financial reporting.
Change in Accounting Principle
ASU 2016-13
As discussed in Note 1 to the consolidated financial statements, the Company has changed its method of accounting for expected credit losses on financial instruments as of December 30, 2019 due to the adoption of ASU 2016-13, Financial Instruments-Credit Losses.
ASU 2016-02
As discussed in Note 1 to the consolidated financial statements, the Company has changed its method of accounting for leases as of December 31, 2018 due to the adoption of ASU 2016-02, Leases.
Basis for Opinion
These consolidated financial statements are the responsibility of the Company’s management. Our responsibility is to express an opinion on these consolidated financial statements based on our audits. We are a public accounting firm registered with the PCAOB and are required to be independent with respect to the Company in accordance with the U.S. federal securities laws and the applicable rules and regulations of the Securities and Exchange Commission and the PCAOB.
We conducted our audits in accordance with the standards of the PCAOB. Those standards require that we plan and perform the audit to obtain reasonable assurance about whether the consolidated financial statements are free of material misstatement, whether due to error or fraud. Our audits included performing procedures to assess the risks of material misstatement of the consolidated financial statements, whether due to error or fraud, and performing procedures that respond to those risks. Such procedures included examining, on a test basis, evidence regarding the amounts and disclosures in the consolidated financial statements. Our audits also included evaluating the accounting principles used and significant estimates made by management, as well as evaluating the overall presentation of the consolidated financial statements. We believe that our audits provide a reasonable basis for our opinion.
Critical Audit Matter
The critical audit matter communicated below is a matter arising from the current period audit of the consolidated financial statements that was communicated or required to be communicated to the audit committee and that: (1) relates to accounts or disclosures that are material to the consolidated financial statements and (2) involved our especially challenging, subjective, or complex judgments. The communication of a critical audit matter does not alter in any way our opinion on the consolidated financial statements, taken as a whole, and we are not, by communicating the critical audit matter below, providing a separate opinion on the critical audit matter or on the accounts or disclosures to which it relates.
Evaluation of cost of inventory
39
As discussed in Note 1 to the consolidated financial statements, certain types of inventory are recorded at the lower of cost or net realizable value. The Company had inventories of approximately $1.4 billion as of December 27, 2020. Certain inventory is recorded at standard cost, which is set by management to reflect the actual costs incurred. The production of inventory is a process with many steps. When transferred to the next stage in the production process, the transfer is often done at a standard cost, where additional costs may be incurred. As such, the cost of inventory at a particular step in the production process is often dependent on the costs recorded at a previous step in the production process.
We identified the evaluation of the cost of certain types of inventory as a critical audit matter. Due to the frequent movement of products, the many steps that a product takes through the production cycle, and the variety of costs incurred at certain steps, especially challenging auditor judgement was required to evaluate the amounts recorded as the costs are incurred and transferred throughout steps in the production process.
The following are the primary procedures we performed to address this critical audit matter. We evaluated the design and tested the operating effectiveness of certain internal controls related to the Company’s inventory costing process, including controls over 1) actual costs incurred, 2) the monitoring of variances between actual costs incurred and standard costs, and 3) the accumulation and transfer of costs throughout steps in the production process. For a sample of transactions, we assessed the actual costs incurred and the transfer of costs throughout steps in the production process by obtaining evidence over the actual costs incurred and tracing the standard cost transferred to the prior step in the production process. For certain aggregate variances between actual costs incurred and standard costs, we assessed the reasonableness of standard cost by evaluating the nature and cause of the variance.
/s/ KPMG LLP
We have served as the Company’s auditor since 2012.
Denver, ColoradoFebruary 10, 2021
40

PILGRIM’S PRIDE CORPORATIONCONSOLIDATED BALANCE SHEETS
December 27, 2020 December 29, 2019
(In thousands, except share and par value data)
Cash and cash equivalents $ 547,624 $ 260,568 Restricted cash and cash equivalents 782 20,009 Trade accounts and other receivables, less allowance for doubtful accounts 741,992 741,281 Accounts receivable from related parties 1,084 944 Inventories 1,358,793 1,383,535 Income taxes receivable 69,397 60,204 Prepaid expenses and other current assets 183,039 131,695
Total current assets 2,902,711 2,598,236 Deferred tax assets 5,471 4,426 Other long-lived assets 24,780 36,325 Operating lease assets, net 288,886 301,513 Identified intangible assets, net 589,913 596,053 Goodwill 1,005,245 973,750 Property, plant and equipment, net 2,657,491 2,592,061
Total assets $ 7,474,497 $ 7,102,364
Accounts payable $ 1,028,710 $ 993,780 Accounts payable to related parties 9,650 3,819 Revenue contract liability 65,918 41,770 Accrued expenses and other current liabilities 807,847 575,319 Income taxes payable — 7,075 Current maturities of long-term debt 25,455 26,392
Total current liabilities 1,937,580 1,648,155 Noncurrent operating lease liability, less current maturities 217,432 235,382 Long-term debt, less current maturities 2,255,546 2,276,029 Noncurrent income taxes payable — 7,731 Deferred tax liabilities 339,831 301,907 Other long-term liabilities 148,761 97,100
Total liabilities 4,899,150 4,566,304
Common stock, $.01 par value, 800,000,000 shares authorized; 261,184,998 and 261,119,064 shares issued at year-end 2020 and year-end 2019, respectively; 243,512,490 and 249,572,119 shares outstanding at year-end 2020 and year-end 2019, respectively 2,612 2,611 Treasury stock, at cost, 17,672,508 shares and 11,546,945 shares at year-end 2020
and year-end 2019, respectively (345,134) (234,892) Additional paid-in capital 1,954,334 1,955,261 Retained earnings 972,569 877,812 Accumulated other comprehensive loss (20,620) (75,129)
Total Pilgrim’s Pride Corporation stockholders’ equity 2,563,761 2,525,663 Noncontrolling interest 11,586 10,397
Total stockholders’ equity 2,575,347 2,536,060 Total liabilities and stockholders’ equity $ 7,474,497 $ 7,102,364
The accompanying notes are an integral part of these Consolidated Financial Statements.
41

PILGRIM’S PRIDE CORPORATIONCONSOLIDATED STATEMENTS OF INCOME
Year EndedDecember 27, 2020 December 29, 2019 December 30, 2018
(In thousands, except per share data)
Net sales $ 12,091,901 $ 11,409,219 $ 10,937,784 Cost of sales 11,253,705 10,338,825 10,094,308
Gross profit 838,196 1,070,394 843,476 Selling, general and administrative expense 592,610 379,910 343,025 Administrative restructuring activities 123 (84) 4,765
Operating income 245,463 690,568 495,686 Interest expense, net of capitalized interest 126,118 132,630 162,812 Interest income (7,305) (14,277) (13,811) Foreign currency transaction loss 760 6,917 17,160 Gain on bargain purchase 3,746 (56,880) — Miscellaneous, net (39,681) 4,633 (2,702)
Income before income taxes 161,825 617,545 332,227 Income tax expense 66,755 161,009 85,423
Net income 95,070 456,536 246,804 Less: Net income (loss) attributable to noncontrolling interest 313 612 (1,141)
Net income attributable to Pilgrim’s Pride Corporation $ 94,757 $ 455,924 $ 247,945
Weighted average shares of Pilgrim's Pride Corporation common stock outstanding:
Basic 245,944 249,401 248,945 Effect of dilutive common stock equivalents 180 308 204 Diluted 246,124 249,709 249,149
Net income attributable to Pilgrim's Pride Corporation per share of common stock outstanding:
Basic $ 0.39 $ 1.83 $ 1.00 Diluted $ 0.39 $ 1.83 $ 1.00
The accompanying notes are an integral part of these Consolidated Financial Statements.
42

PILGRIM’S PRIDE CORPORATIONCONSOLIDATED STATEMENTS OF COMPREHENSIVE INCOME
Year Ended
Year Ended December 27, 2020
Year Ended December 29, 2019
Year Ended December 30, 2018
(In thousands)
Net income $ 95,070 $ 456,536 $ 246,804 Other comprehensive income:
Foreign currency translation adjustmentGains (losses) arising during the period 83,890 54,662 (99,475)
Income tax effect — — 1,624 Derivative financial instruments designated as cash flow hedges
Gains (losses) arising during the period 3,719 (2,106) 817 Income tax effect 160 — —
Reclassification to net earnings for losses (gains) realized (2,664) 383 348
Available-for-sale securitiesGains arising during the period 73 510 1,146
Income tax effect (18) (124) (279) Reclassification to net earnings for gains realized (73) (619) (1,118)
Income tax effect 18 151 272 Defined benefit plans
Losses realized during the period (38,845) (2,161) (1,242) Income tax effect 7,121 1,016 303
Reclassification to net earnings of losses realized 1,502 1,313 1,203 Income tax effect (374) (320) (293)
Total other comprehensive income (loss), net of tax 54,509 52,705 (96,694) Comprehensive income 149,579 509,241 150,110 Less: Comprehensive income (loss) attributable to noncontrolling interests 313 612 (1,141) Comprehensive income attributable to Pilgrim's Pride Corporation $ 149,266 $ 508,629 $ 151,251
The accompanying notes are an integral part of these Consolidated Financial Statements.
43

PIL
GR
IM’S
PR
IDE
CO
RPO
RA
TIO
NC
ON
SOL
IDA
TE
D S
TA
TE
ME
NT
S O
F ST
OC
KH
OL
DE
RS’
EQ
UIT
Y
Pilg
rim
’s P
ride
Cor
pora
tion
Stoc
khol
ders
C
omm
on S
tock
Tre
asur
y St
ock
Add
ition
alPa
id-in
Cap
ital
Ret
aine
d E
arni
ngs
Acc
umul
ated
Oth
erC
ompr
ehen
sive
Los
sN
onco
ntro
lling
Inte
rest
Tot
alSh
ares
Am
ount
Shar
esA
mou
nt
(I
n th
ousa
nds)
Bal
ance
at D
ecem
ber 3
1, 2
017
26
0,16
8 $
2,60
2
(11,
416)
$
(231
,758
) $
1,93
2,50
9 $
173,
943
$ (3
1,14
0)
$ 9,
505
$ 1,
855,
661
Com
preh
ensi
ve in
com
e:N
et in
com
e (lo
ss)
—
—
—
—
—
247,
945
—
(1,1
41)
24
6,80
4
Oth
er c
ompr
ehen
sive
loss
, net
of t
ax b
enef
it of
$1,
627
—
—
—
—
—
—
(9
6,69
4)
—
(96,
694)
C
apita
l dis
tribu
tion
unde
r Tax
Sha
ring
Agr
eem
ent b
etw
een
JBS
USA
Foo
d C
ompa
ny H
oldi
ngs a
nd P
ilgrim
's Pr
ide
Cor
pora
tion
(the
"TSA
")
—
—
—
—
(524
)
—
—
—
(5
24)
Stoc
k-ba
sed
com
pens
atio
n pl
ans:
Com
mon
stoc
k is
sued
und
er c
ompe
nsat
ion
plan
s
228
2
—
—
(2
)
—
—
—
—
Req
uisi
te se
rvic
e pe
riod
reco
gniti
on
—
—
—
—
13,1
53
—
—
—
13,1
53
Com
mon
stoc
k pu
rcha
sed
unde
r sha
re re
purc
hase
pro
gram
—
—
(1
5)
(2
36)
—
—
—
—
(2
36)
Cap
ital c
ontri
butio
n to
subs
idia
ry b
y no
ncon
trolli
ng in
tere
st
—
—
—
—
—
—
—
1,
421
1,
421
Bal
ance
at D
ecem
ber 3
0, 2
018
26
0,39
6
2,60
4
(11,
431)
$
(231
,994
) $
1,94
5,13
6 $
421,
888
$ (1
27,8
34)
$ 9,
785
$ 2,
019,
585
Com
preh
ensi
ve in
com
e:
Net
inco
me
—
—
—
—
—
455,
924
—
612
45
6,53
6
Oth
er c
ompr
ehen
sive
inco
me,
net
of t
ax b
enef
it of
$72
3
—
—
—
—
—
—
52,7
05
—
52,7
05
Stoc
k-ba
sed
com
pens
atio
n pl
ans:
Com
mon
stoc
k is
sued
und
er c
ompe
nsat
ion
plan
s
723
7
—
—
(7
)
—
—
—
—
Req
uisi
te se
rvic
e pe
riod
reco
gniti
on
—
—
—
—
10,1
32
—
—
—
10,1
32
Com
mon
stoc
k pu
rcha
sed
unde
r sha
re re
purc
hase
pro
gram
—
—
(1
16)
(2
,898
)
—
—
—
—
(2,8
98)
Bal
ance
at D
ecem
ber 2
9, 2
019
26
1,11
9 $
2,61
1
(11,
547)
$
(234
,892
) $
1,95
5,26
1 $
877,
812
$ (7
5,12
9)
$ 10
,397
$
2,53
6,06
0
Com
preh
ensi
ve in
com
e:
Net
inco
me
—
—
—
—
—
94,7
57
—
313
95
,070
Oth
er c
ompr
ehen
sive
inco
me,
net
of t
ax b
enef
it of
$6,
907
—
—
—
—
—
—
54
,509
—
54
,509
Cap
ital d
istri
butio
n un
der T
SA
—
—
—
—
(650
)
—
—
—
(6
50)
Stoc
k-ba
sed
com
pens
atio
n pl
ans:
Com
mon
stoc
k is
sued
und
er c
ompe
nsat
ion
plan
s
66
1
—
—
(1
)
—
—
—
—
Req
uisi
te se
rvic
e pe
riod
reco
gniti
on
—
—
—
—
(276
)
—
—
—
(2
76)
Com
mon
stoc
k pu
rcha
sed
unde
r sha
re re
purc
hase
pro
gram
—
—
(6
,126
)
(110
,242
)
—
—
—
—
(110
,242
)
Dis
solu
tion
of su
bsid
iary
—
—
—
—
—
—
—
876
87
6 B
alan
ce a
t Dec
embe
r 27,
202
0
261,
185
$ 2,
612
(1
7,67
3)
$ (3
45,1
34)
$ 1,
954,
334
$ 97
2,56
9 $
(20,
620)
$
11,5
86
$ 2,
575,
347
The
acco
mpa
nyin
g no
tes a
re a
n in
tegr
al p
art o
f the
se C
onso
lidat
ed F
inan
cial
Sta
tem
ents
.
44

PILGRIM’S PRIDE CORPORATIONCONSOLIDATED STATEMENTS OF CASH FLOWS
Year Ended December 27, 2020 December 29, 2019 December 30, 2018
(In thousands)
Cash flows from operating activities:Net income $ 95,070 $ 456,536 $ 246,804 Adjustments to reconcile net income to cash provided by operating activities:
Depreciation and amortization 337,104 287,230 274,088 Deferred income tax expense 37,337 42,478 32,540 Gain on property disposals (13,766) (10,896) (1,889) Loan cost amortization 4,848 4,821 5,569 Gain on bargain purchase 3,746 (56,880) — Accretion of bond discount 982 982 812 Amortization of bond premium (668) (668) (668) Loss (gain) on equity method investments 291 (63) (63) Stock-based compensation (276) 10,132 13,153 Noncash loss on subsidiary dissolution 115 — — Foreign currency transaction losses (gains) related to borrowing arrangements — (4,970) 5,267 Loss on early extinguishment of debt recognized as a component of interest expense — — 15,818 Asset impairment — — 3,504 Changes in operating assets and liabilities:
Trade accounts and other receivables 29,154 (25,000) (10,918) Inventories 26,041 (111,748) 83,174 Prepaid expenses and other current assets (50,347) (15,490) (11,612) Accounts payable and accrued expenses 295,327 119,892 86,834 Income taxes (39,436) (26,378) (248,470) Long-term pension and other postretirement obligations (7,883) (9,221) (6,751) Other operating assets and liabilities 6,608 5,764 4,458
Cash provided by operating activities 724,247 666,521 491,650 Cash flows from investing activities:Acquisitions of property, plant and equipment (354,762) (348,120) (348,666) Proceeds from property disposals 31,976 15,753 9,775 Purchase of acquired business, net of cash acquired (4,216) (384,694) —
Cash used in investing activities (327,002) (717,061) (338,891) Cash flows from financing activities:Payments on revolving line of credit, long-term borrowings and finance lease obligations (430,988) (289,917) (1,117,009) Proceeds from revolving line of credit and long-term borrowings 404,522 259,466 748,382 Purchase of common stock under stock repurchase program (110,242) (2,898) (236) Payment of capitalized loan costs — (652) (12,581) Proceeds (distribution) from capital contribution under the TSA — (525) 5,558 Payment on early extinguishment of debt — — (9,781) Capital contributions to subsidiary by noncontrolling stockholders — — 1,421
Cash used in financing activities (136,708) (34,526) (384,246) Effect of exchange rate changes on cash and cash equivalents 7,292 4,065 3,534 Increase (decrease) in cash and cash equivalents 267,829 (81,001) (227,953) Cash and cash equivalents, beginning of year 280,577 361,578 589,531 Cash and cash equivalents, end of year $ 548,406 $ 280,577 $ 361,578 Supplemental Disclosure Information:
Interest paid (net of amount capitalized) $ 130,641 $ 130,882 $ 154,627 Income taxes paid 51,710 125,856 253,932
The accompanying notes are an integral part of these Consolidated Financial Statements.
45

1. GENERAL
Business
Pilgrim’s Pride Corporation (referred to herein as “Pilgrim’s,” “PPC,” “the Company,” “we,” “us,” “our,” or similar terms) is one of the largest chicken producers in the world, with operations in the United States (“U.S.”), the United Kingdom (“U.K.”), Mexico, France, Puerto Rico and the Netherlands. Pilgrim’s products are sold to foodservice, retail and frozen entrée customers. The Company’s primary distribution is through retailers, foodservice distributors and restaurants throughout the countries listed above. Additionally, the Company exports chicken and pork products to approximately 115 countries. Pilgrim’s fresh products consist of refrigerated (nonfrozen) whole chickens, whole cut-up chickens, selected chicken parts that are either marinated or non-marinated, primary pork cuts, added value pork and pork ribs. The Company’s prepared products include fully cooked, ready-to-cook and individually frozen chicken parts, strips, nuggets and patties, some of which are either breaded or non-breaded, either marinated or non-marinated, processed sausages, bacon, slow-cooked, smoked meat and gammon joints. The Company’s other products include ready-to-eat meals, multi-protein frozen foods, vegetarian foods and desserts, pre-packed meats, sandwich, deli counter meats, pulled pork balls, meat balls and coated foods. As a vertically integrated company, we control every phase of the production of our products. We operate feed mills, hatcheries, processing plants and distribution centers in 14 U.S. states, the U.K., Mexico, France, Puerto Rico and the Netherlands. As of December 27, 2020, Pilgrim’s had approximately 56,400 employees. As of December 27, 2020, Pilgrim’s had the capacity to process more than 44.9 million birds per week for a total of more than 13.2 billion pounds of live chicken annually. Approximately 4,800 contract growers supply poultry for the Company’s operations. As of December 27, 2020, Pilgrim’s had the capacity to process more than 45,000 pigs per week for a total of 436.7 million pounds of live pork annually. Approximately 300 contract growers supply pork for the Company’s operations. As of December 27, 2020, JBS S.A., through its indirect wholly-owned subsidiaries (together, “JBS”) beneficially owned 80.26% of the Company’s outstanding common stock.
Consolidated Financial Statements
The Company operates on the basis of a 52/53-week fiscal year ending on the Sunday falling on or before December 31. Any reference we make to a particular year in the notes to these Consolidated Financial Statements applies to our fiscal year and not the calendar year.
On September 8, 2017, a subsidiary of the Company acquired 100% of the issued and outstanding shares of Granite Holdings Sàrl and its subsidiaries (together, “Moy Park”) from JBS S.A. in a common-control transaction. Moy Park was acquired by JBS S.A. from an unrelated third party on September 30, 2015. For the period from September 30, 2015 through September 7, 2017, the Consolidated Financial Statements include the accounts of the Company and its majority-owned subsidiaries combined with the accounts of Moy Park. For the periods subsequent to September 8, 2017, the Consolidated Financial Statements include the accounts of the Company and its majority-owned subsidiaries, including Moy Park. We eliminate all significant affiliate accounts and transactions upon consolidation.
The Consolidated Financial Statements have been prepared in conformity with accounting principles generally accepted in the U.S. (“U.S. GAAP”) using management’s best estimates and judgments. These estimates and judgments affect the reported amounts of assets and liabilities and disclosure of the contingent assets and liabilities at the date of the financial statements. The estimates and judgments will also affect the reported amounts for certain revenues and expenses during the reporting period. Actual results could differ materially from these estimates and judgments. Significant estimates made by the Company include the allowance for doubtful accounts, reserves related to inventory obsolescence or valuation, useful lives of long-lived assets, goodwill, valuation of deferred tax assets, insurance accruals, valuation of pension and other postretirement benefits obligations, income tax accruals, certain derivative positions and valuations of acquired businesses.
The functional currency of the Company's U.S. and Mexico operations and certain holding-company subsidiaries in Luxembourg, the U.K. and Ireland is the U.S. dollar. The functional currency of its U.K. operations is the British pound. The functional currency of the Company's operations in France and the Netherlands is the euro. For foreign currency-denominated entities other than the Company's Mexico operations, translation from local currencies into U.S. dollars is performed for most assets and liabilities using the exchange rates in effect as of the balance sheet date. Income and expense accounts are remeasured using average exchange rates for the period. Adjustments resulting from translation of these financial records are reflected as a separate component of Accumulated other comprehensive loss in the Consolidated Balance Sheets. For the Company's Mexico operations, remeasurement from the Mexican peso to U.S. dollars is performed for monetary assets and liabilities using the exchange rate in effect as of the balance sheet date. Remeasurement is performed for non-monetary assets using the historical exchange rate in effect on the date of each asset’s acquisition. Income and expense accounts are remeasured
NOTES TO CONSOLIDATED FINANCIAL STATEMENTS
46

using average exchange rates for the period. Net adjustments resulting from remeasurement of these financial records are reflected in Foreign currency transaction losses (gains) in the Consolidated Statements of Income.
The Company or its subsidiaries may use derivatives for the purpose of mitigating exposure to changes in foreign currency exchange rates. Foreign currency transaction gains or losses are reported in the Consolidated Statements of Income.
Revenue Recognition
The vast majority of the Company's revenue is derived from contracts which are based upon a customer ordering its products. While there may be master agreements, the contract is only established when the customer’s order is accepted by the Company. The Company accounts for a contract, which may be verbal or written, when it is approved and committed by both parties, the rights of the parties are identified along with payment terms, the contract has commercial substance and collectability is probable.
The Company evaluates the transaction for distinct performance obligations, which are the sale of its products to customers. Since its products are commodity market-priced, the sales price is representative of the observable, standalone selling price. Each performance obligation is recognized based upon a pattern of recognition that reflects the transfer of control to the customer at a point in time, which is upon destination (customer location or port of destination), and depicts the transfer of control and recognition of revenue. There are instances of customer pick-up at the Company's facilities, in which case control transfers to the customer at that point and the Company recognizes revenue. The Company's performance obligations are typically fulfilled within days to weeks of the acceptance of the order.
The Company makes judgments regarding the nature, amount, timing and uncertainty of revenue and cash flows arising from revenue and cash flows with customers. Determination of a contract requires evaluation and judgment along with the estimation of the total contract value and if any of the contract value is constrained. Due to the nature of our business, there is minimal variable consideration, as the contract is established at the acceptance of the order from the customer. When applicable, variable consideration is estimated at contract inception and updated on a regular basis until the contract is completed. Allocating the transaction price to a specific performance obligation based upon the relative standalone selling prices includes estimating the standalone selling prices including discounts and variable consideration.
Shipping and Handling Costs
In the rare case when shipping and handling activities are performed after a customer obtains control of the good, the Company has elected to account for shipping and handling as activities to fulfill the promise to transfer the good. When revenue is recognized for the related good before the shipping and handling activities occur, the related costs of those shipping and handling activities are accrued. Shipping and handling costs are recorded within cost of sales.
Advertising Costs
The Company expenses advertising costs as incurred. Advertising costs are included in selling, general and administrative (“SG&A”) expense and totaled $20.2 million, $26.5 million and $20.8 million for 2020, 2019 and 2018, respectively.
Research and Development Costs
Research and development costs are expensed as incurred. Research and development costs totaled $5.4 million, $5.1 million and $4.0 million for 2020, 2019 and 2018, respectively.
Cash and Cash Equivalents
The Company considers highly liquid investments with a maturity of three months or less when acquired to be cash equivalents. The majority of the Company’s disbursement bank accounts are zero balance accounts where cash needs are funded as checks are presented for payment by the holder. Checks issued pending clearance that result in overdraft balances for accounting purposes are classified as accounts payable and the change in the related balance is reflected in operating activities on the Consolidated Statements of Cash Flows.
Restricted Cash
The Company is required to maintain cash balances with a broker as collateral for exchange traded futures contracts. These balances are classified as restricted cash as they are not available for use by the Company to fund daily operations. The balance of restricted cash may also include investments in U.S. Treasury Bills that qualify as cash equivalents, as required by the broker, to offset the obligation to return cash collateral.
NOTES TO CONSOLIDATED FINANCIAL STATEMENTS
47

The following table reconciles cash, cash equivalents and restricted cash as reported in the Consolidated Balance Sheets to the total of the same amounts shown in the Consolidated Statements of Cash Flows:
December 27, 2020 December 29, 2019(In thousands)
Cash and cash equivalents $ 547,624 $ 260,568 Restricted cash 782 20,009 Total cash, cash equivalents and restricted cash shown in the Consolidated Statements of Cash Flows $ 548,406 $ 280,577
Investments
The Company’s current investments are all highly liquid investments with a maturity of three months or less when acquired and are, therefore, considered cash equivalents. The Company’s current investments are comprised of fixed income securities, primarily commercial paper and a money market fund. These investments are classified as available-for-sale. These securities are recorded at fair value, and unrealized holding gains and losses are recorded, net of tax, as a separate component of accumulated other comprehensive income. Investments in fixed income securities with remaining maturities of less than one year and those identified by management at the time of purchase for funding operations in less than one year are classified as current assets. Investments in fixed income securities with remaining maturities in excess of one year that management has not identified at the time of purchase for funding operations in less than one year are classified as long-term assets. Unrealized losses are charged against net earnings when a decline in fair value is determined to be other than temporary. Management reviews several factors to determine whether a loss is other than temporary, such as the length of time a security is in an unrealized loss position, the extent to which fair value is less than amortized cost, the impact of changing interest rates in the short and long term, and the Company’s intent and ability to hold the security for a period of time sufficient to allow for any anticipated recovery in fair value. The Company determines the cost of each security sold and each amount reclassified out of accumulated other comprehensive income into earnings using the specific identification method. Purchases and sales are recorded on a settlement date basis.
Investments in entities in which the Company has an ownership interest greater than 50% and exercises control over the entity are consolidated in the Consolidated Financial Statements. Investments in entities in which the Company has an ownership interest between 20% and 50% and exercises significant influence are accounted for using the equity method. The Company invests from time to time in ventures in which its ownership interest is less than 20% and over which it does not exercise significant influence. Such investments are accounted for under the cost method. The fair values for investments not traded on a quoted exchange are estimated based upon the historical performance of the ventures, the ventures’ forecasted financial performance and management’s evaluation of the ventures’ viability and business models. To the extent the book value of an investment exceeds its assessed fair value, the Company will record an appropriate impairment charge.
Accounts Receivable
The Company records accounts receivable when revenue is recognized. We record an allowance for doubtful accounts, reducing our receivables balance to an amount we estimate is collectible from our customers. Estimates used in determining the allowance for doubtful accounts are based on historical collection experience, current trends, aging of accounts receivable, and periodic credit evaluations of our customers’ financial condition. We write off accounts receivable when it becomes apparent, based upon age or customer circumstances, that such amounts will not be collected. Generally, the Company does not require collateral for its accounts receivable.
Inventories
Live chicken inventories are stated at the lower of cost or net realizable value and breeder hen inventories at the lower of cost, less accumulated amortization, or net realizable value. The costs associated with breeder hen inventories are accumulated up to the production stage and amortized over their productive lives using the unit-of-production method. Finished poultry products, feed, eggs and other inventories are stated at the lower of average cost or net realizable value. Inventory typically transfers from one stage of production to another at a standard cost, where it accumulates additional cost directly incurred with the production of inventory, including overhead. The standard cost at which each type of inventory transfers is set by management to reflect the actual costs incurred in the prior steps. We monitor and adjust standard costs throughout the year to ensure that standard costs reasonably reflect the actual average cost of the inventory produced.
Pork inventories are stated at the lower of cost or net realizable value. Cost includes expenditures incurred in bringing each product to its present location and condition such as purchase price, transportation, labor, and appropriate proportion of manufacturing overhead based on actual production.
NOTES TO CONSOLIDATED FINANCIAL STATEMENTS
48

The Company records valuation adjustments for its inventory and for estimated obsolescence at or equal to the difference between the cost of inventory and the estimated market value based upon known conditions affecting inventory, including significantly aged products, discontinued product lines, or damaged or obsolete products. The Company allocates meat costs between its various finished chicken products based on a by-product costing technique that reduces the cost of the whole bird by estimated yields and amounts to be recovered for certain by-product parts. This primarily includes leg quarters, wings, tenders and offal, which are carried in inventory at the estimated recovery amounts, with the remaining amount being reflected as its breast meat cost.
Generally, the Company performs an evaluation of whether any lower of cost or net realizable value adjustments are required at the country level based on a number of factors, including: (1) pools of related inventory, (2) product continuation or discontinuation, (3) estimated market selling prices and (4) expected distribution channels. If actual market conditions or other factors are less favorable than those projected by management, additional inventory adjustments may be required.
Leases
The Company determines if an arrangement is a lease at inception. Operating leases are included in Operating lease assets, net, Accrued expenses and other current liabilities, and Noncurrent operating lease liability, less current maturities, in our Consolidated Balance Sheets. Finance leases are included in Property, plant and equipment, net, Current maturities of long-term debt and Long-term debt, less current maturities in our Consolidated Balance Sheets.
Beginning with the adoption of Accounting Standards Update (“ASU”) 2016-02 on December 31, 2018, operating lease assets and operating lease liabilities are initially recognized based on the present value of the future minimum lease payments over the lease term at commencement date. As most of the Company’s leases do not provide an implicit interest rate, the Company uses its incremental borrowing rate (“IBR”) based on the information available at commencement date in determining the present value of future payments. IBR is derived from the Company’s credit facility’s margin as a basis with adjustments to periodically updated LIBOR swap rate and foreign currency curve. The operating lease asset also includes any lease payments made, including upfront costs and prepayments, and excludes lease incentives and initial direct costs incurred. The Company’s lease terms may include options to extend or terminate a lease when it is reasonably certain that it will exercise that option. Leases with an initial term of 12 months or less are not recorded on the balance sheet. Lease expense for minimum lease payments is recognized on a straight-line basis over the lease term with a corresponding reduction to the operating lease asset.
The Company has lease agreements with lease and non-lease components. Beginning in 2019, lease and non-lease components are generally accounted for separately. For certain equipment leases, such as vehicles, the Company accounts for the lease and non-lease components as a single lease component.
Property, Plant and Equipment
Property, plant and equipment are stated at cost, and repair and maintenance costs are expensed as incurred. Depreciation is computed using the straight-line method over the estimated useful lives of these assets. Estimated useful lives for building, machinery and equipment are five to 33 years and for automobiles and trucks are three to ten years. The charge to income resulting from amortization of assets recorded under capital leases is included with depreciation expense.
The Company records impairment charges on long-lived assets held for use when events and circumstances indicate that the assets may be impaired and the undiscounted cash flows estimated to be generated by those assets are less than the carrying amount of those assets. When the above is true, the impairment charge is determined based upon the amount the net book value of the assets exceeds their fair market value. In making these determinations, the Company utilizes certain assumptions, including, but not limited to: (1) future cash flows estimated to be generated by these assets, which are based on additional assumptions such as asset utilization, remaining length of service and estimated salvage values, (2) estimated fair market value of the assets and (3) determinations with respect to the lowest level of cash flows relevant to the respective impairment test, generally groupings of related operational facilities. Given the interdependency of the Company’s individual facilities during the production process, which operate as a vertically integrated network, it evaluates impairment of assets held for use at the country level (i.e., the U.S. and Mexico). Management believes this is the lowest level of identifiable cash flows for its assets that are held for use in production activities. At the present time, the Company’s forecasts indicate that it can recover the carrying value of its assets held for use based on the projected undiscounted cash flows of the operations.
The Company records impairment charges on long-lived assets held for sale when the carrying amount of those assets exceeds their fair value less appropriate selling costs. Fair value is based on amounts documented in sales contracts or letters of intent accepted by the Company, amounts included in counteroffers initiated by the Company, or, in the absence of current contract negotiations, amounts determined using a sales comparison approach for real property and amounts determined using a cost approach for personal property. Under the sales comparison approach, sales and asking prices of reasonably comparable
NOTES TO CONSOLIDATED FINANCIAL STATEMENTS
49

properties are considered to develop a range of unit prices within which the current real estate market is operating. Under the cost approach, a current cost to replace the asset new is calculated and then the estimated replacement cost is reduced to reflect the applicable decline in value resulting from physical deterioration, functional obsolescence and economic obsolescence. Appropriate selling costs includes reasonable broker’s commissions, costs to produce title documents, filing fees, legal expenses and the like. We estimate appropriate closing costs as 4% to 6% of asset fair value. This range of rates is considered reasonable for our assets held for sale based on historical experience.
Goodwill and Other Intangibles, net
Goodwill represents the excess of the aggregate purchase price over the fair value of the net identifiable assets acquired in a business combination. Identified intangible assets represent trade names, customer relationships and non-compete agreements arising from acquisitions that are recorded at fair value as of the date acquired less accumulated amortization, if any. The Company uses various market valuation techniques to determine the fair value of its identified intangible assets.
Goodwill and other intangible assets with indefinite lives are not amortized but are tested for impairment on an annual basis in the fourth quarter of each fiscal year or more frequently if impairment indicators arise. For goodwill, an impairment loss is recognized for any excess of the carrying amount of a reporting unit’s goodwill over the implied fair value of that goodwill. Management first reviews relevant qualitative factors to determine if an indication of impairment exists for a reporting unit. If management determines there is an indication that the carrying amount of reporting unit goodwill might be impaired, a quantitative analysis is performed. Management performed a qualitative analysis noting no indications of goodwill impairment in any of its reporting units as of December 27, 2020. For indefinite-lived intangible assets, an impairment loss is recognized if the carrying amount of an indefinite-lived intangible asset exceeds the estimated fair value of that intangible asset. Management first reviews relevant qualitative factors to determine if an indication of impairment exists. If management determines there is an indication that the carrying amount of the intangible asset might be impaired, a quantitative analysis is performed. Management performed a qualitative analysis noting no indications of impairment for any of its indefinite-lived intangible assets as of December 27, 2020.
Identifiable intangible assets with definite lives, such as customer relationships, non-compete agreements and trade names that the Company expects to use for a limited amount of time, are amortized over their estimated useful lives on a straight-line basis. The useful lives range from three to 20 years for non-compete agreements and trade names and three to 16 years for customer relationships. Identified intangible assets with definite lives are tested for recoverability whenever events or changes in circumstances indicate that their carrying amount may not be recoverable. Management assessed if events or changes in circumstances indicated that the aggregate carrying amount of its identified intangible assets with definite lives might not be recoverable and determined that there were no impairment indicators during the year ended December 27, 2020 and year ended December 29, 2019.
Book Overdraft Balances
The majority of the Company’s disbursement bank accounts are zero balance accounts where cash needs are funded as checks are presented for payment by the holder. Checks issued pending clearance that result in overdraft balances for accounting purposes are classified as accounts payable and the change in the related balance is reflected in operating activities on the Consolidated Statements of Cash Flows.
Litigation and Contingent Liabilities
The Company is subject to lawsuits, investigations and other claims related to employment, environmental, product and other matters. The Company is required to assess the likelihood of any adverse judgments or outcomes, as well as potential ranges of probable losses, to these matters. The Company estimates the amount of reserves required for these contingencies when losses are determined to be probable and after considerable analysis of each individual issue. The Company expenses legal costs related to such loss contingencies as they are incurred. The accrual for environmental remediation liabilities is measured on an undiscounted basis. These reserves may change in the future due to changes in the Company’s assumptions, the effectiveness of strategies, or other factors beyond the Company’s control.
Accrued Self Insurance
Insurance expense for casualty claims and employee-related health care benefits are estimated using historical and current experience and actuarial estimates. Stop-loss coverage is maintained with third-party insurers to limit the Company’s total exposure. Certain categories of claim liabilities are actuarially determined. The assumptions used to arrive at periodic expenses are reviewed regularly by management. However, actual expenses could differ from these estimates and could result in adjustments to be recognized.
NOTES TO CONSOLIDATED FINANCIAL STATEMENTS
50
Asset Retirement Obligations
The Company monitors certain asset retirement obligations in connection with its operations. These obligations relate to clean-up, removal or replacement activities and related costs for “in-place” exposures only when those exposures are moved or modified, such as during renovations of our facilities. These in-place exposures include asbestos, refrigerants, wastewater, oil, lubricants and other contaminants common in manufacturing environments. Under existing regulations, the Company is not required to remove these exposures and there are no plans to undertake a renovation that would require removal of the asbestos or the remediation of the other in-place exposures at this time. The facilities are expected to be maintained and repaired by activities that will not result in the removal or disruption of these in-place exposures at this time. As a result, there is an indeterminate settlement date for these asset retirement obligations because the range of time over which the Company may incur these liabilities is unknown and cannot be reasonably estimated. Therefore, the Company has not recorded the fair value of any potential liability.
Income Taxes
The Company follows provisions under ASC No. 740-10-30-27 in the Expenses-Income Taxes topic with regard to members of a group that file a consolidated tax return but issue separate financial statements. The Company files its U.S. federal tax return and certain state unitary returns with JBS USA Food Company Holdings (“JBS USA Holdings”). The income tax expense of the Company is computed using the separate return method. The provision for income taxes has been determined using the asset and liability approach of accounting for income taxes. For the unitary states, we have an obligation to make tax payments to JBS USA Holdings for our share of the unitary taxable income, which is included in taxes payable in our Consolidated Balance Sheets. Under this approach, deferred income taxes reflect the net tax effect of temporary differences between the book and tax bases of recorded assets and liabilities, net operating losses and tax credit carry forwards. The amount of deferred tax on these temporary differences is determined using the tax rates expected to apply to the period when the asset is realized or the liability is settled, as applicable, based on the tax rates and laws in the respective tax jurisdiction enacted as of the balance sheet date.
The Company reviews its deferred tax assets for recoverability and establishes a valuation allowance based on historical taxable income, potential for carry back of tax losses, projected future taxable income, applicable tax strategies, and the expected timing of the reversals of existing temporary differences. A valuation allowance is provided when it is more likely than not that some or all of the deferred tax assets will not be realized. Valuation allowances have been established primarily for net operating loss carry forwards of certain foreign subsidiaries.
The Company deems its earnings from Mexico, Puerto Rico and the U.K. as of December 27, 2020 to be permanently reinvested. As such, U.S. deferred income taxes have not been provided on these earnings. If such earnings were not considered indefinitely reinvested, certain deferred foreign and U.S. income taxes would be provided.
The Company follows provisions under ASC No. 740-10-25 that provide a recognition threshold and measurement criteria for the financial statement recognition of a tax benefit taken or expected to be taken in a tax return. Tax benefits are recognized only when it is more likely than not, based on the technical merits, that the benefits will be sustained on examination. Tax benefits that meet the more-likely-than-not recognition threshold are measured using a probability weighting of the largest amount of tax benefit that has greater than 50% likelihood of being realized upon settlement. Whether the more-likely-than-not recognition threshold is met for a particular tax benefit is a matter of judgment based on the individual facts and circumstances evaluated in light of all available evidence as of the balance sheet date. See “Note 12. Income Taxes” to the Consolidated Financial Statements.
Pension and Other Postemployment Benefits
Our pension and other postemployment benefit costs and obligations are dependent on the various actuarial assumptions used in calculating such amounts. These assumptions relate to discount rates, long-term return on plan assets and other factors. We base the discount rate assumptions on current investment yields on high-quality corporate long-term bonds. We determine the long-term return on plan assets based on historical portfolio results and management’s expectation of the future economic environment. Actual results that differ from our assumptions are accumulated and, if in excess of the lesser of 10% of the projected benefit obligation or the fair market value of plan assets, amortized over either (1) the estimated average future service period of active plan participants if the plan is active or (2) the estimated average future life expectancy of all plan participants if the plan is frozen.
Derivative Financial Instruments
The Company uses derivative financial instruments (e.g., futures, forwards options and swaps) for the purpose of mitigating exposure to changes in commodity prices, foreign currency exchange rates and interest rates.
NOTES TO CONSOLIDATED FINANCIAL STATEMENTS
51

• Commodity Price Risk - The Company utilizes various raw materials, which are all considered commodities, in its operations, including corn, soybean meal, soybean oil, wheat, natural gas, electricity and diesel fuel. The Company considers these raw materials to be generally available from a number of different sources and believes it can obtain them to meet its requirements. These commodities are subject to price fluctuations and related price risk due to factors beyond our control, such as economic and political conditions, supply and demand, weather, governmental regulation and other circumstances. Generally, the Company enters into derivative contracts such as physical forward contracts and exchange-traded futures or option contracts in an attempt to mitigate price risk related to its anticipated consumption of commodity inputs for periods up to 12 months. The Company may enter into longer-term derivatives on particular commodities if deemed appropriate.
• Foreign Currency Risk - The Company has foreign operations and, therefore, has exposure to foreign exchange risk when the financial results of those operations are translated to US dollars. The Company will occasionally purchase derivative financial instruments such as foreign currency forward contracts in an attempt to mitigate currency exchange rate exposure related to the net assets of its Mexico reportable segment that are denominated in Mexican pesos. The Company’s U.K. and Europe reportable segment also attempts to mitigate foreign currency exposure on certain transactions denominated in foreign currencies through the use of derivative financial instruments.
• Interest Rate Risk - The Company has exposure to variability in cash flows from interest payments due to the use of variable interest rates on certain long-term debt arrangements. The Company has purchased an interest rate swap contract to convert the variable interest rate to a fixed interest rate on a portion of its outstanding long-term debt arrangements in order to manage this interest rate risk and add stability to interest expense and cash flows.
Pilgrim’s recognizes all commodity derivative instruments that qualify for derivative accounting treatment as either assets or liabilities and measures those instruments at fair value unless they qualify for, and we elect, the normal purchases and normal sales scope exception (“NPNS”). The permitted accounting treatments include: cash flow hedge; fair value hedge; and undesignated contracts. Undesignated contract accounting is the default accounting treatment for all derivatives unless they qualify, and we specifically designate them, for one of the other accounting treatments. Derivatives designated for any of the elective accounting treatments must meet specific, restrictive criteria both at the time of designation and on an ongoing basis.
The Company has generally applied the NPNS exception to its forward physical grain purchase contracts. NPNS contracts are accounted for using the accrual method of accounting; therefore, there were no amounts recorded in the Consolidated Financial Statements at December 27, 2020 and December 29, 2019.
Undesignated contracts may include contracts not designated as a hedge or for which the NPNS exception was not elected, contracts that do not qualify for hedge accounting and derivatives that do not or no longer qualify for the NPNS scope exception. The fair value of these derivatives is recognized in the Consolidated Balance Sheets within Prepaid expenses and other current assets or Accrued expenses and other current liabilities. Changes in fair value of these derivatives are recognized immediately in the Consolidated Statements of Income within Net sales, Cost of sales or Selling, general and administrative expense, depending on the risk they are intended to mitigate. While management believes these instruments help mitigate various market risks, they are not designated nor accounted for as hedges as a result of the extensive record keeping requirements.
Use of Estimates
The preparation of financial statements in conformity with U.S. GAAP requires management to make estimates and assumptions that affect the reported amounts of assets and liabilities and disclosure of contingent assets and liabilities at the date of the financial statements and the reported amounts of revenues and expenses during the reporting period. Actual results could differ from those estimates. We make significant estimates in regard to receivables collectability; inventory valuation; realization of deferred tax assets; valuation of long-lived assets; valuation of contingent liabilities, liabilities subject to compromise and self-insurance liabilities; valuation of pension and other postretirement benefits obligations; and valuation of acquired businesses.
Recent Accounting Pronouncements Adopted in 2020
In June 2016, the Financial Accounting Standards Board (“FASB”) issued Accounting Standard Update (“ASU”) 2016-13, Financial Instruments—Credit Losses (Topic 326): Measurement of Credit Losses on Financial Instruments, which, in an effort to provide financial statement users with more decision-useful information about the expected credit losses on financial instruments, replaces the current incurred loss impairment methodology with a methodology that reflects expected credit losses and requires consideration of a broader range of reasonable and supportable information to inform credit loss estimates. The amendments affect loans, debt securities, trade receivables, net investments in leases, off-balance sheet credit
NOTES TO CONSOLIDATED FINANCIAL STATEMENTS
52

exposures, reinsurance receivables and any other financial assets not excluded from the scope that have the contractual right to receive cash. The adoption of this guidance did not have a material impact on our financial statements.
In August 2018, the FASB issued ASU 2018-13, Fair Value Measurement (Topic 820): Disclosure Framework—Changes to the Disclosure Requirements for Fair Value Measurement, new accounting guidance to improve the effectiveness of disclosures related to fair value measurements. The new guidance removes certain disclosure requirements related to transfers between Level 1 and Level 2 of the fair value hierarchy along with the policy for timing of transfers between levels and the valuation processes for Level 3 fair value measurements. Additions to the disclosure requirements include more quantitative information related to significant unobservable inputs used in Level 3 fair value measurements and gains and losses included in other comprehensive income. The adoption of this guidance did not have a material impact on our financial statements.
In August 2018, the FASB issued ASU 2018-14, Compensation—Retirement Benefits—Defined Benefit Plans—General (Subtopic 715-20): Disclosure Framework—Changes to the Disclosure Requirements for Defined Benefit Plans, new accounting guidance to improve the effectiveness of disclosures related to defined benefit plans by eliminating certain required disclosures, clarifying existing disclosures, and adding new disclosures. Changes include removing disclosures related to the amounts in accumulated other comprehensive income expected to be recognized in the next fiscal year, adding narrative disclosure of the reasons for significant gains and losses related to changes in the defined benefit obligation, and clarifying the disclosures required for plans with projected and accumulated benefit obligations in excess of plan assets. The adoption of this guidance did not have a material impact on our financial statements.
Recent Accounting Pronouncements Adopted in 2019
In February 2016, the FASB issued ASU 2016-02, Leases (Topic 842), along with several updates, which, in an effort to increase transparency and comparability among organizations utilizing leasing, requires an entity that is a lessee to recognize the assets and liabilities arising from operating leases on the balance sheet. This guidance also requires disclosures about the amount, timing and uncertainty of cash flows arising from leases. In transition, the entity may elect to recognize and measure leases at the beginning of the earliest period presented using a modified retrospective approach or the beginning of the period of adoption using a cumulative-effect adjustment approach. We adopted the new standard on December 31, 2018 and recognized and measured leases at the beginning of the period of adoption. We elected the package of practical expedients available under the transition guidance which, among other things, allows the carry-forward of historical lease classification. The Company also elected the practical expedient allowing use of hindsight in assessing the lease term. We made an accounting policy election to not apply the new guidance to leases with a term of 12 months or less and will recognize those payments in the Consolidated Statement of Income on a straight-line basis over the lease term. We implemented a system solution for administering our leases and facilitating compliance with the new guidance. Adoption of the standard had a material impact on our Consolidated Balance Sheets as a result of the increase in assets and liabilities from recognition of operating lease assets and operating lease liabilities. However, the standard did not have a material impact on our Consolidated Statement of Income.
In August 2017, the FASB issued ASU 2017-12, Derivatives and Hedging (Topic 815): Targeted Improvements to Accounting for Hedging Activities, an accounting standard update that simplifies the application of hedge accounting guidance in current U.S. GAAP and improves the reporting of hedging relationships to better portray the economic results of an entity’s risk management activities in its financial statements. Among the simplification updates, the standard eliminates the requirement in current U.S. GAAP to separately recognize periodic hedge ineffectiveness. Mismatches between the changes in value of the hedged item and hedging instrument may still occur but they will no longer be separately reported. The standard requires the presentation of the earnings effect of the hedging instrument in the same income statement line item in which the earnings effect of the hedged item is reported. The standard is effective for annual and interim reporting periods beginning after December 15, 2018, but early adoption is permitted. We have adopted this standard as of December 31, 2018. The adoption of this guidance did not have a material impact on our financial statements.
In February 2018, the FASB issued ASU 2018-02, Income Statement—Reporting Comprehensive Income (Topic 220): Reclassification of Certain Tax Effects from Accumulated Other Comprehensive Income, an accounting standard update that allows a reclassification from accumulated other comprehensive income to retained earnings for stranded tax effects resulting from the U.S. Tax Cuts and Jobs Act. The Company will not reclassify the stranded tax effects associated with the U.S. Tax Cuts and Jobs Act from accumulated other comprehensive income to retained earnings. We adopted this standard as of December 31, 2018. The adoption of this guidance did not have a material impact on our financial statements.
In July 2018, the FASB issued ASU 2018-07, Compensation—Stock Compensation (Topic 718): Improvements to Nonemployee Share-Based Payment Accounting, an accounting standard update to improve non-employee share-based payment accounting. The accounting standard update more closely aligns the accounting for employee and non-employee share based payments. The accounting standards update is effective as of the beginning of our 2019 calendar year with early adoption
NOTES TO CONSOLIDATED FINANCIAL STATEMENTS
53

permitted. We adopted this standard as of December 31, 2018. The adoption of this guidance did not have a material impact on our financial statements.
Recent Accounting Pronouncements Adopted in 2018
In May 2014, the FASB issued ASU 2014-09, Revenue from Contracts with Customers (Topic 606), which provides for a single five-step model to be applied to all revenue contracts with customers. The new standard also requires additional financial statement disclosures that will enable users to understand the nature, amount, timing and uncertainty of revenue and cash flows relating to customer contracts. Companies have an option to use either a retrospective approach or cumulative effect adjustment approach to implement the standard. We adopted this as of January 1, 2018, the beginning of our 2018 fiscal year, using the cumulative effect adjustment, often referred to as modified retrospective approach. Under this method, we did not restate the prior financial statements presented, and would record any adjustments in the opening balance sheet for January 2018. There was no cumulative effect to be recorded as an adjustment to the opening balance of retained earnings. The comparative information was not restated and continues to be presented under the accounting standards in effect for those periods. Additional disclosures will include the amount by which each financial statement line item is affected in the current reporting period during 2018, as compared to the prior guidance. We expect minimal impact from the adoption of the new standard to the financial statements on a go forward basis, except for expanded disclosures. Revenue is currently recognized at destination and will continue to be recognized at point in time under the new guidance. Additional information regarding revenue recognition is included in “Note 3. Revenue Recognition.”
Recent Accounting Pronouncements Not Yet Adopted as of December 27, 2020
In December 2019, the FASB issued ASU 2019-12, Simplifying the Accounting for Income Taxes, which is intended to improve consistency and simplify several areas of existing guidance. ASU 2019-12 removes certain exceptions to the general principles related to the approach for intraperiod tax allocation, the methodology for calculating income taxes in an interim period and the recognition of deferred tax liabilities for outside basis differences. The new guidance also clarifies the accounting for transactions that result in a step-up in the tax basis of goodwill. ASU 2019-12 is effective for annual reporting periods beginning after December 15, 2020, including interim periods within those fiscal years, with early adoption permitted. We are currently evaluating the effect that the ASU 2019-12 will have on our consolidated financial statements.
In March 2020, the FASB issued ASU 2020-04, Reference Rate Reform (Topic 848): Facilitation of the Effects of Reference Rate Reform on Financial Reporting, which provides optional expedients and exceptions to the application of current GAAP to existing contracts, hedging relationships and other transactions affected by reference rate reform. The new guidance will ease the transition to new reference rates by allowing entities to update contracts and hedging relationships without applying many of the contract modification requirements specific to those contracts. The provisions of the new guidance will be effective beginning March 12, 2020, extending through December 31, 2022 with the option to apply the guidance at any point during that time period. Once an entity elects an expedient or exception it must be applied to all eligible contracts or transactions. We currently have hedging transactions and debt agreements that reference LIBOR and will apply the new guidance as these contracts are modified to reference other rates.
2. BUSINESS ACQUISITIONS
Tulip Limited
On October 15, 2019, the Company acquired 100% of the equity of Tulip Limited and its subsidiaries (together “Tulip”) from Danish Crown AmbA for £311.3 million, or $393.3 million, subject to customary working capital adjustments. The acquisition was funded with cash on hand. Tulip, which has subsequently changed its name to Pilgrim’s Pride Ltd. (“PPL”), is a leading, integrated prepared pork supplier headquartered in Warwick, U.K. The acquisition solidifies Pilgrim's as a leading European food company, creating one of the largest integrated prepared foods businesses in the U.K. The PPL operations are included in the Company’s U.K. and Europe reportable segment.
Transaction costs incurred in conjunction with the acquisition were approximately $1.4 million. These costs were expensed as incurred and are reflected within Selling, general and administrative expense in the Company’s Consolidated Statements of Income.
The results of operations of the acquired business since October 15, 2019 are included in the Company’s Consolidated Statements of Income. Net sales and net income generated by the acquired business during 2020 totaled $1.4 billion and $9.6 million, respectively.
The assets acquired and liabilities assumed in the acquisition were measured at their fair values as of October 15, 2019 as set forth below. The excess of the fair values of the net tangible assets and identifiable intangible assets over the purchase
NOTES TO CONSOLIDATED FINANCIAL STATEMENTS
54
price was recorded as gain on bargain purchase in the Company’s U.K. and Europe reportable segment. The fair values recorded were determined based upon various external and internal valuations. The fair values recorded for the assets acquired and liabilities assumed for PPL are as follows (in thousands):
The fair values recorded for the assets acquired and liabilities assumed for PPL are as follows (in thousands):
Cash and cash equivalents $ 6,854 Trade accounts and other receivables 146,423 Inventories 104,211 Prepaid expenses and other current assets 6,579 Operating lease assets 5,613 Property, plant and equipment 329,711 Identified intangible assets 40,418 Other assets 14,647 Total assets acquired 654,456
Accounts payable 110,296 Other current liabilities 55,830 Operating lease liabilities 5,613 Deferred tax liabilities 16,804 Pension obligations 18,435 Other long-term liabilities 1,056 Total liabilities assumed 208,034 Total identifiable net assets 446,422 Gain on bargain purchase (53,134) Total consideration transferred $ 393,288
The Company performed a valuation of the assets and liabilities of PPL as of October 15, 2019. Significant assumptions used in the valuation and the bases for their determination are summarized as follows:
Property, plant and equipment, net. Property, plant and equipment at fair value gave consideration to the highest and best use of the assets. The valuation of PPL’s real property improvements and the majority of its personal property was based on the cost approach. The valuation of PPL’s land, as if vacant, and certain personal property assets was based on the market or sales comparison approach.
Customer relationships. The Company valued PPL customer relationships using the income approach, specifically the multi-period excess earnings model. Under this model, the fair value of the customer relationships asset was determined by estimating the net cash inflows from the relationships discounted to present value. In estimating the fair value of the customer relationships, net sales related to existing PPL customers were estimated to grow at a rate of 2.0% annually, but the Company also anticipates losing existing PPL customers at an attrition rate of 10.0%. Income taxes were estimated at 18.0% of pre-tax income in 2020 and 17.0% of pre-tax income thereafter and net cash flows attributable to PPL’s existing customers were discounted using a rate of 22.0%. The resulting customer relationships intangible asset has a fair value of $40.4 million and a useful life of 11 years.
See “Note 9. Goodwill and Intangible Assets” for additional information regarding the goodwill and intangible assets recognized by the Company in the acquisition.
The following unaudited pro forma information presents the combined financial results for the Company and PPL as if the acquisition had been completed at the beginning of 2018:
NOTES TO CONSOLIDATED FINANCIAL STATEMENTS
55

2020 2019 2018
(In thousands, except per share amounts)
Net sales $ 12,091,901 $ 12,462,566 $ 12,342,474 Net income attributable to Pilgrim's Pride Corporation 97,038 344,869 189,152 Net income attributable to Pilgrim's Pride Corporation per common share - diluted 0.39 1.38 0.76
The above unaudited pro forma financial information is presented for informational purposes only and does not purport to represent what the Company’s results of operations would have been had it completed the acquisitions on the date assumed, nor is it necessarily indicative of the results that may be expected in future periods. Pro forma adjustments exclude cost savings from any synergies resulting from the acquisitions.
FAMPAT/Plan Pro
On April 1, 2020, Avícola Pilgrim's Pride de Mexico S.A. de C.V. acquired 100% of the equity of FAMPAT S.A. de C.V. and Plan Pro Restaurantes S.A. de C.V. (together, “FAMPAT/Plan Pro”) for an aggregate purchase price of 70.4 million Mexican pesos, or $3.0 million. The acquisition was funded with cash on hand. Transaction costs were immaterial; these costs were expensed as incurred and are reflected within Selling, general and administrative expense in the Company’s Consolidated Statements of Income. The acquired operations produce value-added products such as taquitos, enchiladas and pizza, bringing additional breadth and diversity to the Company's product portfolio. The results of operations and financial position of FAMPAT/Plan Pro have been included in the consolidated results of operations and financial position of the Company from the date of acquisition. The FAMPAT/Plan Pro operations are included in the Company’s Mexico reportable segment.
The allocation of the purchase price reflects fair value using Level 3 unobservable inputs and resulted in a fair value of goodwill of $2.2 million at the acquisition date, which is not deductible for income tax purposes. The values recorded were determined based on a valuation using management’s estimates and assumptions.
3. REVENUE RECOGNITION
The vast majority of the Company's revenue is derived from contracts which are based upon a customer ordering its products. See “Note 1. General” for more information regarding the Company’s policies for revenue recognition.
Disaggregated Revenue
Revenue has been disaggregated into the following categories to show how economic factors affect the nature, amount, timing and uncertainty of revenue and cash flows:
Year Ended December 27, 2020Domestic Export Net Sales
(In thousands)
U.S. $ 7,189,539 $ 306,478 $ 7,496,017 U.K. and Europe 2,976,878 297,414 3,274,292 Mexico 1,321,592 — 1,321,592 Net sales $ 11,488,009 $ 603,892 $ 12,091,901
Year Ended December 29, 2019Domestic Export Net Sales
(In thousands)
U.S. $ 7,353,925 $ 282,791 $ 7,636,716 U.K. and Europe 2,105,578 278,215 2,383,793 Mexico 1,388,710 — 1,388,710 Net sales $ 10,848,213 $ 561,006 $ 11,409,219
Shipping and Handling Costs
See “Note 1. General” for more information regarding shipping and handling costs.
Contract Costs
NOTES TO CONSOLIDATED FINANCIAL STATEMENTS
56

The Company can incur incremental costs to obtain or fulfill a contract such as broker expenses that are not expected to be recovered. The amortization period for such expenses is less than one year; therefore, the costs are expensed as incurred.
Taxes
There is no change in accounting for taxes due to the adoption of the new revenue standard, as there is no material change to the timing of revenue recognition. The Company excludes all taxes assessed by a governmental authority that are both imposed on and concurrent with a specific revenue-producing transaction and collected by the entity from a customer (for example, sales, use, value added and some excise taxes) from the transaction price.
Contract Balances
The Company receives payment from customers based on terms established with the customer. Payments are typically due within two weeks of delivery. There are rarely contract assets related to costs incurred to perform in advance of scheduled billings. Revenue contract liabilities relate to payments received in advance of satisfying the performance under the customer contract. The revenue contract liability relates to customer prepayments and the advanced consideration received from governmental agency contracts for which performance obligations to the end customer have not been satisfied.
Changes in the revenue contract liability balances for the years ended December 27, 2020 and December 29, 2019 were as follows:
December 27, 2020 December 29, 2019(In thousands)
Balance, beginning of year $ 41,770 $ 33,328 Revenue recognized (32,816) (57,074) Cash received, excluding amounts recognized as revenue during the period 56,964 65,516
Balance, end of year $ 65,918 $ 41,770
Accounts Receivable
See “Note 1. General” for more information regarding the Company’s policies for accounts receivable.
4. LEASES
The Company is party to operating lease agreements for warehouses, office space, vehicle maintenance facilities and livestock growing farms in the U.S., distribution centers, hatcheries and office space in Mexico and farms, processing facilities and office space in the U.K. and Europe. Additionally, the Company leases equipment, over-the-road transportation vehicles and other assets in all three reportable segments. The Company is also party to a limited number of finance lease agreements in the U.S.
The Company’s leases have remaining lease terms of one year to 15 years, some of which may include options to extend the lease for up to one year and some of which may include options to terminate the lease within one year. The exercise of options to extend lease terms is at the Company’s sole discretion. Certain leases also include options to purchase the leased property.
Certain lease agreements include rental payment increases over the lease term that can be either fixed or variable. Fixed payment increases and variable payment increases based on an index or rate are included in the initial lease liability using the index or rate at commencement date. Variable payment increases not based on an index are recognized as incurred. Certain lease agreements contain residual value guarantees, primarily vehicle and transportation equipment leases.
The following table presents components of lease expense (in thousands). Operating lease cost, finance lease amortization and finance lease interest are respectively included in Cost of sales, Selling, general and administrative expense and Interest expense, net of capitalized interest in the Consolidated Statements of Income.
NOTES TO CONSOLIDATED FINANCIAL STATEMENTS
57

December 27, 2020 December 29, 2019
Operating lease cost(a) $ 90,887 $ 99,242 Amortization of finance lease assets 436 167 Interest on finance leases 99 32 Short-term lease cost 64,410 59,225 Variable lease cost 3,839 3,031
Net lease cost $ 159,671 $ 161,697 (a) Sublease income is immaterial and not included in operating lease costs.
The weighted-average remaining lease term and discount rate for lease liabilities included in our Consolidated Balance Sheets are as follows:
December 27, 2020 December 29, 2019
Weighted-average remaining lease term (years):Operating leases 5.44 5.77Finance leases 3.69 4.54
Weighted-average discount rate:Operating leases 4.53% 4.80%Finance leases 5.08% 5.21%
Supplemental cash flow information related to leases is as follows (in thousands):
Year EndedDecember 27, 2020 December 29, 2019
Cash paid for amounts included in the measurement of lease liabilities:Operating cash flows from operating leases $ 91,254 $ 100,473 Operating cash flow from finance leases 99 32 Financing cash flows from finance leases 486 167
Operating lease assets obtained in exchange for operating lease liabilities $ 60,776 $ 34,648 Finance lease assets obtained in exchange for finance lease liabilities — 2,182
Future minimum lease payments under noncancelable leases as of December 27, 2020 are as follows (in thousands):
Operating Leases Finance Leases
For the fiscal years ending December:2021 $ 83,116 $ 494 2022 68,373 494 2023 56,235 494 2024 42,328 347 2025 29,261 — Thereafter 46,890 —
Total future minimum lease payments 326,203 1,829 Less: imputed interest (37,179) (165)
Present value of lease liabilities $ 289,024 $ 1,664
Lease liabilities as of December 27, 2020 are included in our Consolidated Balance Sheets as follows (in thousands):
Operating Leases Finance Leases(a)
Accrued expenses and other current liabilities $ 71,592 $ — Current maturities of long-term debt — 420 Noncurrent operating lease liability, less current maturities 217,432 — Long-term debt, less current maturities — 1,244
Total lease liabilities $ 289,024 $ 1,664
NOTES TO CONSOLIDATED FINANCIAL STATEMENTS
58

(a) Additional information regarding finance lease assets is included in “Note 10. Property, Plant and Equipment.”
As of December 27, 2020, the Company had $1.7 million operating leases and no finance leases that have not yet commenced.
5. DERIVATIVE FINANCIAL INSTRUMENTS
The Company utilizes various raw materials in its operations, including corn, soybean meal, soybean oil, wheat, natural gas, electricity and diesel fuel, which are all considered commodities. The Company considers these raw materials generally available from a number of different sources and believes it can obtain them to meet its requirements. These commodities are subject to price fluctuations and related price risk due to factors beyond our control, such as economic and political conditions, supply and demand, weather, governmental regulation and other circumstances. Generally, the Company purchases derivative financial instruments, specifically exchange-traded futures and options, in an attempt to mitigate price risk related to its anticipated consumption of commodity inputs for approximately the next twelve months. The Company may purchase longer-term derivative financial instruments on particular commodities if deemed appropriate.
The Company has operations in Mexico, the U.K., France and the Netherlands. Therefore, it has exposure to translational foreign exchange risk when the financial results of those operations are remeasured in U.S. dollars. The Company has purchased foreign currency forward contracts to manage this translational foreign exchange risk.
The Company has exposure to variability in cash flows from interest payments due to the use of variable interest rates on certain long-term debt arrangements in the U.S. reportable segment. The Company has purchased an interest rate swap contract to convert the variable interest rate to a fixed interest rate on a portion of its outstanding long-term debt arrangements in order to manage this interest rate risk and add stability to interest expense and cash flows.
The fair value of derivative assets is included in the line item Prepaid expenses and other current assets on the Consolidated Balance Sheets while the fair value of derivative liabilities is included in the line item Accrued expenses and other current liabilities on the same statements. The Company’s counterparties require that it post collateral for changes in the net fair value of the derivative contracts. This cash collateral is reported in the line item Restricted cash and cash equivalents on the Consolidated Balance Sheets.
The Company has not designated certain derivative financial instruments that it has purchased to mitigate commodity purchase exposures in the U.S. and Mexico or foreign currency transaction exposures on our Mexico operations as cash flow hedges. Therefore, the Company recognized changes in the fair value of these derivative financial instruments immediately in earnings. Gains or losses related to the commodity derivative financial instruments are included in the line item Cost of sales in the Consolidated Statements of Income. Gains or losses related to the foreign currency derivative financial instruments are included in the line item Foreign currency transaction loss (gain) and Cost of sales in the Consolidated Statements of Income.
The Company has designated certain derivative financial instruments related to its U.K. and Europe reportable segment that it has purchased to mitigate foreign currency transaction exposures as cash flow hedges. Before the settlement date of the financial derivative instruments, the Company recognizes changes in the fair value of the effective portion of the cash flow hedge into accumulated other comprehensive income (“AOCI”) while it recognize changes in the fair value of the ineffective portion immediately in earnings. When the derivative financial instruments associated with the effective portion are settled, the amount in AOCI is then reclassified to earnings. Gains or losses related to these derivative financial instruments are included in the line item Net sales and Cost of sales in the Consolidated Statements of Income.
The Company has designated a derivative financial instrument related to its U.S. reportable segment that it has purchased to mitigate variable interest rate exposures as a cash flow hedge. The interest rate swap has monthly settlement dates. Upon each settlement date, the Company recognizes changes in the fair value of the effective portion of the cash flow hedge into AOCI, while it recognizes changes in the ineffective portion immediately in earnings. Upon settlement of the effective portion, the amount in AOCI is then reclassified to earnings. Gains or losses related to the interest rate swap derivative financial instrument are included in the line item Interest expense, net of capitalized interest in the Consolidated Statements of Income.
The Company recognized $40.7 million in net gains during 2020 and $30.1 million and $27.1 million in net losses related to changes in the fair value of its derivative financial instruments during 2019 and 2018, respectively.
Information regarding the Company’s outstanding derivative instruments and cash collateral posted with brokers is included in the following table:
NOTES TO CONSOLIDATED FINANCIAL STATEMENTS
59
December 27, 2020 December 29, 2019
(Fair values in thousands)
Fair values:Commodity derivative assets $ 24,059 $ 5,053 Commodity derivative liabilities (6,531) (5,430) Foreign currency derivative assets 2,204 426 Foreign currency derivative liabilities (428) (5,400) Interest rate swap derivative liabilities (640) — Cash collateral posted with brokers(a) 782 20,009
Derivatives Coverage(b):Corn 16.0 % 12.0 %Soybean meal 24.0 % 44.0 %Period through which stated percent of needs are covered:
Corn December 2021 December 2020Soybean meal December 2021 July 2020
(a) Collateral posted with brokers consists primarily of cash, short term treasury bills, or other cash equivalents. (b) Derivatives coverage is the percent of anticipated commodity needs covered by outstanding derivative instruments through a specified date.
The following tables present the components of the gain or loss on derivatives that qualify as cash flow hedges (in thousands):
Gain (Loss) Recognized in Other Comprehensive Loss on Derivative
December 27, 2020 December 29, 2019 December 30, 2018
Foreign currency derivatives $ 4,514 $ (2,052) $ 829 Interest rate swap derivatives (850) — —
Total $ 3,664 $ (2,052) $ 829
Gain (Loss) Reclassified from AOCI into Income
December 27, 2020 December 29, 2019 December 30, 2018
Foreign currency derivatives $ 2,873 $ (383) $ (348) Interest rate swap derivatives (209) — —
Total $ 2,664 $ (383) $ (348) As of December 27, 2020, the pre-tax deferred net gains on derivatives recorded in AOCI that are expected to be
reclassified to the Consolidated Statements of Income during the next twelve months are $0.7 million. This expectation is based on the anticipated settlements on the hedged investments in foreign currencies that will occur over the next twelve months, at which time the Company will recognize the deferred gains to earnings.
At December 27, 2020, the pre-tax deferred net losses on interest rate swap derivatives recorded in AOCI that are expected to be reclassified to the Consolidated Statements of Income during the next twelve months are $0.5 million. This expectation is based on the anticipated settlements on the hedged interest rate that will occur over the next twelve months, at which time the Company will recognize the deferred losses to earnings.
6. TRADE ACCOUNTS AND OTHER RECEIVABLES
Trade accounts and other receivables (including accounts receivable from related parties), less allowance for doubtful accounts, consisted of the following:
NOTES TO CONSOLIDATED FINANCIAL STATEMENTS
60

December 27, 2020
December 29, 2019
(In thousands)
Trade accounts receivable $ 691,499 $ 696,372 Notes receivable 25,712 4,187 Other receivables 31,954 48,189
Receivables, gross 749,165 748,748 Allowance for doubtful accounts (7,173) (7,467)
Receivables, net $ 741,992 $ 741,281
Accounts receivable from related parties(a) $ 1,084 $ 944 (a) Additional information regarding accounts receivable from related parties is included in “Note 18. Related Party Transactions.”
Changes in the allowance for doubtful accounts were as follows:
Total
(In thousands)
Balance, beginning of year $ (7,467) Provision charged to operating results (94) Account write-offs and recoveries 574 Effect of exchange rate (186) Balance, end of year $ (7,173)
7. INVENTORIES
Inventories consisted of the following:
December 27, 2020
December 29, 2019
(In thousands)
Raw materials and work-in-process $ 868,369 $ 800,749 Finished products 356,052 425,919 Operating supplies 66,495 82,447 Maintenance materials and parts 67,877 74,420
Total inventories $ 1,358,793 $ 1,383,535
8. INVESTMENTS IN SECURITIES
We recognize investments in available-for-sale securities as cash equivalents, current investments or long-term investments depending upon each security’s length to maturity. Additionally, those securities identified by management at the time of purchase for funding operations in less than one year are classified as current.
The following table summarizes our investments in available-for-sale securities accounted for as cash equivalents:
December 27, 2020 December 29, 2019
CostFair
Value CostFair
Value (In thousands)
Fixed income securities $ 178,677 $ 178,677 $ 159,623 $ 159,623
Securities classified as cash and cash equivalents mature within 90 days. Securities classified as short-term investments mature between 91 and 365 days. Securities classified as long-term investments mature after 365 days. The specific identification method is used to determine the cost of each security sold and each amount reclassified out of accumulated other comprehensive loss to earnings. Gross realized gains recognized during 2020 and 2019 related to the Company’s available-for-sale securities totaled $5.8 million and $11.5 million, respectively, while gross realized losses were immaterial. Proceeds received from the sale or maturity of available-for-sale securities investments during 2020 and 2019 are disclosed in the Consolidated Statements of Cash Flows. Net unrealized holding gains and losses on the Company’s available-for-sale securities recognized during 2020 and 2019 that have been included in accumulated other comprehensive loss and the net amount of gains
NOTES TO CONSOLIDATED FINANCIAL STATEMENTS
61

and losses reclassified out of accumulated other comprehensive loss to earnings during 2020 and 2019 are disclosed in “Note 14. Stockholders’ Equity.”
9. GOODWILL AND INTANGIBLE ASSETS
The activity in goodwill by reportable segment for the years ended December 27, 2020 and December 29, 2019 were as follows:
December 29, 2019 AdditionsCurrency
Translation December 27, 2020(In thousands)
U.S. $ 41,936 $ — $ — $ 41,936 U.K. and Europe 806,207 — 29,298 835,505 Mexico 125,607 2,197 — 127,804 Total $ 973,750 $ 2,197 $ 29,298 $ 1,005,245
December 30, 2018 AdditionsCurrency
Translation December 29, 2019(In thousands)
U.S. $ 41,936 $ — $ — $ 41,936 U.K. and Europe 782,207 — 24,000 806,207 Mexico 125,607 — — 125,607 Total $ 949,750 $ — $ 24,000 $ 973,750
Identified intangible assets consisted of the following:
December 29, 2019 Additions AmortizationCurrency
Translation December 27, 2020(In thousands)
Carrying amount: Trade names $ 78,343 $ — $ — $ — $ 78,343 Customer relationships 292,278 — — 4,784 297,062 Non-compete agreements 320 — — — 320 Trade names not subject to amortization 391,431 — — 13,809 405,240 Accumulated amortization: Trade names (45,518) — (1,968) — (47,486) Customer relationships (120,481) — (20,747) (2,018) (143,246) Non-compete agreements (320) — — — (320) Total $ 596,053 $ — $ (22,715) $ 16,575 $ 589,913
December 30, 2018 Additions AmortizationCurrency
Translation December 29, 2019(In thousands)
Carrying amount: Trade names $ 78,343 $ — $ — $ — $ 78,343 Customer relationships 247,706 40,418 — 4,154 292,278 Non-compete agreements 320 — — — 320 Trade names not subject to amortization 380,067 — — 11,364 391,431 Accumulated amortization: Trade names (43,552) — (1,966) — (45,518) Customer relationships (98,441) — (20,920) (1,120) (120,481) Non-compete agreements (315) — (5) — (320) Total $ 564,128 $ 40,418 $ (22,891) $ 14,398 $ 596,053
NOTES TO CONSOLIDATED FINANCIAL STATEMENTS
62

Additions shown in above table for 2019 are comprised of a customer relationships intangible asset recorded as part of the PPL acquisition. The Company valued this asset using the income approach resulting in a fair value of $40.4 million. The intangible asset has a useful life of eleven years. For additional information regarding the initial valuation and assumptions used, refer to “Note 2. Business Acquisitions.”
Intangible assets are amortized over the estimated useful lives of the assets as follows:
Customer relationships 3-16 yearsTrade names 20 yearsNon-compete agreements 3 years
The Company recognized amortization expense related to identified intangible assets of $22.7 million in 2020, $22.9 million in 2019 and $25.7 million in 2018.
The Company expects to recognize amortization expense associated with identified intangible assets of $23.3 million in 2021, $23.3 million in 2022, $22.3 million in 2023 and $21.2 million in 2024, and $21.2 million in 2025.
As of December 27, 2020, the Company assessed qualitative factors to determine if it was necessary to perform either the two-step quantitative impairment test related to the carrying amount of its goodwill or quantitative impairment tests related to the carrying amounts of its identified intangible assets not subject to amortization. Based on these assessments, the Company determined that it was not necessary to perform either the two-step quantitative impairment test related to the carrying amount of its goodwill nor the quantitative impairment tests related to the carrying amounts of its identified intangible assets not subject to amortization at that date.
As of December 27, 2020, the Company assessed if events or changes in circumstances indicated that the aggregate carrying amount of its identified intangible assets subject to amortization might not be recoverable. There were no indicators present that required the Company to test the recoverability of the aggregate carrying amount of its identified intangible assets subject to amortization at that date.
10. PROPERTY, PLANT AND EQUIPMENT
Property, plant and equipment (“PP&E”), net consisted of the following:
December 27, 2020 December 29, 2019 (In thousands)
Land $ 255,171 $ 222,076 Buildings 1,983,823 1,754,219 Machinery and equipment 3,230,199 3,139,748 Autos and trucks 73,647 64,122 Finance lease assets 2,182 2,182 Construction-in-progress 199,161 229,015
PP&E, gross 5,744,183 5,411,362 Accumulated depreciation (3,086,692) (2,819,301)
PP&E, net $ 2,657,491 $ 2,592,061
The Company recognized depreciation expense of $314.4 million, $264.3 million and $248.3 million during 2020, 2019 and 2018, respectively.
During 2020, the Company spent $354.8 million on capital projects and transferred $423.7 million of completed projects from construction-in-progress to depreciable assets. Capital expenditures were primarily incurred during 2020 to improve operational efficiencies and reduce costs. During 2019, the Company spent $348.1 million on capital projects and transferred $400.8 million of completed projects from construction-in-progress to depreciable assets.
During 2020, the Company sold certain PP&E for $32.0 million and recognized a gain of $13.8 million. PP&E sold in 2020 consisted of broiler farms in Mexico, vacant land in Alabama and other miscellaneous equipment. During 2019, the Company sold certain PP&E for $15.8 million and recognized a gain of $10.9 million. PP&E sold in 2019 included broiler farms in Mexico, a breeder farm in Texas, vacant land in Minnesota and miscellaneous equipment.
NOTES TO CONSOLIDATED FINANCIAL STATEMENTS
63

The Company has closed or idled various facilities in the U.S. and the U.K. Neither the Board of Directors nor JBS has determined if it would be in the best interest of the Company to divest any of these idled assets. Management is therefore not certain that it can or will divest any of these assets within one year, is not actively marketing these assets and, accordingly, has not classified them as assets held for sale. The Company continues to depreciate these assets. As of December 27, 2020, the carrying amount of these idled assets was $42.3 million based on depreciable value of $185.5 million and accumulated depreciation of $143.2 million.
As of December 27, 2020, the Company assessed if events or changes in circumstances indicated that the aggregate carrying amount of its property, plant and equipment held for use might not be recoverable. There were no indicators present that required the Company to test the recoverability of the aggregate carrying amount of its property, plant and equipment held for use at that date.
11. CURRENT LIABILITIES
Current liabilities, other than income taxes and current maturities of long-term debt, consisted of the following components:
December 27, 2020
December 29, 2019
(In thousands)
Accounts payable:Trade accounts $ 904,674 $ 875,374 Book overdrafts 106,435 98,267 Other payables 17,601 20,139
Total accounts payable 1,028,710 993,780 Accounts payable to related parties(a) 9,650 3,819 Revenue contract liabilities(b) 65,918 41,770 Accrued expenses and other current liabilities:
Compensation and benefits 189,767 164,946 Other accrued expenses(d) 150,074 172,510 DOJ agreement 110,524 — Nonrecurring legal settlement 75,000 — Current maturities of operating lease liabilities(c) 71,592 66,239 Taxes 67,812 41,901 Insurance and self-insured claims 61,212 67,332 Accrued sales rebates(d) 44,708 20,378 Interest and debt-related fees 29,559 31,183 Derivative liabilities(e) 7,599 10,830
Total accrued expenses and other current liabilities 807,847 575,319 Total current liabilities $ 1,912,125 $ 1,614,688
(a) Additional information regarding accounts payable to related parties is included in “Note 18. Related Party Transactions.”(b) Additional information regarding revenue contract liabilities is included in “Note 3. Revenue Recognition.”(c) Additional information regarding current maturities of operating lease liabilities is included in “Note 4. Leases.”(d) Accrued sales rebates contains a $20.4 million reclassification previously presented in Other accrued expenses on our annual Form 10-K report for
the year ended December 29, 2019 to conform to Current liabilities presented as of December 27, 2020.(e) Additional information regarding derivative liabilities is included in “Note 5. Derivative Financial Instruments.”
12. INCOME TAXES
Income (loss) before income taxes by jurisdiction is as follows:
NOTES TO CONSOLIDATED FINANCIAL STATEMENTS
64
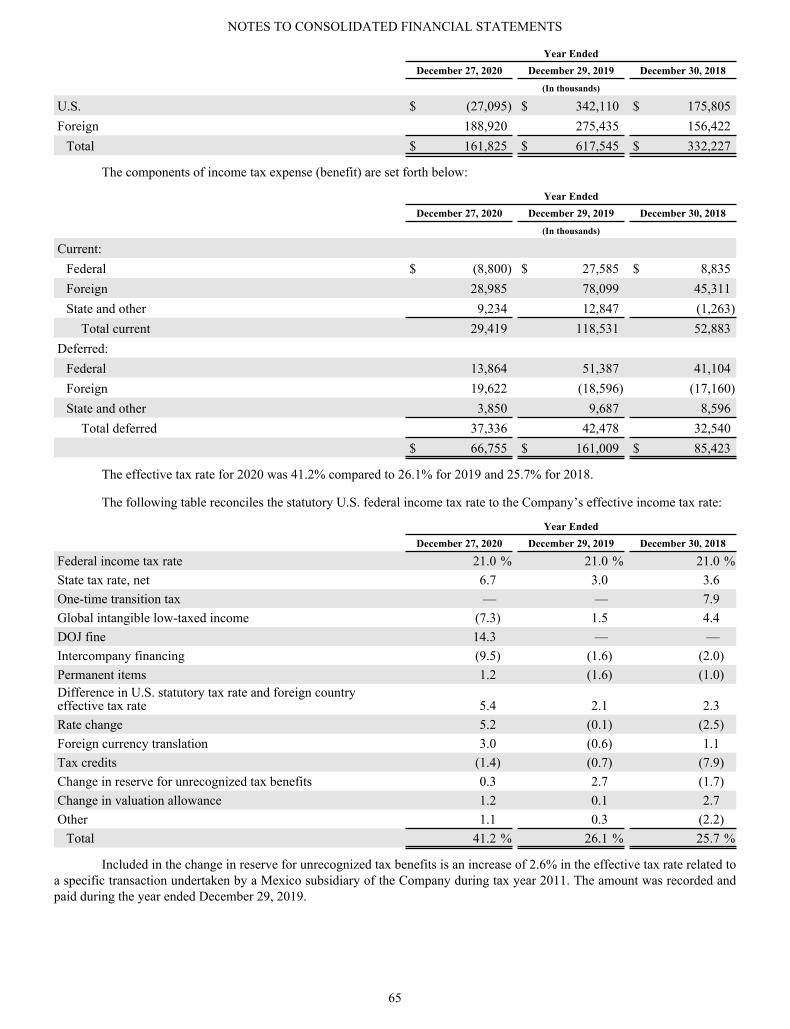
Year EndedDecember 27, 2020 December 29, 2019 December 30, 2018
(In thousands)
U.S. $ (27,095) $ 342,110 $ 175,805 Foreign 188,920 275,435 156,422
Total $ 161,825 $ 617,545 $ 332,227
The components of income tax expense (benefit) are set forth below:
Year EndedDecember 27, 2020 December 29, 2019 December 30, 2018
(In thousands)
Current:Federal $ (8,800) $ 27,585 $ 8,835 Foreign 28,985 78,099 45,311 State and other 9,234 12,847 (1,263)
Total current 29,419 118,531 52,883 Deferred:
Federal 13,864 51,387 41,104 Foreign 19,622 (18,596) (17,160) State and other 3,850 9,687 8,596
Total deferred 37,336 42,478 32,540 $ 66,755 $ 161,009 $ 85,423
The effective tax rate for 2020 was 41.2% compared to 26.1% for 2019 and 25.7% for 2018.
The following table reconciles the statutory U.S. federal income tax rate to the Company’s effective income tax rate:
Year EndedDecember 27, 2020 December 29, 2019 December 30, 2018
Federal income tax rate 21.0 % 21.0 % 21.0 %State tax rate, net 6.7 3.0 3.6 One-time transition tax — — 7.9 Global intangible low-taxed income (7.3) 1.5 4.4 DOJ fine 14.3 — — Intercompany financing (9.5) (1.6) (2.0) Permanent items 1.2 (1.6) (1.0) Difference in U.S. statutory tax rate and foreign country effective tax rate 5.4 2.1 2.3 Rate change 5.2 (0.1) (2.5) Foreign currency translation 3.0 (0.6) 1.1 Tax credits (1.4) (0.7) (7.9) Change in reserve for unrecognized tax benefits 0.3 2.7 (1.7) Change in valuation allowance 1.2 0.1 2.7 Other 1.1 0.3 (2.2)
Total 41.2 % 26.1 % 25.7 %
Included in the change in reserve for unrecognized tax benefits is an increase of 2.6% in the effective tax rate related to a specific transaction undertaken by a Mexico subsidiary of the Company during tax year 2011. The amount was recorded and paid during the year ended December 29, 2019.
NOTES TO CONSOLIDATED FINANCIAL STATEMENTS
65

Significant components of the Company’s deferred tax liabilities and assets are as follows:
December 27, 2020 December 29, 2019 (In thousands)
Deferred tax liabilities:PP&E and identified intangible assets $ 322,660 $ 290,427 Inventories 116,226 81,469 Insurance claims and losses 32,679 31,642 Business combinations 54,257 47,450 Incentive compensation 16,204 12,860 Operating lease assets 65,906 68,846 Other 26,968 14,267
Total deferred tax liabilities 634,900 546,961 Deferred tax assets:
U.S. net operating losses 3,034 3,120 Foreign net operating losses 56,213 50,806 Credit carry forwards 15,223 15,575 Allowance for doubtful accounts 4,005 5,429 Accrued liabilities 94,769 51,148 Workers’ compensation 36,759 36,147 Pension and other postretirement benefits 35,899 29,429 Operating lease liabilities 65,906 68,846 Other 21,640 22,502
Total deferred tax assets 333,448 283,002 Valuation allowance (32,908) (33,522)
Net deferred tax assets 300,540 249,480 Net deferred tax liabilities $ 334,360 $ 297,481
In assessing the realizability of deferred tax assets, management considers whether it is more likely than not that some portion or all of the deferred tax assets will not be realized. The ultimate realization of deferred tax assets is dependent upon the generation of future taxable income during the periods in which those temporary differences become deductible. Management considers the scheduled reversal of deferred tax liabilities (including the impact of available carry back and carry forward periods), projected future taxable income and tax-planning strategies in making this assessment.
As of December 27, 2020, the Company believes it has sufficient positive evidence to conclude that realization of its federal, state and foreign net deferred tax assets are more likely than not to be realized. As of December 27, 2020, the Company’s valuation allowance is $32.9 million, of which $12.4 million relates to Moy Park operations, $7.7 million relates to PPL operations, $11.8 million relates to U.S. foreign tax credits and $1.0 million relates to state net operating losses.
As of December 27, 2020, the Company had state net operating loss carry forwards of approximately $77.6 million that begin to expire in 2021. The Company also had Mexico net operating loss carry forwards as of December 27, 2020 of approximately $1.6 million that begin to expire in 2028. The Company also had U.K. net operating loss carry forwards as of December 27, 2020 of approximately $269.2 million that may be carried forward indefinitely.
As of December 27, 2020, the Company had approximately $3.3 million of state tax credit carry forwards that begin to expire in 2022.
For the year ended December 27, 2020 and year ended December 29, 2019, there is a tax effect of $6.9 million and $0.7 million, respectively, reflected in other comprehensive income.
For the year ended December 27, 2020, there are immaterial tax effects reflected in income tax expense due to excess tax benefits and shortfalls related to stock-based compensation. For the year ended December 29, 2019, there are immaterial tax effects reflected in income tax expense due to excess tax benefits and shortfalls related to stock-based compensation. See “Note 1. General” for additional information.
NOTES TO CONSOLIDATED FINANCIAL STATEMENTS
66
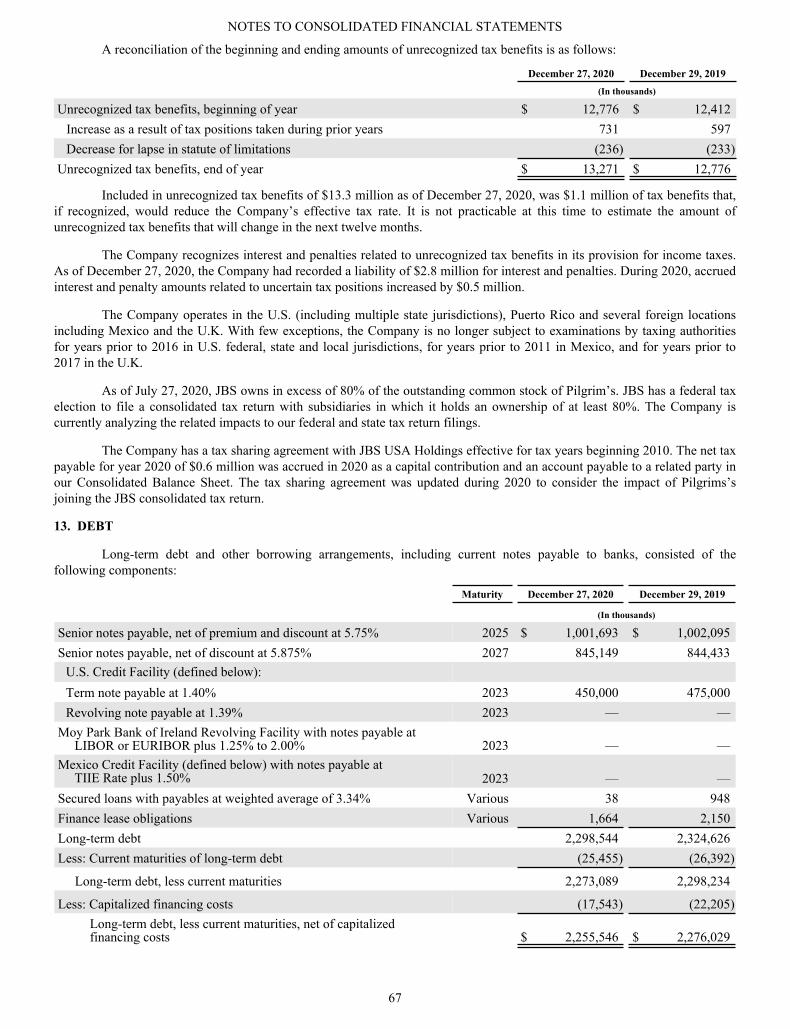
A reconciliation of the beginning and ending amounts of unrecognized tax benefits is as follows:
December 27, 2020 December 29, 2019 (In thousands)
Unrecognized tax benefits, beginning of year $ 12,776 $ 12,412 Increase as a result of tax positions taken during prior years 731 597 Decrease for lapse in statute of limitations (236) (233)
Unrecognized tax benefits, end of year $ 13,271 $ 12,776
Included in unrecognized tax benefits of $13.3 million as of December 27, 2020, was $1.1 million of tax benefits that, if recognized, would reduce the Company’s effective tax rate. It is not practicable at this time to estimate the amount of unrecognized tax benefits that will change in the next twelve months.
The Company recognizes interest and penalties related to unrecognized tax benefits in its provision for income taxes. As of December 27, 2020, the Company had recorded a liability of $2.8 million for interest and penalties. During 2020, accrued interest and penalty amounts related to uncertain tax positions increased by $0.5 million.
The Company operates in the U.S. (including multiple state jurisdictions), Puerto Rico and several foreign locations including Mexico and the U.K. With few exceptions, the Company is no longer subject to examinations by taxing authorities for years prior to 2016 in U.S. federal, state and local jurisdictions, for years prior to 2011 in Mexico, and for years prior to 2017 in the U.K.
As of July 27, 2020, JBS owns in excess of 80% of the outstanding common stock of Pilgrim’s. JBS has a federal tax election to file a consolidated tax return with subsidiaries in which it holds an ownership of at least 80%. The Company is currently analyzing the related impacts to our federal and state tax return filings.
The Company has a tax sharing agreement with JBS USA Holdings effective for tax years beginning 2010. The net tax payable for year 2020 of $0.6 million was accrued in 2020 as a capital contribution and an account payable to a related party in our Consolidated Balance Sheet. The tax sharing agreement was updated during 2020 to consider the impact of Pilgrims’s joining the JBS consolidated tax return.
13. DEBT
Long-term debt and other borrowing arrangements, including current notes payable to banks, consisted of the following components:
Maturity December 27, 2020 December 29, 2019
(In thousands)
Senior notes payable, net of premium and discount at 5.75% 2025 $ 1,001,693 $ 1,002,095 Senior notes payable, net of discount at 5.875% 2027 845,149 844,433
U.S. Credit Facility (defined below): Term note payable at 1.40% 2023 450,000 475,000 Revolving note payable at 1.39% 2023 — —
Moy Park Bank of Ireland Revolving Facility with notes payable at LIBOR or EURIBOR plus 1.25% to 2.00% 2023 — — Mexico Credit Facility (defined below) with notes payable at TIIE Rate plus 1.50% 2023 — — Secured loans with payables at weighted average of 3.34% Various 38 948 Finance lease obligations Various 1,664 2,150 Long-term debt 2,298,544 2,324,626 Less: Current maturities of long-term debt (25,455) (26,392)
Long-term debt, less current maturities 2,273,089 2,298,234
Less: Capitalized financing costs (17,543) (22,205) Long-term debt, less current maturities, net of capitalized financing costs $ 2,255,546 $ 2,276,029
NOTES TO CONSOLIDATED FINANCIAL STATEMENTS
67

U.S. Senior Notes
On March 11, 2015, the Company completed a sale of $500.0 million aggregate principal amount of its 5.75% senior notes due 2025. On September 29, 2017, the Company completed an add-on offering of $250.0 million of these senior notes. The issuance price of this add-on offering was 102.0%, which created gross proceeds of $255.0 million. The additional $5.0 million will be amortized over the remaining life of the senior notes. On March 7, 2018, the Company completed another add-on offering of $250.0 million of these senior notes (together with the senior notes issued in March 2015 and September 2017, the “Senior Notes due 2025”). The issuance price of this add-on offering was 99.25%, which created gross proceeds of $248.1 million. The $1.9 million discount will be amortized over the remaining life of the senior notes. Each issuance of the Senior Notes due 2025 is treated as a single class for all purposes under the 2015 Indenture (defined below) and have the same terms.
The Senior Notes due 2025 are governed by, and were issued pursuant to, an indenture dated as of March 11, 2015 by and among the Company, its guarantor subsidiaries and Regions Bank, as trustee (the “2015 Indenture”). The 2015 Indenture provides, among other things, that the Senior Notes due 2025 bear interest at a rate of 5.75% per annum from the date of issuance until maturity, payable semiannually in cash in arrears, beginning on September 15, 2015 for the Senior Notes due 2025 that were issued in March 2015 and beginning on March 15, 2018 for the Senior Notes due 2025 that were issued in September 2017 and March 2018.
On September 29, 2017, the Company completed a sale of $600.0 million aggregate principal amount of its 5.875% senior notes due 2027. On March 7, 2018, the Company completed an add-on offering of $250.0 million of these senior notes (together with the senior notes issued in September 2017, the “Senior Notes due 2027”). The issuance price of this add-on offering was 97.25%, which created gross proceeds of $243.1 million. The $6.9 million discount will be amortized over the remaining life of the Senior Notes due 2027. Each issuance of the Senior Notes due 2027 is treated as a single class for all purposes under the 2017 Indenture (defined below) and have the same terms.
The Senior Notes due 2027 are governed by, and were issued pursuant to, an indenture dated as of September 29, 2017 by and among the Company, its guarantor subsidiaries and Regions Bank, as trustee (the “2017 Indenture”). The 2017 Indenture provides, among other things, that the Senior Notes due 2027 bear interest at a rate of 5.875% per annum from the date of issuance until maturity, payable semiannually in cash in arrears, beginning on March 30, 2018 for the Senior Notes due 2027 that were issued in September 2017 and beginning on March 15, 2018 for the Senior Notes due 2027 that were issued in March 2018.
The Senior Notes due 2025 and the Senior Notes due 2027 are each guaranteed on a senior unsecured basis by the Company’s guarantor subsidiaries. In addition, any of the Company’s other existing or future domestic restricted subsidiaries that incur or guarantee any other indebtedness (with limited exceptions) must also guarantee the Senior Notes due 2025 and the Senior Notes due 2027. The Senior Notes due 2025 and the Senior Notes due 2027 and related guarantees are unsecured senior obligations of the Company and its guarantor subsidiaries and rank equally with all of the Company’s and its guarantor subsidiaries’ other unsubordinated indebtedness. The Senior Notes due 2025, the 2015 Indenture, the Senior Notes due 2027 and the 2017 Indenture also contain customary covenants and events of default, including failure to pay principal or interest on the Senior Notes due 2025 and the Senior Notes due 2027, respectively, when due, among others.
U.S. Credit Facility
On July 20, 2018, the Company, and certain of the Company’s subsidiaries entered into a Fourth Amended and Restated Credit Agreement (the “U.S. Credit Facility”) with CoBank, ACB, as administrative agent and collateral agent, and the other lenders party thereto. The U.S. Credit Facility provides for a $750.0 million revolving credit commitment and a term loan commitment of up to $500.0 million (the “Term Loans”). The Company used the proceeds from the term loan commitment under the U.S. Credit Facility, together with cash on hand, to repay the outstanding loans under the Company’s previous credit agreement with Coöperatieve Rabobank U.A., New York Branch, as administrative agent, and the other lenders and financial institutions party thereto.
The U.S. Credit Facility includes an accordion feature that allows the Company, at any time, to increase the aggregate revolving loan and term loan commitments by up to an additional $1.25 billion, subject to the satisfaction of certain conditions, including obtaining the lenders’ agreement to participate in the increase.
The revolving loan commitment under the U.S. Credit Facility matures on July 20, 2023. All principal on the Term Loans is due at maturity on July 20, 2023. Installments of principal are required to be made, in an amount equal to 1.25% of the original principal amount of the Term Loans, on a quarterly basis prior to the maturity date of the Term Loans. Covenants in the U.S. Credit Facility also require the Company to use the proceeds it receives from certain asset sales and specified debt or equity issuances and upon the occurrence of other events to repay outstanding borrowings under the U.S. Credit Facility. As of
NOTES TO CONSOLIDATED FINANCIAL STATEMENTS
68

December 27, 2020, the Company had outstanding borrowings under the term loan commitment of $450.0 million. As of December 27, 2020, the Company had outstanding letters of credit and available borrowings under the revolving credit commitment of $39.7 million and $710.3 million, respectively.
The U.S. Credit Facility includes a $75.0 million sublimit for swingline loans and a $125.0 million sublimit for letters of credit. Outstanding borrowings under the revolving loan commitment and the Term Loans bear interest at a per annum rate equal to (1) in the case of LIBOR loans, LIBOR plus a margin based on the Company’s net senior secured leverage ratio, between LIBOR plus 1.25% and LIBOR plus 2.75% and (2) in the case of alternate base rate loans, the base rate plus a margin based on the Company’s net senior secured leverage ratio, between the base rate plus 0.25% and base rate plus 1.75% thereafter.
The U.S. Credit Facility contains customary financial and other various covenants for transactions of this type, including restrictions on the Company's ability to incur additional indebtedness, incur liens, pay dividends, make certain restricted payments, consummate certain asset sales, enter into certain transactions with the Company’s affiliates, or merge, consolidate and/or sell or dispose of all or substantially all of its assets, among other things. The U.S. Credit Facility requires the Company to comply with a minimum level of tangible net worth covenant. The U.S. Credit Facility also provides that the Company may not incur capital expenditures in excess of $500.0 million in any fiscal year.
All obligations under the U.S. Credit Facility continue to be unconditionally guaranteed by certain of the Company’s subsidiaries and continue to be secured by a first priority lien on (1) the accounts receivable and inventory of the Company and its non-Mexico subsidiaries, (2) 100% of the equity interests in the Company's domestic subsidiaries, To-Ricos, Ltd. and To-Ricos Distribution, Ltd., and 65% of the equity interests in its direct foreign subsidiaries and (3) substantially all of the assets of the Company and the guarantors under the U.S. Credit Facility. The Company is currently in compliance with the covenants under the U.S. Credit Facility.
Moy Park Bank of Ireland Revolving Facility Agreement
On June 2, 2018, Moy Park Holdings (Europe) Ltd. and its subsidiaries entered into an unsecured multicurrency revolving facility agreement (the “Bank of Ireland Facility Agreement”) with the Governor and Company of the Bank of Ireland, as agent, and the other lenders party thereto. The Bank of Ireland Facility Agreement provides for a multicurrency revolving loan commitment of up to £100.0 million. The multicurrency revolving loan commitments under the Bank of Ireland Facility Agreement mature on June 2, 2023. Outstanding borrowings under the Bank of Ireland Facility Agreement bear interest at a rate per annum equal to the sum of (1) LIBOR or, in relation to any loan in euros, EURIBOR, plus (2) a margin, ranging from 1.25% to 2.00% based on Leverage (as defined in the Bank of Ireland Facility Agreement). All obligations under the Bank of Ireland Facility Agreement are guaranteed by certain of Moy Park's subsidiaries. As of December 27, 2020, the U.S. dollar-equivalent loan commitment and borrowing availability were both $135.6 million. As of December 27, 2020, there were no outstanding borrowings under the Bank of Ireland Facility Agreement.
The Bank of Ireland Facility Agreement contains representations and warranties, covenants, indemnities and conditions that the Company believes are customary for transactions of this type. Pursuant to the terms of the Bank of Ireland Facility Agreement, Moy Park is required to meet certain financial and other restrictive covenants. Additionally, Moy Park is prohibited from taking certain actions without consent of the lenders, including, without limitation, incurring additional indebtedness, entering into certain mergers or other business combination transactions, permitting liens or other encumbrances on its assets and making restricted payments, including dividends, in each case except as expressly permitted under the Bank of Ireland Facility Agreement. The Bank of Ireland Facility Agreement contains events of default that the Company believes are customary for transactions of this type. If a default occurs, any outstanding obligations under the Bank of Ireland Facility Agreement may be accelerated.
Mexico Credit Facility
On December 14, 2018, certain of the Company's Mexican subsidiaries entered into an unsecured credit agreement (the “Mexico Credit Facility”) with Banco del Bajio, Sociedad Anónima, Institución de Banca Múltiple, as lender. The loan commitment under the Mexico Credit Facility is $1.5 billion Mexican pesos and can be borrowed on a revolving basis. Outstanding borrowings under the Mexico Credit Facility accrue interest at a rate equal to the 28-Day Interbank Equilibrium Interest Rate plus 1.50%. The Mexico Credit Facility contains covenants and defaults that the Company believes are customary for transactions of this type. The Mexico Credit Facility will be used for general corporate and working capital purposes. The Mexico Credit Facility will mature on December 14, 2023. As of December 27, 2020, the U.S. dollar-equivalent of the loan commitment under the Mexico Credit Facility is $75.5 million. As of December 27, 2020, there were no outstanding borrowings under the Mexico Credit Facility.
NOTES TO CONSOLIDATED FINANCIAL STATEMENTS
69

14. STOCKHOLDERS’ EQUITY
Accumulated Other Comprehensive Loss
The following tables provide information regarding the changes in accumulated other comprehensive loss during 2020 and 2019:
2020
Gains (Losses) Related to
Foreign Currency
Translation
Unrealized Losses on Derivative Financial
Instruments Classified as Cash Flow
Hedges
Losses Related to Pension and
Other Postretirement
Benefits
Unrealized Holding Gains on Available-
for-Sale Securities Total
(In thousands)
Balance, beginning of year $ (1,108) $ (2,406) $ (71,615) $ — $ (75,129) Other comprehensive income (loss) before reclassifications 83,890 3,823 (31,724) 55 56,044 Amounts reclassified from accumulated other comprehensive loss to net income — (2,664) 1,128 (55) (1,591) Currency translation — 56 — — 56
Net current year other comprehensive income (loss) 83,890 1,215 (30,596) — 54,509
Balance, end of year $ 82,782 $ (1,191) $ (102,211) $ — $ (20,620)
2019
Losses Related to Foreign Currency
Translation
Unrealized Losses on Derivative Financial
Instruments Classified as Cash Flow
Hedges
Losses Related to Pension and
Other Postretirement
Benefits
Unrealized Holding Gains on Available-
for-Sale Securities Total
(In thousands)
Balance, beginning of year $ (55,770) $ (683) $ (71,463) $ 82 $ (127,834) Other comprehensive income (loss) before reclassifications 54,662 (2,052) (1,145) 386 51,851 Amounts reclassified from accumulated other comprehensive loss to net income — 383 993 (468) 908 Currency translation — (54) — — (54) Net current year other comprehensive income (loss) 54,662 (1,723) (152) (82) 52,705
Balance, end of year $ (1,108) $ (2,406) $ (71,615) $ — $ (75,129)
NOTES TO CONSOLIDATED FINANCIAL STATEMENTS
70

Details about Accumulated Other Comprehensive Loss Components
Amount Reclassified from Accumulated Other Comprehensive Loss(a)
Affected Line Item in the Consolidated Statements of Income2020 2019
(In thousands)
Realized gain on settlement of foreign currency derivatives classified as cash flow hedges $ 2,987 $ — Net sales
Realized loss on settlement of foreign currency derivatives classified as cash flow hedges (114) (383) Cost of sales
Realized loss on settlement of interest rate swap derivatives classified as cash flow hedges (209) — Interest expense, net of capitalized interest
Realized gain on sale of securities 73 619 Interest income
Amortization of pension and other postretirement plan actuarial losses(b) (1,503) (1,313) Miscellaneous, net
Total before tax 1,234 (1,077) Tax expense 357 169 Total reclassification for the period $ 1,591 $ (908)
(a) Amounts in parentheses represent income (expenses) related to results of operations.(b) These accumulated other comprehensive loss components are included in the computation of net periodic pension cost. See “Note 15. Pension and
Other Postretirement Benefits.”
Share Repurchase Program and Treasury Stock
On October 31, 2018, the Company’s Board of Directors approved a $200.0 million share repurchase authorization. The Company plans to repurchase shares through various means, which may include but are not limited to open market purchases, privately negotiated transactions, the use of derivative instruments and/or accelerated share repurchase programs. The extent to which the Company repurchases its shares and the timing of such repurchases will vary and depend upon market conditions and other corporate considerations, as determined by the Company’s management team. The Company reserves the right to limit or terminate the repurchase program at any time without notice. As of December 27, 2020, the Company had repurchased approximately 6.3 million shares under this program with a market value of approximately $113.4 million. The Company accounted for the shares repurchased using the cost method. The Company currently plans to maintain these shares as treasury stock.
Restrictions on Dividends
Both the U.S. Credit Facility and the indentures governing the Company’s senior notes restrict, but do not prohibit, the Company from declaring dividends. Additionally, the Moy Park Multicurrency Revolving Facility Agreement restricts Moy Park’s ability and the ability of certain of Moy Park’s subsidiaries to, among other things, make payments and distributions to the Company.
15. PENSION AND OTHER POSTRETIREMENT BENEFITS
The Company sponsors programs that provide retirement benefits to most of its employees. These programs include qualified defined benefit pension plans such as the Pilgrim's Pride Retirement Plan for Union Employees (the “Union Plan”) the Pilgrim's Pride Pension Plan for Legacy Gold Kist Employees (the “GK Pension Plan”), the Tulip Limited Pension Plan and the Geo Adams Group Pension Fund (together, the “U.K. Plans”), nonqualified defined benefit retirement plans, a defined benefit postretirement life insurance plan and defined contribution retirement savings plan. Expenses recognized under all retirement plans totaled $17.4 million, $19.0 million and $12.1 million in 2020, 2019 and 2018, respectively.
The Company used a year-end measurement date of December 27, 2020 for its pension and postretirement benefits plans. Certain disclosures are listed below. Other disclosures are not material to the financial statements.
Qualified Defined Benefit Pension Plans
The Company sponsors four qualified defined benefit pension plans named the Pilgrim’s Pride Retirement Plan for Union Employees (the “Union Plan”), the Pilgrim’s Pride Pension Plan for Legacy Gold Kist Employees (the “GK Pension Plan”), the Tulip Limited Pension Plan (the “Tulip Plan”) and the Geo Adams Group Pension Fund (the “Geo Adams Plan” and, together with the Tulip Plan, the “U.K. Plans”). The Union Plan covers certain locations or work groups within PPC. The GK Pension Plan covers certain eligible U.S. employees who were employed at locations that the Company purchased through its acquisition of Gold Kist in 2007. Participation in the GK Pension Plan was frozen as of February 8, 2007 for all participants with the exception of terminated vested participants who are or may become permanently and totally disabled. The plan was
NOTES TO CONSOLIDATED FINANCIAL STATEMENTS
71

frozen for that group as of March 31, 2007. The U.K. Plans cover certain eligible active and former U.K. employees who were employed at locations that the Company purchased through its acquisition of Tulip in 2019. Participation in the Tulip Plan was frozen as of October 31, 2007 and participation in the Geo Adams Plan was frozen as of September 5, 2018.
Nonqualified Defined Benefit Pension Plans
The Company sponsors two nonqualified defined benefit retirement plans named the Former Gold Kist Inc. Supplemental Executive Retirement Plan (the “SERP Plan”) and the Former Gold Kist Inc. Directors’ Emeriti Retirement Plan (the “Directors’ Emeriti Plan”). Pilgrim’s Pride assumed sponsorship of the SERP Plan and Directors’ Emeriti Plan through its acquisition of Gold Kist in 2007. The SERP Plan provides benefits on compensation in excess of certain IRC limitations to certain former executives with whom Gold Kist negotiated individual agreements. Benefits under the SERP Plan were frozen as of February 8, 2007. The Directors’ Emeriti Plan provides benefits to former Gold Kist directors.
Defined Benefit Postretirement Life Insurance Plan
The Company sponsors one defined benefit postretirement life insurance plan named the Gold Kist Inc. Retiree Life Insurance Plan (the “Retiree Life Plan” and together with the Union Plan, the GK Pension Plan, the SERP Plan and the Directors’ Emeriti Plan, the “U.S. Plans”). Pilgrim’s Pride assumed defined benefit postretirement medical and life insurance obligations, including the Retiree Life Plan, through its acquisition of Gold Kist in 2007. In January 2001, Gold Kist began to substantially curtail its programs for active employees. On July 1, 2003, Gold Kist terminated medical coverage for retirees age 65 or older, and only retired employees in the closed group between ages 55 and 65 could continue their coverage at rates above the average cost of the medical insurance plan for active employees. These retired employees all reached the age of 65 in 2012 and liabilities of the postretirement medical plan then ended.
Defined Benefit Plans Obligations and Assets
The change in benefit obligation, change in fair value of plan assets, funded status and amounts recognized in the Consolidated Balance Sheets for these plans were as follows:
Pension Benefits Other Benefits
2020 2019 2020 2019
Change in projected benefit obligation: (In thousands)
Projected benefit obligation, beginning of year $ 369,066 $ 157,619 $ 1,527 $ 1,462 Interest cost 8,102 6,673 36 52 Actuarial losses 38,822 20,729 90 132 Benefits paid (13,745) (8,288) — — Curtailments and settlements (8,226) (10,076) (60) (119) Prior service cost 20 8 — — Tulip acquisition — 198,417 — — Currency translation loss 10,155 3,984 — —
Projected benefit obligation, end of year $ 404,194 $ 369,066 $ 1,593 $ 1,527
NOTES TO CONSOLIDATED FINANCIAL STATEMENTS
72
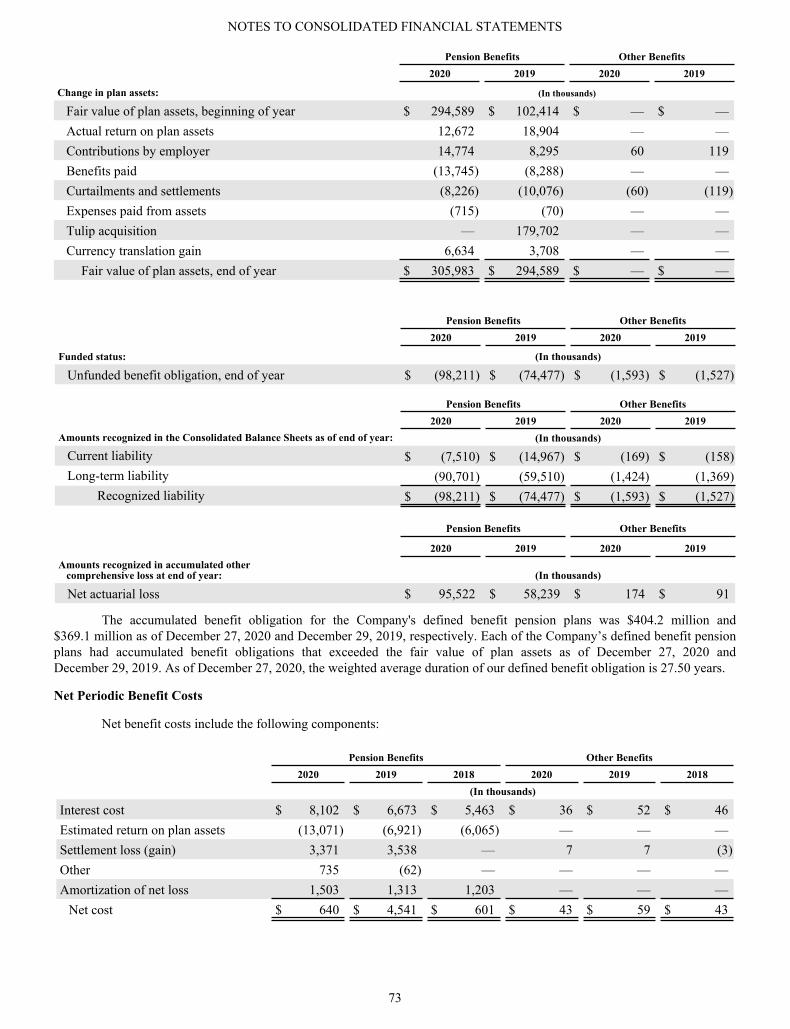
Pension Benefits Other Benefits 2020 2019 2020 2019
Change in plan assets: (In thousands)
Fair value of plan assets, beginning of year $ 294,589 $ 102,414 $ — $ — Actual return on plan assets 12,672 18,904 — — Contributions by employer 14,774 8,295 60 119 Benefits paid (13,745) (8,288) — — Curtailments and settlements (8,226) (10,076) (60) (119) Expenses paid from assets (715) (70) — — Tulip acquisition — 179,702 — — Currency translation gain 6,634 3,708 — —
Fair value of plan assets, end of year $ 305,983 $ 294,589 $ — $ —
Pension Benefits Other Benefits 2020 2019 2020 2019
Funded status: (In thousands)
Unfunded benefit obligation, end of year $ (98,211) $ (74,477) $ (1,593) $ (1,527)
Pension Benefits Other Benefits2020 2019 2020 2019
Amounts recognized in the Consolidated Balance Sheets as of end of year: (In thousands)
Current liability $ (7,510) $ (14,967) $ (169) $ (158) Long-term liability (90,701) (59,510) (1,424) (1,369)
Recognized liability $ (98,211) $ (74,477) $ (1,593) $ (1,527)
Pension Benefits Other Benefits
2020 2019 2020 2019Amounts recognized in accumulated other comprehensive loss at end of year: (In thousands)
Net actuarial loss $ 95,522 $ 58,239 $ 174 $ 91
The accumulated benefit obligation for the Company's defined benefit pension plans was $404.2 million and $369.1 million as of December 27, 2020 and December 29, 2019, respectively. Each of the Company’s defined benefit pension plans had accumulated benefit obligations that exceeded the fair value of plan assets as of December 27, 2020 and December 29, 2019. As of December 27, 2020, the weighted average duration of our defined benefit obligation is 27.50 years.
Net Periodic Benefit Costs
Net benefit costs include the following components:
Pension Benefits Other Benefits 2020 2019 2018 2020 2019 2018 (In thousands)
Interest cost $ 8,102 $ 6,673 $ 5,463 $ 36 $ 52 $ 46 Estimated return on plan assets (13,071) (6,921) (6,065) — — — Settlement loss (gain) 3,371 3,538 — 7 7 (3) Other 735 (62) — — — — Amortization of net loss 1,503 1,313 1,203 — — —
Net cost $ 640 $ 4,541 $ 601 $ 43 $ 59 $ 43
NOTES TO CONSOLIDATED FINANCIAL STATEMENTS
73
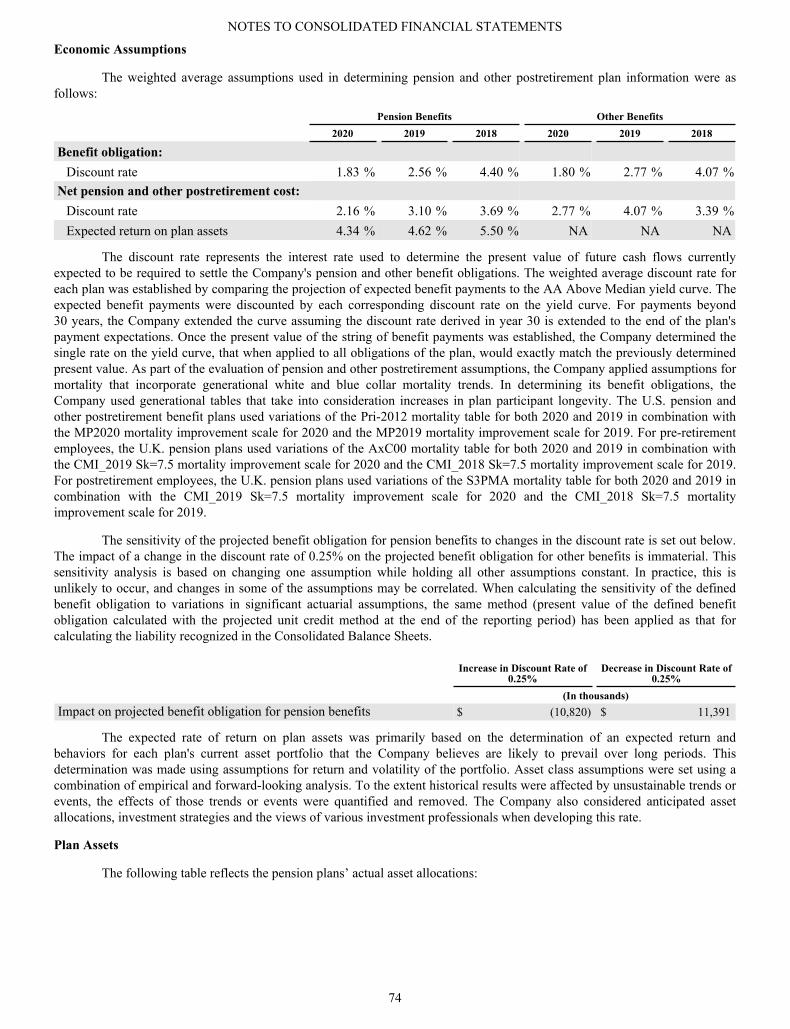
Economic Assumptions
The weighted average assumptions used in determining pension and other postretirement plan information were as follows:
Pension Benefits Other Benefits 2020 2019 2018 2020 2019 2018
Benefit obligation:Discount rate 1.83 % 2.56 % 4.40 % 1.80 % 2.77 % 4.07 %
Net pension and other postretirement cost:Discount rate 2.16 % 3.10 % 3.69 % 2.77 % 4.07 % 3.39 %Expected return on plan assets 4.34 % 4.62 % 5.50 % NA NA NA
The discount rate represents the interest rate used to determine the present value of future cash flows currently expected to be required to settle the Company's pension and other benefit obligations. The weighted average discount rate for each plan was established by comparing the projection of expected benefit payments to the AA Above Median yield curve. The expected benefit payments were discounted by each corresponding discount rate on the yield curve. For payments beyond 30 years, the Company extended the curve assuming the discount rate derived in year 30 is extended to the end of the plan's payment expectations. Once the present value of the string of benefit payments was established, the Company determined the single rate on the yield curve, that when applied to all obligations of the plan, would exactly match the previously determined present value. As part of the evaluation of pension and other postretirement assumptions, the Company applied assumptions for mortality that incorporate generational white and blue collar mortality trends. In determining its benefit obligations, the Company used generational tables that take into consideration increases in plan participant longevity. The U.S. pension and other postretirement benefit plans used variations of the Pri-2012 mortality table for both 2020 and 2019 in combination with the MP2020 mortality improvement scale for 2020 and the MP2019 mortality improvement scale for 2019. For pre-retirement employees, the U.K. pension plans used variations of the AxC00 mortality table for both 2020 and 2019 in combination with the CMI_2019 Sk=7.5 mortality improvement scale for 2020 and the CMI_2018 Sk=7.5 mortality improvement scale for 2019. For postretirement employees, the U.K. pension plans used variations of the S3PMA mortality table for both 2020 and 2019 in combination with the CMI_2019 Sk=7.5 mortality improvement scale for 2020 and the CMI_2018 Sk=7.5 mortality improvement scale for 2019.
The sensitivity of the projected benefit obligation for pension benefits to changes in the discount rate is set out below. The impact of a change in the discount rate of 0.25% on the projected benefit obligation for other benefits is immaterial. This sensitivity analysis is based on changing one assumption while holding all other assumptions constant. In practice, this is unlikely to occur, and changes in some of the assumptions may be correlated. When calculating the sensitivity of the defined benefit obligation to variations in significant actuarial assumptions, the same method (present value of the defined benefit obligation calculated with the projected unit credit method at the end of the reporting period) has been applied as that for calculating the liability recognized in the Consolidated Balance Sheets.
Increase in Discount Rate of 0.25%
Decrease in Discount Rate of 0.25%
(In thousands)Impact on projected benefit obligation for pension benefits $ (10,820) $ 11,391
The expected rate of return on plan assets was primarily based on the determination of an expected return and behaviors for each plan's current asset portfolio that the Company believes are likely to prevail over long periods. This determination was made using assumptions for return and volatility of the portfolio. Asset class assumptions were set using a combination of empirical and forward-looking analysis. To the extent historical results were affected by unsustainable trends or events, the effects of those trends or events were quantified and removed. The Company also considered anticipated asset allocations, investment strategies and the views of various investment professionals when developing this rate.
Plan Assets
The following table reflects the pension plans’ actual asset allocations:
NOTES TO CONSOLIDATED FINANCIAL STATEMENTS
74
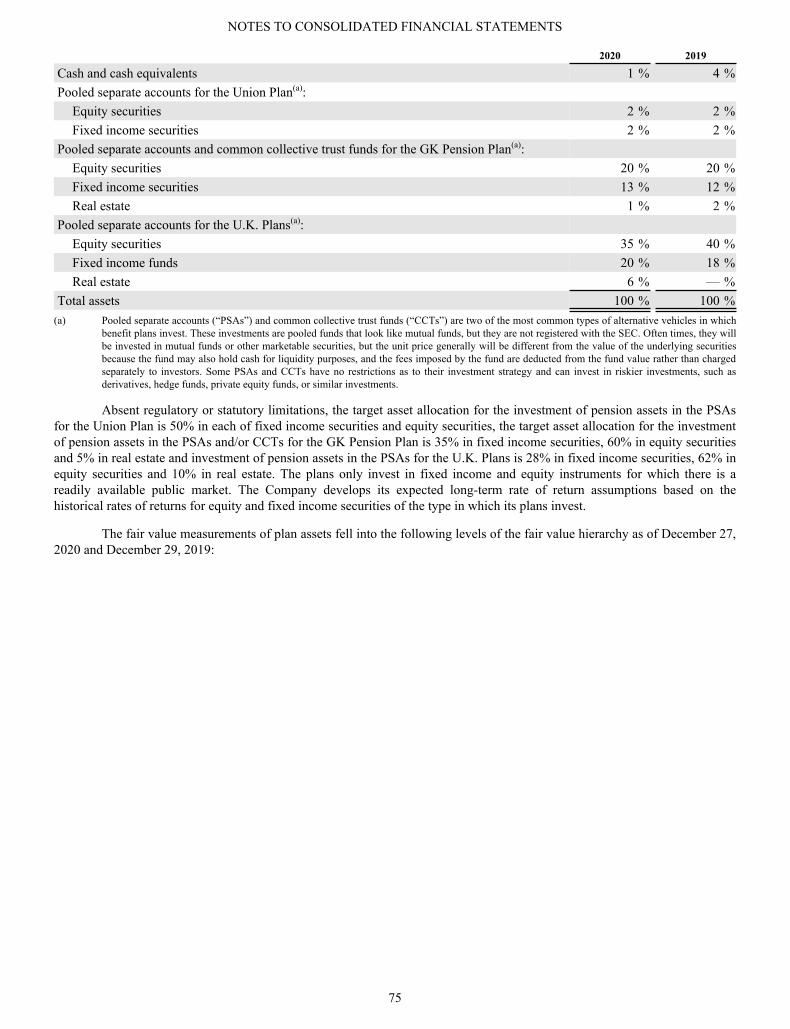
2020 2019
Cash and cash equivalents 1 % 4 %Pooled separate accounts for the Union Plan(a):
Equity securities 2 % 2 %Fixed income securities 2 % 2 %
Pooled separate accounts and common collective trust funds for the GK Pension Plan(a):Equity securities 20 % 20 %Fixed income securities 13 % 12 %Real estate 1 % 2 %
Pooled separate accounts for the U.K. Plans(a):Equity securities 35 % 40 %Fixed income funds 20 % 18 %Real estate 6 % — %
Total assets 100 % 100 %(a) Pooled separate accounts (“PSAs”) and common collective trust funds (“CCTs”) are two of the most common types of alternative vehicles in which
benefit plans invest. These investments are pooled funds that look like mutual funds, but they are not registered with the SEC. Often times, they will be invested in mutual funds or other marketable securities, but the unit price generally will be different from the value of the underlying securities because the fund may also hold cash for liquidity purposes, and the fees imposed by the fund are deducted from the fund value rather than charged separately to investors. Some PSAs and CCTs have no restrictions as to their investment strategy and can invest in riskier investments, such as derivatives, hedge funds, private equity funds, or similar investments.
Absent regulatory or statutory limitations, the target asset allocation for the investment of pension assets in the PSAs for the Union Plan is 50% in each of fixed income securities and equity securities, the target asset allocation for the investment of pension assets in the PSAs and/or CCTs for the GK Pension Plan is 35% in fixed income securities, 60% in equity securities and 5% in real estate and investment of pension assets in the PSAs for the U.K. Plans is 28% in fixed income securities, 62% in equity securities and 10% in real estate. The plans only invest in fixed income and equity instruments for which there is a readily available public market. The Company develops its expected long-term rate of return assumptions based on the historical rates of returns for equity and fixed income securities of the type in which its plans invest.
The fair value measurements of plan assets fell into the following levels of the fair value hierarchy as of December 27, 2020 and December 29, 2019:
NOTES TO CONSOLIDATED FINANCIAL STATEMENTS
75

2020 2019
Level 1(a) Level 2(b) Level 3(c) Total Level 1(a) Level 2(b) Level 3(c) Total
(In thousands)
Cash and cash equivalents $ 1,487 $ — $ — $ 1,487 $ 11,582 $ — $ — $ 11,582 PSAs for the Union Plan:
Large U.S. equity funds(d) — 3,100 — 3,100 — 3,071 — 3,071 Small/Mid U.S. equity funds(e) — 392 — 392 — 372 — 372 International equity funds(f) — 1,874 — 1,874 — 1,878 — 1,878 Fixed income funds(g) — 5,365 — 5,365 — 4,452 — 4,452
PSAs and CCTs for the GK Pension Plan:
Large U.S. equity funds(d) — 29,602 — 29,602 — 20,378 — 20,378 Small/Mid U.S. equity funds(e) — 17,569 — 17,569 — 12,495 — 12,495 International equity funds(f) — 16,320 — 16,320 — 25,149 — 25,149 Fixed income funds(g) — 38,944 — 38,944 — 35,627 — 35,627 Real estate(h) — 5,677 — 5,677 — 5,613 — 5,613
PSAs for the U.K. Plans:Large U.S. equity funds(d) — 39,002 — 39,002 — 17,756 — 17,756 International equity funds(f) — 69,251 — 69,251 — 102,494 — 102,494 Fixed income funds(e) — 60,212 — 60,212 — 53,722 — 53,722 Real estate(h) — 17,188 — 17,188 — — — —
Total assets $ 1,487 $ 304,496 $ — $ 305,983 $ 11,582 $ 283,007 $ — $ 294,589 (a) Unadjusted quoted prices in active markets for identical assets are used to determine fair value.(b) Quoted prices in active markets for similar assets and inputs that are observable for the asset are used to determine fair value.(c) Unobservable inputs, such as discounted cash flow models or valuations, are used to determine fair value.(d) This category is comprised of investment options that invest in stocks, or shares of ownership, in large, well-established U.S. companies. These
investment options typically carry more risk than fixed income options but have the potential for higher returns over longer time periods.(e) This category is generally comprised of investment options that invest in stocks, or shares of ownership, in small to medium-sized U.S. companies.
These investment options typically carry more risk than larger U.S. equity investment options but have the potential for higher returns.(f) This category is comprised of investment options that invest in stocks, or shares of ownership, in companies with their principal place of business or
office outside of the U.S.(g) This category is comprised of investment options that invest in bonds, or debt of a company or government entity (including U.S. and non-U.S.
entities). These investment options typically carry more risk than short-term fixed income investment options, but less overall risk than equities.(h) This category is comprised of investment options that invest in real estate investment trusts or private equity pools that own real estate. These long-
term investments are primarily in office buildings, industrial parks, apartments or retail complexes. These investment options typically carry more risk, including liquidity risk, than fixed income investment options.
Benefit Payments
The following table reflects the benefits as of December 27, 2020 expected to be paid through 2030 from the Company's pension and other postretirement plans. The Company’s pension plans are primarily funded plans. Therefore, anticipated benefits with respect to these plans will come primarily from the trusts established for these plans. The Company's other postretirement plans are unfunded. Therefore, anticipated benefits with respect to these plans will come from the Company’s own assets.
Pension Benefits
Other Benefits
(In thousands)
2021 $ 26,629 $ 169 2022 16,912 163 2023 16,411 156 2024 16,043 149 2025 15,612 140 2026-2030 71,456 555
Total $ 163,063 $ 1,332
NOTES TO CONSOLIDATED FINANCIAL STATEMENTS
76

As required by funding regulations or laws, the Company anticipates contributing $7.5 million and $0.2 million to its pension and other postretirement plans, respectively, during 2021.
Unrecognized Benefit Amounts in Accumulated Other Comprehensive Loss (Gain)
The amounts in accumulated other comprehensive loss that were not recognized as components of net periodic benefits cost and the changes in those amounts are as follows:
Pension Benefits Other Benefits
2020 2019 2018 2020 2019 2018
(In thousands)
Net actuarial loss (gain), beginning of year $ 58,239 $ 54,343 $ 54,235 $ 91 $ (34) $ 35 Amortization (1,503) (1,313) (1,203) — — — Settlement adjustments (3,371) (3,538) — (7) (7) 3 Actuarial loss (gain) 38,822 20,729 (15,635) 90 132 (72) Asset loss (gain) 400 (11,982) 16,946 — — — Net prior service cost 378 — — — — — Currency translation loss 2,557 — — — — —
Net actuarial loss (gain), end of year $ 95,522 $ 58,239 $ 54,343 $ 174 $ 91 $ (34)
Risk Management
Through its defined benefit plans, the Company is exposed to a number of risks, the most significant of which are detailed below:
Asset volatility. The plan liabilities are calculated using a discount rate set with reference to corporate bond yields; if plan assets under perform this yield, this will create a deficit. The pension plans hold a significant proportion of equities, which are expected to outperform corporate bonds in the long-term while contributing volatility and risk in the short-term. The Company monitors the level of investment risk but has no current plan to significantly modify the mixture of investments. The investment position is discussed more below.
Changes in bond yields. A decrease in corporate bond yields will increase plan liabilities, although this will be partially offset by an increase in the value of the plans’ bond holdings.
The investment position is managed and monitored by a committee of individuals from various departments. This group actively monitors how the duration and the expected yield of the investments are matching the expected cash outflows arising from the pension obligations. The group has not changed the processes used to manage its risks from previous periods. The group does not use derivatives to manage its risk. Investments are well diversified, such that the failure of any single investment would not have a material impact on the overall level of assets. The majority of equities are in U.S. large and small cap companies with some global diversification into international entities.
Remeasurement
The Company remeasures both plan assets and obligations on a quarterly basis.
Defined Contribution Plans
The Company sponsors two defined contribution retirement savings plans in the U.S. reportable segment for eligible U.S. and Puerto Rico employees. The Company maintains three postretirement plans for eligible employees in the Mexico reportable segment, as required by Mexico law, which primarily cover termination benefits. The Company maintains two defined contribution retirement savings plans in the U.K. and Europe reportable segment for eligible U.K. and Europe employees, as required by U.K. and Europe law. The Company’s expenses related to its defined contribution plans totaled $14.1 million, $13.7 million and $11.4 million in 2020, 2019 and 2018, respectively.
16. INCENTIVE COMPENSATION
The Company sponsors short-term incentive plans that provides the grant of either cash or stock-based bonus awards payable upon achievement of specified performance goals. Full-time, salaried exempt employees of the Company's U.S. operations who are selected by the administering committee are eligible to participate in the Pilgrim's Short Term Incentive
NOTES TO CONSOLIDATED FINANCIAL STATEMENTS
77

Plan (“STIP”). Certain full-time, salaried employees of the Company’s Mexico operations are eligible to participate in the Pilgrim’s Mexico Incentive Plan (“PMIP”). The Company assumed responsibility for the Moy Park Incentive Plan dated January 1, 2013, as amended (the “MPIP”) through its acquisition of Moy Park on September 8, 2017. As of December 27, 2020, the Company has accrued $27.9 million, $3.8 million and $2.9 million related to cash bonus awards that could potentially be awarded under the STIP, MPIP and PMIP, respectively.
The Company also sponsors a performance-based, omnibus long-term incentive plan that provides for the grant of a broad range of long-term equity-based and liability-based awards to the Company’s officers and other employees, members of the Board of Directors and any consultants (the “LTIP”). Awards that may be granted under the LTIP include “incentive stock options,” within the meaning of the IRC, nonqualified stock options, stock appreciation rights, restricted stock awards and restricted stock units (“RSUs”). Equity-based awards are converted into shares of the Company's common stock shortly after award vesting. Compensation cost to be recognized for an equity-based awards grant is determined by multiplying the number of awards granted by the closing price of a share of the Company's common stock on the award grant date. Liability-based awards granted under the LTIP are converted into cash shortly after award vesting. Compensation cost to be recognized for a liability-based awards grant is first determined by multiplying the number of awards granted by the closing price of a share of PPC’s common stock on the award grant date. However, the compensation cost to be recognized is adjusted at each subsequent milestone date (i.e., forfeiture date, vesting date or financial reporting date) by multiplying the number of awards granted by the closing price of a share of PPC’s common stock on the milestone date. On May 1, 2019, the Company's stockholders approved the Pilgrim’s Pride Corporation 2019 Long Term Incentive Plan (the “2019 LTIP”), which replaced the expiring Pilgrim’s Pride Corporation 2009 Long-Term Incentive Plan (the “2009 LTIP”). The 2019 LTIP became effective as of December 28, 2019. As of December 27, 2020, we have in reserve approximately 1.8 million shares of common stock for future issuance under the 2019 LTIP.
The following awards were outstanding during 2020:
Benefit PlanAward Type
Grant Date
Grant Date Fair
Value per
AwardVesting
ConditionVesting
Date
Intended Settlement
Method
Milestone Date Fair Value per
AwardAwards Granted
Performance Target
Achievement Award
Adjustment
Awards Forfeited to Date
2009 LTIP RSU 3/1/2018 $24.93 Service (a) Stock NA 163,764 — (51,473)
2009 LTIP RSU 3/1/2018 $24.93Performance/
Service (b) Stock NA 217,253 (53,381) (78,449)
2009 LTIP RSU 3/1/2018 $24.93Performance/
Service (c) Cash $19.35 66,272 (17,863) (15,235)
2009 LTIP RSU 5/10/2018 $21.54 Service (d) Stock NA 8,358 — —
2009 LTIP RSU 1/7/2019 $16.47Performance/
Service (e) Stock NA 414,620 39,620 (137,413)
2009 LTIP RSU 1/7/2019 $16.47Performance/
Service (f) Cash $19.35 109,654 13,705 —
2009 LTIP RSU 4/30/2019 $26.91 Service 7/1/2020 Cash $15.12 200,000 — —
2009 LTIP RSU 4/30/2019 $26.91Performance/
Service (g) Stock NA 470,000 — (470,000)
2009 LTIP RSU 5/24/2019 $27.86 Service (d) Stock NA 11,170 — —
2019 LTIP RSU 1/8/2020 $30.94Performance/
Service (h) Stock NA 195,140 — (33,729)
2019 LTIP RSU 1/8/2020 $30.94Performance/
Service (i) Cash $19.35 121,310 — —
2019 LTIP RSU 4/29/2020 $22.01 Service (d) Stock NA 13,630 — —
(a) The restricted stock units vest in ratable tranches on December 31, 2018, December 31, 2019 and December 31, 2020. Expected compensation cost related to these units totals $2.8 million based on a closing stock price for the Company’s common stock of $24.93 per share on March 1, 2018. Compensation cost will be amortized to profit/loss over the remaining vesting period.
(b) The restricted stock units vest in ratable tranches on December 31, 2019, December 31, 2020 and December 31, 2021. Expected compensation cost related to these units totals $2.1 million based on a closing stock price for the Company’s common stock of $24.93 per share on March 1, 2018. Compensation cost will be amortized to profit/loss over the remaining vesting period.
(c) The restricted stock units vest in ratable tranches on December 31, 2019, December 31, 2020 and December 31, 2021. Expected compensation cost related to these units totals $0.6 million based on a closing stock price for the Company's common stock of $19.35 per share on December 27, 2020. Compensation cost will be amortized to profit/loss over the remaining vesting period.
(d) These restricted stock units were granted to the non-employees who currently serve on the Company's Board of Directors. Each participating director's units will vest upon his departure from the Company's Board of Directors. Compensation cost was recognized in profit/loss upon the grant date.
NOTES TO CONSOLIDATED FINANCIAL STATEMENTS
78

(e) The restricted stock units vest in ratable tranches on December 31, 2020, December 31, 2021 and December 31, 2022. Expected compensation cost related to these units totals $5.2 million based on a closing stock price for the Company's common stock of $16.47 per share on January 7, 2019. Compensation cost will be amortized to profit/loss over the remaining vesting period.
(f) The restricted stock units vest in ratable tranches on December 31, 2020, December 31, 2021 and December 31, 2022. Expected compensation cost related to these units totals $2.1 million based on a closing stock price for the Company's common stock of $19.35 per share on December 27, 2020. Compensation cost will be amortized to profit/loss upon satisfaction of the performance conditions over the remaining vesting period.
(g) The restricted stock units were cancelled in their entirety by the Company's Board of Directors on December 8, 2020.(h) If performance conditions related to the Company's 2020 operating results are satisfied, the restricted stock units vest in ratable tranches on
December 31, 2021, December 31, 2022 and December 31, 2023. Expected compensation cost related to these units totals $5.0 million based on a closing stock price for the Company's common stock of $30.94 per share on January 8, 2020. Compensation cost will be amortized to profit/loss upon satisfaction of the performance conditions over the remaining vesting period.
(i) If performance conditions related to the Company's 2020 operating results are satisfied, the restricted stock units vest in ratable tranches on December 31, 2021, December 31, 2022 and December 31, 2023. Expected compensation cost related to these units totals $3.8 million based on a closing stock price for the Company's common stock of $30.94 per share on December 27, 2020. Compensation cost will be amortized to profit/loss upon satisfaction of the performance conditions over the remaining vesting period.
Compensation costs and the income tax benefit recognized for our stock-based compensation arrangements are included below:
2020 2019 2018(In thousands)
Equity-based awards compensation cost:Cost of sales $ 838 $ 461 $ 389 Selling, general and administrative expense 1,938 9,671 12,764 Total cost 2,776 10,132 13,153
Income tax benefit 676 2,466 3,202 Net cost $ 2,100 $ 7,666 $ 9,951
Liability-based awards compensation cost:Selling, general and administrative expense $ 1,081 $ 671 $ — Income tax benefit 263 163 — Net cost $ 818 $ 508 $ —
The Company’s RSU activity is included below:
2020 2019 2018
Number
Weighted Average
Milestone Date Fair Value(a) Number
Weighted Average
Milestone Date Fair Value(a) Number
Weighted Average
Milestone Date Fair Value(a)
(In thousands, except weighted average fair values)
Equity-based RSUs:Outstanding at beginning of year 926 $ 24.04 1,069 $ 22.97 389 $ 18.39 Transferred to liability-based awards (200) 26.91 (36) 24.67 — — Granted 249 28.14 843 22.01 1,114 23.05 Vested (66) 24.93 (723) 22.08 — — Forfeited (325) 25.95 (227) 21.51 (434) 19.06 Outstanding at end of year 584 $ 22.12 926 $ 24.04 1,069 $ 22.97
NOTES TO CONSOLIDATED FINANCIAL STATEMENTS
79

2020 2019 2018
Number
Weighted Average
Milestone Date Fair Value(a) Number
Weighted Average
Milestone Date Fair Value(a) Number
Weighted Average
Milestone Date Fair Value(a)
(In thousands, except weighted average fair values)
Liability-based RSUs:Outstanding at beginning of year 143 $ 32.97 — $ — — $ — Transferred from equity-based awards 200 26.91 36 14.77 — — Granted 135 29.47 110 16.47 — — Vested (211) 16.04 (3) 26.86 — — Forfeited — — — — — — Outstanding at end of year 267 $ 19.35 143 $ 32.97 — $ —
(a) The milestone date fair value is either the closing price of the Company’s common stock on the grant date for equity-based awards or the closing price of a share of the Company's common stock on the respective milestone date for cash-based liability-based awards (i.e., grant date, vesting date, forfeiture date or financial reporting date).
The total fair values of equity-based awards and liability-based awards vested during 2020 were $2.5 million and $3.0 million, respectively. The total fair values of equity-based awards and liability-based awards vested during 2019 were $14.0 million and $0.1 million, respectively.
As of December 27, 2020, the total unrecognized compensation cost related to all nonvested equity-based awards was $5.1 million. This cost is expected to be recognized over a weighted average period of 1.76 years. As of December 27, 2020, the total unrecognized compensation cost related to all nonvested liability-based awards was $3.8 million. This cost is expected to be recognized over a weighted average period of 1.74 years.
Historically, we have issued new shares to satisfy equity-based award conversions.
17. FAIR VALUE MEASUREMENTS
Fair value is an exit price, representing the amount that would be received to sell an asset or paid to transfer a liability in an orderly transaction between market participants. Assets and liabilities measured at fair value must be categorized into one of three different levels depending on the assumptions (i.e., inputs) used in the valuation:
Level 1 Unadjusted quoted prices in active markets for identical assets or liabilities;
Level 2
Quoted prices in active markets for similar assets and liabilities and inputs that are observable for the asset or liability; or
Level 3 Unobservable inputs, such as discounted cash flow models or valuations.
The determination of where assets and liabilities fall within this hierarchy is based upon the lowest level of input that is significant to the fair value measurement in its entirety.
As of December 27, 2020 and December 29, 2019, the Company held derivative assets and liabilities that were required to be measured at fair value on a recurring basis. Derivative assets and liabilities consist of long and short positions on exchange-traded commodity futures instruments, foreign currency forward contracts to manage translation and remeasurement risk and interest rate swap instruments.
The following items were measured at fair value on a recurring basis:
NOTES TO CONSOLIDATED FINANCIAL STATEMENTS
80
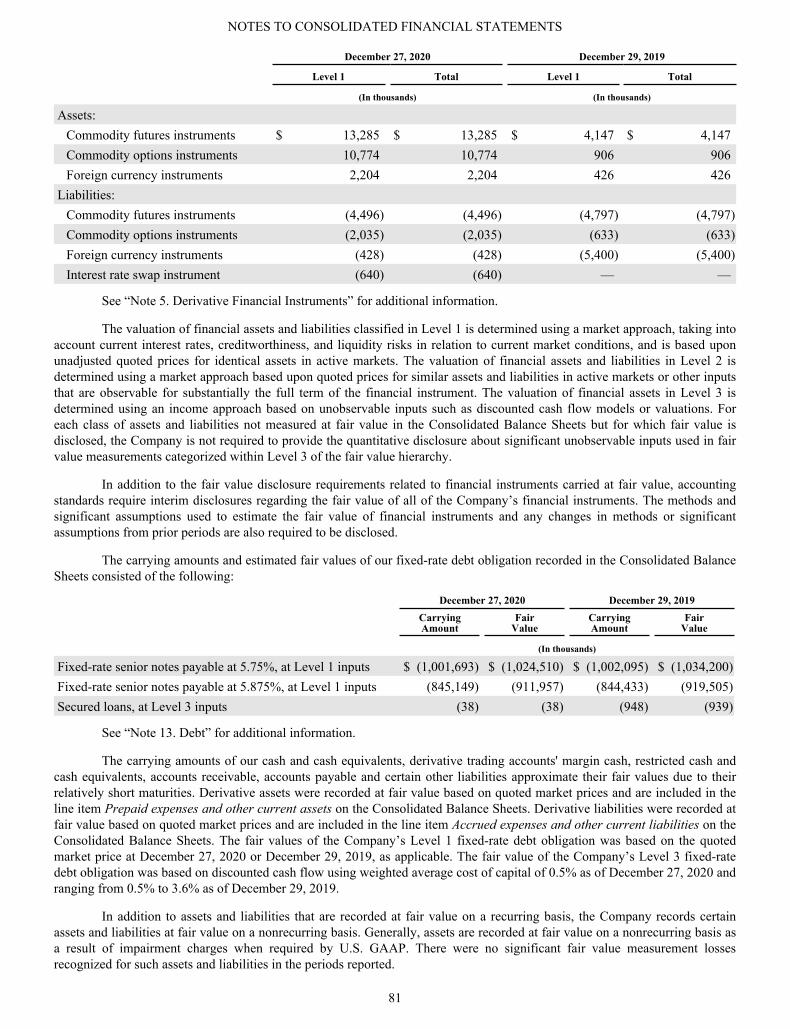
December 27, 2020 December 29, 2019
Level 1 Total Level 1 Total
(In thousands) (In thousands)
Assets:Commodity futures instruments $ 13,285 $ 13,285 $ 4,147 $ 4,147 Commodity options instruments 10,774 10,774 906 906 Foreign currency instruments 2,204 2,204 426 426
Liabilities:Commodity futures instruments (4,496) (4,496) (4,797) (4,797) Commodity options instruments (2,035) (2,035) (633) (633) Foreign currency instruments (428) (428) (5,400) (5,400) Interest rate swap instrument (640) (640) — —
See “Note 5. Derivative Financial Instruments” for additional information.
The valuation of financial assets and liabilities classified in Level 1 is determined using a market approach, taking into account current interest rates, creditworthiness, and liquidity risks in relation to current market conditions, and is based upon unadjusted quoted prices for identical assets in active markets. The valuation of financial assets and liabilities in Level 2 is determined using a market approach based upon quoted prices for similar assets and liabilities in active markets or other inputs that are observable for substantially the full term of the financial instrument. The valuation of financial assets in Level 3 is determined using an income approach based on unobservable inputs such as discounted cash flow models or valuations. For each class of assets and liabilities not measured at fair value in the Consolidated Balance Sheets but for which fair value is disclosed, the Company is not required to provide the quantitative disclosure about significant unobservable inputs used in fair value measurements categorized within Level 3 of the fair value hierarchy.
In addition to the fair value disclosure requirements related to financial instruments carried at fair value, accounting standards require interim disclosures regarding the fair value of all of the Company’s financial instruments. The methods and significant assumptions used to estimate the fair value of financial instruments and any changes in methods or significant assumptions from prior periods are also required to be disclosed.
The carrying amounts and estimated fair values of our fixed-rate debt obligation recorded in the Consolidated Balance Sheets consisted of the following:
December 27, 2020 December 29, 2019
CarryingAmount
FairValue
CarryingAmount
FairValue
(In thousands)
Fixed-rate senior notes payable at 5.75%, at Level 1 inputs $ (1,001,693) $ (1,024,510) $ (1,002,095) $ (1,034,200) Fixed-rate senior notes payable at 5.875%, at Level 1 inputs (845,149) (911,957) (844,433) (919,505) Secured loans, at Level 3 inputs (38) (38) (948) (939)
See “Note 13. Debt” for additional information.
The carrying amounts of our cash and cash equivalents, derivative trading accounts' margin cash, restricted cash and cash equivalents, accounts receivable, accounts payable and certain other liabilities approximate their fair values due to their relatively short maturities. Derivative assets were recorded at fair value based on quoted market prices and are included in the line item Prepaid expenses and other current assets on the Consolidated Balance Sheets. Derivative liabilities were recorded at fair value based on quoted market prices and are included in the line item Accrued expenses and other current liabilities on the Consolidated Balance Sheets. The fair values of the Company’s Level 1 fixed-rate debt obligation was based on the quoted market price at December 27, 2020 or December 29, 2019, as applicable. The fair value of the Company’s Level 3 fixed-rate debt obligation was based on discounted cash flow using weighted average cost of capital of 0.5% as of December 27, 2020 and ranging from 0.5% to 3.6% as of December 29, 2019.
In addition to assets and liabilities that are recorded at fair value on a recurring basis, the Company records certain assets and liabilities at fair value on a nonrecurring basis. Generally, assets are recorded at fair value on a nonrecurring basis as a result of impairment charges when required by U.S. GAAP. There were no significant fair value measurement losses recognized for such assets and liabilities in the periods reported.
NOTES TO CONSOLIDATED FINANCIAL STATEMENTS
81

18. RELATED PARTY TRANSACTIONS
Pilgrim's has been and, in some cases, continues to be a party to certain transactions with affiliated companies.
Year Ended
December 27, 2020 December 29, 2019 December 30, 2018(In thousands)
Sales to related parties:JBS USA Food Company(a) $ 14,228 $ 14,108 $ 13,843 JBS Five Rivers — — 7,096 JBS Global (UK) Ltd. — 141 — JBS Chile Ltda. 225 482 60 Combo, Mercado de Congelados 887 207 159 JBS Australia Pty. Ltd. 2,540 — —
Total sales to related parties $ 17,880 $ 14,938 $ 21,158
Year Ended
December 27, 2020 December 29, 2019 December 30, 2018(In thousands)
Cost of goods purchased from related parties:JBS USA Food Company(a) $ 142,615 $ 134,790 $ 117,596 Seara Meats B.V. 8,138 22,797 36,223 JBS Aves Ltda. — — 1,123 JBS Toledo NV 155 307 445 JBS Global (UK) Ltd. 674 170 21
Total cost of goods purchased from related parties $ 151,582 $ 158,064 $ 155,408
Year Ended
December 27, 2020 December 29, 2019 December 30, 2018(In thousands)
Expenditures paid by related parties:JBS USA Food Company(b) $ 39,025 $ 32,161 $ 62,189 JBS Chile Ltda. — 6 33 Seara Food Europe Holdings 9 77 —
Total expenditures paid by related parties $ 39,034 $ 32,244 $ 62,222
Year Ended
December 27, 2020 December 29, 2019 December 30, 2018(In thousands)
Expenditures paid on behalf of related parties:JBS USA Food Company(b) $ 16,266 $ 9,103 $ 9,192 JBS S.A. — — 170 Seara International Ltd. — — 45
Total expenditures paid on behalf of related parties $ 16,266 $ 9,103 $ 9,407
Year Ended
December 27, 2020 December 29, 2019 December 30, 2018(In thousands)
Other related party transactions:Capital distribution under tax sharing agreement (c) $ 650 $ — $ 525
Total other related party transactions $ 650 $ — $ 525
NOTES TO CONSOLIDATED FINANCIAL STATEMENTS
82

December 27, 2020 December 29, 2019(In thousands)
Accounts receivable from related parties:JBS USA Food Company(a) $ 714 $ 643 JBS Chile Ltda. — 301 JBS Australia Pty. Ltd. 370 —
Total accounts receivable from related parties $ 1,084 $ 944
December 27, 2020 December 29, 2019(In thousands)
Accounts payable to related parties:JBS USA Food Company(a) $ 8,562 $ 2,826 JBS Global UK Ltd. 5 5 Seara Meats B.V. 1,075 988 JBS Chile Ltda. 8 —
Total accounts payable to related parties $ 9,650 $ 3,819 (a) The Company routinely execute transactions to both purchase products from JBS USA Food Company (“JBS USA”) and sell products to them. As
of December 27, 2020, approximately $1.5 million of goods from JBS USA were in transit and not reflected on our Consolidated Balance Sheets.(b) The Company has an agreement with JBS USA to allocate costs associated with JBS USA’s procurement of SAP licenses and maintenance services
for both companies. Under this agreement, the fees associated with procuring SAP licenses and maintenance services are allocated between the Company and JBS USA in proportion to the percentage of licenses used by each company. The agreement expires on the date of expiration, or earlier termination, of the underlying SAP license agreement. The Company also has an agreement with JBS USA to allocate the costs of supporting the business operations by one consolidated corporate team, which have historically been supported by their respective corporate teams. Expenditures paid by JBS USA on behalf of the Company will be reimbursed by the Company and expenditures paid by the Company on behalf of JBS USA will be reimbursed by JBS USA. This agreement expires on December 31, 2021.
(c) The Company entered into a tax sharing agreement during 2014 with JBS USA Holdings effective for tax years starting in 2010. The net tax payable for tax year 2020 was accrued in 2020 and will be paid in 2021. The net tax payable for tax year 2018 was accrued in 2018 and was paid in 2019.
19. REPORTABLE SEGMENTS
The Company operates in three reportable segments: U.S., U.K. and Europe and Mexico. The Company measures segment profit as operating income. Corporate expenses are allocated to the Mexico and U.K. and Europe reportable segments based upon various apportionment methods for specific expenditures incurred related thereto with the remaining amounts allocated to the U.S. reportable segment.
We conduct separate operations in the continental U.S. and in Puerto Rico. For segment reporting purposes, the Puerto Rico operations are included in the U.S. reportable segment. The chicken products processed by the U.S. reportable segment are sold to foodservice, retail and frozen entrée customers. The segment’s primary distribution is through retailers, foodservice distributors and restaurants.
The U.K. and Europe reportable segment processes primarily chicken and pork products that are sold to foodservice, retail and frozen entrée customers. The segment’s primary distribution is through retailers, foodservice distributors and restaurants.
The chicken products processed by the Mexico reportable segment are sold to foodservice, retail and frozen entrée customers. The segment’s primary distribution is through retailers, foodservice distributors and restaurants.
Additional information regarding reportable segments is as follows:
Year Ended
December 27, 2020(a) December 29,2019(b) December 30, 2018(c)
(In thousands)
Net salesU.S. $ 7,496,017 $ 7,636,716 $ 7,425,661 U.K. and Europe 3,274,292 2,383,793 2,148,666 Mexico 1,321,592 1,388,710 1,363,457
Total $ 12,091,901 $ 11,409,219 $ 10,937,784
NOTES TO CONSOLIDATED FINANCIAL STATEMENTS
83

(a) For the year 2020, the United States reportable segment had intercompany sales to the Mexico reportable segment of $210.6 million. These sales consisted of fresh products, prepared products and grain.
(b) For the year 2019, the United States reportable segment had intercompany sales to the Mexico reportable segment of $188.9 million. These sales consisted of fresh products, prepared products and grain.
(c) For the year 2018, the United States reportable segment had intercompany sales to the Mexico reportable segment of $100.7 million. These sales consisted of fresh products, prepared products and grain.
Year Ended
December 27, 2020 December 29, 2019 December 30, 2018(In thousands)
Operating incomeU.S. $ 69,377 $ 487,275 $ 291,381 U.K. and Europe 102,734 79,182 84,524 Mexico 72,879 124,015 119,649 Elimination 473 96 132 Total operating income 245,463 690,568 495,686
Interest expense, net of capitalized interest 126,118 132,630 162,812 Interest income (7,305) (14,277) (13,811) Foreign currency transaction loss 760 6,917 17,160 Gain on bargain purchase 3,746 (56,880) — Miscellaneous, net (39,681) 4,633 (2,702)
Income before income taxes 161,825 617,545 332,227 Income tax expense 66,755 161,009 85,423
Net income $ 95,070 $ 456,536 $ 246,804
Year Ended
December 27, 2020 December 29, 2019 December 30, 2018(In thousands)
Depreciation and amortization:U.S. $ 218,244 $ 207,584 $ 196,079 U.K. and Europe 92,673 60,499 50,586 Mexico 26,187 19,147 27,423
Total $ 337,104 $ 287,230 $ 274,088
Year Ended
December 27, 2020 December 29, 2019 December 30, 2018(In thousands)
Capital expenditures:U.S. $ 264,149 $ 269,609 $ 257,913 U.K. and Europe 77,597 58,795 58,334 Mexico 13,016 19,716 32,419
Total $ 354,762 $ 348,120 $ 348,666
December 27, 2020 December 29, 2019 (In thousands)
Total assets:U.S. $ 5,189,021 $ 5,207,282 U.K. and Europe 3,034,219 2,824,382 Mexico 1,212,428 1,020,331 Eliminations (1,961,171) (1,949,631)
Total $ 7,474,497 $ 7,102,364
NOTES TO CONSOLIDATED FINANCIAL STATEMENTS
84

Year Ended
December 27, 2020 December 29, 2019 December 30, 2018(In thousands)
Net sales to customers by customer location:U.S. $ 7,190,809 $ 7,355,631 $ 7,173,280 Europe 3,225,717 2,363,017 2,134,822 Mexico 1,350,588 1,437,081 1,411,727 Asia-Pacific 252,573 175,898 159,515 Canada, Caribbean and Central America 30,792 31,808 26,450 Africa 25,321 28,400 21,286 South America 16,101 17,384 10,704 Total $ 12,091,901 $ 11,409,219 $ 10,937,784
December 27, 2020 December 29, 2019 (In thousands)
Long-lived assets(a):U.S. $ 1,815,460 $ 1,789,530 U.K. and Europe 842,049 801,887 Mexico 292,651 306,413 Eliminations (3,783) (4,256)
Total $ 2,946,377 $ 2,893,574 (a) For this disclosure, we exclude financial instruments, deferred tax assets and intangible assets in accordance with ASC 280-10-50-41, Segment
Reporting. Long-lived assets, as used in ASC 280-10-50-41, implies hard assets that cannot be readily removed.
The following table sets forth net sales attributable to each of our primary product lines and markets served with those products. We based the table on our internal sales reports and their classification of products.
NOTES TO CONSOLIDATED FINANCIAL STATEMENTS
85
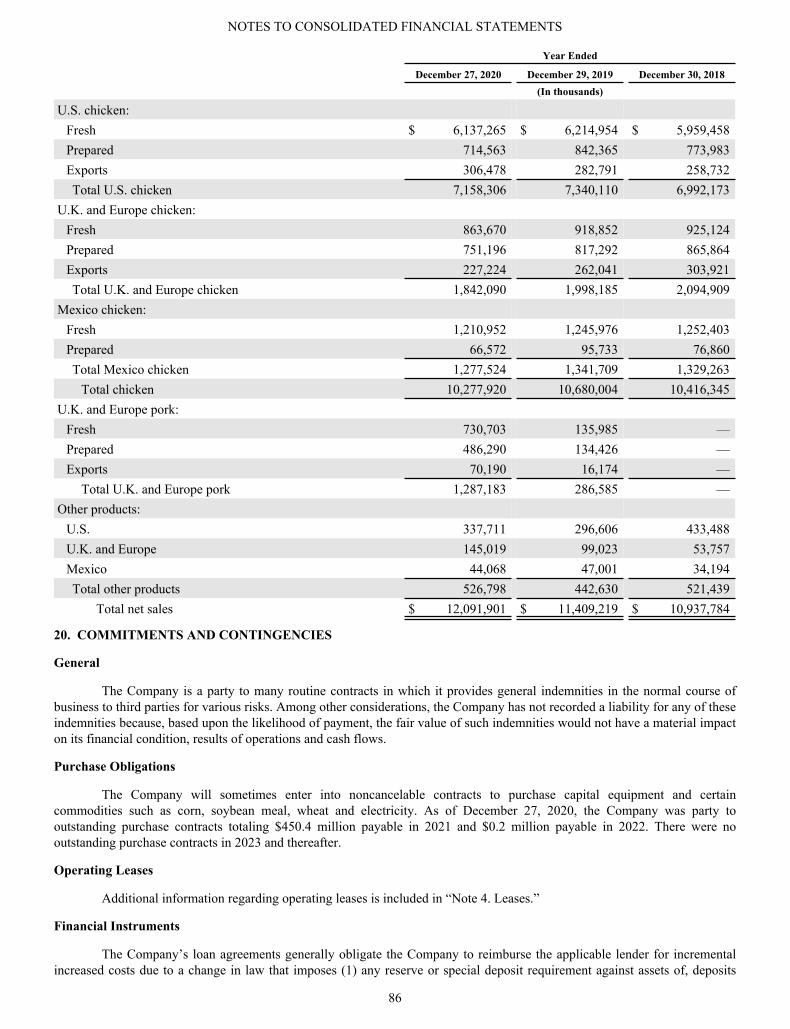
Year Ended
December 27, 2020 December 29, 2019 December 30, 2018(In thousands)
U.S. chicken:Fresh $ 6,137,265 $ 6,214,954 $ 5,959,458 Prepared 714,563 842,365 773,983 Exports 306,478 282,791 258,732 Total U.S. chicken 7,158,306 7,340,110 6,992,173
U.K. and Europe chicken:Fresh 863,670 918,852 925,124 Prepared 751,196 817,292 865,864 Exports 227,224 262,041 303,921 Total U.K. and Europe chicken 1,842,090 1,998,185 2,094,909
Mexico chicken:Fresh 1,210,952 1,245,976 1,252,403 Prepared 66,572 95,733 76,860 Total Mexico chicken 1,277,524 1,341,709 1,329,263
Total chicken 10,277,920 10,680,004 10,416,345 U.K. and Europe pork:
Fresh 730,703 135,985 — Prepared 486,290 134,426 — Exports 70,190 16,174 —
Total U.K. and Europe pork 1,287,183 286,585 — Other products:
U.S. 337,711 296,606 433,488 U.K. and Europe 145,019 99,023 53,757 Mexico 44,068 47,001 34,194 Total other products 526,798 442,630 521,439
Total net sales $ 12,091,901 $ 11,409,219 $ 10,937,784
20. COMMITMENTS AND CONTINGENCIES
General
The Company is a party to many routine contracts in which it provides general indemnities in the normal course of business to third parties for various risks. Among other considerations, the Company has not recorded a liability for any of these indemnities because, based upon the likelihood of payment, the fair value of such indemnities would not have a material impact on its financial condition, results of operations and cash flows.
Purchase Obligations
The Company will sometimes enter into noncancelable contracts to purchase capital equipment and certain commodities such as corn, soybean meal, wheat and electricity. As of December 27, 2020, the Company was party to outstanding purchase contracts totaling $450.4 million payable in 2021 and $0.2 million payable in 2022. There were no outstanding purchase contracts in 2023 and thereafter.
Operating Leases
Additional information regarding operating leases is included in “Note 4. Leases.”
Financial Instruments
The Company’s loan agreements generally obligate the Company to reimburse the applicable lender for incremental increased costs due to a change in law that imposes (1) any reserve or special deposit requirement against assets of, deposits
NOTES TO CONSOLIDATED FINANCIAL STATEMENTS
86
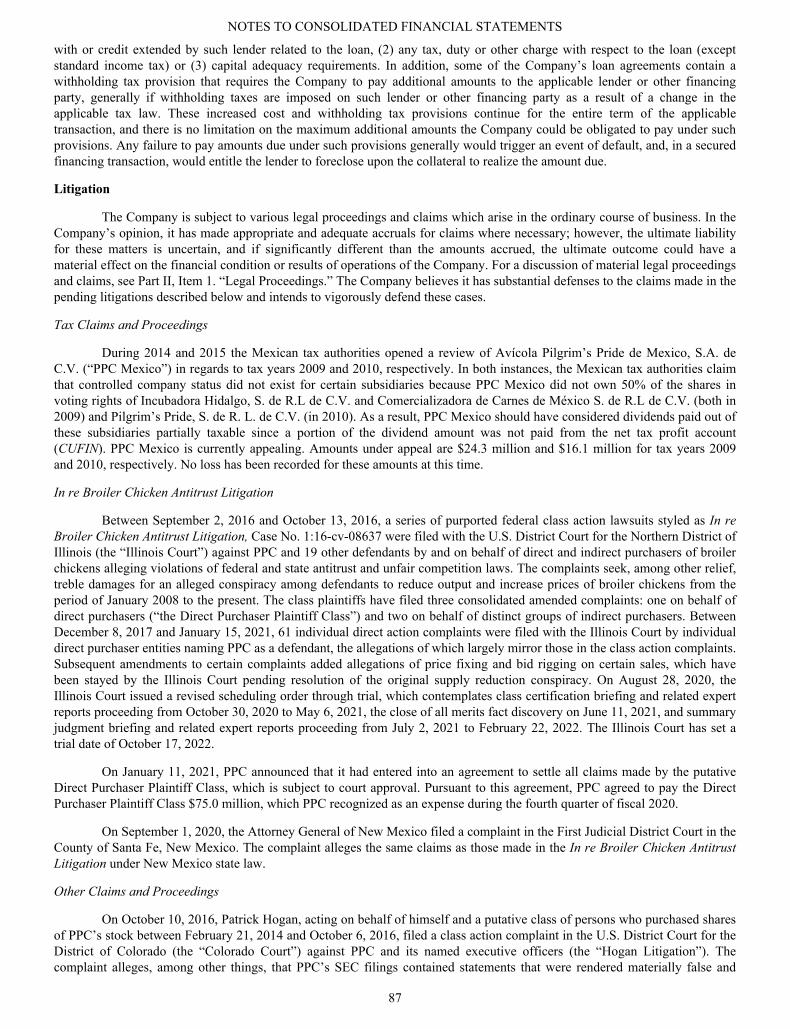
with or credit extended by such lender related to the loan, (2) any tax, duty or other charge with respect to the loan (except standard income tax) or (3) capital adequacy requirements. In addition, some of the Company’s loan agreements contain a withholding tax provision that requires the Company to pay additional amounts to the applicable lender or other financing party, generally if withholding taxes are imposed on such lender or other financing party as a result of a change in the applicable tax law. These increased cost and withholding tax provisions continue for the entire term of the applicable transaction, and there is no limitation on the maximum additional amounts the Company could be obligated to pay under such provisions. Any failure to pay amounts due under such provisions generally would trigger an event of default, and, in a secured financing transaction, would entitle the lender to foreclose upon the collateral to realize the amount due.
Litigation
The Company is subject to various legal proceedings and claims which arise in the ordinary course of business. In the Company’s opinion, it has made appropriate and adequate accruals for claims where necessary; however, the ultimate liability for these matters is uncertain, and if significantly different than the amounts accrued, the ultimate outcome could have a material effect on the financial condition or results of operations of the Company. For a discussion of material legal proceedings and claims, see Part II, Item 1. “Legal Proceedings.” The Company believes it has substantial defenses to the claims made in the pending litigations described below and intends to vigorously defend these cases.
Tax Claims and Proceedings
During 2014 and 2015 the Mexican tax authorities opened a review of Avícola Pilgrim’s Pride de Mexico, S.A. de C.V. (“PPC Mexico”) in regards to tax years 2009 and 2010, respectively. In both instances, the Mexican tax authorities claim that controlled company status did not exist for certain subsidiaries because PPC Mexico did not own 50% of the shares in voting rights of Incubadora Hidalgo, S. de R.L de C.V. and Comercializadora de Carnes de México S. de R.L de C.V. (both in 2009) and Pilgrim’s Pride, S. de R. L. de C.V. (in 2010). As a result, PPC Mexico should have considered dividends paid out of these subsidiaries partially taxable since a portion of the dividend amount was not paid from the net tax profit account (CUFIN). PPC Mexico is currently appealing. Amounts under appeal are $24.3 million and $16.1 million for tax years 2009 and 2010, respectively. No loss has been recorded for these amounts at this time.
In re Broiler Chicken Antitrust Litigation
Between September 2, 2016 and October 13, 2016, a series of purported federal class action lawsuits styled as In re Broiler Chicken Antitrust Litigation, Case No. 1:16-cv-08637 were filed with the U.S. District Court for the Northern District of Illinois (the “Illinois Court”) against PPC and 19 other defendants by and on behalf of direct and indirect purchasers of broiler chickens alleging violations of federal and state antitrust and unfair competition laws. The complaints seek, among other relief, treble damages for an alleged conspiracy among defendants to reduce output and increase prices of broiler chickens from the period of January 2008 to the present. The class plaintiffs have filed three consolidated amended complaints: one on behalf of direct purchasers (“the Direct Purchaser Plaintiff Class”) and two on behalf of distinct groups of indirect purchasers. Between December 8, 2017 and January 15, 2021, 61 individual direct action complaints were filed with the Illinois Court by individual direct purchaser entities naming PPC as a defendant, the allegations of which largely mirror those in the class action complaints. Subsequent amendments to certain complaints added allegations of price fixing and bid rigging on certain sales, which have been stayed by the Illinois Court pending resolution of the original supply reduction conspiracy. On August 28, 2020, the Illinois Court issued a revised scheduling order through trial, which contemplates class certification briefing and related expert reports proceeding from October 30, 2020 to May 6, 2021, the close of all merits fact discovery on June 11, 2021, and summary judgment briefing and related expert reports proceeding from July 2, 2021 to February 22, 2022. The Illinois Court has set a trial date of October 17, 2022.
On January 11, 2021, PPC announced that it had entered into an agreement to settle all claims made by the putative Direct Purchaser Plaintiff Class, which is subject to court approval. Pursuant to this agreement, PPC agreed to pay the Direct Purchaser Plaintiff Class $75.0 million, which PPC recognized as an expense during the fourth quarter of fiscal 2020.
On September 1, 2020, the Attorney General of New Mexico filed a complaint in the First Judicial District Court in the County of Santa Fe, New Mexico. The complaint alleges the same claims as those made in the In re Broiler Chicken Antitrust Litigation under New Mexico state law.
Other Claims and Proceedings
On October 10, 2016, Patrick Hogan, acting on behalf of himself and a putative class of persons who purchased shares of PPC’s stock between February 21, 2014 and October 6, 2016, filed a class action complaint in the U.S. District Court for the District of Colorado (the “Colorado Court”) against PPC and its named executive officers (the “Hogan Litigation”). The complaint alleges, among other things, that PPC’s SEC filings contained statements that were rendered materially false and
NOTES TO CONSOLIDATED FINANCIAL STATEMENTS
87

misleading by PPC’s failure to disclose that (2) PPC colluded with several of its industry peers to fix prices in the broiler-chicken market as alleged in the In re Broiler Chicken Antitrust Litigation, (2) its conduct constituted a violation of federal antitrust laws, (3) PPC’s revenues during the class period were the result of illegal conduct and (4) that PPC lacked effective internal control over financial reporting. The complaint also states that PPC’s industry was anticompetitive and seeks compensatory damages. On April 4, 2017, the Colorado Court appointed another stockholder, George James Fuller, as lead plaintiff. On May 11, 2017, the plaintiff filed an amended complaint, which extended the end date of the putative class period to November 17, 2017. PPC and the other defendants moved to dismiss on June 12, 2017, and the plaintiff filed its opposition on July 12, 2017. PPC and the other defendants filed their reply on August 1, 2017. On March 14, 2018, the Colorado Court dismissed the plaintiff’s complaint without prejudice and issued final judgment in favor of PPC and the other defendants. On April 11, 2018, the plaintiff moved for reconsideration of the Colorado Court’s decision and for permission to file a Second Amended Complaint. PPC and the other defendants filed a response to the plaintiff’s motion on April 25, 2018. On November 19, 2018, the Colorado Court denied the plaintiff’s motion for reconsideration and granted plaintiff leave to file a Second Amended Complaint. On June 8, 2020, the plaintiff filed a Second Amended Complaint against the same defendants, based in part on the Indictment (defined below). On July 31, 2020, defendants filed a motion to dismiss the Second Amended Complaint pursuant to Rule 12(b)(6) of the Federal Rules of Civil Procedure. Plaintiffs filed an opposition to the motion to dismiss on August 31, 2020, and defendants filed their reply on September 20, 2020. The Colorado Court's decision on the motion to dismiss is pending.
On January 27, 2017, a purported class action on behalf of broiler chicken farmers was brought against PPC and four other producers in the U.S. District Court for the Eastern District of Oklahoma (the “Oklahoma Court”) alleging, among other things, a conspiracy to reduce competition for grower services and depress the price paid to growers. Plaintiffs allege violations of the Sherman Antitrust Act and the Packers and Stockyards Act and seek, among other relief, treble damages. The complaint was consolidated with a subsequently filed consolidated amended class action complaint styled as In re Broiler Chicken Grower Litigation, Case No. CIV-17-033-RJS (the “Grower Litigation”). The defendants (including PPC) jointly moved to dismiss the consolidated amended complaint on September 9, 2017 for failure to state a claim under Rule 12(b)(6) of the Federal Rules of Civil Procedure. The Oklahoma Court granted only certain other defendants’ motions challenging jurisdiction. On January 6, 2020, the Oklahoma Court denied the pending Rule 12 motion, and lifted the stay on discovery. The case is currently in discovery. On October 6, 2020, the Oklahoma plaintiffs filed a motion with the U.S. Judicial Panel on Multidistrict Litigation (the “JPML”) seeking consolidation of a series of copycat complaints filed in September and October 2020 in the U.S. District Courts for the District of Colorado, the District of Kansas, and the Northern District of California. On December 15, 2020, the JPML ordered the transfer of all cases to the Oklahoma Court for consolidated or coordinated pretrial proceedings.
On March 9, 2017, a stockholder derivative action, DiSalvio v. Lovette, et al., No. 2017 cv. 30207, was brought against all of PPC’s directors and its Chief Financial Officer, Fabio Sandri, in the Nineteenth Judicial District Court for the County of Weld in Colorado (the “Weld County Court”). The complaint alleges, among other things, that the named defendants breached their fiduciary duties by failing to prevent PPC and its officers from engaging in an antitrust conspiracy as alleged in the In re Broiler Chicken Antitrust Litigation, and issuing false and misleading statements as alleged in the Hogan class action litigation. On April 17, 2017, a related stockholder derivative action, Brima v. Lovette, et al., No. 2017 cv. 30308, was brought against all of PPC’s directors and its Chief Financial Officer in the Weld County Court. The Brima complaint contains largely the same allegations as the DiSalvio complaint. The DiSalvio and Brima litigations (“the Derivative Litigation”) have been consolidated, and on October 14, 2020, an amended shareholder derivative complaint was filed which alleges, among other things, that the named defendants breached their fiduciary duties by failing to prevent PPC from engaging in an antitrust conspiracy as alleged in the Broiler litigation, the Indictment (as defined below), and other related proceedings; and by failing to prevent the issuance of false and misleading statements as alleged in the Hogan securities litigation and the UFCW securities litigation (as defined below). The consolidated case is currently stayed, pending the resolution of the motion to dismiss in the Hogan Litigation described above.
On January 24, 2018, a stockholder derivative action styled as Sciabacucchi v. JBS S.A. et al. was brought against all of PPC’s directors, JBS S.A., JBS USA Holdings and several members of the Batista family, in the Court of Chancery of the State of Delaware (the “Chancery Court”). The complaint alleges, among other things, that the named defendants breached their fiduciary duties arising out of PPC’s acquisition of Moy Park. On May 24, 2018, Employees Retirement System of the City of St. Louis filed a derivative complaint, which was virtually identical to the Sciabacucchi complaint. Both complaints sought compensatory damages. On July 2, 2018, the Chancery Court granted a stipulation consolidating the cases and making the first complaint (Sciabacucchi) the operative complaint. Also by stipulation, various defendants have been voluntarily dismissed from the case without prejudice. The remaining defendants are JBS S.A., JBS USA Holding, and directors Lovette, Nogueira de Souza, Tomazoni, and Molina. PPC also remains in the case as a nominal defendant. On March 15, 2019, the Chancery Court denied the non-PPC defendants’ motion to dismiss. As a result, the case proceeded to discovery, and trial was scheduled to commence in November 2020. On October 3, 2019, the parties entered into a stipulation agreeing to settle the dispute for (1) a cash payment to PPC by the non-PPC defendants of $42.5 million less any fees and expenses awarded to the plaintiffs’ counsel,
NOTES TO CONSOLIDATED FINANCIAL STATEMENTS
88

as well as any applicable taxes (the “Settlement Amount”), and (2) corporate governance changes to be implemented by PPC. No portion of the Settlement Amount will be paid by PPC to the non-PPC defendants. The settlement was approved by the Chancery Court on January 28, 2020. On March 2, 2020, the Settlement Amount was transferred to PPC, and as a result, PPC recognized income, net of legal fees, of $34.6 million, which is included in Miscellaneous, net in the Consolidated Statement of Income for the year ended December 27, 2020.
Between August 30, 2019 and October 16, 2019, four purported class action lawsuits were filed in the U.S. District Court for the District of Maryland (the “Maryland Court”) against PPC and a number of other chicken producers, as well as WMS (Webber, Meng, Sahl and Company) and Agri Stats. The plaintiffs seek to represent a nationwide class of processing plant production and maintenance workers (“Plant Workers”). They allege that the defendants conspired to fix and depress the compensation paid to Plant Workers in violation of the Sherman Act and seek damages from January 1, 2009 to the present. On November 12, 2019, the Maryland Court ordered the consolidation of the four cases for pretrial purposes. The defendants (including PPC) jointly moved to dismiss the consolidated complaint on November 22, 2019. Shortly thereafter, the plaintiffs informed the defendants and the Maryland Court that they would be amending their complaint, which they did on December 20, 2019. The consolidated amended complaint asserts largely similar allegations to the pleadings in the consolidated complaint, but was expanded to include more class members and turkey processors as well as chicken processors. The defendants moved to dismiss the consolidated amended complaint on March 2, 2020. The Maryland Court dismissed PPC and a number of other defendants on September 16, 2020 without prejudice. Plaintiffs subsequently filed amended complaints on November 2, 2020 re-naming PPC and the other dismissed defendants. Defendants moved to dismiss on December 18, 2020. The briefing is set to be complete on February 25, 2021.
On July 6, 2020, United Food and Commercial Workers International Union Local 464A (“UFCW”), acting on behalf of itself and a putative class of persons who purchased shares of PPC stock between February 9, 2017 and June 3, 2020, filed a class action complaint in the Colorado Court against PPC, and Messrs. Lovette, Penn, and Sandri. The complaint alleges, among other things, that PPC’s public statements regarding its business and the drivers behind its financial results were false and misleading due to the defendants’ purported failure to disclose its participation in an antitrust conspiracy as alleged in the Broiler litigation and the Indictment (defined below). On September 4, 2020, UFCW and the New Mexico State Investment Council filed competing motions to be appointed lead plaintiff under the Private Litigation Securities Reform Act. A decision on the lead plaintiff motions is currently pending.
PPC believes it has strong defenses in the pending litigations described above and intends to contest them vigorously. PPC cannot predict the outcome of these pending litigations nor when they will be resolved. The consequences of the pending litigation matters are inherently uncertain, and adverse actions, judgments or settlements in some or all of these matters has resulted and may in the future result in materially adverse monetary damages, fines, penalties or injunctive relief against PPC. Any claims or litigation, even if fully indemnified or insured, could damage PPC’s reputation and make it more difficult to compete effectively or to obtain adequate insurance in the future.
DOJ Antitrust Matter
On July 1, 2019, the DOJ issued a subpoena to PPC in connection with its investigation arising from the In re Broiler Chicken Antitrust Litigation. The Company has been cooperating with the DOJ investigation.
On June 3, 2020, PPC learned of an indictment by a Grand Jury in the Colorado Court against Jayson Penn, the chief executive officer and president of PPC at that time, in addition to two former employees of PPC and a former employee of a different company (the “Indictment”). The Indictment alleges that the defendants entered into and engaged in a conspiracy to suppress and eliminate competition by rigging bids and fixing prices and other price-related terms for broiler chicken products sold in the U.S., in violation of Section 1 of the Sherman Antitrust Act, 15 U.S.C. Section 1. On June 4, 2020, PPC learned that Mr. Penn pleaded not guilty to the charges. Effective June 15, 2020, Mr. Penn began a paid leave of absence from PPC. In connection with Mr. Penn’s leave of absence, PPC’s Board of Directors appointed the chief financial officer of PPC, Fabio Sandri, to serve in the additional role of PPC’s interim president and chief executive officer. On September 22, 2020, PPC's Board of Directors appointed Fabio Sandri as PPC's President and Chief Executive Officer in addition to his role as Chief Financial Officer. On September 22, 2020, PPC disclosed that Mr. Penn was no longer with the Company. The Company has initiated a search process to identify a new chief financial officer.
On October 6, 2020, PPC learned of a superseding indictment by a Grand Jury in the Colorado Court against former Chief Executive Officer of PPC, William Lovette, one additional former employee of PPC, and four employees of different companies. The superseding indictment alleges similar claims to the Indictment.
On October 13, 2020, the Company announced that it had entered into a plea agreement (the “Plea Agreement”) with the DOJ pursuant to which the Company agreed to (1) plead guilty to one count of conspiracy in restraint of competition involving sales of broiler chicken products in the U.S. in violation of the Sherman Antitrust Act, 15 U.S.C. § 1, and (2) pay a
NOTES TO CONSOLIDATED FINANCIAL STATEMENTS
89

fine of $110,524,140. The Company recognized the fine as expense which is included in Selling, general and administrative expense in the Consolidated Statements of Income for the year ended December 27, 2020. Under the Plea Agreement, which is subject to the approval of the Colorado Court, the DOJ agreed not to bring further charges against the Company for any antitrust violation involving the sale of broiler chicken products in the U.S. occurring prior to the date of the Plea Agreement. The Company continues to cooperate with the DOJ in connection with the ongoing federal antitrust investigation into alleged price fixing and other anticompetitive conduct in the broiler chicken industry.
J&F Investigation
On May 3, 2017, certain officers of J&F Investimentos S.A. (“J&F,” and together with the companies controlled by J&F, the “J&F Group”), a company organized in Brazil and an indirect controlling stockholder of the Company, including a former senior executive and former board members of the Company, entered into cooperation agreements (acordos de colaboração) (collectively, the “Cooperation Agreements”) with the Brazilian Office of the Prosecutor General (Procuradoria-Geral da República) in connection with certain illicit conduct by J&F and such individuals acting in their capacity as J&F executives. The details of such illicit conduct are set forth in separate annexes to the Cooperation Agreements, and include admissions of improper payments to politicians and political parties in Brazil during a ten-year period in exchange for receiving, or attempting to receive, favorable treatment for certain J&F Group companies in Brazil.
On June 5, 2017, J&F, for itself and as the controlling shareholder of the J&F Group companies, entered into a leniency agreement (the “Leniency Agreement”) with the Brazilian Federal Prosecutor (Ministério Público Federal) whereby J&F assumed responsibility for the conduct that was described in the annexes to the Cooperation Agreements. In connection with the Leniency Agreement, J&F has agreed to pay a fine of 10.3 billion Brazilian reais, adjusted for inflation, over a 25-year period. Various proceedings by Brazilian governmental authorities remain pending against J&F and certain of its former or current officers seeking to invalidate the Cooperation Agreements and impose more severe penalties for additional alleged illicit conduct that was not disclosed in the annexes to the Cooperation Agreements.
On October 14, 2020, certain affiliates of the Company – J&F Investimentos, S.A., JBS S.A., Joesley Batista and Wesley Batista – entered into a settlement agreement (the “Settlement”) with the SEC. The Company was not a party to the Settlement, was not a respondent in the related proceedings, and is not required to make any related payment. Under the Settlement, the SEC issued an Order Instituting Cease-and-Desist Proceedings Pursuant to Section 21C of the Securities Exchange Act of 1934 (the “SEC Order”) finding securities law violations by such affiliates that resulted in the Company, an indirect subsidiary, failing to maintain accurate books and records and internal accounting controls. According to the SEC Order, the violations, which related to certain intercompany transactions from 2009 to 2015, were unbeknownst to the Company’s management, and the SEC Order will have no impact on the Company’s previously filed financial statements or its prior assessments of internal control over financial reporting.
On October 14, 2020, J&F reached an agreement (the “J&F Plea Agreement”) with the DOJ regarding violations stemming from the same facts and conduct that were the subject of the Leniency Agreement and the Cooperation Agreements (described above). Pursuant to the J&F Plea Agreement, J&F pled guilty to one count of conspiracy to violate the U.S. Foreign Corrupt Practices Act. The J&F Plea Agreement imposed a fine of $256,497,026, and J&F was required to make a payment of $128,248,513 under the J&F Plea Agreement (due to J&F receiving a 50% credit for amounts paid to Brazilian authorities). JBS and PPC are not parties to the J&F Plea Agreement and will not bear any liabilities arising from it. The J&F Plea Agreement resolved the U.S. criminal legal exposure of J&F and all its affiliates related to the conduct that was the subject of the Leniency Agreement and the Cooperation Agreements.
21. MARKET RISKS AND CONCENTRATIONS
The Company’s financial instruments that are exposed to concentrations of credit risk consist primarily of cash equivalents, investment securities and trade accounts receivable. The Company’s cash equivalents and investment securities are high-quality debt and equity securities placed with major banks and financial institutions. The Company’s trade accounts receivable are generally unsecured. Credit evaluations are performed on all significant customers and updated as circumstances dictate. Concentrations of credit risk with respect to trade accounts receivable are limited due to the large number of customers and their dispersion across geographic areas. The Company does not have a single customer that exceeds the 10% of net sales. For the year ended December 27, 2020, our largest single customer was 6.9% of net sales. The Company does not believe it has significant concentrations of credit risk in its trade accounts receivable.
As of December 27, 2020, we employed approximately 30,900 persons in the U.S. reportable segment, approximately 10,500 persons in the Mexico reportable segment and approximately 15,000 persons in the U.K. and Europe reportable segment. Approximately 35.2% of the Company’s employees were covered under collective bargaining agreements. Substantially all employees covered under collective bargaining agreements are covered under agreements that expire in 2021 or later. We have not experienced any labor-related work stoppage at any location in over ten years. We believe our relationship
NOTES TO CONSOLIDATED FINANCIAL STATEMENTS
90
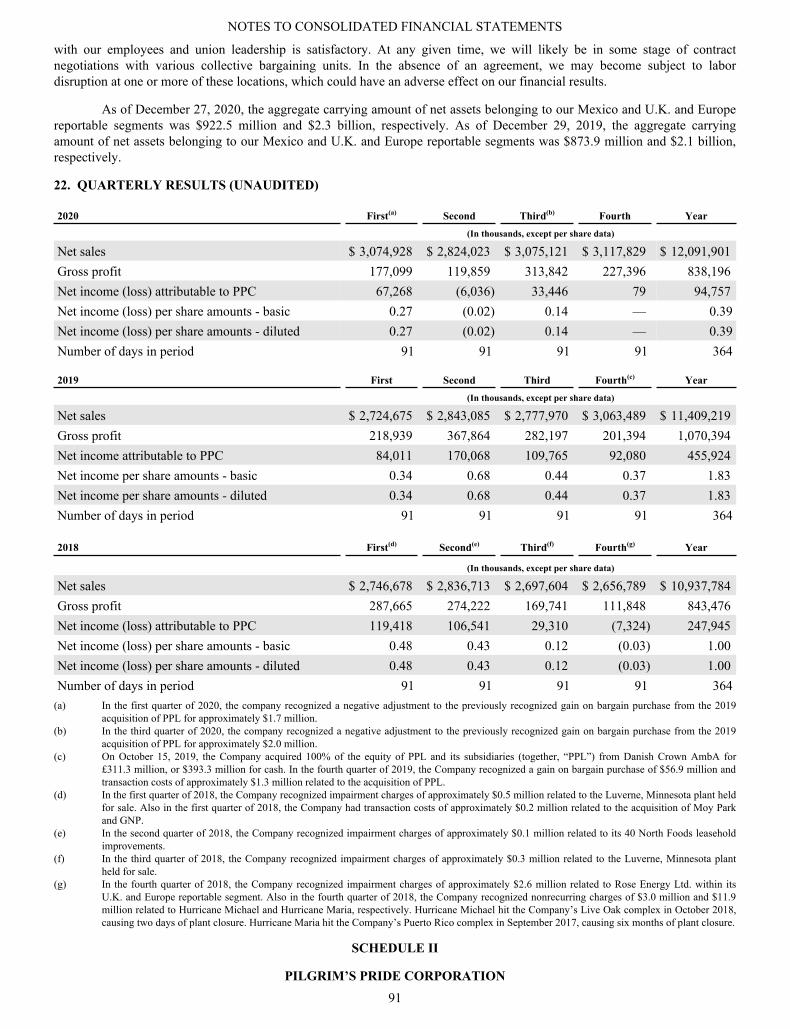
with our employees and union leadership is satisfactory. At any given time, we will likely be in some stage of contract negotiations with various collective bargaining units. In the absence of an agreement, we may become subject to labor disruption at one or more of these locations, which could have an adverse effect on our financial results.
As of December 27, 2020, the aggregate carrying amount of net assets belonging to our Mexico and U.K. and Europe reportable segments was $922.5 million and $2.3 billion, respectively. As of December 29, 2019, the aggregate carrying amount of net assets belonging to our Mexico and U.K. and Europe reportable segments was $873.9 million and $2.1 billion, respectively.
22. QUARTERLY RESULTS (UNAUDITED)
2020 First(a) Second Third(b) Fourth Year (In thousands, except per share data)
Net sales $ 3,074,928 $ 2,824,023 $ 3,075,121 $ 3,117,829 $ 12,091,901 Gross profit 177,099 119,859 313,842 227,396 838,196 Net income (loss) attributable to PPC 67,268 (6,036) 33,446 79 94,757 Net income (loss) per share amounts - basic 0.27 (0.02) 0.14 — 0.39Net income (loss) per share amounts - diluted 0.27 (0.02) 0.14 — 0.39Number of days in period 91 91 91 91 364
2019 First Second Third Fourth(c) Year(In thousands, except per share data)
Net sales $ 2,724,675 $ 2,843,085 $ 2,777,970 $ 3,063,489 $ 11,409,219 Gross profit 218,939 367,864 282,197 201,394 1,070,394 Net income attributable to PPC 84,011 170,068 109,765 92,080 455,924 Net income per share amounts - basic 0.34 0.68 0.44 0.37 1.83 Net income per share amounts - diluted 0.34 0.68 0.44 0.37 1.83 Number of days in period 91 91 91 91 364
2018 First(d) Second(e) Third(f) Fourth(g) Year
(In thousands, except per share data)
Net sales $ 2,746,678 $ 2,836,713 $ 2,697,604 $ 2,656,789 $ 10,937,784 Gross profit 287,665 274,222 169,741 111,848 843,476 Net income (loss) attributable to PPC 119,418 106,541 29,310 (7,324) 247,945 Net income (loss) per share amounts - basic 0.48 0.43 0.12 (0.03) 1.00 Net income (loss) per share amounts - diluted 0.48 0.43 0.12 (0.03) 1.00 Number of days in period 91 91 91 91 364
(a) In the first quarter of 2020, the company recognized a negative adjustment to the previously recognized gain on bargain purchase from the 2019 acquisition of PPL for approximately $1.7 million.
(b) In the third quarter of 2020, the company recognized a negative adjustment to the previously recognized gain on bargain purchase from the 2019 acquisition of PPL for approximately $2.0 million.
(c) On October 15, 2019, the Company acquired 100% of the equity of PPL and its subsidiaries (together, “PPL”) from Danish Crown AmbA for £311.3 million, or $393.3 million for cash. In the fourth quarter of 2019, the Company recognized a gain on bargain purchase of $56.9 million and transaction costs of approximately $1.3 million related to the acquisition of PPL.
(d) In the first quarter of 2018, the Company recognized impairment charges of approximately $0.5 million related to the Luverne, Minnesota plant held for sale. Also in the first quarter of 2018, the Company had transaction costs of approximately $0.2 million related to the acquisition of Moy Park and GNP.
(e) In the second quarter of 2018, the Company recognized impairment charges of approximately $0.1 million related to its 40 North Foods leasehold improvements.
(f) In the third quarter of 2018, the Company recognized impairment charges of approximately $0.3 million related to the Luverne, Minnesota plant held for sale.
(g) In the fourth quarter of 2018, the Company recognized impairment charges of approximately $2.6 million related to Rose Energy Ltd. within its U.K. and Europe reportable segment. Also in the fourth quarter of 2018, the Company recognized nonrecurring charges of $3.0 million and $11.9 million related to Hurricane Michael and Hurricane Maria, respectively. Hurricane Michael hit the Company’s Live Oak complex in October 2018, causing two days of plant closure. Hurricane Maria hit the Company’s Puerto Rico complex in September 2017, causing six months of plant closure.
SCHEDULE II
PILGRIM’S PRIDE CORPORATION
NOTES TO CONSOLIDATED FINANCIAL STATEMENTS
91
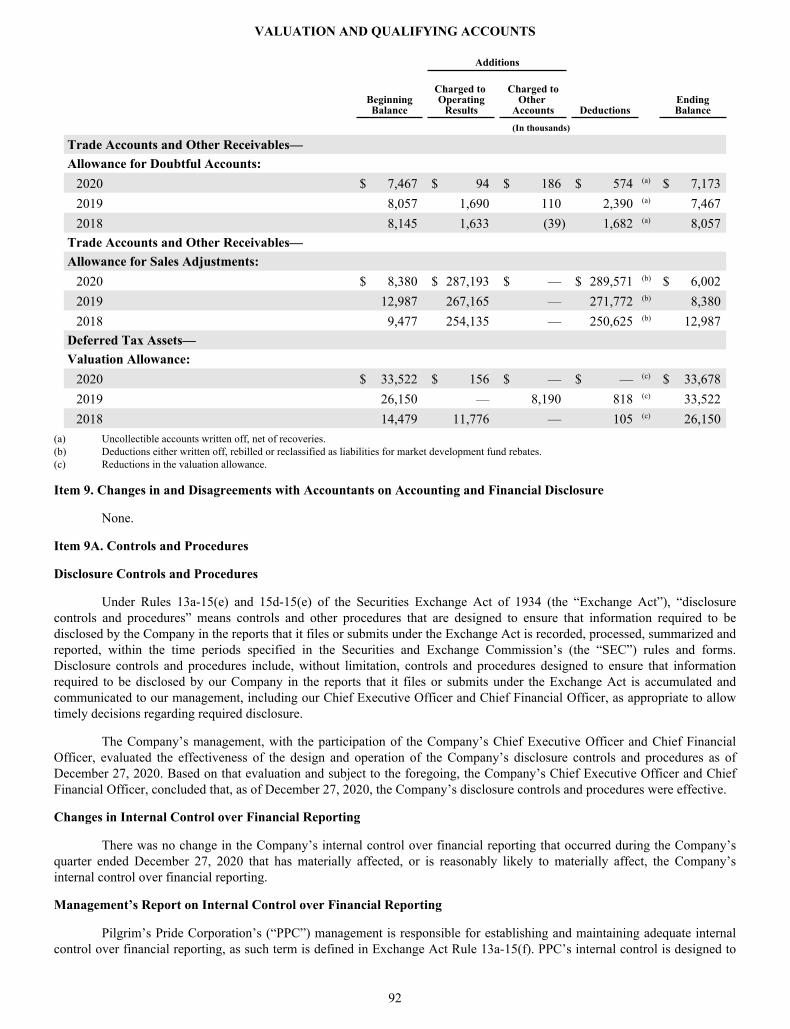
VALUATION AND QUALIFYING ACCOUNTS
Additions
BeginningBalance
Charged to Operating
Results
Charged toOther
Accounts Deductions EndingBalance
(In thousands)
Trade Accounts and Other Receivables—Allowance for Doubtful Accounts:
2020 $ 7,467 $ 94 $ 186 $ 574 (a) $ 7,173 2019 8,057 1,690 110 2,390 (a) 7,467 2018 8,145 1,633 (39) 1,682 (a) 8,057
Trade Accounts and Other Receivables—Allowance for Sales Adjustments:
2020 $ 8,380 $ 287,193 $ — $ 289,571 (b) $ 6,002 2019 12,987 267,165 — 271,772 (b) 8,380 2018 9,477 254,135 — 250,625 (b) 12,987
Deferred Tax Assets—Valuation Allowance:
2020 $ 33,522 $ 156 $ — $ — (c) $ 33,678 2019 26,150 — 8,190 818 (c) 33,522 2018 14,479 11,776 — 105 (c) 26,150
(a) Uncollectible accounts written off, net of recoveries.(b) Deductions either written off, rebilled or reclassified as liabilities for market development fund rebates.(c) Reductions in the valuation allowance.
Item 9. Changes in and Disagreements with Accountants on Accounting and Financial Disclosure
None.
Item 9A. Controls and Procedures
Disclosure Controls and Procedures
Under Rules 13a-15(e) and 15d-15(e) of the Securities Exchange Act of 1934 (the “Exchange Act”), “disclosure controls and procedures” means controls and other procedures that are designed to ensure that information required to be disclosed by the Company in the reports that it files or submits under the Exchange Act is recorded, processed, summarized and reported, within the time periods specified in the Securities and Exchange Commission’s (the “SEC”) rules and forms. Disclosure controls and procedures include, without limitation, controls and procedures designed to ensure that information required to be disclosed by our Company in the reports that it files or submits under the Exchange Act is accumulated and communicated to our management, including our Chief Executive Officer and Chief Financial Officer, as appropriate to allow timely decisions regarding required disclosure.
The Company’s management, with the participation of the Company’s Chief Executive Officer and Chief Financial Officer, evaluated the effectiveness of the design and operation of the Company’s disclosure controls and procedures as of December 27, 2020. Based on that evaluation and subject to the foregoing, the Company’s Chief Executive Officer and Chief Financial Officer, concluded that, as of December 27, 2020, the Company’s disclosure controls and procedures were effective.
Changes in Internal Control over Financial Reporting
There was no change in the Company’s internal control over financial reporting that occurred during the Company’s quarter ended December 27, 2020 that has materially affected, or is reasonably likely to materially affect, the Company’s internal control over financial reporting.
Management’s Report on Internal Control over Financial Reporting
Pilgrim’s Pride Corporation’s (“PPC”) management is responsible for establishing and maintaining adequate internal control over financial reporting, as such term is defined in Exchange Act Rule 13a-15(f). PPC’s internal control is designed to
92

provide reasonable assurance regarding the reliability of financial reporting and the preparation of financial statements in accordance with generally accepted accounting principles.
PPC's management assessed the effectiveness of the Company’s internal control over financial reporting as of December 27, 2020 based on the Committee of Sponsoring Organizations of the Treadway Commission (COSO) Internal Control Integrated Framework (2013). Based on this assessment, management concluded that PPC’s internal control over financial reporting was effective as of December 27, 2020.
KPMG LLP, an independent registered public accounting firm which audited our Consolidated Financial Statements included in this Form 10-K, has issued an unqualified report on the effectiveness of the Company’s internal control over financial reporting as of December 27, 2020. That report is included in this Item 9A of this annual report.
93

REPORT OF INDEPENDENT REGISTERED PUBLIC ACCOUNTING FIRM
To the Stockholders and Board of DirectorsPilgrim’s Pride Corporation:
Opinion on Internal Control Over Financial Reporting
We have audited Pilgrim’s Pride Corporation’s and subsidiaries’ (the Company) internal control over financial reporting as of December 27, 2020, based on criteria established in Internal Control - Integrated Framework (2013) issued by the Committee of Sponsoring Organizations of the Treadway Commission. In our opinion, the Company maintained, in all material respects, effective internal control over financial reporting as of December 27, 2020, based on criteria established in Internal Control - Integrated Framework (2013) issued by the Committee of Sponsoring Organizations of the Treadway Commission.
We also have audited, in accordance with the standards of the Public Company Accounting Oversight Board (United States) (PCAOB), the consolidated balance sheets of the Company as of December 27, 2020 and December 29, 2019, the related consolidated statements of income, comprehensive income, stockholders’ equity, and cash flows for each of the fiscal years in the three-year December 27, 2020 and the related notes and financial statement schedule II (collectively, the consolidated financial statements), and our report dated February 10, 2021 expressed an unqualified opinion on those consolidated financial statements.
Basis for Opinion
The Company’s management is responsible for maintaining effective internal control over financial reporting and for its assessment of the effectiveness of internal control over financial reporting, included in the accompanying Management’s Report on Internal Control over Financial Reporting. Our responsibility is to express an opinion on the Company’s internal control over financial reporting based on our audit. We are a public accounting firm registered with the PCAOB and are required to be independent with respect to the Company in accordance with the U.S. federal securities laws and the applicable rules and regulations of the Securities and Exchange Commission and the PCAOB.
We conducted our audit in accordance with the standards of the PCAOB. Those standards require that we plan and perform the audit to obtain reasonable assurance about whether effective internal control over financial reporting was maintained in all material respects. Our audit of internal control over financial reporting included obtaining an understanding of internal control over financial reporting, assessing the risk that a material weakness exists, and testing and evaluating the design and operating effectiveness of internal control based on the assessed risk. Our audit also included performing such other procedures as we considered necessary in the circumstances. We believe that our audit provides a reasonable basis for our opinion.
Definition and Limitations of Internal Control Over Financial Reporting
A company’s internal control over financial reporting is a process designed to provide reasonable assurance regarding the reliability of financial reporting and the preparation of financial statements for external purposes in accordance with generally accepted accounting principles. A company’s internal control over financial reporting includes those policies and procedures that (1) pertain to the maintenance of records that, in reasonable detail, accurately and fairly reflect the transactions and dispositions of the assets of the company; (2) provide reasonable assurance that transactions are recorded as necessary to permit preparation of financial statements in accordance with generally accepted accounting principles, and that receipts and expenditures of the company are being made only in accordance with authorizations of management and directors of the company; and (3) provide reasonable assurance regarding prevention or timely detection of unauthorized acquisition, use, or disposition of the company’s assets that could have a material effect on the financial statements.
Because of its inherent limitations, internal control over financial reporting may not prevent or detect misstatements. Also, projections of any evaluation of effectiveness to future periods are subject to the risk that controls may become inadequate because of changes in conditions, or that the degree of compliance with the policies or procedures may deteriorate.
/s/ KPMG LLP
Denver, Colorado
February 10, 2021
94

Item 9B. Other Information
None.PART III
Item 10. Directors, Executive Officers and Corporate Governance
Certain information regarding our executive officers has been presented under “Information about our Executive Officers” included in “Item 1. Business,” above.
We have adopted a Code of Business Conduct and Ethics, which applies to all employees, including our Chief Executive Officer and our Chief Financial Officer and Principal Accounting Officer. The full text of our Code of Business Conduct and Ethics is published on our website, at www.pilgrims.com, under the “Investors-Corporate Governance” caption. We intend to disclose, if required, future amendments to, or waivers from, certain provisions of this Code on our website within four business days following the date of such amendment or waiver.
The other information required by Item 10 is incorporated by reference herein from the Company’s Definitive Proxy Statement for its 2021 Annual Meeting of Stockholders to be filed no later than 120 days after the close of the fiscal year covered by this report, which sections are incorporated herein by reference.
Item 11. Executive Compensation
The information required by Item 11 is incorporated by reference herein from the Company’s Definitive Proxy Statement for its 2021 Annual Meeting of Stockholders to be filed no later than 120 days after the close of the fiscal year covered by this report, which sections are incorporated herein by reference.
Item 12. Security Ownership of Certain Beneficial Owners and Management and Related Stockholder Matters
Equity Compensation Plan Information
Plan Category(a)
Number of Securities to Be Issued Upon Exercise of Outstanding Options, Warrants and Rights(b)
Weighted-Average Exercise Price of
Outstanding Option, Warrants and Rights
Number of Securities Remaining Available for Future Issuance Under Equity Compensation
Plans (Excluding Securities Reflected in the
First Column)
Equity compensation plans approved by securities holders 161,411 $ 30.94 1,838,589
Equity compensation plans not approved by securities holders — — —
Total 161,411 $ 30.94 1,838,589 (a) The table provides certain information about our common stock that may be issued under the Long Term Incentive Plan (the “LTIP”), as of
December 27, 2020. For additional information concerning terms of the LTIP, see Part II. Item 8, Notes to Consolidated Financial Statements, “Note 16. Incentive Compensation” in this annual report.
(b) These amounts represent restricted stock units outstanding, but not yet vested, under the 2019 LTIP as of December 27, 2020.
The other information required by Item 12 is incorporated by reference herein from the Company’s Definitive Proxy Statement for its 2021 Annual Meeting of Stockholders to be filed no later than 120 days after the close of the fiscal year covered by this report, which sections are incorporated herein by reference.
Item 13. Certain Relationships and Related Transactions, and Director Independence
The information required by Item 13 is incorporated by reference herein from the Company’s Definitive Proxy Statement for its 2021 Annual Meeting of Stockholders to be filed no later than 120 days after the close of the fiscal year covered by this report, which sections are incorporated herein by reference.
Item 14. Principal Accountant Fees and Services
The information required by Item 14 is incorporated by reference herein from the Company’s Definitive Proxy Statement for its 2021 Annual Meeting of Stockholders to be filed no later than 120 days after the close of the fiscal year covered by this report, which sections are incorporated herein by reference.
95

PART IV
Item 15. Exhibits and Financial Statement Schedules
(a) Financial Statements
(i) The financial statements and schedules listed in the index to financial statements and schedules on page 1 of this annual report are filed as part of this annual report.
(ii) All other schedules for which provision is made in the applicable accounting regulations of the Securities and Exchange Commission are not required under the related instructions or are not applicable and therefore have been omitted.
(iii) The financial statements schedule entitled “Valuation and Qualifying Accounts and Reserves” is filed as part of this annual report on page 94.
(b) Exhibits
Exhibit Number
2.1 Share Purchase Agreement, dated as of September 8, 2017, among JBS S.A., Granite Holdings S.à r.l., Onix Investments UK Limited and the Company (incorporated by reference from Exhibit 2.1 of the Company’s Current Report on Form 8-K (No. 001-09273) filed on September 11, 2017).
2.2 Share Purchase Agreement, dated as of August 25, 2019, by and among Tulip International (UK) Limited and Onix Investments UK Limited (incorporated by reference from Exhibit 2.4 of the Company’s Annual Report Form 10-K filed on February 21, 2020).
2.3 Exhibits to the Share Purchase Agreement, dated as of August 25, 2019, by and among Tulip International (UK) Limited and Onix Investments UK Limited (incorporated by reference from Exhibit 2.5 of the Company’s Annual Report on Form 10-K filed on February 21, 2020).
3.1 Amended and Restated Certificate of Incorporation of the Company (incorporated by reference from Exhibit 3.1 of the Company’s Form 8-A (No. 001-09273) filed on December 27, 2012).
3.2 Amended and Restated Corporate Bylaws of the Company (incorporated by reference from Exhibit 3.2 of the Company’s Quarterly Report on Form 10-Q (No. 001-09273) filed on November 8, 2017).
4.1 Stockholders Agreement dated December 28, 2009 between the Company and JBS USA Holding Lux, S.à.r.l., formerly known as JBS USA Holdings, LLC, as amended (incorporated by reference from Exhibit 3.3 to the Company’s Form 8-A (No. 001-09273) filed on December 27, 2012).
4.2 Form of Common Stock Certificate (incorporated by reference from Exhibit 4.1 to the Company’s Current Report on Form 8-K (No. 001-09273) filed on December 29, 2009).
4.3 Indenture dated as of March 11, 2015 among the Company, Pilgrim’s Pride Corporation of West Virginia, Inc. and Wells Fargo Bank, National Association, as Trustee, Form of Senior 5.750% Note due 2025, and Form of Guarantee attached (incorporated by reference from Exhibit 4.1 of the Company’s Current Report on Form 8-K (No 001-09273) filed on March 11, 2015).
4.4 Indenture dated as of September 29, 2017 among the Company, Pilgrim’s Pride Corporation of West Virginia, Inc., Gold’n Plump Poultry, LLC, Gold’n Plump Farms, LLC, JFC LLC and U.S. Bank National Association, as Trustee (incorporated by reference from Exhibit 4.2 of the Company’s Current Report on Form 8-K (No. 001-09273) filed on October 3, 2017).
4.5 Form of Senior 5.750% Note due 2025 (included in Exhibit 4.3).
4.6 Form of Senior 5.875% Note due 2027 (included in Exhibit 4.4).
4.7 Description of Securities Registered Pursuant to Section 12(b) of the Exchange Act. (incorporated by reference from Exhibit 4.7 of the Company’s Annual Report on Form 10-K filed on February 21, 2020).
10.1 Pilgrim’s Pride Corporation Long Term Incentive Plan (incorporated by reference from Exhibit 10.2 of the Company’s Current Report on Form 8-K (No. 001-09273) filed on December 30, 2009). †
10.2 Form of Restricted Stock Unit Award Agreement (incorporated by reference to Exhibit 10.2 of the Company’s Current Report on Form 8-K (No. 001-09273) filed on September 10, 2012). †
96
10.3 Checking Account Loan Opening Contract dated July 23, 2014 among Avícola Pilgrim’s Pride de Mexico, S.A. de C.V., as borrower, Pilgrim’s Pride S. de R.L. de C.V. and Comercializadora de Carnes de Mexico, S. de R.L. de C.V., as guarantors, and BBVA Bancomer, S.A., Institución de Banca Múltiple, Grupo Financiero BBVA Bancomer, as borrower (incorporated by reference from Exhibit 10.2 of the Company’s Quarterly Report on Form 10-Q (No. 001-09273) filed on July 28, 2016).
10.4 Agreement to Modify Checking Account Loan Opening Contract dated November 3, 2015 among Avícola Pilgrim’s Pride de Mexico, S.A. de C.V., as borrower, Pilgrim’s Pride S. de R.L. de C.V. and Comercializadora de Carnes de Mexico, S. de R.L. de C.V., as guarantors, and BBVA Bancomer, S.A., Institución de Banca Múltiple, Grupo Financiero BBVA Bancomer, as borrower (incorporated by reference from Exhibit 10.3 of the Company’s Quarterly Report on Form 10-Q (No. 001-09273) filed on July 28, 2016).
10.5 Checking Account Loan Opening Contract dated September 27, 2016 among Avícola Pilgrim’s Pride de Mexico, S.A. de C.V., as borrower, Pilgrim’s Pride S. de R.L. de C.V. and Comercializadora de Carnes de Mexico, S. de R.L. de C.V., as guarantors, and BBVA Bancomer, S.A., Institución de Banca Múltiple, Grupo Financiero BBVA Bancomer, as borrower (incorporated by reference from Exhibit 10.1 of the Company’s Quarterly Report on Form 10-Q (No. 001-09273) filed on October 27, 2016).
10.6 Multicurrency Revolving Facility Agreement, dated as of June 2, 2018, by and among Moy Park Holdings (Europe) Limited, certain of its subsidiaries, the Governor and Company of the Bank of Ireland, as agent, and the other lenders party thereto (incorporated by reference from Exhibit 10.1 of the Company’s Current Report on Form 8-K (No. 001-09273) filed on June 12, 2018).
10.7 Fourth Amended and Restated Credit Agreement, dated as of July 20, 2018, by and among Pilgrim’s Pride Corporation, certain of its subsidiaries, CoBank ACB, as administrative agent and collateral agent, and the other lenders party thereto (incorporated by reference from Exhibit 10.1 of the Company’s Current Report on Form 8-K (No. 001-09273) filed on July 24, 2018).
10.8 Revolving Line of Credit Agreement, dated as of December 14, 2018, by and among Banco del Bajío, Sociedad Anónima, Institución de Banca Múltiple as lender, Avícola Pilgrim’s Pride de México, Sociedad Anónima de Capital Variable as borrower, and Comercializadora de Carnes de México, Sociedad de Responsabilidad Limitada de Capital Variable, Pilgrim’s Pride, Sociedad de Responsabilidad Limitada de Capital Variable, and Pilgrim’s Operaciones Laguna, Sociedad de Responsabilidad Limitada de Capital Variable, as guarantors (incorporated by reference from Exhibit 10.1 of the Company’s Current Report on Form 8-K (No. 001-09273) filed on December 20, 2018).
10.9 2019 Pilgrim’s Pride Corporation Long-Term Incentive Plan (incorporated by reference from Exhibit 10.14 of the Company’s Annual Report on Form 10-K filed on February 21, 2020).†
10.10 Incentive Compensation Agreement, dated as of 03/22/2019, between Jayson Penn and the Company.†
21 Subsidiaries of Registrant.*
23.1 Consent of KPMG LLP.*
31.1 Certification of Principal Executive Officer and Principal Financial Officer pursuant to Section 302 of the Sarbanes-Oxley Act of 2002.*
32.1 Certification of Principal Executive Officer and Principal Financial Officer of Pilgrim’s Pride Corporation pursuant to Section 906 of the Sarbanes-Oxley Act of 2002.**
101.INS Inline XBRL Instance Document
101.SCH Inline XBRL Taxonomy Extension Schema
101.CAL Inline XBRL Taxonomy Extension Calculation
101.DEF Inline XBRL Taxonomy Extension Definition
101.LAB Inline XBRL Taxonomy Extension Label
101.PRE Inline XBRL Taxonomy Extension Presentation
104 Cover Page Interactive Data File (formatted as Inline XBRL and contained in Exhibit 101)
* Filed herewith
** Furnished herewith
† Represents a management contract or compensation plan arrangement
97
Item 16. Form 10-K Summary
None.
SIGNATURES
Pursuant to the requirements of Section 13 or 15(d) the Securities Exchange Act of 1934, the Registrant has duly caused this report to be signed on its behalf by the undersigned, thereunto duly authorized, on February 10, 2021.
PILGRIM’S PRIDE CORPORATION
By: /s/ Fabio SandriFabio SandriPresident and Chief Executive Officer, Chief Financial Officer and Chief Accounting Officer
POWER OF ATTORNEY
KNOW ALL PERSONS BY THESE PRESENT that the undersigned officers and directors of Pilgrim’s Pride Corporation do hereby constitute and appoint Fabio Sandri as his or her true and lawful attorneys-in-fact and agents, with full power of substitution and resubstitution, for him or her and in his or her name, place and stead, in any and all capacities, to sign any and all amendments to this Annual Report on Form 10-K, and to file the same, with all exhibits thereto, and other documents in connection therewith, with the Securities and Exchange Commission, granting unto said attorney-in-fact and agent full power and authority to do and perform each and every act and thing requisite and necessary to be done in connection therewith, as fully to all intents and purposes as he or she might or could do in person, hereby ratifying and confirming that all said attorney-in-fact and agent, or any of them or their or his or her substitute or substitutes, may lawfully do or cause to be done by virtue hereof.
Pursuant to the requirements of the Securities Exchange Act of 1934, this report has been signed below by the following persons on behalf of the Registrant and in the capacities and on the dates indicated.
98

Signature Title Date
/s/ Gilberto Tomazoni Chairman of the Board February 10, 2021Gilberto Tomazoni
/s/ Fabio Sandri
President and Chief Executive Officer, Chief Financial Officer and Chief Accounting Officer
February 10, 2021
Fabio Sandri (Principal Executive Officer, Principal Financial Officer, Principal Accounting Officer and Duly Authorized Officer)
/s/ Farha Aslam Director February 10, 2021Farha Aslam
/s/ Arquimedes A. Celis Director February 10, 2021Arquimedes A. Celis
/s/ Michael L. Cooper Director February 10, 2021Michael L. Cooper
/s/ Wallim Cruz de Vasconcellos Junior Director February 10, 2021Wallim Cruz de Vasconcellos Junior
/s/ Charles Macaluso Director February 10, 2021Charles Macaluso
/s/ Denilson Molina Director February 10, 2021Denilson Molina
/s/ Andre Nogueira de Souza Director February 10, 2021Andre Nogueira de Souza
/s/ Vincent Trius Director February 10, 2021Vincent Trius
99

This page intentionally left blank.

This page intentionally left blank.

This page intentionally left blank.


PILGRIM’S PRIDE CORPOR ATION 1770 PROMONTORY CIRCLE GREELEY, CO 80634


![The Pilgrim's Progress [in Mizo]](https://img.dokumen.tips/doc/110x75/548f5a1ab47959b92f8b4850/the-pilgrims-progress-in-mizo.jpg)