Embed Size (px)
Citation preview

11
STONNINGTON.VIC.GOV.AU
2019–20Annual Report
2 City of Stonnington Annual Report 2019–20
AcknowledgementWe acknowledge that we are situated on the traditional land of the Boon Wurrung and Wurundjeri people and offer our respects to their Elders, past and present. We recognise and respect the cultural heritage of this land.
3
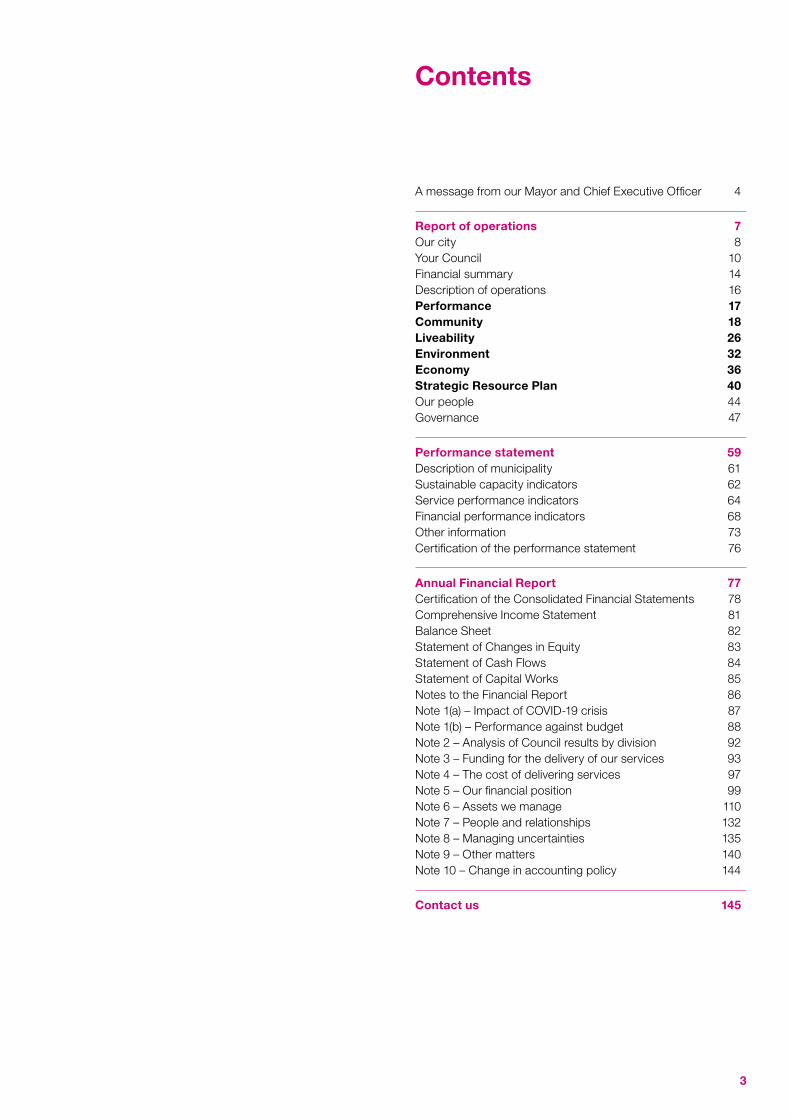
A message from our Mayor and Chief Executive Officer 4
Report of operations 7Our city 8Your Council 10Financial summary 14Description of operations 16Performance 17Community 18Liveability 26Environment 32Economy 36Strategic Resource Plan 40Our people 44Governance 47
Performance statement 59Description of municipality 61Sustainable capacity indicators 62Service performance indicators 64Financial performance indicators 68Other information 73Certification of the performance statement 76
Annual Financial Report 77Certification of the Consolidated Financial Statements 78Comprehensive Income Statement 81Balance Sheet 82Statement of Changes in Equity 83Statement of Cash Flows 84Statement of Capital Works 85Notes to the Financial Report 86Note 1(a) – Impact of COVID-19 crisis 87Note 1(b) – Performance against budget 88Note 2 – Analysis of Council results by division 92Note 3 – Funding for the delivery of our services 93Note 4 – The cost of delivering services 97Note 5 – Our financial position 99Note 6 – Assets we manage 110Note 7 – People and relationships 132Note 8 – Managing uncertainties 135Note 9 – Other matters 140Note 10 – Change in accounting policy 144
Contact us 145
Contents

4 City of Stonnington Annual Report 2019–20
A message from our Mayor and Chief Executive Officer
The Financial Year 2019–20 was the third year of the City of Stonnington Council Plan 2017–21. Notwithstanding the unprecedented health and economic shocks brought about by COVID-19, the City of Stonnington performed strongly against the Council Plan’s four pillars: community, liveability, environment and economy.
Council is proud to have created opportunities, under its plan, to bring our community together, implement a range of long-term strategic policies and invest in infrastructure to ensure Stonnington remains one of Australia’s premier municipalities.

5
Despite the challenges, we remain focused on being a future ready organisation that puts the customer at the centre of everything we do. We are committed to being efficient, fit for purpose, responsive and agile, delivering high quality services and responding to the changing needs of our community.
A year of challengesThe devastating bushfires during the summer of 2019-20 hit our regional local government colleagues hard. The effects were felt locally, with a number of Council services and facilities forced to close due to poor air quality.
The bushfires were soon followed by the global outbreak of COVID-19. The second half of the year therefore took on an entirely different complexion as Council responded to rapidly moving events.
Council acted quickly to implement a range of measures to help slow the spread of COVID-19 and to protect our people and the community. These measures included the re-design of services and facilities, temporary closures of our libraries, aquatics and leisure centres and face-to-face child and maternal health services.
It was a difficult decision to stand down hundreds of loyal staff – and send hundreds more to work from home. The resilience with which the organisation responded to these changes was a testimony to the commitment of our people.
Meanwhile, as the community experienced successive waves of the pandemic, core Council services such as waste collection, street maintenance and open space management became more important than ever.
Our frontline teams – from street cleaners to those helping society’s most vulnerable – worked tirelessly to keep the municipality clean, support the directives of health authorities and provide outlets for the community’s physical and mental wellbeing.
Impact on the BudgetThe impact of COVID-19 on Council’s Budget has been significant and the reverberations will continue for many years.
There was an immediate decline in revenue of $9.6 million from the 2019–20 forecast. The 2020–21 Budget was re-designed to reflect a deeply impacted economic environment.
Due to many years of prudent financial management, Council was in the position to offer approximately $5 million in relief for residents and businesses, while remaining committed to critical long-term capital projects that create jobs and economic opportunity.
From the re-imagining of Prahran Town Hall, to many smaller projects across our neighbourhoods such as footpath and playground upgrades, these initiatives provide important economic stimulus and employment opportunities.
Projects and infrastructureCouncil was delighted to open Prahran Square in late 2019.The new heart of Prahran has spaces to relax, catch up with friends or just take a breather from the hustle and bustle. Alongside hundreds of safe and secure car spaces – including our first electric car charging stations – Prahran Square will be home to many exciting community events, boosting patronage to nearby cafés, bars, restaurants and retail stores.
Planning for the Percy Treyvaud Memorial Park Masterplan also continued. It will guide the proposed development of new community sporting facilities and park improvements.
Important projects delivered this year include:
» Grosvenor Street Maternal Child Health Centre upgrade
» Toorak Park/Victory Square Masterplan Stage 1 completion
» Caroline Gardens redevelopment
» King Street Walk
» Gardiner Park redevelopment and first synthetic sports ground
» Gladstone Gardens and Carters Avenue Reserve, and
» Princess Gardens Masterplan Stage 1 implementation.
We continued to invest in our neighbourhoods, including the Kooyong Village Shopping Precinct upgrade and Mount Street and Forrest Hill Masterplans, as well as adding valuable pocket parks in Mount, Balmoral, Regent, Porter and Grattan streets.
Our rehabilitation and revegetation works continued across the city, particularly along the Yarra River, an increasingly popular recreation area.

6 City of Stonnington Annual Report 2019–20
Climate and sustainabilityIn February 2020, Council declared a climate emergency. This recognises the need for immediate and urgent action on climate change.
Council’s Climate Emergency Action Plan will include actions we are taking to reduce corporate and community emissions, increase canopy cover, enhance biodiversity, improve resource recovery, and support the community and businesses to take action.
Sustainability highlights in 2019-20 include:
» Committed to purchasing 100 per cent of electricity supply from renewables from July 2021
» Installed electric vehicle charging stations at Prahran Square carpark
» Saved 1.6 million litres of water at Prahran Aquatic Centre
» Planted 1,981 trees and 23,660 plants
» Trialled permeable paving at Kingston Street carpark, Malvern East, allowing capture water to irrigate nearby Central Park
» Expanded kerbside waste service to include food waste, and
» Hosted Melbourne’s biggest clothes swap event.
Events and economic developmentCouncil continued to roll out its well known and popular series of events, celebrating the diversity, culture, arts and sense of community that make Stonnington special.
COVID-19 forced a reimagined events program. New opportunities for Council to connect to community came from using online technology and innovation.
The Economic Development team initiated several successful programs and campaigns to showcase Stonnington as a great place to live, work and invest, including the See Opportunity campaign.
We provided strong support to our uniquely different precincts and retail strips, including creative marketing campaigns, business education and networking programs.
TransformationIn late 2019, the City of Stonnington unveiled a new corporate structure, designed to enable a transformation to a more customer-focused, agile and efficient business model.
Work is now well underway on a major overhaul of the complex and ageing business systems and infrastructure that underpin our operations. This will lay the groundwork for a digital-first service that will result in a superior customer experience, drive internal efficiencies and provide ratepayers with greater value for money.
AdvocacyCouncil significantly stepped up its advocacy program on behalf of the community, working both unilaterally and in partnership with other councils on a range of challenges and opportunities, including homelessness, waste and recycling management, Victoria’s major projects program, the implementation of the new Local Government Act and improvements to Melbourne’s cycling infrastructure network.
FarewellsCouncil would like to acknowledge the many years of wonderful service of former Corporate Services Director Geoff Cockram, who retired after more than 14 years of service.
Cr Steven Stefanopoulos Mayor
Jacqui Weatherill Chief Executive Officer
Postscript from Cr Stefanopoulos
It was an honour to have served a third term as Mayor and spend more than 1,000 days leading what I believe is Victoria’s most successful municipality. Congratulations to Cr John Chandler, who was appointed our first Deputy Mayor. John was also Stonnington’s first Mayor in 1996.
I could not have been better supported by my fellow Councillors and the wonderful dedicated staff who strive to make Stonnington a better place every day. I was also delighted to host the Mayoral Charity Fundraiser for the Victorian Pride Centre, an Australia-first which celebrated the LGBTIQ+ community.
I particularly thank my fellow Councillors for the way in which we have come together, on behalf of our community, to navigate these difficult times.
A message from our Mayor and Chief Executive OfficerCont...
7
Report of operations
7

8 City of Stonnington Annual Report 2019–20
Our city
The City of Stonnington is located in Melbourne’s inner south-east, alongside the Yarra River, covering an area of 25.62 square kilometres. Stonnington takes in the suburbs of Armadale, Kooyong, Malvern, Malvern East, Prahran, Toorak and parts of Glen Iris, South Yarra and Windsor.
Stonnington is primarily a residential area, with some commercial, industrial, office and institutional land uses. The municipality is well known for shopping and lifestyle precincts, parks and gardens, leafy streets and historical architecture.
The estimated resident population in 2020 is 120,784. It is anticipated that the municipality will experience population growth of approximately 18.61 per cent to 2036.
Our community Stonnington has a relatively young population, with 35 per cent of residents aged 18–34 years and a median age of 35 years.
Of the families in Stonnington, 20 per cent are couples with children, 25 per cent are couples without children and 5.5 per cent are one-parent families.
Of all households, 32 per cent are single-person households, 8.9 per cent are group households, and the average size across all households is 2.1 persons per dwelling.
Stonnington has a culturally and economically diverse population. The housing stock ranges from some of Melbourne’s finest mansions to large blocks of public housing, an indication of the community’s contrasting lifestyles, needs and expectations. Nearly one-quarter of the community speak a language other than English at home, with the top five non-English languages being Mandarin, Greek, Cantonese, Italian and Spanish. Almost one-third of the community was born overseas, and the top five nations of origin are China, the United Kingdom, India, New Zealand and Greece.
Stonnington has 3,463 residents who have a disability requiring assistance with core activities, and almost one in 10 residents act in the role of unpaid carer for a person with a disability.
Just over a quarter (25.5 per cent) of residents fully own their home, with a further 21 per cent paying off a mortgage and 44.2 per cent renting.
Stonnington is home to 18,512 businesses creating 70,456 local jobs. The retail trade (20.4 per cent) and health care and social assistance (17.0 per cent) industries are Stonnington’s largest employers. This adds to our $10.09 billion gross regional product and contributes significantly to Stonnington’s vibrancy and prosperity.
Our history Stonnington was formed in June 1994 through the amalgamation of the cities of Malvern and Prahran. Stonnington takes its name from a historically significant mansion in the area, which was named after Stonington in Connecticut, USA.
Stonnington is situated on the traditional land of the Boon Wurrung and Wurundjeri people. The Boon Wurrung and Woiwurrung, a clan of the Wurundjeri people, continued to live along the Yarra River as European settlement expanded beyond the centre of the Port Phillip district (Melbourne) in the 1800s.
As part of the expanding development of the area, the first Prahran Market was established in 1864. Originally known as Fitzroy Road, Chapel Street was named in 1852 when the first chapel was built.
The first commercial activity along Chapel Street was established in the late 1830s, making it one of the oldest shopping strips in Melbourne today.
Local government has operated in the area for more than 160 years. The first municipal election was held in Prahran in 1856, and the Prahran Town Hall opened in 1861. Planning for the Malvern Town Hall commenced as early as 1867, with the Shire of Malvern, as it was then, holding its first meeting there in 1886.
9Report of operations
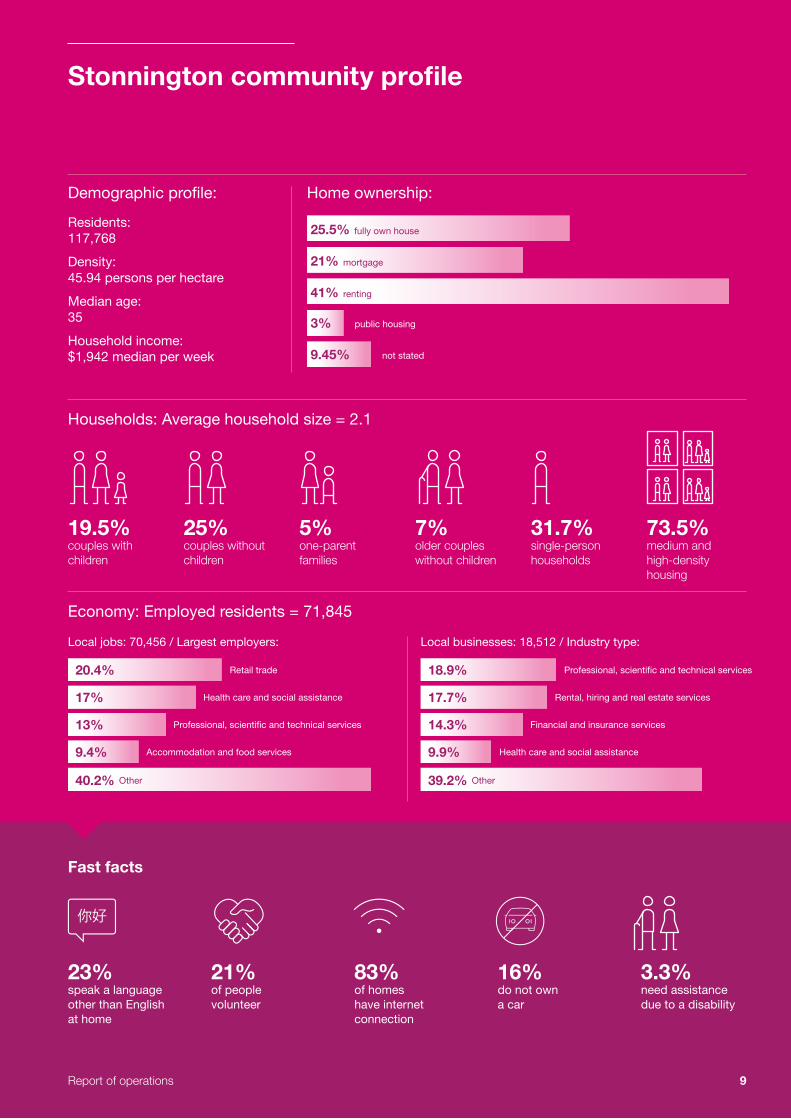
Stonnington community profile
Residents: 117,768
Density: 45.94 persons per hectare
Median age: 35
Household income: $1,942 median per week
Fast facts
23%speak a language other than English at home
21%of people volunteer
83%of homes have internet connection
16% do not own a car
3.3% need assistance due to a disability
Households: Average household size = 2.1
Economy: Employed residents = 71,845
Demographic profile: Home ownership:
9.45%
3%
41% renting
public housing
not stated
21% mortgage
25.5% fully own house
19.5%couples with children
25%couples without children
5%one-parent families
7%older coupleswithout children
31.7%single-personhouseholds
73.5%medium and high-densityhousing
20.4% 18.9%
13% 14.3%
17% 17.7%
9.4% 9.9%
40.2% Other 39.2% Other
Professional, scientific and technical services Financial and insurance services
Health care and social assistance Rental, hiring and real estate services
Retail trade Professional, scientific and technical services
Accommodation and food services Health care and social assistance
Local jobs: 70,456 / Largest employers: Local businesses: 18,512 / Industry type:

10 City of Stonnington Annual Report 2019–20
Your Council
Council’s commitmentCouncil endeavours to achieve the best outcomes for the community having regard to the long-term and cumulative effects of its decisions.
In seeking to achieve its primary purpose, Council will facilitate the following:
» Promote the social, economic and environmental viability and sustainability of the city.
» Ensure resources are used efficiently and effectively and that services are provided in accordance with the best value principles to meet the needs of the community.
» Improve the overall quality of people’s lives in the community.
» Promote appropriate business and employment opportunities.
» Continually upgrade Council’s services and facilities to be accessible and equitable.
» Ensure the equitable imposition of rates and charges.
» Ensure transparency and accountability in decision-making.
The purpose of local government is specified in the Local Government Act 1989.
Our valuesCity of Stonnington has a clear strength in the bond and affinity between its Councillors, the community and staff. Staff support the community leadership and governance role of Councillors, and work together to achieve the commitments of the Council Plan. Having all City of Stonnington staff practise the following organisational values enhances the quality of this partnership:
» Cooperation – We know that working together means we get better results. We are a team and together we achieve great things for our community. Our citizens, community and service users are the focus of all our actions.
» Change and New Ideas – Finding better ways to do things and sometimes doing things that haven’t been done before keeps us challenged, inspired and relevant.
» Learning – We encourage learning and create opportunities for people to grow and succeed for the benefit of our community.
» Achievement – We work hard to achieve great outcomes, strive for excellence and celebrate our successes.
» Communication – We communicate in a respectful, transparent and inclusive manner. Being open and honest in our communications allows us to make better decisions.
» Accountability – We do things the right way for the right reasons. We are responsible and accountable for the work we do and the way we do it.
Council’s vision:Stonnington will be an inclusive, healthy, creative, sustainable and smart community.
Cooperation Change and New Ideas
Learning Achievement Communication Accountability

11Report of operations
Cr Melina Sehr
First elected 2002, re-elected 2004, 2008, 2012 and 2016. Mayor 2003–04, March–November 2004, and 2010–11.
Cr Jami Klisaris
First elected 2012, re-elected 2016.
Mayor 2016–17.
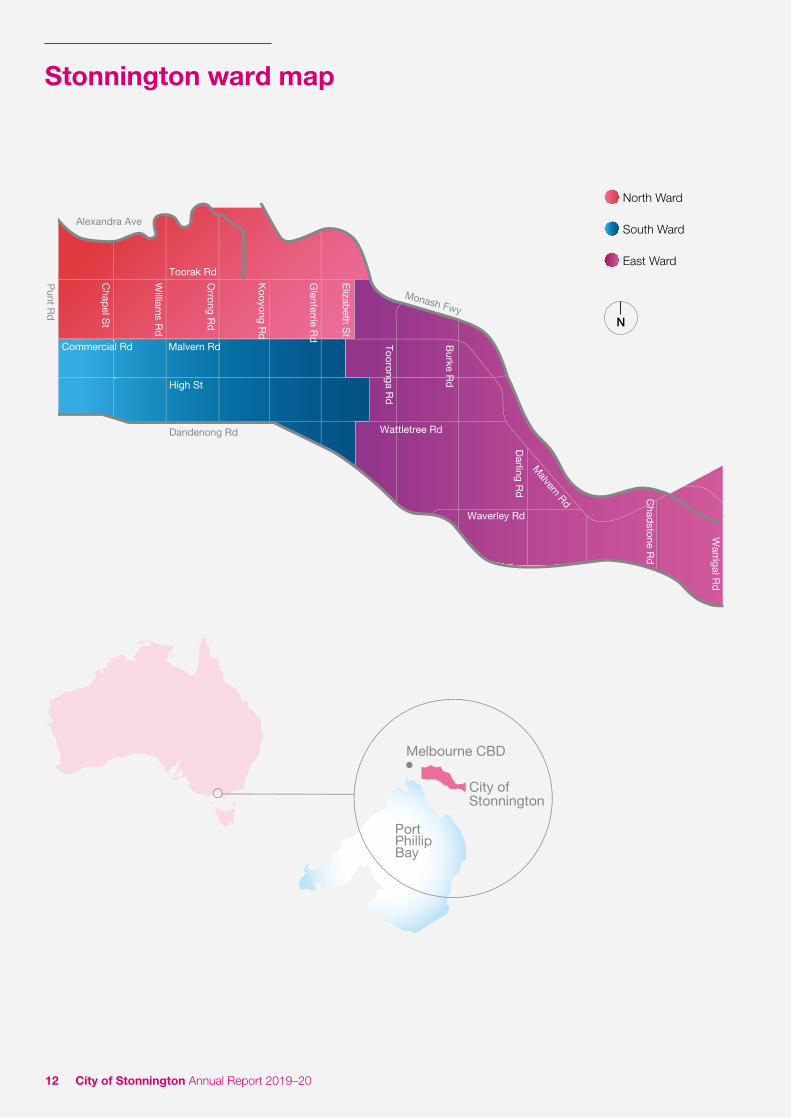
North Ward
Cr John Chandler
First elected 1996, re-elected 1999, 2002, 2004, 2008, 2012 and 2016. Mayor 1996–97, 2006–07 and 2011–12. Deputy mayor 2019–20. Served as an elected Councillor and Mayor of the former City of Prahran.
Cr Marcia Griffin
First elected 2016.
Cr Matthew Koce
First elected 2012, re-elected 2016. Mayor 2012–13.
South Ward
Cr Judy Hindle
First elected 2002, re-elected 2004, 2008 and 2016.
Cr Steve Stefanopoulos
First elected 2004, re-elected 2016. Mayor 2017–20.
Cr Glen Atwell
First elected 2016.
Cr Sally Davis
First elected 1999, re-elected 2002 and 2016. Mayor 2002–03.
East Ward
Councillors
Melbourne CBD
City ofStonnington
Port Phillip Bay
William
s Rd
Commercial Rd
Toorak Rd
Punt Rd
Chapel St
Kooyong Rd
Glenferrie Rd
Alexandra Ave
Elizabeth StDandenong Rd
High St
Orrong Rd
Warrigal Rd
Darling Rd
Burke Rd
Tooronga Rd
Monash Fwy
Malvern Rd
Waverley Rd
Wattletree Rd
Chadstone Rd
Malvern Rd
North Ward
South Ward
East Ward
Stonnington ward map
Melbourne CBD
City ofStonnington
Port Phillip Bay
William
s Rd
Commercial Rd
Toorak Rd
Punt Rd
Chapel St
Kooyong Rd
Glenferrie Rd
Alexandra Ave
Elizabeth St
Dandenong Rd
High St
Orrong Rd
Warrigal Rd
Darling Rd
Burke Rd
Tooronga Rd
Monash Fwy
Malvern Rd
Waverley Rd
Wattletree Rd
Chadstone Rd
Malvern Rd
12 City of Stonnington Annual Report 2019–20
13Report of operations
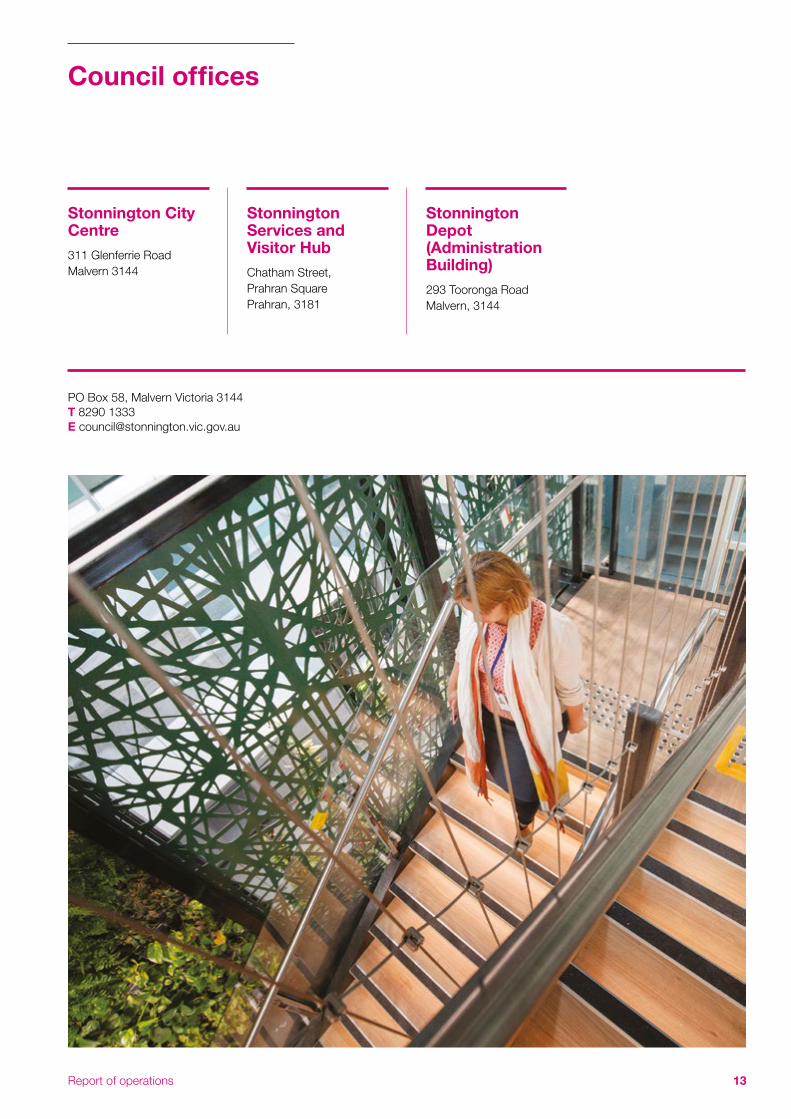
Council offices
Stonnington City Centre311 Glenferrie Road Malvern 3144
Stonnington Services and Visitor HubChatham Street, Prahran Square Prahran, 3181
Stonnington Depot (Administration Building)293 Tooronga Road Malvern, 3144
PO Box 58, Malvern Victoria 3144T 8290 1333E [email protected]
Melbourne CBD
City ofStonnington
Port Phillip Bay
William
s Rd
Commercial Rd
Toorak Rd
Punt Rd
Chapel St
Kooyong Rd
Glenferrie Rd
Alexandra Ave
Elizabeth St
Dandenong Rd
High St
Orrong Rd
Warrigal Rd
Darling Rd
Burke Rd
Tooronga Rd
Monash Fwy
Malvern Rd
Waverley Rd
Wattletree Rd
Chadstone Rd
Malvern Rd

14 City of Stonnington Annual Report 2019–20
Financial summary
Council’s financial position continues to remain strong. A summary of our performance is outlined below. Detailed information relating to Council’s financial performance is included within the Financial Statements and Performance Statement sections of this report.
The Financial Statements are a general purpose financial report compliant with Australian Accounting Standards, the Local Government Act 1989, and the Local Government (Planning and Reporting) Regulations 2014. Consistent with the regulations, these statements are prepared in accordance with the Local Government Model Financial Report.
Operating positionDuring the 2019–20 financial year COVID-19 significantly impacted the delivery of all non-essential services and core service were forced to adapt to the impact of social restrictions. Measures taken to mitigate the crisis has impacted City of Stonnington’s operations at year ended 30 June 2020.
Council achieved a surplus of $25.98 million in 2019–20. Rates and Charges revenue was $117.74 million. The average rate was capped at 2.5% for 2019–20, and there was some growth in the number of rateable properties as a result of development activity. $12.75 million of total revenue was attributable to open space contributions, which will be used to fund future investments in the creation of open space in response to our growing population.
Employee costs were $68.81 million with Council providing employment opportunities for over 900 employees. Expenditure on materials and services was $60.55 million, enabling Council to deliver an array of high quality services to the community. The adjusted underlying surplus of Council, after removing non-recurrent capital grants, cash capital contributions and non-monetary contributions, is $12.4 million or 6.97% when compared to adjusted underlying revenue. Sustaining an adjusted underlying surplus is a critical financial strategy that provides capacity to assist in funding the renewal of the $2.93 billion of community assets under Council’s control.
LiquidityCouncil’s current assets includes cash and cash equivalents, investments in term deposits (other financial assets) and other assets. Current assets were $120.48 million in 2019–20 compared to $125.21 million in 2018–19. The working capital (liquidity) ratio, which assesses Council’s ability to meet current commitments, is calculated by measuring Council’s current assets as a percentage of current liabilities. Council’s result of 272% is an indicator of an excellent financial position and exceeds the expected target band of 120% to 200%.
AD
JU
ST
ED
UN
DE
RLY
ING
RE
SU
LT R
AT
IO %
WO
RK
ING
CA
PIT
AL R
AT
IO %
2016–17 2016–17
0 100
8 200
4 150
12 250
2
10
6
14
16
18
300
2018–19 2018–192017–18 2017–182019–20 2019–20
15Report of operations
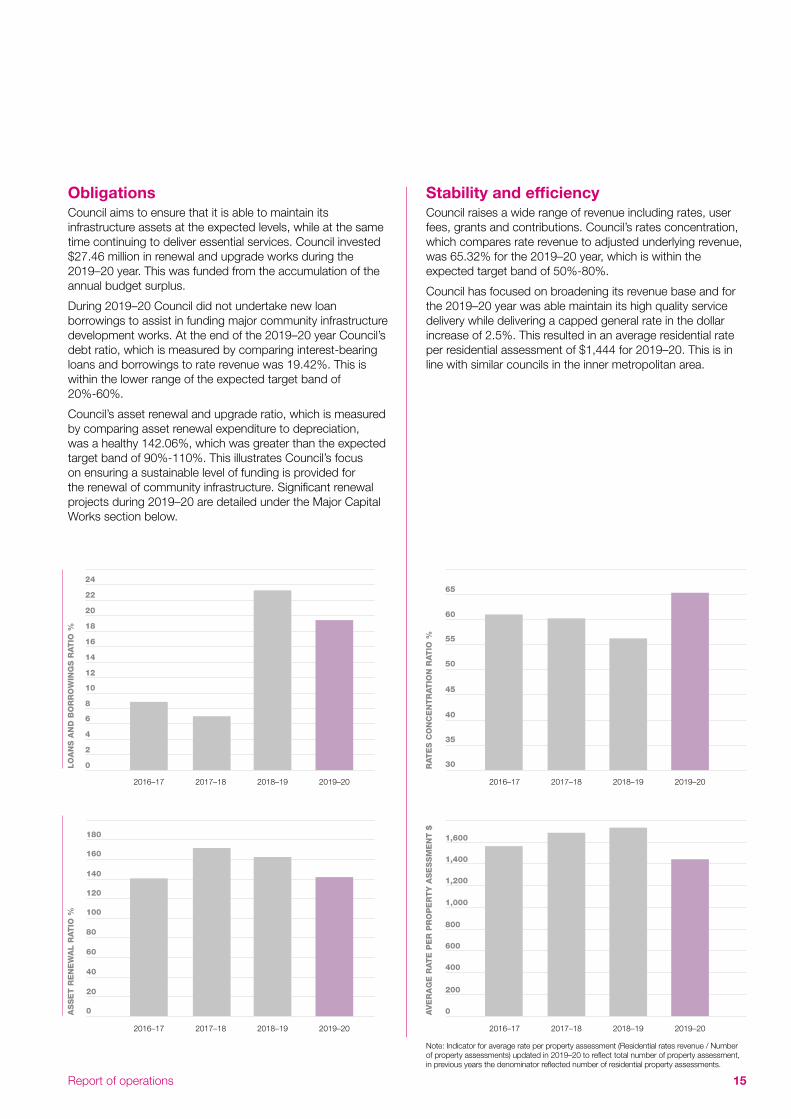
ObligationsCouncil aims to ensure that it is able to maintain its infrastructure assets at the expected levels, while at the same time continuing to deliver essential services. Council invested $27.46 million in renewal and upgrade works during the 2019–20 year. This was funded from the accumulation of the annual budget surplus.
During 2019–20 Council did not undertake new loan borrowings to assist in funding major community infrastructure development works. At the end of the 2019–20 year Council’s debt ratio, which is measured by comparing interest-bearing loans and borrowings to rate revenue was 19.42%. This is within the lower range of the expected target band of 20%-60%.
Council’s asset renewal and upgrade ratio, which is measured by comparing asset renewal expenditure to depreciation, was a healthy 142.06%, which was greater than the expected target band of 90%-110%. This illustrates Council’s focus on ensuring a sustainable level of funding is provided for the renewal of community infrastructure. Significant renewal projects during 2019–20 are detailed under the Major Capital Works section below.
Stability and efficiencyCouncil raises a wide range of revenue including rates, user fees, grants and contributions. Council’s rates concentration, which compares rate revenue to adjusted underlying revenue, was 65.32% for the 2019–20 year, which is within the expected target band of 50%-80%.
Council has focused on broadening its revenue base and for the 2019–20 year was able maintain its high quality service delivery while delivering a capped general rate in the dollar increase of 2.5%. This resulted in an average residential rate per residential assessment of $1,444 for 2019–20. This is in line with similar councils in the inner metropolitan area.
AS
SE
T R
EN
EW
AL R
AT
IO %
LO
AN
S A
ND
BO
RR
OW
ING
S R
AT
IO %
AV
ER
AG
E R
AT
E P
ER
PR
OP
ER
TY
AS
ES
SM
EN
T $
RAT
ES
CO
NC
EN
TR
AT
ION
RAT
IO %
2016–17
2016–17
2016–17
2016–17
0
80
160
40
120
20
100
180
60
140
0
4
8
12
16
20
24
2
6
10
14
18
22
0
800
400
1,200
200
1,000
600
1,400
1,600
30
45
35
50
40
55
65
60
2018–19
2018–19
2018–19
2018–19
2017–18
2017–18
2017–18
2017–18
2019–20
2019–20
2019–20
2019–20
Note: Indicator for average rate per property assessment (Residential rates revenue / Number of property assessments) updated in 2019–20 to reflect total number of property assessment, in previous years the denominator reflected number of residential property assessments.

16 City of Stonnington Annual Report 2019–20
Description of operations
The City of Stonnington is responsible for a broad range of services including family and children’s services, transport and parking regulation, open space, youth facilities, waste management, community buildings, economic and cultural development, planning for appropriate development and ensuring accountability for financial resources.
Our community services and infrastructure support the wellbeing and prosperity of the community. Council’s vision, strategic objectives and strategies to further improve services and facilities for the period of this Annual Report are further described in the Council Plan 2017–21 and the Budget 2019–2020.
Delivering services, facilities, support and advocacy to achieve the key strategic objectives is measured by a set of service performance indicators and measures set by the State Government. Council also has a wide range of reporting responsibilities under Victorian and Australian legislation.
Major capital works During 2019–20 the overall expenditure on capital works was $46.55 million and included:
» Prahran Square development project ($15.59 million)
» Open space acquisition and development ($1.03 million)
» Roads and Footpaths ($6.69 million)
» Drainage improvements ($2.91 million) – including road drainage replacement works
» Harold Holt Swim Centre Masterplan implementation ($0.86 million)
» Percey Treyvaud Memorial Park Masterplan development ($1.03 million)
» Princes Gardens Masterplan implementation ($0.36 million)
» Prahran Town Hall Masterplan development ($0.78 million)
» Toorak Park Masterplan implementation ($2.47 million)
» Windsor Siding Masterplan implementation ($0.56 million)
» Forest Hill Public Realm ($0.58 million)
» Bicycle strategy and path improvement ($0.42 million)
» Floodlighting development program ($0.41 million)
» Street light LED upgrade and solar upgrades ($0.51 million)
» Library materials ($0.84 million), and
» Public art and sculpture acquisition program ($0.7 million).
Major achievements » Official opening of Prahran Square
» Declared a climate change emergency
» Achieved Council’s 2020 greenhouse gas emissions target
» Completed Harold Holt Swim Centre improvement works
» Redeveloped Gardiner Park, featuring Council’s first synthetic sports ground
» Completed Victory Square improvement works
» Adopted Inclusion Plan 2019–2022, and
» Delivered recovery planning, strategies and community awareness campaigns in response to COVID-19 pandemic.
Major changes Ms Jacqui Weatherill commenced as Chief Executive Officer on 22 July 2019. A restructure was undertaken during 2019–20 as part of building a fit-for-purpose organisation that is future ready. This included developing a new directorate to elevate community engagement and innovation.
The Local Government Act 2020 commenced its staged proclamation and implementation during 2019–20. It represents the most ambitious reform to the local government sector in over 30 years. The Act will improve local government democracy, accountability and service delivery for all Victorians.
The new Local Government Act 2020 will be implemented in stages from April 2020 to July 2021. During this transition period many of Council’s obligations will still be governed by the Local Government Act 1989 .
Economic factors On 11 March 2020, COVID-19 was declared a global pandemic and a state of emergency was declared in Victoria on 16 March 2020.
Council enacted its Business Continuity and Pandemic Plans on 17 March 2020, with a focus on maintaining core services.
COVID-19 significantly impacted the delivery of all non-essential services and core services adapted to the impact of restrictions. Measures taken to mitigate the crisis have impacted City of Stonnington’s operations and financial performance.
A summary of these impacts is included in the financial report under Note 1(a) – Impact of COVID-19 crisis on City of Stonnington’s operations and 2019–20 financial report.
17Report of operations
Performance
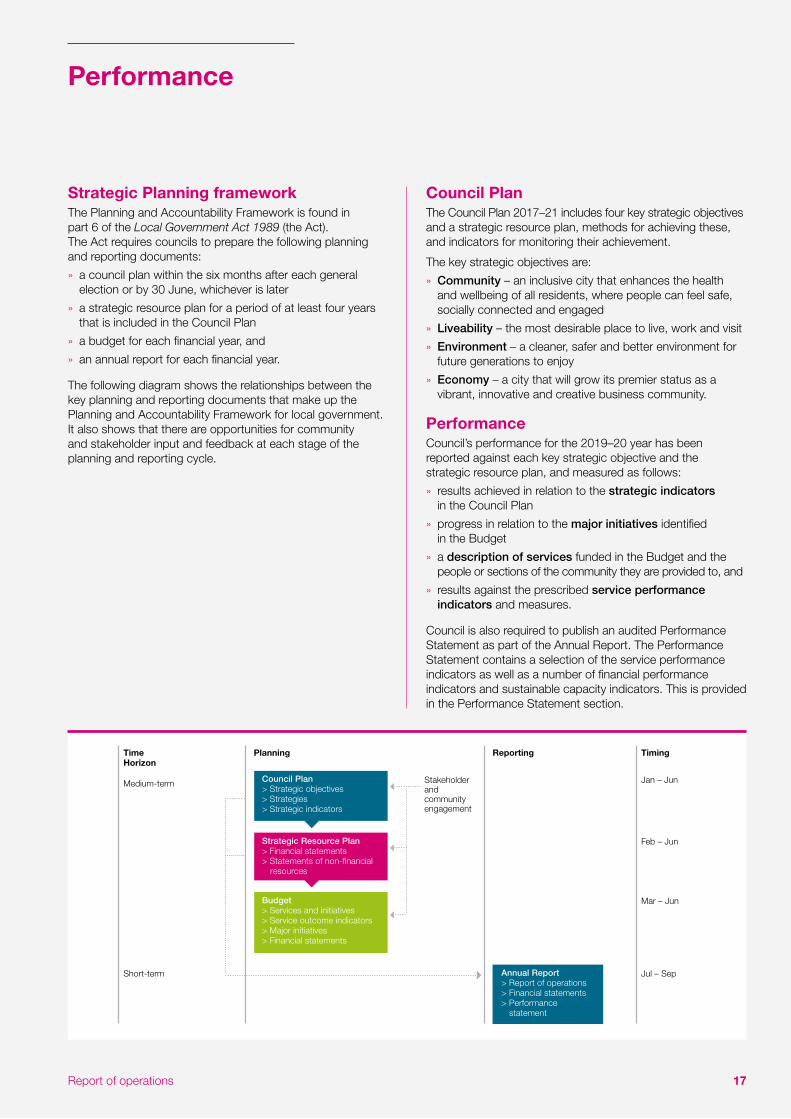
Strategic Planning framework The Planning and Accountability Framework is found in part 6 of the Local Government Act 1989 (the Act). The Act requires councils to prepare the following planning and reporting documents:
» a council plan within the six months after each general election or by 30 June, whichever is later
» a strategic resource plan for a period of at least four years that is included in the Council Plan
» a budget for each financial year, and
» an annual report for each financial year.
The following diagram shows the relationships between the key planning and reporting documents that make up the Planning and Accountability Framework for local government. It also shows that there are opportunities for community and stakeholder input and feedback at each stage of the planning and reporting cycle.
Council Plan The Council Plan 2017–21 includes four key strategic objectives and a strategic resource plan, methods for achieving these, and indicators for monitoring their achievement.
The key strategic objectives are:
» Community – an inclusive city that enhances the health and wellbeing of all residents, where people can feel safe, socially connected and engaged
» Liveability – the most desirable place to live, work and visit
» Environment – a cleaner, safer and better environment for future generations to enjoy
» Economy – a city that will grow its premier status as a vibrant, innovative and creative business community.
Performance Council’s performance for the 2019–20 year has been reported against each key strategic objective and the strategic resource plan, and measured as follows:
» results achieved in relation to the strategic indicators in the Council Plan
» progress in relation to the major initiatives identified in the Budget
» a description of services funded in the Budget and the people or sections of the community they are provided to, and
» results against the prescribed service performance indicators and measures.
Council is also required to publish an audited Performance Statement as part of the Annual Report. The Performance Statement contains a selection of the service performance indicators as well as a number of financial performance indicators and sustainable capacity indicators. This is provided in the Performance Statement section.
TimeHorizon
Planning Reporting Timing
Medium-term Stakeholder and community engagement
Jan – Jun
Feb – Jun
Mar – Jun
Short-term Jul – Sep
Council Plan> Strategic objectives> Strategies> Strategic indicators
Strategic Resource Plan> Financial statements> Statements of non-financial resources
Budget> Services and initiatives> Service outcome indicators> Major initiatives> Financial statements
Annual Report> Report of operations> Financial statements> Performance statement
18 City of Stonnington Annual Report 2019–20
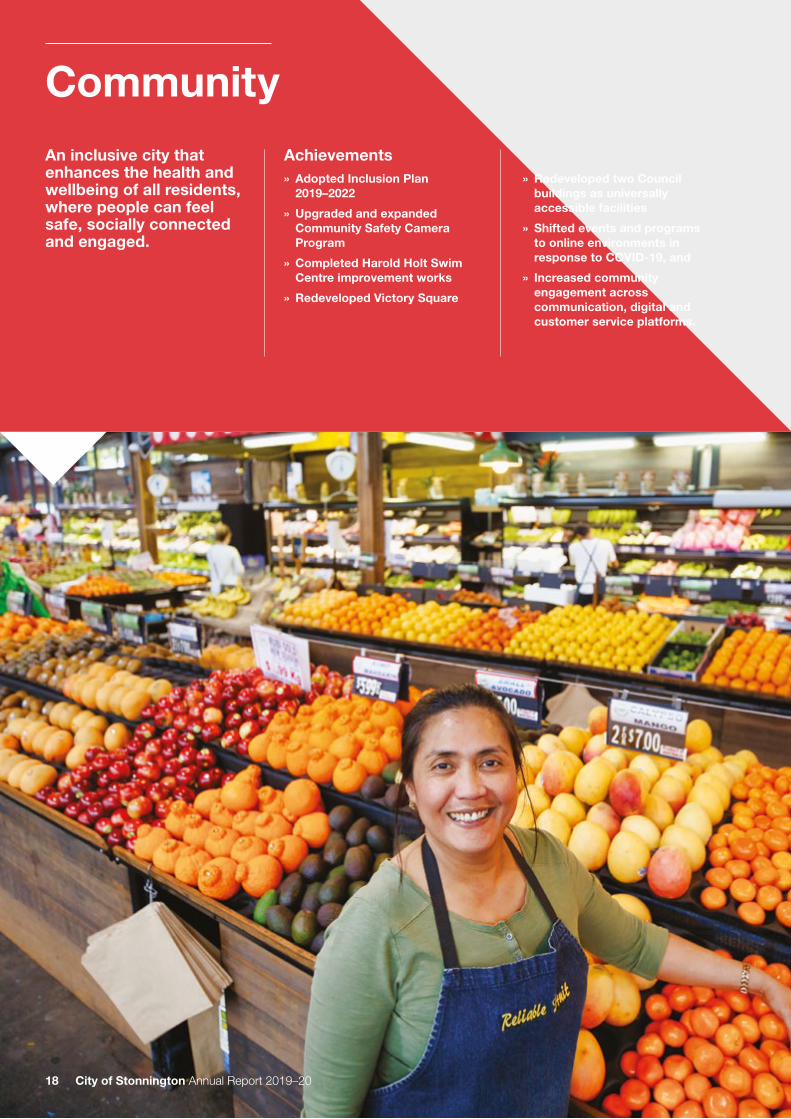
Community
An inclusive city that enhances the health and wellbeing of all residents, where people can feel safe, socially connected and engaged.
Achievements » Adopted Inclusion Plan
2019–2022
» Upgraded and expanded Community Safety Camera Program
» Completed Harold Holt Swim Centre improvement works
» Redeveloped Victory Square
» Redeveloped two Council buildings as universally accessible facilities
» Shifted events and programs to online environments in response to COVID-19, and
» Increased community engagement across communication, digital and customer service platforms.
19Report of operations
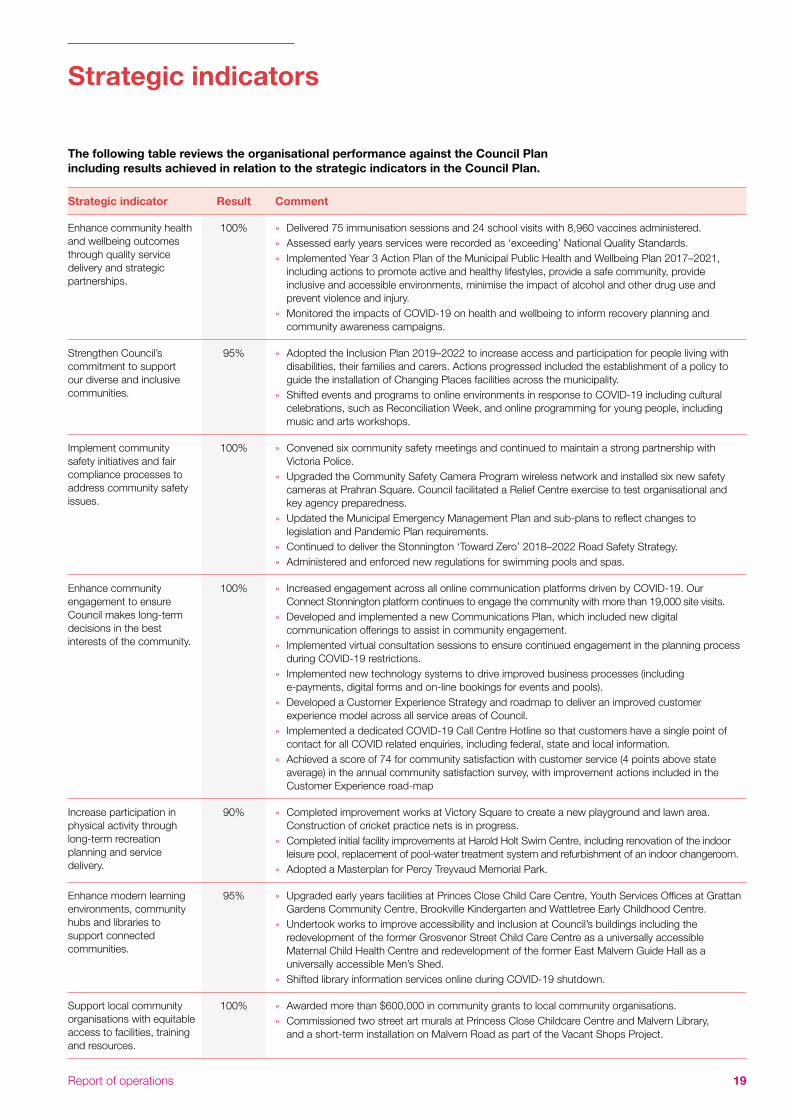
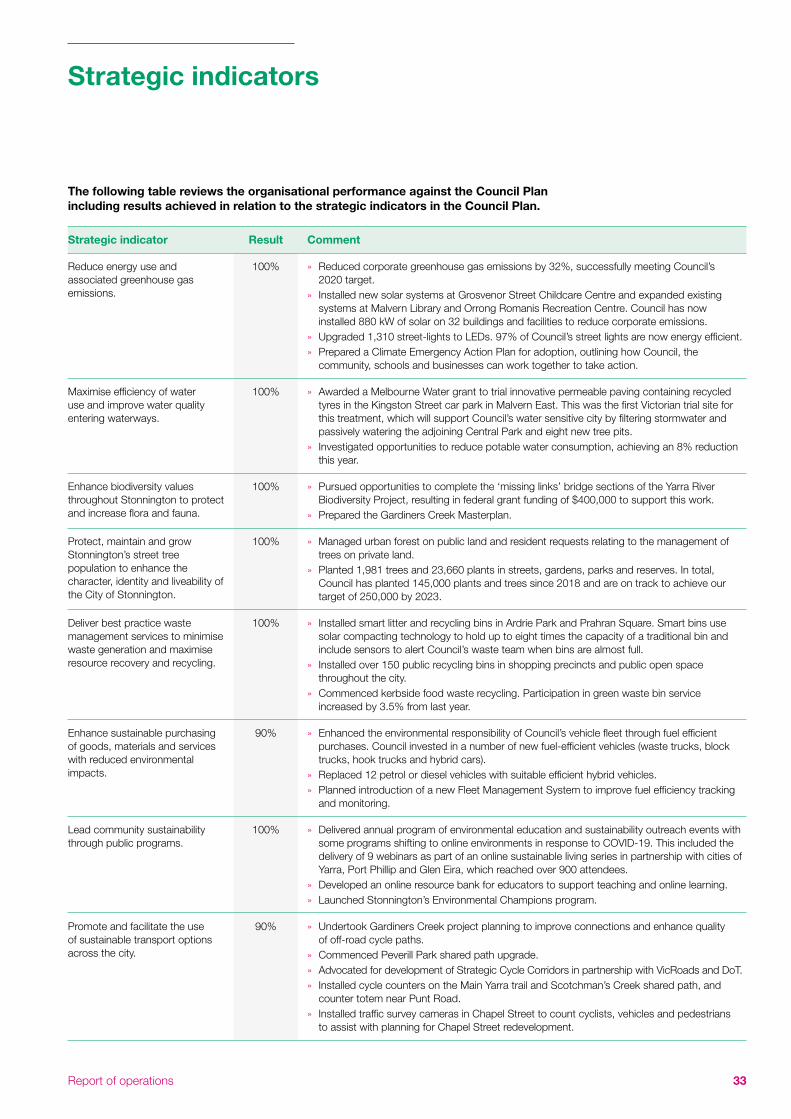
Strategic indicators
The following table reviews the organisational performance against the Council Plan including results achieved in relation to the strategic indicators in the Council Plan.
Strategic indicator Result Comment
Enhance community health and wellbeing outcomes through quality service delivery and strategic partnerships.
100% » Delivered 75 immunisation sessions and 24 school visits with 8,960 vaccines administered. » Assessed early years services were recorded as ‘exceeding’ National Quality Standards. » Implemented Year 3 Action Plan of the Municipal Public Health and Wellbeing Plan 2017–2021,
including actions to promote active and healthy lifestyles, provide a safe community, provide inclusive and accessible environments, minimise the impact of alcohol and other drug use and prevent violence and injury.
» Monitored the impacts of COVID-19 on health and wellbeing to inform recovery planning and community awareness campaigns.
Strengthen Council’s commitment to support our diverse and inclusive communities.
95% » Adopted the Inclusion Plan 2019–2022 to increase access and participation for people living with disabilities, their families and carers. Actions progressed included the establishment of a policy to guide the installation of Changing Places facilities across the municipality.
» Shifted events and programs to online environments in response to COVID-19 including cultural celebrations, such as Reconciliation Week, and online programming for young people, including music and arts workshops.
Implement community safety initiatives and fair compliance processes to address community safety issues.
100% » Convened six community safety meetings and continued to maintain a strong partnership with Victoria Police.
» Upgraded the Community Safety Camera Program wireless network and installed six new safety cameras at Prahran Square. Council facilitated a Relief Centre exercise to test organisational and key agency preparedness.
» Updated the Municipal Emergency Management Plan and sub-plans to reflect changes to legislation and Pandemic Plan requirements.
» Continued to deliver the Stonnington ‘Toward Zero’ 2018–2022 Road Safety Strategy. » Administered and enforced new regulations for swimming pools and spas.
Enhance community engagement to ensure Council makes long-term decisions in the best interests of the community.
100% » Increased engagement across all online communication platforms driven by COVID-19. Our Connect Stonnington platform continues to engage the community with more than 19,000 site visits.
» Developed and implemented a new Communications Plan, which included new digital communication offerings to assist in community engagement.
» Implemented virtual consultation sessions to ensure continued engagement in the planning process during COVID-19 restrictions.
» Implemented new technology systems to drive improved business processes (including e-payments, digital forms and on-line bookings for events and pools).
» Developed a Customer Experience Strategy and roadmap to deliver an improved customer experience model across all service areas of Council.
» Implemented a dedicated COVID-19 Call Centre Hotline so that customers have a single point of contact for all COVID related enquiries, including federal, state and local information.
» Achieved a score of 74 for community satisfaction with customer service (4 points above state average) in the annual community satisfaction survey, with improvement actions included in the Customer Experience road-map
Increase participation in physical activity through long-term recreation planning and service delivery.
90% » Completed improvement works at Victory Square to create a new playground and lawn area. Construction of cricket practice nets is in progress.
» Completed initial facility improvements at Harold Holt Swim Centre, including renovation of the indoor leisure pool, replacement of pool-water treatment system and refurbishment of an indoor changeroom.
» Adopted a Masterplan for Percy Treyvaud Memorial Park.
Enhance modern learning environments, community hubs and libraries to support connected communities.
95% » Upgraded early years facilities at Princes Close Child Care Centre, Youth Services Offices at Grattan Gardens Community Centre, Brookville Kindergarten and Wattletree Early Childhood Centre.
» Undertook works to improve accessibility and inclusion at Council’s buildings including the redevelopment of the former Grosvenor Street Child Care Centre as a universally accessible Maternal Child Health Centre and redevelopment of the former East Malvern Guide Hall as a universally accessible Men’s Shed.
» Shifted library information services online during COVID-19 shutdown.
Support local community organisations with equitable access to facilities, training and resources.
100% » Awarded more than $600,000 in community grants to local community organisations. » Commissioned two street art murals at Princess Close Childcare Centre and Malvern Library,
and a short-term installation on Malvern Road as part of the Vacant Shops Project.

City of Stonnington Annual Report 2019–2020
Major initiatives
The following table reviews progress in relation to major initiatives identified in the Budget 2019–20.
Major initiative Progress
Complete the design phase of the proposed indoor facility and begin construction, subject to adopting the Masterplan for the Multi-Sport and Recreation Precinct at Percy Treyvaud Memorial Park ($14.41 million net cost).
Masterplan endorsed by Council in May 2019. Currently progressing detailed design.
Implement Stage 1 of the Toorak Park Sport Precinct Masterplan ($1.91 million net cost).
Stage 1 Victory Square redevelopment works completed. Stage 2 construction of cricket practice nets is in progress. Draft feasibility study due for completion by August 2020.
Complete Stage 1 of the Harold Holt Swim Centre Masterplan implementation ($2.9 million net cost).
Stage 1 of the Improvement Program completed. Design and documentation for next stage.

21Report of operations
Description of services
The following table provides information about the services funded in the Budget 2019–20 and the people or sections of the community who receive the service.
Service area Description Net cost ($’000) Actual
BudgetVariance
Favourable / (unfavourable)
Diversity and Aged Services
This service provides a range of services for the aged and culturally diverse community including home-delivered meals, centre-based meals, personal care, transport, home maintenance, housing support, regional assessment services, domestic assistance, respite care and senior citizen clubs.
5,386
5,220
(166)
Animal Management Services
This service oversees animal registrations, animal complaints and prosecutions, pound operations and animal welfare education.
326
168
(158)
Aquatic Services This service supports a healthy community by providing a range of recreational facilities including indoor and outdoor swimming pools, a fully equipped gymnasium, aqua aerobics and a range of fitness classes.
2,525
1,229
(1,296)
Children and Family Services
This service provides family-oriented support services including childcare, pre-schools, a toy library, maternal and child health, preschool dental, counselling and support, youth services, immunisation, family day care and holiday programs.
4,771
4,024
(747)
Chapel Off Chapel This service provides theatre services including technical staging advice and performance operations, facilities for events, exhibitions of works by local artists, and function and catering services including for seminars, meetings and conferences.
1,070
903
(167)
Customer and Civic Services
This service provides a range of governance, statutory and corporate support services and acts as the main customer interface with the community. Services include coordinating Council and committee meetings, corporate planning, community engagement and support services at the Civic Centre. The customer support service is delivered from three customer service centres
1,967
2,205
238
Communications This service ensures the City of Stonnington communicates with our community in a consistent, proactive and integrated way that aligns with our corporate identity and brand. This service is responsible for the management and provision of advice on external communication on behalf of Council.
3,163
2,393
(770)
Environmental Health
This service protects the community by coordinating food safety support programs, Tobacco Act activities and smokefree dining and gaming venue issues. The service also responds to public health concerns relating to unreasonable noise emissions, housing standards and pest controls.
490
159
(331)
Library and Local History Services
This service provides public library services at four locations and local history services and provides a focal point for the community to enjoy the facilities and services offered.
4,241
4,290
49
Malvern Valley Golf Course
This service provides public open space, significant environmental areas and an 18-hole public golf course.
289
350
61
Recreation Services
This service is responsible for the management and use of sportsgrounds, pavilions and community centres. It provides advice to Council on recreation needs, assists community groups with funding applications, event management and promotion, and administers license agreements.
856
919
63

22 City of Stonnington Annual Report 2019–20
Service performance indicators
No. Service performance indicators
Results Comments
2016–17 2017–18 2018–19 2019–20
Aquatic facilities
Service standard
AF2 Health inspections of aquatic facilities
(Number of authorised officer inspections of Council aquatic facilities / Number of Council aquatic facilities)
2.00 1.00 1.00 0.33 Council ensures aquatic facilities operate in accordance with the Public Health and Wellbeing Act 2008. No health inspections were conducted in the fourth quarter of 2019–20, due to COVID-19 shutdown of facilities.
Utilisation
AF6 Utilisation of aquatic facilities
(Number of visits to aquatic facilities / Municipal population)
4.96 5.42 5.30 4.09 COVID-19 restrictions resulted in a reduced attendance of 29,417 visits recorded from April to June 2020, with facilities open for just 23 days during the 3-month period. This resulted in a reduced utilisation rate that is outside materiality.
Service cost
AF4* Cost of indoor aquatic facilities
(Direct cost of indoor aquatic facilities less income received / Number of visits to indoor aquatic facilities)
$1.52 $1.25 $2.58 Retired in 2020
This measure was replaced by AF7 from 1 July 2019.
AF5* Cost of outdoor aquatic facilities
(Direct cost of outdoor aquatic facilities less income received / Number of visits to outdoor aquatic facilities)
$0.00 $0.00 $0.00 Retired in 2020
This measure was replaced by AF7 from 1 July 2019.
AF7 Cost of aquatic facilities
(Direct cost of aquatic facilities less income received / Number of visits to aquatic facilities)
New in 2020
New in 2020
New in 2020
$1.76 This is a new indicator for 2020. Cost per visit was impacted due to COVID-19 shutdowns. While visits ceased, fixed costs continued throughout the shutdown period.
Note: From 2020, this measure replaced two previous measures: ‘Cost of indoor aquatic facilities’ and ‘Cost of outdoor aquatic facilities’, see retired measures.
Animal management
Timeliness
AM1 Time taken to action animal management requests
(Number of days between receipt and first response action for all animal management requests / Number of animal management requests)
2.61 1.83 1.12 1.60 Critical requests such as animal attacks and injured animals are actioned the same day. Council’s response time remains ahead of the state average (2 days across all councils 2018–19).
Service standard
AM2 Animals reclaimed
(Number of animals reclaimed / Number of animals collected) x100
78.28% 61.34% 50.68% 37.19% The percentage of animals reclaimed continues to decline. A higher proportion of cats (146) have been impounded, which are less likely to be reclaimed than dogs (109). The reclaim rates averaged 19% for cats and 83% for dogs.

23Report of operations
No. Service performance indicators
Results Comments
2016–17 2017–18 2018–19 2019–20
AM5 Animals rehomed
(Number of animals rehomed / Number of animals collected) x100
New in 2020
New in 2020
New in 2020
TBC The Council pound is operated by the Save-A-Dog Scheme. Council is working with our provider to meet the data requirements for this performance indicator.
Note: New measure for 2019–20 financial year.
Service cost
AM3* Cost of animal management service
(Direct cost of the animal management service / Number of registered animals)
$68.50 $50.59 $79.03 Retired in 2020
This measure was replaced by AM6 from 1 July 2019.
AM6 Cost of animal management service per population
(Direct cost of the animal management service / Population)
New in 2020
New in 2020
New in 2020
$8.18 Council is committed to the safety of the community and animal welfare. Increased costs related to the use of contract staff to cover unexpected leave, and increased legal costs for prosecutions that were adjourned.
Note: This measure is replacing previous ‘Cost of animal management service’, which was based on cost per number of registered animals.
Health and safety
AM4* Animal management prosecutions
(Number of successful animal management prosecutions)
6 9 5 Retired in 2020
This measure was replaced by AM7 from 1 July 2019.
AM7 Animal management prosecutions
(Number of successful animal management prosecutions / Number of animal management prosecutions) x 100
New in 2020
New in 2020
New in 2020
0.00% Council pursues charges through the Magistrates Court as appropriate. During the 2019–20 financial year COVID-19 restrictions led to court hearing adjournments.
Note: This measure is replacing previous ‘Animal management prosecutions’, which was a measure of number, not proportion.
Food safety
Timeliness
FS1 Time taken to action food complaints
(Number of days between receipt and first response action for all food complaints / Number of food complaints)
1.00 1.00 2.88 2.94 Council’s community response to the COVID-19 pandemic involved Environmental Health Officers. Response times declined to a 2.5 day average for a food premises related complaint, including weekends.
Service standard
FS2 Food safety assessments
(Number of registered class 1 food premises and class 2 food premises that receive an annual food safety assessment in accordance with the Food Act 1984 / Number of registered class 1 food premises and class 2 food premises that require an annual food safety assessment in accordance with the Food Act 1984) x100
88.64% 97.46% 91.58% 95.39% Food safety assessments, required under the Victorian Food Act 1984, improved by more than 3%, and is consistent with the state average. This is despite COVID-19 closures during the fourth quarter of 2019–20.

24 City of Stonnington Annual Report 2019–20
No. Service performance indicators
Results Comments
2016–17 2017–18 2018–19 2019–20
Service cost
FS3 Cost of food safety service
(Direct cost of the food safety service / Number of food premises registered or notified in accordance with the Food Act 1984)
$696.15 $695.05 $643.29 $680.71 Increased cost is the result of contract labour hire usage. Contractors were utilised due increased workload associated with COVID-19 response.
Health and safety
FS4 Critical and major non-compliance outcome notifications
(Number of critical non-compliance outcome notifications and major non-compliance notifications about a food premises followed up / Number of critical non-compliance outcome notifications and major non-compliance notifications about a food premises) x100
89.57% 87.93% 90.75% 99.50% Council has improved responsiveness to critical and major non-compliance notifications. Follow up inspections of premises that had critical and major non-compliance notifications, occurred within appropriate timelines.
Libraries
Utilisation
LB1 Physical library collection usage
(Number of physical library collection item loans / Number of physical library collection items)
4.42 4.91 5.00 3.23 COVID-19 restrictions forced library closures, impacting usage of items across all libraries. Malvern library was closed for renovations for six weeks (January - February) impacting loans during this time frame.
Note: From 2019–20, this indicator measures the performance of physical library items as a subset of the wider library collection.
Resource standard
LB2 Recently purchased library collection
(Number of library collection items purchased in the last 5 years / Number of library collection items) x100
83.21% 91.37% 99.94% 82.98% Purchases over recent years meet the community’s expectation for contemporary library services. Since COVID-19 restrictions, purchases have reduced, and focused on digital acquisitions.
Participation
LB4 Active library borrowers in municipality
(Number of active library borrowers in the last three years / The sum of the population for the last three years) x100
17.32% 17.06% 15.46% 15.84% The number of active library borrowers is consistent with 2018–19. COVID-19 restrictions and Malvern Library renovations increased online borrowings.
Service cost
LB3* Cost of library service
(Direct cost of the library service / Number of visits)
$7.21 $7.14 $7.88 Retired in 2020
This measure was replaced by LB5 from 1 July 2019.
LB5 Cost of library service per population
(Direct cost of the library service / Population)
New in 2020
New in 2020
New in 2020
$48.18 Costs increased with COVID-19 shutdown causing: increased online subscriptions; cancelled events requiring honouring of expense agreements; lost revenue of meeting room hire. High utilities costs also had an impact.
Service performance indicatorsCont...

25Report of operations
No. Service performance indicators
Results Comments
2016–17 2017–18 2018–19 2019–20
Maternal and child health (MCH)
Service standard
MC2 Infant enrolments in the MCH service
(Number of infants enrolled in the MCH service (from birth notifications received) / Number of birth notifications received) x100
101.05% 100.46% 101.43% 101.13% The result is consistent with prior periods. High participation rates demonstrate the importance and value of maternal and child health services for infants and their families.
Service cost
MC3 Cost of the MCH service
(Cost of the MCH service / Hours worked by MCH nurses)
$79.65 $87.70 $97.33 $62.39 The cost of service provision has decreased outside the materiality threshold, with improvements to true cost allocation - removing costs not directly related to maternal child health service provision.
Participation
MC4 Participation in the MCH service
(Number of children who attend the MCH service at least once (in the year) / Number of children enrolled in the MCH service) x100
75.02% 78.86% 78.84% 82.39% Family participation can vary between years. The 2019-20 result was an improvement on 2018-19.
MC5 Participation in the MCH service by Aboriginal children
(Number of Aboriginal children who attend the MCH service at least once (in the year) / Number of Aboriginal children enrolled in the MCH service) x100
68.42% 62.16% 73.33% 95.45% The City of Stonnington has a small Aboriginal community, and family participation in maternal and child health services will vary significantly between years. There was a focused effort by Council for this service, resulting in an increase in participation.
Satisfaction
MC1* Participation in first MCH home visit
(Number of first MCH home visits / Number of birth notifications received) x100
99.9% 95.0% 99.7% Retired in 2020
This measure was replaced by MC6 from 1 July 2019.
MC6 Participation in 4-week Key Age and Stage visit
(Number of 4-week key age and stage visits / Number of birth notifications received) x100
New in 2020
New in 2020
New in 2020
96.83% Council encourages participation by families in universal health care supports. Participation rates are high, rating well against the state average.
Note: *Denotes retired indicator not captured during current reporting period. Replacement indicators specified in Comments where appropriate.

26 City of Stonnington Annual Report 2019–20
Liveability
Stonnington will be the most desirable place to live, work and visit.
Achievements » Official opening of Prahran
Square
» Continued detailed design of the Prahran Town Hall redevelopment
» Received funding for new pocket park in Prahran and off-leash dog park in South Yarra, and
» Added 26 heritage places to the Heritage Overlay.

27Report of operations
Strategic indicators
The following table reviews the organisational performance against the Council Plan including results achieved in relation to the strategic indicators in the Council Plan.
Strategic indicator Result Comment
Strategically invest in open spaces, sporting fields and community facilities, and optimise use according to community needs.
95% » The State Government provided grants Local Parks Program for a new pocket park in Mount Street Prahran and a new off-leash dog park in South Yarra.
» Ensured new open spaces as part of the Toorak Road Level Crossing Removal Project, demonstrating Council’s advocacy for open space provision as a legacy of State Government infrastructure projects.
» Completed facility improvement works at Righetti Oval, Malvern Library, Grattan Gardens Community Centre, Menzies Pavilion, Muir Pavilion, Pollack Pavilion, Como Pavilion and the Stonnington Animal Pound.
» Implemented ongoing Masterplan works including safety and amenity upgrades at Windsor Siding, park improvements at Princess Gardens and pedestrian improvements at Forrest Hill.
» Launched Prahran Square in December 2019.
Preserve Stonnington’s heritage architecture and balance its existing character with complementary and sustainable development.
100% » Endorsed a comprehensive suburb-by-suburb approach to heritage preservation. » Added three individual places and two precinct extensions totaling 26 heritage places to
the Heritage Overlay.
Balance the competing demands of maintaining residential amenity and population growth through appropriate planning.
100% » Completed a Neighbourhood Character Refresh following updated State Government requirements which will inform Council’s Draft Housing Strategy.
Enhance the design outcomes of public spaces, places and buildings.
100% » Assessed planning applications against the Environmental Sustainable Design and advocated for state-wide Policy.
» Advocated for improved public amenity and urban design for the Bangs Street Housing Estate, and the creation of safe spaces through consideration of crime prevention through environmental design principles, opportunities for communal spaces to encourage connectedness, a sustainable social housing mix and appropriate supports and services for future tenants.
» Advocated at a regional and state level for increased supply of public, social and affordable housing to meet the needs of the community.
Advocate for improved and accessible public transport to enhance liveability and economic growth.
100% » Engaged with the Department of Transport, Yarra Trams and inner south metro councils to address existing services, future planning and new, improved public transport infrastructure, including DDA compliance and access for all users.
Maintain Council’s infrastructure and assets essential for the sustainable operation of the city.
100% » Completed conservation work on heritage significant facilities including the Harold Holt Swim Centre and Malvern Town Hall.
» Completed a proposal to redevelop the Prahran Town Hall. » Prepared a Developer Contributions Policy and lodged Planning Scheme amendment for
authorisation. » Delivered Council’s annual street cleaning program, and replaced and repaired
approximately 8,000 m2 of footpath. In response to flooding events and service demands, a number of subprograms have been expanded including footpath replacement, drainage pit cleaning and signage maintenance. 90% of requests through CRMS were met within service standards.
28 City of Stonnington Annual Report 2019–20
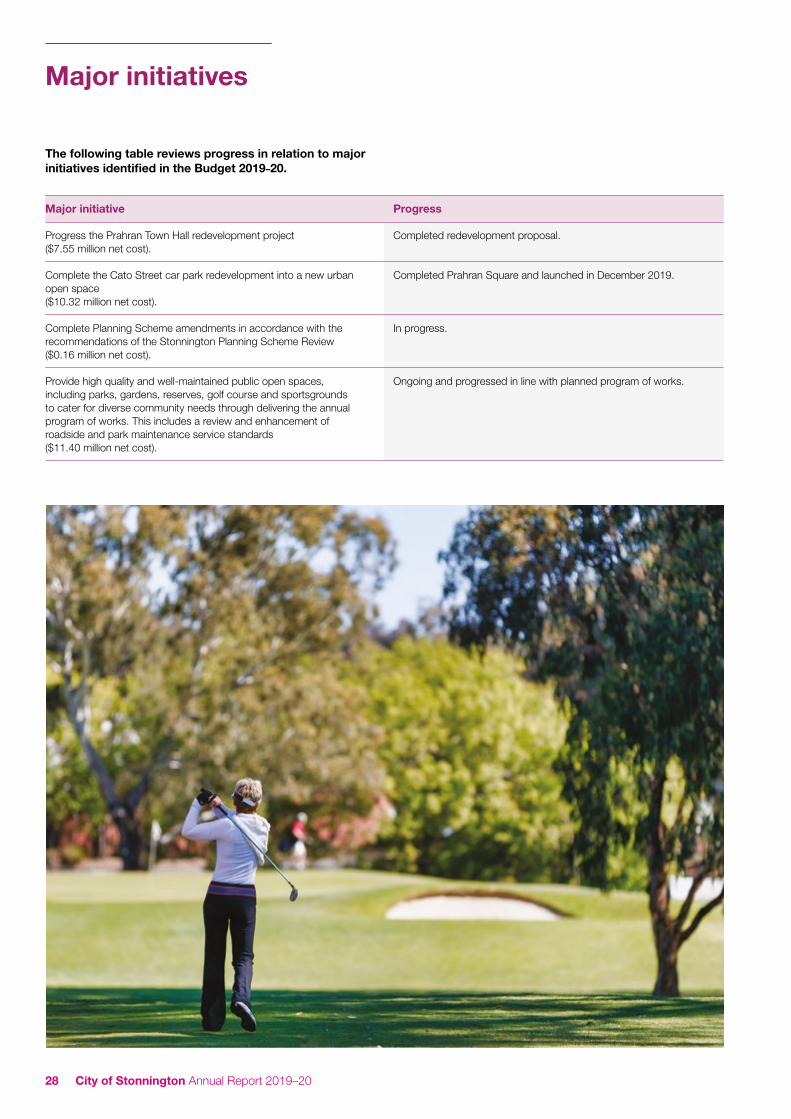
Major initiatives
The following table reviews progress in relation to major initiatives identified in the Budget 2019–20.
Major initiative Progress
Progress the Prahran Town Hall redevelopment project ($7.55 million net cost).
Completed redevelopment proposal.
Complete the Cato Street car park redevelopment into a new urban open space ($10.32 million net cost).
Completed Prahran Square and launched in December 2019.
Complete Planning Scheme amendments in accordance with the recommendations of the Stonnington Planning Scheme Review ($0.16 million net cost).
In progress.
Provide high quality and well-maintained public open spaces, including parks, gardens, reserves, golf course and sportsgrounds to cater for diverse community needs through delivering the annual program of works. This includes a review and enhancement of roadside and park maintenance service standards ($11.40 million net cost).
Ongoing and progressed in line with planned program of works.

29Report of operations
Description of services
The following table provides information about the services funded in the Budget 2019–20 and the people or sections of the community who receive the service.
Service area Description Net cost ($’000) Actual
BudgetVariance
Favourable / (unfavourable)
Building Control and Amenity Services
This service provides statutory building services, including processing of building permits, emergency management responsibilities, fire safety inspections, audits of swimming pool barriers and investigations of complaints and illegal works. It also provides education, regulation and enforcement of the General Local Law and state legislation.
362
(308)
(670)
Property Maintenance This service prepares long-term maintenance management programs for Council’s property assets in an integrated and prioritised manner to optimise their strategic value and service potential. These include municipal buildings, pavilions and other community buildings.
2,832
2,653
(179)
Infrastructure Planning, Design and Management
This service conducts capital works planning for Council’s main civil infrastructure assets in an integrated and prioritised manner to optimise their strategic value and service potential. This service undertakes design, tendering, contract management and supervision of works such as roads, laneways, car parks, foot/bike paths, drains and bridges.
4,586
2,414
(2,172)
Major Projects and Property Improvements
This service conducts planning and delivers capital works projects for Council’s properties to renew and improve the condition, compliance, sustainability, performance and value of Council’s existing buildings to meet service delivery needs.
477
767
290
Streets, Roads and Drains Cleaning and Maintenance
This service provides street cleaning, leaf collection, weed removal and drainage pit cleaning and maintains street litter bins.
4,397
3,861
(536)
Urban Development This service processes all planning applications, provides advice and makes decisions about development proposals that require a planning permit, as well as representing Council at the Victorian Civil and Administrative Tribunal. The service monitors and amends Council’s Planning Scheme as well as preparing major planning policy documents to shape the future of Stonnington.
5,228
5,114
(114)
Venue Facilities This service provides venues for commercial hire and community use at the Malvern Town Hall, Functions On Chapel and Armadale meeting rooms. The service supports Council’s civic functions and activities.
1,252
1,258
6

30 City of Stonnington Annual Report 2019–20
Service performance indicators
No. Service performance indicators
Results Comments
2016–17 2017–18 2018–19 2019–20
Roads
Satisfaction of use
R1 Sealed local road requests
(Number of sealed local road requests / Kilometres of sealed local roads) x100
63.25 49.40 51.52 76.67 Requests increased outside materiality threshold, though 140 requests outside Council responsibility were redirected to relevant authorities. Removing these results in total of 34.24 for 2019–20, and 33% reduction on 2018–19 result.
Condition
R2 Sealed local roads maintained to condition standards
(Number of kilometres of sealed local roads below the renewal intervention level set by Council / Kilometres of sealed local roads) x100
99.40% 98.80% 98.79% 99.70% Road condition has been maintained by ongoing maintenance and renewal programs.
Service cost
R3 Cost of sealed local road reconstruction
(Direct cost of sealed local road reconstruction / Square metres of sealed local roads reconstructed)
$133.07 $248.29 $133.99 $199.90 The reconstruction of Union Street required full depth pavement reconstruction. Situated in the business activity precinct of Chapel Street, these works required additional OHS measures, increasing costs.
R4 Cost of sealed local road resealing
(Direct cost of sealed local road resealing / Square metres of sealed local roads resealed)
$24.15 $19.68 $21.52 $26.13 The increased cost of resealing is due to increased cost of asphalt, and works being conducted in busy narrow streets that required additional site safety measures.
Satisfaction
R5 Satisfaction with sealed local roads
(Community satisfaction rating out of 100 with how council has performed on the condition of sealed local roads)
66.00 65.00 70.00 65.00 Council has ongoing maintenance and renewal programs. Satisfaction with sealed local roads was 5 points lower than 2018–19, but within the materiality threshold. The result is 11 points higher than the state average for 2018–9.

31Report of operations
No. Service performance indicators
Results Comments
2016–17 2017–18 2018–19 2019–20
Statutory Planning
Timeliness
SP1 Time taken to decide planning applications
(The median number of days between receipt of a planning application and a decision on the application)
88.00 96.00 86.00 70.00 Council received 100 less applications in Q4 2019–20 when compared with Q4 2018–19, which influenced the outcome on application processing times.
Service standard
SP2 Planning applications decided within required time frames
((Number of regular planning application decisions made within 60 days) + (Number of VicSmart planning application decisions made within 10 days) / Number of planning application decisions made) x100
57.07% 54.76% 66.00% 71.21% Changes to the Planning Scheme, allowing additional application categories to be classed as VicSmart, resulted in a 7% increase in VicSmart applications (received and assessed) within the timeframe.
Service cost
SP3 Cost of statutory planning service
(Direct cost of the statutory planning service / Number of planning applications received)
$3,497.25 $4,093.77 $4,053.98 $2,560.10 Operating expenditure decreased with reduced reliance on contract staff during Q4.
Decision-making
SP4 Council planning decisions upheld at VCAT
(Number of VCAT decisions that did not set aside council’s decision in relation to a planning application / Number of VCAT decisions in relation to planning applications) x100
66.67% 50.75% 48.00% 52.63% Council makes decisions in the best interest of the community. The 2019–20 result of 52.63% aligns to the state average of 52.64% for 2018–19 and is an improvement of almost 10% on Council’s 2018–19 results.
Note that for 2019–20 the success rate was 76%, if mediated outcomes included.
32 City of Stonnington Annual Report 2019–20
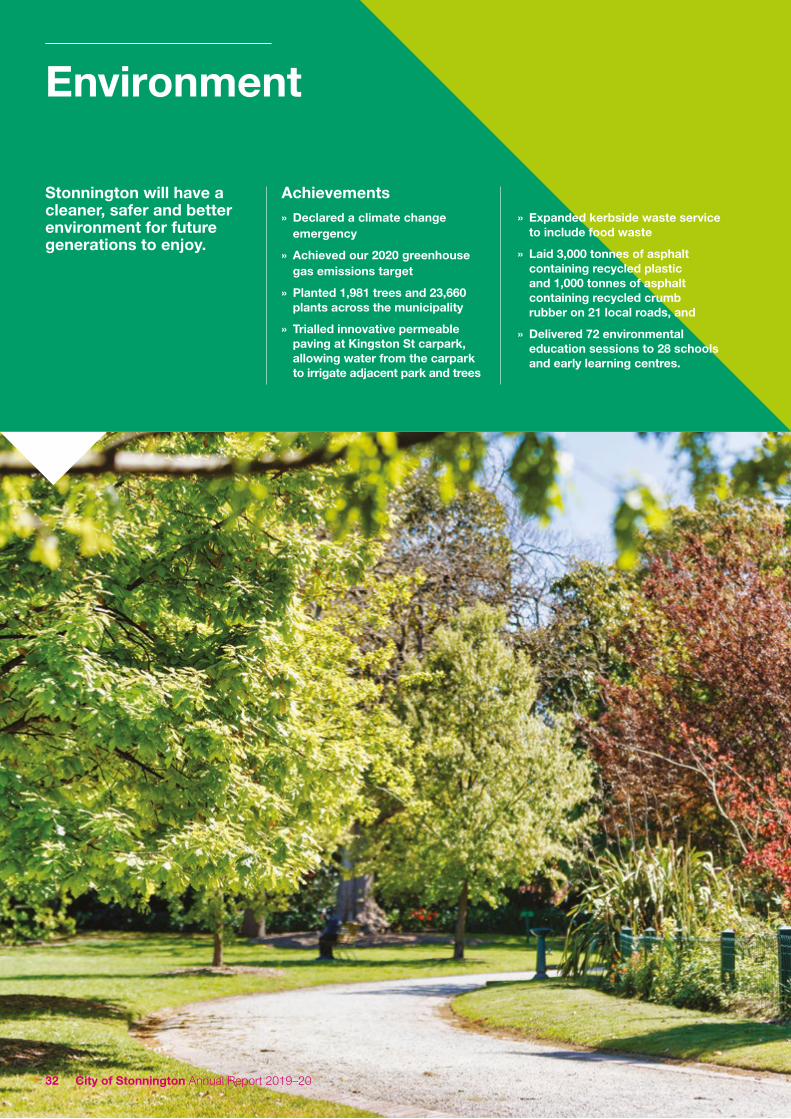
Environment
Stonnington will have a cleaner, safer and better environment for future generations to enjoy.
Achievements » Declared a climate change
emergency
» Achieved our 2020 greenhouse gas emissions target
» Planted 1,981 trees and 23,660 plants across the municipality
» Trialled innovative permeable paving at Kingston St carpark, allowing water from the carpark to irrigate adjacent park and trees
» Expanded kerbside waste service to include food waste
» Laid 3,000 tonnes of asphalt containing recycled plastic and 1,000 tonnes of asphalt containing recycled crumb rubber on 21 local roads, and
» Delivered 72 environmental education sessions to 28 schools and early learning centres.
33Report of operations
Strategic indicators
The following table reviews the organisational performance against the Council Plan including results achieved in relation to the strategic indicators in the Council Plan.
Strategic indicator Result Comment
Reduce energy use and associated greenhouse gas emissions.
100% » Reduced corporate greenhouse gas emissions by 32%, successfully meeting Council’s 2020 target.
» Installed new solar systems at Grosvenor Street Childcare Centre and expanded existing systems at Malvern Library and Orrong Romanis Recreation Centre. Council has now installed 880 kW of solar on 32 buildings and facilities to reduce corporate emissions.
» Upgraded 1,310 street-lights to LEDs. 97% of Council’s street lights are now energy efficient. » Prepared a Climate Emergency Action Plan for adoption, outlining how Council, the
community, schools and businesses can work together to take action.
Maximise efficiency of water use and improve water quality entering waterways.
100% » Awarded a Melbourne Water grant to trial innovative permeable paving containing recycled tyres in the Kingston Street car park in Malvern East. This was the first Victorian trial site for this treatment, which will support Council’s water sensitive city by filtering stormwater and passively watering the adjoining Central Park and eight new tree pits.
» Investigated opportunities to reduce potable water consumption, achieving an 8% reduction this year.
Enhance biodiversity values throughout Stonnington to protect and increase flora and fauna.
100% » Pursued opportunities to complete the ‘missing links’ bridge sections of the Yarra River Biodiversity Project, resulting in federal grant funding of $400,000 to support this work.
» Prepared the Gardiners Creek Masterplan.
Protect, maintain and grow Stonnington’s street tree population to enhance the character, identity and liveability of the City of Stonnington.
100% » Managed urban forest on public land and resident requests relating to the management of trees on private land.
» Planted 1,981 trees and 23,660 plants in streets, gardens, parks and reserves. In total, Council has planted 145,000 plants and trees since 2018 and are on track to achieve our target of 250,000 by 2023.
Deliver best practice waste management services to minimise waste generation and maximise resource recovery and recycling.
100% » Installed smart litter and recycling bins in Ardrie Park and Prahran Square. Smart bins use solar compacting technology to hold up to eight times the capacity of a traditional bin and include sensors to alert Council’s waste team when bins are almost full.
» Installed over 150 public recycling bins in shopping precincts and public open space throughout the city.
» Commenced kerbside food waste recycling. Participation in green waste bin service increased by 3.5% from last year.
Enhance sustainable purchasing of goods, materials and services with reduced environmental impacts.
90% » Enhanced the environmental responsibility of Council’s vehicle fleet through fuel efficient purchases. Council invested in a number of new fuel-efficient vehicles (waste trucks, block trucks, hook trucks and hybrid cars).
» Replaced 12 petrol or diesel vehicles with suitable efficient hybrid vehicles. » Planned introduction of a new Fleet Management System to improve fuel efficiency tracking
and monitoring.
Lead community sustainability through public programs.
100% » Delivered annual program of environmental education and sustainability outreach events with some programs shifting to online environments in response to COVID-19. This included the delivery of 9 webinars as part of an online sustainable living series in partnership with cities of Yarra, Port Phillip and Glen Eira, which reached over 900 attendees.
» Developed an online resource bank for educators to support teaching and online learning. » Launched Stonnington’s Environmental Champions program.
Promote and facilitate the use of sustainable transport options across the city.
90% » Undertook Gardiners Creek project planning to improve connections and enhance quality of off-road cycle paths.
» Commenced Peverill Park shared path upgrade. » Advocated for development of Strategic Cycle Corridors in partnership with VicRoads and DoT. » Installed cycle counters on the Main Yarra trail and Scotchman’s Creek shared path, and
counter totem near Punt Road. » Installed traffic survey cameras in Chapel Street to count cyclists, vehicles and pedestrians
to assist with planning for Chapel Street redevelopment.
34 City of Stonnington Annual Report 2019–20
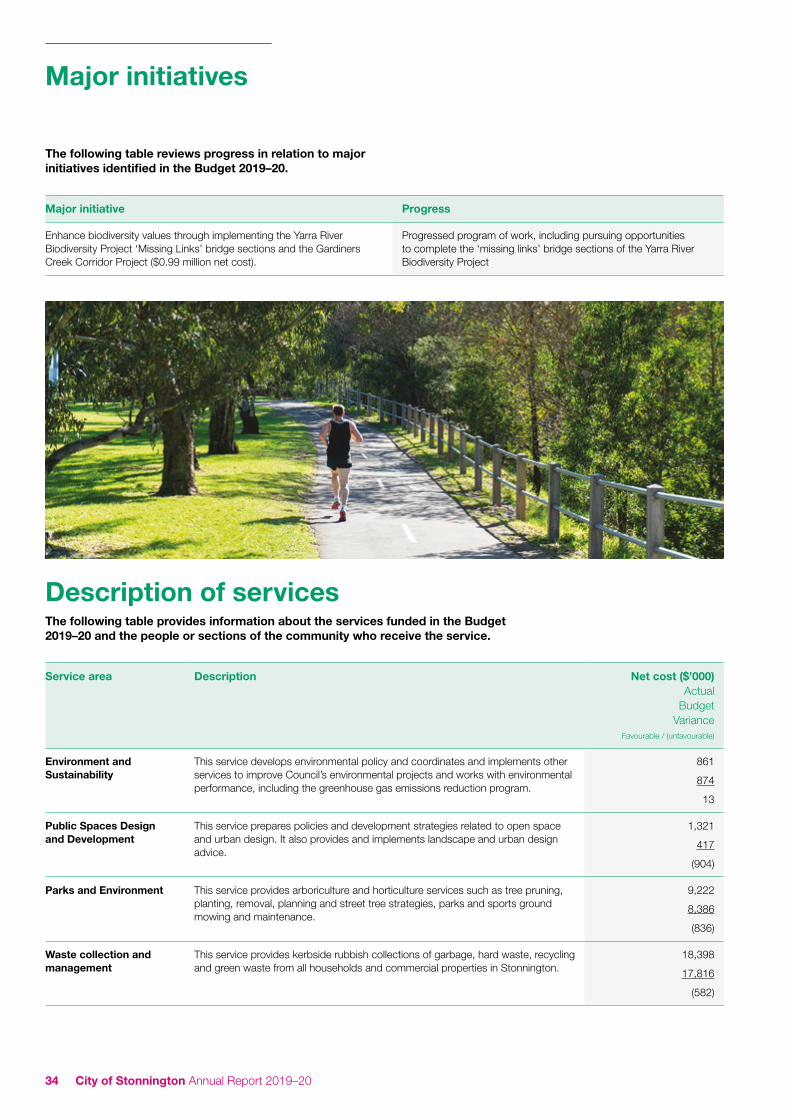
Major initiatives
The following table reviews progress in relation to major initiatives identified in the Budget 2019–20.
Major initiative Progress
Enhance biodiversity values through implementing the Yarra River Biodiversity Project ‘Missing Links’ bridge sections and the Gardiners Creek Corridor Project ($0.99 million net cost).
Progressed program of work, including pursuing opportunities to complete the ‘missing links’ bridge sections of the Yarra River Biodiversity Project
Description of servicesThe following table provides information about the services funded in the Budget 2019–20 and the people or sections of the community who receive the service.
Service area Description Net cost ($’000) Actual
BudgetVariance
Favourable / (unfavourable)
Environment and Sustainability
This service develops environmental policy and coordinates and implements other services to improve Council’s environmental projects and works with environmental performance, including the greenhouse gas emissions reduction program.
861
874
13
Public Spaces Design and Development
This service prepares policies and development strategies related to open space and urban design. It also provides and implements landscape and urban design advice.
1,321
417
(904)
Parks and Environment This service provides arboriculture and horticulture services such as tree pruning, planting, removal, planning and street tree strategies, parks and sports ground mowing and maintenance.
9,222
8,386
(836)
Waste collection and management
This service provides kerbside rubbish collections of garbage, hard waste, recycling and green waste from all households and commercial properties in Stonnington.
18,398
17,816
(582)

35Report of operations
Service performance indicators
No. Service performance indicators
Results Comments
2016–17 2017–18 2018–19 2019–20
Waste Collection
Satisfaction
WC1 Kerbside bin collection requests
(Number of kerbside garbage and recycling bin collection requests / Number of kerbside bin collection households) x1000
140.35 135.07 138.73 150.22 The result is an 8% increase and within materiality threshold. Increased reports of missed collections (April–June 2020) attributed to COVID-19 ‘work from home’ arrangements; increased home gardening and a higher incidence of bin refills.
Service standard
WC2 Kerbside collection bins missed
(Number of kerbside garbage and recycling collection bins missed / Number of scheduled kerbside garbage and recycling collection bin lifts) x10,000
3.58 3.83 3.80 4.40 The result compares well to 4.9% state average for 2018–19. Increased reports of missed collections (April–June 2020) attributed to COVID-19 ‘work from home’ arrangements; increased home gardening and a higher incidence of bin refills.
Service cost
WC3 Cost of kerbside garbage bin collection service
(Direct cost of the kerbside garbage bin collection service / Number of kerbside garbage collection bins)
$122.23 $126.33 $119.87 $118.68 Council is committed to providing cost efficient waste management services. This result shows a marginal improvement on the 2018–2019 result.
WC4 Cost of kerbside recyclables collection service
(Direct cost of the kerbside recyclables bin collection service / Number of kerbside recyclables collection bins)
$18.41 $25.69 $37.83 $37.51 This result is consistent with 2018–2019, and $20 cheaper than the state average.
Waste diversion
WC5 Kerbside collection waste diverted from landfill
(Weight of recyclables and green organics collected from kerbside bins / Weight of garbage, recyclables and green organics collected from kerbside bins) x100
36.89% 36.57% 34.81% 40.20% Council promotes community environmental outcomes. Waste diversion rates improved almost 6% compared to 2018–19, with food waste inclusion in green organics bin from 1 March 2020 contributing to the improved result.
36 City of Stonnington Annual Report 2019–20
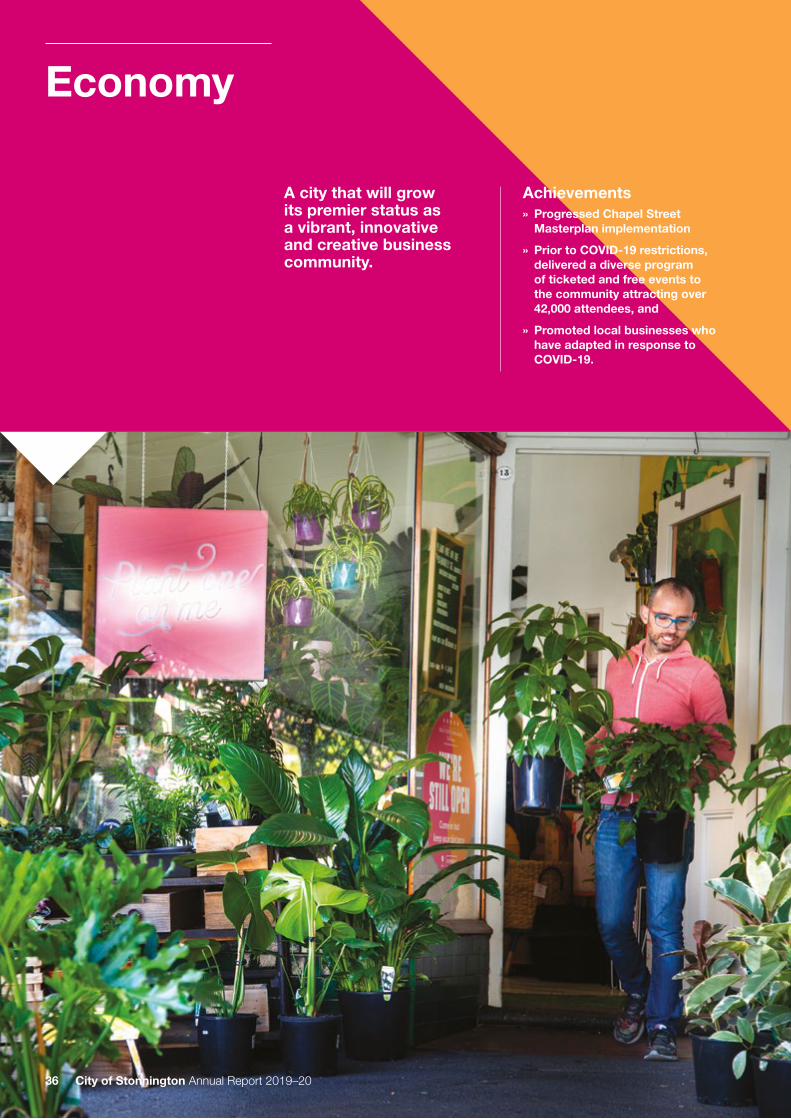
Economy
A city that will grow its premier status as a vibrant, innovative and creative business community.
Achievements » Progressed Chapel Street
Masterplan implementation
» Prior to COVID-19 restrictions, delivered a diverse program of ticketed and free events to the community attracting over 42,000 attendees, and
» Promoted local businesses who have adapted in response to COVID-19.

37Report of operations
Strategic indicators
The following table reviews the organisational performance against the Council Plan including results achieved in relation to the strategic indicators in the Council Plan.
Strategic indicator Result Comment
Develop long-term plans to ensure sustainability of Stonnington’s activity centres.
90% » Commenced planning for Council’s adopted Hawksburn Structure Plan via planning scheme amendment C272, which was progressed to a virtual Panel Hearing in June 2020.
» Planned 17 smaller activity centres, with 3D modelling undertaken to gauge appropriateness of proposed heights and setbacks as well as further supporting studies. A draft framework for the centres has been progressed.
» Implemented a business concierge service as part of the Better Approvals program to assist with welcoming new businesses.
» Progressed Chapel Street Masterplan implementation.
Provide effective engagement and support to local business through business skills development and marketing.
100% » Delivered planned business education events and support services online in response to COVID-19, including:
» “See Opportunity” Webinar Series, which featured six local businesses over six episodes, sharing their insights into how they adapted their business in the current environment
» ‘Retail Restart’ webinar tailored to assist Stonnington retail businesses consider how they might restart or relaunch as restrictions ease
» Two online training webinars on social media marketing and Facebook advertising, and
» Continued to engage with local businesses explaining available Local, State and Federal support packages and training.
Leverage Stonnington’s strategic location to attract new business and industry investment in key high-value industries that are matched to the strengths of Stonnington.
100% » Endorsed the Vacant to Vibrant Action Plan and progressed a number of initiatives including:
» Better Approvals Program, recruitment of a Senior Business Consultant » Retail Precinct Profiles, installation of graphics on vacant shop windows » Activation of 290 Malvern Road (vacant Council owned commercial building flagged
as new skate park as part of Prahran Aquatic Centre redevelopment) with internal mural and art work, and
» Established internal processes to identify businesses requiring support.
Promote Stonnington’s premier precincts, employment clusters and cultural assets as hubs for shopping, hospitality, entertainment and culture.
95% » Prepared an Arts and Culture Strategy for adoption by Council. » Successfully delivered a diverse program of ticketed and free events to the community
between July and February, attracting over 42,000 attendees. March to June events were not delivered due to COVID-19 State of Emergency.
» Completed a comprehensive activation plan to engage with the local community and encourage participation in activities, Prahran Square visitation and local business support.
» Promoted local businesses who have adapted in response to COVID-19 on our website, and featured six businesses as part of Council’s “See Opportunity” Webinar Series.
» Partnered with the Chapel Street Precinct Association to implement the ‘Chapel Innovation’ program, a campaign that features businesses and people who have adapted in response to COVID-19 restrictions.

38 City of Stonnington Annual Report 2019–20
Major initiatives
The following table reviews progress in relation to major initiatives identified in the Budget 2019–20.
Major initiative Progress
Adopt the Activity Centres Strategy and progress planning provisions for Hawksburn Village ($0.32 million net cost).
Commenced planning for Council’s adopted Hawksburn Structure Plan, which was progressed to a virtual Panel Hearing in June 2020.
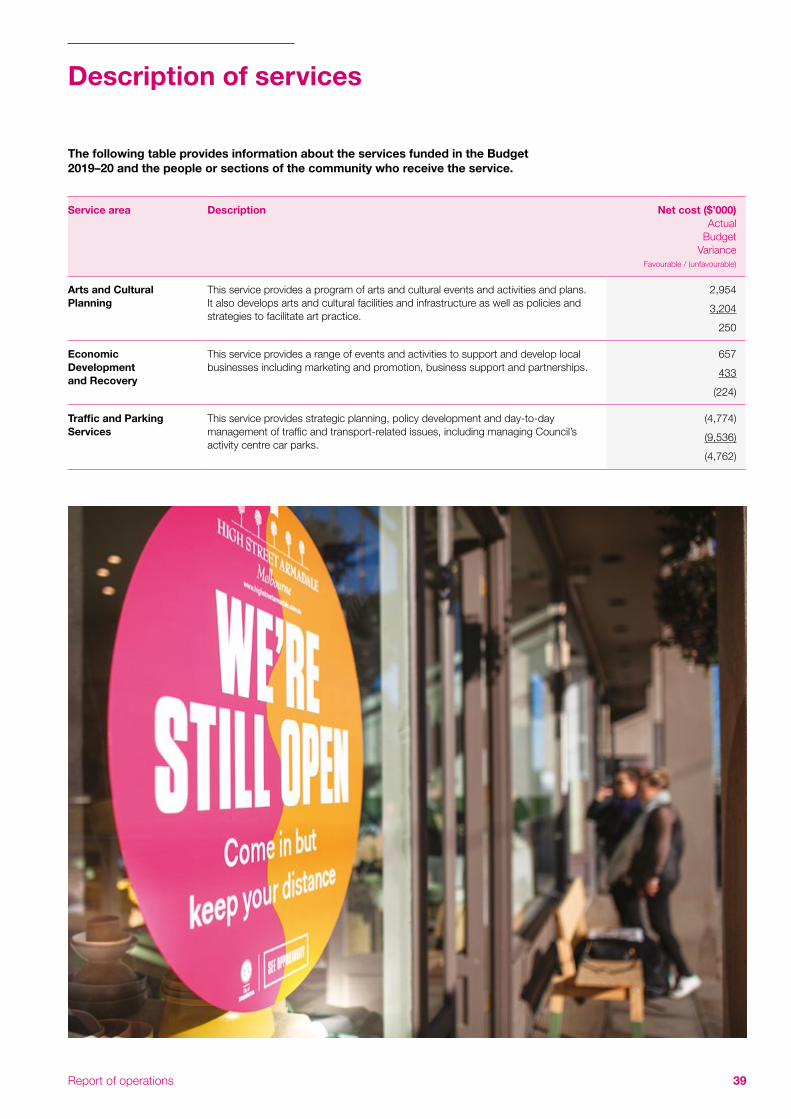
39Report of operations
Description of services
The following table provides information about the services funded in the Budget 2019–20 and the people or sections of the community who receive the service.
Service area Description Net cost ($’000)Actual
BudgetVariance
Favourable / (unfavourable)
Arts and Cultural Planning
This service provides a program of arts and cultural events and activities and plans. It also develops arts and cultural facilities and infrastructure as well as policies and strategies to facilitate art practice.
2,954
3,204
250
Economic Development and Recovery
This service provides a range of events and activities to support and develop local businesses including marketing and promotion, business support and partnerships.
657
433
(224)
Traffic and Parking Services
This service provides strategic planning, policy development and day-to-day management of traffic and transport-related issues, including managing Council’s activity centre car parks.
(4,774)
(9,536)
(4,762)

40 City of Stonnington Annual Report 2019–20
Stonnington is committed to good governance through transparent processes, accessible services, accountability, strong leadership, effective management of resources, advocacy and responsiveness to current and future community needs.
Achievements » Developed a three-year
technology and digitisation road-map to modernise Council processes, ensure safe and reliable infrastructure, automate manual handling and provide greater choice for customers to interact with us
» Implemented the use of virtual desktops (AWS workspaces) across the organisation to enable staff to work from home wherever possible, enabling Council business to continue during the COVID-19 pandemic, and
» Unveiled a new corporate structure, designed to enable a transformation to a more customer-focused, agile and efficient business model.
Strategic Resource Plan

41Report of operations
Strategic indicators
The following table reviews the organisational performance against the Council Plan including results achieved in relation to the strategic indicators in the Council Plan.
Strategic indicator Result Comment
Governance 100% » Continuously updated governance practices, policies and procedures in accordance with legislative requirements.
» Undertook Annual Citizen of the Year awards ceremony. » Moved citizenship ceremonies to online environment during COVID-19. » Continued to support the Inner Melbourne Action Plan (IMAP) maintaining Executive membership
and special interest working groups.
People 90% » Continued to offer staff an award-winning wellbeing program. » Provided human rights legislation training throughout the year. » Enabled people to work-from-home in line-with COVID-19 restrictions.
Asset Management 100% » Upgraded council facilities at Princes Close Child Care Centre, Malvern Library, Central Park Child Care Centre, McArthur Street MCH Centre, Drysdale Street, Elizabeth Street and McFarlan Street Multi-storey Carparks, Orrong Romanis Recreation Centre, and Brookville Kindergarten.
Business Systems and Technology
100% » Developed a 3-year technology and digitisation road-map to modernise Council processes, ensure safe and reliable infrastructure, automate manual handling and provide greater choice for customers to interact with us.
» Implemented the use of virtual desktops (AWS workspaces) across the organisation to enable staff to work from home wherever possible, enabling Council business to continue during the COVID-19 pandemic.
» Developed a new Corporate Information Technology Strategy to support Council’s business transformation program for the next 3 years.
» Increased the functionality of Council’s Geographic Information System (GIS). » Progressed a number of business system improvement projects to assist in service delivery
across Council, including e-services, booking systems, digital forms, a new website and internal system upgrades
Risk 95% » Continued to maintain all OHS policies, procedures and management systems to AS/NZS 4801 standard.
» Undertook continuous improvement and training to ensure a high safety culture within the organisation.
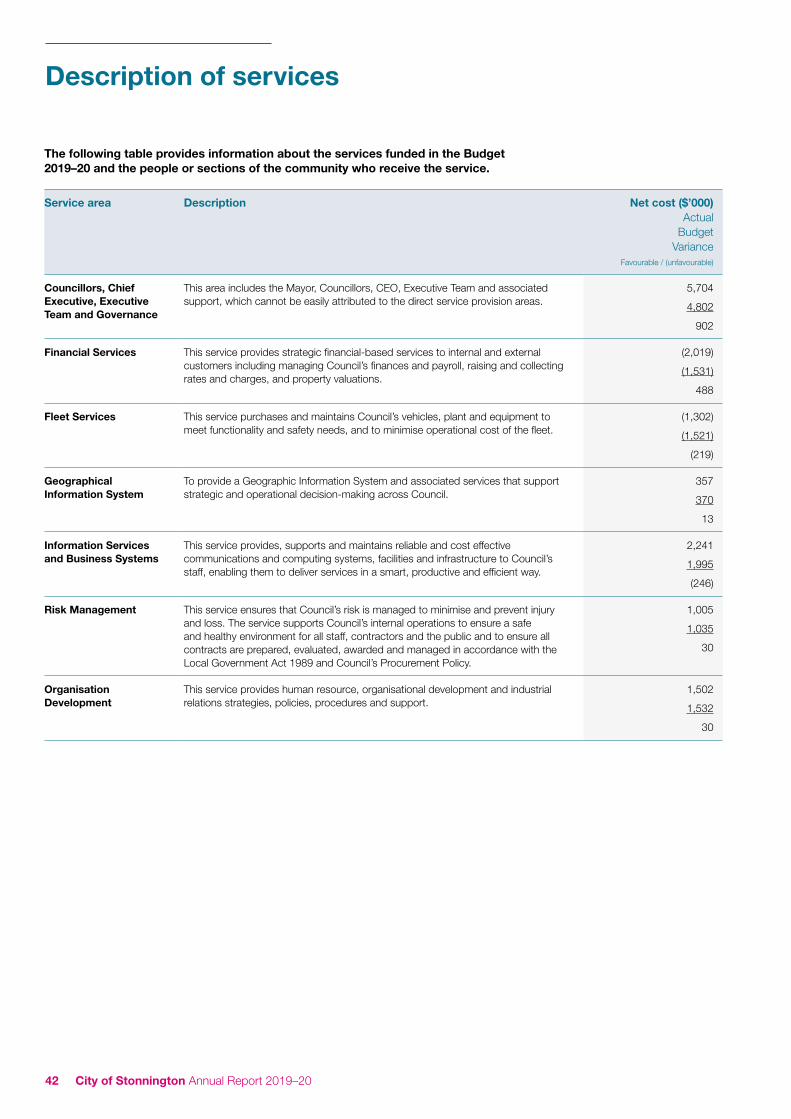
42 City of Stonnington Annual Report 2019–20
Description of services
The following table provides information about the services funded in the Budget 2019–20 and the people or sections of the community who receive the service.
Service area Description Net cost ($’000) Actual
BudgetVariance
Favourable / (unfavourable)
Councillors, Chief Executive, Executive Team and Governance
This area includes the Mayor, Councillors, CEO, Executive Team and associated support, which cannot be easily attributed to the direct service provision areas.
5,704
4,802
902
Financial Services This service provides strategic financial-based services to internal and external customers including managing Council’s finances and payroll, raising and collecting rates and charges, and property valuations.
(2,019)
(1,531)
488
Fleet Services This service purchases and maintains Council’s vehicles, plant and equipment to meet functionality and safety needs, and to minimise operational cost of the fleet.
(1,302)
(1,521)
(219)
Geographical Information System
To provide a Geographic Information System and associated services that support strategic and operational decision-making across Council.
357
370
13
Information Services and Business Systems
This service provides, supports and maintains reliable and cost effective communications and computing systems, facilities and infrastructure to Council’s staff, enabling them to deliver services in a smart, productive and efficient way.
2,241
1,995
(246)
Risk Management This service ensures that Council’s risk is managed to minimise and prevent injury and loss. The service supports Council’s internal operations to ensure a safe and healthy environment for all staff, contractors and the public and to ensure all contracts are prepared, evaluated, awarded and managed in accordance with the Local Government Act 1989 and Council’s Procurement Policy.
1,005
1,035
30
Organisation Development
This service provides human resource, organisational development and industrial relations strategies, policies, procedures and support.
1,502
1,532
30

43Report of operations
Service performance indicators
No. Service performance indicators
Results Comments
2016–17 2017–18 2018–19 2019–20
Governance
Transparency
G1 Council decisions made at meetings closed to the public
(Number of Council resolutions made at ordinary or special meetings of Council, or at meetings of a special committee consisting only of Councillors, closed to the public / Number of Council resolutions made at ordinary or special meetings of Council or at meetings of a special committee consisting only of Councillors ) x100
9.47% 8.00% 14.47% 10.76% The new Local Government Act 2020 has narrower definitions as to what can be included as confidential. Council has improved its transparency, and achieved a 3.71 percentage point improvement compared to the 2018–19 year.
Consultation and engagement
G2 Satisfaction with community consultation and engagement
Community satisfaction rating out of 100 with how Council has performed on community consultation and engagement
58.00 60.00 56.00 56.00 Council is committed to consultation and engagement with the community on an ongoing basis. Satisfaction with community consultation and engagement is consistent with the state average.
Attendance
G3 Councillor attendance at council meetings
(The sum of the number of Councillors who attended each ordinary and special Council meeting / (Number of ordinary and special Council meetings) × (Number of Councillors elected at the last Council general election)) x100
91.88% 90.74% 89.37% 89.86% Councillor commitment is demonstrated by their regular attendance at meetings. The result is consistent with 2018–19.
Service cost
G4 Cost of elected representation
(Direct cost of the governance service / Number of Councillors elected at the last Council general election)
$60,078.78 $57,650.56 $57,214.56 $61,032.11 The cost of elected representation increased during the 2019–20 year, due to increased cost of governance services.
Satisfaction
G5 Satisfaction with council decisions
(Community satisfaction rating out of 100 with how council has performed in making decisions in the interest of the community)
60.00 58.00 58.00 57.00 Community satisfaction with Council decisions is consistent with prior years, and is four points higher than the state average.

44 City of Stonnington Annual Report 2019–20
Our people
Organisational structure Council is the governing body that appoints a Chief Executive Officer (CEO). The CEO has responsibility for the day-to-day management of operations in accordance with the strategic directions of the Council Plan. Mr Simon Thomas was interim CEO from the beginning of the period until the commencement of the CEO, Ms Jacqui Weatherill, on 22 July 2019.
The CEO and five Directors form the Executive Team. The Executive Team manages the day-to-day operations of the municipality and leads the organisation. Its members are:
» Chief Executive Officer, Jacqui Weatherill
» Director Corporate Services, Chris Balfour
» Director Planning and Place, Stuart Draffin
» Director Engagement and Innovation, Greg Curio
» Director Community and Wellbeing, Cath Harrod, and
» Director Environment and Infrastructure, Rick Kwasek.
A restructure was undertaken during 2019–20 as part of building a fit for purpose organisation that is future ready. This included developing a new directorate to elevate community engagement and drive innovation across Council.
The areas of responsibility of the Executive Team members and their direct reports as at 30 June 2020 are included in the organisational chart.

45Report of operations
Council staff A summary of the number of full time equivalent (FTE) staff across a range of aspects as at 30 June 2020 is set out below. In response to the COVID-19 pandemic, approximately 130 staff were stood down between March and June 2020 due to closure of select Council services.
Employment type – gender
CEO Corporate Services
Planning and Place
Engagement and
Innovation
Community and
Wellbeing
Environment and
Infrastructure
Total FTE
Permanent full time – F 8.0 20.7 53.0 17.0 79.4 30.3 208.3
Permanent part time – F 0.1 4.4 3.8 2.6 70.8 0.9 82.6
Temporary full time – F 0.0 1.1 4.4 3.8 18.8 2.1 30.2
Temporary part time – F 0.0 0.2 0.5 0.0 11.4 2.2 14.4
Casual – F 0.4 0.4 0.5 3.8 17.5 0.1 22.8
Permanent full time – M 3.0 15.3 32.8 19.9 27.8 136.1 235.0
Permanent part time – M 0.0 0.1 0.0 4.1 44.0 0.1 48.4
Temporary full time – M 0.0 0.1 2.4 2.7 1.5 3.6 10.4
Temporary part time – M 0.0 0.0 0.0 0.0 4.0 0.9 5.0
Casual – M 0.0 0.0 0.9 1.0 7.0 2.6 11.4
Total 11.5 42.3 98.3 54.9 282.3 179.0 668.3
Employment classification
Female FTE
Male FTE
Total FTE
Band 1 0.5 0.0 0.5
Band 2 19.5 21.9 41.4
Band 3 49.4 16.8 66.2
Band 4 72.0 22.8 94.8
Band 5 72.7 42.2 114.9
Band 6 66.7 36.3 102.9
Band 7 30.8 29.0 59.8
Band 8 10.8 14.8 25.6
Other 35.8 126.4 162.1
Total 358.2 310.1 668.3

46 City of Stonnington Annual Report 2019–20
Our peopleCont...
Equal employment opportunity program The City of Stonnington is committed to providing a workplace free of all forms of discrimination, bullying, harassment, sexual harassment and victimisation. Council aims for equality of opportunity for all employees and to eliminate discrimination relating to the protected attributes outlined in the Equal Opportunity Act 2010.
We have well-established policies and procedures in place to support this aim including the ability to report complaints. We ensure employees receive information and training about equal opportunity expectations at induction and regular intervals throughout their employment.
As part of our commitment, Council has a network of trained contact officers to provide confidential support and advice to any employee who believes they may be experiencing discrimination or harassment in the workplace.
» Indicator: percentage of new employees receiving equal opportunity training within six months of commencement. Target: 100 per cent. Result: 90 per cent.
» Indicator: percentage of existing employees receiving refresher equal opportunity training at least every two years. Target: 100 per cent. Result: 83 per cent.
» Indicator: number of contact officers per number of Council employees. Target: 1:50. Result: 1:53 (based on 900 employees with 17 contact officers in total)
2016–17
2017–18
2018–19
2019- 20
Training sessions conducted
3 12 15 5 face to
face (+ online)
Employees completing training sessions
127 195 214 167
Number of equal opportunity reports
3 6 4 5
Number of equal opportunity investigations reported to external bodies
1 1 2 2
Number of equal opportunity complaints results internally
4 5 1 3
Professional developmentWe have a strong commitment to helping staff develop and further enhance their skills. We support and encourage this development through a variety of methods. As part of this commitment we also have a corporate training program that provides consistent and meaningful staff development across the organisation. The courses we provide are designed to target all divisions of the organisation and build on skills important to our success.
One of the highlights of the 2019–20 program was the focus on mental health. Given the community pressures as a result of COVID-19, as well as the impact the pandemic has had on staff, it became a priority of the Corporate Training program to focus on wellbeing. A number of programs were developed and tailored to the different roles and stresses that individuals and teams face. One particular program, REACH, (Recognise, Empathise, Assist, Connect, Hindsight) focused on improving the experience of individuals interacting with Council, and our people’s understanding of complex mental health issues and warning signs. The program was successful in reducing stigmas and building more supportive relationships between the community and staff.
Enterprise bargaining agreementCouncil’s Enterprise Agreement No. 10 was approved by the Fair Work Commission on 1 April 2019. The agreement covers the terms and conditions of all our employees except for the Chief Executive Officer and will be in operation until 30 June 2021.
Wellbeing programThe health, safety and wellbeing of employees is vital to our success. Healthy staff are more productive, engaged and likely to exercise greater discretionary effort. When we take care of our people, they take care of our community and our business.
The 2019–20 wellbeing program was very successful, with participation in all initiatives increasing by over 100%. This year’s program focused on three key pillars identified as critical to overall employee wellbeing – healthy mind, healthy body and healthy life – and also focused on increasing participation from our male workforce.
Remuneration – officers and staff Our staff are remunerated in accordance with the requirements of the Local Government Act, the Victorian Local Authorities Award 2001, the Nurses (ANF – Victorian Local Government) Award 2002 and our Enterprise Agreement 2017–21. A summary of remuneration is included in the financial report under Note 7.1 – Council and key management remuneration.

47Report of operations
Governance
The City of Stonnington is constituted under the Local Government Act to provide leadership for the good governance of the municipal district and the local community. We have a number of roles under this legislation including:
» taking into account the diverse needs of the local community in decision-making
» providing leadership by establishing strategic objectives and monitoring achievements
» ensuring that resources are managed in a responsible and accountable manner
» advocating for the interests of the local community to other communities and governments, and
» fostering community cohesion and encouraging active participation in civic life.
We are committed to effective and sustainable forms of democratic and corporate governance as the key to ensuring that we meet the community’s priorities. The community has many opportunities to provide input into our decision-making processes including community consultation, public forums such as ward meetings and the ability to make formal submissions.
Our formal decision-making processes are conducted through Council meetings and special committees of Council. The majority of decision-making is delegated to Council staff. These delegations are exercised in accordance with adopted policies.
To achieve the purpose and objectives of the Act and sound corporate governance, the Council plan reflects our commitment to the Stonnington community and focuses on four key objectives: community, liveability, environment and economy.
The following details the benefits of good governance and how the City of Stonnington works to promote community confidence. This gives elected members and Council officers confidence in the council, which leads to better and ethical decisions. It helps the City of Stonnington meet its legislative obligations.
Council A council must consist of not fewer than five and not more than 12 Councillors. The City of Stonnington has had nine Councillors since the amalgamation of councils in the 1990s and subsequent internal boundaries reviews conducted at various legislative periods since then.
Council elections are held every four years at the end of October. The last general Council election was held by postal ballot on 22 October 2016. All nine positions were contested with the following Councillors elected:
East Ward Cr Glen Atwell
Cr Sally Davis
Cr Jami Klisaris
South Ward Cr Judy Hindle
Cr Melina Sehr
Cr Steven Stefanopoulos
North Ward Cr John Chandler
Cr Marcia Griffin
Cr Matthew Koce
Mayor The Mayor, Cr Steven Stefanopoulos, was elected by the Councillors at a special meeting on 8 November 2019 for an additional one-year term. The Mayor takes precedence at all municipal proceedings within the municipality and takes the chair at all meetings of the Council at which he is present.

48 City of Stonnington Annual Report 2019–20
GovernanceCont...
Meetings of Council Ordinary meetings of Council are generally held on the first and third Mondays of the month, excluding January, but can change due to the timing of public holidays or number of weeks in a month. The meeting schedule is adopted by Council in the last quarter of each year and is advertised in the local paper and on our website.
Council meetings are often well attended by interested members of the public and commence at 7pm in the Council Chamber at the Malvern Town Hall. Council meetings are streamed live over the internet and recordings are usually available on our website within 48 hours after the meeting. From May 2020, Council Meetings were relocated from the Council Chamber to the homes and offices of Councillors and Council Staff to ensure that social distancing was observed during the COVID-19 pandemic.
Copies of the Council Agenda are available prior to the meeting on the website and for viewing at Council libraries, (COVID-19 restrictions permitting). Minutes and Agendas of past meetings are available on the website.
The meeting procedure is outlined in our General Local Law 2018 (No.1). Voting is by a show of hands and, while Councillors can choose to abstain from voting on an issue, this rarely occurs except if a Councillor has declared a conflict of interest and has vacated the Chamber.
Councillor Briefings are held on alternative Mondays. These are not decision-making meetings but closed, informal advisory meetings where Councillors have the opportunity to have lengthy in-depth discussions on strategic policy development, new and ongoing projects and other matters.
Planning consultative meetings are part of the City of Stonnington’s planning process. These meetings provide a forum for the ward Councillors, applicant and objectors to discuss their points of view in respect to a proposed development and endeavour to reach some mutual agreement on the proposal before our consideration. Such meetings are held when there are seven or more objectors.
Councillor meeting attendance 2019–20
Councillor Council meetings
Council briefings
Planning consultative meetings *
Ward meetings
Ordinary Special East Ward South Ward North Ward
Total meetings held 20 3 26 18 11 12 1 per ward
G Atwell 19 2 21 6 0 0 1
J Chandler 20 2 21 0 0 4 1
S Davis 18 3 25 17 0 0 1
M Griffin 17 2 25 0 0 11 1
J Hindle 17 3 23 0 8 0 1
J Klisaris 15 3 18 10 0 0 0
M Koce 19 3 23 0 0 11 1
M Sehr 17 3 23 0 4 0 1
S Stefanopoulous (Mayor from 7 November 2019)
20 3 25 0 10 0 1
* More than one Councillor may have attended a consultative meeting.

49Report of operations
Advisory committeesCouncil’s advisory committees included:
» Economic Development and Culture Advisory Committee
» Strategic Communications and Engagement Advisory Committee , and
» Sustainability Advisory Committee.
All Councillors are advised of advisory committee meetings and are able to attend.
Council also has a number of local advisory committees that Councillors attend:
» Stonnington Cycling Reference Group
» Access Stonnington Committee
» Prahran Town Hall Redevelopment Steering Group
» Stonnington Ethnic Services Committee
» Stonnington History Committee
» Prahran Square Project Steering Committee
» Community Grants Working Group
» Multi-purpose sports and recreation facility – Percy Treyvaud Memorial Park – Steering Group Meeting
Councillor advisory committee attendance 2019–20
Economic Development and Culture
Community Services
Strategic Planning
Strategic Communications and Engagement
Sustainability
Total meetings held 3 1 3 1 2
G Atwell 0 0 0 0 0
J Chandler 0 0 3 0 0
S Davis 2 0 0 1 0
M Griffin 3 0 1 0 0
J Hindle 0 0 2 0 0
J Klisaris 0 1 0 0 0
M Koce 0 0 0 0 2
M Sehr 0 0 0 0 0
S Stefanopoulous(Mayor from 7 November 2019)
3 1 1 1 2
Special committees The Local Government Act 1989 allows councils to establish one or more special committees consisting of Councillors, Council staff, other persons, and any combination of these. Council has one Special Committee, the Inner Melbourne Action Plan Implementation Committee (IMAP).
IMAP is a collaborative partnership between the Cities of Stonnington, Melbourne, Port Phillip, Yarra and Maribyrnong, with these Councils working together to strengthen the liveability, attraction and prosperity of the region. This Special Committee is formed in partnership with each of these councils and has delegated authority to progress the implementation of the action plan.
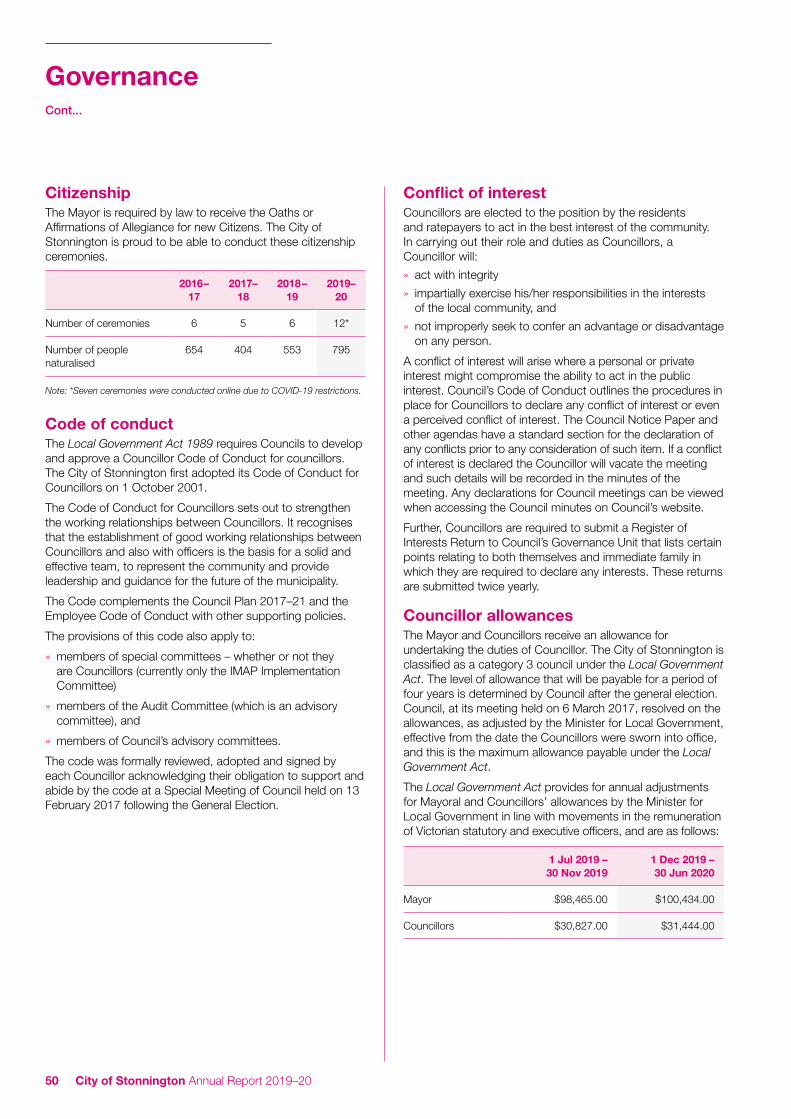
50 City of Stonnington Annual Report 2019–20
GovernanceCont...
Citizenship The Mayor is required by law to receive the Oaths or Affirmations of Allegiance for new Citizens. The City of Stonnington is proud to be able to conduct these citizenship ceremonies.
2016– 17
2017– 18
2018– 19
2019– 20
Number of ceremonies 6 5 6 12*
Number of people naturalised
654 404 553 795
Note: *Seven ceremonies were conducted online due to COVID-19 restrictions.
Code of conduct The Local Government Act 1989 requires Councils to develop and approve a Councillor Code of Conduct for councillors. The City of Stonnington first adopted its Code of Conduct for Councillors on 1 October 2001.
The Code of Conduct for Councillors sets out to strengthen the working relationships between Councillors. It recognises that the establishment of good working relationships between Councillors and also with officers is the basis for a solid and effective team, to represent the community and provide leadership and guidance for the future of the municipality.
The Code complements the Council Plan 2017–21 and the Employee Code of Conduct with other supporting policies.
The provisions of this code also apply to:
» members of special committees – whether or not they are Councillors (currently only the IMAP Implementation Committee)
» members of the Audit Committee (which is an advisory committee), and
» members of Council’s advisory committees.
The code was formally reviewed, adopted and signed by each Councillor acknowledging their obligation to support and abide by the code at a Special Meeting of Council held on 13 February 2017 following the General Election.
Conflict of interest Councillors are elected to the position by the residents and ratepayers to act in the best interest of the community. In carrying out their role and duties as Councillors, a Councillor will:
» act with integrity
» impartially exercise his/her responsibilities in the interests of the local community, and
» not improperly seek to confer an advantage or disadvantage on any person.
A conflict of interest will arise where a personal or private interest might compromise the ability to act in the public interest. Council’s Code of Conduct outlines the procedures in place for Councillors to declare any conflict of interest or even a perceived conflict of interest. The Council Notice Paper and other agendas have a standard section for the declaration of any conflicts prior to any consideration of such item. If a conflict of interest is declared the Councillor will vacate the meeting and such details will be recorded in the minutes of the meeting. Any declarations for Council meetings can be viewed when accessing the Council minutes on Council’s website.
Further, Councillors are required to submit a Register of Interests Return to Council’s Governance Unit that lists certain points relating to both themselves and immediate family in which they are required to declare any interests. These returns are submitted twice yearly.
Councillor allowances The Mayor and Councillors receive an allowance for undertaking the duties of Councillor. The City of Stonnington is classified as a category 3 council under the Local Government Act. The level of allowance that will be payable for a period of four years is determined by Council after the general election. Council, at its meeting held on 6 March 2017, resolved on the allowances, as adjusted by the Minister for Local Government, effective from the date the Councillors were sworn into office, and this is the maximum allowance payable under the Local Government Act.
The Local Government Act provides for annual adjustments for Mayoral and Councillors’ allowances by the Minister for Local Government in line with movements in the remuneration of Victorian statutory and executive officers, and are as follows:
1 Jul 2019 – 30 Nov 2019
1 Dec 2019 – 30 Jun 2020
Mayor $98,465.00 $100,434.00
Councillors $30,827.00 $31,444.00

51Report of operations
The Mayor is not entitled to receive the Councillor allowance in addition to the Mayoral allowance. The Mayor and Councillors also receive an amount equivalent to the Superannuation Guarantee levy (currently 9.5 per cent). Allowances are paid monthly, and a pro-rata adjustment made with the change of Mayor and with the change of Councillors following the General Election.
The following table contains a summary of the allowances paid to Councillors during 2019–20.
Councillor Allowance Superannuation guarantee
levy equivalent
G Atwell $31,136.64 $2,957.98
J Chandler $31,136.64 $2,957.98
S Davis $31,136.64 $2,957.98
M Griffin $31,136.64 $2,957.98
J Hindle $31,136.64 $2,957.98
J Klisaris $31,136.64 $2,957.98
M Koce $31,136.64 $2,957.98
M Sehr $31,136.64 $2,957.98
S Stefanopoulous (Mayor from 7 November 2019)
$99,452.68 $9,448.01
Councillor expenses In accordance with section 75 of the Local Government Act, council is required to reimburse a Councillor for expenses incurred while performing his or her duties as a Councillor. Council is also required to adopt and maintain a policy in relation to reimbursing expenses for Councillors. The policy provides guidance for reimbursing expenses and for providing resources, facilities and other support to the Mayor and Councillors to enable them to discharge their duties. Council also publishes (in this report) the details of the expenses, including reimbursement of expenses for each Councillor and member of a Council committee paid by Council.
The details of the expenses including reimbursement of expenses for each Councillor and member of a Council committee paid by Council for the 2019–20 year are set out in the following table.
TR (IS) $
TR (LC)$
CM$
CC$
IC$
CT$
OE$
Total$
G Atwell - - - - 1,568 - - 1,568
J Chandler - - - - 3,941 - - 3,941
S Davis - - - - 3,048 1,605 74 4,727
M Griffin - 186 - - 5,983 1,450 1,165 8,784
J Hindle - - - - 1,550 - 74 1,624
J Klisaris - - - - 3,770 - 74 3,844
M Koce - 44 - - 4,347 - - 4,391
M Sehr - - - 212 3,368 - 624 4,204
S Stefanopoulous (Mayor from 7 November 2019)
- 260 - - 1,693 904 - 2,857
TR (IS) = Travel interstate TR (LC) = Travel local CM = Car mileage CC = Child care IC = Information and communication expenses CT = Conferences and training expenses OE Other expenses
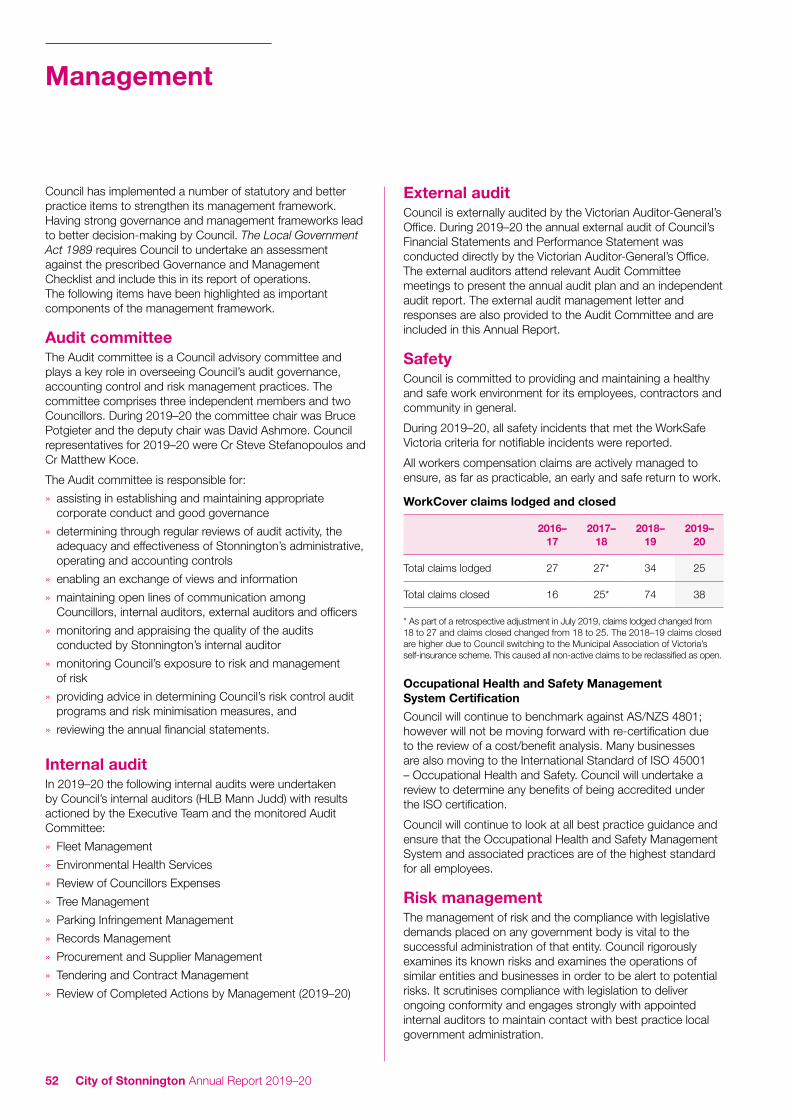
52 City of Stonnington Annual Report 2019–20
Management
Council has implemented a number of statutory and better practice items to strengthen its management framework. Having strong governance and management frameworks lead to better decision-making by Council. The Local Government Act 1989 requires Council to undertake an assessment against the prescribed Governance and Management Checklist and include this in its report of operations. The following items have been highlighted as important components of the management framework.
Audit committeeThe Audit committee is a Council advisory committee and plays a key role in overseeing Council’s audit governance, accounting control and risk management practices. The committee comprises three independent members and two Councillors. During 2019–20 the committee chair was Bruce Potgieter and the deputy chair was David Ashmore. Council representatives for 2019–20 were Cr Steve Stefanopoulos and Cr Matthew Koce.
The Audit committee is responsible for:
» assisting in establishing and maintaining appropriate corporate conduct and good governance
» determining through regular reviews of audit activity, the adequacy and effectiveness of Stonnington’s administrative, operating and accounting controls
» enabling an exchange of views and information
» maintaining open lines of communication among Councillors, internal auditors, external auditors and officers
» monitoring and appraising the quality of the audits conducted by Stonnington’s internal auditor
» monitoring Council’s exposure to risk and management of risk
» providing advice in determining Council’s risk control audit programs and risk minimisation measures, and
» reviewing the annual financial statements.
Internal auditIn 2019–20 the following internal audits were undertaken by Council’s internal auditors (HLB Mann Judd) with results actioned by the Executive Team and the monitored Audit Committee:
» Fleet Management
» Environmental Health Services
» Review of Councillors Expenses
» Tree Management
» Parking Infringement Management
» Records Management
» Procurement and Supplier Management
» Tendering and Contract Management
» Review of Completed Actions by Management (2019–20)
External auditCouncil is externally audited by the Victorian Auditor-General’s Office. During 2019–20 the annual external audit of Council’s Financial Statements and Performance Statement was conducted directly by the Victorian Auditor-General’s Office. The external auditors attend relevant Audit Committee meetings to present the annual audit plan and an independent audit report. The external audit management letter and responses are also provided to the Audit Committee and are included in this Annual Report.
Safety Council is committed to providing and maintaining a healthy and safe work environment for its employees, contractors and community in general.
During 2019–20, all safety incidents that met the WorkSafe Victoria criteria for notifiable incidents were reported.
All workers compensation claims are actively managed to ensure, as far as practicable, an early and safe return to work.
WorkCover claims lodged and closed
2016– 17
2017– 18
2018– 19
2019– 20
Total claims lodged 27 27* 34 25
Total claims closed 16 25* 74 38
* As part of a retrospective adjustment in July 2019, claims lodged changed from 18 to 27 and claims closed changed from 18 to 25. The 2018–19 claims closed are higher due to Council switching to the Municipal Association of Victoria’s self-insurance scheme. This caused all non-active claims to be reclassified as open.
Occupational Health and Safety Management System Certification
Council will continue to benchmark against AS/NZS 4801; however will not be moving forward with re-certification due to the review of a cost/benefit analysis. Many businesses are also moving to the International Standard of ISO 45001 – Occupational Health and Safety. Council will undertake a review to determine any benefits of being accredited under the ISO certification.
Council will continue to look at all best practice guidance and ensure that the Occupational Health and Safety Management System and associated practices are of the highest standard for all employees.
Risk managementThe management of risk and the compliance with legislative demands placed on any government body is vital to the successful administration of that entity. Council rigorously examines its known risks and examines the operations of similar entities and businesses in order to be alert to potential risks. It scrutinises compliance with legislation to deliver ongoing conformity and engages strongly with appointed internal auditors to maintain contact with best practice local government administration.
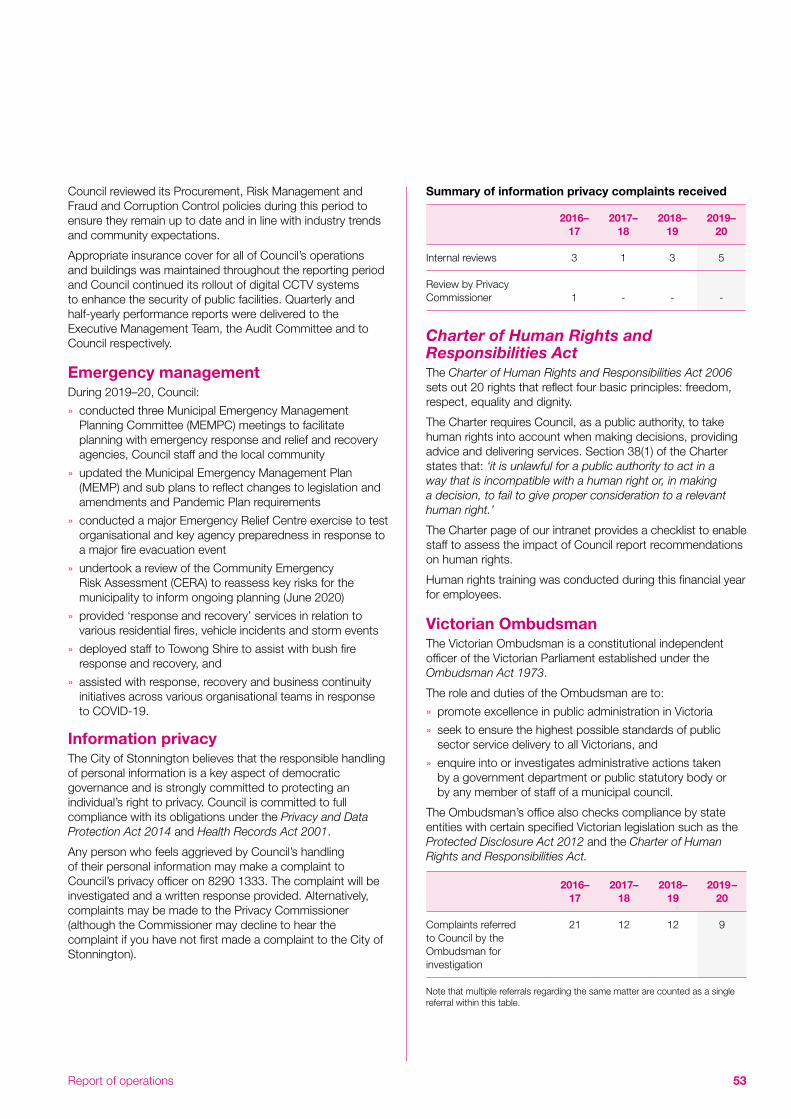
53Report of operations
Council reviewed its Procurement, Risk Management and Fraud and Corruption Control policies during this period to ensure they remain up to date and in line with industry trends and community expectations.
Appropriate insurance cover for all of Council’s operations and buildings was maintained throughout the reporting period and Council continued its rollout of digital CCTV systems to enhance the security of public facilities. Quarterly and half-yearly performance reports were delivered to the Executive Management Team, the Audit Committee and to Council respectively.
Emergency managementDuring 2019–20, Council:
» conducted three Municipal Emergency Management Planning Committee (MEMPC) meetings to facilitate planning with emergency response and relief and recovery agencies, Council staff and the local community
» updated the Municipal Emergency Management Plan (MEMP) and sub plans to reflect changes to legislation and amendments and Pandemic Plan requirements
» conducted a major Emergency Relief Centre exercise to test organisational and key agency preparedness in response to a major fire evacuation event
» undertook a review of the Community Emergency Risk Assessment (CERA) to reassess key risks for the municipality to inform ongoing planning (June 2020)
» provided ‘response and recovery’ services in relation to various residential fires, vehicle incidents and storm events
» deployed staff to Towong Shire to assist with bush fire response and recovery, and
» assisted with response, recovery and business continuity initiatives across various organisational teams in response to COVID-19.
Information privacy The City of Stonnington believes that the responsible handling of personal information is a key aspect of democratic governance and is strongly committed to protecting an individual’s right to privacy. Council is committed to full compliance with its obligations under the Privacy and Data Protection Act 2014 and Health Records Act 2001.
Any person who feels aggrieved by Council’s handling of their personal information may make a complaint to Council’s privacy officer on 8290 1333. The complaint will be investigated and a written response provided. Alternatively, complaints may be made to the Privacy Commissioner (although the Commissioner may decline to hear the complaint if you have not first made a complaint to the City of Stonnington).
Summary of information privacy complaints received
2016– 17
2017– 18
2018– 19
2019– 20
Internal reviews 3 1 3 5
Review by Privacy Commissioner 1 - - -
Charter of Human Rights and Responsibilities ActThe Charter of Human Rights and Responsibilities Act 2006 sets out 20 rights that reflect four basic principles: freedom, respect, equality and dignity.
The Charter requires Council, as a public authority, to take human rights into account when making decisions, providing advice and delivering services. Section 38(1) of the Charter states that: ‘it is unlawful for a public authority to act in a way that is incompatible with a human right or, in making a decision, to fail to give proper consideration to a relevant human right.’
The Charter page of our intranet provides a checklist to enable staff to assess the impact of Council report recommendations on human rights.
Human rights training was conducted during this financial year for employees.
Victorian Ombudsman The Victorian Ombudsman is a constitutional independent officer of the Victorian Parliament established under the Ombudsman Act 1973.
The role and duties of the Ombudsman are to:
» promote excellence in public administration in Victoria
» seek to ensure the highest possible standards of public sector service delivery to all Victorians, and
» enquire into or investigates administrative actions taken by a government department or public statutory body or by any member of staff of a municipal council.
The Ombudsman’s office also checks compliance by state entities with certain specified Victorian legislation such as the Protected Disclosure Act 2012 and the Charter of Human Rights and Responsibilities Act.
2016– 17
2017– 18
2018– 19
2019– 20
Complaints referred to Council by the Ombudsman for investigation
21 12 12 9
Note that multiple referrals regarding the same matter are counted as a single referral within this table.
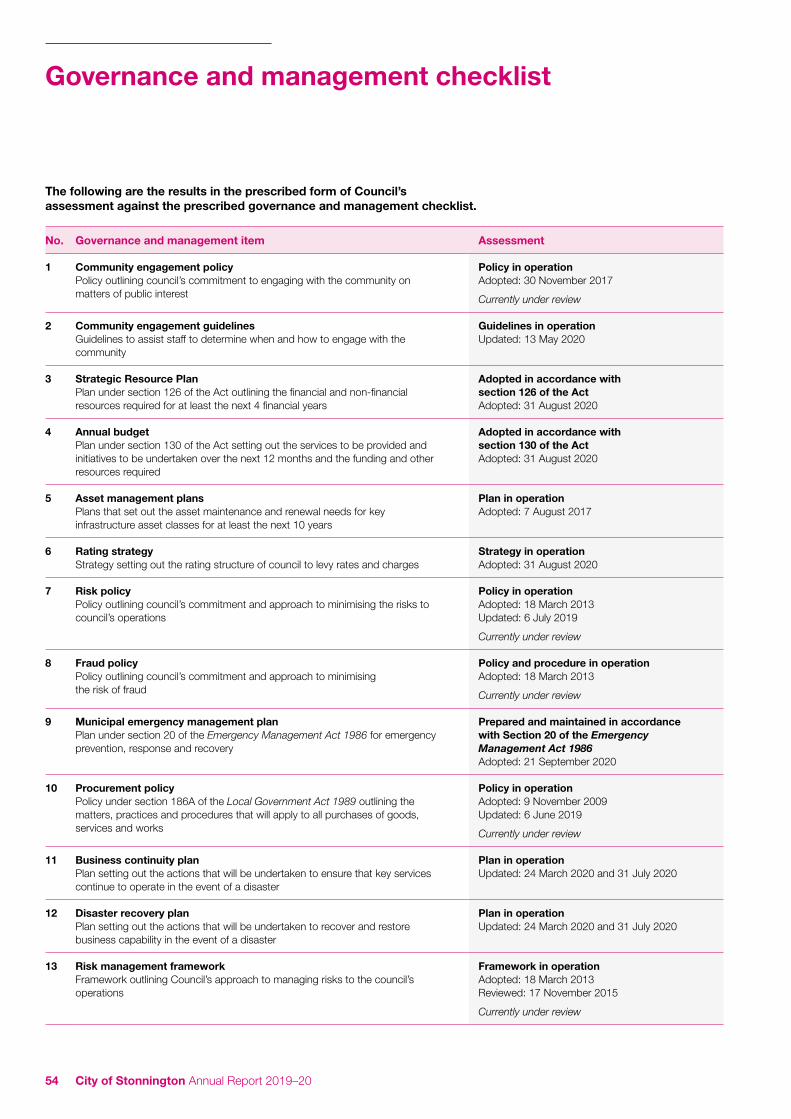
54 City of Stonnington Annual Report 2019–20
Governance and management checklist
The following are the results in the prescribed form of Council’s assessment against the prescribed governance and management checklist.
No. Governance and management item Assessment
1 Community engagement policyPolicy outlining council’s commitment to engaging with the community on matters of public interest
Policy in operationAdopted: 30 November 2017
Currently under review
2 Community engagement guidelinesGuidelines to assist staff to determine when and how to engage with the community
Guidelines in operationUpdated: 13 May 2020
3 Strategic Resource PlanPlan under section 126 of the Act outlining the financial and non-financial resources required for at least the next 4 financial years
Adopted in accordance with section 126 of the ActAdopted: 31 August 2020
4 Annual budgetPlan under section 130 of the Act setting out the services to be provided and initiatives to be undertaken over the next 12 months and the funding and other resources required
Adopted in accordance with section 130 of the ActAdopted: 31 August 2020
5 Asset management plans Plans that set out the asset maintenance and renewal needs for key infrastructure asset classes for at least the next 10 years
Plan in operationAdopted: 7 August 2017
6 Rating strategy Strategy setting out the rating structure of council to levy rates and charges
Strategy in operationAdopted: 31 August 2020
7 Risk policy Policy outlining council’s commitment and approach to minimising the risks to council’s operations
Policy in operationAdopted: 18 March 2013 Updated: 6 July 2019
Currently under review
8 Fraud policy Policy outlining council’s commitment and approach to minimising the risk of fraud
Policy and procedure in operationAdopted: 18 March 2013
Currently under review
9 Municipal emergency management plan Plan under section 20 of the Emergency Management Act 1986 for emergency prevention, response and recovery
Prepared and maintained in accordance with Section 20 of the Emergency Management Act 1986Adopted: 21 September 2020
10 Procurement policy Policy under section 186A of the Local Government Act 1989 outlining the matters, practices and procedures that will apply to all purchases of goods, services and works
Policy in operationAdopted: 9 November 2009 Updated: 6 June 2019
Currently under review
11 Business continuity plan Plan setting out the actions that will be undertaken to ensure that key services continue to operate in the event of a disaster
Plan in operationUpdated: 24 March 2020 and 31 July 2020
12 Disaster recovery plan Plan setting out the actions that will be undertaken to recover and restore business capability in the event of a disaster
Plan in operationUpdated: 24 March 2020 and 31 July 2020
13 Risk management frameworkFramework outlining Council’s approach to managing risks to the council’s operations
Framework in operationAdopted: 18 March 2013 Reviewed: 17 November 2015
Currently under review

55Report of operations
No. Governance and management item Assessment
14 Audit Committee Advisory committee of council under section 139 of the Act whose role is to oversee the integrity of a council’s financial reporting, processes to manage risks to the council’s operations and for compliance with applicable legal, ethical, and regulatory requirements
Committee established in accordance with section 139 of the ActEstablished: 30 January 1995
15 Internal audit Independent accounting professionals engaged by the council to provide analyses and recommendations aimed at improving council’s governance, risk and management controls
Internal audit provider (HLB Mann Judd) engagedThree year period from 1 July 2019. Option to extend 2 x 1 year terms.
16 Performance reporting framework A set of indicators measuring financial and non-financial performance, including the performance indicators referred to in section 131 of the Act
Framework in operation:Effective: 1 July 2014
Currently under review
17 Council Plan reporting Report reviewing the performance of the council against the Council Plan, including the results in relation to the strategic indicators, for the first six months of the financial year
Reports presentedPresented: 21 January 2020
18 Financial reporting Quarterly statements to council under section 138 of the Act comparing budgeted revenue and expenditure with actual revenue and expenditure
Statements presented to Council in accordance with section 138(1) of the ActPresented:18 November 2019 (Q1); 17 February 2020 (Q2); 1 June 2020 (Q3); 5 October 2020 (Q4)
19 Risk reporting Six-monthly reports of strategic risks to council’s operations, their likelihood and consequences of occurring and risk minimisation strategies
Quarterly risk reporting to Executive Team and Audit Committee Presented to Audit Committee: 22 August 2019 (Q1); 14 November 2019 (Q2); 20 February 2020 (Q3); 23 September 2020 (Q4)
Strategic risks to be reviewed in conjunction with Council Plan 2021-25 development.
20 Performance reportingSix-monthly reports of indicators measuring the results against financial and non-financial performance, including performance indicators referred to in section 131 of the Act
Reports presentedPresented: 21 January 2020; 28 July 2020
21 Annual report Annual report under sections 131, 132 and 133 of the Act to the community containing a report of operations and audited financial and performance statements
Report considered by Council in accordance with Section 134 of the ActConsidered: 14 October 2019
22 Councillor Code of ConductCode under section 76C of the Act setting out the conduct principles and the dispute resolution processes to be followed by councillors
Code reviewed in accordance with Section 76C of the ActReviewed: 13 February 2017
23 DelegationsA document setting out the powers, duties and functions of council and the Chief Executive Officer that have been delegated to members of staff
Delegations reviewed in accordance with Section 98(6) of the ActReviewed: 7 August 2020
24 Meeting proceduresA local law governing the conduct of meetings of council and special committees
Procedures in operationAdopted: 25 July 2018
We certify that the information in this checklist presents fairly the status of the Council’s governance and management arrangements.
Cr Steven Stefanopoulos Mayor 5 October 2020
Jacqui Weatherill Chief Executive Officer 5 October 2020

56 City of Stonnington Annual Report 2019–20
Statutory information
The following information is provided in accordance with legislative and other requirements applying to Council.
Best value Compliance with the Local Government Act 1989 requires Council to report to the community on its achievements in relation to the Best Value Principles at least once a year. Council’s Best Value Principles demonstrate commitment to continuous improvement and the pursuit of service excellence. Council incorporates Best Value Principles through regular business planning and performance monitoring processes.
Carers recognition The Carers Recognition Act 2012 requires us to report on our recognition and support of carers.
We provided a range of services and activities, including access to respite care, social support programs and holidays that carers could attend with those they care for, in a supported environment as well as hosting a free carers forum for carers to get expert advice and support.
Contracts In 2019–20 Council maintained its existing programs to ensure compliance with sections 186 and 186A of the Local Government Act 1989. Council continued its membership of the Municipal Association of Victoria’s LEAP Program, which analyses expenditure by category and by supplier. The information gained enables Council to strategically plan future procurements for achieving greater cost savings.
Council did not enter into any contracts valued at $150,000 or more for goods or services or $200,000 or more for works without engaging in a competitive process.
Documents available for public inspection During the year 2019–20, in accordance with regulation 12 of the Local Government (General) Regulations 2015 the following documents were available for public inspection or copies of the documents could be made in accordance with the Local Government Act 1989 (LGA 1989) at Stonnington City Centre, 311 Glenferrie Road Malvern:
» a document containing details of overseas or interstate travel (with exceptions) undertaken in an official capacity by any Councillor or any member of Council staff in the previous 12 months, including the names of the Councillors, or member of Council staff and the dates on which the travel began and ended, destination, purpose and total cost of the overseas or interstate travel, including accommodation costs
» agendas for, and minutes (kept under section 93 of the LGA 1989) of ordinary and special meetings held in the previous 12 months held pursuant to the LGA 1989 and the Local Government Act 2020 (LGA 2020) other than those agendas and minutes relating to parts of meetings closed to members of the public under section 89 of the LGA 1989 or section 66 of the LGA 2020 relating to confidential information within the meaning of section 77(2) of the LGA 1989 and section 3 of the LGA 2020 (note: minutes and agendas are on Council’s website)
» minutes of meetings of the Inner Melbourne Action Plan special committee established under section 86 of the LGA 1989 and held in the previous 12 months, other than those minutes relating to parts of meetings closed to members of the public under section 89 of the LGA 1989 which was confidential information within the meaning of section 77(2) of the LGA 1989 (note: minutes and agendas for the Inner Melbourne Action Plan Committee are on the Council website)
» a register of delegations kept under sections 87(1), and 98(4) of the LGA 1989 and sections 11 and 47 of the LGA 2020, including the dates on which the last review under sections 86(6) and 98(6) of the LGA 1989 took place
» a document containing details of all leases involving land that were entered into by Council as lessor, including the lessee and the terms and the value of the lease;
» a register maintained under section 224(1A) of the LGA 1989 of authorised officers appointed under section 224 of the LGA 1989, and
» a list of donations and grants made by Council during the previous 12 months, including the names of people who, or bodies that, have received a donation or grant and the amount of each donation or grant.
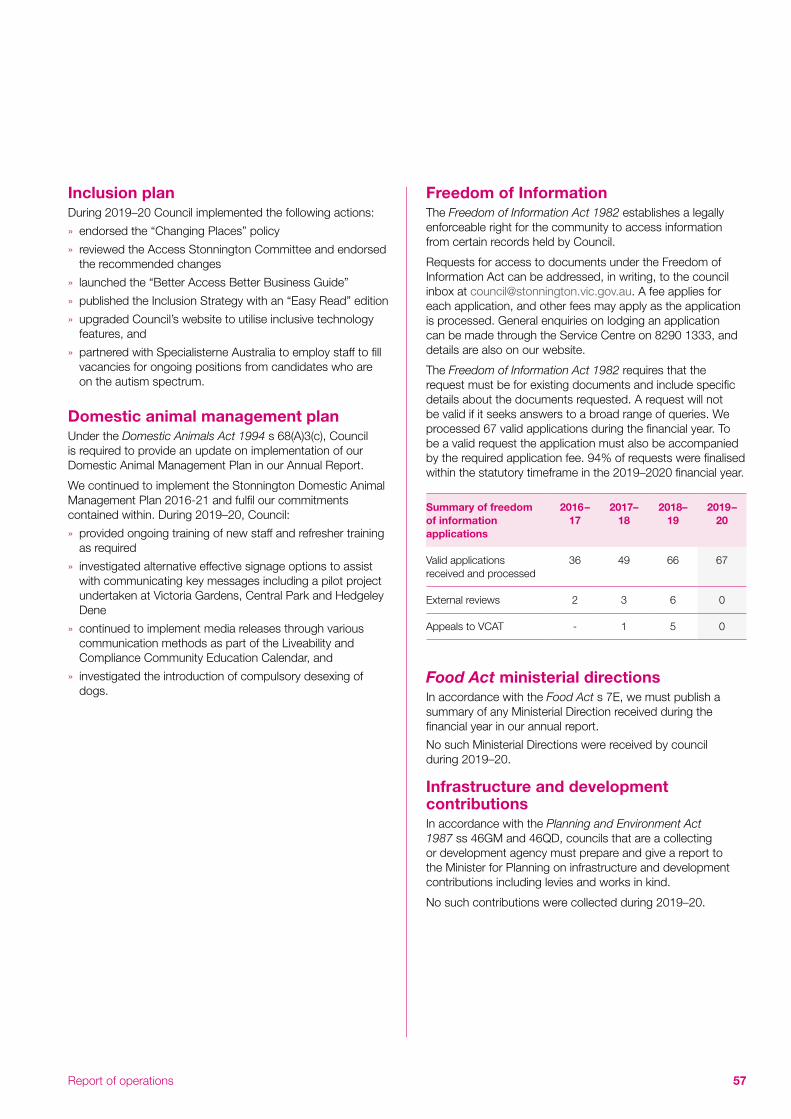
57Report of operations
Inclusion planDuring 2019–20 Council implemented the following actions:
» endorsed the “Changing Places” policy
» reviewed the Access Stonnington Committee and endorsed the recommended changes
» launched the “Better Access Better Business Guide”
» published the Inclusion Strategy with an “Easy Read” edition
» upgraded Council’s website to utilise inclusive technology features, and
» partnered with Specialisterne Australia to employ staff to fill vacancies for ongoing positions from candidates who are on the autism spectrum.
Domestic animal management plan Under the Domestic Animals Act 1994 s 68(A)3(c), Council is required to provide an update on implementation of our Domestic Animal Management Plan in our Annual Report.
We continued to implement the Stonnington Domestic Animal Management Plan 2016-21 and fulfil our commitments contained within. During 2019–20, Council:
» provided ongoing training of new staff and refresher training as required
» investigated alternative effective signage options to assist with communicating key messages including a pilot project undertaken at Victoria Gardens, Central Park and Hedgeley Dene
» continued to implement media releases through various communication methods as part of the Liveability and Compliance Community Education Calendar, and
» investigated the introduction of compulsory desexing of dogs.
Freedom of Information The Freedom of Information Act 1982 establishes a legally enforceable right for the community to access information from certain records held by Council.
Requests for access to documents under the Freedom of Information Act can be addressed, in writing, to the council inbox at [email protected]. A fee applies for each application, and other fees may apply as the application is processed. General enquiries on lodging an application can be made through the Service Centre on 8290 1333, and details are also on our website.
The Freedom of Information Act 1982 requires that the request must be for existing documents and include specific details about the documents requested. A request will not be valid if it seeks answers to a broad range of queries. We processed 67 valid applications during the financial year. To be a valid request the application must also be accompanied by the required application fee. 94% of requests were finalised within the statutory timeframe in the 2019–2020 financial year.
Summary of freedom of information applications
2016– 17
2017– 18
2018– 19
2019– 20
Valid applications received and processed
36 49 66 67
External reviews 2 3 6 0
Appeals to VCAT - 1 5 0
Food Act ministerial directions In accordance with the Food Act s 7E, we must publish a summary of any Ministerial Direction received during the financial year in our annual report.
No such Ministerial Directions were received by council during 2019–20.
Infrastructure and development contributions In accordance with the Planning and Environment Act 1987 ss 46GM and 46QD, councils that are a collecting or development agency must prepare and give a report to the Minister for Planning on infrastructure and development contributions including levies and works in kind.
No such contributions were collected during 2019–20.
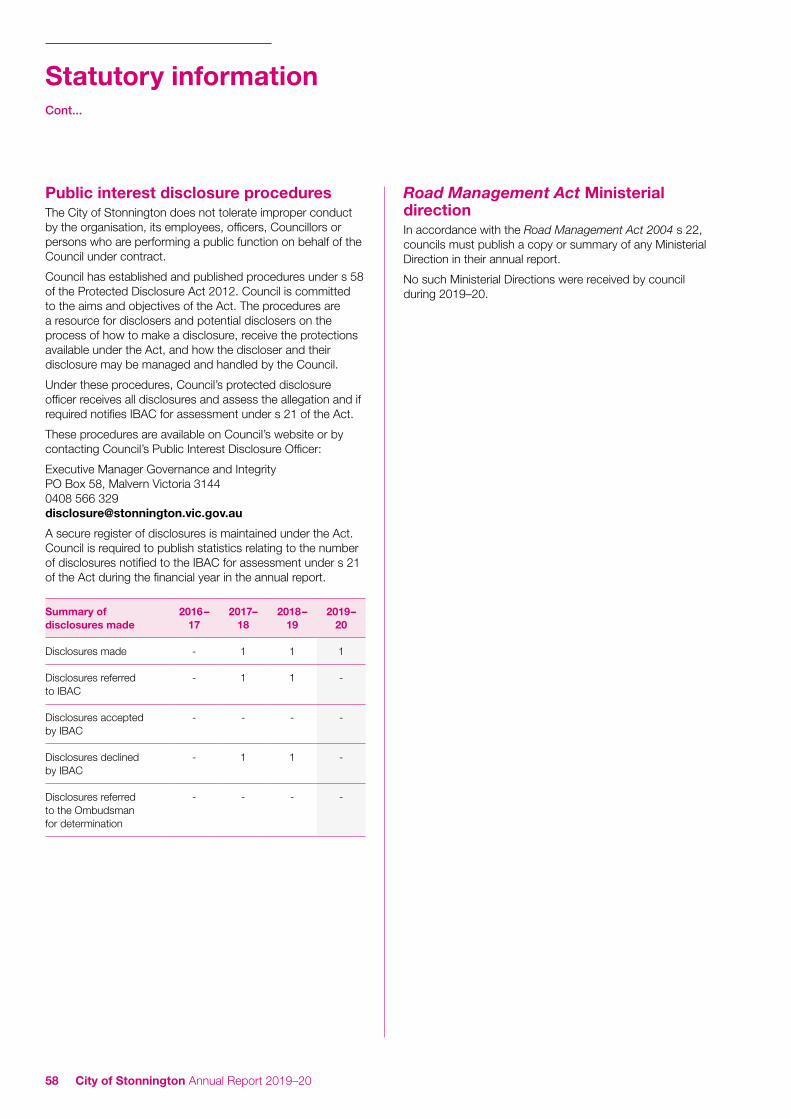
58 City of Stonnington Annual Report 2019–20
Statutory informationCont...
Public interest disclosure proceduresThe City of Stonnington does not tolerate improper conduct by the organisation, its employees, officers, Councillors or persons who are performing a public function on behalf of the Council under contract.
Council has established and published procedures under s 58 of the Protected Disclosure Act 2012. Council is committed to the aims and objectives of the Act. The procedures are a resource for disclosers and potential disclosers on the process of how to make a disclosure, receive the protections available under the Act, and how the discloser and their disclosure may be managed and handled by the Council.
Under these procedures, Council’s protected disclosure officer receives all disclosures and assess the allegation and if required notifies IBAC for assessment under s 21 of the Act.
These procedures are available on Council’s website or by contacting Council’s Public Interest Disclosure Officer:
Executive Manager Governance and IntegrityPO Box 58, Malvern Victoria 31440408 566 [email protected]
A secure register of disclosures is maintained under the Act. Council is required to publish statistics relating to the number of disclosures notified to the IBAC for assessment under s 21 of the Act during the financial year in the annual report.
Summary of disclosures made
2016– 17
2017– 18
2018– 19
2019– 20
Disclosures made - 1 1 1
Disclosures referred to IBAC
- 1 1 -
Disclosures accepted by IBAC
- - - -
Disclosures declined by IBAC
- 1 1 -
Disclosures referred to the Ombudsman for determination
- - - -
Road Management Act Ministerial direction In accordance with the Road Management Act 2004 s 22, councils must publish a copy or summary of any Ministerial Direction in their annual report.
No such Ministerial Directions were received by council during 2019–20.
59Performance statement
Performance statement
For the year ended 30 June 2020
59

60 City of Stonnington Annual Report 2019–20

61Performance statement
The City of Stonnington is located in Melbourne’s inner south-eastern suburbs, a short distance from the centre of Melbourne and alongside the Yarra River.
Covering an area of 25.62 square kilometres, the city stretches from Punt Road in the west to Warrigal Road in the east and is bounded by the Yarra River / Gardiners Creek to the north and Dandenong Road to the south. The city covers the suburbs of Prahran, Windsor (part), South Yarra (part), Toorak, Armadale, Malvern, Malvern East, Kooyong and Glen Iris (part).
The city is primarily a residential area, with significant retail/commercial activity along with institutional land uses. The Chapel Street Precinct is home to a vibrant entertainment area which attracts both residents and visitors to the municipality.
The ABS estimates that the resident population of the City of Stonnington, at 30 June 2020 was 117,768. It is anticipated that the municipality will grow to 143,257 by 2036 (.id, Population and household forecasts, 2016 to 2036).
The COVID-19 pandemic has had many and varied impacts across the City of Stonnington, greater Melbourne and beyond. The City of Stonnington responded swiftly to this health emergency, with our first priority at all times being the safety and wellbeing of our customers, communities and staff.
Council significantly adjusted its operations as a result of the pandemic, including mandating most of its workforce to work from home, from where they now continue to deliver the many essential services that keep our community and environment safe, clean and functioning.
The pandemic has caused many businesses to close or reduce operations, resulting in a significant economic impact. Council responded with support packages for business, including suspending a range of fees and charges to help business get through this tough period.
Description of municipality

62 City of Stonnington Annual Report 2019–20
Results
Indicator/measure 2017 2018 2019 2020 Comments
Population
Expenses per head of municipal population
(Total expenses / Municipal population)
$1,287.44 $1,352.22 $1,399.62 $1,401.00 Council continues to manage a relatively low level of expenditure per head of population. This is through the efficient and effective delivery of high quality services to the community within a responsible budget. The slight increase in this indicator compared with 2018–19 is a result of an increase in the operating expenses resulted from the recognition of amortisation of right of use asset (change in accounting policy AASB 16 Leases), fair value decrement in investment properties and enterprise bargaining increase in employees costs.
Municipal population:2017: 111,003 (2016 ERP) 2018: 113,772 (2017 ERP) 2019: 116,281 (2018 ERP) 2020: 117,768 (2019 ERP)
Infrastructure per head of municipal population
(Value of infrastructure / Municipal population)
$5,224.19 $5,334.83 $5,631.84 $5,946.57 Council continues to maintain and invest in high quality community infrastructure.
Population density per length of road
(Municipal population / Kilometres of local roads)
333.04 343.79 352.14 355.79 As an inner urban municipality, Stonnington’s population continues to grow significantly while the length of the local roads remains relatively unchanged.
Own-source revenue
Own-source revenue per head of municipal population
(Own-source revenue / Municipal population)
$1,422.79 $1,476.19 $1,489.91 $1,431.01 The result has decreased from 2018–19 due to the loss of income from the closure of non-essential services as a result of the COVID-19 pandemic. However the indicator still reflects Council’s continual ability to generate revenue from alternative sources to ensure ongoing financial sustainability.
Recurrent grants
Recurrent grants per head of municipal population
(Recurrent grants / Municipal population)
$99.91 $80.08 $77.38 $74.70 The variance year-on-year predominantly relates to the nature and timing of government grant funding to Council.
Disadvantage
Relative socio-economic disadvantage
(Index of Relative socio-economic disadvantage by decile)
10 10 10 10 Stonnington’s SEIFA rating indicates a low level of disadvantage. However, there are pockets of significant disadvantage in Prahran, South Yarra and Windsor, and some localised minor disadvantage in Malvern East.
Workforce turnover
Resignations and terminations compared to average staff
(Number of permanent staff resignations and terminations / Average number of permanent staff for the financial year) x100
14.4% 14.3% 14.5% 12.0% Turnover has been lower due to lower level of departures as a result of the COVID-19 pandemic.
Sustainable capacity indicatorsFor the year ended 30 June 2020

63Performance statement
Definitions » “adjusted underlying revenue” means total income other than:
(a) non-recurrent grants used to fund capital expenditure; and
(b) non-monetary asset contributions; and
(c) contributions to fund capital expenditure from sources other than those referred to above
» “infrastructure” means non-current property, plant and equipment excluding land
» “local road” means a sealed or unsealed road for which the council is the responsible road authority under the Road Management Act 2004
» “population” means the resident population estimated by council
» “own-source revenue” means adjusted underlying revenue other than revenue that is not under the control of council (including government grants)
» “relative socio-economic disadvantage”, in relation to a municipality, means the relative socio-economic disadvantage, expressed as a decile for the relevant financial year, of the area in which the municipality is located according to the Index of Relative Socio-Economic Disadvantage (Catalogue Number 2033.0.55.001) of SEIFA
» “SEIFA” means the Socio-Economic Indexes for Areas published from time to time by the Australian Bureau of Statistics on its Internet website
» “unrestricted cash” means all cash and cash equivalents other than restricted cash.
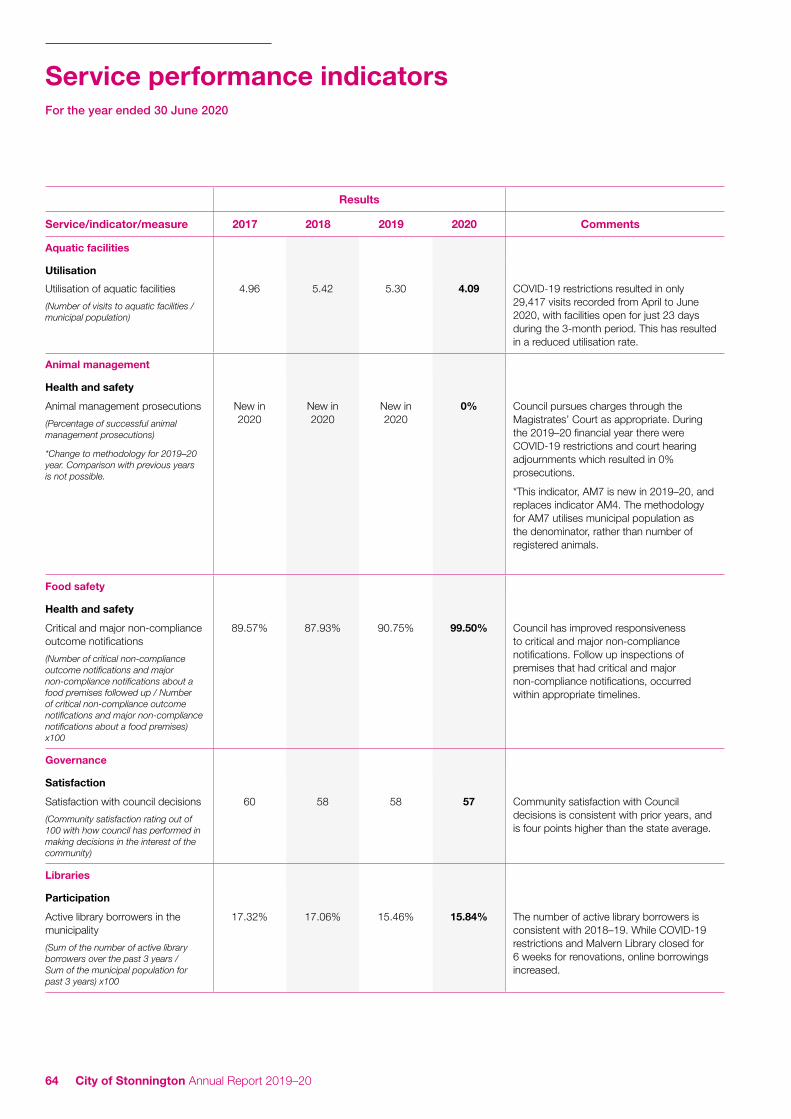
64 City of Stonnington Annual Report 2019–20
Results
Service/indicator/measure 2017 2018 2019 2020 Comments
Aquatic facilities
Utilisation
Utilisation of aquatic facilities
(Number of visits to aquatic facilities / municipal population)
4.96 5.42 5.30 4.09 COVID-19 restrictions resulted in only 29,417 visits recorded from April to June 2020, with facilities open for just 23 days during the 3-month period. This has resulted in a reduced utilisation rate.
Animal management
Health and safety
Animal management prosecutions
(Percentage of successful animal management prosecutions)
*Change to methodology for 2019–20 year. Comparison with previous years is not possible.
New in 2020
New in 2020
New in 2020
0% Council pursues charges through the Magistrates’ Court as appropriate. During the 2019–20 financial year there were COVID-19 restrictions and court hearing adjournments which resulted in 0% prosecutions.
*This indicator, AM7 is new in 2019–20, and replaces indicator AM4. The methodology for AM7 utilises municipal population as the denominator, rather than number of registered animals.
Food safety
Health and safety
Critical and major non-compliance outcome notifications
(Number of critical non-compliance outcome notifications and major non-compliance notifications about a food premises followed up / Number of critical non-compliance outcome notifications and major non-compliance notifications about a food premises) x100
89.57% 87.93% 90.75% 99.50% Council has improved responsiveness to critical and major non-compliance notifications. Follow up inspections of premises that had critical and major non-compliance notifications, occurred within appropriate timelines.
Governance
Satisfaction
Satisfaction with council decisions
(Community satisfaction rating out of 100 with how council has performed in making decisions in the interest of the community)
60 58 58 57 Community satisfaction with Council decisions is consistent with prior years, and is four points higher than the state average.
Libraries
Participation
Active library borrowers in the municipality
(Sum of the number of active library borrowers over the past 3 years / Sum of the municipal population for past 3 years) x100
17.32% 17.06% 15.46% 15.84% The number of active library borrowers is consistent with 2018–19. While COVID-19 restrictions and Malvern Library closed for 6 weeks for renovations, online borrowings increased.
Service performance indicatorsFor the year ended 30 June 2020
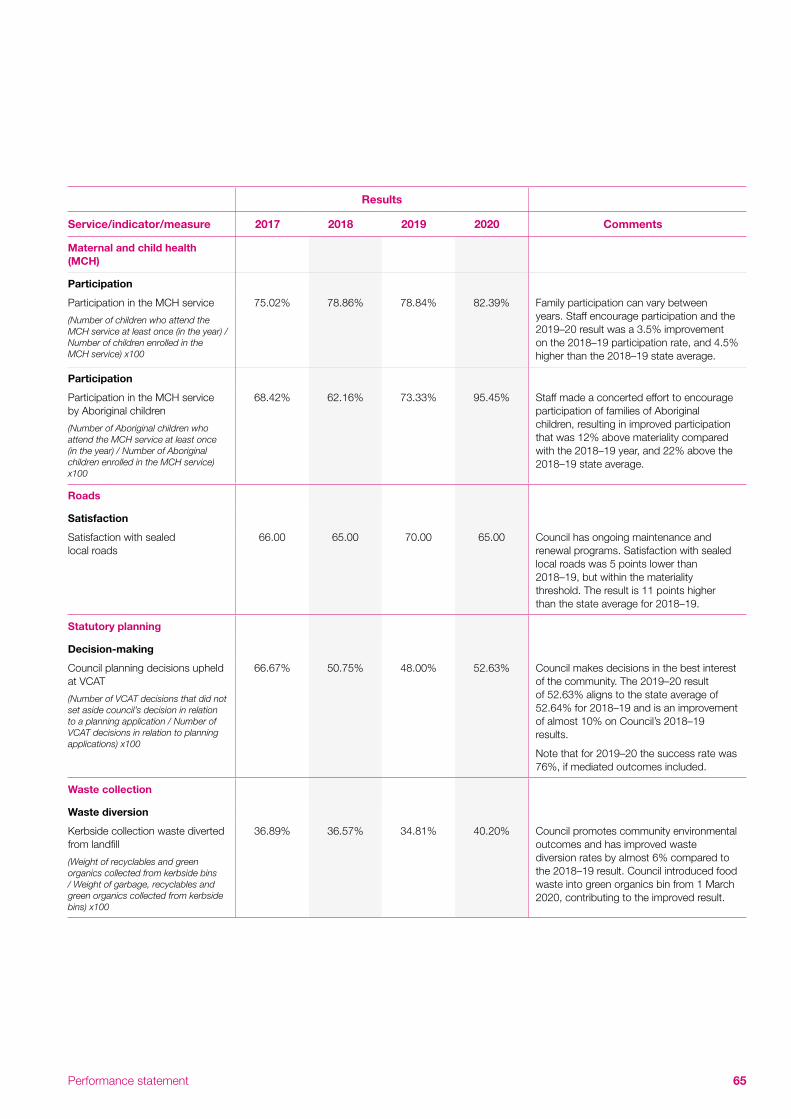
65Performance statement
Results
Service/indicator/measure 2017 2018 2019 2020 Comments
Maternal and child health (MCH)
Participation
Participation in the MCH service
(Number of children who attend the MCH service at least once (in the year) / Number of children enrolled in the MCH service) x100
75.02% 78.86% 78.84% 82.39% Family participation can vary between years. Staff encourage participation and the 2019–20 result was a 3.5% improvement on the 2018–19 participation rate, and 4.5% higher than the 2018–19 state average.
Participation
Participation in the MCH service by Aboriginal children
(Number of Aboriginal children who attend the MCH service at least once (in the year) / Number of Aboriginal children enrolled in the MCH service) x100
68.42% 62.16% 73.33% 95.45% Staff made a concerted effort to encourage participation of families of Aboriginal children, resulting in improved participation that was 12% above materiality compared with the 2018–19 year, and 22% above the 2018–19 state average.
Roads
Satisfaction
Satisfaction with sealed local roads
66.00 65.00 70.00 65.00 Council has ongoing maintenance and renewal programs. Satisfaction with sealed local roads was 5 points lower than 2018–19, but within the materiality threshold. The result is 11 points higher than the state average for 2018–19.
Statutory planning
Decision-making
Council planning decisions upheld at VCAT
(Number of VCAT decisions that did not set aside council’s decision in relation to a planning application / Number of VCAT decisions in relation to planning applications) x100
66.67% 50.75% 48.00% 52.63% Council makes decisions in the best interest of the community. The 2019–20 result of 52.63% aligns to the state average of 52.64% for 2018–19 and is an improvement of almost 10% on Council’s 2018–19 results.
Note that for 2019–20 the success rate was 76%, if mediated outcomes included.
Waste collection
Waste diversion
Kerbside collection waste diverted from landfill
(Weight of recyclables and green organics collected from kerbside bins / Weight of garbage, recyclables and green organics collected from kerbside bins) x100
36.89% 36.57% 34.81% 40.20% Council promotes community environmental outcomes and has improved waste diversion rates by almost 6% compared to the 2018–19 result. Council introduced food waste into green organics bin from 1 March 2020, contributing to the improved result.

66 City of Stonnington Annual Report 2019–20
Definitions » “Aboriginal child” means a child who is an Aboriginal person
» “Aboriginal person” has the same meaning as in the Aboriginal Heritage Act 2006
» “active library member” means a member of a library who has borrowed a book from the library
» “annual report” means an annual report prepared by a council under sections 131,132 and 133 of the Act
» “CALD” means culturally and linguistically diverse and refers to persons born outside Australia in a country whose national language is not English
» “class 1 food premises” means food premises, within the meaning of the Food Act 1984, that have been declared as class 1 food premises under section 19C of that Act
» “class 2 food premises” means food premises, within the meaning of the Food Act 1984, that have been declared as class 2 food premises under section 19C of that Act
» “critical non-compliance outcome notification” means a notification received by council under section 19N(3) or (4) of the Food Act 1984, or advice given to council by an authorized officer under that Act, of a deficiency that poses an immediate serious threat to public health
» “food premises” has the same meaning as in the Food Act 1984
» “local road” means a sealed or unsealed road for which the council is the responsible road authority under the Road Management Act 2004
» “major non-compliance outcome notification” means a notification received by a council under section 19N(3) or (4) of the Food Act 1984, or advice given to council by an authorized officer under that Act, of a deficiency that does not pose an immediate serious threat to public health but may do so if no remedial action is taken
» “MCH” means the Maternal and Child Health Service provided by a council to support the health and development of children within the municipality from birth until school age
» “population” means the resident population estimated by council
» “WorkSafe reportable aquatic facility safety incident” means an incident relating to a council aquatic facility that is required to be notified to the Victorian WorkCover Authority under Part 5 of the Occupational Health and Safety Act 2004.

67Performance statement

68 City of Stonnington Annual Report 2019–20
Financial performance indicatorsFor the year ended 30 June 2020
Results Forecasts
Dimension/indicator/measure 2017 2018 2019 2020 2021 2022 2023 2024 Material Variations
Expenditure level
Expenses per property assessment
(Total expenses / Number of property assessments)
$2,338.30 $2,475.41 $2,523.22 $2,522.68 $2,380.80 $2,436.62 $2,575.56 $2,650.26 Council is delivering quality services in accordance with its long term plan.
Efficiency
Revenue level
Average rate per property assessment
(Total rate revenue / Number of property assessments)
New in 2020
New in 2020
New in 2020
$1,443.55 $1,460.91 $1,531.39 $1,577.78 $1,625.41 Council continues to have one of the lowest average residential rates and charges across metropolitan Melbourne. Council’s actual rate increase was capped at 2.5 per cent for 2019–20. Council is delivering services in accordance with its long term plan.
* This indicator, E4 is new in 2019–20, and replaces indicator E1.
Liquidity
Working capital
Current assets compared to current liabilities
(Current assets / Current liabilities) x100
321.42% 286.98% 260.39% 272.38% 194.75% 147.43% 124.49% 106.01% Council can comfortably meet all short term financial commitments and is in a sound financial position. The decrease in later years reflects increased expenditure in capital works program (using cash reserves). Cash and investments will assist in funding the significant capital works programs planned in the years ahead.
Unrestricted cash
Unrestricted cash compared to current liabilities
(Unrestricted cash / Current liabilities) x100
-196.58% -49.61% -36.38% -86.95% 48.75% 10.22% -1.06% -13.23% The 2019–20 actual result (and prior year results) do not include Council’s significant holdings of Term Deposits with maturity over 90 days (which are classed as Financial Assets). These Term Deposits total $63.0 million in 2019–20. When included in the measure for 2019–20 the result is a very healthy 55.5%. Forecasts for 2019–20 onwards assume that all term deposits as having original maturities of less than 90 days and are therefore included in unrestricted cash. Council is forecast to be in a strong financial position in the years ahead.
Obligations
Loans and borrowings
Loans and borrowings compared to rates
(Interest bearing loans and borrowings / Rate revenue) x100
8.85% 6.99% 23.25% 19.42% 20.41% 34.59% 45.64% 39.15% The balance of Council borrowings at the end of 2019–20 was $26.0 million compared to $7.5 million at the end of 2018–19. New loan borrowings ore forecasted at $5 million for 2020–21, $22 million for 2021-22 and $20 million for 2022-23 to assist in funding the development of major community infrastructure. This is consistent with Council’s long term financial plan.
Loans and borrowings
Loans and borrowings repayments compared to rates
(Interest and principal repayments on interest bearing loans and borrowings / Rate revenue) x100
2.66% 2.35% 2.38% 3.35% 3.27% 3.48% 4.81% 6.32% Loan borrowings of $3.5 million were repaid in 2019–20. New loans and associated repayments are forecast in 2021-22, 2022-23 and 2023-24 to assist in funding the development of major community infrastructure. This is consistent with Council’s long term financial plan.
Indebtedness
Non-current liabilities compared to own source revenue
[Non-current liabilities / Own source revenue] x100
7.06% 5.58% 14.99% 13.78% 15.26% 23.56% 30.10% 25.69% At 2019–20 loan borrowings decreased by $3.5 million. Further loan borrowings of $5 million for 2020–21, $22 million for 2021-22 and $20 million for 2022-23 are forecast to assist in funding the development of major community infrastructure. This is consistent with Council’s long term financial plan.
Asset renewal
Asset renewal and upgrade compared to depreciation
(Asset renewal and asset upgrade expense / Asset depreciation) x100
New in 2020 New in 2020 New in 2020 142.06% 250.00% 321.00% 192.00% 201.00% Council has a robust capital program that ensures appropriate levels of renewals and upgrades are maintained.
* This indicator, O5 is new in 2019–20, and replaces indicator O1.

69Performance statement
Results Forecasts
Dimension/indicator/measure 2017 2018 2019 2020 2021 2022 2023 2024 Material Variations
Expenditure level
Expenses per property assessment
(Total expenses / Number of property assessments)
$2,338.30 $2,475.41 $2,523.22 $2,522.68 $2,380.80 $2,436.62 $2,575.56 $2,650.26 Council is delivering quality services in accordance with its long term plan.
Efficiency
Revenue level
Average rate per property assessment
(Total rate revenue / Number of property assessments)
New in 2020
New in 2020
New in 2020
$1,443.55 $1,460.91 $1,531.39 $1,577.78 $1,625.41 Council continues to have one of the lowest average residential rates and charges across metropolitan Melbourne. Council’s actual rate increase was capped at 2.5 per cent for 2019–20. Council is delivering services in accordance with its long term plan.
* This indicator, E4 is new in 2019–20, and replaces indicator E1.
Liquidity
Working capital
Current assets compared to current liabilities
(Current assets / Current liabilities) x100
321.42% 286.98% 260.39% 272.38% 194.75% 147.43% 124.49% 106.01% Council can comfortably meet all short term financial commitments and is in a sound financial position. The decrease in later years reflects increased expenditure in capital works program (using cash reserves). Cash and investments will assist in funding the significant capital works programs planned in the years ahead.
Unrestricted cash
Unrestricted cash compared to current liabilities
(Unrestricted cash / Current liabilities) x100
-196.58% -49.61% -36.38% -86.95% 48.75% 10.22% -1.06% -13.23% The 2019–20 actual result (and prior year results) do not include Council’s significant holdings of Term Deposits with maturity over 90 days (which are classed as Financial Assets). These Term Deposits total $63.0 million in 2019–20. When included in the measure for 2019–20 the result is a very healthy 55.5%. Forecasts for 2019–20 onwards assume that all term deposits as having original maturities of less than 90 days and are therefore included in unrestricted cash. Council is forecast to be in a strong financial position in the years ahead.
Obligations
Loans and borrowings
Loans and borrowings compared to rates
(Interest bearing loans and borrowings / Rate revenue) x100
8.85% 6.99% 23.25% 19.42% 20.41% 34.59% 45.64% 39.15% The balance of Council borrowings at the end of 2019–20 was $26.0 million compared to $7.5 million at the end of 2018–19. New loan borrowings ore forecasted at $5 million for 2020–21, $22 million for 2021-22 and $20 million for 2022-23 to assist in funding the development of major community infrastructure. This is consistent with Council’s long term financial plan.
Loans and borrowings
Loans and borrowings repayments compared to rates
(Interest and principal repayments on interest bearing loans and borrowings / Rate revenue) x100
2.66% 2.35% 2.38% 3.35% 3.27% 3.48% 4.81% 6.32% Loan borrowings of $3.5 million were repaid in 2019–20. New loans and associated repayments are forecast in 2021-22, 2022-23 and 2023-24 to assist in funding the development of major community infrastructure. This is consistent with Council’s long term financial plan.
Indebtedness
Non-current liabilities compared to own source revenue
[Non-current liabilities / Own source revenue] x100
7.06% 5.58% 14.99% 13.78% 15.26% 23.56% 30.10% 25.69% At 2019–20 loan borrowings decreased by $3.5 million. Further loan borrowings of $5 million for 2020–21, $22 million for 2021-22 and $20 million for 2022-23 are forecast to assist in funding the development of major community infrastructure. This is consistent with Council’s long term financial plan.
Asset renewal
Asset renewal and upgrade compared to depreciation
(Asset renewal and asset upgrade expense / Asset depreciation) x100
New in 2020 New in 2020 New in 2020 142.06% 250.00% 321.00% 192.00% 201.00% Council has a robust capital program that ensures appropriate levels of renewals and upgrades are maintained.
* This indicator, O5 is new in 2019–20, and replaces indicator O1.

70 City of Stonnington Annual Report 2019–20
Financial performance indicatorsFor the year ended 30 June 2020
Cont...
Results Forecasts
Dimension/indicator/measure 2017 2018 2019 2020 2021 2022 2023 2024 Material Variations
Operating position
Adjusted underlying result
Adjusted underlying surplus (or deficit)
(Adjusted underlying surplus (deficit)/ Adjusted underlying revenue) x100
15.48% 13.26% 18.14% 6.97% 6.33% 13.57% 11.66% 11.61% The 2019–20 result is significantly impacted by the lockdown restrictions in place in response to the unprecedented COVID-19 pandemic. The pandemic is also forecast to impact results of 2020–21. Footpath and health permits income were refunded as part of the business support program $0.77 million. Loss of income resulted from the closure of non-essential services including aquatic services $1.38 million and the early year’s services $0.76 million. Parking enforcements were reduced to support essential workers movements $1.73 million. Council activated its hardship policy and paused or significantly reduced commercial rent agreements for tenants of Council owned properties $0.25 million and other non-essential community services income.
Stability
Rates concentration
Rates compared to adjusted underlying revenue
(Rate revenue / Adjusted underlying revenue) x100
61.01% 60.26% 56.27% 65.32% 70.74% 66.64% 66.42% 66.55% The 2019–20 result is due to other revenue sources decreased compared to 2018–19 as a result of COVID-19. The other revenue sources include user fees, statutory fees and fines, monetary contributions and capital works grants. However, rate revenue will continue to be a key source of funding for the delivery of high quality services and infrastructure to the community.
Rates effort
Rates compared to property values
(Rate revenue / Capital improved value of rateable properties in the municipality) x100
0.13% 0.13% 0.12% 0.12% 0.13% 0.13% 0.13% 0.14% This result illustrates the relatively low rating burden for the Stonnington community, and Council continues to have one of the lowest average residential rates and charges across metropolitan Melbourne.

71Performance statement
Results Forecasts
Dimension/indicator/measure 2017 2018 2019 2020 2021 2022 2023 2024 Material Variations
Operating position
Adjusted underlying result
Adjusted underlying surplus (or deficit)
(Adjusted underlying surplus (deficit)/ Adjusted underlying revenue) x100
15.48% 13.26% 18.14% 6.97% 6.33% 13.57% 11.66% 11.61% The 2019–20 result is significantly impacted by the lockdown restrictions in place in response to the unprecedented COVID-19 pandemic. The pandemic is also forecast to impact results of 2020–21. Footpath and health permits income were refunded as part of the business support program $0.77 million. Loss of income resulted from the closure of non-essential services including aquatic services $1.38 million and the early year’s services $0.76 million. Parking enforcements were reduced to support essential workers movements $1.73 million. Council activated its hardship policy and paused or significantly reduced commercial rent agreements for tenants of Council owned properties $0.25 million and other non-essential community services income.
Stability
Rates concentration
Rates compared to adjusted underlying revenue
(Rate revenue / Adjusted underlying revenue) x100
61.01% 60.26% 56.27% 65.32% 70.74% 66.64% 66.42% 66.55% The 2019–20 result is due to other revenue sources decreased compared to 2018–19 as a result of COVID-19. The other revenue sources include user fees, statutory fees and fines, monetary contributions and capital works grants. However, rate revenue will continue to be a key source of funding for the delivery of high quality services and infrastructure to the community.
Rates effort
Rates compared to property values
(Rate revenue / Capital improved value of rateable properties in the municipality) x100
0.13% 0.13% 0.12% 0.12% 0.13% 0.13% 0.13% 0.14% This result illustrates the relatively low rating burden for the Stonnington community, and Council continues to have one of the lowest average residential rates and charges across metropolitan Melbourne.
72 City of Stonnington Annual Report 2019–20
Definitions » “adjusted underlying revenue” means total income other than:
(a) non-recurrent grants used to fund capital expenditure; and
(b) non-monetary asset contributions; and
(c) contributions to fund capital expenditure from sources other than those referred to above
» “adjusted underlying surplus (or deficit)” means adjusted underlying revenue less total expenditure
» “asset renewal expenditure” means expenditure on an existing asset or on replacing an existing asset that returns the service capability of the asset to its original capability
» “current assets” has the same meaning as in the AAS Local Government Better Practice Guide Performance Statement 2019–2031
» “current liabilities” has the same meaning as in the AAS
» “non-current assets” means all assets other than current assets
» “non-current liabilities” means all liabilities other than current liabilities
» “non-recurrent grant” means a grant obtained on the condition that it be expended in a specified manner and is not expected to be received again during the period covered by a council’s Strategic Resource Plan
» “own-source revenue” means adjusted underlying revenue other than revenue that is not under the control of council (including government grants
» “population” means the resident population estimated by council
» “rate revenue” means revenue from general rates, municipal charges, service rates and service charges
» “recurrent grant” means a grant other than a non-recurrent grant
» “residential rates” means revenue from general rates, municipal charges, service rates and service charges levied on residential properties
» “restricted cash” means cash and cash equivalents, within the meaning of the AAS, that are not available for use other than for a purpose for which it is restricted, and includes cash to be used to fund capital works expenditure from the previous financial year
» “unrestricted cash” means all cash and cash equivalents other than restricted cash.
Financial performance indicatorsFor the year ended 30 June 2020
Cont...
73Performance statement
Basis of Preparation
Council is required to prepare and include a performance statement within its annual report. The performance statement includes the results of the prescribed sustainable capacity, service performance and financial performance indicators and measures together with a description of the municipal district and an explanation of material variations in the results. This statement has been prepared to meet the requirements of the Local Government Act 1989 and Local Government (Planning and Reporting) Regulations 2014.
Where applicable the results in the performance statement have been prepared on accounting bases consistent with those reported in the Financial Statements. The other results are based on information drawn from council information systems or from third parties (e.g. Australian Bureau of Statistics).
The performance statement presents the actual results for the current year and for the prescribed financial performance indicators and measures, the results forecast by Council’s strategic resource plan. The Local Government (Planning and Reporting) Regulations 2014 require explanation of any material variations in the results contained in the performance statement. Council has adopted materiality thresholds relevant to each indicator and measure and explanations have not been provided for variations below the materiality thresholds unless the variance is considered to be material because of its nature.
The forecast figures included in the performance statement are those adopted by Council in its strategic resource plan on 31 August 2020 and which forms part of the Council Plan.
The strategic resource plan includes estimates based on key assumptions about the future that were relevant at the time of adoption and aimed at achieving sustainability over the long term. Detailed information on the actual financial results is contained in the General Purpose Financial Statements. The strategic resource plan can be obtained by contacting Council.
Other informationFor the year ended 30 June 2020

74 City of Stonnington Annual Report 2019–2074 City of Stonnington Annual Report 2019–20
In my opinion, the accompanying performance statement has been prepared in accordance with the Local Government Act 1989 and the Local Government (Planning and Reporting) Regulations 2014.
Julia Gallace, B.Acy, CA Principal Accounting Officer
Dated: 5 October 2020
In our opinion, the accompanying performance statement of the City of Stonnington for the year ended 30 June 2020 presents fairly the results of council’s performance in accordance with the Local Government Act 1989 and the Local Government (Planning and Reporting) Regulations 2014.
The performance statement contains the relevant performance indicators, measures and results in relation to service performance, financial performance and sustainable capacity.
At the date of signing, we are not aware of any circumstances that would render any particulars in the performance statement to be misleading or inaccurate.
We have been authorised by the council and by the Local Government (Planning and Reporting) Regulations 2014 to certify this performance statement in its final form.
Steven Stefanopoulos Councillor
Dated: 5 October 2020
John Chandler Councillor
Dated: 5 October 2020
Jacqui Weatherill Chief Executive Officer
Dated: 5 October 2020
Certification of the performance statement
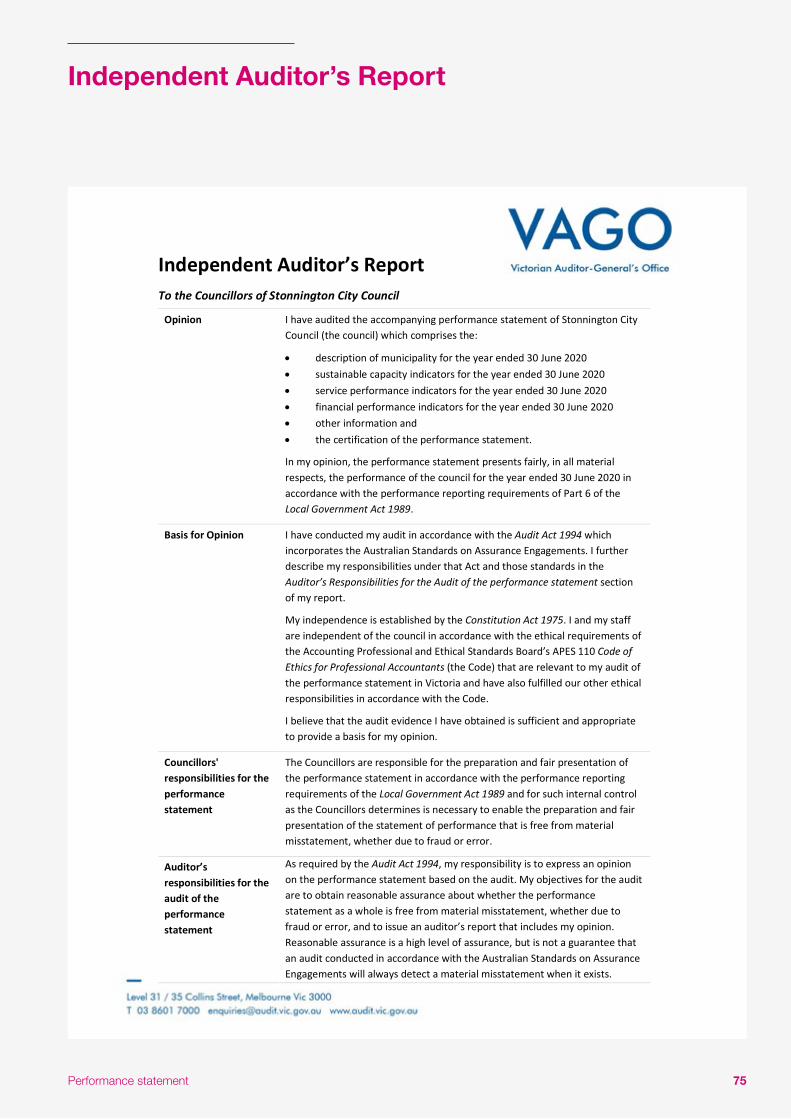
75Performance statement
Independent Auditor’s Report
Independent Auditor’s Report To the Councillors of Stonnington City Council
Opinion I have audited the accompanying performance statement of Stonnington City Council (the council) which comprises the:
description of municipality for the year ended 30 June 2020 sustainable capacity indicators for the year ended 30 June 2020 service performance indicators for the year ended 30 June 2020 financial performance indicators for the year ended 30 June 2020 other information and the certification of the performance statement.
In my opinion, the performance statement presents fairly, in all material respects, the performance of the council for the year ended 30 June 2020 in accordance with the performance reporting requirements of Part 6 of the Local Government Act 1989.
Basis for Opinion I have conducted my audit in accordance with the Audit Act 1994 which incorporates the Australian Standards on Assurance Engagements. I further describe my responsibilities under that Act and those standards in the Auditor’s Responsibilities for the Audit of the performance statement section of my report.
My independence is established by the Constitution Act 1975. I and my staff are independent of the council in accordance with the ethical requirements of the Accounting Professional and Ethical Standards Board’s APES 110 Code of Ethics for Professional Accountants (the Code) that are relevant to my audit of the performance statement in Victoria and have also fulfilled our other ethical responsibilities in accordance with the Code.
I believe that the audit evidence I have obtained is sufficient and appropriate to provide a basis for my opinion.
Councillors' responsibilities for the performance statement
The Councillors are responsible for the preparation and fair presentation of the performance statement in accordance with the performance reporting requirements of the Local Government Act 1989 and for such internal control as the Councillors determines is necessary to enable the preparation and fair presentation of the statement of performance that is free from material misstatement, whether due to fraud or error.
Auditor’s responsibilities for the audit of the performance statement
As required by the Audit Act 1994, my responsibility is to express an opinion on the performance statement based on the audit. My objectives for the audit are to obtain reasonable assurance about whether the performance statement as a whole is free from material misstatement, whether due to fraud or error, and to issue an auditor’s report that includes my opinion. Reasonable assurance is a high level of assurance, but is not a guarantee that an audit conducted in accordance with the Australian Standards on Assurance Engagements will always detect a material misstatement when it exists.
76 City of Stonnington Annual Report 2019–20
2
Misstatements can arise from fraud or error and are considered material if, individually or in the aggregate, they could reasonably be expected to influence the decisions of users taken on the basis of this performance statement.
As part of an audit in accordance with the Australian Standards on Assurance Engagements, I exercise professional judgement and maintain professional scepticism throughout the audit. I also:
identify and assess the risks of material misstatement of performance statement, whether due to fraud or error, design and perform audit procedures responsive to those risks, and obtain audit evidence that is sufficient and appropriate to provide a basis for my opinion. The risk of not detecting a material misstatement resulting from fraud is higher than for one resulting from error, as fraud may involve collusion, forgery, intentional omissions, misrepresentations, or the override of internal control.
obtain an understanding of internal control relevant to the audit in order to design audit procedures that are appropriate in the circumstances, but not for the purpose of expressing an opinion on the effectiveness of the council’s internal control
evaluate the overall presentation, structure and content of the performance statement, including the disclosures, and whether performance statement represents the underlying events and results in a manner that achieves fair presentation.
I communicate with the Councillors regarding, among other matters, the planned scope and timing of the audit and significant audit findings, including any significant deficiencies in internal control that I identify during my audit.
MELBOURNE 13 October 2020
Sanchu Chummar as delegate for the Auditor-General of Victoria
Independent Auditor’s ReportCont...

77
AnnualFinancial
ReportFor the year ended 30 June 2020
77
78 City of Stonnington Annual Report 2019–20
Certification of the Consolidated Financial Statements
In my opinion the accompanying consolidated financial statements have been prepared in accordance with the Local Government Act 1989, the Local Government (Planning and Reporting) Regulations 2014, Australian Accounting Standards and other mandatory professional reporting requirements.
Julia Gallace, B.Acy, CA Principal Accounting Officer
Date: 5 October 2020
Malvern
In our opinion the accompanying consolidated financial statements present fairly the financial transactions of Stonnington City Council and its subsidary for the year ended 30 June 2020 and the financial position of Stonnington City Council and its subsidiary as at that date.
As at the date of signing, we are not aware of any circumstances which would render any particulars in the consolidated financial statements to be misleading or inaccurate.
We have been authorised by Council and by the Local Government (Planning and Reporting) Regulations 2014 to certify the consolidated financial statements in their final form.
Steven Stefanopoulos Councillor
Date: 5 October 2020
Malvern
John Chandler Councillor
Date: 5 October 2020
Malvern
Jacqui Weatherill Chief Executive Officer
Date: 5 October 2020
Malvern

79Annual Financial Report
Independent Auditor’s Report
Independent Auditor’s Report To the Councillors of Stonnington City Council
Opinion I have audited the consolidated financial report of Stonnington City Council (the council) and its controlled entity (together, the consolidated entity), which comprises the:
consolidated entity and council balance sheet as at 30 June 2020 consolidated entity and council comprehensive income statement for the year then ended consolidated entity and council statement of changes in equity for the year then ended consolidated entity and council statement of cash flows for the year then ended council statement of capital works for the year then ended notes to the financial statements, including significant accounting policies certification of the consolidated financial statements.
In my opinion, the financial report presents fairly, in all material respects, the financial positions of the consolidated entity and the council as at 30 June 2020 and their financial performance and cash flows for the year then ended in accordance with the financial reporting requirements of Part 6 of the Local Government Act 1989 and applicable Australian Accounting Standards.
Basis for Opinion
I have conducted my audit in accordance with the Audit Act 1994 which incorporates the Australian Auditing Standards. I further describe my responsibilities under that Act and those standards in the Auditor’s Responsibilities for the Audit of the Financial Report section of my report.
My independence is established by the Constitution Act 1975. My staff and I are independent of the council and the consolidated entity in accordance with the ethical requirements of the Accounting Professional and Ethical Standards Board’s APES 110 Code of Ethics for Professional Accountants (the Code) that are relevant to my audit of the financial report in Victoria. My staff and I have also fulfilled our other ethical responsibilities in accordance with the Code.
I believe that the audit evidence I have obtained is sufficient and appropriate to provide a basis for my opinion.
Councillors’s responsibilities for the financial report
The Councillors of the council are responsible for the preparation and fair presentation of the financial report in accordance with Australian Accounting Standards and the Local Government Act 1989, and for such internal control as the Councillors determine is necessary to enable the preparation and fair presentation of a financial report that is free from material misstatement, whether due to fraud or error.
In preparing the financial report, the Councillors are responsible for assessing the council and the consolidated entity’s ability to continue as a going concern, disclosing, as applicable, matters related to going concern and using the going concern basis of accounting unless it is inappropriate to do so.

80 City of Stonnington Annual Report 2019–20
Independent Auditor’s ReportCont...
2
Auditor’s responsibilities for the audit of the financial report
As required by the Audit Act 1994, my responsibility is to express an opinion on the financial report based on the audit. My objectives for the audit are to obtain reasonable assurance about whether the financial report as a whole is free from material misstatement, whether due to fraud or error, and to issue an auditor’s report that includes my opinion. Reasonable assurance is a high level of assurance, but is not a guarantee that an audit conducted in accordance with the Australian Auditing Standards will always detect a material misstatement when it exists. Misstatements can arise from fraud or error and are considered material if, individually or in the aggregate, they could reasonably be expected to influence the economic decisions of users taken on the basis of this financial report.
As part of an audit in accordance with the Australian Auditing Standards, I exercise professional judgement and maintain professional scepticism throughout the audit. I also:
identify and assess the risks of material misstatement of the financial report, whether due to fraud or error, design and perform audit procedures responsive to those risks, and obtain audit evidence that is sufficient and appropriate to provide a basis for my opinion. The risk of not detecting a material misstatement resulting from fraud is higher than for one resulting from error, as fraud may involve collusion, forgery, intentional omissions, misrepresentations, or the override of internal control.
obtain an understanding of internal control relevant to the audit in order to design audit procedures that are appropriate in the circumstances, but not for the purpose of expressing an opinion on the effectiveness of the council and the consolidated entity’s internal control
evaluate the appropriateness of accounting policies used and the reasonableness of accounting estimates and related disclosures made by the Councillors
conclude on the appropriateness of the Councillors' use of the going concern basis of accounting and, based on the audit evidence obtained, whether a material uncertainty exists related to events or conditions that may cast significant doubt on the council and the consolidated entity’s ability to continue as a going concern. If I conclude that a material uncertainty exists, I am required to draw attention in my auditor’s report to the related disclosures in the financial report or, if such disclosures are inadequate, to modify my opinion. My conclusions are based on the audit evidence obtained up to the date of my auditor’s report. However, future events or conditions may cause the council and the consolidated entity to cease to continue as a going concern.
evaluate the overall presentation, structure and content of the financial report, including the disclosures, and whether the financial report represents the underlying transactions and events in a manner that achieves fair presentation
obtain sufficient appropriate audit evidence regarding the financial information of the entities or business activities within the council and consolidated entity to express an opinion on the financial report. I remain responsible for the direction, supervision and performance of the audit of the council and the consolidated entity. I remain solely responsible for my audit opinion.
I communicate with the Councillors regarding, among other matters, the planned scope and timing of the audit and significant audit findings, including any significant deficiencies in internal control that I identify during my audit.
MELBOURNE 13 October 2020
Sanchu Chummar as delegate for the Auditor-General of Victoria
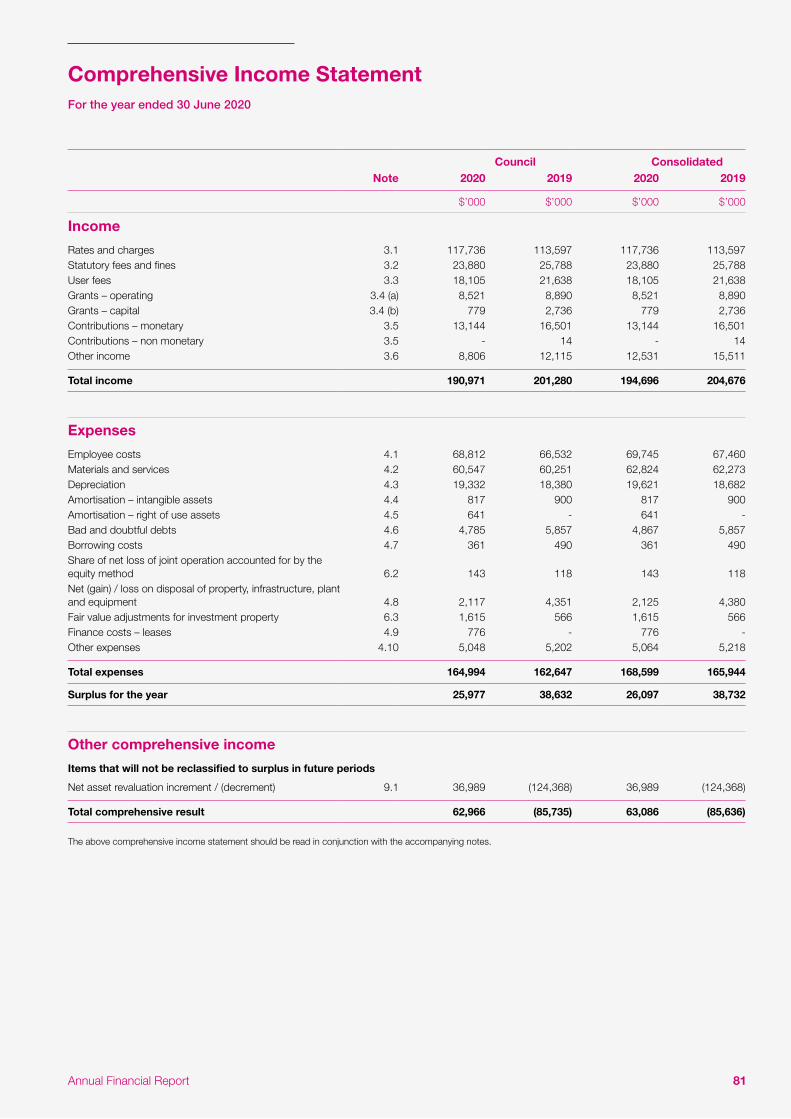
81Annual Financial Report
Council ConsolidatedNote 2020 2019 2020 2019
$’000 $’000 $’000 $’000
Income
Rates and charges 3.1 117,736 113,597 117,736 113,597Statutory fees and fines 3.2 23,880 25,788 23,880 25,788User fees 3.3 18,105 21,638 18,105 21,638Grants – operating 3.4 (a) 8,521 8,890 8,521 8,890Grants – capital 3.4 (b) 779 2,736 779 2,736Contributions – monetary 3.5 13,144 16,501 13,144 16,501Contributions – non monetary 3.5 - 14 - 14Other income 3.6 8,806 12,115 12,531 15,511
Total income 190,971 201,280 194,696 204,676
Expenses
Employee costs 4.1 68,812 66,532 69,745 67,460Materials and services 4.2 60,547 60,251 62,824 62,273Depreciation 4.3 19,332 18,380 19,621 18,682Amortisation – intangible assets 4.4 817 900 817 900Amortisation – right of use assets 4.5 641 - 641 -Bad and doubtful debts 4.6 4,785 5,857 4,867 5,857Borrowing costs 4.7 361 490 361 490Share of net loss of joint operation accounted for by the equity method 6.2 143 118 143 118Net (gain) / loss on disposal of property, infrastructure, plant and equipment 4.8 2,117 4,351 2,125 4,380Fair value adjustments for investment property 6.3 1,615 566 1,615 566Finance costs – leases 4.9 776 - 776 -Other expenses 4.10 5,048 5,202 5,064 5,218
Total expenses 164,994 162,647 168,599 165,944
Surplus for the year 25,977 38,632 26,097 38,732
Other comprehensive income
Items that will not be reclassified to surplus in future periods
Net asset revaluation increment / (decrement) 9.1 36,989 (124,368) 36,989 (124,368)
Total comprehensive result 62,966 (85,735) 63,086 (85,636)
The above comprehensive income statement should be read in conjunction with the accompanying notes.
Comprehensive Income StatementFor the year ended 30 June 2020

82 City of Stonnington Annual Report 2019–20
Council ConsolidatedNote 2020 2019 2020 2019
$’000 $’000 $’000 $’000
Assets
Current assetsCash and cash equivalents 5.1 (a) 43,711 12,125 44,874 13,116Trade and other receivables 5.1 (c) 12,865 10,436 13,289 10,686
Other financial assets 5.1 (b) 63,000 99,000 63,000 99,000Other assets 5.2 (a) 901 3,653 1,171 3,699
Total current assets 120,477 125,214 122,334 126,501
Non-current assetsOther financial assets 5.1 (b) 15 245 15 245Investments in joint operation and subsidiary 6.2 2,363 2,632 363 632Property, infrastructure, plant and equipment 6.1 2,928,051 2,866,352 2,933,921 2,872,463Right-of-use assets 5.8 1,971 - 1,971 -Investment property 6.3 7,485 9,100 7,485 9,100Intangible assets 5.2 (b) 1,286 1,733 1,286 1,733
Total non-current assets 2,941,171 2,880,062 2,945,041 2,884,173
Total assets 3,061,648 3,005,276 3,067,375 3,010,674
Liabilities
Current liabilitiesTrade and other payables 5.3 (a) 13,981 21,907 14,317 22,280Trust funds and deposits 5.3 (b) 8,434 7,716 8,487 7,769Unearned income 5.3 (c) 1,952 - 1,952 -Provisions 5.5 (a) & (b) 15,223 14,964 15,384 15,083Interest-bearing liabilities 5.4 3,500 3,500 3,500 3,500Lease liabilitites 5.8 1,143 - 1,143 -
Total current liabilities 44,233 48,087 44,783 48,632
Non-current liabilities
Provisions 5.5 (a) 2,061 1,891 2,064 1,893Interest-bearing liabilities 5.4 19,000 22,500 19,000 22,500Lease liabilitites 5.8 717 - 717 -Other liabilities 6.2 1,441 1,566 1,441 1,566
Total non-current liabilities 23,219 25,957 23,222 25,959
Total liabilities 67,450 74,044 68,005 74,591
Net assets 2,994,198 2,931,232 2,999,370 2,936,083
EquityAccumulated surplus 1,109,343 1,095,388 1,114,515 1,100,238Reserves 9.1 1,884,855 1,835,844 1,884,855 1,835,844
Total equity 2,994,198 2,931,232 2,999,370 2,936,083
The above balance sheet should be read in conjunction with the accompanying notes.
Balance SheetAs at 30 June 2020
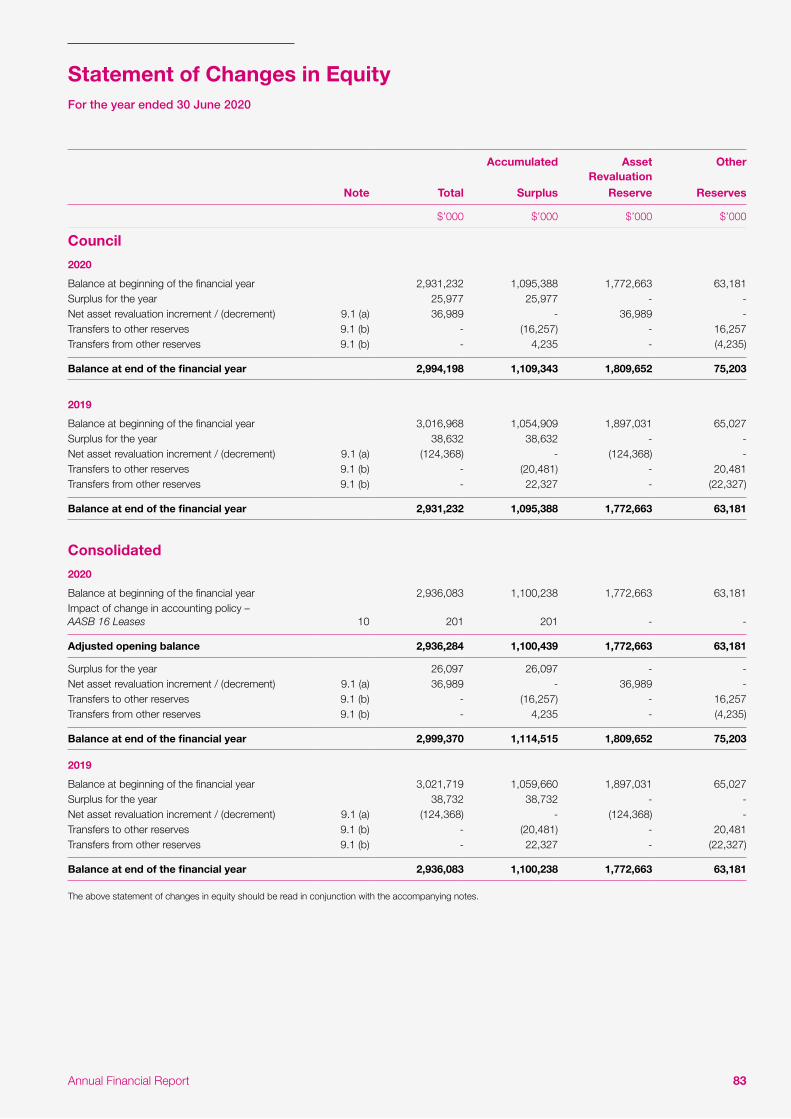
83Annual Financial Report
Accumulated Asset Revaluation
Other
Note Total Surplus Reserve Reserves
$’000 $’000 $’000 $’000
Council
2020
Balance at beginning of the financial year 2,931,232 1,095,388 1,772,663 63,181Surplus for the year 25,977 25,977 - -Net asset revaluation increment / (decrement) 9.1 (a) 36,989 - 36,989 -Transfers to other reserves 9.1 (b) - (16,257) - 16,257Transfers from other reserves 9.1 (b) - 4,235 - (4,235)
Balance at end of the financial year 2,994,198 1,109,343 1,809,652 75,203
2019
Balance at beginning of the financial year 3,016,968 1,054,909 1,897,031 65,027Surplus for the year 38,632 38,632 - -Net asset revaluation increment / (decrement) 9.1 (a) (124,368) - (124,368) -Transfers to other reserves 9.1 (b) - (20,481) - 20,481Transfers from other reserves 9.1 (b) - 22,327 - (22,327)
Balance at end of the financial year 2,931,232 1,095,388 1,772,663 63,181
Consolidated
2020
Balance at beginning of the financial year 2,936,083 1,100,238 1,772,663 63,181Impact of change in accounting policy – AASB 16 Leases 10 201 201 - -
Adjusted opening balance 2,936,284 1,100,439 1,772,663 63,181
Surplus for the year 26,097 26,097 - -Net asset revaluation increment / (decrement) 9.1 (a) 36,989 - 36,989 -Transfers to other reserves 9.1 (b) - (16,257) - 16,257Transfers from other reserves 9.1 (b) - 4,235 - (4,235)
Balance at end of the financial year 2,999,370 1,114,515 1,809,652 75,203
2019
Balance at beginning of the financial year 3,021,719 1,059,660 1,897,031 65,027Surplus for the year 38,732 38,732 - -Net asset revaluation increment / (decrement) 9.1 (a) (124,368) - (124,368) -Transfers to other reserves 9.1 (b) - (20,481) - 20,481Transfers from other reserves 9.1 (b) - 22,327 - (22,327)
Balance at end of the financial year 2,936,083 1,100,238 1,772,663 63,181
The above statement of changes in equity should be read in conjunction with the accompanying notes.
Statement of Changes in EquityFor the year ended 30 June 2020

84 City of Stonnington Annual Report 2019–20
Council ConsolidatedNote 2020 2019 2020 2019
Inflows/(Outflows)
Inflows/ (Outflows)
Inflows/ (Outflows)
Inflows/ (Outflows)
$’000 $’000 $’000 $’000
Cash flows from operating activities
Rates and charges 113,832 113,278 113,832 113,278Statutory fees and fines 24,211 26,604 24,211 26,604User fees 18,918 22,883 18,918 27,157Grants – operating 9,070 9,486 9,070 9,486Grants – capital 1,566 2,739 1,566 2,739Contributions - monetary 13,043 16,597 13,043 16,597Interest received 2,240 2,644 2,246 2,655Other receipts 7,100 9,657 11,390 9,657Net GST refund 10,175 11,629 10,006 11,457Trust funds and deposits taken 22,613 21,328 22,613 21,328Employee costs (68,033) (67,407) (68,928) (68,345)Materials and services (74,729) (77,353) (74,729) ( 80,063 )Short-term, low value and variable lease payments (337) - (337) -Trust funds and deposits repaid (21,481) (20,626) (21,481) (20,652)Other payments (4,676) (6,070) (7,688) (6,072)
Net cash provided by operating activities 9.2 53,513 65,388 53,730 65,825
Cash flows from investing activities
Payments for property, infrastructure, plant and equipment 6.1 (53,332) (81,146) (53,387) (81,185)Proceeds from sale of property, infrastructure, plant and equipment 393 642 393 663Payments for investments (72,500) (146,800) (72,500) (146,800)Receipts from investments 108,500 137,800 108,500 137,800
Net cash used in investing activities (16,939) (89,504) (16,994) (89,522)
Cash flows from financing activities
Borrowing costs (376) (469) (376) (469)Proceeds from borrowings - 20,000 - 20,000Repayment of borrowings (3,500) (2,187) (3,490) (2,236)Interest paid – lease liability (776) - (776) -Repayment of lease liabilities (337) - (337) -
Net cash provided by/(used in) financing activities (4,989) 17,344 (4,979) 17,295
Net (decrease)/increase in cash and cash equivalents 31,585 (6,772) 31,758 (6,402)Cash and cash equivalents at the beginning of the financial year 12,125 18,897 13,116 19,518
Cash and cash equivalents at the end of the financial year
5.1 (a) 43,711 12,125 44,874 13,116
Financing arrangements 5.6
Restrictions on cash assets 5.1 (b)
The above statement of cash flows should be read in conjunction with the accompanying notes.
Statement of Cash FlowsFor the year ended 30 June 2020

85Annual Financial Report
Council2020 2019
$’000 $’000
Property
Land 1,030 7,518
Total land 1,030 7,518
Buildings
6,334
11,246
Heritage buildings 812 1,275
Total buildings 7,146 12,521
Total property 8,176 20,039
Plant and equipment
Heritage plant and equipment 1,587 262Plant, machinery and equipment 2,489 3,826Fixtures, fittings and furniture 605 591Computers and telecommunications 382 585Library books 843 832
Total plant and equipment 5,906 6,096
Infrastructure
Roads 7,845 4,970Bridges - 209Footpaths and cycleways 594 1,094Drainage 3,546 1,903Recreational, leisure and community facilities 1,528 3,448Parks, open space and streetscapes 16,668 42,356Other infrastructure 2,290 1,596
Total infrastructure 32,471 55,576
Total capital works expenditure 46,553 81,711
Represented by:
New asset expenditure 18,595 50,084Asset renewal expenditure 19,502 25,640Asset expansion expenditure 494 1,728Asset upgrade expenditure 7,962 4,259
Total capital works expenditure 46,553 81,711
The above statement of capital works should be read in conjunction with the accompanying notes.
Statement of Capital WorksFor the year ended 30 June 2020
86 City of Stonnington Annual Report 2019–20
Overview
Introduction
Stonnington City Council was established by an Order of the Governor in Council on 22 June 1994 and is a body corporate.
Council’s main office is located at 311 Glenferrie Road, Malvern, Victoria.
Statement of compliance
These consolidated financial statements are a general purpose financial report that consists of a Comprehensive Income Statement, Balance Sheet, Statement of Changes in Equity, Statement of Cash Flows, Statement of Capital Works and Notes accompanying these consolidated financial statements. The general purpose financial report complies with Australian Accounting Standards (AAS), other authoritative pronouncements of the Australian Accounting Standards Board, the Local Government Act 1989, and the Local Government (Planning and Reporting) Regulations 2014.
Significant accounting policies
Basis of accounting
The accrual basis of accounting has been used in the preparation of these consolidated financial statements, whereby assets, liabilities, equity, income and expenses are recognised in the reporting period to which they relate, regardless of when cash is received or paid.
Judgements, estimates and assumptions are required to be made about the carrying values of assets and liabilities that are not readily apparent from other sources. The estimates and associated judgements are based on professional judgement derived from historical experience and various other factors that are believed to be reasonable under the circumstances. Actual results may differ from these estimates.
Revisions to accounting estimates are recognised in the period in which the estimate is revised and also in future periods that are affected by the revision. Judgements and assumptions made by management in the application of AASs that have significant effects on the consolidated financial statements and estimates relate to:
» the fair value of land, buildings, infrastructure, plant and equipment (refer to note 6.1)
» the determination of depreciation for buildings, infrastructure, plant and equipment (refer to note 6.1)
» the determination of employee provisions (refer to note 5.5)
» the determination of whether performance obligations are sufficiently specific so as to determine whether an arrangement is within the scope of AASB 15 Revenue from Contracts with Customers or AASB 1058 Income of Not-for-Profit Entities (refer to Note 3)
» the determination, in accordance with AASB 16 Leases, of the lease term, the estimation of the discount rate when not implicit in the lease and whether an arrangement is in substance short-term or low value (refer to Note 5.8), and
» other areas requiring judgements.
Unless otherwise stated, all accounting policies are consistent with those applied in the prior year. Where appropriate, comparative figures have been amended to accord with current presentation (except where transitional requirements of AASB 15 Revenue from Contracts with Customers, AASB 16 Leases and AASB 1058 Income of Not-for-Profit Entities do not require restatement of comparatives under the modified retrospective approach adopted by the Council), and disclosure has been made of any material changes to comparatives.
Notes to the Financial ReportFor the year ended 30 June 2020
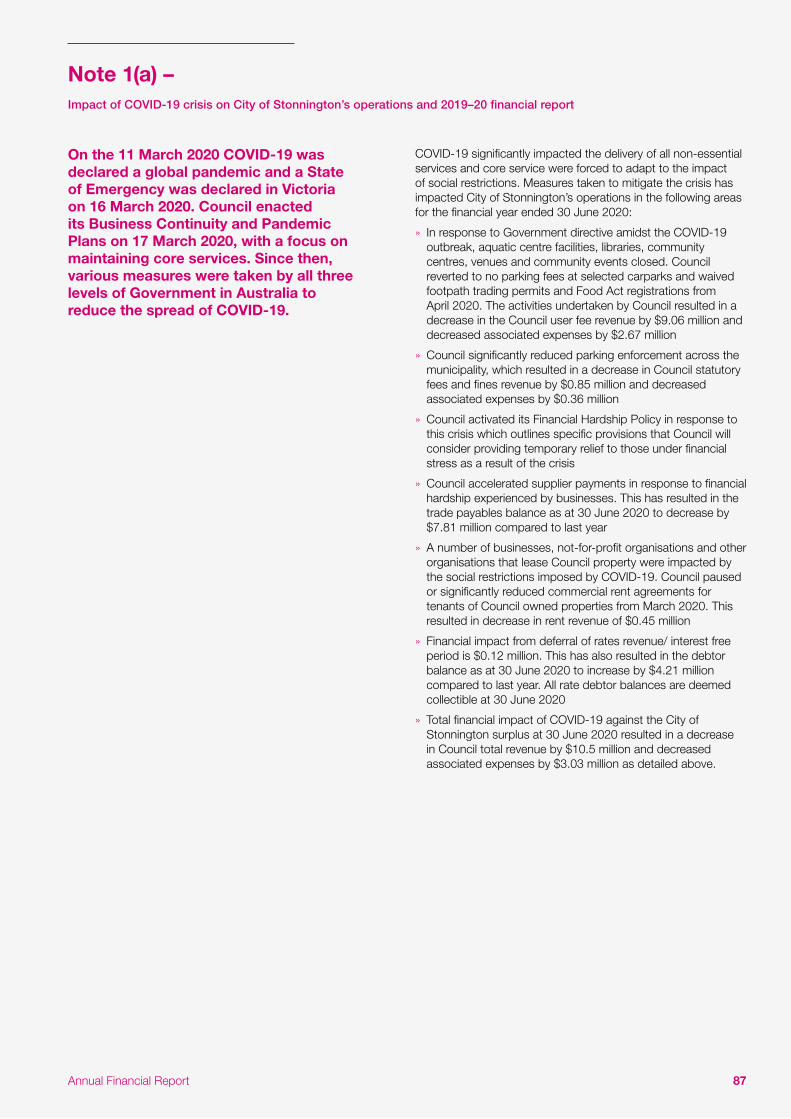
87Annual Financial Report
On the 11 March 2020 COVID-19 was declared a global pandemic and a State of Emergency was declared in Victoria on 16 March 2020. Council enacted its Business Continuity and Pandemic Plans on 17 March 2020, with a focus on maintaining core services. Since then, various measures were taken by all three levels of Government in Australia to reduce the spread of COVID-19.
COVID-19 significantly impacted the delivery of all non-essential services and core service were forced to adapt to the impact of social restrictions. Measures taken to mitigate the crisis has impacted City of Stonnington’s operations in the following areas for the financial year ended 30 June 2020:
» In response to Government directive amidst the COVID-19 outbreak, aquatic centre facilities, libraries, community centres, venues and community events closed. Council reverted to no parking fees at selected carparks and waived footpath trading permits and Food Act registrations from April 2020. The activities undertaken by Council resulted in a decrease in the Council user fee revenue by $9.06 million and decreased associated expenses by $2.67 million
» Council significantly reduced parking enforcement across the municipality, which resulted in a decrease in Council statutory fees and fines revenue by $0.85 million and decreased associated expenses by $0.36 million
» Council activated its Financial Hardship Policy in response to this crisis which outlines specific provisions that Council will consider providing temporary relief to those under financial stress as a result of the crisis
» Council accelerated supplier payments in response to financial hardship experienced by businesses. This has resulted in the trade payables balance as at 30 June 2020 to decrease by $7.81 million compared to last year
» A number of businesses, not-for-profit organisations and other organisations that lease Council property were impacted by the social restrictions imposed by COVID-19. Council paused or significantly reduced commercial rent agreements for tenants of Council owned properties from March 2020. This resulted in decrease in rent revenue of $0.45 million
» Financial impact from deferral of rates revenue/ interest free period is $0.12 million. This has also resulted in the debtor balance as at 30 June 2020 to increase by $4.21 million compared to last year. All rate debtor balances are deemed collectible at 30 June 2020
» Total financial impact of COVID-19 against the City of Stonnington surplus at 30 June 2020 resulted in a decrease in Council total revenue by $10.5 million and decreased associated expenses by $3.03 million as detailed above.
Note 1(a) –Impact of COVID-19 crisis on City of Stonnington’s operations and 2019–20 financial report
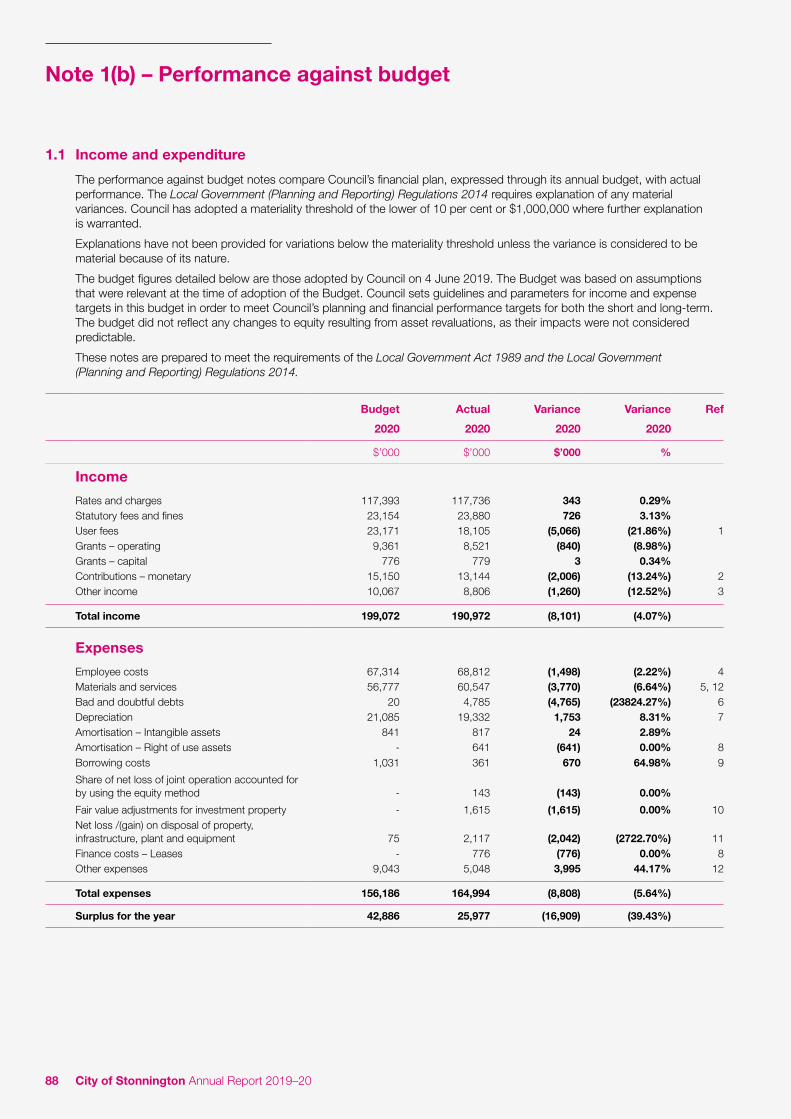
88 City of Stonnington Annual Report 2019–20
1.1 Income and expenditure
The performance against budget notes compare Council’s financial plan, expressed through its annual budget, with actual performance. The Local Government (Planning and Reporting) Regulations 2014 requires explanation of any material variances. Council has adopted a materiality threshold of the lower of 10 per cent or $1,000,000 where further explanation is warranted.
Explanations have not been provided for variations below the materiality threshold unless the variance is considered to be material because of its nature.
The budget figures detailed below are those adopted by Council on 4 June 2019. The Budget was based on assumptions that were relevant at the time of adoption of the Budget. Council sets guidelines and parameters for income and expense targets in this budget in order to meet Council’s planning and financial performance targets for both the short and long-term. The budget did not reflect any changes to equity resulting from asset revaluations, as their impacts were not considered predictable.
These notes are prepared to meet the requirements of the Local Government Act 1989 and the Local Government (Planning and Reporting) Regulations 2014.
Budget Actual Variance Variance Ref
2020 2020 2020 2020
$’000 $’000 $’000 %
Income
Rates and charges 117,393 117,736 343 0.29%Statutory fees and fines 23,154 23,880 726 3.13%User fees 23,171 18,105 (5,066) (21.86%) 1Grants – operating 9,361 8,521 (840) (8.98%)Grants – capital 776 779 3 0.34%Contributions – monetary 15,150 13,144 (2,006) (13.24%) 2Other income 10,067 8,806 (1,260) (12.52%) 3
Total income 199,072 190,972 (8,101) (4.07%)
Expenses
Employee costs 67,314 68,812 (1,498) (2.22%) 4Materials and services 56,777 60,547 (3,770) (6.64%) 5, 12Bad and doubtful debts 20 4,785 (4,765) (23824.27%) 6Depreciation 21,085 19,332 1,753 8.31% 7Amortisation – Intangible assets 841 817 24 2.89%Amortisation – Right of use assets - 641 (641) 0.00% 8Borrowing costs 1,031 361 670 64.98% 9
Share of net loss of joint operation accounted for by using the equity method - 143 (143) 0.00%
Fair value adjustments for investment property - 1,615 (1,615) 0.00% 10Net loss /(gain) on disposal of property, infrastructure, plant and equipment 75 2,117 (2,042) (2722.70%) 11Finance costs – Leases - 776 (776) 0.00% 8Other expenses 9,043 5,048 3,995 44.17% 12
Total expenses 156,186 164,994 (8,808) (5.64%)
Surplus for the year 42,886 25,977 (16,909) (39.43%)
Note 1(b) – Performance against budget

89Annual Financial Report
(i) Explanation of material variations
Variance Ref
Item Explanation
1 User fees Footpath permits and Health permits income was refunded as part of the business support program as a result of the unprecedented COVID-19 pandemic $0.56 million. Loss of income also resulted from the closure and restrictions placed on non-essential services including aquatic services income $1.38 million and the early years services income $0.76 million. Parking enforcements were reduced in response to the pandemic, and Council experienced collection issues with Fines Victoria resulting in income lower than budget $1.73 million. Statutory planning permits income was lower than budgeted $0.25 million as well as other non essential community services income loss.
2 Contributions – monetary Open space contributions lower than budget by $2.0 million due to lower than expected levels of development.
3 Other income Other income lower than budget predominantly due to unfavourable Interest income $0.67 million impacted by the decreasing interest rate environment, rental reliefs as part of the COVID-19 Business Support Program.
$0.45 million, rental income lower than expected as a result of the delay in the opening of the newly developed Prahran Square $0.11 million, and cost recovery for Victorian Building Authorities (VBA) cladding project no longer forthcoming as full cost recovery is being rebuked by the VBA $0.13 million. These are partially offset by recovery of valuations work from the State Revenue Office $0.20 million and Fuel Tax Credit and the Goods and Services Tax recovery.
4 Employee costs Contractor costs exceeded budget $0.95 million predominantly due to additional resource requirements in the waste disposal and tipping area in response to new safety initiatives requirements, graffiti maintenance, additional compliance functions and initiatives to improve the engagement and communications services. There are a number of unplanned leaves requiring backfill. Cost also exceeded budget due to termination payments following the COVID-19 pandemic.
5 Materials and services Materials and services cost exceeded budget predominantly due to higher than budget security cost $0.37 million, consulting fees $0.48 million, legal fees $0.53 million, tipping fees $0.28 million, cleaning costs and additional PPE $0.33 million, telecommunication and software support $0.36 million and vehicle servicing requirements $0.26 million. This has been offset by major contract payments savings of $1.0m which includes saving against the parking enforcement contract with DCA and cost re-prioritsation as a result of COVID-19. A further reduction of contract payment costs of $1.16m, arising from the impact of the new accounting standard (AASB16 Leases), this amount is re-allocated to depreciation and lease interest expenses.
6 Bad and doubtful debts Bad and doubtful debts were $4.76 million greater than budget as a result of an increment in the provision for doubtful debts for infringement court income owing to Council. The majority of infringement court income owing to Council is offset by a provision for doubtful debts as there is a low likelihood of this income being paid to Council. The collection of infringement court income is managed by Fines Victoria.
7 Depreciation Depreciation expense is lower than budget as a result of the lower level of capital works completed and capitalised for 2019–20 (please refer to the Statement of Capital Works for more details on this program).
8 Amortisation - Right of use assets / Finance costs - Leases
The new accounting standard for leases (AASB16 Leases ) came into effect 1 July 2020. This was not budgeted and shows an overspend of $1.41 million, offset by a reduction against materials and services (contract payments). The new standard requires Council to bring operating leases on-balance sheet, and has a net impact on surplus of $0.11 million (please refer to Note 5.8 for further details).
9 Borrowing costs Budgeted loan borrowings for the Prahran Square redevelopment project were not required to be drawn down until later in the year than originally budgeted and the actual interest rate was lower than budgeted leading to savings.
10 Fair value adjustments for investment property
This adjustment is unbudgeted and reflects the reduction in the assessed value of Council’s investment properties over the last 12 months (please refer to Note 6.3 for further details).
11 Net loss /(gain) on disposal of property, infrastructure, plant and equipment
Council had an overall net loss on disposal/write-off of assets (proceeds less the net asset value) which represents the following transactions:
» Proceeds received for which there was no adjustment in the asset register $0.03 million » Net loss on the sale of plant and equipment $0.26 million; and » Net loss or Asset write-offs for property and infrastructure assets $0.98 million from building demolitions
and road renewal program $1.48 million. Refer to Notes 4.8 and 6.1 for further details. » The budget estimate reflects the expected net loss from the sale of minor plant and equipment only.
12 Other expenses New operating initiatives of $3.11 million that were budgeted under ‘other expenses’ were allocated to materials and services resulting in a favourable variance.

90 City of Stonnington Annual Report 2019–20
1.2 Capital works
Budget Actual Variance Variance2020 2020 2020 2020
$’000 $’000 $’000 % Ref
Property
Land 10,000 1,030 8,970 89.70% 1
Total land 10,000 1,030 8,970 89.70%
Buildings
21,633
6,334
15,299
70.72%
2
Heritage buildings 11,000 812 10,188 92.62% 3
Total buildings 32,633 7,146 25,487 78.10%
Total property 42,633 8,176 34,457 80.82%
Plant and equipment
Heritage plant and equipment 192 1,587 ( 1,395 ) (726.75%) 4Plant, machinery and equipment 2,350 2,489 (139) (5.91%)Fixtures, fittings and furniture 833 605 228 27.37% 5Computers and telecommunications 575 382 193 33.57% 6Library books 1,055 843 212 20.09% 7
Total plant and equipment 5,005 5,906 (901) (18.01%)
Infrastructure
Roads 5,830 7,845 (2,015) (34.56%) 8Bridges 75 0 75 100.00% 8Footpaths and cycleways 3,091 594 2,497 80.78% 8Drainage 2,781 3,546 (765) (27.51%) 9Recreational, leisure and community facilities 3,692 1,528 2,164 58.61% 10Street trees 920 749 171 18.59% 11Parks, open space and streetscapes 17,750 15,919 1,831 10.32% 12Other infrastructure 1,727 2,290 (563) (32.60%) 13
Total infrastructure 35,866 32,471 3,395 9.47%
Total capital works expenditure 83,503 46,553 36,950 44.25%
Represented by:
New asset expenditure 36,755 18,595 18,159 49.41% 1,2Asset renewal expenditure 27,092 19,502 7,590 28.02% 2,12Asset expansion expenditure 6,390 494 5,896 92.27% 3Asset upgrade expenditure 13,266 7,962 5,304 39.98% 3
Total capital works expenditure 83,503 46,553 36,950 44.25%
Note 1(b) – Performance against budgetCont...

91Annual Financial Report
(i) Explanation of material variations
Variance Ref
Item Explanation
1 Land The opportunity to purchase properties to enhance public realm is dependent on market availability. Council purchased a new property as part of the Open Space Strategy which was funded from the Open Space Reserve, however based on availability did not purchase Open Space in line with budget.
3 Buildings The Percy Treyvaud Masterplan Implementation $13.0 million (new) and Harold Holt Masterplan works $2.1 million (renewal) have been deferred to future financial year as a result of COVID-19 impacts and construction restrictions.
3 Heritage buildings The Prahran Town Hall redevelopment $7.0 million (upgrade/expansion) and Prahran Market upgrade works $1.4 million (upgrade/expansion) have been deferred into the next financial year as a result of COVID-19 impacts and construction restrictions.
4 Heritage plant and equipment
The variance relates to the recognition of costs for the Prahran Square ‘The Pipes’ art installation under the Heritage Art asset category while being originally budgeted under Park and Open Space works.
5 Fixtures, fittings and furniture
The variance is a result of furniture upgrades works placed on hold as a result of COVID-19 impacts and restrictions.
6 Computers and telecommunications
The variance is a result of upgrade/renewal works placed on hold as a result of COVID-19 impacts and restrictions.
7 Library books Some of the expenditure being budgeted under this category was operational in nature and expensed. In addition, the variance is also a result of upgrade/renewal works placed on hold as a result of COVID-19 impacts and restrictions.
8 Roads, bridges, footpaths and cycleways
The variance relates to the recognition of road construction costs for Prahran Square and Chapel Street Precinct Masterplan Implementation project works in this asset category while being originally budgeted under the Park ad Open Space works. In addition, the variance is also a result of upgrade/renewal works being deferred as a result of COVID-19 impacts and restrictions.
9 Drainage Some drainage improvements works that were originally budgeted as part of the roads refurbishment or parks and open space capital works programs or projects were allocated to the drainage capital works program. These include project works for Prahran Square, Lorne Road Refurbishment and Millewa Avenue Refurbishment.
10 Recreational, leisure and community facilities
Some capital works are now expected to be completed in the next financial year as a result of COVID-19 impacts and restrictions. The delayed project includes the Tennis Facility Review and Redevelopment Strategy Implementation.
11 Street trees The annual tree planting and tree replacement program has been delayed as a result of COVID-19 impacts and restrictions.
12 Parks, open space and streetscapes
The majority of expenditure $11.5 million relates to the Prahran Square development which is now complete. The variance mainly relates to project works being originally budgeted in this asset category being capitalised elsewhere (see above comment) and as a result of project works being deferred as a result of COVID-19 impacts and restrictions, including Chapel Street Precinct Masterplan Implementation $1.4 million (renewal).
13 Other infrastructure The variance relates to the recognition of road extra construction costs for various project works in this asset category while being originally budgeted under the Park ad Open Space works or other asset categories. These projects include Chapel Street Precinct Masterplan Implementation and Prahran Square.
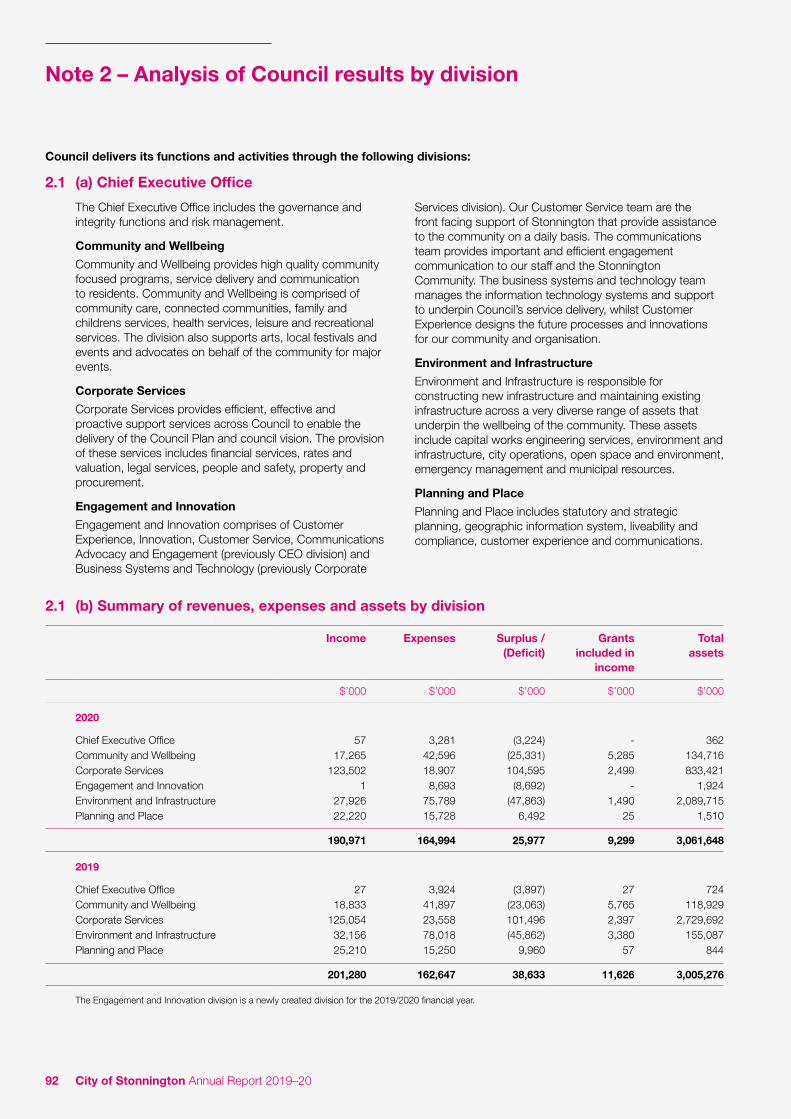
92 City of Stonnington Annual Report 2019–20
Council delivers its functions and activities through the following divisions:
2.1 (a) Chief Executive Office
The Chief Executive Office includes the governance and integrity functions and risk management.
Community and Wellbeing
Community and Wellbeing provides high quality community focused programs, service delivery and communication to residents. Community and Wellbeing is comprised of community care, connected communities, family and childrens services, health services, leisure and recreational services. The division also supports arts, local festivals and events and advocates on behalf of the community for major events.
Corporate Services
Corporate Services provides efficient, effective and proactive support services across Council to enable the delivery of the Council Plan and council vision. The provision of these services includes financial services, rates and valuation, legal services, people and safety, property and procurement.
Engagement and Innovation
Engagement and Innovation comprises of Customer Experience, Innovation, Customer Service, Communications Advocacy and Engagement (previously CEO division) and Business Systems and Technology (previously Corporate
Services division). Our Customer Service team are the front facing support of Stonnington that provide assistance to the community on a daily basis. The communications team provides important and efficient engagement communication to our staff and the Stonnington Community. The business systems and technology team manages the information technology systems and support to underpin Council’s service delivery, whilst Customer Experience designs the future processes and innovations for our community and organisation.
Environment and Infrastructure
Environment and Infrastructure is responsible for constructing new infrastructure and maintaining existing infrastructure across a very diverse range of assets that underpin the wellbeing of the community. These assets include capital works engineering services, environment and infrastructure, city operations, open space and environment, emergency management and municipal resources.
Planning and Place
Planning and Place includes statutory and strategic planning, geographic information system, liveability and compliance, customer experience and communications.
2.1 (b) Summary of revenues, expenses and assets by division
Income Expenses Surplus / (Deficit)
Grants included in
income
Total assets
$’000 $’000 $’000 $’000 $’000
2020
Chief Executive Office 57 3,281 (3,224) - 362Community and Wellbeing 17,265 42,596 (25,331) 5,285 134,716Corporate Services 123,502 18,907 104,595 2,499 833,421Engagement and Innovation 1 8,693 (8,692) - 1,924Environment and Infrastructure 27,926 75,789 (47,863) 1,490 2,089,715Planning and Place 22,220 15,728 6,492 25 1,510
190,971 164,994 25,977 9,299 3,061,648
2019
Chief Executive Office 27 3,924 (3,897) 27 724Community and Wellbeing 18,833 41,897 (23,063) 5,765 118,929Corporate Services 125,054 23,558 101,496 2,397 2,729,692Environment and Infrastructure 32,156 78,018 (45,862) 3,380 155,087Planning and Place 25,210 15,250 9,960 57 844
201,280 162,647 38,633 11,626 3,005,276
The Engagement and Innovation division is a newly created division for the 2019/2020 financial year.
Note 2 – Analysis of Council results by division
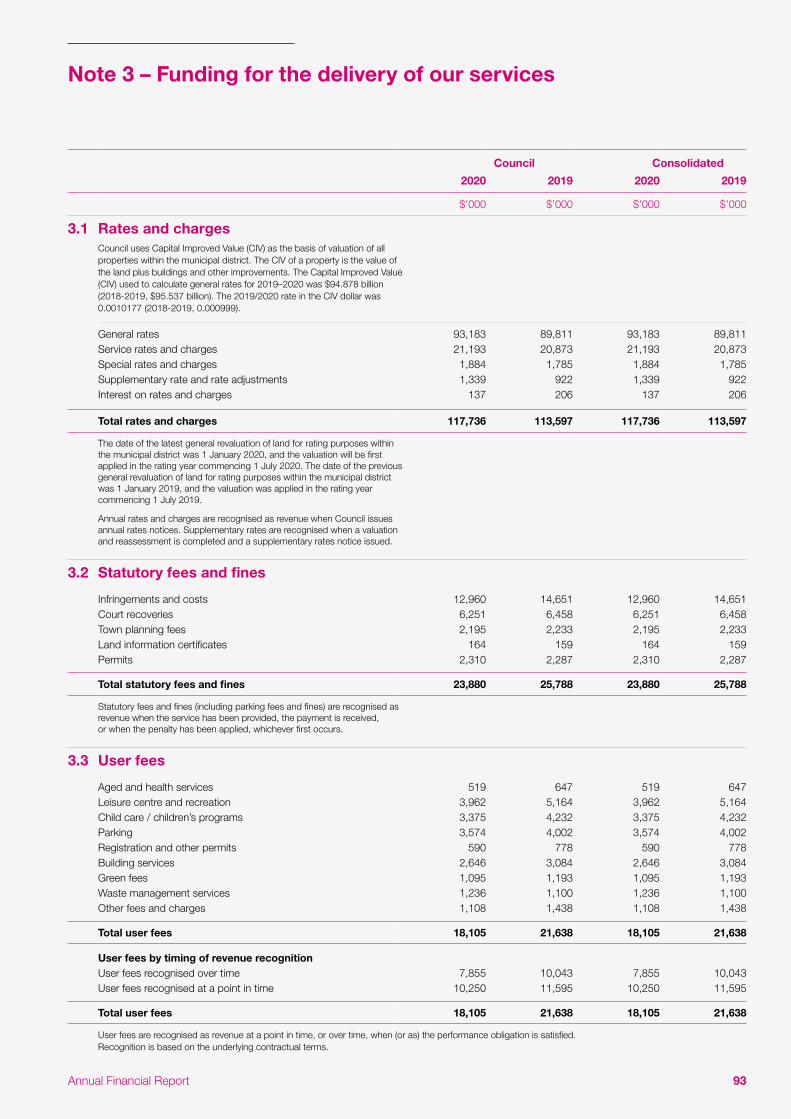
93Annual Financial Report
Council Consolidated
2020 2019 2020 2019
$’000 $’000 $’000 $’000
3.1 Rates and chargesCouncil uses Capital Improved Value (CIV) as the basis of valuation of all properties within the municipal district. The CIV of a property is the value of the land plus buildings and other improvements. The Capital Improved Value (CIV) used to calculate general rates for 2019–2020 was $94.878 billion (2018-2019, $95.537 billion). The 2019/2020 rate in the CIV dollar was 0.0010177 (2018-2019, 0.000999).
General rates 93,183 89,811 93,183 89,811Service rates and charges 21,193 20,873 21,193 20,873Special rates and charges 1,884 1,785 1,884 1,785Supplementary rate and rate adjustments 1,339 922 1,339 922Interest on rates and charges 137 206 137 206
Total rates and charges 117,736 113,597 117,736 113,597
The date of the latest general revaluation of land for rating purposes within the municipal district was 1 January 2020, and the valuation will be first applied in the rating year commencing 1 July 2020. The date of the previous general revaluation of land for rating purposes within the municipal district was 1 January 2019, and the valuation was applied in the rating year commencing 1 July 2019.
Annual rates and charges are recognised as revenue when Council issues annual rates notices. Supplementary rates are recognised when a valuation and reassessment is completed and a supplementary rates notice issued.
3.2 Statutory fees and fines
Infringements and costs 12,960 14,651 12,960 14,651Court recoveries 6,251 6,458 6,251 6,458Town planning fees 2,195 2,233 2,195 2,233Land information certificates 164 159 164 159Permits 2,310 2,287 2,310 2,287
Total statutory fees and fines 23,880 25,788 23,880 25,788
Statutory fees and fines (including parking fees and fines) are recognised as revenue when the service has been provided, the payment is received, or when the penalty has been applied, whichever first occurs.
3.3 User fees
Aged and health services 519 647 519 647Leisure centre and recreation 3,962 5,164 3,962 5,164Child care / children’s programs 3,375 4,232 3,375 4,232Parking 3,574 4,002 3,574 4,002Registration and other permits 590 778 590 778Building services 2,646 3,084 2,646 3,084Green fees 1,095 1,193 1,095 1,193Waste management services 1,236 1,100 1,236 1,100Other fees and charges 1,108 1,438 1,108 1,438
Total user fees 18,105 21,638 18,105 21,638
User fees by timing of revenue recognitionUser fees recognised over time 7,855 10,043 7,855 10,043User fees recognised at a point in time 10,250 11,595 10,250 11,595
Total user fees 18,105 21,638 18,105 21,638
User fees are recognised as revenue at a point in time, or over time, when (or as) the performance obligation is satisfied. Recognition is based on the underlying contractual terms.
Note 3 – Funding for the delivery of our services
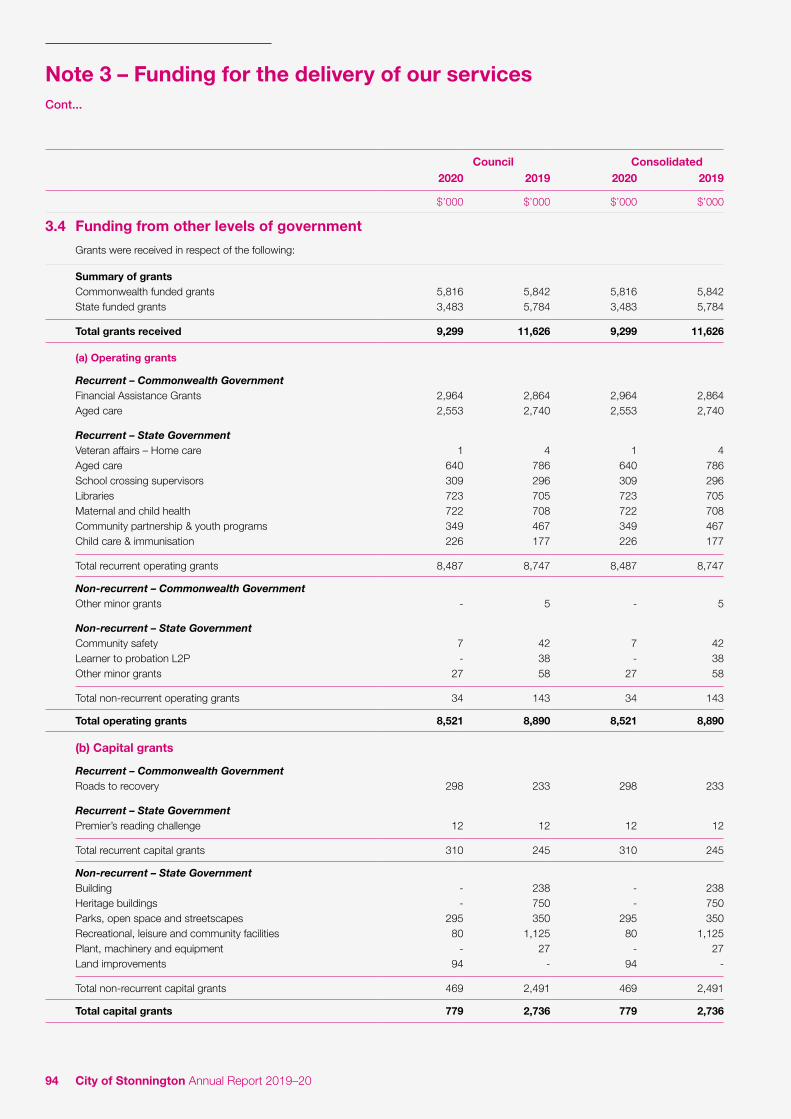
94 City of Stonnington Annual Report 2019–20
Council Consolidated2020 2019 2020 2019
$’000 $’000 $’000 $’000
3.4 Funding from other levels of government
Grants were received in respect of the following:
Summary of grantsCommonwealth funded grants 5,816 5,842 5,816 5,842State funded grants 3,483 5,784 3,483 5,784
Total grants received 9,299 11,626 9,299 11,626
(a) Operating grants
Recurrent – Commonwealth GovernmentFinancial Assistance Grants 2,964 2,864 2,964 2,864Aged care 2,553 2,740 2,553 2,740
Recurrent – State GovernmentVeteran affairs – Home care 1 4 1 4Aged care 640 786 640 786School crossing supervisors 309 296 309 296Libraries 723 705 723 705Maternal and child health 722 708 722 708Community partnership & youth programs 349 467 349 467Child care & immunisation 226 177 226 177
Total recurrent operating grants 8,487 8,747 8,487 8,747
Non-recurrent – Commonwealth GovernmentOther minor grants - 5 - 5
Non-recurrent – State GovernmentCommunity safety 7 42 7 42Learner to probation L2P - 38 - 38Other minor grants 27 58 27 58
Total non-recurrent operating grants 34 143 34 143
Total operating grants 8,521 8,890 8,521 8,890
(b) Capital grants
Recurrent – Commonwealth GovernmentRoads to recovery 298 233 298 233
Recurrent – State GovernmentPremier’s reading challenge 12 12 12 12
Total recurrent capital grants 310 245 310 245
Non-recurrent – State GovernmentBuilding - 238 - 238Heritage buildings - 750 - 750Parks, open space and streetscapes 295 350 295 350Recreational, leisure and community facilities 80 1,125 80 1,125Plant, machinery and equipment - 27 - 27Land improvements 94 - 94 -
Total non-recurrent capital grants 469 2,491 469 2,491
Total capital grants 779 2,736 779 2,736
Note 3 – Funding for the delivery of our servicesCont...

95Annual Financial Report
Council Consolidated2020 2019 2020 2019
$’000 $’000 $’000 $’000
(c) Unspent grants received on condition that they be spent in a specific manner
OperatingBalance at start of year 1,415 786 1,415 786Received during the financial year and remained unspent at balance date 787 1,247 787 1,247Received in prior years and spent during the financial year (1,170) (618) (1,170) (618)
Balance at year end 1,032 1,415 1,032 1,415
CapitalBalance at start of year 378 - 378 -Received during the financial year and remained unspent at balance date 757 378 757 378Received in prior years and spent during the financial year - - - -
Balance at year end 1,135 378 1,135 378
Grant income is recognised at the point in time when the council satisfies its performance obligations as specified in the underlying agreement.
3.5 Contributions
Monetary 13,144 16,501 13,144 16,501Non-monetary - 14 - 14
Total contributions 13,144 16,515 13,144 16,515
Open space 12,747 16,278 12,747 16,279Development contributions 74 - 74 -Capital works contributions 275 82 275 82Operating contributions 48 141 48 141
Total monetary contributions 13,144 16,501 13,144 16,501
Contributions of non-monetary assets were received in relation to the following asset classes :
Heritage plant and equipment - 14 - 14
Total non-monetary contributions - 14 - 14
Monetary and non monetary contributions are recognised as revenue when Council obtains control over the contributed asset.
3.6 Other income
Interest 1,641 2,738 1,647 2,749Investment property rental 486 633 486 633Council works cost recovery 981 1,392 981 1,392Fire services property levy administration 84 82 84 82State Revenue Office – valuation cost recovery 347 1,207 347 1,207Transport towing 74 132 74 132Other rent 4,855 5,652 8,519 9,047Other 338 279 393 269
Total other income 8,806 12,115 12,531 15,511
Interest is recognised as it is earned.
Other income is measured at the fair value of the consideration received or receivable and is recognised when Council gains control over the right to receive the income.
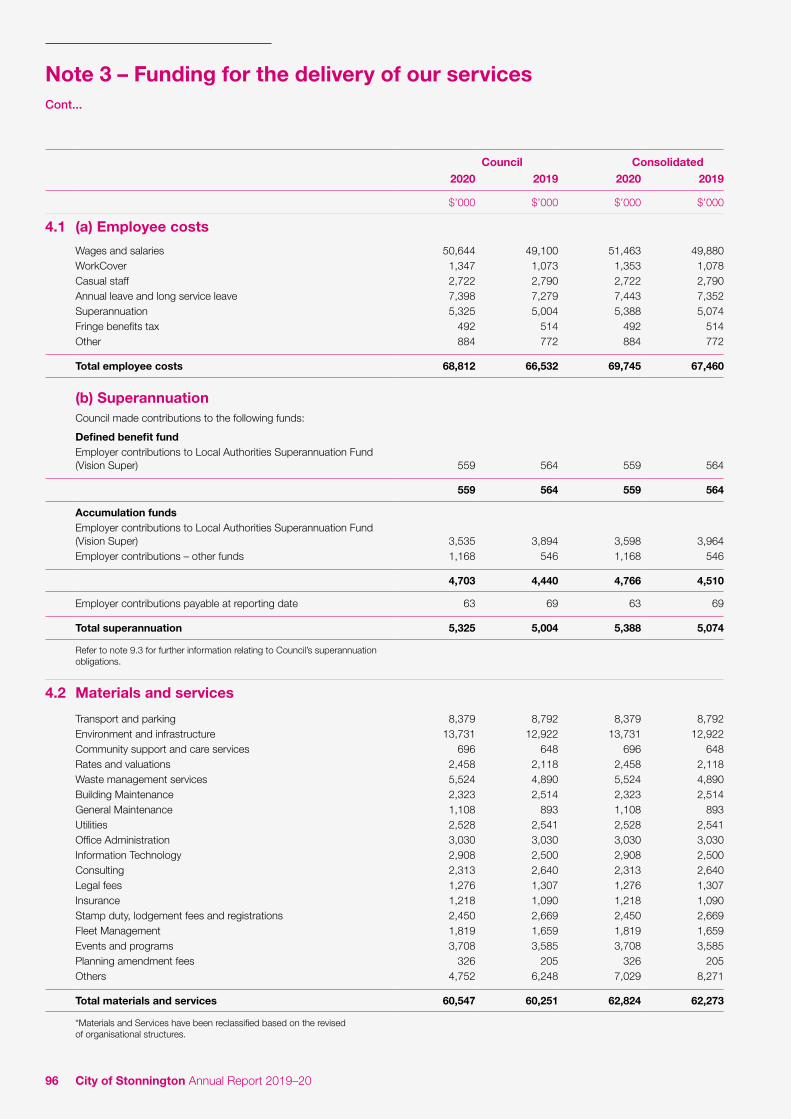
96 City of Stonnington Annual Report 2019–20
Council Consolidated2020 2019 2020 2019
$’000 $’000 $’000 $’000
4.1 (a) Employee costs
Wages and salaries 50,644 49,100 51,463 49,880WorkCover 1,347 1,073 1,353 1,078Casual staff 2,722 2,790 2,722 2,790Annual leave and long service leave 7,398 7,279 7,443 7,352Superannuation 5,325 5,004 5,388 5,074Fringe benefits tax 492 514 492 514Other 884 772 884 772
Total employee costs 68,812 66,532 69,745 67,460
(b) SuperannuationCouncil made contributions to the following funds:
Defined benefit fundEmployer contributions to Local Authorities Superannuation Fund (Vision Super) 559 564 559 564
559 564 559 564
Accumulation fundsEmployer contributions to Local Authorities Superannuation Fund (Vision Super) 3,535 3,894 3,598 3,964Employer contributions – other funds 1,168 546 1,168 546
4,703 4,440 4,766 4,510
Employer contributions payable at reporting date 63 69 63 69
Total superannuation 5,325 5,004 5,388 5,074
Refer to note 9.3 for further information relating to Council’s superannuation obligations.
4.2 Materials and services
Transport and parking 8,379 8,792 8,379 8,792Environment and infrastructure 13,731 12,922 13,731 12,922Community support and care services 696 648 696 648Rates and valuations 2,458 2,118 2,458 2,118Waste management services 5,524 4,890 5,524 4,890Building Maintenance 2,323 2,514 2,323 2,514General Maintenance 1,108 893 1,108 893Utilities 2,528 2,541 2,528 2,541Office Administration 3,030 3,030 3,030 3,030Information Technology 2,908 2,500 2,908 2,500Consulting 2,313 2,640 2,313 2,640Legal fees 1,276 1,307 1,276 1,307Insurance 1,218 1,090 1,218 1,090Stamp duty, lodgement fees and registrations 2,450 2,669 2,450 2,669Fleet Management 1,819 1,659 1,819 1,659Events and programs 3,708 3,585 3,708 3,585Planning amendment fees 326 205 326 205Others 4,752 6,248 7,029 8,271
Total materials and services 60,547 60,251 62,824 62,273
*Materials and Services have been reclassified based on the revised of organisational structures.
Note 3 – Funding for the delivery of our servicesCont...
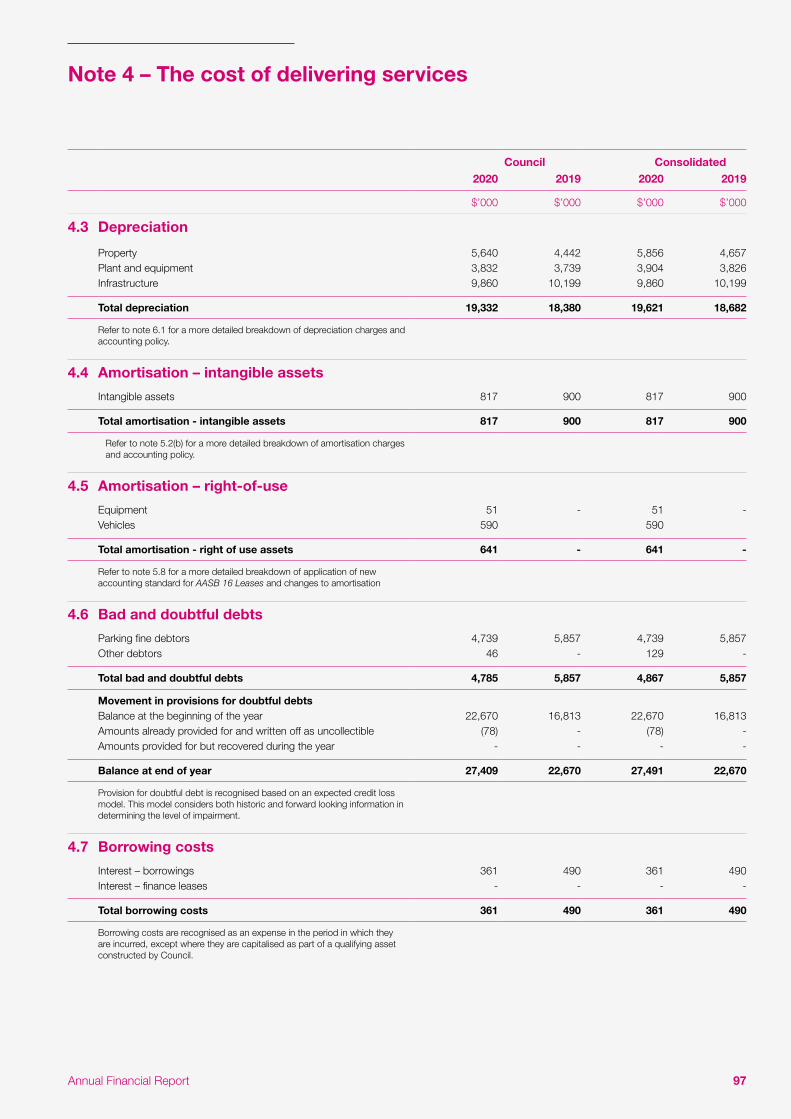
97Annual Financial Report
Council Consolidated2020 2019 2020 2019
$’000 $’000 $’000 $’000
4.3 Depreciation
Property 5,640 4,442 5,856 4,657Plant and equipment 3,832 3,739 3,904 3,826Infrastructure 9,860 10,199 9,860 10,199
Total depreciation 19,332 18,380 19,621 18,682
Refer to note 6.1 for a more detailed breakdown of depreciation charges and accounting policy.
4.4 Amortisation – intangible assets
Intangible assets 817 900 817 900
Total amortisation - intangible assets 817 900 817 900
Refer to note 5.2(b) for a more detailed breakdown of amortisation charges and accounting policy.
4.5 Amortisation – right-of-use
Equipment 51 - 51 -Vehicles 590 590
Total amortisation - right of use assets 641 - 641 -
Refer to note 5.8 for a more detailed breakdown of application of new accounting standard for AASB 16 Leases and changes to amortisation
4.6 Bad and doubtful debts
Parking fine debtors 4,739 5,857 4,739 5,857Other debtors 46 - 129 -
Total bad and doubtful debts 4,785 5,857 4,867 5,857
Movement in provisions for doubtful debtsBalance at the beginning of the year 22,670 16,813 22,670 16,813Amounts already provided for and written off as uncollectible (78) - (78) -Amounts provided for but recovered during the year - - - -
Balance at end of year 27,409 22,670 27,491 22,670
Provision for doubtful debt is recognised based on an expected credit loss model. This model considers both historic and forward looking information in determining the level of impairment.
4.7 Borrowing costs
Interest – borrowings 361 490 361 490Interest – finance leases - - - -
Total borrowing costs 361 490 361 490
Borrowing costs are recognised as an expense in the period in which they are incurred, except where they are capitalised as part of a qualifying asset constructed by Council.
Note 4 – The cost of delivering services

98 City of Stonnington Annual Report 2019–20
Council Consolidated2020 2019 2020 2019
$’000 $’000 $’000 $’000
4.8 Net (gain) / loss on disposal of property, infrastructure, plant and equipment
Net (gain) / loss on sale of property, infrastructure, plant and equipmentProceeds from sales (393) (642) (393) (642)Written down value of assets disposed 260 665 268 694
Net loss on write off property, infrastructure, plant and equipmentInfrastructure 2,250 4,328 2,250 4,328Plant and equipment - - - -
2,250 4,328 2,250 4,328
Total net loss on disposal of property, infrastructure, plant and equipment
2,117 4,351 2,125 4,380
4.9 Finance costs – leases
Interest – Lease liabilities 776 - 776 -
Total finance costs 776 - 776 -
Refer to note 5.8 for a more detailed breakdown of application of new accounting standard for AASB 16 Leases and changes to interest
4.10 Other expenses
Auditors’ remuneration – VAGO – audit of the financial statement, performance statement and grant acquittals 73 73 89 89Auditors’ remuneration – Internal 200 129 200 129Councillors’ allowances 382 375 382 375Operating lease rentals 337 687 337 687Community grants 3,192 3,414 3,192 3,414Others 864 524 864 524
Total other expenses 5,048 5,202 5,064 5,218
Note 4 – The cost of delivering servicesCont...
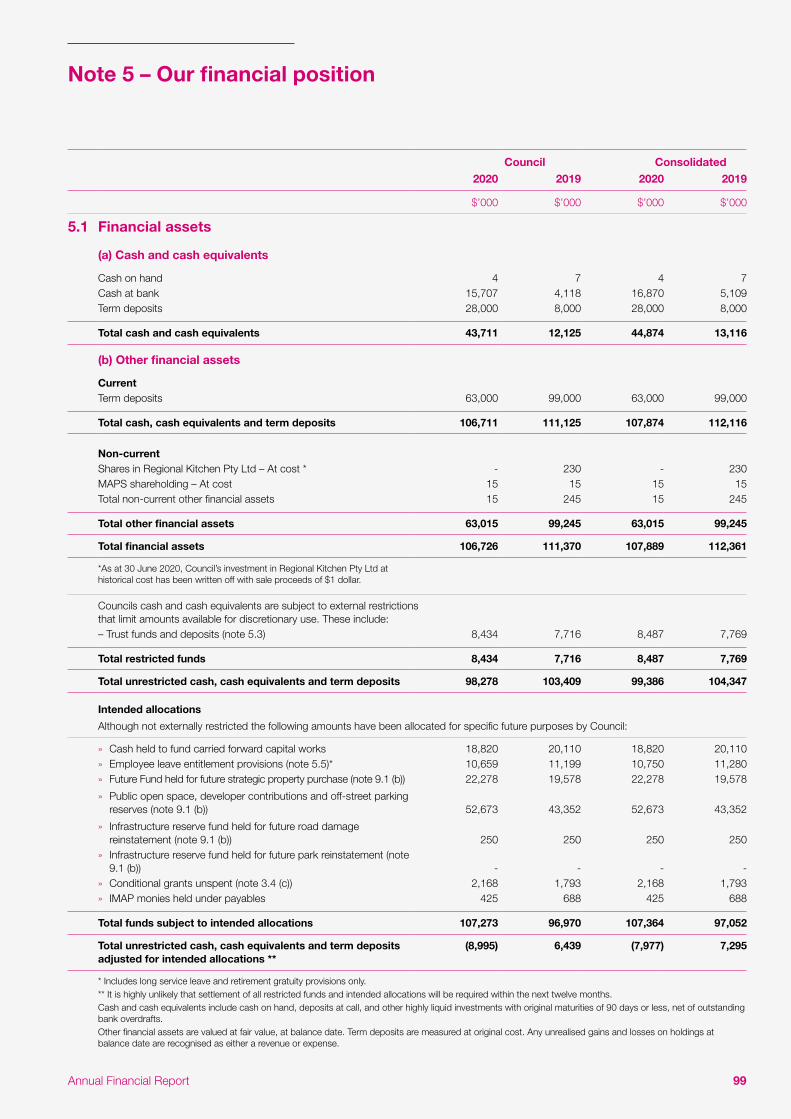
99Annual Financial Report
Council Consolidated2020 2019 2020 2019
$’000 $’000 $’000 $’000
5.1 Financial assets
(a) Cash and cash equivalents
Cash on hand 4 7 4 7Cash at bank 15,707 4,118 16,870 5,109Term deposits 28,000 8,000 28,000 8,000
Total cash and cash equivalents 43,711 12,125 44,874 13,116
(b) Other financial assets
CurrentTerm deposits 63,000 99,000 63,000 99,000
Total cash, cash equivalents and term deposits 106,711 111,125 107,874 112,116
Non-currentShares in Regional Kitchen Pty Ltd – At cost * - 230 - 230MAPS shareholding – At cost 15 15 15 15Total non-current other financial assets 15 245 15 245
Total other financial assets 63,015 99,245 63,015 99,245
Total financial assets 106,726 111,370 107,889 112,361
*As at 30 June 2020, Council’s investment in Regional Kitchen Pty Ltd at historical cost has been written off with sale proceeds of $1 dollar.
Councils cash and cash equivalents are subject to external restrictions that limit amounts available for discretionary use. These include:– Trust funds and deposits (note 5.3) 8,434 7,716 8,487 7,769
Total restricted funds 8,434 7,716 8,487 7,769
Total unrestricted cash, cash equivalents and term deposits 98,278 103,409 99,386 104,347
Intended allocations
Although not externally restricted the following amounts have been allocated for specific future purposes by Council:
» Cash held to fund carried forward capital works 18,820 20,110 18,820 20,110 » Employee leave entitlement provisions (note 5.5)* 10,659 11,199 10,750 11,280 » Future Fund held for future strategic property purchase (note 9.1 (b)) 22,278 19,578 22,278 19,578
» Public open space, developer contributions and off-street parking reserves (note 9.1 (b)) 52,673 43,352 52,673 43,352
» Infrastructure reserve fund held for future road damage reinstatement (note 9.1 (b)) 250 250 250 250
» Infrastructure reserve fund held for future park reinstatement (note 9.1 (b)) - - - -
» Conditional grants unspent (note 3.4 (c)) 2,168 1,793 2,168 1,793 » IMAP monies held under payables 425 688 425 688
Total funds subject to intended allocations 107,273 96,970 107,364 97,052
Total unrestricted cash, cash equivalents and term deposits adjusted for intended allocations **
(8,995) 6,439 (7,977) 7,295
* Includes long service leave and retirement gratuity provisions only.** It is highly unlikely that settlement of all restricted funds and intended allocations will be required within the next twelve months.Cash and cash equivalents include cash on hand, deposits at call, and other highly liquid investments with original maturities of 90 days or less, net of outstanding bank overdrafts.Other financial assets are valued at fair value, at balance date. Term deposits are measured at original cost. Any unrealised gains and losses on holdings at balance date are recognised as either a revenue or expense.
Note 5 – Our financial position
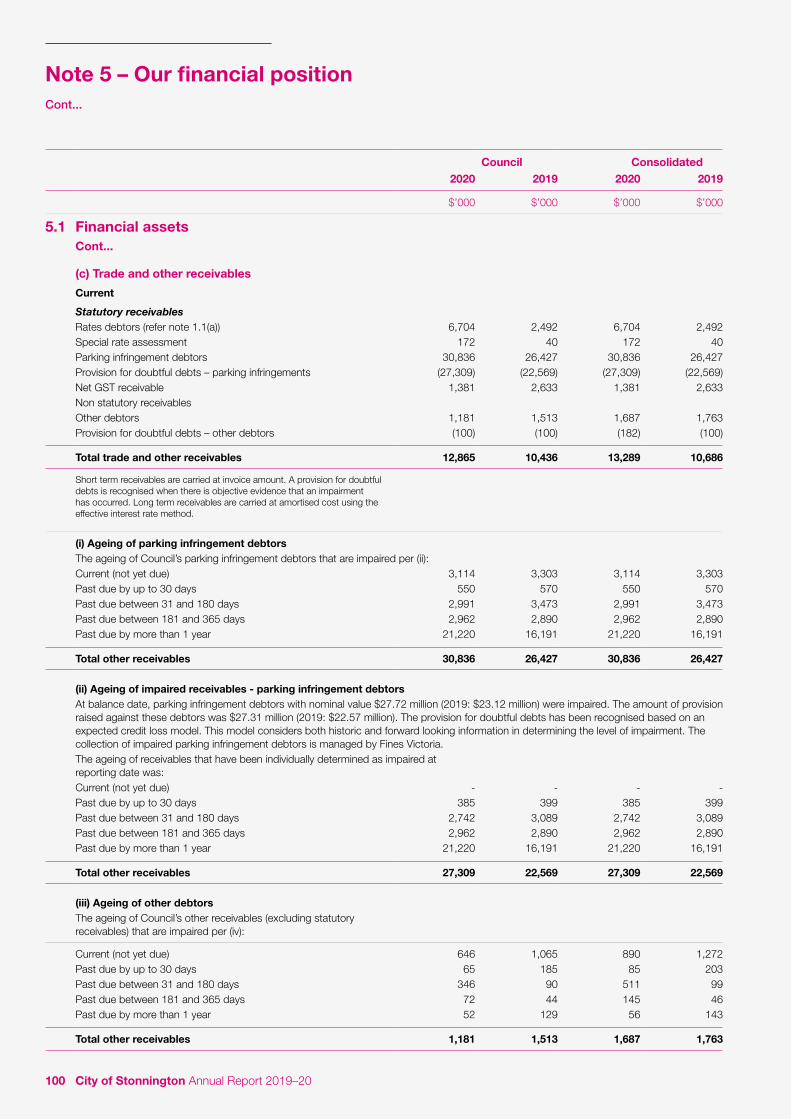
100 City of Stonnington Annual Report 2019–20
Council Consolidated2020 2019 2020 2019
$’000 $’000 $’000 $’000
5.1 Financial assets Cont...
(c) Trade and other receivables
Current
Statutory receivablesRates debtors (refer note 1.1(a)) 6,704 2,492 6,704 2,492Special rate assessment 172 40 172 40Parking infringement debtors 30,836 26,427 30,836 26,427Provision for doubtful debts – parking infringements (27,309) (22,569) (27,309) (22,569)Net GST receivable 1,381 2,633 1,381 2,633Non statutory receivablesOther debtors 1,181 1,513 1,687 1,763Provision for doubtful debts – other debtors (100) (100) (182) (100)
Total trade and other receivables 12,865 10,436 13,289 10,686
Short term receivables are carried at invoice amount. A provision for doubtful debts is recognised when there is objective evidence that an impairment has occurred. Long term receivables are carried at amortised cost using the effective interest rate method.
(i) Ageing of parking infringement debtorsThe ageing of Council’s parking infringement debtors that are impaired per (ii):Current (not yet due) 3,114 3,303 3,114 3,303Past due by up to 30 days 550 570 550 570Past due between 31 and 180 days 2,991 3,473 2,991 3,473Past due between 181 and 365 days 2,962 2,890 2,962 2,890Past due by more than 1 year 21,220 16,191 21,220 16,191
Total other receivables 30,836 26,427 30,836 26,427
(ii) Ageing of impaired receivables - parking infringement debtorsAt balance date, parking infringement debtors with nominal value $27.72 million (2019: $23.12 million) were impaired. The amount of provision raised against these debtors was $27.31 million (2019: $22.57 million). The provision for doubtful debts has been recognised based on an expected credit loss model. This model considers both historic and forward looking information in determining the level of impairment. The collection of impaired parking infringement debtors is managed by Fines Victoria.The ageing of receivables that have been individually determined as impaired at reporting date was:Current (not yet due) - - - -Past due by up to 30 days 385 399 385 399Past due between 31 and 180 days 2,742 3,089 2,742 3,089Past due between 181 and 365 days 2,962 2,890 2,962 2,890Past due by more than 1 year 21,220 16,191 21,220 16,191
Total other receivables 27,309 22,569 27,309 22,569
(iii) Ageing of other debtorsThe ageing of Council’s other receivables (excluding statutory receivables) that are impaired per (iv):
Current (not yet due) 646 1,065 890 1,272Past due by up to 30 days 65 185 85 203Past due between 31 and 180 days 346 90 511 99Past due between 181 and 365 days 72 44 145 46Past due by more than 1 year 52 129 56 143
Total other receivables 1,181 1,513 1,687 1,763
Note 5 – Our financial positionCont...

101Annual Financial Report
Council Consolidated2020 2019 2020 2019
$’000 $’000 $’000 $’000
(iv) Ageing of individually impaired receivables – other debtors At balance date, consolidated receivables with nominal value $0.18 million (2019; nil) were impaired. The amount of provision raised against these debtors was $0.18 million (2019; nil). They have been individually impaired as a result of their doubtful collection.The ageing of receivables that have been individually determined as impaired at reporting date was:
Current (not yet due) - - 12 -Past due by up to 30 days - - - -Past due between 31 and 180 days 87 - 91 -Past due between 181 and 365 days 13 - 75 -Past due by more than 1 year - - 4 -
Total other receivables 100 - 182 -
5.2 Non-financial assets
(a) Other assets – current
Prepayments 270 2,186 344 2,235Accrued income 398 915 735 915Other 233 552 92 548
Total other assets 901 3,653 1,171 3,699
(b) Intangible assets
Gross Carrying AmountBalance at 1 July 2019 12,476 12,476Work in progress 78 78Other additions 291 291
Balance at 30 June 2020 12,845 12,845
Accumulated amortisation and impairmentBalance at 1 July 2019 (10,743) (10,743)Amortisation expense (816) (816)
Balance at 30 June 2020 (11,559) (11,559)
Net book value at 30 June 2019 1,733 1,733
Net book value at 30 June 2020 1,286 1,286
Intangible assets relate to software. Intangible assets with finite lives are amortised as an expense on a systematic basis over the asset’s useful life. Amortisation is generally calculated on a straight line basis, at a rate that allocates the asset value, less any estimated residual value over its estimated useful life. Estimates of the remaining useful lives and amortisation method are reviewed at least annually, and adjustments made where appropriate.

102 City of Stonnington Annual Report 2019–20
Council Consolidated2020 2019 2020 2019
$’000 $’000 $’000 $’000
5.3 Payables
(a) Trade and other payables
Trade payables (refer note 1.1(a)) 7,580 15,385 7,878 15,699Accrued expenses 5,310 5,177 5,310 5,177Other 1,091 1,345 1,129 1,404
Total trade and other payables 13,981 21,907 14,317 22,280
(b) Trust funds and deposits
Refundable deposits 5,511 5,386 5,564 5,439Refundable contract deposits 846 894 846 894Fire Service Property Levy 1,200 780 1,200 780Retention amounts 877 656 877 656
Total trust funds and deposits 8,434 7,716 8,487 7,769
(c) Unearned income
Grants received in advance – operating 1,135 - 1,135 -Grants received in advance – capital 788 - 788 -Other 29 - 29 -
Total unearned income 1,952 - 1,952 -
Amounts received as deposits and retention amounts controlled by Council are recognised as trust funds until they are returned, transferred in accordance with the purpose of the receipt, or forfeited. Trust funds that are forfeited, resulting in council gaining control of the funds, are to be recognised as revenue at the time of forfeit.
Purpose and nature of items
Refundable deposits – Deposits are taken by Council as a form of surety in a number of circumstances, including in relation to building works, tender deposits, contract deposits and the use of civic facilities.
Fire Services Property Levy – Council is the collection agent for fire services property levy on behalf of the State Government. Council remits amounts received on a quarterly basis. Amounts disclosed here will be remitted to the State Government in line with that process.
Retention Amounts – Council has a contractual right to retain certain amounts until a contractor has met certain requirements or a related warrant or defect period has elapsed. Subject to satisfactory completion of the contractual obligations, or the elapsing of time, these amounts will be paid to the relevant contractor in line with Council’s contractual obligations.
Council Consolidated2020 2019 2020 2019
$’000 $’000 $’000 $’000
5.4 Interest-bearing liabilities
Current
Borrowings – secured 3,500 3,500 3,500 3,500
3,500 3,500 3,500 3,500
Non-currentBorrowings – secured 19,000 22,500 19,000 22,500
19,000 22,500 19,000 22,500
Total 22,500 26,000 22,500 26,000
Note 5 – Our financial positionCont...

103Annual Financial Report
Council Consolidated2020 2019 2020 2019
$’000 $’000 $’000 $’000
Borrowings are secured by rates income of Council.
a) The maturity profile for Council’s borrowings is:
Not later than one year 3,500 3,500 3,500 3,500Later than one year and not later than five years 10,000 12,500 10,000 12,500Later than five years 9,000 10,000 9,000 10,000
22,500 26,000 22,500 26,000 Borrowings are initially measured at fair value, being the cost of the interest bearing liabilities, net of transaction costs. The measurement basis subsequent to initial recognition depends on whether the Council has categorised its interest-bearing liabilities as either financial liabilities designated at fair value through the profit and loss, or financial liabilities at amortised cost. Any difference between the initial recognised amount and the redemption value is recognised in net result over the period of the borrowing using the effective interest method.
The classification depends on the nature and purpose of the interest bearing liabilities. The Council determines the classification of its interest bearing liabilities at initial recognition.
Employee Provisions
Insurance Excess Provision
Total
$’000 $’000 $’000
5.5 Provisions
2020 CouncilBalance at beginning of the financial year 16,740 115 16,855Additional provisions 5,967 - 5,967Amounts used (5,360) (115) (5,475)
Change in the discounted amount arising because of time and the effect of any change in the discount rate (63) - (63)
Balance at the end of the financial year 17,284 - 17,284
2020 ConsolidatedBalance at beginning of the financial year 16,860 115 16,975Additional provisions 6,037 - 6,037Amounts used (5,386) (115) (5,501)
Change in the discounted amount arising because of time and the effect of any change in the discount rate (63) - (63)
Balance at the end of the financial year 17,448 - 17,448
2019 CouncilBalance at beginning of the financial year 16,178 200 16,378Additional provisions 5,946 - 5,946Amounts used (5,314) (86) (5,399)
Change in the discounted amount arising because of time and the effect of any change in the discount rate (71) - (71)
Balance at the end of the financial year 16,740 115 16,855
2019 ConsolidatedBalance at beginning of the financial year 16,313 200 16,513Additional provisions 6,020 - 6,020Amounts used (5,402) (85) (5,487)
Change in the discounted amount arising because of time and the effect of any change in the discount rate (71) - (71)
Balance at the end of the financial year 16,860 115 16,975

104 City of Stonnington Annual Report 2019–20
Council Consolidated2020 2019 2020 2019
$’000 $’000 $’000 $’000
5.5 Provisions Cont...
(a) Employee provisions
Current provisions expected to be wholly settled within 12 monthsAnnual leave 2,859 2,506 2,912 2,536Long service leave 516 465 516 465Retirement gratuity 99 - 99 -Time in lieu 118 99 118 99Accrued day off 597 445 597 445
4,189 3,515 4,242 3,545
Current provisions expected to be wholly settled after 12 months
Annual leave 2,952 2,492 2,973 2,501Long service leave 8,082 8,842 8,169 8,921
11,034 11,334 11,142 11,423
Total current employee provisions 15,223 14,849 15,384 14,968
Non-currentLong service leave 2,016 1,741 2,019 1,743Retirement gratuity 45 150 45 150
Total non-current employee provisions 2,061 1,891 2,064 1,893
Aggregate carrying amount of employee provisions:Current 15,223 14,849 15,384 14,968Non-current 2,061 1,891 2,064 1,893
Total aggregate carrying amount of employee provisions 17,284 16,740 17,448 16,861
The calculation of employee costs and benefits includes all relevant on-costs and are calculated as follows at reporting date.
Wages and salaries and annual leave Liabilities for wages and salaries, including non-monetary benefits and annual leave expected to be wholly settled within 12 months of the reporting date are recognised in the provision for employee benefits in respect of employee services up to the reporting date, classified as current liabilities and measured at their nominal values.
Liabilities that are not expected to be wholly settled within 12 months of the reporting date are recognised in the provision for employee benefits as current liabilities, measured at the present value of the amounts expected to be paid when the liabilities are settled using the remuneration rate expected to apply at the time of settlement.
Long service leave Liability for long service leave (LSL) is recognised in the provision for employee benefits. LSL is measured at present value. Unconditional LSL is disclosed as a current liability. Conditional LSL that has been accrued, where an employee is yet to reach a qualifying term of employment, is disclosed as a non-current liability.
Retirement gratuity Liability for retirement gratuity is recognised in the provision for employee benefits and accounts as post - employment benefits. Retirement gratuity is measured at present value and disclosed as a non-current liability.
The following assumptions were adopted in measuring the present value of long service leave and retirement gratuity:
Weighted average increase in employee costs 2.25% 2.25% 2.25% 2.25%Weighted average discount rates 0.26% 1.03% 0.26% 1.03%Weighted average settlement period 12 months 12 months 12 months 12 monthsWeighted average index rate 1.34% 2.59% 1.34% 2.59%
Note 5 – Our financial positionCont...

105Annual Financial Report
Council Consolidated2020 2019 2020 2019
$’000 $’000 $’000 $’000
5.6 Financing arrangementsCouncil has the following funding arrangements in place as at 30 June 2020.
Bank overdraft 250 250 250 250Credit card facilities 65 65 65 65Finance lease 4,617 3,913 4,617 3,913Borrowings 22,500 26,000 22,500 26,000
Total facilities 27,432 30,228 27,432 30,228
Used facilities (26,103) (29,017) (26,103) (29,017)
Unused facilities 1,329 1,211 1,329 1,211
(b) Insurance excess provisions
Current - 115 - 115

106 City of Stonnington Annual Report 2019–20
5.7 Commitments
Council has entered into the following commitments. Commitments are not recognised in the Balance Sheet. Commitments are disclosed at their nominal value and presented inclusive of the GST payable.
Prahran Market Pty Ltd has no material commitments.
Not later than 1 year
Later than 1 year and
not later than 2 years
Later than 2 years and
not later than 5 years
Later than 5 years
Total
$’000 $’000 $’000 $’000 $’000
2020
OperatingMunicipal turf maintenance and mowing services 1,847 316 - - 2,163
Playgorund landscape, recreational and sports facilities upgrade 507 211 - - 718Management of car parks 1,118 172 - - 1,290Hard and green waste collection 796 - - - 796Cleaning of municipal buildings & aquatics centres 1,290 838 - - 2,129Recycling collections 2,179 - - - 2,179Building maintenance services 1,809 27 27 54 1,917Tipping waste management 4,803 5,710 235 485 11,233Central record services 71 - - - 71Other contractual obligations 2,996 1,450 950 1,514 6,910
Total 17,416 8,723 1,212 2,053 29,406
Capital
Buildings 347 149 59 - 555Other capital works 1,563 12 12 25 1,613
Total 1,910 161 71 25 2,167
2019
OperatingMunicipal turf maintenance and mowing services 3,228 - - - 3,228Parking enforcement and car parks 8,326 - - - 8,326Management of car parks 899 919 - - 1,819Hard and green waste collection 390 - - - 390Cleaning of municipal buildings and aquatics centres 1,403 1,257 1,301 - 3,961Recycling collections 2,150 - - - 2,150Building maintenance services 2,200 - - - 2,200Tipping waste management 4,656 4,772 4,892 - 14,320Provision of insurance broking and premium services 33 36 121 - 190Central record services 218 222 458 - 899Other contractual obligations 1,960 1,059 1,228 - 4,247
Total 25,463 8,265 8,000 - 41,728
CapitalBuildings 580 533 - - 1,113Roads 4,460 550 50 - 5,060Drainage 110 - - - 110Cato Street car park redevelopment 13,111 - - - 13,111Other capital works 658 25 25 - 708
Total 18,919 1,108 75 - 20,102
Note 5 – Our financial positionCont...
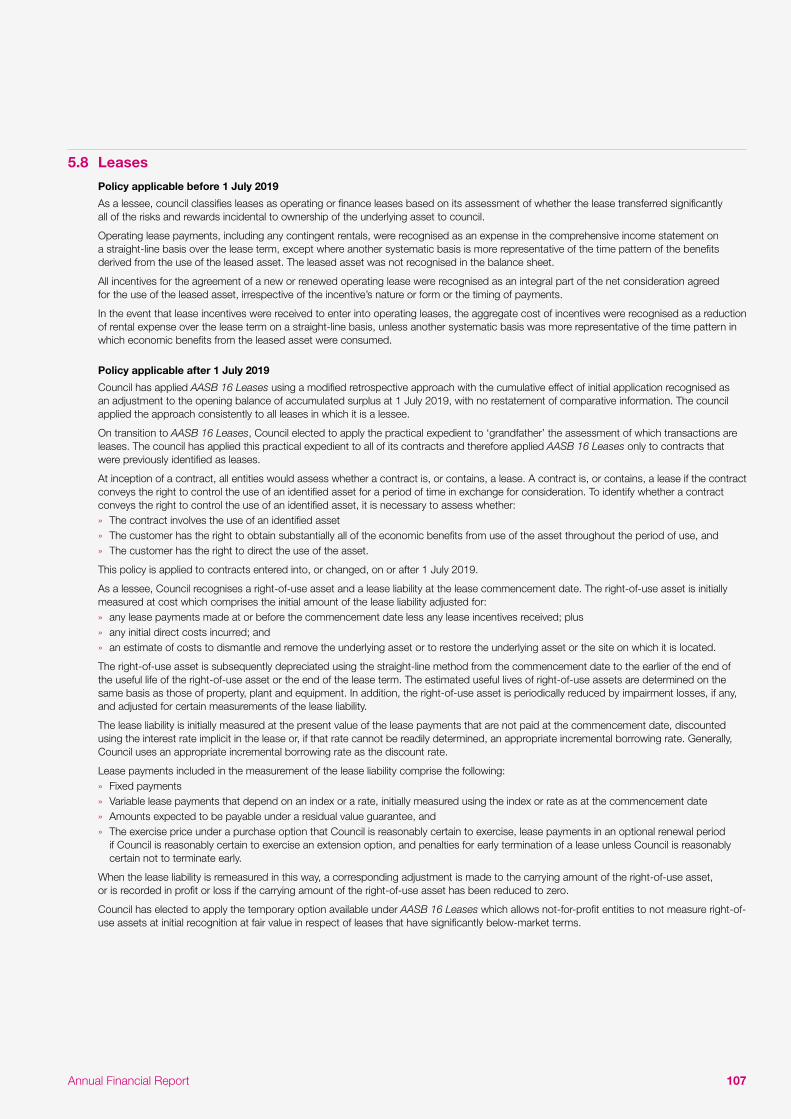
107Annual Financial Report
5.8 Leases
Policy applicable before 1 July 2019
As a lessee, council classifies leases as operating or finance leases based on its assessment of whether the lease transferred significantly all of the risks and rewards incidental to ownership of the underlying asset to council.
Operating lease payments, including any contingent rentals, were recognised as an expense in the comprehensive income statement on a straight-line basis over the lease term, except where another systematic basis is more representative of the time pattern of the benefits derived from the use of the leased asset. The leased asset was not recognised in the balance sheet.
All incentives for the agreement of a new or renewed operating lease were recognised as an integral part of the net consideration agreed for the use of the leased asset, irrespective of the incentive’s nature or form or the timing of payments.
In the event that lease incentives were received to enter into operating leases, the aggregate cost of incentives were recognised as a reduction of rental expense over the lease term on a straight-line basis, unless another systematic basis was more representative of the time pattern in which economic benefits from the leased asset were consumed.
Policy applicable after 1 July 2019
Council has applied AASB 16 Leases using a modified retrospective approach with the cumulative effect of initial application recognised as an adjustment to the opening balance of accumulated surplus at 1 July 2019, with no restatement of comparative information. The council applied the approach consistently to all leases in which it is a lessee.
On transition to AASB 16 Leases, Council elected to apply the practical expedient to ‘grandfather’ the assessment of which transactions are leases. The council has applied this practical expedient to all of its contracts and therefore applied AASB 16 Leases only to contracts that were previously identified as leases.
At inception of a contract, all entities would assess whether a contract is, or contains, a lease. A contract is, or contains, a lease if the contract conveys the right to control the use of an identified asset for a period of time in exchange for consideration. To identify whether a contract conveys the right to control the use of an identified asset, it is necessary to assess whether: » The contract involves the use of an identified asset » The customer has the right to obtain substantially all of the economic benefits from use of the asset throughout the period of use, and » The customer has the right to direct the use of the asset.
This policy is applied to contracts entered into, or changed, on or after 1 July 2019.
As a lessee, Council recognises a right-of-use asset and a lease liability at the lease commencement date. The right-of-use asset is initially measured at cost which comprises the initial amount of the lease liability adjusted for: » any lease payments made at or before the commencement date less any lease incentives received; plus » any initial direct costs incurred; and » an estimate of costs to dismantle and remove the underlying asset or to restore the underlying asset or the site on which it is located.
The right-of-use asset is subsequently depreciated using the straight-line method from the commencement date to the earlier of the end of the useful life of the right-of-use asset or the end of the lease term. The estimated useful lives of right-of-use assets are determined on the same basis as those of property, plant and equipment. In addition, the right-of-use asset is periodically reduced by impairment losses, if any, and adjusted for certain measurements of the lease liability.
The lease liability is initially measured at the present value of the lease payments that are not paid at the commencement date, discounted using the interest rate implicit in the lease or, if that rate cannot be readily determined, an appropriate incremental borrowing rate. Generally, Council uses an appropriate incremental borrowing rate as the discount rate.
Lease payments included in the measurement of the lease liability comprise the following: » Fixed payments » Variable lease payments that depend on an index or a rate, initially measured using the index or rate as at the commencement date » Amounts expected to be payable under a residual value guarantee, and » The exercise price under a purchase option that Council is reasonably certain to exercise, lease payments in an optional renewal period
if Council is reasonably certain to exercise an extension option, and penalties for early termination of a lease unless Council is reasonably certain not to terminate early.
When the lease liability is remeasured in this way, a corresponding adjustment is made to the carrying amount of the right-of-use asset, or is recorded in profit or loss if the carrying amount of the right-of-use asset has been reduced to zero.
Council has elected to apply the temporary option available under AASB 16 Leases which allows not-for-profit entities to not measure right-of-use assets at initial recognition at fair value in respect of leases that have significantly below-market terms.
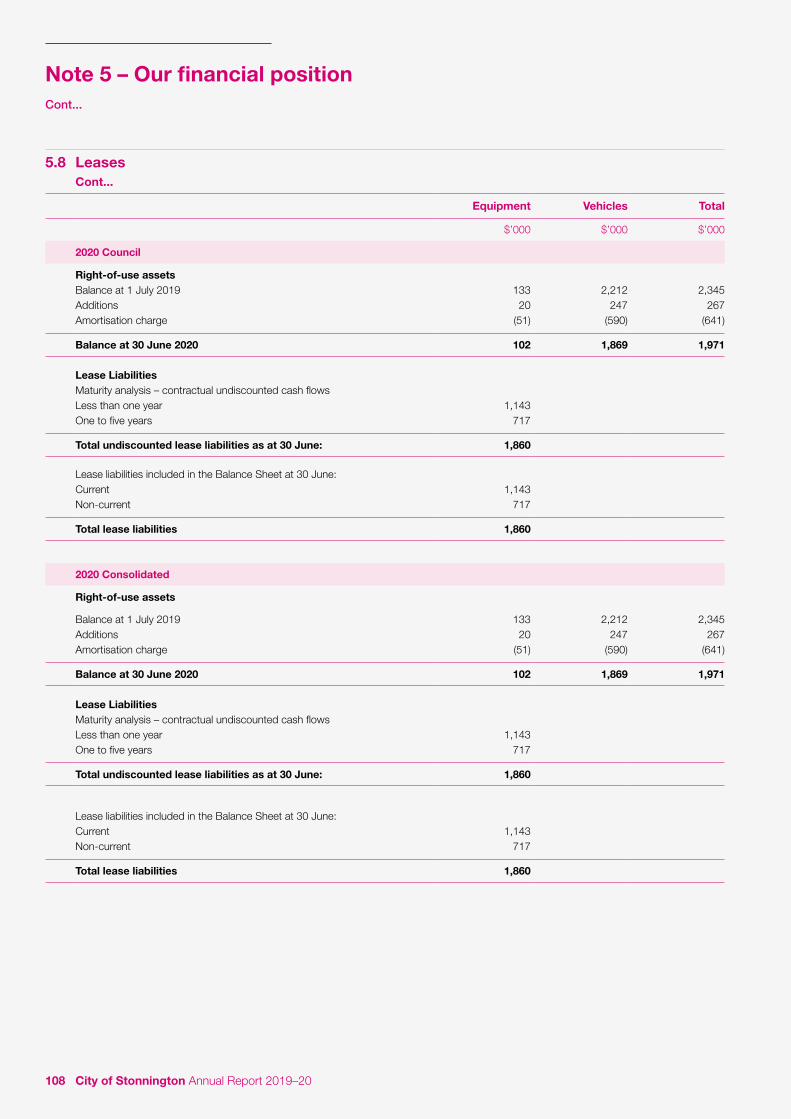
108 City of Stonnington Annual Report 2019–20
5.8 Leases Cont...
Equipment Vehicles Total
$’000 $’000 $’000
2020 Council
Right-of-use assetsBalance at 1 July 2019 133 2,212 2,345Additions 20 247 267Amortisation charge (51) (590) (641)
Balance at 30 June 2020 102 1,869 1,971
Lease LiabilitiesMaturity analysis – contractual undiscounted cash flowsLess than one year 1,143One to five years 717
Total undiscounted lease liabilities as at 30 June: 1,860
Lease liabilities included in the Balance Sheet at 30 June:Current 1,143Non-current 717
Total lease liabilities 1,860
2020 Consolidated
Right-of-use assets
Balance at 1 July 2019 133 2,212 2,345Additions 20 247 267Amortisation charge (51) (590) (641)
Balance at 30 June 2020 102 1,869 1,971
Lease LiabilitiesMaturity analysis – contractual undiscounted cash flowsLess than one year 1,143One to five years 717
Total undiscounted lease liabilities as at 30 June: 1,860
Lease liabilities included in the Balance Sheet at 30 June:Current 1,143Non-current 717
Total lease liabilities 1,860
Note 5 – Our financial positionCont...

109Annual Financial Report
5.8 Leases
Short-term and low value leases
Council has elected not to recognise right-of-use assets and lease liabilities for short-term leases of machinery that have a lease term of 12 months or less and leases of low-value assets (individual assets worth less than existing capitalisation thresholds for a like asset up to a maximum of AUD$10,000), including IT equipment. Council recognises the lease payments associated with these leases as an expense on a straight-line basis over the lease term.
Council Consolidated2020 2020
$’000 $’000
Expenses relating to:Short-term leases 185 185Leases of low value assets 152 152
Total 337 337
Variable lease payments (not included in measurement of lease liabilities) - -
Non-cancellable lease commitments – Short-term and low-value leases
Commitments for minimum lease payments for short-term and low-value leases are payable as follows:
Payable:Within one year 185 185Later than one year but not later than five years 152 152
Total lease commitments 337 337
i. Leases classified as operating leases under AASB 117 Leases
At transition, lease liabilities were measured at the present value of the remaining lease payments, discounted at Council’s incremental borrowing rate as at 1 July 2019. Right-of-use assets are measured at an amount equal to the lease liability, adjusted by the amount of any prepaid or accrued lease payments. Council applied this approach to all applicable leases.
Council used the following practical expedients when applying AASB 16 Leases to leases previously classified as operating leases under AASB 117 Leases.
» Applied a single discount rate to a portfolio of leases with similar characteristics.
» Adjusted the right-of-use assets by the amount of AASB 137 Provisions, Contingent Liabilities and Contingent Assets onerous contract provision immediately before the date of initial application, as an alternative to an impairment review.
» Applied the exemption not to recognise right-of-use assets and liabilities for leases with less than 12 months of lease term.
» Used hindsight when determining the lease term if the contract contains options to extend or terminate the lease.
ii. Leases previously classified as finance leases
For leases that were classified as finance leases under AASB 117 Leases, the carrying amount of the right-of-use asset and the lease liability at 1 July 2019 are determined at the carrying amount of the lease asset and lease liability under AASB 117 Leases immediately before that date.
Council is not required to make any adjustments on transition to AASB 16 Leases for leases in which it acts as a lessor, except for a sub-lease. Council accounted for its leases in accordance with AASB 16 Leases from the date of initial application.
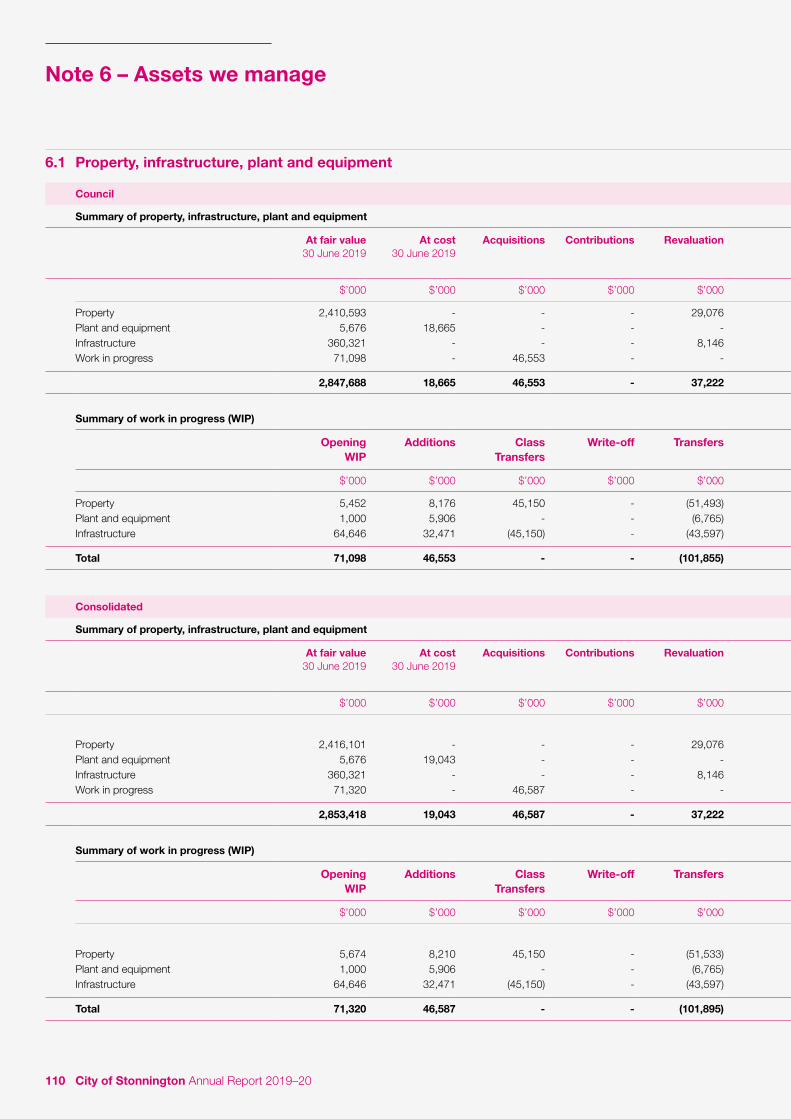
110 City of Stonnington Annual Report 2019–20
6.1 Property, infrastructure, plant and equipment
Council
Summary of property, infrastructure, plant and equipment
At fair value 30 June 2019
At cost 30 June 2019
Acquisitions Contributions Revaluation Depreciation Disposal Write-off Transfers At fair value 30 June 2020
At cost 30 June 2020
Written down value
30 June 2020
$’000 $’000 $’000 $’000 $’000 $’000 $’000 $’000 $’000 $’000 $’000 $’000
Property 2,410,593 - - - 29,076 (5,640) (998) - 51,493 2,484,524 - 2,484,524Plant and equipment 5,676 18,665 - - - (3,832) (261) - 6,765 5,675 21,337 27,012Infrastructure 360,321 - - - 8,146 (9,860) - (1,485) 43,597 400,719 - 400,718Work in progress 71,098 - 46,553 - - - - - (101,855) 15,796 - 15,796
2,847,688 18,665 46,553 - 37,222 (19,332) (1,259) (1,485) - 2,906,715 21,337 2,928,051
Summary of work in progress (WIP)
Opening WIP
Additions Class Transfers
Write-off Transfers Closing WIP
$’000 $’000 $’000 $’000 $’000 $’000
Property 5,452 8,176 45,150 - (51,493) 7,285Plant and equipment 1,000 5,906 - - (6,765) 141Infrastructure 64,646 32,471 (45,150) - (43,597) 8,370
Total 71,098 46,553 - - (101,855) 15,796
Consolidated
Summary of property, infrastructure, plant and equipment
At fair value 30 June 2019
At cost 30 June 2019
Acquisitions Contributions Revaluation Depreciation Disposal Write-off Transfers At fair value 30 June 2020
At cost 30 June 2020
Written down value
30 June 2020
$’000 $’000 $’000 $’000 $’000 $’000 $’000 $’000 $’000 $’000 $’000 $’000
Property 2,416,101 - - - 29,076 (5,856) (998) - 51,533 2,489,857 - 2,489,857Plant and equipment 5,676 19,043 - - - (3,904) (247) - 6,765 5,676 21,657 27,333Infrastructure 360,321 - - - 8,146 (9,860) - (1,485) 43,597 400,719 - 400,719Work in progress 71,320 - 46,587 - - - - - (101,895) 16,012 - 16,012
2,853,418 19,043 46,587 - 37,222 (19,621) (1,245) (1,485) - 2,912,264 21,657 2,933,921
Summary of work in progress (WIP)
Opening WIP
Additions Class Transfers
Write-off Transfers Closing WIP
$’000 $’000 $’000 $’000 $’000 $’000
Property 5,674 8,210 45,150 - (51,533) 7,501Plant and equipment 1,000 5,906 - - (6,765) 141Infrastructure 64,646 32,471 (45,150) - (43,597) 8,370
Total 71,320 46,587 - - (101,895) 16,012
Note 6 – Assets we manage

111Annual Financial Report
6.1 Property, infrastructure, plant and equipment
Council
Summary of property, infrastructure, plant and equipment
At fair value 30 June 2019
At cost 30 June 2019
Acquisitions Contributions Revaluation Depreciation Disposal Write-off Transfers At fair value 30 June 2020
At cost 30 June 2020
Written down value
30 June 2020
$’000 $’000 $’000 $’000 $’000 $’000 $’000 $’000 $’000 $’000 $’000 $’000
Property 2,410,593 - - - 29,076 (5,640) (998) - 51,493 2,484,524 - 2,484,524Plant and equipment 5,676 18,665 - - - (3,832) (261) - 6,765 5,675 21,337 27,012Infrastructure 360,321 - - - 8,146 (9,860) - (1,485) 43,597 400,719 - 400,718Work in progress 71,098 - 46,553 - - - - - (101,855) 15,796 - 15,796
2,847,688 18,665 46,553 - 37,222 (19,332) (1,259) (1,485) - 2,906,715 21,337 2,928,051
Summary of work in progress (WIP)
Opening WIP
Additions Class Transfers
Write-off Transfers Closing WIP
$’000 $’000 $’000 $’000 $’000 $’000
Property 5,452 8,176 45,150 - (51,493) 7,285Plant and equipment 1,000 5,906 - - (6,765) 141Infrastructure 64,646 32,471 (45,150) - (43,597) 8,370
Total 71,098 46,553 - - (101,855) 15,796
Consolidated
Summary of property, infrastructure, plant and equipment
At fair value 30 June 2019
At cost 30 June 2019
Acquisitions Contributions Revaluation Depreciation Disposal Write-off Transfers At fair value 30 June 2020
At cost 30 June 2020
Written down value
30 June 2020
$’000 $’000 $’000 $’000 $’000 $’000 $’000 $’000 $’000 $’000 $’000 $’000
Property 2,416,101 - - - 29,076 (5,856) (998) - 51,533 2,489,857 - 2,489,857Plant and equipment 5,676 19,043 - - - (3,904) (247) - 6,765 5,676 21,657 27,333Infrastructure 360,321 - - - 8,146 (9,860) - (1,485) 43,597 400,719 - 400,719Work in progress 71,320 - 46,587 - - - - - (101,895) 16,012 - 16,012
2,853,418 19,043 46,587 - 37,222 (19,621) (1,245) (1,485) - 2,912,264 21,657 2,933,921
Summary of work in progress (WIP)
Opening WIP
Additions Class Transfers
Write-off Transfers Closing WIP
$’000 $’000 $’000 $’000 $’000 $’000
Property 5,674 8,210 45,150 - (51,533) 7,501Plant and equipment 1,000 5,906 - - (6,765) 141Infrastructure 64,646 32,471 (45,150) - (43,597) 8,370
Total 71,320 46,587 - - (101,895) 16,012
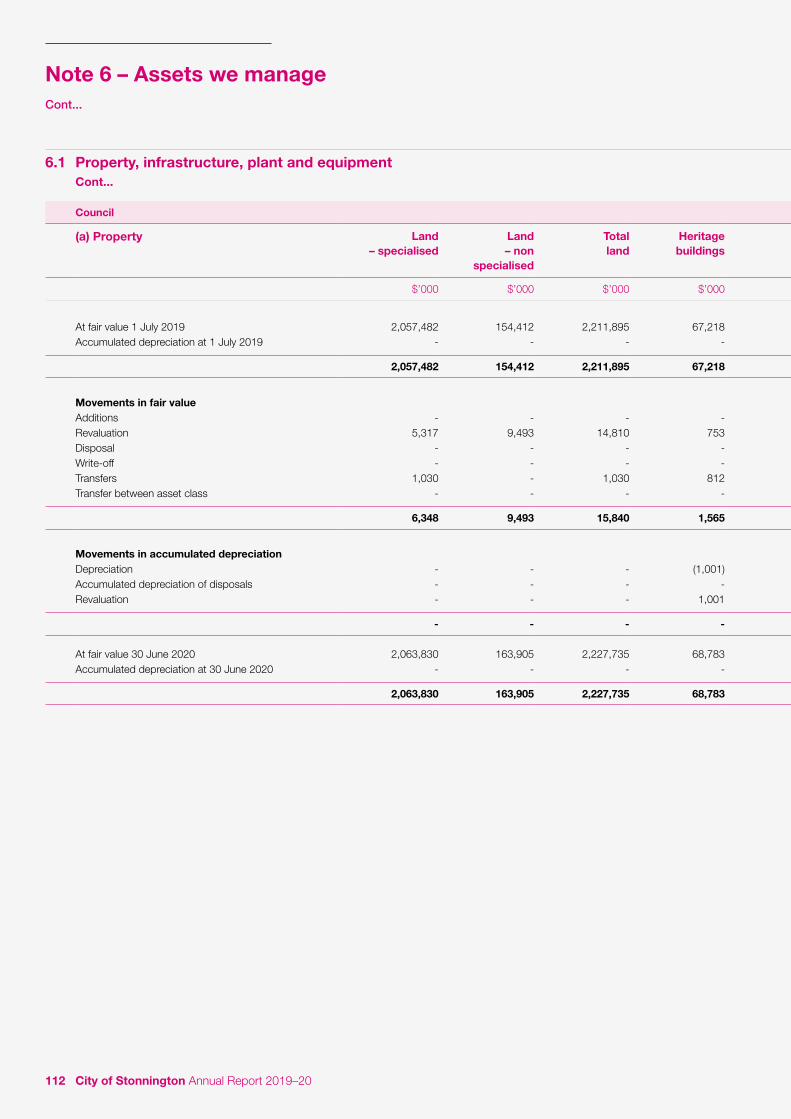
112 City of Stonnington Annual Report 2019–20
6.1 Property, infrastructure, plant and equipment Cont...
Council
(a) Property Land – specialised
Land – non
specialised
Total land
Heritage buildings
Buildings – specialised
Buildings – non
specialised
Total buildings
Work in progress
Total property
$’000 $’000 $’000 $’000 $’000 $’000 $’000 $’000 $’000
At fair value 1 July 2019 2,057,482 154,412 2,211,895 67,218 113,556 17,924 198,698 5,452 2,416,045Accumulated depreciation at 1 July 2019 - - - - - - - - -
2,057,482 154,412 2,211,895 67,218 113,556 17,924 198,698 5,452 2,416,045
Movements in fair valueAdditions - - - - - - - 8,176 8,176Revaluation 5,317 9,493 14,810 753 9,903 (1,893) 8,763 - 23,573Disposal - - - - - - - - -Write-off - - - - (1,135) - (1,135) - (1,135)Transfers 1,030 - 1,030 812 48,111 1,539 50,463 (51,493) -Transfer between asset class - - - - - - 45,150 45,150
6,348 9,493 15,840 1,565 56,879 (354) 58,091 1,833 75,764
Movements in accumulated depreciationDepreciation - - - (1,001) (4,128) (511) (5,640) - (5,640)Accumulated depreciation of disposals - - - - 137 - 137 - 137Revaluation - - - 1,001 3,991 511 5,503 - 5,503
- - - - - - - - -
At fair value 30 June 2020 2,063,830 163,905 2,227,735 68,783 170,435 17,571 256,789 7,285 2,491,809Accumulated depreciation at 30 June 2020 - - - - - - - - -
2,063,830 163,905 2,227,735 68,783 170,435 17,571 256,789 7,285 2,491,809
Note 6 – Assets we manageCont...

113Annual Financial Report
6.1 Property, infrastructure, plant and equipment Cont...
Council
(a) Property Land – specialised
Land – non
specialised
Total land
Heritage buildings
Buildings – specialised
Buildings – non
specialised
Total buildings
Work in progress
Total property
$’000 $’000 $’000 $’000 $’000 $’000 $’000 $’000 $’000
At fair value 1 July 2019 2,057,482 154,412 2,211,895 67,218 113,556 17,924 198,698 5,452 2,416,045Accumulated depreciation at 1 July 2019 - - - - - - - - -
2,057,482 154,412 2,211,895 67,218 113,556 17,924 198,698 5,452 2,416,045
Movements in fair valueAdditions - - - - - - - 8,176 8,176Revaluation 5,317 9,493 14,810 753 9,903 (1,893) 8,763 - 23,573Disposal - - - - - - - - -Write-off - - - - (1,135) - (1,135) - (1,135)Transfers 1,030 - 1,030 812 48,111 1,539 50,463 (51,493) -Transfer between asset class - - - - - - 45,150 45,150
6,348 9,493 15,840 1,565 56,879 (354) 58,091 1,833 75,764
Movements in accumulated depreciationDepreciation - - - (1,001) (4,128) (511) (5,640) - (5,640)Accumulated depreciation of disposals - - - - 137 - 137 - 137Revaluation - - - 1,001 3,991 511 5,503 - 5,503
- - - - - - - - -
At fair value 30 June 2020 2,063,830 163,905 2,227,735 68,783 170,435 17,571 256,789 7,285 2,491,809Accumulated depreciation at 30 June 2020 - - - - - - - - -
2,063,830 163,905 2,227,735 68,783 170,435 17,571 256,789 7,285 2,491,809
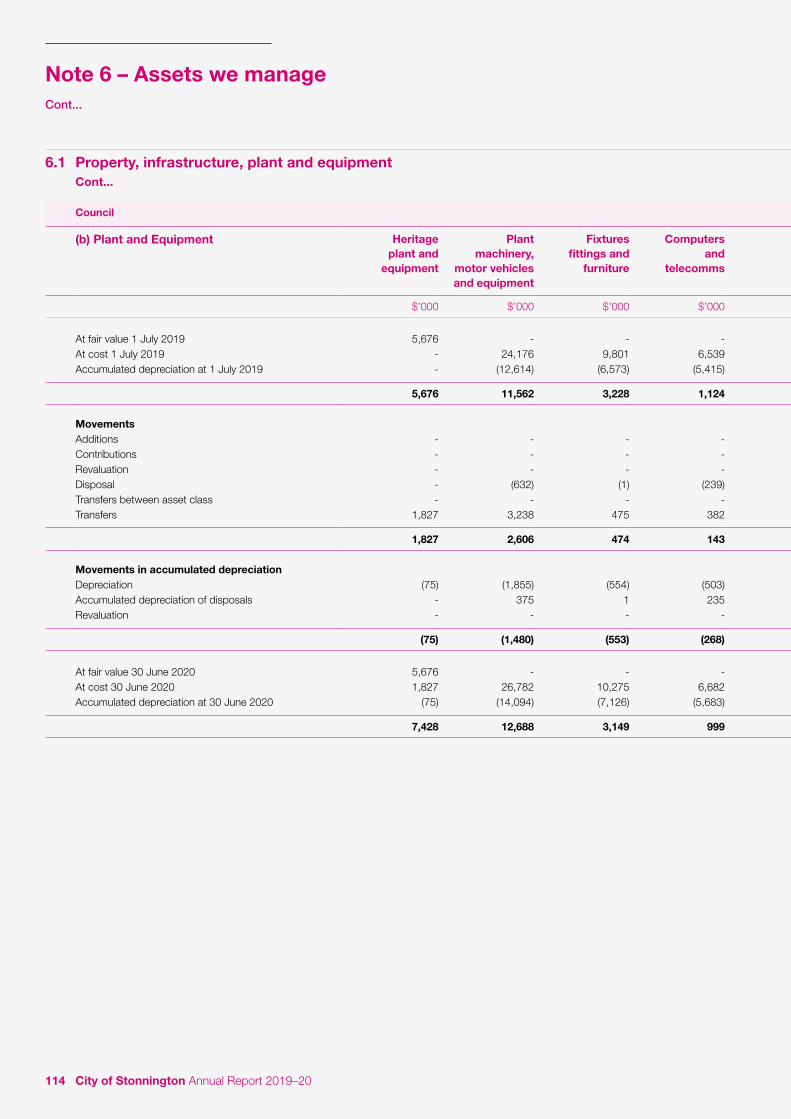
114 City of Stonnington Annual Report 2019–20
6.1 Property, infrastructure, plant and equipment Cont...
Council
(b) Plant and Equipment Heritage plant and
equipment
Plant machinery,
motor vehicles and equipment
Fixtures fittings and
furniture
Computers and
telecomms
Library books
Work In progress
Total plant and
equipment
$’000 $’000 $’000 $’000 $’000 $’000 $’000
At fair value 1 July 2019 5,676 - - - - - 5,676At cost 1 July 2019 - 24,176 9,801 6,539 21,342 1,000 62,858Accumulated depreciation at 1 July 2019 - (12,614) (6,573) (5,415) (18,591) - (43,193)
5,676 11,562 3,228 1,124 2,751 1,000 25,341
MovementsAdditions - - - - - 5,906 5,906Contributions - - - - - - -Revaluation - - - - - - -Disposal - (632) (1) (239) - - (872)Transfers between asset class - - - - - - -Transfers 1,827 3,238 475 382 843 (6,765) -
1,827 2,606 474 143 843 (859) 5,034
Movements in accumulated depreciationDepreciation (75) (1,855) (554) (503) (845) - (3,832)Accumulated depreciation of disposals - 375 1 235 - - 611Revaluation - - - - - - -
(75) (1,480) (553) (268) (845) - (3,221)
At fair value 30 June 2020 5,676 - - - - - 5,676At cost 30 June 2020 1,827 26,782 10,275 6,682 22,186 141 67,892Accumulated depreciation at 30 June 2020 (75) (14,094) (7,126) (5,683) (19,436) - (46,414)
7,428 12,688 3,149 999 2,750 141 27,154
Note 6 – Assets we manageCont...

115Annual Financial Report
6.1 Property, infrastructure, plant and equipment Cont...
Council
(b) Plant and Equipment Heritage plant and
equipment
Plant machinery,
motor vehicles and equipment
Fixtures fittings and
furniture
Computers and
telecomms
Library books
Work In progress
Total plant and
equipment
$’000 $’000 $’000 $’000 $’000 $’000 $’000
At fair value 1 July 2019 5,676 - - - - - 5,676At cost 1 July 2019 - 24,176 9,801 6,539 21,342 1,000 62,858Accumulated depreciation at 1 July 2019 - (12,614) (6,573) (5,415) (18,591) - (43,193)
5,676 11,562 3,228 1,124 2,751 1,000 25,341
MovementsAdditions - - - - - 5,906 5,906Contributions - - - - - - -Revaluation - - - - - - -Disposal - (632) (1) (239) - - (872)Transfers between asset class - - - - - - -Transfers 1,827 3,238 475 382 843 (6,765) -
1,827 2,606 474 143 843 (859) 5,034
Movements in accumulated depreciationDepreciation (75) (1,855) (554) (503) (845) - (3,832)Accumulated depreciation of disposals - 375 1 235 - - 611Revaluation - - - - - - -
(75) (1,480) (553) (268) (845) - (3,221)
At fair value 30 June 2020 5,676 - - - - - 5,676At cost 30 June 2020 1,827 26,782 10,275 6,682 22,186 141 67,892Accumulated depreciation at 30 June 2020 (75) (14,094) (7,126) (5,683) (19,436) - (46,414)
7,428 12,688 3,149 999 2,750 141 27,154

116 City of Stonnington Annual Report 2019–20
6.1 Property, infrastructure, plant and equipment Cont...
Council
(c) Infrastructure Roads Bridges Drainage Recreational, leisure and community
Parks, open space and
streetscapes
Other infrastructure
Work in progress
Total infrastructure
$’000 $’000 $’000 $’000 $’000 $’000 $’000 $’000
At fair value 1 July 2019 381,637 6,683 150,804 18,692 58,411 33,857 64,646 714,730Accumulated depreciation at 1 July 2019 (187,403) (1,582) (75,522) (5,596) (7,993) (11,667) - (289,763)
194,234 5,101 75,282 13,096 50,418 22,190 64,646 424,967
Movements in fair valueAdditions - - - - - - 32,471 32,471Revaluation - - (70,832) - - (2,044) - (72,876)Write-off (4,574) - - - - - - (4,574)Transfers 11,730 - 4,242 6,100 19,061 2,464 (43,597) -Transfer between asset class - - - - - - (45,150) (45,150)
7,156 - (66,590) 6,100 19,061 420 (56,276) (90,129)
Movements in accumulated depreciationDepreciation (4,590) (130) (1,848) (799) (1,141) (1,352) - (9,860)Accumulated depreciation of disposals/write offs 3,089 - - - - - - 3,089Revaluation - - 77,370 - - 3,652 - 81,022
(1,501) (130) 75,522 (799) (1,141) 2,300 - 74,251
At fair value 30 June 2020 388,793 6,683 84,213 24,792 77,472 34,277 8,371 624,601Accumulated depreciation at 30 June 2020 (188,904) (1,712) - (6,395) (9,134) (9,367) - (215,512)
199,889 4,971 84,213 18,397 68,338 24,910 8,371 409,089
Note 6 – Assets we manageCont...

117Annual Financial Report
6.1 Property, infrastructure, plant and equipment Cont...
Council
(c) Infrastructure Roads Bridges Drainage Recreational, leisure and community
Parks, open space and
streetscapes
Other infrastructure
Work in progress
Total infrastructure
$’000 $’000 $’000 $’000 $’000 $’000 $’000 $’000
At fair value 1 July 2019 381,637 6,683 150,804 18,692 58,411 33,857 64,646 714,730Accumulated depreciation at 1 July 2019 (187,403) (1,582) (75,522) (5,596) (7,993) (11,667) - (289,763)
194,234 5,101 75,282 13,096 50,418 22,190 64,646 424,967
Movements in fair valueAdditions - - - - - - 32,471 32,471Revaluation - - (70,832) - - (2,044) - (72,876)Write-off (4,574) - - - - - - (4,574)Transfers 11,730 - 4,242 6,100 19,061 2,464 (43,597) -Transfer between asset class - - - - - - (45,150) (45,150)
7,156 - (66,590) 6,100 19,061 420 (56,276) (90,129)
Movements in accumulated depreciationDepreciation (4,590) (130) (1,848) (799) (1,141) (1,352) - (9,860)Accumulated depreciation of disposals/write offs 3,089 - - - - - - 3,089Revaluation - - 77,370 - - 3,652 - 81,022
(1,501) (130) 75,522 (799) (1,141) 2,300 - 74,251
At fair value 30 June 2020 388,793 6,683 84,213 24,792 77,472 34,277 8,371 624,601Accumulated depreciation at 30 June 2020 (188,904) (1,712) - (6,395) (9,134) (9,367) - (215,512)
199,889 4,971 84,213 18,397 68,338 24,910 8,371 409,089
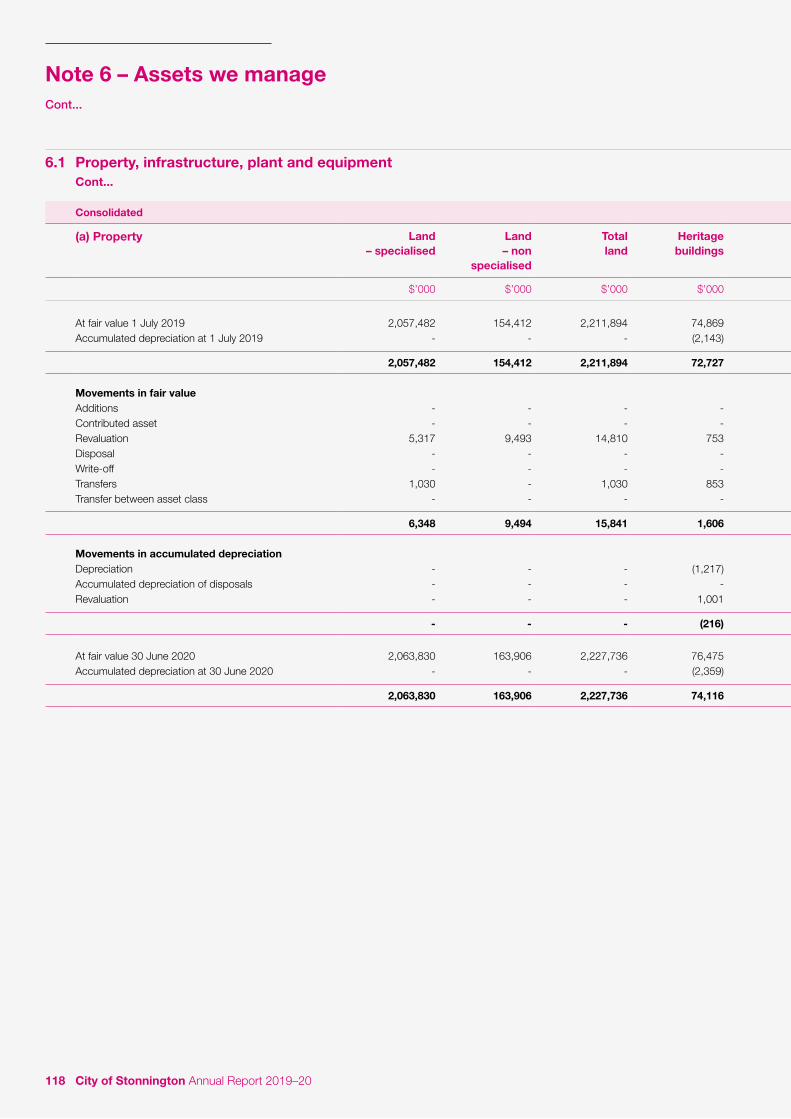
118 City of Stonnington Annual Report 2019–20
6.1 Property, infrastructure, plant and equipment Cont...
Consolidated
(a) Property Land – specialised
Land – non
specialised
Total land
Heritage buildings
Buildings – specialised
Buildings – non
specialised
Total buildings
Work in progress
Total property
$’000 $’000 $’000 $’000 $’000 $’000 $’000 $’000 $’000
At fair value 1 July 2019 2,057,482 154,412 2,211,894 74,869 113,556 17,924 206,350 5,674 2,423,918Accumulated depreciation at 1 July 2019 - - - (2,143) - - (2,143) - (2,143)
2,057,482 154,412 2,211,894 72,727 113,556 17,924 204,207 5,674 2,421,775
Movements in fair valueAdditions - - - - - - - 8,210 8,210Contributed asset - - - - - - - - -Revaluation 5,317 9,493 14,810 753 9,903 (1,893) 8,763 - 23,573Disposal - - - - - - - - -Write-off - - - - (1,135) - (1,135) - (1,135)Transfers 1,030 - 1,030 853 48,111 1,539 50,503 (51,533) -Transfer between asset class - - - - - - - 45,150 45,150
6,348 9,494 15,841 1,606 56,879 (354) 58,131 1,827 75,799
Movements in accumulated depreciationDepreciation - - - (1,217) (4,128) (511) (5,856) - (5,856)Accumulated depreciation of disposals - - - - 137 - 137 - 137Revaluation - - - 1,001 3,991 511 5,503 - 5,503
- - - (216) - - (216) - (216)
At fair value 30 June 2020 2,063,830 163,906 2,227,736 76,475 170,435 17,571 264,481 7,501 2,499,718Accumulated depreciation at 30 June 2020 - - - (2,359) - - (2,359) - (2,359)
2,063,830 163,906 2,227,736 74,116 170,435 17,571 262,122 7,501 2,497,358
Note 6 – Assets we manageCont...

119Annual Financial Report 119Annual Financial Report
6.1 Property, infrastructure, plant and equipment Cont...
Consolidated
(a) Property Land – specialised
Land – non
specialised
Total land
Heritage buildings
Buildings – specialised
Buildings – non
specialised
Total buildings
Work in progress
Total property
$’000 $’000 $’000 $’000 $’000 $’000 $’000 $’000 $’000
At fair value 1 July 2019 2,057,482 154,412 2,211,894 74,869 113,556 17,924 206,350 5,674 2,423,918Accumulated depreciation at 1 July 2019 - - - (2,143) - - (2,143) - (2,143)
2,057,482 154,412 2,211,894 72,727 113,556 17,924 204,207 5,674 2,421,775
Movements in fair valueAdditions - - - - - - - 8,210 8,210Contributed asset - - - - - - - - -Revaluation 5,317 9,493 14,810 753 9,903 (1,893) 8,763 - 23,573Disposal - - - - - - - - -Write-off - - - - (1,135) - (1,135) - (1,135)Transfers 1,030 - 1,030 853 48,111 1,539 50,503 (51,533) -Transfer between asset class - - - - - - - 45,150 45,150
6,348 9,494 15,841 1,606 56,879 (354) 58,131 1,827 75,799
Movements in accumulated depreciationDepreciation - - - (1,217) (4,128) (511) (5,856) - (5,856)Accumulated depreciation of disposals - - - - 137 - 137 - 137Revaluation - - - 1,001 3,991 511 5,503 - 5,503
- - - (216) - - (216) - (216)
At fair value 30 June 2020 2,063,830 163,906 2,227,736 76,475 170,435 17,571 264,481 7,501 2,499,718Accumulated depreciation at 30 June 2020 - - - (2,359) - - (2,359) - (2,359)
2,063,830 163,906 2,227,736 74,116 170,435 17,571 262,122 7,501 2,497,358
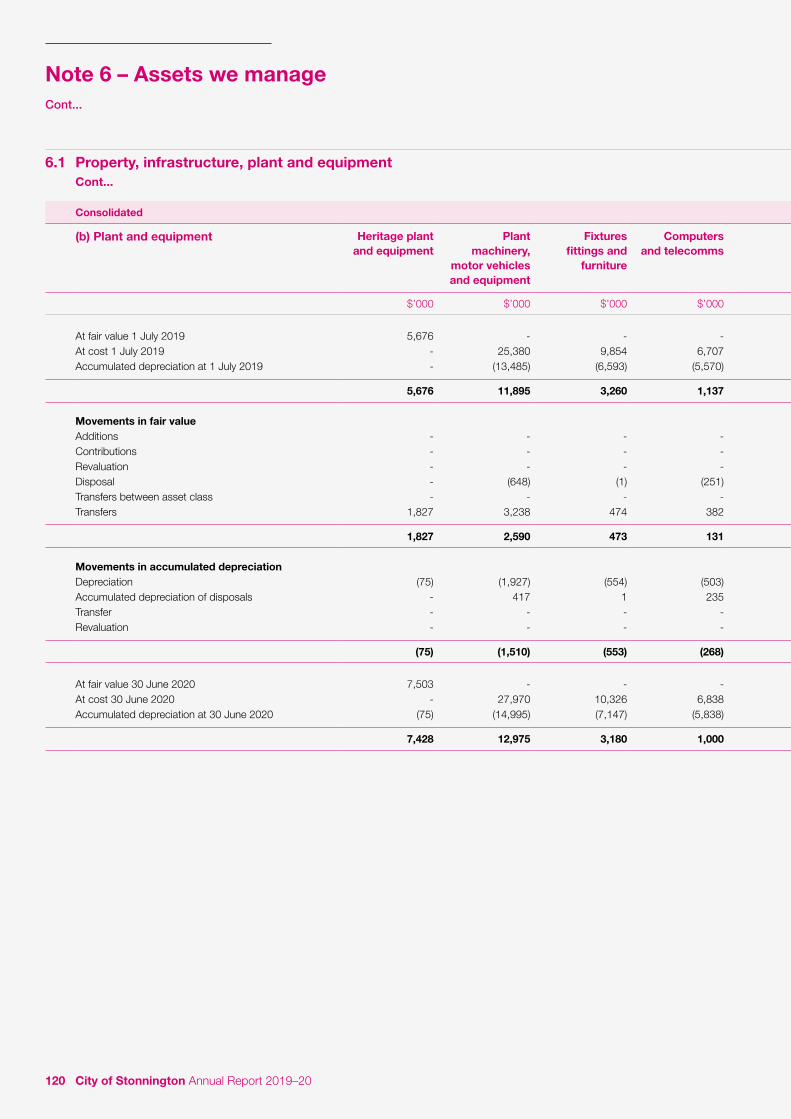
120 City of Stonnington Annual Report 2019–20
6.1 Property, infrastructure, plant and equipment Cont...
Consolidated
(b) Plant and equipment Heritage plant and equipment
Plant machinery,
motor vehicles and equipment
Fixtures fittings and
furniture
Computers and telecomms
Library books
Work In progress
Total plant and
equipment
$’000 $’000 $’000 $’000 $’000 $’000 $’000
At fair value 1 July 2019 5,676 - - - - - 5,676At cost 1 July 2019 - 25,380 9,854 6,707 21,342 1,000 64,284Accumulated depreciation at 1 July 2019 - (13,485) (6,593) (5,570) (18,591) - (44,239)
5,676 11,895 3,260 1,137 2,751 1,000 25,720
Movements in fair valueAdditions - - - - - 5,906 5,906Contributions - - - - - - -Revaluation - - - - - - -Disposal - (648) (1) (251) - - (900)Transfers between asset class - - - - - - -Transfers 1,827 3,238 474 382 844 (6,765) -
1,827 2,590 473 131 844 (859) 5,006
Movements in accumulated depreciationDepreciation (75) (1,927) (554) (503) (844) - (3,904)Accumulated depreciation of disposals - 417 1 235 - - 653Transfer - - - - - - -Revaluation - - - - - - -
(75) (1,510) (553) (268) (844) - (3,251)
At fair value 30 June 2020 7,503 - - - - - 7,503At cost 30 June 2020 - 27,970 10,326 6,838 22,186 141 67,462Accumulated depreciation at 30 June 2020 (75) (14,995) (7,147) (5,838) (19,436) - (47,491)
7,428 12,975 3,180 1,000 2,750 141 27,474
Note 6 – Assets we manageCont...

121Annual Financial Report
6.1 Property, infrastructure, plant and equipment Cont...
Consolidated
(b) Plant and equipment Heritage plant and equipment
Plant machinery,
motor vehicles and equipment
Fixtures fittings and
furniture
Computers and telecomms
Library books
Work In progress
Total plant and
equipment
$’000 $’000 $’000 $’000 $’000 $’000 $’000
At fair value 1 July 2019 5,676 - - - - - 5,676At cost 1 July 2019 - 25,380 9,854 6,707 21,342 1,000 64,284Accumulated depreciation at 1 July 2019 - (13,485) (6,593) (5,570) (18,591) - (44,239)
5,676 11,895 3,260 1,137 2,751 1,000 25,720
Movements in fair valueAdditions - - - - - 5,906 5,906Contributions - - - - - - -Revaluation - - - - - - -Disposal - (648) (1) (251) - - (900)Transfers between asset class - - - - - - -Transfers 1,827 3,238 474 382 844 (6,765) -
1,827 2,590 473 131 844 (859) 5,006
Movements in accumulated depreciationDepreciation (75) (1,927) (554) (503) (844) - (3,904)Accumulated depreciation of disposals - 417 1 235 - - 653Transfer - - - - - - -Revaluation - - - - - - -
(75) (1,510) (553) (268) (844) - (3,251)
At fair value 30 June 2020 7,503 - - - - - 7,503At cost 30 June 2020 - 27,970 10,326 6,838 22,186 141 67,462Accumulated depreciation at 30 June 2020 (75) (14,995) (7,147) (5,838) (19,436) - (47,491)
7,428 12,975 3,180 1,000 2,750 141 27,474
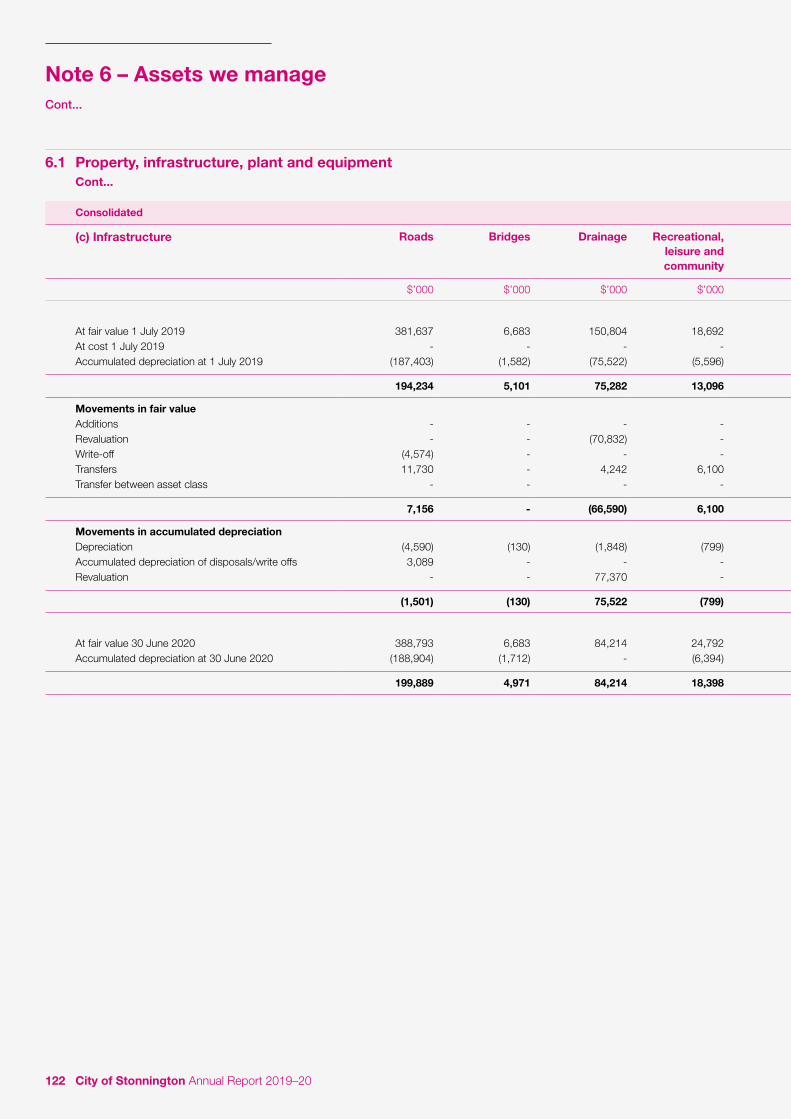
122 City of Stonnington Annual Report 2019–20
6.1 Property, infrastructure, plant and equipment Cont...
Consolidated
(c) Infrastructure Roads Bridges Drainage Recreational, leisure and community
Parks, open space and
streetscapes
Other infrastructure
Work in progress
Total infrastructure
$’000 $’000 $’000 $’000 $’000 $’000 $’000 $’000
At fair value 1 July 2019 381,637 6,683 150,804 18,692 58,410 33,857 64,646 714,730At cost 1 July 2019 - - - - - - - -Accumulated depreciation at 1 July 2019 (187,403) (1,582) (75,522) (5,596) (7,993) (11,667) - (289,763)
194,234 5,101 75,282 13,096 50,418 22,191 64,646 424,967
Movements in fair valueAdditions - - - - - - 32,471 32,471Revaluation - - (70,832) - - (2,044) - (72,876)Write-off (4,574) - - - - - - (4,574)Transfers 11,730 - 4,242 6,100 19,061 2,464 (43,597) -Transfer between asset class - - - - - - (45,150) (45,150)
7,156 - (66,590) 6,100 19,061 420 (56,276) (90,129)
Movements in accumulated depreciationDepreciation (4,590) (130) (1,848) (799) (1,141) (1,353) - (9,860)Accumulated depreciation of disposals/write offs 3,089 - - - - - - 3,089Revaluation - - 77,370 - - 3,652 - 81,022
(1,501) (130) 75,522 (799) (1,141) 2,299 - 74,251
At fair value 30 June 2020 388,793 6,683 84,214 24,792 77,471 34,277 8,371 624,601Accumulated depreciation at 30 June 2020 (188,904) (1,712) - (6,394) (9,134) (9,367) - (215,513)
199,889 4,971 84,214 18,398 68,337 24,910 8,371 409,089
Note 6 – Assets we manageCont...
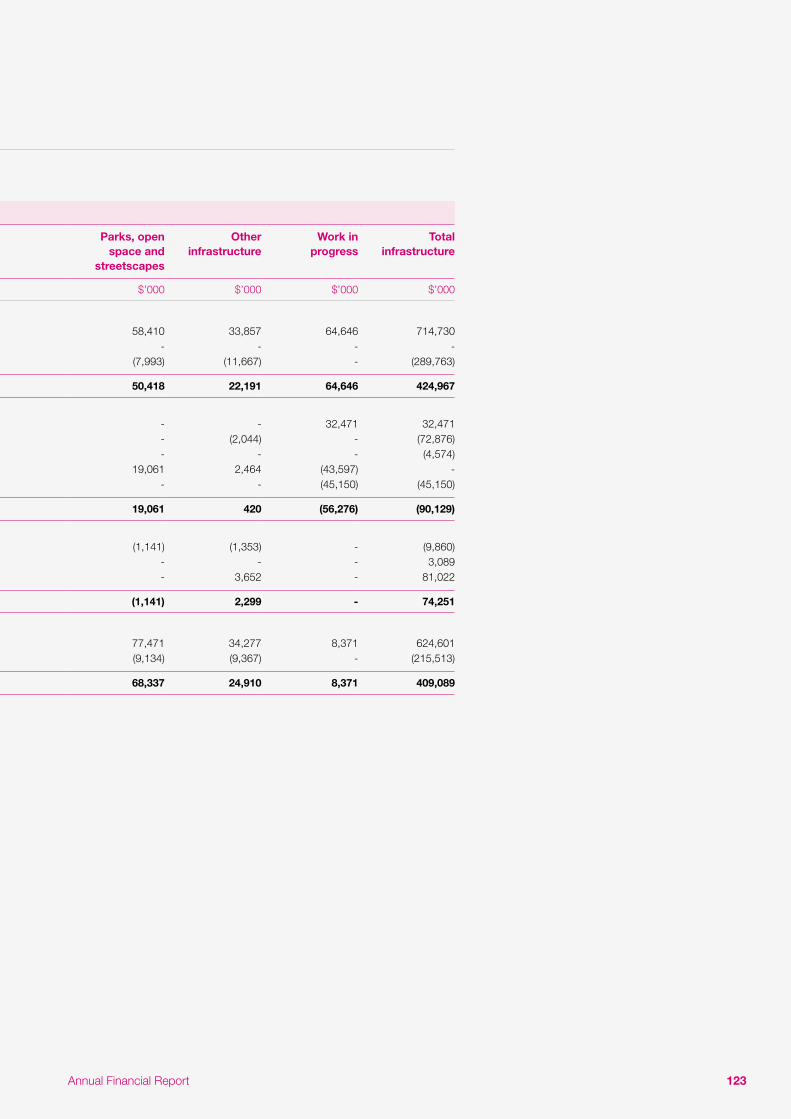
123Annual Financial Report
6.1 Property, infrastructure, plant and equipment Cont...
Consolidated
(c) Infrastructure Roads Bridges Drainage Recreational, leisure and community
Parks, open space and
streetscapes
Other infrastructure
Work in progress
Total infrastructure
$’000 $’000 $’000 $’000 $’000 $’000 $’000 $’000
At fair value 1 July 2019 381,637 6,683 150,804 18,692 58,410 33,857 64,646 714,730At cost 1 July 2019 - - - - - - - -Accumulated depreciation at 1 July 2019 (187,403) (1,582) (75,522) (5,596) (7,993) (11,667) - (289,763)
194,234 5,101 75,282 13,096 50,418 22,191 64,646 424,967
Movements in fair valueAdditions - - - - - - 32,471 32,471Revaluation - - (70,832) - - (2,044) - (72,876)Write-off (4,574) - - - - - - (4,574)Transfers 11,730 - 4,242 6,100 19,061 2,464 (43,597) -Transfer between asset class - - - - - - (45,150) (45,150)
7,156 - (66,590) 6,100 19,061 420 (56,276) (90,129)
Movements in accumulated depreciationDepreciation (4,590) (130) (1,848) (799) (1,141) (1,353) - (9,860)Accumulated depreciation of disposals/write offs 3,089 - - - - - - 3,089Revaluation - - 77,370 - - 3,652 - 81,022
(1,501) (130) 75,522 (799) (1,141) 2,299 - 74,251
At fair value 30 June 2020 388,793 6,683 84,214 24,792 77,471 34,277 8,371 624,601Accumulated depreciation at 30 June 2020 (188,904) (1,712) - (6,394) (9,134) (9,367) - (215,513)
199,889 4,971 84,214 18,398 68,337 24,910 8,371 409,089
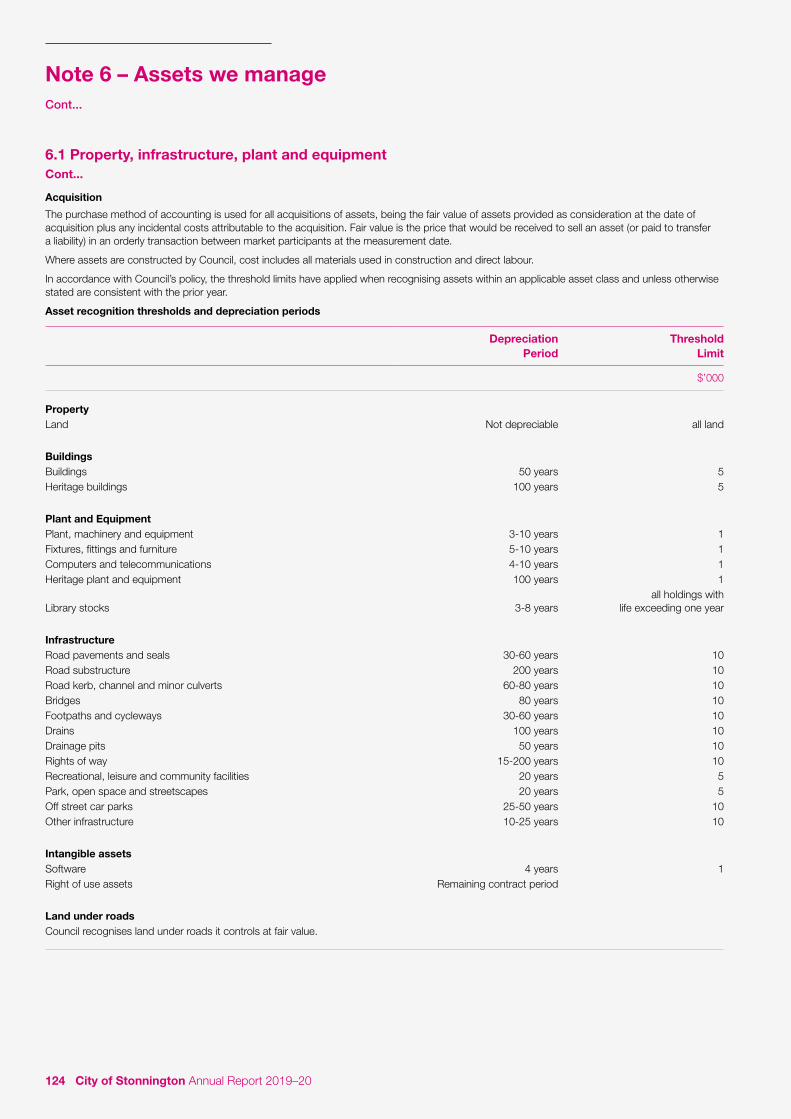
124 City of Stonnington Annual Report 2019–20
6.1 Property, infrastructure, plant and equipment Cont...
Acquisition
The purchase method of accounting is used for all acquisitions of assets, being the fair value of assets provided as consideration at the date of acquisition plus any incidental costs attributable to the acquisition. Fair value is the price that would be received to sell an asset (or paid to transfer a liability) in an orderly transaction between market participants at the measurement date.
Where assets are constructed by Council, cost includes all materials used in construction and direct labour.
In accordance with Council’s policy, the threshold limits have applied when recognising assets within an applicable asset class and unless otherwise stated are consistent with the prior year.
Asset recognition thresholds and depreciation periods
Depreciation Period
Threshold Limit
$’000
PropertyLand Not depreciable all land
BuildingsBuildings 50 years 5Heritage buildings 100 years 5
Plant and EquipmentPlant, machinery and equipment 3-10 years 1Fixtures, fittings and furniture 5-10 years 1Computers and telecommunications 4-10 years 1Heritage plant and equipment 100 years 1
Library stocks 3-8 yearsall holdings with
life exceeding one year
InfrastructureRoad pavements and seals 30-60 years 10Road substructure 200 years 10Road kerb, channel and minor culverts 60-80 years 10Bridges 80 years 10Footpaths and cycleways 30-60 years 10Drains 100 years 10Drainage pits 50 years 10Rights of way 15-200 years 10Recreational, leisure and community facilities 20 years 5Park, open space and streetscapes 20 years 5Off street car parks 25-50 years 10Other infrastructure 10-25 years 10
Intangible assetsSoftware 4 years 1Right of use assets Remaining contract period
Land under roadsCouncil recognises land under roads it controls at fair value.
Note 6 – Assets we manageCont...

125Annual Financial Report
Depreciation and amortisation
Buildings, plant and equipment, infrastructure, and other assets having limited useful lives are systematically depreciated over their useful lives to Council in a manner which reflects consumption of the service potential embodied in those assets. Estimates of remaining useful lives and residual values are made on a regular basis with major asset classes reassessed annually. Depreciation rates and methods are reviewed annually.
Where assets have separate identifiable components that are subject to regular replacement, these components are assigned distinct useful lives and residual values and a separate depreciation rate is determined for each component.
Road earthworks are not depreciated on the basis that they are assessed as not having a limited useful life. Straight line depreciation is charged based on the residual useful life as determined each year.
Depreciation periods used are listed above and are consistent with the prior year unless otherwise stated.
Repairs and maintenance
Where the repair relates to the replacement of a component of an asset and the cost exceeds the capitalisation threshold the cost is capitalised and depreciated. The carrying value of the replaced asset is expensed.
Valuation of land and buildings
The market is being impacted by the uncertainty caused by the COVID-19 pandemic. As at the date of valuation we consider that there is market uncertainty resulting in significant valuation uncertainty. This valuation is therefore reported on the basis of ‘significant valuation uncertainty’. As a result, less certainty exists than normal and a higher degree of caution should be attached to the valuation given the environment and future impact that COVID-19 might have on markets.
This valuation is current at the date of valuation only. The value assessed herein may change significantly and unexpectedly over a relatively short period of time as a result of factors that the Valuer could not reasonably have been aware of as at the date of valuation.
Full valuation of land and buildings were undertaken by Mr D.Thai, AAPI CPV (Australian Property Institute Member no. 3029). The valuation of land and buildings is at fair value, being market value based on highest and best use permitted by relevant land planning provisions.
Where land use is restricted through existing planning provisions the valuation is reduced to reflect this limitation. This adjustment is an unobservable input in the valuation. The adjustment has no impact on the Comprehensive Income Statement.
To the extent that non-specialised land and non-specialised buildings do not contain significant, unobservable adjustments, these assets are classified as Level 2 under the market based direct comparison approach.
Specialised land or land under roads is valued at fair value using site values adjusted for englobo (undeveloped and/or unserviced) characteristics, access rights and private interests of other parties and entitlements of infrastructure assets and services. This adjustment is an unobservable input in the valuation. The adjustment has no impact on the Comprehensive Income Statement.
Any significant movements in the unobservable inputs for land and land under roads will have a significant impact on the fair value of these assets.
The date of the current valuation is detailed in the following table.
Details of Council’s land and buildings and information about the fair value hierarchy as at 30 June 2020 are as follows:
Level 1 Level 2 Level 3 Date of Valuation
$’000 $’000 $’000
Land – non specialised - 163,905 - 06/20Land – specialised - - 1,382,530 06/20Land under roads - - 681,300 06/20Buildings – non specialised - 17,571 - 06/20Buildings – specialised - - 239,219 06/20
Total - 181,476 2,303,048
Definitions of the fair value hierarchy outlined in Note 8.4.
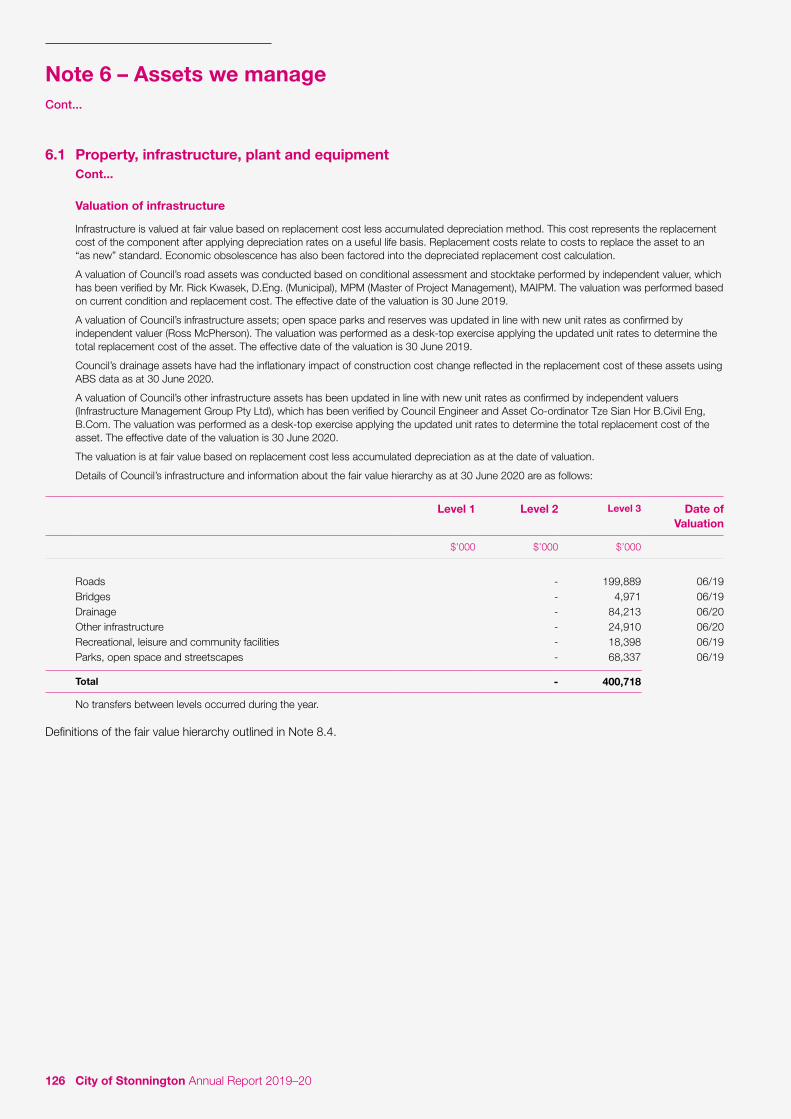
126 City of Stonnington Annual Report 2019–20
6.1 Property, infrastructure, plant and equipment Cont...
Valuation of infrastructure
Infrastructure is valued at fair value based on replacement cost less accumulated depreciation method. This cost represents the replacement cost of the component after applying depreciation rates on a useful life basis. Replacement costs relate to costs to replace the asset to an “as new” standard. Economic obsolescence has also been factored into the depreciated replacement cost calculation.
A valuation of Council’s road assets was conducted based on conditional assessment and stocktake performed by independent valuer, which has been verified by Mr. Rick Kwasek, D.Eng. (Municipal), MPM (Master of Project Management), MAIPM. The valuation was performed based on current condition and replacement cost. The effective date of the valuation is 30 June 2019.
A valuation of Council’s infrastructure assets; open space parks and reserves was updated in line with new unit rates as confirmed by independent valuer (Ross McPherson). The valuation was performed as a desk-top exercise applying the updated unit rates to determine the total replacement cost of the asset. The effective date of the valuation is 30 June 2019.
Council’s drainage assets have had the inflationary impact of construction cost change reflected in the replacement cost of these assets using ABS data as at 30 June 2020.
A valuation of Council’s other infrastructure assets has been updated in line with new unit rates as confirmed by independent valuers (Infrastructure Management Group Pty Ltd), which has been verified by Council Engineer and Asset Co-ordinator Tze Sian Hor B.Civil Eng, B.Com. The valuation was performed as a desk-top exercise applying the updated unit rates to determine the total replacement cost of the asset. The effective date of the valuation is 30 June 2020.
The valuation is at fair value based on replacement cost less accumulated depreciation as at the date of valuation.
Details of Council’s infrastructure and information about the fair value hierarchy as at 30 June 2020 are as follows:
Level 1 Level 2 Level 3 Date of Valuation
$’000 $’000 $’000
Roads - 199,889 06/19Bridges - 4,971 06/19Drainage - 84,213 06/20Other infrastructure - 24,910 06/20Recreational, leisure and community facilities - 18,398 06/19Parks, open space and streetscapes - 68,337 06/19
Total - 400,718
No transfers between levels occurred during the year.
Definitions of the fair value hierarchy outlined in Note 8.4.
Note 6 – Assets we manageCont...

127Annual Financial Report
Valuation of heritage assets – arts and antiques
Council underwent a valuation of artworks, antiques and public artworks in accordance with AASB 13 - Fair value measurement in 2019. The value of these assets are determined in accordance with an independent valuation undertaken by McWilliam Associates, Colin Mc William (Registered Valuer No: 384) on council’s fine arts, public sculptures and other artworks and by Peter Tinslay (Registered Valuer No: 613) on council’s historical assets. Input data for the valuation was derived from values of like or similar material found by research of records of Australian and international sales, purchases and other forms of acquisition, knowledge of prices paid by other institutions and valuation experience of other Council’s Collections. Heritage assets acquired over the 2019–20 financial year have been recognised at cost. Council’s Fine Art (comprising furniture, decorative arts and archives) and New Art Asset Collections have been determined by the valuer as requiring level 3 (unobservabke) inputs to determine their valuation. The specific nature of these colections are that there are fewer observable sales of like or similar items for these assets.
Level 1 Level 2 Level 3 Date of Valuation
$’000 $’000 $’000
Heritage, plant and equipment - 3,346 4,082 06/19
Total - 3,346 4,082
Description of significant unobservable inputs into level 3 valuations
Specialised land and land under roads is valued using a market based direct comparison technique. Significant unobservable inputs include the extent and impact of restriction of use and the market cost of land per square metre. The extent and impact of restrictions on use varies and results in a reduction to surrounding land values between 5% and 95%. The market value of land varies significantly depending on the location of the land and the current market conditions. Currently land values range between $160 and $5,500 per square metre.
Specialised buildings are valued using a depreciated replacement cost technique. Significant unobservable inputs include the current replacement cost and remaining useful lives of buildings. Current replacement costs is calculated on a square metre basis and ranges from $1,350 to $8,650 per square metre. The remaining useful lives of buildings are determined on the basis of the current condition of buildings and vary from 50 years to 100 years. Replacement cost is sensitive to changes in market conditions, with any increase or decrease in cost flowing through to the valuation. Useful lives of buildings are sensitive to changes in expectations or requirements that could either shorten or extend the useful lives of buildings.
Infrastructure assets are valued based on the depreciated replacement cost. Significant unobservable inputs include the current replacement cost and remaining useful lives of infrastructure. Current replacement costs is calculated on a cost per unit per linear metre basis and ranges from $18 to $500 per linear metre. The remaining useful lives of infrastructure assets are determined on the basis of the current condition of the asset and vary from 10 years to 200 years. Replacement cost is sensitive to changes in market conditions, with any increase or decrease in cost flowing through to the valuation. Useful lives of infrastructure are sensitive to changes in use, expectations or requirements that could either shorten or extend the useful lives of infrastructure assets.
2020 2019
$’000 $’000
Reconciliation of specialised landLand under roads 681,300 686,150Land 1,382,530 1,371,332
Total specialised land 2,063,830 2,057,482
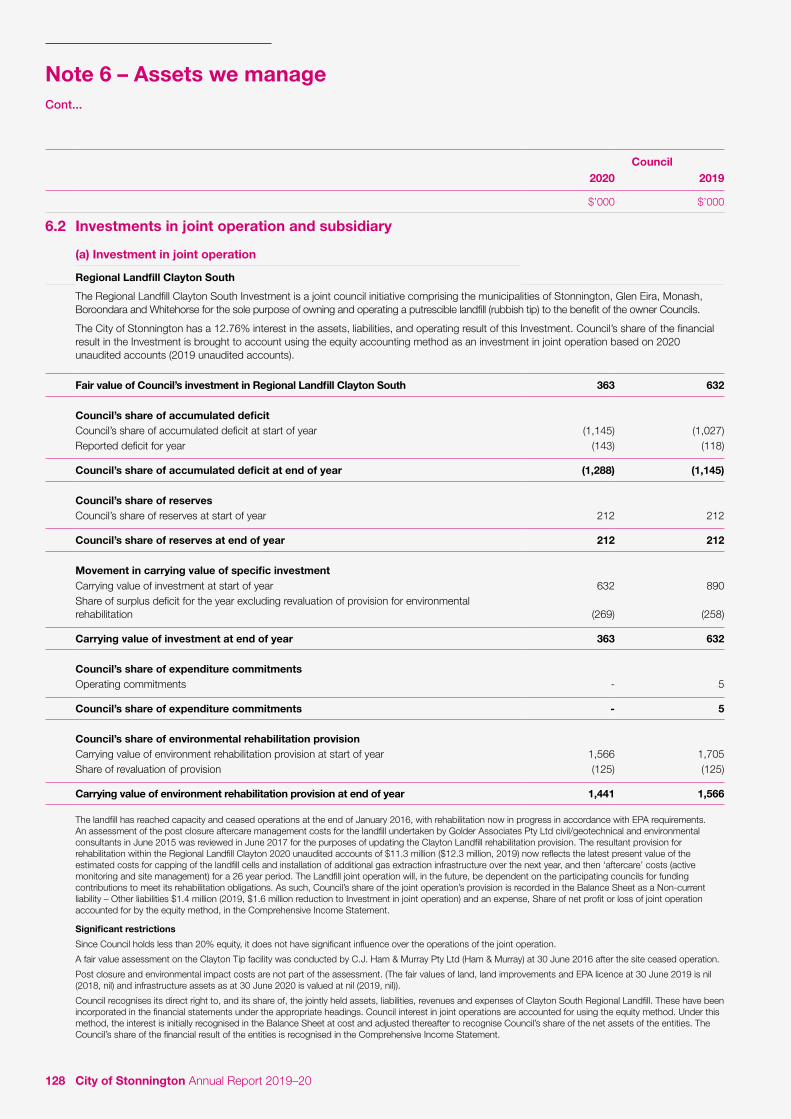
128 City of Stonnington Annual Report 2019–20
Council2020 2019
$’000 $’000
6.2 Investments in joint operation and subsidiary
(a) Investment in joint operation
Regional Landfill Clayton South
The Regional Landfill Clayton South Investment is a joint council initiative comprising the municipalities of Stonnington, Glen Eira, Monash, Boroondara and Whitehorse for the sole purpose of owning and operating a putrescible landfill (rubbish tip) to the benefit of the owner Councils.
The City of Stonnington has a 12.76% interest in the assets, liabilities, and operating result of this Investment. Council’s share of the financial result in the Investment is brought to account using the equity accounting method as an investment in joint operation based on 2020 unaudited accounts (2019 unaudited accounts).
Fair value of Council’s investment in Regional Landfill Clayton South 363 632
Council’s share of accumulated deficitCouncil’s share of accumulated deficit at start of year (1,145) (1,027)Reported deficit for year (143) (118)
Council’s share of accumulated deficit at end of year (1,288) (1,145)
Council’s share of reservesCouncil’s share of reserves at start of year 212 212
Council’s share of reserves at end of year 212 212
Movement in carrying value of specific investmentCarrying value of investment at start of year 632 890Share of surplus deficit for the year excluding revaluation of provision for environmental rehabilitation (269) (258)
Carrying value of investment at end of year 363 632
Council’s share of expenditure commitmentsOperating commitments - 5
Council’s share of expenditure commitments - 5
Council’s share of environmental rehabilitation provisionCarrying value of environment rehabilitation provision at start of year 1,566 1,705Share of revaluation of provision (125) (125)
Carrying value of environment rehabilitation provision at end of year 1,441 1,566
The landfill has reached capacity and ceased operations at the end of January 2016, with rehabilitation now in progress in accordance with EPA requirements. An assessment of the post closure aftercare management costs for the landfill undertaken by Golder Associates Pty Ltd civil/geotechnical and environmental consultants in June 2015 was reviewed in June 2017 for the purposes of updating the Clayton Landfill rehabilitation provision. The resultant provision for rehabilitation within the Regional Landfill Clayton 2020 unaudited accounts of $11.3 million ($12.3 million, 2019) now reflects the latest present value of the estimated costs for capping of the landfill cells and installation of additional gas extraction infrastructure over the next year, and then ‘aftercare’ costs (active monitoring and site management) for a 26 year period. The Landfill joint operation will, in the future, be dependent on the participating councils for funding contributions to meet its rehabilitation obligations. As such, Council’s share of the joint operation’s provision is recorded in the Balance Sheet as a Non-current liability – Other liabilities $1.4 million (2019, $1.6 million reduction to Investment in joint operation) and an expense, Share of net profit or loss of joint operation accounted for by the equity method, in the Comprehensive Income Statement.
Significant restrictions
Since Council holds less than 20% equity, it does not have significant influence over the operations of the joint operation.
A fair value assessment on the Clayton Tip facility was conducted by C.J. Ham & Murray Pty Ltd (Ham & Murray) at 30 June 2016 after the site ceased operation.
Post closure and environmental impact costs are not part of the assessment. (The fair values of land, land improvements and EPA licence at 30 June 2019 is nil (2018, nil) and infrastructure assets as at 30 June 2020 is valued at nil (2019, nil)).
Council recognises its direct right to, and its share of, the jointly held assets, liabilities, revenues and expenses of Clayton South Regional Landfill. These have been incorporated in the financial statements under the appropriate headings. Council interest in joint operations are accounted for using the equity method. Under this method, the interest is initially recognised in the Balance Sheet at cost and adjusted thereafter to recognise Council’s share of the net assets of the entities. The Council’s share of the financial result of the entities is recognised in the Comprehensive Income Statement.
Note 6 – Assets we manageCont...

129Annual Financial Report
(b) Subsidiary
Prahran Market Pty Ltd
Prahran Market Pty Ltd is a wholly owned subsidiary, incorporated within Australia, of the City of Stonnington. Prahran Market Pty Ltd manages the retail activities of the Prahran Market for the City of Stonnington on terms set out in a management agreement between both parties dated 30 March 2008.
In response to the COVID-19 pandemic, Council provided rent abatement to Prahran Market of $0.29 million as at 30 June 2020 with intention to perform another review post balance date as the COVID-19 crisis continues to evolve.
The assets, liabilities, and operating result based upon 2020 unaudited financial statements (2019 unaudited financial statements) are included in Council’s consolidated financial accounts, as follows:
Summarised financial information 2020 2019
$’000 $’000
Summarised statement of comprehensive incomeTotal income 4,991 4,907Total expenses 4,871 4,808Surplus/(deficit) for the year 120 99
Total comprehensive result 120 99
Summarised balance sheetCurrent assets 2,059 1,291Non-current assets 5,869 6,110
Total assets 7,928 7,401
Current liabilities 701 498Non-current liabilities 57 55Total liabilities 758 552
Net Assets 7,170 6,849
Equity
Accumulated funds 5,170 4,849Issued capital 2,000 2,000
Total Equity 7,170 6,849
Summarised statement of cash flows
Net cash provided by operating activities 217 438Net cash used in investing activities (55) (18)Net cash used in financing activities 10 (49)
Net increase/(decrease) in cash and cash equivalents 172 370
Principles of consolidation
The consolidated financial statements of Council incorporates all entities controlled by Council as at 30 June 2020, and their income and expenses for that part of the reporting period in which control existed. Transactions and balances within the consolidated group are eliminated.
Subsidiaries are all entities over which Council has control. Council controls an entity when it is exposed to, or has rights to, variable returns from its involvement with the entity and has the ability to affect those returns through its power to direct the activities of the entity. Subsidiaries are fully consolidated from the date on which control is transferred to Council. They are deconsolidated from the date that control ceases.
Where dissimilar accounting policies are adopted by entities and their effect is considered material, adjustments are made to ensure consistent policies are adopted in these financial statements.
The Prahran Market Pty Ltd is the only subsidiary and controlled entity consolidated into Council.

130 City of Stonnington Annual Report 2019–20
6.3 Investment property
Council Consolidated2020 2019 2020 2019
$’000 $’000 $’000 $’000
Balance at beginning of the financial year 9,100 11,200 9,100 11,200Additions - 1,646 - 1,646Net transfer to land and building - (3,180) - (3,180)Fair value adjustments (1,615) (566) (1,615) (566)
Balance at end of financial year 7,485 9,100 7,485 9,100
Investment property is held to generate long-term rental yields. Investment property is measured initially at cost, including transaction costs. Costs incurred subsequent to initial acquisition are capitalised when it is probable that future economic benefit in excess of the originally assessed performance of the asset will flow to Council. Subsequent to initial recognition at cost, investment property is carried at fair value, determined annually by independent valuers. Changes to fair value are recorded in the Comprehensive Income Statement in the period that they arise.
Valuation of investment property
The valuation of investment property has been determined annually by Council valuer, Mr D. Thai AAPI CPV (Australian Property Institute Member no. 3029). All tenant leases are on arm’s length basis. Investment property is carried at fair value being $7.5 million (2019, 9.1 million), based on the current market value of the property.
Note 6 – Assets we manageCont...

131Annual Financial Report

132 City of Stonnington Annual Report 2019–20
7.1 Council and key management remuneration
(a) Related parties
Parent entity Stonnington City Council is the parent entity.
Subsidiaries Interests in subsidiary are detailed in note 6.2.
(b) Key management personnel
Details of persons holding the position of Councillor or other members of key management personnel at any time during the year are:
Councillors Councillor Steve Stefanopoulos (Mayor 1 July 2019 – 30 June 2020)
Councillor Jami Klisaris (1 July 2019 – 30 June 2020)
Councillor John Chandler (1 July 2019 – 30 June 2020)
Councillor Melina Sehr (1 July 2019 – 30 June 2020)
Councillor Matthew Koce (1 July 2019 – 30 June 2020)
Councillor Glen Atwell (1 July 2019 – 30 June 2020)
Councillor Judy Hindle (1 July 2019 – 30 June 2020)
Councillor Marcia Griffin (1 July 2019 – 30 June 2020)
Councillor Sally Davis (1 July 2019 – 30 June 2020)
Chief Executive Officer Ms Jacqui Weatherill (22 July 2019 – 30 June 2020)
Interim Chief Executive Officer
Mr Simon Thomas (1 July – 19 July 2019)
Director Mr Geoff Cockram Director Corporate Services (1 July 2019 – 24 March 2020)
Mr Christopher Balfour Director Corporate Services (25 March – 30 June 2020)
Mr Rick Kwasek Director Environment and Infrastructure (1 July 2019 – 30 June 2020)
Mr Stuart Draffin Director Planning and Place (1 July 2019 – 30 June 2020)
Ms Cath Harrod Director Community and Wellbeing (1 July 2019 – 30 June 2020)
Mr Greg Curcio Director Engagement and Innovation (24 March – 30 June 2020)
Council 2020 2019
No. No.
Total number of Councillors 9 9Total of Chief Executive Officer and other key management personnel 8 6
Total key management personnel 17 15
Note 7 – People and relationships
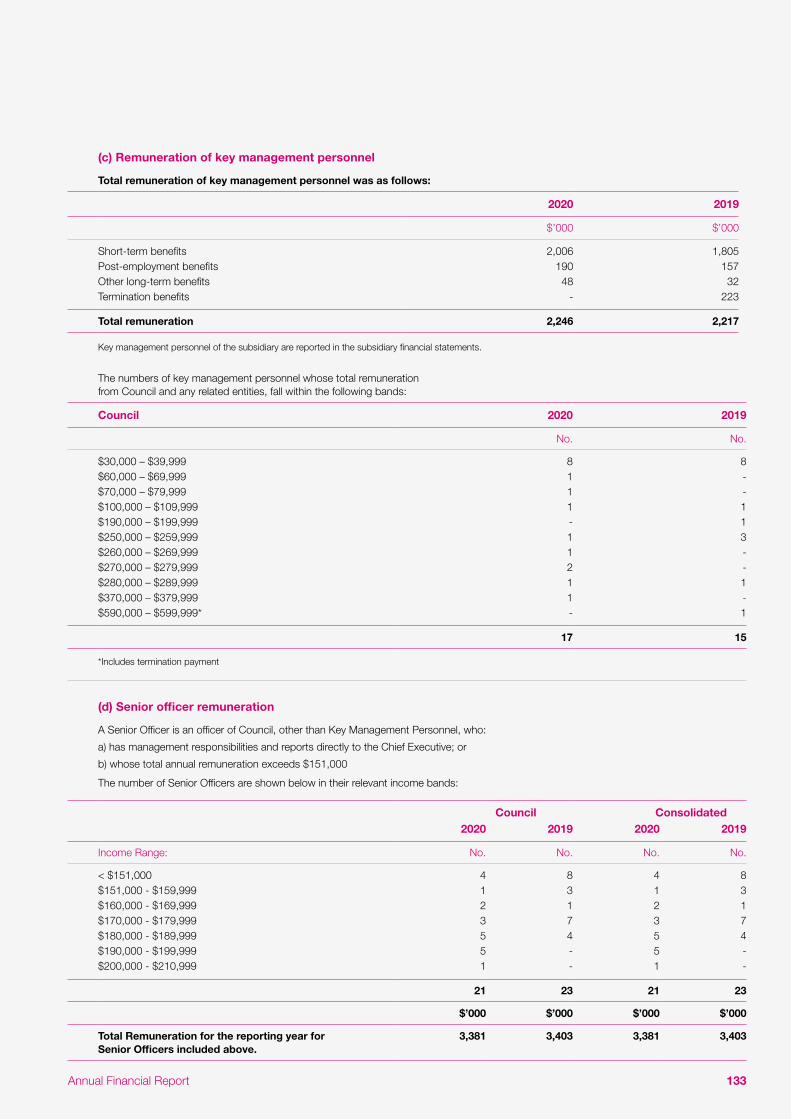
133Annual Financial Report
(c) Remuneration of key management personnel
Total remuneration of key management personnel was as follows:
2020 2019
$’000 $’000
Short-term benefits 2,006 1,805Post-employment benefits 190 157Other long-term benefits 48 32Termination benefits - 223
Total remuneration 2,246 2,217
Key management personnel of the subsidiary are reported in the subsidiary financial statements.
The numbers of key management personnel whose total remuneration from Council and any related entities, fall within the following bands:
Council 2020 2019
No. No.
$30,000 – $39,999 8 8$60,000 – $69,999 1 -$70,000 – $79,999 1 -$100,000 – $109,999 1 1$190,000 – $199,999 - 1$250,000 – $259,999 1 3$260,000 – $269,999 1 -$270,000 – $279,999 2 -$280,000 – $289,999 1 1$370,000 – $379,999 1 -$590,000 – $599,999* - 1
17 15
*Includes termination payment
(d) Senior officer remuneration
A Senior Officer is an officer of Council, other than Key Management Personnel, who:
a) has management responsibilities and reports directly to the Chief Executive; or
b) whose total annual remuneration exceeds $151,000
The number of Senior Officers are shown below in their relevant income bands:
Council Consolidated2020 2019 2020 2019
Income Range: No. No. No. No.
< $151,000 4 8 4 8$151,000 - $159,999 1 3 1 3$160,000 - $169,999 2 1 2 1$170,000 - $179,999 3 7 3 7$180,000 - $189,999 5 4 5 4$190,000 - $199,999 5 - 5 -$200,000 - $210,999 1 - 1 -
21 23 21 23
$’000 $’000 $’000 $’000
Total Remuneration for the reporting year for Senior Officers included above.
3,381 3,403 3,381 3,403

134 City of Stonnington Annual Report 2019–20
7.2 Related party disclosure
(a) Transactions with related parties
During the period Council entered into the following transactions with related parties.
Type of transaction Terms Aggregate Amount (incl GST)
$’000
Rental, Council rates, garbage collection fees and reimbursements from Prahran Market Pty Ltd
Management agreement 1,396
Other revenue from Prahran Market Pty Ltd Letter of Agreement 26
Base rent paid to Prahran Market Pty Ltd Rental agreement 29
Reimbursement for capital improvements undertaken at Prahran Market
Management agreement 248
(b) Outstanding balances with related parties
The following balance is outstanding at the end of the reporting period in relation to transactions with related parties.
Type of transaction Terms Aggregate Amount (incl GST)
$’000
Amounts receivable from Prahran Market Pty Ltd Memorandum of understanding 141
Capital contribution outstanding to Prahran Market Pty Ltd Memorandum of understanding 62
(c) Loans to/from related parties
There are no outstanding loans to/from related parties.
(d) Commitments to/from related parties
Prahran Market Pty Ltd has a Management Agreement with Stonnington City Council which is in overholding.
Prahran Market Pty Ltd had a variation of Lease Agreement with Stonnington City Council until 30 June 2019. This is in overholding from 1 July 2019.
Note 7 – People and relationshipsCont...

135Annual Financial Report
8.1 Contingent assets and contingent liabilities
(a) Contingent assets
Legal matters
The Council is presently involved in several confidential legal matters, which are being conducted through Council’s solicitors. The remaining matters are not yet finalised, the financial outcome of these matters cannot be reliably estimated and no allowance for these contingencies has been made in the financial report (30 June 2019, same position).
Operating lease receivables
Council has entered into commercial property leases on its investment property, consisting of surplus freehold office complexes. These properties held under operating leases have remaining non-cancellable lease terms of between 1 and 10 years. All leases include a CPI based revision of the rental charge annually.
Future minimum rentals receivable under non-cancellable operating leases are as follows:
Council Consolidated2020 2019 2020 2019
$’000 $’000 $’000 $’000
Not later than one year 395 395 395 395
395 395 395 395
(b) Contingent liabilities
Legal matters
Council is presently involved in several confidential legal matters, which are being conducted through Council’s solicitors.
As these matters are yet to be finalised, and the financial outcomes are unable to be reliably estimated, no allowance for these contingencies has been made in the financial report (30 June 2019, same position).
Superannuation
Council has obligations under a defined benefit superannuation scheme that may result in the need to make additional contributions to the scheme, matters relating to this potential obligation are outlined in Note 9.3. As a result of the volatility in financial markets the likelihood of making such contributions in future periods exists. At this point in time it is not known if additional contributions will be required, their timing or potential amount.
Liability Mutual Insurance
Council is a participant of the MAV Liability Mutual Insurance (LMI) Scheme. The LMI scheme provides public liability and professional indemnity insurance cover. The LMI scheme states that each participant will remain liable to make further contributions to the scheme in respect of any insurance year in which it was a participant to the extent of its participant’s share of any shortfall in the provision set aside in respect of that insurance year, and such liability will continue whether or not the participant remains a participant in future insurance years.
MAV Workcare
Council is a participant of the MAV WorkCare Scheme. The MAV WorkCare scheme provides workers compensation insurance. The MAV WorkCare Scheme states that each participant will remain liable to make further contributions to the scheme in respect of any insurance year in which it was a participant to the extent of its participant’s share of any shortfall in the provision set aside in respect of that insurance year, and such liability will continue whether or not the participant remains a participant in future insurance years.
Note 8 – Managing uncertainties
136 City of Stonnington Annual Report 2019–20
8.2 Change in accounting standards
The following new AAS’s have been issued that are not mandatory for the 30 June 2020 reporting period. Council has assessed these pending standards and has identified the following potential impacts will flow from the application of these standards in future reporting periods.
AASB 1059 Service Concession Arrangements: Grantors (AASB 1059) (applies 2020-21 for LG Sector)
AASB 1059 addresses the accounting for a service concession arrangement by a grantor that is a public sector entity by prescribing the accounting for the arrangement from the grantor’s perspective. It requires the grantor to:
» recognise a service concession asset constructed, developed or acquired from a third party by the operator, including an upgrade to an existing asset of the grantor, when the grantor controls the asset
» reclassify an existing asset (including recognising previously unrecognised identifiable intangible assets and land under roads) as a service concession asset when it meets the criteria for recognition as a service concession asset
» initially measure a service concession asset constructed, developed or acquired by the operator or reclassified by the grantor at current replacement cost in accordance with the cost approach to fair value in AASB 13 Fair Value Measurement. Subsequent to the initial recognition or reclassification of the asset, the service concession asset is accounted for in accordance with AASB 116 Property, Plant and Equipment or AASB 138 Intangible Assets, as appropriate, except as specified AASB 1059
» recognise a corresponding liability measured initially at the fair value (current replacement cost) of the service concession asset, adjusted for any other consideration between the grantor and the operator, and
» disclose sufficient information to enable users of financial statements to understand the nature, amount, timing and uncertainty of assets, liabilities, revenue and cash flows arising from service concession arrangements.
Based on the Council’s current assessment, there is expected to be no impact on the transactions and balances recognised in the financial statements as the Council is not a grantor in a service concession arrangement.
AASB 2018-7 Amendments to Australian Accounting Standards – Definition of Material (applies 2020-21 for LG Sector)
The Standard principally amends AASB 101 Presentation of Financial Statements and AASB 108 Accounting Policies, Changes in Accounting Estimates and Errors. The amendments refine the definition of material in AASB 101. The amendments clarify the definition of material and its application by improving the wording and aligning the definition across AASB Standards and other publications. The impacts on the local government sector are expected to be minimal.
AASB 2019-1 Amendments to Australian Accounting Standards – References to the Conceptual Framework (applies 2020-21 for LG Sector)
This Standard sets out amendments to Australian Accounting Standards, Interpretations and other pronouncements to reflect the issuance of the Conceptual Framework for Financial Reporting (Conceptual Framework) by the AASB. The impacts on the local government sector are expected to be minimal.
Note 8 – Managing uncertaintiesCont...

137Annual Financial Report
8.3 Financial instruments
(a) Objectives and policies
Council’s principal financial instruments comprise cash assets, term deposits, receivables (excluding statutory receivables), payables (excluding statutory payables) and bank borrowings. Details of the significant accounting policies and methods adopted, including the criteria for recognition, the basis of measurement and the basis on which income and expenses are recognised, in respect of each class of financial asset, financial liability and equity instrument is disclosed in the Notes of the financial statements. Risk management is carried out by senior management under policies approved by Council. These policies include identification and analysis of the risk exposure to Council and appropriate procedures, controls and risk minimisation.
(b) Market risk
Market risk is the risk that the fair value or future cash flows of Council financial instruments will fluctuate because of changes in market prices. Council’s exposure to market risk is primarily through interest rate risk with only insignificant exposure to other price risks and no exposure to foreign currency risk.
Interest rate risk
Interest rate risk refers to the risk that the value of a financial instrument or cash flows associated with the instrument will fluctuate due to changes in market interest rates. Council does not hold any interest bearing financial instruments that are measured at fair value, and therefore has no exposure to fair value interest rate risk. Cash flow interest rate risk is the risk that the future cash flows of a financial instrument will fluctuate because of changes in market interest rates. Council has minimal exposure to cash flow interest rate risk through its cash and deposits that are at floating rates.
Investment of surplus funds is made with approved financial institutions under the Local Government Act 1989. We manage interest rate risk by adopting an investment policy that ensures:
» diversification of investment product,
» monitoring of return on investment, and
» benchmarking of returns and comparison with budget.
There has been no significant change in Council’s exposure, or its objectives, policies and processes for managing interest rate risk or the methods used to measure this risk from the previous reporting period.
The declining interest rate may have altered as a result of changed business conditions under COVID-19, however the duration as well as the effectiveness of government and reserve bank responses remains unclear at this time. Interest rate movements have not been sufficiently significant during the year to have an impact on Council’s year end result.
(c) Credit risk
Credit risk is the risk that a contracting entity will not complete its obligations under a financial instrument and cause us to make a financial loss. We have exposure to credit risk on some financial assets included in our Balance Sheet. To help manage this risk:
» we have a policy for establishing credit limits for the entities we deal with
» we may require collateral where appropriate, and
» we only invest surplus funds with financial institutions which have a recognised credit rating specified in our investment policy.
Receivables consist of a large number of customers, spread across the ratepayer, business and government sectors. Credit risk associated with Council’s other financial assets is minimal. Rates debtors are secured by a charge over the rateable property. Council has assessed that 94% of parking infringement debts owing to Council are unlikely to be collected and has raised a provision for doubtful debts over those debts based on an assessment of collectability. The collection of long overdue parking infringement debts is managed by Fines Victoria.
The City of Stonnington Rates Financial Hardship Policy provides various options to assist ratepayers in financial distress, such as rate concessions, charge and interest deferral, payment options and interest waivers. The Rates Financial Hardship Policy continued to apply with the following amendments in response to the COVID-19 pandemic: In response to the COVID-19 state of emergency, interest and other additional fees will not be charged on overdue rates for the period of 16 March to 31 December 2020.
There are no material financial assets which are individually determined to be impaired.
We may also be subject to credit risk for transactions which are not included in the Balance Sheet, such as when we provide a guarantee for another party. Details of our contingent liabilities are disclosed in note 8.1 (b).
The maximum exposure to credit risk at the reporting date to recognised financial assets is the carrying amount, net of any provisions for impairment of those assets, as disclosed in the Balance Sheet and notes to the financial statements. Council does not hold any collateral other than that related to Council rates and charges. In the event that a ratepayer fails to pay their rates and charges, Council has the power to register a charge over the rateable property. By registering the charge over the rateable property, Council has priority over any other encumbrances on the property.

138 City of Stonnington Annual Report 2019–20
(d) Liquidity risk
Liquidity risk includes the risk that, as a result of our operational liquidity requirements we will not have sufficient funds to settle a transaction when required or we will be forced to sell a financial asset at below value or may be unable to settle or recover a financial asset.
To help reduce these risks Council:
» have a liquidity policy which targets a minimum and average level of cash and cash equivalents to be maintained
» have readily accessible standby facilities and other funding arrangements in place
» have a liquidity portfolio structure that requires surplus funds to be invested within various bands of liquid instruments
» monitor budget to actual performance on a regular basis, and
» set limits on borrowings relating to the percentage of loans to rate revenue and percentage of loan principal repayments to rate revenue.
Council’s maximum exposure to liquidity risk is the carrying amounts of financial liabilities as disclosed on the face of the balance sheet and the amounts related to any financial guarantees disclosed in Note 8.1(b), and is deemed insignificant based on prior periods’ data and current assessment of risk.
There has been no significant change in Council’s exposure, or its objectives, policies and processes for managing liquidity risk or the methods used to measure this risk from the previous reporting period.
With the exception of borrowings, all financial liabilities are expected to be settled within normal terms of trade. Details of the maturity profile for borrowings are disclosed at Note 5.4.
Unless otherwise stated, the carrying amounts of financial instruments reflect their fair value.
(e) Sensitivity disclosure analysis
Taking into account past performance, future expectations, economic forecasts, and management’s knowledge and experience of the financial markets, Council believes the following movements are ‘reasonably possible’ over the next 12 months:
» A parallel shift of + 0.5% and - 0.5% in market interest rates (AUD) from year-end rates of 1.00%.
These movements will not have a material impact on the valuation of Council’s financial assets and liabilities, nor will they have a material impact on the results of Council’s operations.
Note 8 – Managing uncertaintiesCont...
139Annual Financial Report
8.4 Fair value measurement
Fair value hierarchy
Council’s financial assets and liabilities are not valued in accordance with the fair value hierarchy. Council’s financial assets and liabilities are measured at amortised cost.
Council measures certain assets and liabilities at fair value where required or permitted by Australian Accounting Standards. AASB 13 Fair value measurement , aims to improve consistency and reduce complexity by providing a definition of fair value and a single source of fair value measurement and disclosure requirements for use across Australian Accounting Standards.
AASB 13 defines fair value as the price that would be received to sell an asset or paid to transfer a liability in an orderly transaction between market participants at the measurement date. Fair value under AASB 13 is an exit price regardless of whether that price is directly observable or estimated using another valuation technique.
All assets and liabilities for which fair value is measured or disclosed in the financial statements are categorised within a fair value hierarchy, described as follows, based on the lowest level input that is significant to the fair value measurement as a whole:
Level 1 — Quoted (unadjusted) market prices in active markets for identical assets or liabilities
Level 2 — Valuation techniques for which the lowest level input that is significant to the fair value measurement is directly or indirectly observable; and
Level 3 — Valuation techniques for which the lowest level input that is significant to the fair value measurement is unobservable.
For the purpose of fair value disclosures, Council has determined classes of assets and liabilities on the basis of the nature, characteristics and risks of the asset or liability and the level of the fair value hierarchy as explained above.
In addition, Council determines whether transfers have occurred between levels in the hierarchy by re-assessing categorisation (based on the lowest level input that is significant to the fair value measurement as a whole) at the end of each reporting period.
Revaluation
Subsequent to the initial recognition of assets, non-current physical assets, other than plant and equipment, are measured at their fair value, being the price that would be received to sell an asset (or paid to transfer a liability) in an orderly transaction between market participants at the measurement date. At balance date, Council reviewed the carrying value of the individual classes of assets measured at fair value to ensure that each asset materially approximated its fair value. Where the carrying value materially differed from the fair value at balance date, the class of asset was revalued.
Fair value valuations are determined in accordance with a valuation hierarchy. Changes to the valuation hierarchy will only occur if an external change in the restrictions or limitations of use of an asset result in changes to the permissible or practical highest and best use of the asset. In addition, Council undertakes a formal revaluation of land, buildings, and infrastructure assets on a regular basis ranging from 1 to 4 years. The valuation is performed either by experienced council officers or independent experts.
Where the assets are revalued, the revaluation increments are credited directly to the asset revaluation reserve except to the extent that an increment reverses a prior year decrement for that class of asset that had been recognised as an expense in which case the increment is recognised as revenue up to the amount of the expense. Revaluation decrements are recognised as an expense except where prior increments are included in the asset revaluation reserve for that class of asset in which case the decrement is taken to the reserve to the extent of the remaining increments. Within the same class of assets, revaluation increments and decrements within the year are offset.
Impairment of assets
At each reporting date, Council reviews the carrying value of its assets to determine whether there is any indication that these assets have been impaired. If such an indication exists, the recoverable amount of the asset, being the higher of the asset’s fair value less costs of disposal and value in use, is compared to the assets carrying value. Any excess of the assets carrying value over its recoverable amount is expensed to the Comprehensive Income Statement, unless the asset is carried at the revalued amount in which case, the impairment loss is recognised directly against the revaluation surplus in respect of the same class of asset to the extent that the impairment loss does not exceed the amount in the revaluation surplus for that same class of asset.
8.5 Events occurring after balance dateThe spread of COVID-19 has continued to severely impact Victoria’s economy after balance date, with many businesses being forced to cease or limit operations for long or indefinite periods of time.
On 2 August 2020, if you live in metropolitan Melbourne, Stage 4 restrictions were applied. Measures taken to contain the spread of the COVID-19, include travel bans, quarantines, social distancing, mandatory face masks and closures of non-essential services including schools and childcare unless permitted. These measures have triggered significant disruptions to businesses in Victoria, resulting in an economic slowdown.
The government has responded with monetary and fiscal interventions to stabilise economic conditions, however Council does not meet the criteria to access current government funding, nor the job keeper scheme.
Council has determined that these events are non-adjusting subsequent events. Accordingly, the financial position and results of operations as of and for the year ended 30 June 2020 have not been adjusted to reflect their impact.
The duration and impact of the COVID-19 pandemic, as well as the effectiveness of government responses, remains unclear at this time. It is not possible to reliably estimate the duration and severity of these consequences, as well as their impact on the financial position and results of the Council for future periods.
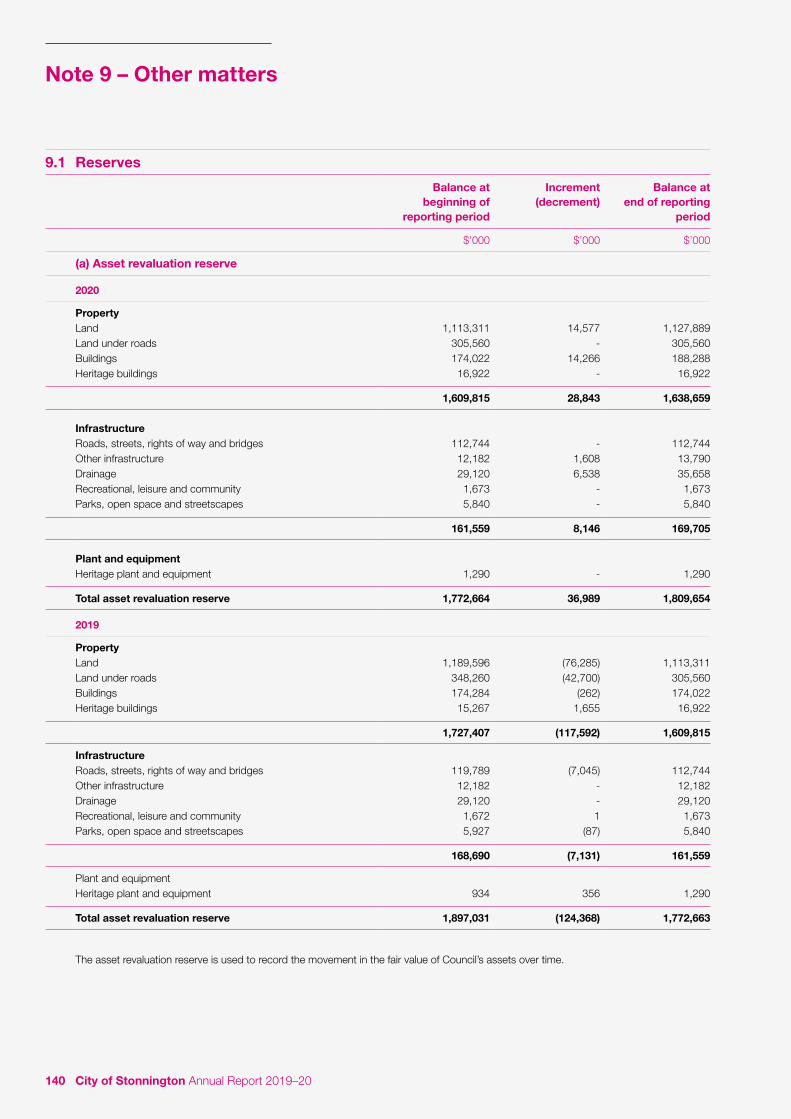
140 City of Stonnington Annual Report 2019–20
9.1 Reserves
Balance at beginning of
reporting period
Increment (decrement)
Balance at end of reporting
period
$’000 $’000 $’000
(a) Asset revaluation reserve
2020
PropertyLand 1,113,311 14,577 1,127,889Land under roads 305,560 - 305,560Buildings 174,022 14,266 188,288Heritage buildings 16,922 - 16,922
1,609,815 28,843 1,638,659
InfrastructureRoads, streets, rights of way and bridges 112,744 - 112,744Other infrastructure 12,182 1,608 13,790Drainage 29,120 6,538 35,658Recreational, leisure and community 1,673 - 1,673Parks, open space and streetscapes 5,840 - 5,840
161,559 8,146 169,705
Plant and equipmentHeritage plant and equipment 1,290 - 1,290
Total asset revaluation reserve 1,772,664 36,989 1,809,654
2019
PropertyLand 1,189,596 (76,285) 1,113,311Land under roads 348,260 (42,700) 305,560Buildings 174,284 (262) 174,022Heritage buildings 15,267 1,655 16,922
1,727,407 (117,592) 1,609,815
InfrastructureRoads, streets, rights of way and bridges 119,789 (7,045) 112,744Other infrastructure 12,182 - 12,182Drainage 29,120 - 29,120Recreational, leisure and community 1,672 1 1,673Parks, open space and streetscapes 5,927 (87) 5,840
168,690 (7,131) 161,559
Plant and equipmentHeritage plant and equipment 934 356 1,290
Total asset revaluation reserve 1,897,031 (124,368) 1,772,663
The asset revaluation reserve is used to record the movement in the fair value of Council’s assets over time.
Note 9 – Other matters

141Annual Financial Report
9.1 Reserves
Balance at beginning of
reporting period
Transfer from accumulated
surplus
Transfer to accumulated
surplus
Balance at end of
reporting period
Consolidated balance at end
of reporting period
$’000 $’000 $’000 $’000 $’000
(b) Other reserves
2020
Open Space Reserve 43,352 13,257 (3,935) 52,674 52,674Developer Contributions - - - - -Future Fund Reserve 19,578 3,000 (300) 22,278 22,278Infrastructure - Roads Damaged Reserve 251 - - 251 251
Total other reserves 63,181 16,257 (4,235) 75,203 75,203
2019
Open Space Reserve 46,267 17,481 (20,396) 43,352 43,352Future Fund Reserve 17,778 3,000 (1,200) 19,578 19,578Infrastructure – Roads Damaged Reserve 272 - (21) 250 250Park Reinstatement Reserve 710 - (710) - -
Total other reserves 65,027 20,481 (22,327) 63,181 63,181
The Open Space Reserve is used to record developer contributions and utilisation of this reserve is to purchase, create or enhance open space assets.
The Off-Street Parking Reserve is used to record contributions to off-street parking and funds the purchase or development of off-street parking assets.
The Developer Contributions Reserve is governed by the Developer Contributions Plan. It is used for the development of infrastructure in the Forrest Hill precinct.
The Future Fund Reserve is a reserve created to assist Council when making strategic property acquisitions, for major community infrastructure development opportunities and other specific one off purposes.
The Infrastructure - Roads Damaged Reserve is created to enable Council to utilise forfeited road asset protection and work zones maintenance bonds on road and infrastructure repair and maintenance.
The Park Reinstatement Reserve is created for recording of funds received as a result of occupation of Gardiner Park by VicRoads. Funds will be utilised to maintain and enhance Gardiner Park.

142 City of Stonnington Annual Report 2019–20
9.2 Reconciliation of cash flows from operating activities to surplus
Council Consolidated2020 2019 2020 2019
$’000 $’000 $’000 $’000
Surplus for the year 25,977 38,633 26,097 38,732
Depreciation/amortisation 20,790 19,280 21,079 19,582Loss on disposal of property, infrastructure, plant and equipment 2,117 4,351 2,124.88 4,360Share of net loss of joint operation accounted for by the equity method 143 118 143 118Loss of sale in investment equity 230 - 230 -Fair value adjustments for investment property 1,615 566 1,615 566Contributions – non monetary assets - (14) - (14)Rent abatement 361 - 361 -
Change in assets and liabilities in relation to operating activities:
Decrease in trade and other receivables (2,467) 70 (2,702) (22)(Increase)/decrease in prepayments 1,916 1,125 1,746 1,125Decrease in accrued income 167 (142) 167 (142)Increase in trade and other payables (1,856) 84 (1,673) 235(Decrease)/increase in other liabilities 4,160 839 4,139 822
Increase/(decrease) in provisions 360 478 405 463
Net cash provided by operating activities 53,513 65,388 53,730 65,825
9.3 Superannuation
Council makes the majority of its employer superannuation contributions in respect of its employees to the Local Authorities Superannuation Fund (Vision Super). This Fund has two categories of membership, accumulation and defined benefit, each of which is funded differently.
Accumulation
The Fund’s accumulation categories receive both employer and employee contributions on a progressive basis. Employer contributions are normally based on a fixed percentage of employee earnings (for the year ended 30 June 2020, this was 9.5% as required under Superannuation Guarantee legislation).
Defined Benefit
Council does not use defined benefit accounting for its defined benefit obligations under the Fund’s Defined Benefit category. This is because the Fund’s Defined Benefit category is a pooled multi-employer sponsored plan.
There is no proportional split of the defined benefit liabilities, assets or costs between the participating employers as the defined benefit obligation is a floating obligation between the participating employers and the only time that the aggregate obligation is allocated to specific employers is when a call is made. As a result, the level of participation of Council in the Fund cannot be measured as a percentage compared with other participating employers. Therefore, the Fund Actuary is unable to allocate benefit liabilities, assets and costs between employers for the purposes of AASB 119.
Funding arrangements
Council makes employer contributions to the Defined Benefit category of the Fund at rates determined by the Trustee on the advice of the Fund Actuary.
As at 30 June 2018, an interim actuarial investigation was held as the Fund provides lifetime pensions in the Defined Benefit category. The vested benefit index (VBI) of the Defined Benefit category of which Council is a contributing employer was 106.0%. The financial assumptions used to calculate the VBIs were:
Net investment returns 6.0% pa
Salary information 3.5% pa
Price inflation (CPI) 2.0% pa.
Vision Super has advised that the estimated VBI at 30 June 2020 was 104.6%.
The VBI is used as the primary funding indicator. Because the VBI was above 100%, the 30 June 2018 interim actuarial investigation determined the Defined Benefit category was in a satisfactory financial position and that no change was necessary to the Defined Benefit category’s funding arrangements from prior years.
Note 9 – Other mattersCont...

143Annual Financial Report
Employer contributions
Regular contributionsOn the basis of the results of the 2018 interim actuarial investigation conducted by the Fund Actuary, Council makes employer contributions to the Fund’s Defined Benefit category at rates determined by the Fund’s Trustee. For the year ended 30 June 2020, this rate was 9.5% of members’ salaries (9.5% in 2018–19). This rate will increase in line with any increases in the SG contribution rate. In addition, Council reimburses the Fund to cover the excess of the benefits paid as a consequence of retrenchment above the funded resignation or retirement benefit.
Funding callsIf the Defined Benefit category is in an unsatisfactory financial position at an actuarial investigation or the Defined Benefit category‘s VBI is below its shortfall limit at any time other than the date of the actuarial investigation, the Defined Benefit category has a shortfall for the purposes of SPS 160 and the Fund is required to put a plan in place so that the shortfall is fully funded within three years of the shortfall occurring. The Fund monitors its VBI on a quarterly basis and the Fund has set its shortfall limit at 97%.
In the event that the Fund Actuary determines that there is a shortfall based on the above requirement, the Fund’s participating employers (including Council) are required to make an employer contribution to cover the shortfall.
Using the agreed methodology, the shortfall amount is apportioned between the participating employers based on the pre-1 July 1993 and post-30 June 1993 service liabilities of the Fund’s Defined Benefit category, together with the employer’s payroll at 30 June 1993 and at the date the shortfall has been calculated.
Due to the nature of the contractual obligations between the participating employers and the Fund, and that the Fund includes lifetime pensioners and their reversionary beneficiaries, it is unlikely that the Fund will be wound up.
If there is a surplus in the Fund, the surplus cannot be returned to the participating employers.
In the event that a participating employer is wound-up, the defined benefit obligations of that employer will be transferred to that employer’s successor.
The 2018 interim actuarial investigation surplus amounts
An actuarial investigation is conducted annually for the Defined Benefit category of which Council is a contributing employer. Generally, a full actuarial investigation is conducted every three years and interim actuarial investigations are conducted for each intervening year. An interim investigation was conducted as at 30 June 2018 and a full actuarial investigation was conducted as at 30 June 2017.
The Fund’s actuarial investigations identified the following for the Defined Benefit category of which Council is a contributing employer:
2018 2017
$m $m
A VBI surplus 131.9 69.8A total service liability surplus 218.3 193.5A discounted accrued benefits surplus 249.1 228.8
The VBI surplus means that the market value of the fund’s assets supporting the defined benefit obligations exceed the vested benefits that the defined benefit members would have been entitled to if they had all exited on 30 June 2018.
The total service liability surplus means that the current value of the assets in the Fund’s Defined Benefit category plus expected future contributions exceeds the value of expected future benefits and expenses as at 30 June 2018.
The discounted accrued benefit surplus means that the current value of the assets in the Fund’s Defined Benefit category exceeds the value of benefits payable in the future but accrued in respect of service to 30 June 2018.
Council was notified of the 30 June 2018 VBI during August 2018. (2017: August 2017).
The 2019 interim actuarial investigation
An interim actuarial investigation is being conducted for the Fund’s position as at 30 June 2019 as the Fund provides lifetime pensions in the Defined Benefit category. It is anticipated that this actuarial investigation will be completed in October 2019.
Contributions by Council (excluding any unfunded liability payments) to the above superannuation plans for the financial year ended 30 June 2020 are detailed below:
2020 2019Scheme Type of Scheme Rate $’000 $’000
Vision super Defined benefit 9.50% 559 564Vision super Accumulation fund 9.50% 4,703 4,440
There were $0.06 million contributions outstanding as at 30 June 2020.
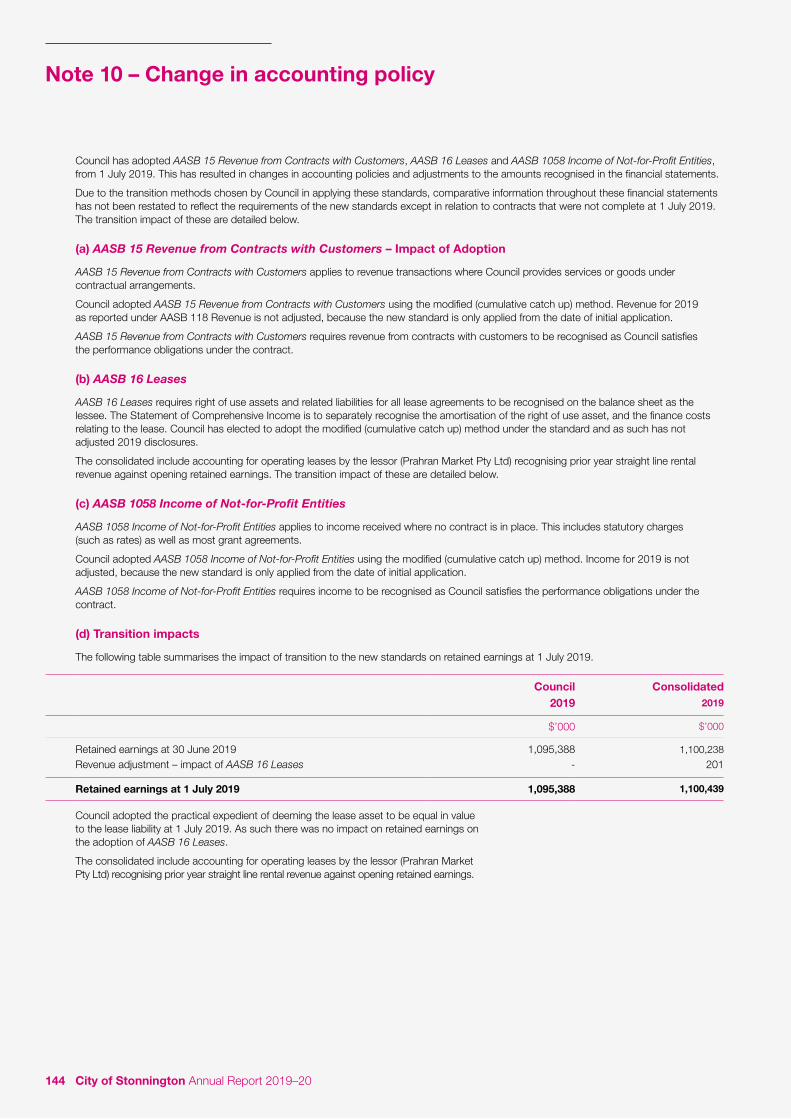
144 City of Stonnington Annual Report 2019–20
Council has adopted AASB 15 Revenue from Contracts with Customers, AASB 16 Leases and AASB 1058 Income of Not-for-Profit Entities, from 1 July 2019. This has resulted in changes in accounting policies and adjustments to the amounts recognised in the financial statements.
Due to the transition methods chosen by Council in applying these standards, comparative information throughout these financial statements has not been restated to reflect the requirements of the new standards except in relation to contracts that were not complete at 1 July 2019. The transition impact of these are detailed below.
(a) AASB 15 Revenue from Contracts with Customers – Impact of Adoption
AASB 15 Revenue from Contracts with Customers applies to revenue transactions where Council provides services or goods under contractual arrangements.
Council adopted AASB 15 Revenue from Contracts with Customers using the modified (cumulative catch up) method. Revenue for 2019 as reported under AASB 118 Revenue is not adjusted, because the new standard is only applied from the date of initial application.
AASB 15 Revenue from Contracts with Customers requires revenue from contracts with customers to be recognised as Council satisfies the performance obligations under the contract.
(b) AASB 16 Leases
AASB 16 Leases requires right of use assets and related liabilities for all lease agreements to be recognised on the balance sheet as the lessee. The Statement of Comprehensive Income is to separately recognise the amortisation of the right of use asset, and the finance costs relating to the lease. Council has elected to adopt the modified (cumulative catch up) method under the standard and as such has not adjusted 2019 disclosures.
The consolidated include accounting for operating leases by the lessor (Prahran Market Pty Ltd) recognising prior year straight line rental revenue against opening retained earnings. The transition impact of these are detailed below.
(c) AASB 1058 Income of Not-for-Profit Entities
AASB 1058 Income of Not-for-Profit Entities applies to income received where no contract is in place. This includes statutory charges (such as rates) as well as most grant agreements.
Council adopted AASB 1058 Income of Not-for-Profit Entities using the modified (cumulative catch up) method. Income for 2019 is not adjusted, because the new standard is only applied from the date of initial application.
AASB 1058 Income of Not-for-Profit Entities requires income to be recognised as Council satisfies the performance obligations under the contract.
(d) Transition impacts
The following table summarises the impact of transition to the new standards on retained earnings at 1 July 2019.
Council Consolidated2019 2019
$’000 $’000
Retained earnings at 30 June 2019 1,095,388 1,100,238
Revenue adjustment – impact of AASB 16 Leases - 201
Retained earnings at 1 July 2019 1,095,388 1,100,439
Council adopted the practical expedient of deeming the lease asset to be equal in value to the lease liability at 1 July 2019. As such there was no impact on retained earnings on the adoption of AASB 16 Leases.
The consolidated include accounting for operating leases by the lessor (Prahran Market Pty Ltd) recognising prior year straight line rental revenue against opening retained earnings.
Note 10 – Change in accounting policy

Contact us8290 1333PO Box 58, Malvern Victoria [email protected] Visit usstonnington.vic.gov.au Stonnington City Centre 311 Glenferrie Road, Malvern
Stonnington Services and Visitor Hub Chatham Street, Prahran Square, Prahran
Stonnington Depot (Administration Building) 293 Tooronga Road, Malvern
Connect with us
facebook.com/stonningtoncouncil
twitter.com/StonningtonNews
instagram.com/whats_on_stonnington
linkedin.com/company/city-of-stonnington
ISSN: 2652-855X (Print)ISSN: 2652-8568 (Online)
Community LanguagesCall the Stonnington Community Link, a multilingual telephone information service.
Mandarin 9280 0730
Cantonese 9280 0731
Greek 9280 0732
Italian 9280 0733
Polish 9280 0734
Russian 9280 0735
Indonesian 9280 0737
All other languages 9280 0736 We are national relay service friendlyIf you are deaf, or have a hearing impairment or speech impairment, contact us through the National Relay Service:
» TTY user phone 133 677 then ask for 8290 1333
» Speak and Listen users phone 1300 555 727 then ask for 8290 1333
» Internet relay users connect to the NRS then ask for 8290 1333