Embed Size (px)
Citation preview

November 2018
1
FX Strategy Team
30 November 2018
www.ing.com/THINK
2019 FX Outlook: Peak Dollar Surviving the climb and hoping for a safe descent
Economic & Financial Analysis FX
FX Outlook 2019 November 2018
Contents
Executive summary 1
2019 FX Outlook: Peak dollar 2 USD: Picking the top ...........................................................................................................................11 EUR: No fireworks ................................................................................................................................13 European politics in 2019: United in even more diversity ........................................................16 JPY: Pure play on the dollar ..............................................................................................................17 GBP: Out of control .............................................................................................................................19 CNY: A line in the sand? .....................................................................................................................22 CHF: SNB stays cautious ....................................................................................................................25 $-Bloc: Three commodity currencies with very different outlooks .........................................27 2019 commodities outlook .............................................................................................................33 Scandies: Still no strong rally in sight .............................................................................................35 CEEMEA: Less important EUR effect ...............................................................................................38 Balkans: Foggier EU integration road ahead ................................................................................44 LATAM: A new political reality .........................................................................................................46 Trade growth .......................................................................................................................................50 Asia: Overlapping layers of risk .......................................................................................................51
ING foreign exchange forecasts 59
Chris Turner Global Head of Strategy London +44 20 7767 1610 [email protected]
Petr Krpata, CFA Chief EMEA FX and IR Strategist London +44 20 7767 6561 [email protected]
Carsten Brzeski Chief Economist Germany, Austria Frankfurt +49 69 27 222 64455 [email protected]
Rob Carnell Chief Economist & Head of Research, Asia-Pacific Singapore +65 6232 6020 [email protected]
Ciprian Dascalu Chief Economist, Romania Bucharest +40 31 406 8990 [email protected]
Raoul Leering Head of International Trade Analysis Amsterdam +31 20 563 4407 [email protected]
Charlotte de Montpellier Economist, Switzerland Brussels +32 2 547 3386 [email protected]
Warren Patterson Commodities Strategist Amsterdam +31 20 563 8921 [email protected]
Iris Pang Economist, Greater China Hong Kong +852 2848 8071 [email protected]
Gustavo Rangel Chief Economist, LATAM New York +1 646 424 6464 [email protected]
Prakash Sakpal Economist, Asia Singapore +65 6232 6181 [email protected]
View all our research on www.ing.com/THINK
Cover photograph courtesy of shutterstock
Publication date 30 November 2018
FX Outlook 2019 November 2018
1
Executive summary • When will global asset markets be released from the stranglehold of high US
interest rates and the strong dollar? That’s the big question for 2019. We think it’s too early to be positioning for a turnaround just yet, because core US inflation looks set to push up to 2.5% next summer - prompting four more Fed hikes.
• That would normally spell another big leg higher for the dollar. However, the dollar is significantly overvalued against most currencies, suggesting any new highs are marginal. That could mean EUR/USD and USD/JPY pressing the 1.10 and 117 areas, respectively, in 1Q19 and EMFX handing back some of its recent gains.
• As 2019 progresses, expect to hear more about a Fed pause. US market interest rates typically turn lower before the top in the Fed cycle. And if we’re right with our call for a Fed peak in the third quarter, we suspect that undervalued risk assets can breathe a sigh of relief and the dollar embark on an orderly sell-off.
Key views It is too early to call a top in the dollar. The Fed is now in the realms of late cycle tightening and should deliver four more hikes. Dollar hedging costs will remain extremely expensive and, barring a US-centric shock, we would expect to see marginal new dollar highs against the EUR and the JPY over the next six months.
As 2019 progresses, expect a bearish dollar narrative to develop. US rates should be coming off their highs by the end of the year and as US growth converges lower on the rest of the world, expect investors to rotate out of US asset markets. A search for alternative sources of stimulus may also see the White House favour a weaker dollar.
Europe has been a big disappointment in 2018. Though sluggish growth has been blamed on a relentless stream of ‘one-off factors’, it is hard to see a significant pick-up in activity next year. EUR/USD will struggle to make it above 1.20 as the ECB barely lifts rates off the floor. European Parliamentary elections in May will also be in focus.
A lower EUR/USD in the early part of the year is typically not good news for CE4 currencies. The good news is that HUF and PLN are already undervalued, while the market’s favourite villain – the RON – is too expensive to sell. Any CZK gains should be primarily dependent on the hawkish CNB, not the EUR/USD.
On Brexit, UK parliamentary approval of the Withdrawal Agreement may not be seen until February. Even if the deal is passed, 2019 is unlikely to look pretty either as both the UK and the EU struggle to define what the ultimate relationship should look like. Expect GBP to continue to trade on volatility levels more common in emerging markets.
For EM, the gales blowing out of the US look set to continue through early 2019. Add in declining world trade volumes and rising late cycle volatility and the EM environment looks challenged. But EM currencies have already discounted a lot of bad news. If they can survive the first half, modest rallies should be seen later in the year.
Within the EM space, we see the Renminbi steadily weakening all year as the economy adjusts to the US trade agenda. Our USD/CNY target is 7.30. In theory, a softer environment for crude oil prices in 2019 – we see Brent trading more in the US$60/bbl area than the US$70/bbl area – should be good for Asia. Assuming the INR can survive elections in May, RBI tightening in 2H19 should allow the INR to take advantage of the softer dollar story.
The big beasts of Latam, BRL and MXN, will continue to see substantial volatility as investors adjust to the new political reality. Argentina aside, better external accounts, low inflation and faster GDP growth suggest more resilience in the region. However, Brazil’s ability to pass fiscal legislation will very much set the tone early next year.

FX Outlook 2019 November 2018
2
Second-guessing the US policy agenda Correctly second-guessing the Trump policy agenda would have paid-off handsomely over the past two years.
A relatively quiet first year in office for Trump (2017) saw global recovery stories come through and a benign decline in the dollar. This second year of Trump’s presidency has seen Washington come out fighting on trade, insulated by January’s US$1.5trn fiscal stimulus. This put paid to notions of a synchronised global recovery and a weaker dollar.
Hats off to the US Administration for the timing of their protectionist card. As (current) US Commerce Secretary, Wilbur Ross, says: ‘It’s a good time to get aggressive on trade’.
What of 2019? As always, there is a range of scenarios, but we doubt that 2019 will see fresh US fiscal stimulus sufficiently large enough to prevent the US economy slowing back to trend growth near 2%. Despite widespread acknowledgement on the need for infrastructure spending, we doubt the Democrats will want to back a stimulus from which the Republicans could reap the benefits in the 2020 presidential election. In other words, policy gridlock makes it more likely than not that the US growth slows to trend.
When it comes to trade, we know that the President’s executive powers are wide-ranging. The Democratic control of the House may make it harder to pass Trump’s NAFTA 2.0, but there is bi-partisan support for a more aggressive stance against China. The Democrats acknowledge that the Strategic Economic Dialogue established under the Obama White House failed to produce results. And if China did join the WTO on unfairly good terms, they did so under the watch of George W. Bush in 2001.
Chris Turner Global Head of Strategy London +44 20 7767 1610 [email protected]
Petr Krpata, CFA Chief EMEA FX and IR Strategist London +44 20 7767 6561 [email protected]
2019 FX Outlook: Peak dollar Surviving the climb and hoping for a safe descent • 2018 has proved a pretty miserable year for asset markets. International
investment opportunities have been crowded out by a stronger dollar and an outperforming US equity market. Like a noisy dinner party guest, Washington has dominated the macro-political conversation.
• Looking into 2019, we don't see any major changes in Washington's foreign policy agenda – particularly trade. But on the domestic side, a divided Congress and a late cycle US economy should start investors thinking about a peak in the US rate cycle – and potentially a peak in the dollar as well.
• We think bearish flattening of the US yield curve can drive some modest dollar strength against the low yielders in the early part of 2019 – and keep already cheap risk assets undervalued as high US rates pressure test the global economy.
• As 2019 progresses, however, and as US growth slows towards trend, signals of at least a pause in the Fed cycle can allow risk assets to breathe again. A safe descent from the dollar summit should start the great rotation out of the US and into the undervalued asset markets overseas.

FX Outlook 2019 November 2018
3
Our baseline assumes that existing US tariffs against China remain in place through 2019 and are broadened/strengthened, such that, by the end of 2019, China’s entire exports to the US are subject to tariffs. Other scenarios are possible, too. Please see our trade team’s assessment of the 2019 environment on page 50.
What does Washington policy mean for the US macro cycle? Some comparisons are being drawn between the US and Australia, where the latter has not seen a technical recession since 1991. But we suspect the US business cycle is not dead. And while not calling a US recession in 2020, let alone in 2019, our US economics team do feel that we are at a late point in the US business cycle – or at least the point where calls for the death of the Philips curve are proved premature and inflation risks look skewed to the upside.
Fig 1 GDP to slow to trend in 2019 Fig 2 US core inflation: Four scenarios
Source: ING Source: ING, Macrobond
Our 2019 baseline view sees US growth slowing from the peak 4.2% (QoQ annualised) in 2Q18 to 2.0% by the end of 2019. Typically faulty seasonals see the first quarter as the worst of the year (we see 1Q19 at 1.5%), but the market should be prepared for this. The softening in US growth through 2019 should largely be led by the consumer and government sectors – as the effects of the January 2018 tax cuts wear off.
More focus, however, will come on the US inflation side. The Fed has so far sounded relaxed on inflation and our debt strategy team are amazed that break-even inflation rates – those derived from the difference between 10 year nominal and TIPS yield – are not much above 2%.
Despite this seemingly benign view on inflation, our US macro team see US wages breaking sustainably above 3% over the coming months and core inflation staying above 2% for the majority of 2019. In terms of a profile, we see core US inflation working its way towards the 2.5% area by the middle of 2019 and peaking around there. In our minds, this profile justifies another Fed hike this December and three more through the first three quarters of 2019 to take the Fed target range to the 3.00/3.25% band.
-3
-2
-1
0
1
2
3
4
5
6
1Q16 1Q17 1Q18 1Q19
Consumption InvestmentGovernment InventoriesNet Trade GDP growth (QoQ ann'l)
0.00.51.01.52.02.53.03.54.0
Historical uncertainty band DataBaseline OverheatingGoldilocks SlowdownTarget
%

FX Outlook 2019 November 2018
4
Fig 3 We look for the market to move to the Fed Dots – and not vice versa (%)
Source: ING
Despite recent discussion that Fed policy is close to neutral, we suspect this is not more seriously debated until 2Q19, when Fed Funds have been taken into the 2.75-3.00% range – close to the middle of the Fed’s Long Run Dots.
Thus we are in the camp looking for the market to move towards the Fed Dots and not vice versa. If we’re right, this will mean further bearish flattening of the yield curve, with the potential for inversion if there are any meaningful signs of a slowdown in activity.
Of course other Fed scenarios are possible. We explore these in Figure 22 on page 12. In assessing these alternatives, we do see inflation risks being skewed to the upside at this stage in the cycle and think it is too early to back ideas of a near term pause in Fed tightening.
What does Washington policy mean for the dollar? Washington’s policy of domestic stimulus and external economic aggression has delivered strong outperformance of both US equities and the dollar in 2018. Significant repatriation of overseas US corporate profits – far larger than in 2005 – has seen record US share buybacks and has helped to insulate US equities from slowing world trade volumes and from the downward revisions to world growth rates.
Fig 4 YTD benchmark equity returns (in US$ terms) Fig 5 2Q18 share buybacks hit a record US$198bn per quarter!
Source: Bloomberg Source: Bloomberg, ING
However in 2019, slowing US growth, rising input costs and a diminishing marginal impact from share buybacks stand to limit US equity outperformance.
And for the dollar itself, we think simple growth differentials remain very important indeed. From the desynchronized global growth story in 2018, we look for a resumption
0
1
2
3
4
5
September Meeting Dec implied Fed fund rate Latest median
2018 2019 2020 2021 LR
-50% -40% -30% -20% -10% 0% 10%
TurkeyChina
S. KoreaGermany
MexicoUK
EuropeAustralia
CanadaJapanRussia
IndiaBrazil
USA
60
70
80
90
100
110
120
-200
-100
0
100
200
300
400
2002 2004 2006 2008 2010 2012 2014 2016 2018S&P 500 share buybacks ($ bn) - LHSUS reinvested earnings overseas ($ bn) - LHSUSD trade-weighted index (majors) - RHS
FX Outlook 2019 November 2018
5
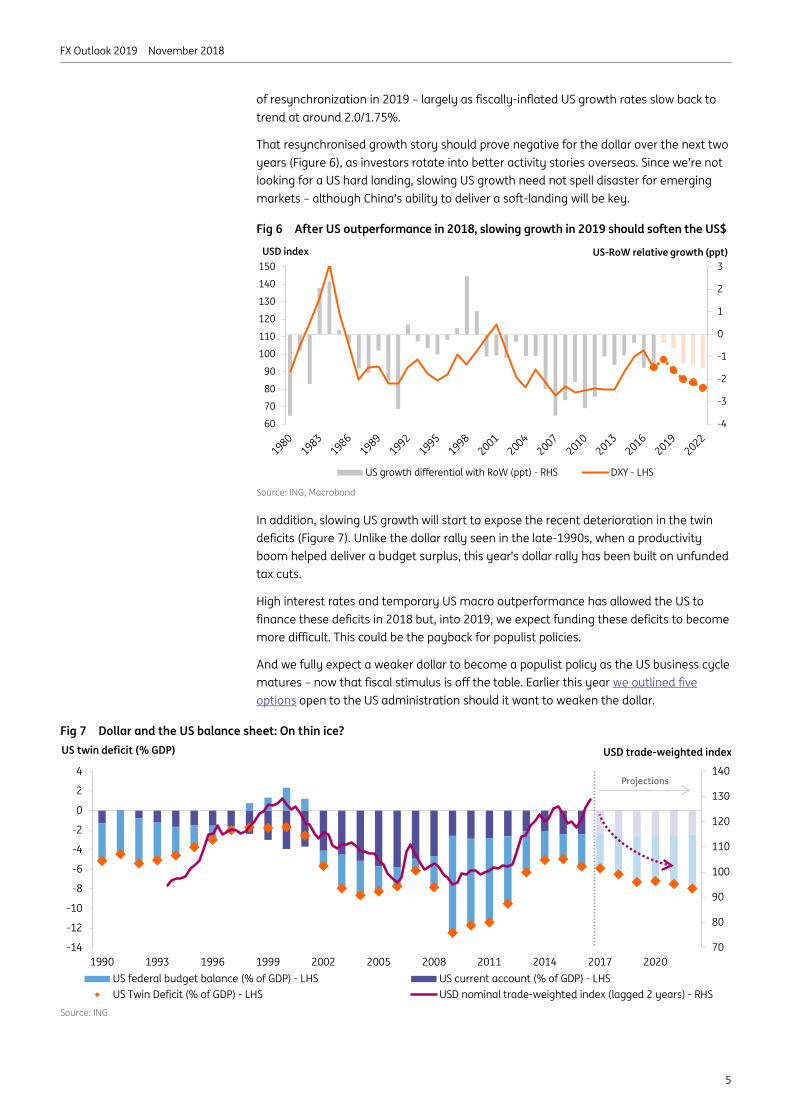
of resynchronization in 2019 – largely as fiscally-inflated US growth rates slow back to trend at around 2.0/1.75%.
That resynchronised growth story should prove negative for the dollar over the next two years (Figure 6), as investors rotate into better activity stories overseas. Since we’re not looking for a US hard landing, slowing US growth need not spell disaster for emerging markets – although China’s ability to deliver a soft-landing will be key.
Fig 6 After US outperformance in 2018, slowing growth in 2019 should soften the US$
Source: ING, Macrobond
In addition, slowing US growth will start to expose the recent deterioration in the twin deficits (Figure 7). Unlike the dollar rally seen in the late-1990s, when a productivity boom helped deliver a budget surplus, this year’s dollar rally has been built on unfunded tax cuts.
High interest rates and temporary US macro outperformance has allowed the US to finance these deficits in 2018 but, into 2019, we expect funding these deficits to become more difficult. This could be the payback for populist policies.
And we fully expect a weaker dollar to become a populist policy as the US business cycle matures – now that fiscal stimulus is off the table. Earlier this year we outlined five options open to the US administration should it want to weaken the dollar.
Fig 7 Dollar and the US balance sheet: On thin ice?
Source: ING
60
70
80
90
100
110
120
130
140
150
-4
-3
-2
-1
0
1
2
3
US growth differential with RoW (ppt) - RHS DXY - LHS
USD index US-RoW relative growth (ppt)
70
80
90
100
110
120
130
140
-14
-12
-10
-8
-6
-4
-2
0
2
4
1990 1993 1996 1999 2002 2005 2008 2011 2014 2017 2020US federal budget balance (% of GDP) - LHS US current account (% of GDP) - LHSUS Twin Deficit (% of GDP) - LHS USD nominal trade-weighted index (lagged 2 years) - RHS
US twin deficit (% GDP) USD trade-weighted index
Projections

FX Outlook 2019 November 2018
6
Understanding dollar valuation and key drivers This year’s rally in the dollar and collapse in emerging currencies has generated the view that the dollar is expensive. Indeed, fund managers feel the dollar is at its most overvalued since 2006, according to some buy-side surveys.
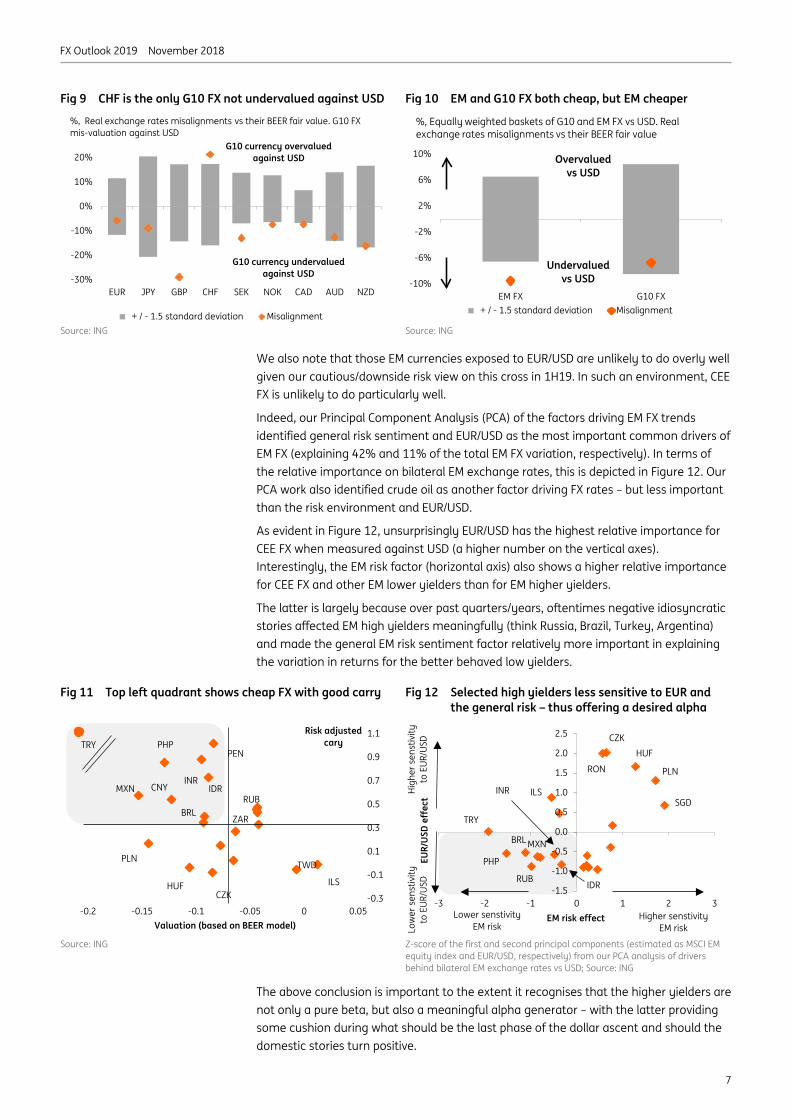
Our Behavioural Equilibrium Exchange Rate (BEER) model agrees that the dollar is expensive. It actually sees the dollar as overvalued against the entire FX spectrum, apart from the CHF and the ILS (Figure 8 for EM FX and Figure 9 for G10 FX).
While both G10 and EM FX segments are cheap against the dollar, according to our model, EMFX is cheaper in both absolute and relative terms. This is evident in Figure 10, which not only shows a larger nominal EM FX undervaluation, but also shows a more extreme undervaluation, being outside of the 1.5 standard deviation band. This more appealing EM FX valuation versus G10 FX should not come as a surprise given that EM FX bore the brunt of the 2018 storm of high US rates, high oil prices and trade wars.
Fig 8 Only one currency (ILS) in the entire EM FX space is not undervalued against USD
Source: ING
We think this very cheap valuation should provide some cushion to EM FX during this final phase of the dollar strength over coming months (be that rise driven by Fed tightening or escalating trade wars).
Moreover, even though we don’t look for a full risk-on environment over the coming months and risk appetite is likely to remain fragile, those high yielders where interest rates have risen over recent quarters may remain relatively resilient. Here the mix of undervaluation and high rates will demand very high conviction levels to sell EM FX. We frame this view in Figure 11. The top left hand quadrant depicts those currencies where valuation is attractive and the risk adjusted carry is high (though in the case of CNY we expect further managed CNY decline versus the dollar
We acknowledge that higher US rates and escalating trade wars mean that EM FX will struggle to post nominal gains over coming months. But our key view is that undervaluation and high rates mean that they can outperform expensive forward prices.
-45%
-35%
-25%
-15%
-5%
5%
15%
25%
BRL MXN CLP COP PEN CNY INR IDR KRW MYR PHP SGD TWD THB CZK HUF PLN ILS ZAR TRY RUB
+ / - 1.5 standard deviation Misalignment
%, Real exchange rates misalignments vs their BEER fair value. EM FX mis-valuation against USD
EM currency overvalued against USD
LatAm EM Asia CEEMEA
EM currency undervalued against USD
FX Outlook 2019 November 2018
7
Fig 9 CHF is the only G10 FX not undervalued against USD Fig 10 EM and G10 FX both cheap, but EM cheaper
Source: ING Source: ING
We also note that those EM currencies exposed to EUR/USD are unlikely to do overly well given our cautious/downside risk view on this cross in 1H19. In such an environment, CEE FX is unlikely to do particularly well.
Indeed, our Principal Component Analysis (PCA) of the factors driving EM FX trends identified general risk sentiment and EUR/USD as the most important common drivers of EM FX (explaining 42% and 11% of the total EM FX variation, respectively). In terms of the relative importance on bilateral EM exchange rates, this is depicted in Figure 12. Our PCA work also identified crude oil as another factor driving FX rates – but less important than the risk environment and EUR/USD.
As evident in Figure 12, unsurprisingly EUR/USD has the highest relative importance for CEE FX when measured against USD (a higher number on the vertical axes). Interestingly, the EM risk factor (horizontal axis) also shows a higher relative importance for CEE FX and other EM lower yielders than for EM higher yielders.
The latter is largely because over past quarters/years, oftentimes negative idiosyncratic stories affected EM high yielders meaningfully (think Russia, Brazil, Turkey, Argentina) and made the general EM risk sentiment factor relatively more important in explaining the variation in returns for the better behaved low yielders.
Fig 11 Top left quadrant shows cheap FX with good carry Fig 12 Selected high yielders less sensitive to EUR and the general risk – thus offering a desired alpha
Source: ING Z-score of the first and second principal components (estimated as MSCI EM
equity index and EUR/USD, respectively) from our PCA analysis of drivers behind bilateral EM exchange rates vs USD; Source: ING
The above conclusion is important to the extent it recognises that the higher yielders are not only a pure beta, but also a meaningful alpha generator – with the latter providing some cushion during what should be the last phase of the dollar ascent and should the domestic stories turn positive.
-30%
-20%
-10%
0%
10%
20%
EUR JPY GBP CHF SEK NOK CAD AUD NZD
+ / - 1.5 standard deviation Misalignment
%, Real exchange rates misalignments vs their BEER fair value. G10 FX mis-valuation against USD
G10 currency overvalued against USD
G10 currency undervalued against USD
-10%
-6%
-2%
2%
6%
10%
EM FX G10 FX + / - 1.5 standard deviation Misalignment
%, Equally weighted baskets of G10 and EM FX vs USD. Real exchange rates misalignments vs their BEER fair value
Undervaluedvs USD
Overvaluedvs USD
-0.3
-0.1
0.1
0.3
0.5
0.7
0.9
1.1
-0.2 -0.15 -0.1 -0.05 0 0.05
MXN
ILS
RUBIDR
PLN
ZARBRL
TRYRisk adjusted
caryPHP
CNY
PEN
INR
HUFCZK
TWD
Valuation (based on BEER model)
-1.5
-1.0
-0.5
0.0
0.5
1.0
1.5
2.0
2.5
-3 -2 -1 0 1 2 3
EUR/
USD
effe
ct
EM risk effect
CZK
RON PLN
HUF
SGD
TRY
ILS
BRL
RUB
PHP
MXN
High
er s
enst
ivity
to
EUR
/USD
Higher senstivity EM risk
Lower senstivity EM riskLo
wer
sen
stiv
ity
to E
UR/U
SD
INR
IDR
FX Outlook 2019 November 2018
8
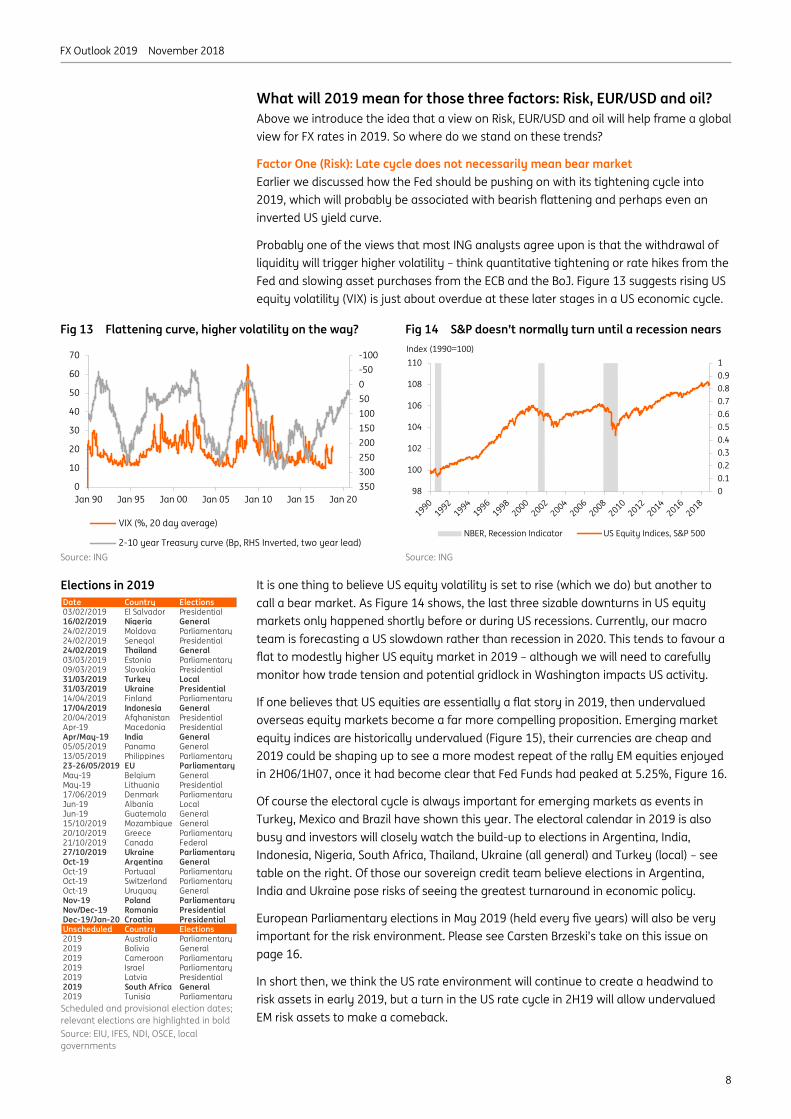
What will 2019 mean for those three factors: Risk, EUR/USD and oil? Above we introduce the idea that a view on Risk, EUR/USD and oil will help frame a global view for FX rates in 2019. So where do we stand on these trends?
Factor One (Risk): Late cycle does not necessarily mean bear market Earlier we discussed how the Fed should be pushing on with its tightening cycle into 2019, which will probably be associated with bearish flattening and perhaps even an inverted US yield curve.
Probably one of the views that most ING analysts agree upon is that the withdrawal of liquidity will trigger higher volatility – think quantitative tightening or rate hikes from the Fed and slowing asset purchases from the ECB and the BoJ. Figure 13 suggests rising US equity volatility (VIX) is just about overdue at these later stages in a US economic cycle.
Fig 13 Flattening curve, higher volatility on the way? Fig 14 S&P doesn’t normally turn until a recession nears
Source: ING Source: ING
It is one thing to believe US equity volatility is set to rise (which we do) but another to call a bear market. As Figure 14 shows, the last three sizable downturns in US equity markets only happened shortly before or during US recessions. Currently, our macro team is forecasting a US slowdown rather than recession in 2020. This tends to favour a flat to modestly higher US equity market in 2019 – although we will need to carefully monitor how trade tension and potential gridlock in Washington impacts US activity.
If one believes that US equities are essentially a flat story in 2019, then undervalued overseas equity markets become a far more compelling proposition. Emerging market equity indices are historically undervalued (Figure 15), their currencies are cheap and 2019 could be shaping up to see a more modest repeat of the rally EM equities enjoyed in 2H06/1H07, once it had become clear that Fed Funds had peaked at 5.25%, Figure 16.
Of course the electoral cycle is always important for emerging markets as events in Turkey, Mexico and Brazil have shown this year. The electoral calendar in 2019 is also busy and investors will closely watch the build-up to elections in Argentina, India, Indonesia, Nigeria, South Africa, Thailand, Ukraine (all general) and Turkey (local) – see table on the right. Of those our sovereign credit team believe elections in Argentina, India and Ukraine pose risks of seeing the greatest turnaround in economic policy.
European Parliamentary elections in May 2019 (held every five years) will also be very important for the risk environment. Please see Carsten Brzeski’s take on this issue on page 16.
In short then, we think the US rate environment will continue to create a headwind to risk assets in early 2019, but a turn in the US rate cycle in 2H19 will allow undervalued EM risk assets to make a comeback.
-100-500501001502002503003500
10
20
30
40
50
60
70
Jan 90 Jan 95 Jan 00 Jan 05 Jan 10 Jan 15 Jan 20
VIX (%, 20 day average)
2-10 year Treasury curve (Bp, RHS Inverted, two year lead)
00.10.20.30.40.50.60.70.80.91
98
100
102
104
106
108
110
NBER, Recession Indicator US Equity Indices, S&P 500
Index (1990=100)
Elections in 2019
Scheduled and provisional election dates; relevant elections are highlighted in bold Source: EIU, IFES, NDI, OSCE, local governments
Date Country Elections03/02/2019 El Salvador Presidential16/02/2019 Nigeria General24/02/2019 Moldova Parliamentary24/02/2019 Senegal Presidential24/02/2019 Thailand General03/03/2019 Estonia Parliamentary09/03/2019 Slovakia Presidential31/03/2019 Turkey Local31/03/2019 Ukraine Presidential14/04/2019 Finland Parliamentary17/04/2019 Indonesia General20/04/2019 Afghanistan PresidentialApr-19 Macedonia PresidentialApr/May-19 India General05/05/2019 Panama General13/05/2019 Philippines Parliamentary23-26/05/2019 EU ParliamentaryMay-19 Belgium GeneralMay-19 Lithuania Presidential17/06/2019 Denmark ParliamentaryJun-19 Albania LocalJun-19 Guatemala General15/10/2019 Mozambique General20/10/2019 Greece Parliamentary21/10/2019 Canada Federal27/10/2019 Ukraine ParliamentaryOct-19 Argentina GeneralOct-19 Portugal ParliamentaryOct-19 Switzerland ParliamentaryOct-19 Uruguay GeneralNov-19 Poland ParliamentaryNov/Dec-19 Romania PresidentialDec-19/Jan-20 Croatia PresidentialUnscheduled Country Elections2019 Australia Parliamentary2019 Bolivia General2019 Cameroon Parliamentary2019 Israel Parliamentary2019 Latvia Presidential2019 South Africa General2019 Tunisia Parliamentary
FX Outlook 2019 November 2018
9
Fig 15 Forward-looking PER ratios. EM looks cheap Fig 16 Fed pauses, EM equities? Will it be 2000 or 2006?
Source: ING, Bloomberg Source: Bloomberg
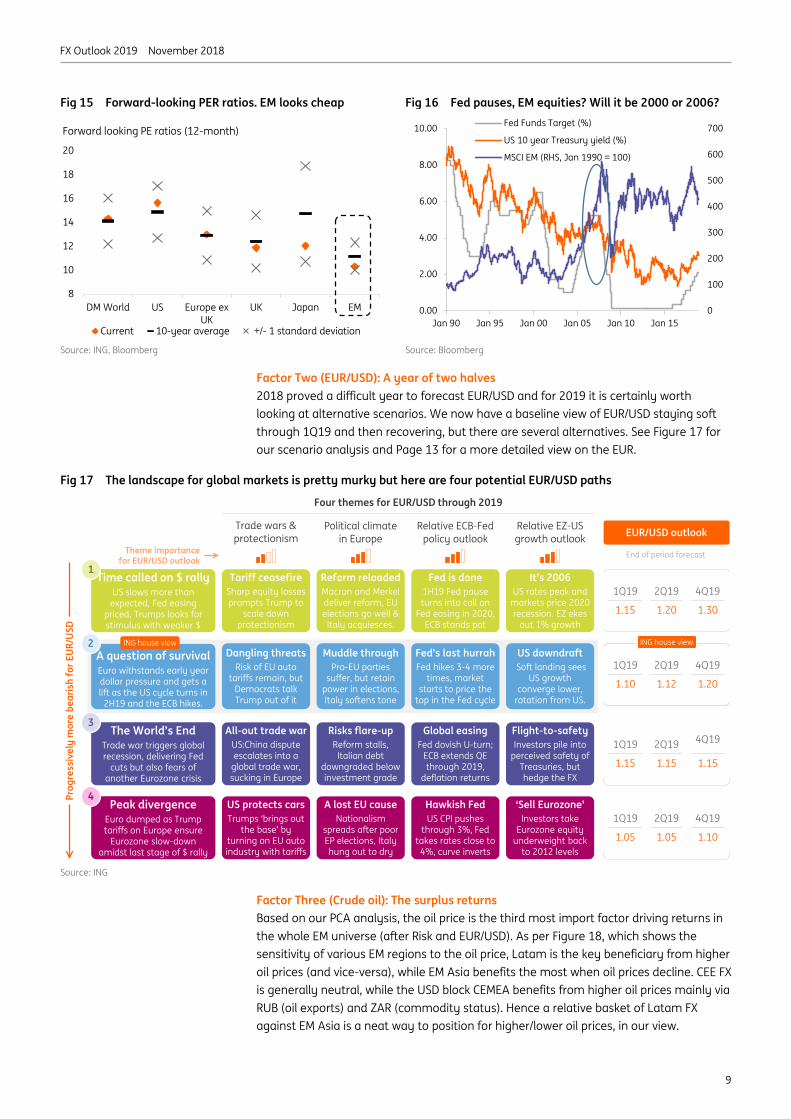
Factor Two (EUR/USD): A year of two halves 2018 proved a difficult year to forecast EUR/USD and for 2019 it is certainly worth looking at alternative scenarios. We now have a baseline view of EUR/USD staying soft through 1Q19 and then recovering, but there are several alternatives. See Figure 17 for our scenario analysis and Page 13 for a more detailed view on the EUR.
Fig 17 The landscape for global markets is pretty murky but here are four potential EUR/USD paths
Source: ING
Factor Three (Crude oil): The surplus returns Based on our PCA analysis, the oil price is the third most import factor driving returns in the whole EM universe (after Risk and EUR/USD). As per Figure 18, which shows the sensitivity of various EM regions to the oil price, Latam is the key beneficiary from higher oil prices (and vice-versa), while EM Asia benefits the most when oil prices decline. CEE FX is generally neutral, while the USD block CEMEA benefits from higher oil prices mainly via RUB (oil exports) and ZAR (commodity status). Hence a relative basket of Latam FX against EM Asia is a neat way to position for higher/lower oil prices, in our view.
8
10
12
14
16
18
20
DM World US Europe exUK
UK Japan EM
Current 10-year average +/- 1 standard deviation
Forward looking PE ratios (12-month)
0
100
200
300
400
500
600
700
0.00
2.00
4.00
6.00
8.00
10.00
Jan 90 Jan 95 Jan 00 Jan 05 Jan 10 Jan 15
Fed Funds Target (%)
US 10 year Treasury yield (%)
MSCI EM (RHS, Jan 1990 = 100)
Prog
ress
ivel
y m
ore
bear
ish
for E
UR/U
SD
Time called on $ rallyUS slows more than expected, Fed easing
priced, Trumps looks for stimulus with weaker $
Trade wars & protectionism
Political climate in Europe
Four themes for EUR/USD through 2019
Tariff ceasefireSharp equity losses prompts Trump to
scale down protectionism
A question of survivalEuro withstands early year dollar pressure and gets a lift as the US cycle turns in
2H19 and the ECB hikes.
The World’s EndTrade war triggers global recession, delivering Fed
cuts but also fears of another Eurozone crisis
Fed is done 1H19 Fed pause turns into call on
Fed easing in 2020, ECB stands pat
Peak divergenceEuro dumped as Trump tariffs on Europe ensure
Eurozone slow-down amidst last stage of $ rally
Reform reloadedMacron and Merkel deliver reform, EU elections go well &
Italy acquiesces.
Dangling threatsRisk of EU auto
tariffs remain, but Democrats talk Trump out of it
Fed’s last hurrahFed hikes 3-4 more
times, market starts to price the
top in the Fed cycle
Muddle throughPro-EU parties
suffer, but retain power in elections, Italy softens tone
All-out trade warUS:China dispute escalates into a
global trade war, sucking in Europe
Global easingFed dovish U-turn;
ECB extends QE through 2019,
deflation returns
Risks flare-upReform stalls,
Italian debt downgraded below investment grade
US protects carsTrumps ‘brings out
the base’ by turning on EU auto industry with tariffs
Hawkish FedUS CPI pushes
through 3%, Fed takes rates close to
4%, curve inverts
A lost EU causeNationalism
spreads after poor EP elections, Italy hung out to dry
It’s 2006 US rates peak and
markets price 2020 recession. EZ ekes
out 1% growth
US downdraftSoft landing sees
US growth converge lower,
rotation from US.
Flight-to-safetyInvestors pile into
perceived safety of Treasuries, but hedge the FX
‘Sell Eurozone’Investors take
Eurozone equity underweight back
to 2012 levels
Relative ECB-Fed policy outlook
Relative EZ-US growth outlook EUR/USD outlook
1
4
2
3
Theme importance for EUR/USD outlook
End of period forecast
1Q19
1.15
2Q19 4Q19
1.20 1.30
1Q19
1.10
2Q19 4Q19
1.12 1.20
1Q19
1.15
2Q19 4Q19
1.15 1.15
1Q19
1.05
2Q19 4Q19
1.05 1.10
ING house view ING house view

FX Outlook 2019 November 2018
10
Fig 18 A reminder of how EM FX trades with oil… Fig 19 …and G10 FX as well
Source: ING PCA analysis Source: ING PCA analysis
In the G10 space, it should not come a surprise that commodity currencies (led by CAD) show positive sensitivity to the oil price (Figure 19). While NOK also benefits, it does less so when measured against USD crosses, since the EUR/USD impact is taming its upside.
EUR/USD shows negative sensitivity to the oil price partly because of the rising impact of oil on the US economy (following the start of shale exploration). In addition, what was previously a positive effect of higher oil prices on EUR/USD via the monetary policy transmission channel is no longer the case, given that the current dovish-leaning ECB is looking through the ‘one off’ impact of the oil price on the headline EZ CPI (which is currently above the 2% target) and is more concerned about still muted core price pressures (with core CPI being well below the 2% target).
So what of oil? Warren Patterson discusses key commodity drivers on page 33 and for 1H19 notes that the global oil market stands to see a sizeable surplus – buoyed by record production levels from the US and Russia. That puts pressure on OPEC+ to cut production at its meeting on 6 December in Vienna. ING feels that OPEC+ will need to deliver production cuts of 1.5 million barrels per day to see Brent returning to US$75 per barrel, our year-end target. And we favour crude stabilising near US$65 per barrel by the end of 2019. Yet Brent is now trading on an implied volatility near 50% and conviction calls on this market will be difficult to hold.
Conclusion We suspect US rates and the dollar have a little further to climb, keeping their stranglehold over risk-sensitive currencies for the next few months. However, the dollar has risen a long way in 2018 and is now overvalued against a whole host of currencies – particularly those in emerging markets. We therefore doubt that the dollar in 2019 will repeat its gains of 2018.
In terms of timing, defensive positions against the dollar look advisable over the coming months as the dollar pushes to marginal new highs against the low yielders. Those currencies least sensitive to a lower EUR/USD and trading off their own risk characteristics could outperform. We are thinking here of IDR, BRL and RUB. At this time EUR/USD could be pressing 1.10.
Towards the summer, however, we think signals of a Fed pause will become stronger and investors will be encouraged to rotate out of defensive positions in the dollar. Emerging market currencies should be able to breathe again and selective stories in all of the CEEMEA, Latam and Asia (ex-China) regions should start to perform as EUR/USD slowly climbs to 1.20.
-0.3
-0.2
-0.1
0.0
0.1
0.2
0.3
LatAm CEEMEA USD-block
CEE EM Asia
PC3 (the third principal component) loadings to various EM FX regions currencies (vs USD). We identify PC3 as the oil price. Positive sign means positive correlation with the oil price and vice versa.
-0.8
-0.6
-0.4
-0.2
0.0
0.2
0.4
0.6
CAD AUD GBP NZD NOK SEK EUR CHF JPY
PC2 (the third principal component) loadings to various G10 currencies (vs USD). We identify PC2 as the oil price. Positive sign means positive correlation with the oil price and vice versa.
FX Outlook 2019 November 2018
11
Following a good dollar decline in 2017, this year has seen a bad dollar rally. We use the terms ‘good’ and ‘bad’ with respect to the investment climate. Negative returns in nearly all asset categories this year have been a result of the firmer dollar and the protectionist policies unleashed by Washington.
As noted earlier, US trade policy looks unlikely to change in 2019 – and could get far worse were President Trump to attempt to ‘bring out the base’ by seeking redress from the EU auto sector. This would prolong the dollar rally in our opinion.
What will change, however, will be the US cycle. This elongated business cycle has been a tough one to call, but what seems clear is that US growth rates in the 3-4% YoY range will be very hard to maintain through 2019. A return to more sustainable rates of growth in the 1.75-2.00% area look likely, with some signs already that interest-sensitive sectors of the economy – such as housing and construction – are slowing.
Despite the normalisation in growth rates, we suspect the Fed has unfinished business and could take the policy rate another 100bp higher by 3Q19. Fed tightening does not always deliver a firmer dollar – and the dollar can fall quite sharply when the market thinks the Fed is nearly done with rate hikes. We see this kind of environment for 2019.
Washington will have much greater interest in a weaker dollar by that time. With limited options for fresh fiscal stimulus, a weaker dollar could be a useful way to spur growth.
Fig 20 US rates have certainly provided a $ lift this year… Fig 21 …US swap rates typically peak before Fed Funds
Source: Bloomberg Source: Bloomberg
0123456789
65707580859095
100105110115
Jan 90 Jan 95 Jan 00 Jan 05 Jan 10 Jan 15 Jan 20
US Trade Weighted Dollar Index Majors (1973=100)
Fed Funds Target Range (RHS %)
0
2
4
6
8
10
12
Jan 89 Jan 94 Jan 99 Jan 04 Jan 09 Jan 14 Jan 19
Fed target (Mid range) US 2 year swap rates
USD: Picking the top • President Trump’s loose fiscal strategy and the Fed’s tighter monetary policy have
combined to lift the dollar. We see marginal new dollar highs in early 2019.
• Late cycle tightening from the Fed, one more this year and three more in 2019, stand to make dollar hedging costs even more expensive.
• 2019 should ultimately see the US growth story converge lower on the rest of the world. A rotation out of US assets should trigger a benign dollar decline by end-2019.
Chris Turner Global Head of Strategy London +44 20 7767 1610 [email protected]
FX Outlook 2019 November 2018
12
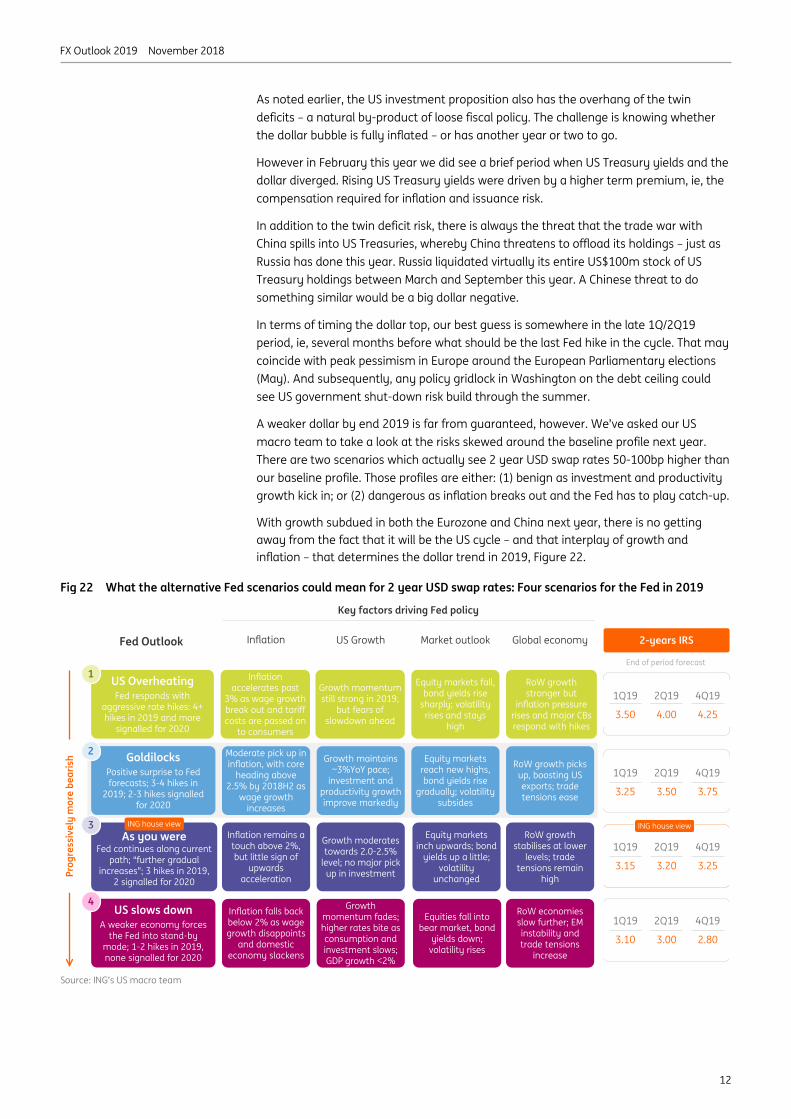
As noted earlier, the US investment proposition also has the overhang of the twin deficits – a natural by-product of loose fiscal policy. The challenge is knowing whether the dollar bubble is fully inflated – or has another year or two to go.
However in February this year we did see a brief period when US Treasury yields and the dollar diverged. Rising US Treasury yields were driven by a higher term premium, ie, the compensation required for inflation and issuance risk.
In addition to the twin deficit risk, there is always the threat that the trade war with China spills into US Treasuries, whereby China threatens to offload its holdings – just as Russia has done this year. Russia liquidated virtually its entire US$100m stock of US Treasury holdings between March and September this year. A Chinese threat to do something similar would be a big dollar negative.
In terms of timing the dollar top, our best guess is somewhere in the late 1Q/2Q19 period, ie, several months before what should be the last Fed hike in the cycle. That may coincide with peak pessimism in Europe around the European Parliamentary elections (May). And subsequently, any policy gridlock in Washington on the debt ceiling could see US government shut-down risk build through the summer.
A weaker dollar by end 2019 is far from guaranteed, however. We’ve asked our US macro team to take a look at the risks skewed around the baseline profile next year. There are two scenarios which actually see 2 year USD swap rates 50-100bp higher than our baseline profile. Those profiles are either: (1) benign as investment and productivity growth kick in; or (2) dangerous as inflation breaks out and the Fed has to play catch-up.
With growth subdued in both the Eurozone and China next year, there is no getting away from the fact that it will be the US cycle – and that interplay of growth and inflation – that determines the dollar trend in 2019, Figure 22.
Fig 22 What the alternative Fed scenarios could mean for 2 year USD swap rates: Four scenarios for the Fed in 2019
Source: ING’s US macro team
Prog
ress
ivel
y m
ore
bear
ish
US OverheatingFed responds with
aggressive rate hikes: 4+ hikes in 2019 and more
signalled for 2020
Inflation US Growth
Key factors driving Fed policy
Inflation accelerates past
3% as wage growth break out and tariff costs are passed on
to consumers
Goldilocks Positive surprise to Fed forecasts; 3-4 hikes in
2019; 2-3 hikes signalled for 2020
As you wereFed continues along current
path; “further gradual increases”; 3 hikes in 2019,
2 signalled for 2020
Equity markets fall, bond yields rise
sharply; volatility rises and stays
high
US slows downA weaker economy forces
the Fed into stand-by mode; 1-2 hikes in 2019, none signalled for 2020
Growth momentum still strong in 2019,
but fears of slowdown ahead
Moderate pick up in inflation, with core
heading above 2.5% by 2018H2 as
wage growth increases
Equity markets reach new highs, bond yields rise
gradually; volatility subsides
Growth maintains ~3%YoY pace;
investment and productivity growth improve markedly
Inflation remains a touch above 2%, but little sign of
upwards acceleration
Equity markets inch upwards; bond
yields up a little; volatility
unchanged
Growth moderates towards 2.0-2.5%
level; no major pick up in investment
Inflation falls back below 2% as wage growth disappoints
and domestic economy slackens
Equities fall into bear market, bond
yields down; volatility rises
Growth momentum fades; higher rates bite as consumption and investment slows; GDP growth <2%
RoW growth stronger but
inflation pressure rises and major CBs respond with hikes
RoW growth picks up, boosting US exports; trade tensions ease
RoW growth stabilises at lower
levels; trade tensions remain
high
RoW economies slow further; EM instability and trade tensions
increase
Market outlook Global economy 2-years IRS
1
4
2
3
End of period forecast
1Q19
3.50
2Q19 4Q19
4.00 4.25
1Q19
3.25
2Q19 4Q19
3.50 3.75
1Q19
3.15
2Q19 4Q19
3.20 3.25
1Q19
3.10
2Q19 4Q19
3.00 2.80
ING house view ING house view
Fed Outlook

FX Outlook 2019 November 2018
13
ECB: Window of opportunity is closing Compared to previous years, we no longer expect ECB policy to be a meaningful driver of the EUR/USD in the year ahead. The QE tapering adjustment is now behind us and, while the second step in the ECB policy normalisation is still ahead of us (deposit rate hikes), we now expect the cycle to be a shallow one – perhaps even one-and-done.
With Eurozone growth gradually slowing and core CPI expected to remain below 2% throughout our forecast horizon (Figure 23), there will be little reason for the cautious ECB to tighten policy beyond the exit from the unorthodox measures (that is beyond exiting the negative rate environment).
With the window of opportunity for a more prolonged tightening cycle closing, the start of a limited hiking cycle in late 2019 is unlikely to deliver a meaningful boost to the euro. Our economists now see the ECB delivering just one 20bp deposit rate hike in 4Q19 (taking the rate to -0.20%) and then bringing the deposit rate to zero in 1Q20 (accompanied by a refi rate increase to 0.25%). Our team then see a pause. Such a very limited ECB tightening cycle won’t generate much of an independent EUR rally.
Italy: Risk peaking in 2Q19? The Italian fiscal situation and its implication for BTP Italian government bonds are, in our view, the key risk factor for the EUR in 2019. We expect it will work negatively against the common currency in 1H19. With regards to the stand-off between the European Commission (EC) and Italy, we expect the EC to start a so-called excessive deficit procedure (EDP), a disciplinary measure for countries that breach the bloc’s budget deficit and public debt rules, by April 2019 at the latest.
Yet, with EU parliamentary elections (that take place every five years) scheduled for May 2019, it seems unlikely the populist Italian government will want to damage election momentum by making too many policy compromises.
This political stand-off coupled with a likely sovereign downgrade from either Fitch or S&P (or both) during their credit rating reviews in 1H19 (Figure 24) suggest a peak in Italian political risk in the first half of the year. This would keep EUR/USD upside fairly tamed and possibly lead to some EUR decline. Of course, other Italian scenarios are possible too.
Still, we don’t expect Italian risks to deliver a knock-out blow for the EUR because: (1) the Italian rating should remain investment grade and we don’t see the BTP-Bund spread breaking above the 400bp level; and (2) the contagion to other peripheral countries should
EUR: No fireworks • The window for the independent EUR rally is closing and our constructive EUR/USD
outlook for 2H19 is more about a negative USD view than a bullish EUR call
• We look for a V-shaped EUR/USD profile, first reaching 1.10 by 1Q19 as the mix of peaking Italian risk and the last push in the USD bull cycle weighs on the cross…
• …before rebounding to 1.20 by end-2019, driven by a turn lower in the USD and the ECB’s first depo hike in late-2019. This should give modest support to cheap EUR
Petr Krpata, CFA Chief EMEA FX and IR Strategist London +44 20 7767 6561 [email protected]
FX Outlook 2019 November 2018
14
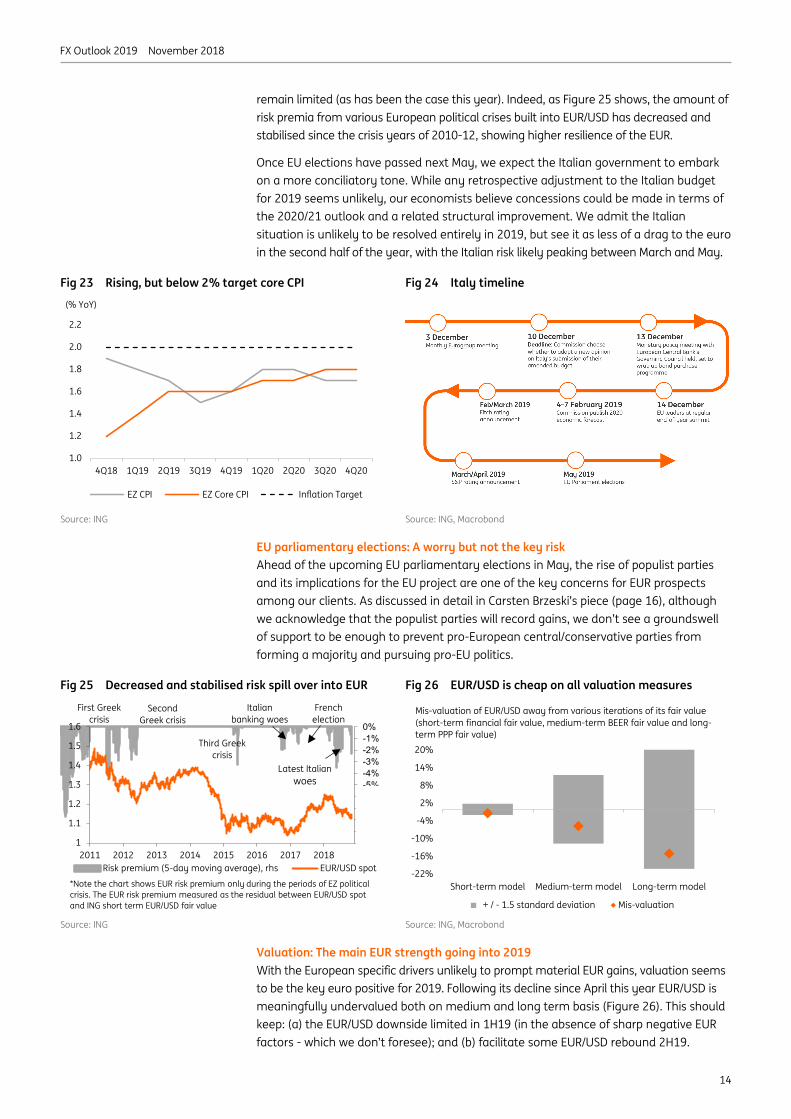
remain limited (as has been the case this year). Indeed, as Figure 25 shows, the amount of risk premia from various European political crises built into EUR/USD has decreased and stabilised since the crisis years of 2010-12, showing higher resilience of the EUR.
Once EU elections have passed next May, we expect the Italian government to embark on a more conciliatory tone. While any retrospective adjustment to the Italian budget for 2019 seems unlikely, our economists believe concessions could be made in terms of the 2020/21 outlook and a related structural improvement. We admit the Italian situation is unlikely to be resolved entirely in 2019, but see it as less of a drag to the euro in the second half of the year, with the Italian risk likely peaking between March and May.
Fig 23 Rising, but below 2% target core CPI Fig 24 Italy timeline
Source: ING Source: ING, Macrobond
EU parliamentary elections: A worry but not the key risk Ahead of the upcoming EU parliamentary elections in May, the rise of populist parties and its implications for the EU project are one of the key concerns for EUR prospects among our clients. As discussed in detail in Carsten Brzeski’s piece (page 16), although we acknowledge that the populist parties will record gains, we don’t see a groundswell of support to be enough to prevent pro-European central/conservative parties from forming a majority and pursuing pro-EU politics.
Fig 25 Decreased and stabilised risk spill over into EUR Fig 26 EUR/USD is cheap on all valuation measures
Source: ING Source: ING, Macrobond
Valuation: The main EUR strength going into 2019 With the European specific drivers unlikely to prompt material EUR gains, valuation seems to be the key euro positive for 2019. Following its decline since April this year EUR/USD is meaningfully undervalued both on medium and long term basis (Figure 26). This should keep: (a) the EUR/USD downside limited in 1H19 (in the absence of sharp negative EUR factors - which we don’t foresee); and (b) facilitate some EUR/USD rebound 2H19.
1.0
1.2
1.4
1.6
1.8
2.0
2.2
4Q18 1Q19 2Q19 3Q19 4Q19 1Q20 2Q20 3Q20 4Q20
EZ CPI EZ Core CPI Inflation Target
(% YoY)
-10%-9%-8%-7%-6%-5%-4%-3%-2%-1%0%
1
1.1
1.2
1.3
1.4
1.5
1.6
2011 2012 2013 2014 2015 2016 2017 2018Risk premium (5-day moving average), rhs EUR/USD spot
Third Greek crisis
Italian banking woes
French election
First Greek crisis
SecondGreek crisis
*Note the chart shows EUR risk premium only during the periods of EZ political crisis. The EUR risk premium measured as the residual between EUR/USD spot and ING short term EUR/USD fair value
Latest Italian woes
-22%
-16%
-10%
-4%
2%
8%
14%
20%
Short-term model Medium-term model Long-term model
+ / - 1.5 standard deviation Mis-valuation
Mis-valuation of EUR/USD away from various iterations of its fair value (short-term financial fair value, medium-term BEER fair value and long-term PPP fair value)

FX Outlook 2019 November 2018
15
More about the fading USD strength than bullish EUR view We remain constructive on EUR/USD but believe things will first get modestly worse before getting modestly better. Hence our U-shape profile of EUR/USD: falling to 1.10 in 1Q19 (due to the mix of Italian politics and a hiking Fed) and recovering to 1.20 by 4Q19.
The recovery in 2H19 should be primarily driven by the end of the USD bull market and subsequent USD weakness. Though the ECB is to embark on depo rate hikes, the likely limited pace of tightening won’t be enough to cause a large EUR rally. It will help, but it won’t deliver fireworks.
1.20 End-2019 EUR/USD

FX Outlook 2019 November 2018
16
European politics in 2019: United in even more diversity In European politics, 2017 was the year of hope for momentum towards further integration; a temporary ‘Europhoria’. 2018 was the year of a disappointing and disillusioning return to reality (and a de facto standstill). Will 2019 be the climax of disappointments or another turnaround?
Leaving Italy’s fiscal escapades aside, three main political themes should get financial markets’ attention next year: elections for the European Parliament in May (held every five years), a changing of the guard in European top jobs, and German politics.
While past European elections have been a low-key event with poor participation rates, many financial market participants are likely to pay the coming elections a lot of attention, fearing a significant rise in EU-sceptical forces. However, as is so often the case, the reality is less exciting and next year’s European election results could be less of a shock than many fear. Some erosion of the political centre, with social democrats and conservatives losing their absolute majority for the first time since 1979, would continue recent national trends but could be mostly offset by gains of the liberals and greens.
Due to the Brexit effect, gains of EU-sceptical parties in percentage of total seats could be more limited than anticipated. Rather than an overall sharp increase, there could be a power shift within the group of EU-sceptical parties. As a result, the political centre would be more fragmented than in the past but the overall sentiment in the European Parliament should remain pro-EU. A former slogan of the European Union will probably have to change from “United in diversity” into “United in even more diversity”.
All EU top jobs are up for grabs next year: President of European Parliament, President of the European Commission, President of the European Council, President of the ECB and two jobs at the ECB Executive Board. Filling these vacancies will be a masterpiece for game theory experts as a balance between nationalities, gender, experiences, political colours and previous jobholders as well as between institutions (the European Council and the European Parliament) will be required. The likely fragmentation of the political centre will be an additional complication. In the past, social democrats (S&D) and conservatives (EPP) held a majority in the European Parliament and were able to horse trade between each other. This will probably no longer be the case next year. However, despite an even more complicated nomination process, there is de facto no risk that any European institution will be headed by an EU-sceptical president.
As regards the vacancies at the ECB, it is too early for an estimated guess but we question whether the ECB’s monetary policy will actually change. No matter who succeeds Praet, Draghi and Coeure, we do not expect the ECB to return to a more dogmatic approach. The Draghi-Praet legacy of a very pragmatic and sometimes unconventional monetary policy will, in our view, survive the changing of the guard.
For many years the stability anchor of European politics, Germany is now in the closing stages of the Merkel era and some fear this could become a source of instability. While we do not believe the race for Merkel’s successor in the CDU will undermine national or European politics, given the continuous fall of the SPD, another disastrous result at the European Elections would increase the odds for a snap election towards the end of 2019.
No panic, this is Europe. This is probably the best label for our base case scenario for European politics in 2019. Regarding potential political risks, ‘Europhoria’ might be gone but this does not mean that the Eurozone is about to disintegrate or be taken over by EU-sceptics. Progress towards deeper integration is still being made. The acid test for the Eurozone and greater integration will be the next recession but not politics in 2019.
Special Focus
Carsten Brzeski Chief Economist Germany, Austria Frankfurt +49 69 27 222 64455 [email protected]

FX Outlook 2019 November 2018
17
USD/JPY has so far had one of its quieter years. Realised one year volatility has dropped to 6.3% – the lowest since 2014. Taking a look at what have been the drivers of USD/JPY this year, US yields seem to be the standout factor. USD/JPY has had a much closer relationship with these than other factors that might be associated with the JPY, such as the risk environment, the oil price and developments in Asian currencies in general.
There have been moments in 2018 when these relationships broke down. For example, February saw a divergence between US yields and USD/JPY. Higher Treasury yields were being driven by higher term premia (risk compensation) rather than by higher expected US short-term rates, and provided a glimpse at how the dollar could look in the future if US Treasuries were to get hit by fears of fiscal sustainability.
There were also brief periods over the summer, when USD/JPY looked to be trading off the China/Asia story. Investors will recall that USD/JPY traded close to 150 during the height of the Asian crisis in 1998, before LTCM went bust (Long-Term Capital Management L.P. was a hedge fund management firm based in Connecticut that used absolute-return trading strategies combined with high financial leverage), the Fed cut 75bp and the US Dot Com boom stalled into 2000.
Fig 27 What's driving USD/JPY?
Source: Bloomberg, ING
For now, however, it looks as though the US business cycle and the Fed story will dominate. This especially so since the BoJ looks a long way away from adjusting policy.
-0.60
-0.40
-0.20
0.00
0.20
0.40
0.60
0.80
2 yearTreasury yields
10 yearTreasury yields
VIX Brent Crude $/CNY Asian DollarIndex
30 day 90 day 180 day
Correlation of daily changes between $/JPY and key variables
JPY: Pure play on the dollar • USD/JPY has been a side-show for a large part of 2018. One-year FX options
volatility has been mired in the 8.0-8.5% area. US yields have driven trends
• Given the call for further Fed hikes and a likely bearish flattening of the curve, we suspect USD/JPY can press the 115/117 area in the early part of 2019
• Rising volatility as the US cycle matures and a turn in US yields by end-2019 could see the USD/JPY trend turn. The US-China stand-off also presents downside risks
Chris Turner Global Head of Strategy London +44 20 7767 1610 [email protected]

FX Outlook 2019 November 2018
18
Notably this year the BoJ has extended forward guidance to its already elaborate policy of Quantitative and Qualitative Monetary Easing (QQE) with Yield Curve Control (YCC).
While the BoJ does acknowledge the pain being inflicted on the Net Interest Margins of Japanese Banks by its monetary policy, it shows no sign of adjusting its policy anytime soon. This is because the core target of BoJ monetary policy – price stability at 2% – remains so distant.
Even though the Japanese economy is doing reasonably well – we see 1.7% GDP growth this year and next – the BoJ will be fearful of adjusting policy ahead of the October 2019 consumption tax hike, where the rate will be increased from 8% to 10%. The last consumption tax hike in 2014 caused a brief recession.
We therefore think the BoJ policy will remain cautious and that we’ll continue to see some modest expansion of the BoJ’s balance sheet as it continues QQE. For reference, the BoJ’s balance sheet crossed 100% of GDP in October 2018. On that subject, the relative sizing of the Fed’s balance sheet versus the BoJ’s provides a supportive backdrop for USD/JPY.
Another supportive factor for USD/JPY over the next 3-6 months should be the shape of the US yield curve and the related issue of FX hedging costs for Japanese investors holding US Treasuries. Because of Fed rate hikes, the three-month costs of hedging US assets back into the JPY is now 3.3%. It’s not quite the 5.5-6.0% levels seen in the late-1990s, but it has broken above current 10-year US yields. Thus it’s very expensive to FX hedge US Treasury purchases. This means: (1) less Japanese buying of US Treasuries; (2) reducing FX hedge ratios on US Treasury purchases; and (3) perhaps both.
Fig 28 USD/JPY underperforms CB balance sheet moves Fig 29 US curve flattening suggests patience needed
Source: Bloomberg, ING Source: Bloomberg, ING
Unless there is a substantial shock that cements the view that the Fed is ready to pause very soon, it is hard to call USD/JPY substantially lower. Indeed, we think there is a window to the 115/117 area in the first half of 2019. As the year progresses, however, and US market interest rates show signs of turning, we would expect USD/JPY to be turning decisively lower through 110. Our year-end 2019 forecast is 105.
There are many risks to this trajectory, of course. The upside risks could come from: (1) the Fed being behind the curve and having to hike rates more aggressively; and (2) China’s slowdown becoming disorderly and a ‘sell Asia’ narrative building.
The downside risks probably come from Washington foreign policy. A Chinese threat to sell US Treasuries would probably see USD/JPY lead the dollar lower. In addition, Japan, like Europe, could be at risk of an extension of tariffs into the auto sector. Those auto tariff risks could come hand-in-hand with a White House desire for a weaker dollar. Without the typical recourse to extensive FX intervention, USD/JPY would be vulnerable. Given these risks, we believe USD/JPY traded volatility is too cheap heading into 2019.
0
20
40
60
80
100
120
140
160
Jan 08 Jan 10 Jan 12 Jan 14 Jan 16 Jan 18
BOJ vs Fed Balance Sheet (% of GDP, Jan 2008 = 100)USD/JPY (RHS)
-350
-300
-250
-200
-150
-100
-50
0
50
100
70
80
90
100
110
120
130
140
150
Jan 91 Jan 96 Jan 01 Jan 06 Jan 11 Jan 16
USD/JPY US 2-10 year Treasury curve (RHS bp 1 yr lag)

FX Outlook 2019 November 2018
19
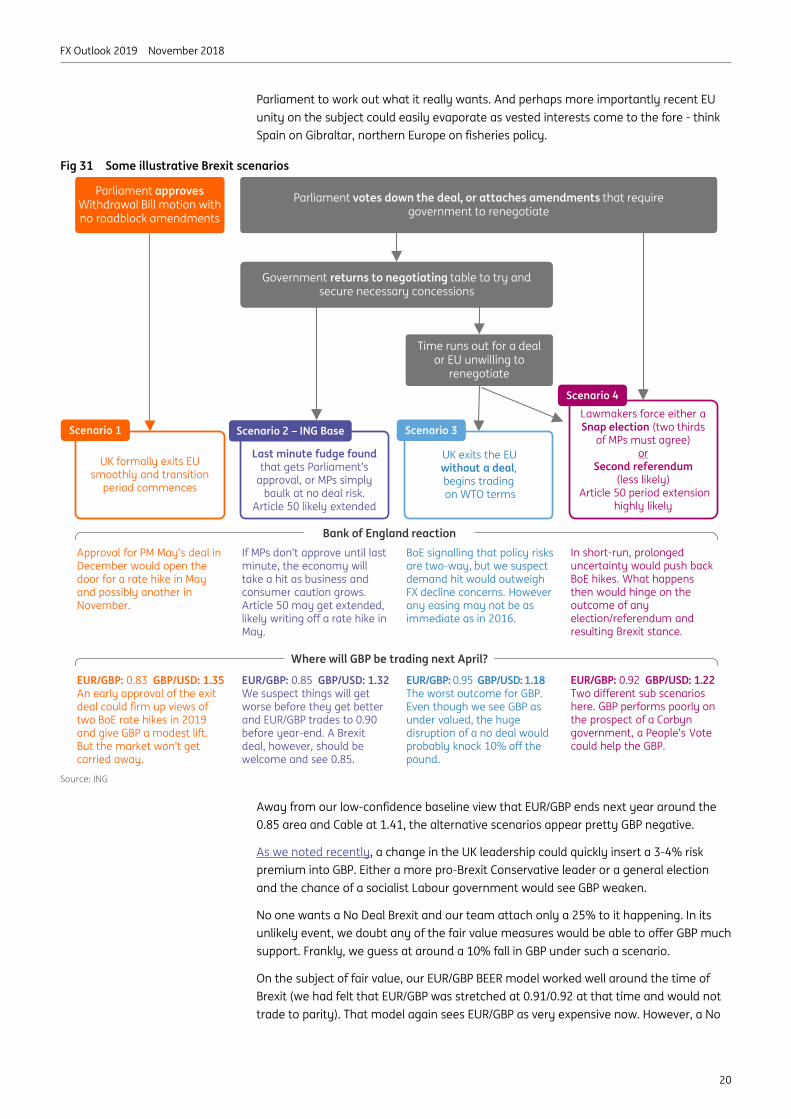
GBP has been on a wild and mostly declining ride since the Brexit vote in June 2016. It’s not fair to say that nothing has been achieved since then. We do, after all, now have a 585 page Withdrawal Agreement. However, the nature of the UK’s departure from the EU and its future trading relationship with that bloc remains highly uncertain.
One thing our team does agree on is that things will get worse before they get better. Barring a second referendum reversing the Brexit vote, the term ‘better’ is still economically worse than our prior relationship with the EU. In terms of GBP forecasts, we think EUR/GBP could still have another run at the 0.91/0.92 area by the end of this year as PM May struggles to get her Withdrawal Agreement through parliament at the first attempt. There is now speculation of a second vote as late as February 2019.
Fig 30 GBP is trading on an option volatility associated with the EM world (%)
Source: Bloomberg
As the high volatility of GBP attests (Figure 30), transparency is especially poor right now. In Figure 31 our team looks at a variety of Brexit scenarios and their impact on GBP. In fact, we feel constrained by limiting the number of scenarios to four!
There are not too many positive GBP scenarios. While some certainty over an orderly Brexit would be welcomed by markets, the move to fully price two BoE rate hikes in 2019 may only be worth 2-3% GBP upside. This is because we see very little progress on the UK’s ultimate relationship with the EU next year. It will probably take a year for the UK
6
7
8
9
10
11
12
13
14
Jan 18 Apr 18 Jul 18 Oct 18
G7 FX 3m implied volatility (%) EM FX 3m implied volatility (%)GBP/USD 3m implied volatility (%)
%
GBP: Out of control • The UK is barely four months away from leaving the EU, but the nature of the
departure, let alone the future relationship with Europe, remains highly uncertain
• In the options market, GBP is now trading on similar volatility levels to EM currencies. We can’t see this environment changing before 29 March 2019
• Fundamental undervaluation has limited some of GBP’s downside since 2016. However, there would be no saving GBP under a no deal scenario.
Chris Turner Global Head of Strategy London +44 20 7767 1610 [email protected]
FX Outlook 2019 November 2018
20
Parliament to work out what it really wants. And perhaps more importantly recent EU unity on the subject could easily evaporate as vested interests come to the fore - think Spain on Gibraltar, northern Europe on fisheries policy.
Fig 31 Some illustrative Brexit scenarios
Source: ING
Away from our low-confidence baseline view that EUR/GBP ends next year around the 0.85 area and Cable at 1.41, the alternative scenarios appear pretty GBP negative.
As we noted recently, a change in the UK leadership could quickly insert a 3-4% risk premium into GBP. Either a more pro-Brexit Conservative leader or a general election and the chance of a socialist Labour government would see GBP weaken.
No one wants a No Deal Brexit and our team attach only a 25% to it happening. In its unlikely event, we doubt any of the fair value measures would be able to offer GBP much support. Frankly, we guess at around a 10% fall in GBP under such a scenario.
On the subject of fair value, our EUR/GBP BEER model worked well around the time of Brexit (we had felt that EUR/GBP was stretched at 0.91/0.92 at that time and would not trade to parity). That model again sees EUR/GBP as very expensive now. However, a No
Bank of England reaction
Parliament approves Withdrawal Bill motion with no roadblock amendments
Parliament votes down the deal, or attaches amendments that require government to renegotiate
UK formally exits EU smoothly and transition
period commences
Scenario 1Lawmakers force either aSnap election (two thirds
of MPs must agree)or
Second referendum(less likely)
Article 50 period extension highly likely
Government returns to negotiating table to try and secure necessary concessions
Time runs out for a deal or EU unwilling to
renegotiate
UK exits the EU without a deal, begins tradingon WTO terms
Scenario 3
Last minute fudge found that gets Parliament’s
approval, or MPs simply baulk at no deal risk.
Article 50 likely extended
Scenario 4
Scenario 2 – ING Base
Approval for PM May’s deal in December would open the door for a rate hike in May and possibly another in November.
If MPs don’t approve until last minute, the economy will take a hit as business and consumer caution grows. Article 50 may get extended, likely writing off a rate hike in May.
BoE signalling that policy risks are two-way, but we suspect demand hit would outweigh FX decline concerns. However any easing may not be as immediate as in 2016.
In short-run, prolonged uncertainty would push back BoE hikes. What happens then would hinge on the outcome of any election/referendum and resulting Brexit stance.
Where will GBP be trading next April?
EUR/GBP: 0.83 GBP/USD: 1.35An early approval of the exit deal could firm up views of two BoE rate hikes in 2019 and give GBP a modest lift. But the market won’t get carried away.
EUR/GBP: 0.85 GBP/USD: 1.32We suspect things will get worse before they get better and EUR/GBP trades to 0.90 before year-end. A Brexitdeal, however, should be welcome and see 0.85.
EUR/GBP: 0.95 GBP/USD: 1.18The worst outcome for GBP. Even though we see GBP as under valued, the huge disruption of a no deal would probably knock 10% off the pound.
EUR/GBP: 0.92 GBP/USD: 1.22Two different sub scenarios here. GBP performs poorly on the prospect of a Corbyngovernment, a People’s Vote could help the GBP.
FX Outlook 2019 November 2018
21
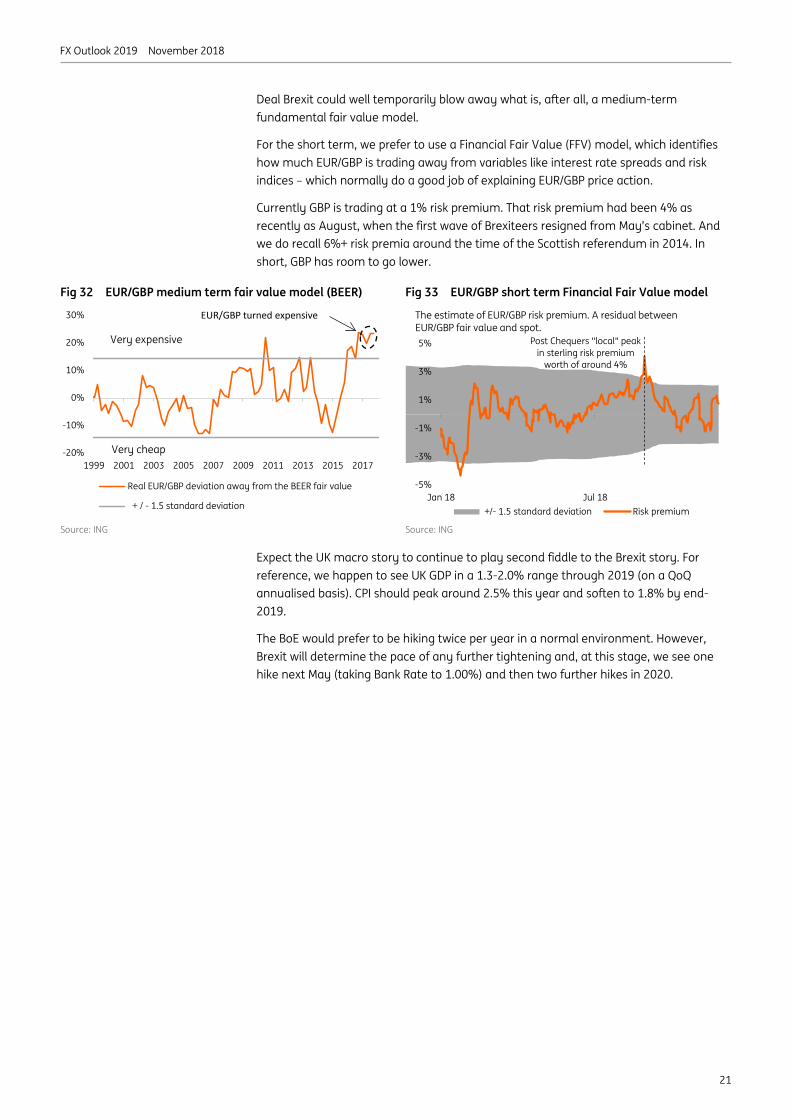
Deal Brexit could well temporarily blow away what is, after all, a medium-term fundamental fair value model.
For the short term, we prefer to use a Financial Fair Value (FFV) model, which identifies how much EUR/GBP is trading away from variables like interest rate spreads and risk indices – which normally do a good job of explaining EUR/GBP price action.
Currently GBP is trading at a 1% risk premium. That risk premium had been 4% as recently as August, when the first wave of Brexiteers resigned from May’s cabinet. And we do recall 6%+ risk premia around the time of the Scottish referendum in 2014. In short, GBP has room to go lower.
Fig 32 EUR/GBP medium term fair value model (BEER) Fig 33 EUR/GBP short term Financial Fair Value model
Source: ING Source: ING
Expect the UK macro story to continue to play second fiddle to the Brexit story. For reference, we happen to see UK GDP in a 1.3-2.0% range through 2019 (on a QoQ annualised basis). CPI should peak around 2.5% this year and soften to 1.8% by end-2019.
The BoE would prefer to be hiking twice per year in a normal environment. However, Brexit will determine the pace of any further tightening and, at this stage, we see one hike next May (taking Bank Rate to 1.00%) and then two further hikes in 2020.
-20%
-10%
0%
10%
20%
30%
1999 2001 2003 2005 2007 2009 2011 2013 2015 2017
Real EUR/GBP deviation away from the BEER fair value
+ / - 1.5 standard deviation
Very expensive
Very cheap
EUR/GBP turned expensive
-5%
-3%
-1%
1%
3%
5%
Jan 18 Jul 18 +/- 1.5 standard deviation Risk premium
The estimate of EUR/GBP risk premium. A residual between EUR/GBP fair value and spot.
Post Chequers "local" peak in sterling risk premium
worth of around 4%

FX Outlook 2019 November 2018
22
2019 will be a difficult year for the central bank (PBoC) to manage yuan movement as the trade wars escalates. At the time of writing, the USD/CNY has depreciated by more than 7% in 2018, to 6.94. We project a 4% depreciation of CNY against the USD from 7.00 at the end of 2018 to 7.30 by the end of 2019.
The biggest factor that will determine the yuan trend in 2019 will be how the trade war with the US unfolds. With no sign of the stand-off abating, we see a high probability that trade talks between China and the US will deteriorate, and expect increases in tariffs from both sides.
The PBoC does not want to see a rapid depreciation of the yuan given that this would shake market confidence in the Chinese economy and trigger a ‘sell China mentality’. But any escalation in the trade war is likely to speed up yuan depreciation in 2019.
We consider three factors that could potentially keep yuan depreciation in check in 2019: (1) the central bank can continue to keep outflows limited; (2) the government can break the connection between a weakening yuan and a falling A-share index; and (3) a slight loosening of monetary policies.
On the first factor, from the outset of the trade war, the PBoC has minimised outflows by imposing reserves on short yuan positions in the forward market. The scale of 2018 outflows is not comparable to the exodus seen during 2015 and 2016 (Figure 34).
Fig 34 Despite a 7% CNY fall, only a small capital outflow seen in 2018
Fig 35 Expect balanced net capital flows in 2019
Source: ING, Bloomberg Source: ING, Bloomberg
6.0
6.2
6.4
6.6
6.8
7.0
7.21500
2000
2500
3000
3500
4000
4500
Jan 15 Jul 15 Jan 16 Jul 16 Jan 17 Jul 17 Jan 18 Jul 18
China foreign reserves (US$bn) USD/CNY (reversed)
6.0
6.2
6.4
6.6
6.8
7.0
7.2-800
-600
-400
-200
0
200
Jan 15 Jul 15 Jan 16 Jul 16 Jan 17 Jul 17 Jan 18 Jul 18
Fx balance of banks on behalf of clients (CNYbn)PBoC position for fx purchase (CNYbn)USD/CNY (reversed, rhs)
CNY: A line in the sand? • We project a 4% depreciation of CNY against the USD, from 7.00 at the end of
2018 to 7.30 by the end of 2019
• An ongoing escalation of the trade war with the US will be the biggest factor driving the yuan’s direction in 2019
• We consider several ways in which the government can act to mitigate the impact of the trade war and maintain confidence in the market
Iris Pang Economist, Greater China Hong Kong +852 2848 8071 [email protected]

FX Outlook 2019 November 2018
23
Tackling the second factor will not be straightforward for the government; if the market believes that the yuan will weaken as the trade war escalates and that corporate earnings of exporters will be impacted as a consequence, investor confidence and the A-share index will get hit. Without action from the government to disconnect the two, the central bank will be reluctant to let the USD/CNY pass beyond the 7.0 handle in an attempt to avoid the ripple effect on the stock market.
Without intervention, we believe that the escalating trade war will push the yuan to depreciate to the 7.0 handle before the end of 2018.
However, if the government were to intervene and allow the USD/CNY to linger too long under the 7.0 handle, the outcome could be just as bad as allowing it to cross the line earlier. It might consolidate market belief that the 7.0 handle means the yuan is too weak and must be avoided at all costs.
If USD/CNY is to break above 7.00 next year as we believe, breaking the connection between a weaker yuan and a falling A-share index is all the more important. To do so, the central government will need to increase its support to exporters, or corporates, in general.
Fig 36 Strong relationship between CNY and A-share index
Fig 37 USD/CNY to follow DXY in 1H19 and diverge in 2H19
Source: ING, Bloomberg Source: ING, Bloomberg
For the third factor, we expect a gradual loosening of monetary policy by the central bank to avoid surprising the market with big policy movements. A dramatic easing of policy could trigger concerns of a severe economic downturn. We expect four cuts to the required reserve ratio (RRR) ranging from 0.5 to 1.0 percentage points each, and two cuts in the 7-day PBoC policy rates, each of 5 basis points, to keep the interest rate stable as the risk premium increases with any escalation in the trade war
A mild yuan depreciation is the most likely path in 2019. As the trade war progresses, the yuan is expected to depreciate further, but the government is unlikely to let yuan depreciation threaten confidence in economic stability. We therefore assign a high probability of mild yuan depreciation against the dollar of 4%, to 7.30.
We also consider a scenario in which the trade war between China and the US ends positively in 2019 and the direction of the yuan changes. Though this is not our baseline scenario, there is a small chance that China and the US negotiate successfully to unwind all the tariffs. Then the yuan would appreciate as confidence returns and exporters celebrate. We see this scenario driving the USD/CNY back to 6.5.
As in last year’s forecast, we do not expect the central bank to focus on the RMB index (called the RMB CFET Index) as a policy tool because the CNY basket index is merely a passive indicator that reflects a weighted average of the dollar and other currencies against the yuan via USD/CNY.
2800
3000
3200
3400
3600
3800
4000
4200
4400
Jan 16 Jul 16 Jan 17 Jul 17 Jan 18 Jul 18
6.2
6.3
6.4
6.5
6.6
6.7
6.8
6.9
7.0
USDCNY (reversed, rhs) A-share index
86
88
90
92
94
96
98
100
6.20
6.30
6.40
6.50
6.60
6.70
6.80
6.90
7.00
Jan 18 Mar 18 May 18 Jul 18 Sep 18 Nov 18
USD/CNY DOLLAR INDEX (rhs)
Don’t focus on RMB CFETS index as it is a passive indicator. USD/CNY is the exchange rate policy tool
7.0 is just a line in the sand
The government needs to disconnect the yuan and A-share index
Not crossing the 7.0 handle could be equally as bad for the market
What if all the tariffs are cancelled?
The PBOC will opt for gradual loosening. Big policy movements could stoke fears of a sharper slowdown
7.30 is our forecast for USD/CNY and USD/CNH in 2019

FX Outlook 2019 November 2018
24
We also expect the onshore yuan (USD/CNY) and offshore yuan (USD/CNH) spread to narrow continuously (Figure 38). As long as the trade war continues, the CNY will guide the CNH on a daily basis so that the offshore market will not generate an unnecessary surprise to the onshore market.
Overall, we expect China’s GDP growth to slow on the back of trade. We forecast GDP growth decelerating from 6.6% in 2018 to 6.3% in 2019.
The slowdown should be mild because of the aggressive fiscal stimulus of CNY9-10tr spread between 2H18 and 2020 to support the economy via tax cuts, export tax rebates, creating capital pools for high tech projects and private-owned enterprises.
Fig 38 Onshore and offshore yuan will converge Fig 39 Lower RRR is one factor driving a weaker CNY
Source: ING, Bloomberg Source: ING, Bloomberg
-500
-400
-300
-200
-100
0
100
200
300
400
500
6.0
6.1
6.2
6.3
6.4
6.5
6.6
6.7
6.8
6.9
7.0
Jan 18 Mar 18 May 18 Jul 18 Sep 18 Nov 18
CNH-CNY USD/CNH USD/CNY
12
13
14
15
16
17
18
19
20
21
226.0
6.1
6.2
6.3
6.4
6.5
6.6
6.7
6.8
6.9
7.0
Sep 10 Sep 11 Sep 12 Sep 13 Sep 14 Sep 15 Sep 16 Sep 17 Sep 18
USD/CNY Required reserve ratio (%) (rhs)
USD/CNY and USD/CNH to nearly become one
We expect a mild slowdown in economic growth as aggressive fiscal stimulus is expected

FX Outlook 2019 November 2018
25
While welcoming the recovery in Swiss growth this year, the SNB may not welcome the renewed strength in CHF. 2018 was meant to be the year that the ECB pushed ahead with its monetary normalisation and EUR/CHF pushed back above 1.20. Instead, Eurozone growth inexplicably slowed sharply and the outlook for 2019 is not particularly encouraging either.
Let’s start by looking at the Swiss activity story. Here’s what ING’s Swiss economist, Charlotte de Montpellier, has to say:
On GDP: “Switzerland has outperformed the Eurozone since late 2017, largely due to the depreciation of CHF from the prior summer. Swiss exports performed well and exports of goods and services grew annually above 3% for four consecutive quarters. Strong international demand also encouraged Swiss companies to increase their production capacity and investments in capital goods grew strongly. Besides that, private consumption has also resumed growth, thanks to rising confidence and rising nominal wages following the increase of inflation.”
As Figure 40 shows, we expect Swiss GDP outperformance to wane through 2019 such that by the end of the year, Eurozone and Switzerland QoQ growth rates will be similar at near 0.3%.
Fig 40 Swiss economic out-performance to wane in 2019
Source: ING
0.0
0.5
1.0
1.5
2.0
2.5
3.0
3.5
-0.4-0.20.00.20.40.60.81.01.2
Q4
2013
Q1
2014
Q2
2014
Q3
2014
Q4
2014
Q1
2015
Q2
2015
Q3
2015
Q4
2015
Q1
2016
Q2
2016
Q3
2016
Q4
2016
Q1
2017
Q2
2017
Q3
2017
Q4
2017
Q1
2018
Q2
2018
Q3
2018
Q4
2018
FQ
1 20
19F
Q2
2019
FQ
3 20
19F
Q4
2019
F
Eurozone (%qoq GDP growth) Switzerland (%qoq GDP growth)
Eurozone (%yoy GDP growth, rhs) Switzerland (%yoy GDP growth, rhs)
Chris Turner Global Head of Strategy London +44 20 7767 1610 [email protected]
Charlotte de Monpellier Economist, Switzerland Brussels +32 2 547 3386 [email protected]
CHF: SNB stays cautious • Instead of enjoying an ECB tightening cycle and a higher EUR/CHF, the SNB now
has to ride out a weaker EUR/CHF on the back of Italian budgetary woes
• Doubts may emerge as to the SNB’s ability to undertake extensive FX intervention again – since Switzerland is on the US Treasury’s monitoring list
• USD strength and low Swiss inflation mean that CHF real trade weighted indices are between 15% and 18% off their highs. Greater SNB tolerance for CHF strength?

FX Outlook 2019 November 2018
26
On SNB policy, Charlotte says: “Given the importance of exports to the Swiss economy, the SNB closely monitors the CHF. A strong appreciation of the CHF tends to reduce growth and depress inflation, which is not very high and remains a cause of concern for the SNB (1.1% in October, underlying inflation at 0.4%). In order to avoid excessive appreciation of the CHF, the SNB maintains an ultra-loose monetary policy with negative interest rates (policy rate is 3m CHF Libor at -0.75%) and is willing to intervene in foreign exchange markets if needed.”
“In order to avoid an excessive appreciation of CHF, we believe that the SNB will not raise interest rates until the ECB moves first. Moreover, given that the Swiss franc is considered a safe haven, geopolitical tensions, Brexit-related problems, the Italian budget, the trade war and the slowdown in world growth tend to push the Swiss franc higher, as we have seen since the summer of 2018. We therefore do not expect a rate hike by the SNB before the first quarter of 2020.”
Fig 41 Stronger CHF reduces chances of SNB hikes Fig 42 CHF trade weighted indices off their highs
Source: Bloomberg, ING Source: SNB
The trouble for the SNB is that the policy rate is already at -0.75% and the SNB has been reliant on FX intervention to rein in the ‘highly valued’ CHF.
If, as we believe, the EUR stays soft into March 2019 on Italian budgetary concerns and potential sovereign downgrades, the SNB will again be called upon to intervene. In the twelve months to June 2018, the US Treasury noted the SNB had intervened to the tune of US$17bn, around 2.4% of Switzerland’s GDP. And being on the US Treasury’s monitoring list, the SNB does have to be a little careful.
Switzerland already fulfils two of the US Treasury’s three criteria for being named a currency manipulator and Swiss authorities may not have much appetite in appearing more firmly on Washington’s radar by undertaking significant intervention again.
In gauging the SNB’s tolerance for CHF strength it may also be worth looking at the SNB’s own trade weighted indices. Nominal indices are 8-10% off their highs seen when the SNB exited the 1.20 EUR/CHF floor in January 2015. But because of low Swiss inflation relative to trading partners, real CHF trade weighted indices are 15-18% off their highs. Does that mean the SNB has a little greater tolerance for CHF strength?
In all, another tough year for the EUR – glacial ECB normalisation, the Italian budget, European Parliamentary elections – suggest the SNB may have to suffer EUR/CHF in the 1.08/10 region early next year. Should the ECB be able to deliver its first rate rises in the cycle late in 2019, EUR/CHF has a shot at recovering to 1.15. But 2019 looks to be a year of downside risks to this cross rate.
-0.50
-0.25
0.00
0.25
1.06
1.08
1.10
1.12
1.14
1.16
1.18
1.20
Jan 17 Apr 17 Jul 17 Oct 17 Jan 18 Apr 18 Jul 18 Oct 18
EUR/CHF
Market pricing of SNB policyrate end 2020 (RHS %)
100
110
120
130
140
150
160
170
Jan 14 Jan 15 Jan 16 Jan 17 Jan 18
CHF Nominal Overall index CHF Nominal Euro indexCHF Real Overall index CHF Real Euro index
2000 = 100
1.15 End-2019 EUR/CHF
FX Outlook 2019 November 2018
27
Commodity impact When we talk about commodity currencies, we ought to remember that we are not talking about a homogenous group of economies. Merely ones for which commodities make up a disproportionate percentage of the total product or export basket.
For Canada, Australia and New Zealand, the differences are stark. Canada has been having a tough time as major oil pipeline constraints in the country have caused the Western Canada Select (WCS) discount to Western Texas Intermediate (WTI) to widen. With no short-term, or even medium-term capacity solution in sight, there could be some further bad news for CAD embedded in the decline in oil prices. But energy is actually now a bigger deal for Australia as a proportion of all its exports.
Fig 43 $-Bloc export/commodity composition
Source: CEIC
Figure 43 shows the top 10 export groups for each economy (which collectively account for the lion’s share of all exports) on a relative basis.
For Canada, whilst oil and other fuels account for more than one-fifth of this top ten group, metals a further 6-7% and agricultural output another 5%, machinery (including vehicles) accounts for more than half of this selected total. Put it another way, Canada is less of a commodity currency than either Australia or New Zealand. In contrast, the sum
0%10%20%30%40%50%60%70%80%90%
100%
Canada Australia New Zealand
Oil, fuels, chem and plastics Machines / vehicles Metals / ores
Agriculture / lumber Other
$-Bloc: Three commodity currencies with very different outlooks • CAD is at the vanguard of the Bloc with the BoC now normalising rates after trade
deals appear to be in place - though some new doubts are resurfacing
• AUD is the laggard of the three with a stronger negative influence from China and a central bank that appears to be happy seeing the AUD slide
• NZD is the big surprise, closing the gap with the AUD amidst big labour market improvements and doubt about the two-way policy steer from the RBNZ
Rob Carnell Chief Economist & Head of Research, Asia-Pacific Singapore +65 6232 6020 [email protected]

FX Outlook 2019 November 2018
28
of commodity exports for Australia and New Zealand, viewed in this way, account for about 70% of the top ten categories, though in New Zealand’s case, this is predominantly dairy, meat and cereals (softs) whilst in Australia’s case, metals/ores and fuels account for the bulk, with agricultural output a far smaller proportion.
So figuring out a common commodity thread for these economies is probably a wasted effort. For Australia, the relevant sphere of commodity influence is China. And, for
example, a plot of the CRB metals index against the inverted USD/CNY gives a particularly good fit over the past 24 months. Anticipating some further CNY weakness in 2019, we can extrapolate this to weaker metals prices and, in turn, a weaker AUD.
Fig 44 Metals prices and (inverted) USD/CNY
Source: Bloomberg
For Canada, the key metric is not a commodity at all, but the strength of the US manufacturing economy relative to that of Canada. Right now, having been extremely strong, Canadian manufacturing is picking up whilst in the US, it might be peaking out. That could provide some CAD support as we run through 2019.
Fig 45 USD/CAD and relative PMI strength
Source: Bloomberg
For New Zealand, the best that we can say is that softs demand will be less demand sensitive than metals or manufactured goods. On the supply side though, it is likely to be more influenced by the weather, rainfall, etc.
6.2
6.3
6.4
6.5
6.6
6.7
6.8
6.9
7.0
7.1800
820
840
860
880
900
920
940
960
980
1,000
Jan 17 Apr 17 Jul 17 Oct 17 Jan 18 Apr 18 Jul 18 Oct 18
CRB metals index USD/CNY, rhs, inv
Index USD/CNY
1.20
1.22
1.24
1.26
1.28
1.30
1.32
1.34
1.36
1.38
1.40
-2
-1
0
1
2
3
4
5
6
Jan 16 Apr 16 Jul 16 Oct 16 Jan 17 Apr 17 Jul 17 Oct 17 Jan 18 Apr 18 Jul 18 Oct 18
US-CAN PMI differential, lhs USD/CAN, rhs
PMI differential - points USD/CAD
“Looking for a common commodity thread for the $-bloc is a wasted effort”

FX Outlook 2019 November 2018
29
In Figure 46, we show the Southern Oscillation index, a measure of the deviation of sea level air-pressure at different points in the Pacific, which drives phenomena such as El Niño and La Niña. These fluctuating weather cycles can alter mean temperature and precipitation in the southern hemisphere, by shifting the prevailing Humboldt winds and bringing more or less moisture over the land.
With the reading at 3, the index is currently neutral, but indications are growing that an El Niño event is an increasing probability. While this can bring drought and floods to different parts of the country, the net effect seems to be
that El Niño works to weaken the NZD – higher softs prices as supply falls may be undermined by lower volumes and other factors such as low replenishment of rainfall-dependent hydro lakes and energy production.
Fig 46 NZD/USD and EL Niño
Source: Bloomberg
Canada The Bank of Canada (BoC) is set to remain in policy normalisation mode in response to an economy operating close to potential; Canadian growth has been strong and GDP growth should average 2.5% this year. Even with a mild slowdown forecast, growth should remain healthy – we expect 2.1% in 2019.
Our growth predictions (and thus policy rate predictions) assume some trade relief on the back of the United-States-Mexico-Canada-Agreement (USMCA) agreed in late September.
This though, has yet to be formally ratified by Congress. And if this remains the case, could present a downside risk to our forecasts.
The front-runner for house majority leader, Nancy Pelosi, has already indicated that she would like to see a better agreement with regard to labour and the environment. Until Congress approves the agreement, market uncertainty will persist.
On the surface, the Canadian labour market looks good, with the unemployment rate at a four-decade-low of 5.8%. But wages growth has declined for five months in a row now; and may point to some hidden slack.
We do see a pick-up in wages on the horizon. Firms have recently reported labour shortages are a major production capacity constraint and plan to increase hiring. This should add some upward impetus to wage growth next year, though as we have seen in the US, you can wait a very long time before that materialises.
0.560.580.600.620.640.660.680.700.720.740.760.78
-25
-20
-15
-10
-5
0
5
10
15
20
Jan 15 Jul 15 Jan 16 Jul 16 Jan 17 Jul 17 Jan 18 Jul 18
El Nino Oscillation index, lhs NZD/USD, rhs
EL Nino Oscillation Index NZD/USD
“New Zealand’s commodity prices are as determined by the weather as they are by
global demand factors”
“BoC – hiking the most of the three central banks over our forecast horizon”
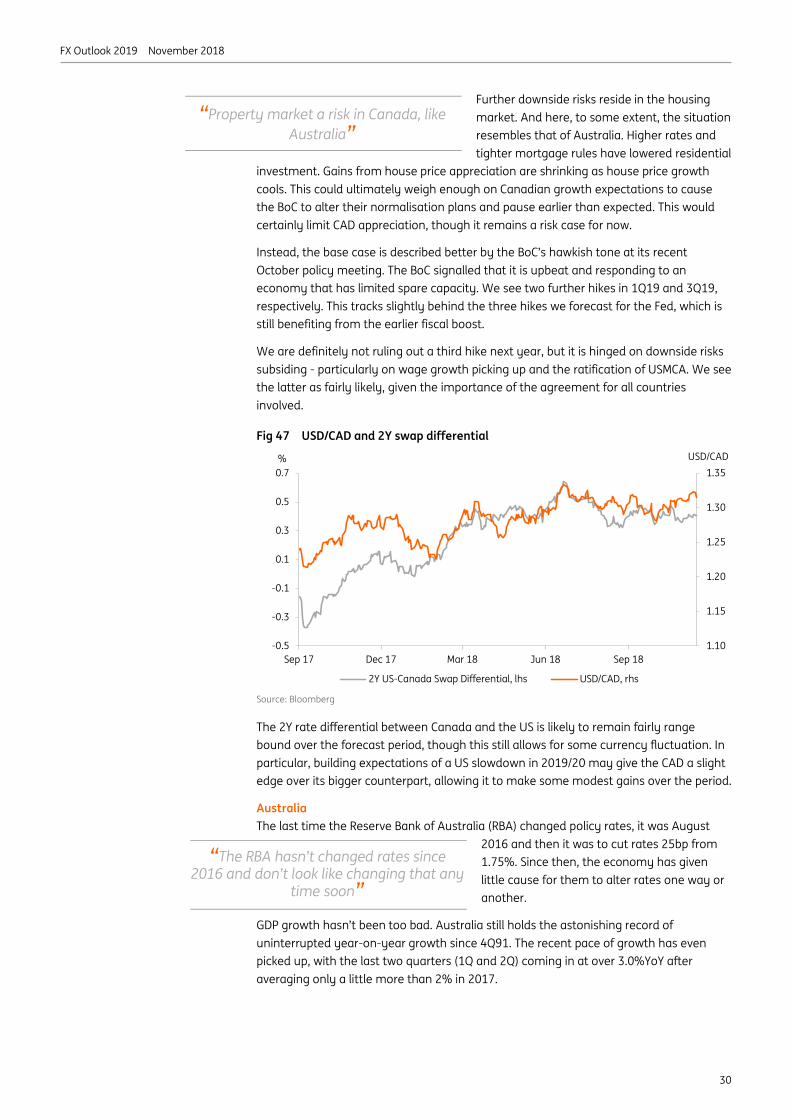
FX Outlook 2019 November 2018
30
Further downside risks reside in the housing market. And here, to some extent, the situation resembles that of Australia. Higher rates and tighter mortgage rules have lowered residential
investment. Gains from house price appreciation are shrinking as house price growth cools. This could ultimately weigh enough on Canadian growth expectations to cause the BoC to alter their normalisation plans and pause earlier than expected. This would certainly limit CAD appreciation, though it remains a risk case for now.
Instead, the base case is described better by the BoC’s hawkish tone at its recent October policy meeting. The BoC signalled that it is upbeat and responding to an economy that has limited spare capacity. We see two further hikes in 1Q19 and 3Q19, respectively. This tracks slightly behind the three hikes we forecast for the Fed, which is still benefiting from the earlier fiscal boost.
We are definitely not ruling out a third hike next year, but it is hinged on downside risks subsiding - particularly on wage growth picking up and the ratification of USMCA. We see the latter as fairly likely, given the importance of the agreement for all countries involved.
Fig 47 USD/CAD and 2Y swap differential
Source: Bloomberg
The 2Y rate differential between Canada and the US is likely to remain fairly range bound over the forecast period, though this still allows for some currency fluctuation. In particular, building expectations of a US slowdown in 2019/20 may give the CAD a slight edge over its bigger counterpart, allowing it to make some modest gains over the period.
Australia The last time the Reserve Bank of Australia (RBA) changed policy rates, it was August
2016 and then it was to cut rates 25bp from 1.75%. Since then, the economy has given little cause for them to alter rates one way or another.
GDP growth hasn’t been too bad. Australia still holds the astonishing record of uninterrupted year-on-year growth since 4Q91. The recent pace of growth has even picked up, with the last two quarters (1Q and 2Q) coming in at over 3.0%YoY after averaging only a little more than 2% in 2017.
1.10
1.15
1.20
1.25
1.30
1.35
-0.5
-0.3
-0.1
0.1
0.3
0.5
0.7
Sep 17 Dec 17 Mar 18 Jun 18 Sep 18
2Y US-Canada Swap Differential, lhs USD/CAD, rhs
% USD/CAD
“Property market a risk in Canada, like Australia”
“The RBA hasn’t changed rates since 2016 and don’t look like changing that any
time soon”
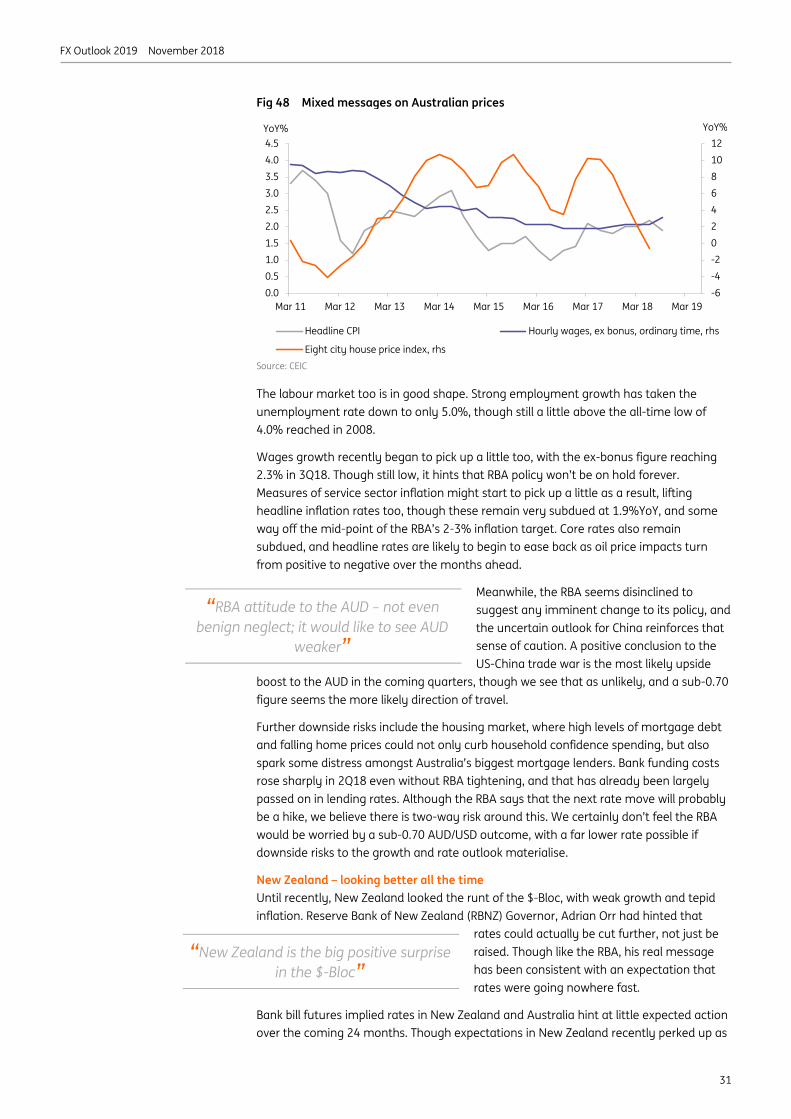
FX Outlook 2019 November 2018
31
Fig 48 Mixed messages on Australian prices
Source: CEIC
The labour market too is in good shape. Strong employment growth has taken the unemployment rate down to only 5.0%, though still a little above the all-time low of 4.0% reached in 2008.
Wages growth recently began to pick up a little too, with the ex-bonus figure reaching 2.3% in 3Q18. Though still low, it hints that RBA policy won’t be on hold forever. Measures of service sector inflation might start to pick up a little as a result, lifting headline inflation rates too, though these remain very subdued at 1.9%YoY, and some way off the mid-point of the RBA’s 2-3% inflation target. Core rates also remain subdued, and headline rates are likely to begin to ease back as oil price impacts turn from positive to negative over the months ahead.
Meanwhile, the RBA seems disinclined to suggest any imminent change to its policy, and the uncertain outlook for China reinforces that sense of caution. A positive conclusion to the US-China trade war is the most likely upside
boost to the AUD in the coming quarters, though we see that as unlikely, and a sub-0.70 figure seems the more likely direction of travel.
Further downside risks include the housing market, where high levels of mortgage debt and falling home prices could not only curb household confidence spending, but also spark some distress amongst Australia’s biggest mortgage lenders. Bank funding costs rose sharply in 2Q18 even without RBA tightening, and that has already been largely passed on in lending rates. Although the RBA says that the next rate move will probably be a hike, we believe there is two-way risk around this. We certainly don’t feel the RBA would be worried by a sub-0.70 AUD/USD outcome, with a far lower rate possible if downside risks to the growth and rate outlook materialise.
New Zealand – looking better all the time Until recently, New Zealand looked the runt of the $-Bloc, with weak growth and tepid inflation. Reserve Bank of New Zealand (RBNZ) Governor, Adrian Orr had hinted that
rates could actually be cut further, not just be raised. Though like the RBA, his real message has been consistent with an expectation that rates were going nowhere fast.
Bank bill futures implied rates in New Zealand and Australia hint at little expected action over the coming 24 months. Though expectations in New Zealand recently perked up as
-6-4-2024681012
0.00.51.01.52.02.53.03.54.04.5
Mar 11 Mar 12 Mar 13 Mar 14 Mar 15 Mar 16 Mar 17 Mar 18 Mar 19
Headline CPI Hourly wages, ex bonus, ordinary time, rhs
Eight city house price index, rhs
YoY% YoY%
“RBA attitude to the AUD – not even benign neglect; it would like to see AUD
weaker”
“New Zealand is the big positive surprise in the $-Bloc”
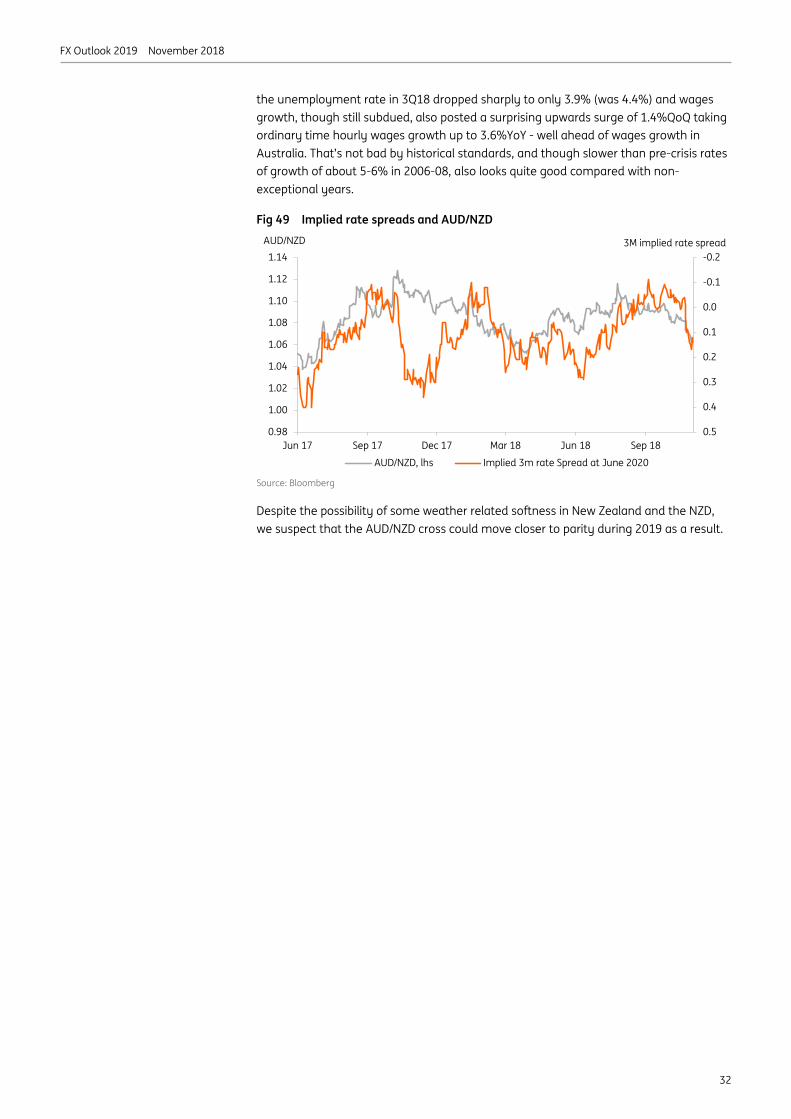
FX Outlook 2019 November 2018
32
the unemployment rate in 3Q18 dropped sharply to only 3.9% (was 4.4%) and wages growth, though still subdued, also posted a surprising upwards surge of 1.4%QoQ taking ordinary time hourly wages growth up to 3.6%YoY - well ahead of wages growth in Australia. That’s not bad by historical standards, and though slower than pre-crisis rates of growth of about 5-6% in 2006-08, also looks quite good compared with non-exceptional years.
Fig 49 Implied rate spreads and AUD/NZD
Source: Bloomberg
Despite the possibility of some weather related softness in New Zealand and the NZD, we suspect that the AUD/NZD cross could move closer to parity during 2019 as a result.
-0.2
-0.1
0.0
0.1
0.2
0.3
0.4
0.50.98
1.00
1.02
1.04
1.06
1.08
1.10
1.12
1.14
Jun 17 Sep 17 Dec 17 Mar 18 Jun 18 Sep 18
AUD/NZD, lhs Implied 3m rate Spread at June 2020
AUD/NZD 3M implied rate spread
FX Outlook 2019 November 2018
33
2019 commodities outlook 2018 has been quite the year for the commodities complex. Sanctions and growing trade tensions led to increased volatility in markets, and with still plenty of uncertainty around these, they are likely to remain key drivers for the commodities complex over 2019.
Crude oil – the surplus returns There has been plenty of uncertainty around the oil market over 2018, particularly with the return of US sanctions against Iran, and what it would mean for Iranian oil exports. As a result, OPEC+ decided to relax compliance with its production cut deal, which has seen the group producing at levels last seen back in November 2016. Meanwhile both Russia and the US are producing at record levels. This strong production growth, along with Iranian waivers has meant that the global oil market is set to be well supplied as we move into 2019. Demand growth is also a concern, largely driven by trade tensions. We expect the global oil market to see a sizeable surplus over the first half of 2019, and therefore expect that OPEC+ will agree to another round of production cuts at its December meeting. Confirmation of further cuts should be supportive for prices in the near term, but as we move through 2019, we expect ICE Brent to trend back towards the mid-US$60/bbl, driven by non-OPEC supply growth.
Copper – trade concerns weigh on the market Copper prices have been weighed down heavily by concerns over the ongoing trade war. However, trade tensions appear to be having little impact on Chinese copper demand, with both strong imports and physical premiums in the spot market. Meanwhile prompt spreads also suggest tightness in the spot market, and this is confirmed by low inventory levels. Moving into 2019, the copper market is set to continue to tighten. We currently forecast small deficits, and therefore the need to see higher prices to incentivise investment in mining projects. We believe that copper needs to trade up towards the US$7,000/t level in order to attract this investment, and given that it takes several years to develop mines, prices need to trend higher sooner rather than later. The key downside risk is obviously a further deterioration in trade, combined with Chinese stimulus not being as effective as hoped for.
Iron ore – stronger prices… for now Having seen a significant sell-off earlier in the year, iron prices have recovered over the second half of the year, with the market trading back towards US$75/t. Quality premiums have remained strong over much of the year, as healthy steel margins and China’s anti-pollution drive pushes buyers towards higher quality iron ore. However, saying that, Chinese iron ore imports are marginally lower so far this year, with domestic inventories drawn down instead. Looking ahead, we expect prices to trend towards US$60/t by the end of 2019. We continue to see growing seaborne supply, while Chinese iron ore demand appears to have peaked. Concerns over China’s economy certainly doesn’t help either.
Coal – continues to defy expectations The coal market has had yet another strong year, with Newcastle coal trading to as high as US$120/t - levels last seen back in 2011. This strength has come largely from stronger Chinese import demand, while in Europe a hot summer has also been supportive. Meanwhile, coking coal prices have been supported by strong Chinese steel margins. Looking ahead, US weather forecaster, NOAA is expecting an 80% chance of a weak El Niño weather event over the northern hemisphere winter, which usually means a milder winter in North Asia. Realisation of this, along with the second winter where we see a move away from Chinese residential coal-fired heating to gas, should mean that we do not see a significant seasonal pickup in coal imports. Meanwhile the broader trend of energy transition should weigh on coal demand growth and, as a result, on prices moving forward.
Special Feature
Warren Patterson Commodities Strategist Amsterdam 31 20 563 8921 [email protected]
RUB CAD
NOK RUB
CLP PEN
INR CNY
BRL ZAR AUD
ZAR RUB
IDR COP AUD

FX Outlook 2019 November 2018
34
Soybeans – all about the trade war The soybean market has been weighed down heavily this year by China’s retaliatory trade tariffs on US soybeans. These tariffs come at a time when the US is set to see a record harvest and, with Chinese buyers turning increasingly to South American soybeans, US inventories will be fairly large moving into next season. While CBOT prices have come under pressure, physical cash values for South American beans have strengthened considerably over the year. Trade talks between China and the US will largely dictate soybean prices over 2019. If tariffs on US soybeans remain in place, we struggle to see soybean prices trading above US$9/bu over the course of 2019. In fact prices need to trade at levels that persuade farmers to switch to another crop, such as corn. If China and the US come to some sort of deal, this does increase the upside for soybean prices, however a deal will need to be made fairly quickly, as farmers will be finalising planting intentions over 1Q19.
BRL

FX Outlook 2019 November 2018
35
Theme 1: Limited scope for Scandinavian FX bull market vs EUR We don’t see much scope for a rally of Scandinavian currencies against EUR in 2019. This is because we see a fairly limited scope for both the Norges Bank and the Riksbank to meaningfully out-hike the ECB during the current cycle. The high levels (both in absolute and relative terms – Figure 50 of household debt in both countries means that:
1) a sharp rise in interest rates would hurt households disproportionately and pose a risk to the economy (for example, around 70% of mortgages in Sweden are floating rate, making transmission fairly rapid);
2) the transmission mechanism from interest rates into the real economy is stronger than in previous hiking cycles as higher policy rates will have a greater and more immediate impact on households’ spending power.
All this means that the tightening cycle in both Sweden and Norway will be fairly limited and thus not prompt a pronounced strength in the respective currencies vs EUR (where the ECB will also embark on a fairly shallow tightening cycle – see EUR section, page 13). That’s why we don’t expect EUR/SEK to break back below 10.00 in 2019 and look for EUR/NOK to stay above 9.30 (with the 9.40 level to continue proving a strong support for the cross). For SEK, this means that the currency will remain undervalued vs EUR (Figure 51) while the EUR/NOK valuation gap should close (Figure 52).
Of course, better relative data points and an occasionally more risk-friendly environment may prompt stronger Scandinavian FX vs EUR but, given the stage of the global business cycle, such occasions are unlikely to be prolonged. Also, the expected slowdown in global trade volumes is unlikely to be a positive for either of the Scandies.
Theme 2: The year of the diverging halves for NOK and SEK We expect NOK to outperform SEK in 1H19. First, the Swedish economy is set to slow as construction falls and household spending decelerates after a long period of strong growth. In contrast, Norway is moving from a recovery to expansion phase after the 2014-16 oil slump, and should continue recording a stable growth. Pure economic data and growth dynamics should thus put some upside pressure on NOK/SEK during 1H19. The situation should reverse in the second half of the year (Figure 53) as we expect the Swedish economy to recover a bit and Norway’s above trend growth to slow a little. This should cause some catch-up for SEK relative to NOK.
Scandies: Still no strong rally in sight • We see three key themes for Scandie FX in 2019:
1) Limited scope for sustained NOK or SEK rallies vs EUR. EUR/SEK to stay above 10.00 and EUR/NOK above 9.30
2) NOK outpacing SEK in 1H19 due to diverging growth dynamics, likely early Swedish elections and bottoming oil price. This equates to NOK/SEK 1.10 in 1H19
3) Bigger case for stronger NOK vs SEK due in part to higher Norges Bank tolerance for stronger FX. Compared to 2018, the housing market is not the theme for 2019
Petr Krpata, CFA Chief EMEA FX and IR Strategist London +44 20 7767 6561 [email protected]
Jonas Goltermann Developed Market Economist London +44 20 7767 6909 [email protected]
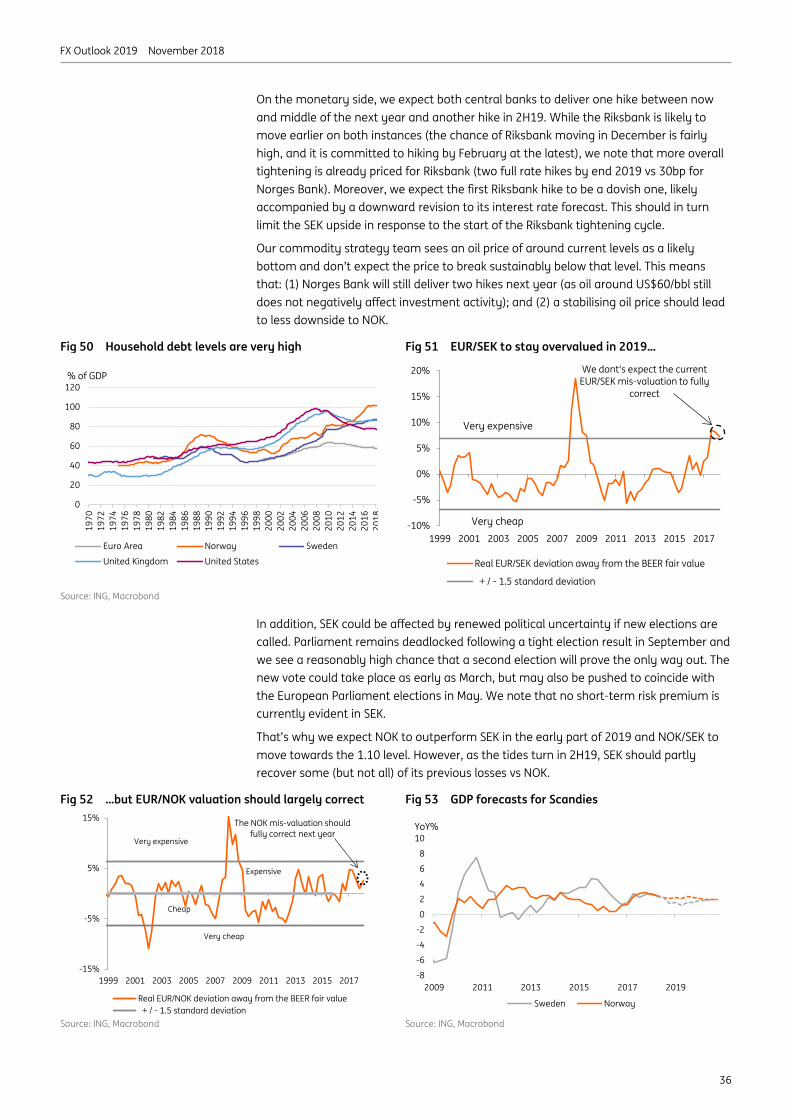
FX Outlook 2019 November 2018
36
On the monetary side, we expect both central banks to deliver one hike between now and middle of the next year and another hike in 2H19. While the Riksbank is likely to move earlier on both instances (the chance of Riksbank moving in December is fairly high, and it is committed to hiking by February at the latest), we note that more overall tightening is already priced for Riksbank (two full rate hikes by end 2019 vs 30bp for Norges Bank). Moreover, we expect the first Riksbank hike to be a dovish one, likely accompanied by a downward revision to its interest rate forecast. This should in turn limit the SEK upside in response to the start of the Riksbank tightening cycle.
Our commodity strategy team sees an oil price of around current levels as a likely bottom and don’t expect the price to break sustainably below that level. This means that: (1) Norges Bank will still deliver two hikes next year (as oil around US$60/bbl still does not negatively affect investment activity); and (2) a stabilising oil price should lead to less downside to NOK.
Fig 50 Household debt levels are very high Fig 51 EUR/SEK to stay overvalued in 2019…
Source: ING, Macrobond
In addition, SEK could be affected by renewed political uncertainty if new elections are called. Parliament remains deadlocked following a tight election result in September and we see a reasonably high chance that a second election will prove the only way out. The new vote could take place as early as March, but may also be pushed to coincide with the European Parliament elections in May. We note that no short-term risk premium is currently evident in SEK.
That’s why we expect NOK to outperform SEK in the early part of 2019 and NOK/SEK to move towards the 1.10 level. However, as the tides turn in 2H19, SEK should partly recover some (but not all) of its previous losses vs NOK.
Fig 52 ...but EUR/NOK valuation should largely correct Fig 53 GDP forecasts for Scandies
Source: ING, Macrobond Source: ING, Macrobond
0
20
40
60
80
100
120
1970
1972
1974
1976
1978
1980
1982
1984
1986
1988
1990
1992
1994
1996
1998
2000
2002
2004
2006
2008
2010
2012
2014
2016
2018
Euro Area Norway Sweden
United Kingdom United States
% of GDP
-10%
-5%
0%
5%
10%
15%
20%
1999 2001 2003 2005 2007 2009 2011 2013 2015 2017
Real EUR/SEK deviation away from the BEER fair value
+ / - 1.5 standard deviation
Very expensive
Very cheap
We dont's expect the current EUR/SEK mis-valuation to fully
correct
-15%
-5%
5%
15%
1999 2001 2003 2005 2007 2009 2011 2013 2015 2017
Real EUR/NOK deviation away from the BEER fair value + / - 1.5 standard deviation
Very expensive
Cheap
Expensive
Very cheap
The NOK mis-valuation should fully correct next year
-8
-6
-4
-2
0
2
4
6
8
10
2009 2011 2013 2015 2017 2019
Sweden Norway
YoY%

FX Outlook 2019 November 2018
37
Theme 3: Higher NB tolerance for stronger currency favours NOK vs SEK While the price action between NOK and SEK should vary between the two halves of the year, we generally see the case for a modestly stronger NOK vs SEK. A key reason is that we see the Norges Bank as having greater tolerance for a stronger currency than the Riksbank. Not only has Riksbank previously expressed its unease with an overly strong exchange rate (and preventing SEK from appreciation was a non-negligible factor behind the Riksbank’s easing in past years) but higher household debt levels in Norway (vs Sweden) also mean that, in relative terms the Norges Bank will have a preference for allowing more of the tightening to come through FX rather than interest rates.
Another factor is that Norway benefits from much healthier current account dynamics. Even at the bottom of the 2014-16 oil bust, Norway had a higher current account surplus than Sweden and, with the recovery in energy prices since, the Norwegian surplus is likely to continue improving. Sweden, by contrast, has seen a continuous deterioration in its current account since the financial crisis. While we may see that trend ease next year as Swedish consumption slows, we think the Swedish external position, while favourable overall, compares poorly to rising surpluses in Norway and the Eurozone (Figure 54).
Housing market: Lingering concerns, but no longer the key theme We also note that compared to last year, we don’t expect the theme of a fragile housing market to have a material effect on NOK and SEK. In our view, the worst price falls appear to be behind us, which suggests a limited potential for rising risk premia associated with the housing sector. While slowing construction will weigh on growth, especially in Sweden, this is largely factored into the central bank forecasts.
And although Norway housing market is arguably in a relatively better shape vs Sweden (Figure 55) the reaction function of each of the two central banks to the housing situation is not dissimilar. We don’t see the development in the housing market as the key risk to the overly aggressive tightening cycle, but rather, as discussed above, the structural issue of high levels of indebtedness that will limit the scope for rate increases for years to come.
Fig 54 Current account dynamics favour NOK Fig 55 Housing markets stabilising
Source: ING, Macrobond Source: ING, Macrobond
-202468
1012141618
2002 2004 2006 2008 2010 2012 2014 2016 2018
EZ Sweden Norway
% of GDP
-15-10
-505
1015202530
2006
2006
2007
2008
2008
2009
2010
2010
2011
2012
2012
2013
2014
2014
2015
2016
2016
2017
2018
2018
Sweden, all homes Sweden, flats Norway all homes
%YoY
FX Outlook 2019 November 2018
38
CEE does not look to be an attractive proposition for USD-denominated investors in 1H19. Except for RON, the regional currencies offer a low risk adjusted carry (vs USD) and are levered to EUR/USD, which we expect to struggle in the early part of next year. When measured against USD, the CEE currency segment has a high correlation exposure to EM risk (gauged by MSCI EM equity index) which, like the EUR/USD, we expect to struggle in 1H19 as the trade war rhetoric continues (ie, US raising tariffs on Chinese goods to 25% on 1 January 2019).
Figure 56 shows the results from our Principal Component Analysis (PCA) of key drivers of EM crosses. EM risk and EUR/USD are the two most important factors, explaining more than 50% of variation in EM FX returns. Given our outlook for the first half of 2019 (fragile risk sentiment, lower EUR/USD), CEE FX finds itself in the undesirable top right quadrant – undesirably levered to EUR/USD downside and precarious risk appetite.
Fig 56 CEE FX in the ‘wrong’ quadrant for 1H19 Fig 57 The CEE growth picture in 2019 will be different
Z-score of the first and second principal components (estimated as MSCI EM equity index and EUR/USD, respectively) from our PCA analysis of drivers behind bilateral EM exchange rates vs USD Source: ING
Source: ING
-1.5
-1.0
-0.5
0.0
0.5
1.0
1.5
2.0
2.5
-3 -2 -1 0 1 2 3
EUR/
USD
effe
ct
EM risk effect
CZK
RON PLN
HUF
SGD
TRY
ILS
BRL
RUB
PHP
MXN
High
er s
enst
ivity
to
EU
R/U
SD
Higher senstivity EM risk
Lower senstivity EM riskLo
wer
sen
stiv
ity
to E
UR/
USD
INR
IDR -4%
-2%
0%
2%
4%
6%
8%
Czech Rep Hungary Poland Romania
2017 GDP growth 2019 GDP growth forecastDifference (2019F vs 2017)
% GDP growth (YoY), Actual for 2017 and expected for 2019 based on ING forecast
CEEMEA: Less important EUR effect • For USD investors, CEE looks a better proposition in 2H19 than 1H19 due to our
V-shape EUR/USD profile. But don’t look for a repeat of the 2017 CEE FX rally (when EUR/USD spiked) as, this time, higher EUR/USD will be more about a weaker dollar than a stronger euro. In contrast to 2017, CEE economies will no longer be booming
• We think the worst for HUF is over with the NBH taking a more cautious stance. Any further CZK gains to be heavily reliant on the CNB’s goodwill (rather than EUR/USD).
• While CEE FX is agnostic to oil price variations, oil matters for the USD-bloc. We look for lower TRY but remain constructive on RUB, where sanction risk is the key obstacle to express higher conviction on our flat/carry generating RUB profile
Petr Krpata, CFA Chief EMEA FX and IR Strategist London +44 20 7767 6561 [email protected]
And the EMEA Economics Team
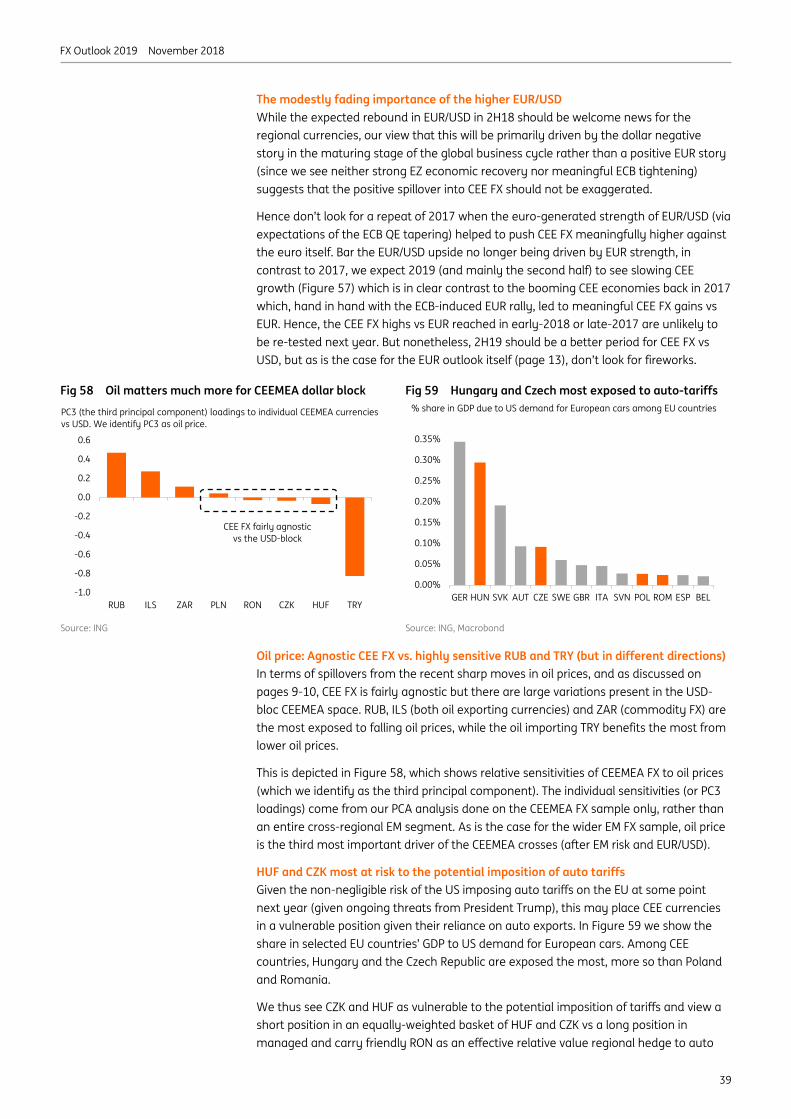
FX Outlook 2019 November 2018
39
The modestly fading importance of the higher EUR/USD While the expected rebound in EUR/USD in 2H18 should be welcome news for the regional currencies, our view that this will be primarily driven by the dollar negative story in the maturing stage of the global business cycle rather than a positive EUR story (since we see neither strong EZ economic recovery nor meaningful ECB tightening) suggests that the positive spillover into CEE FX should not be exaggerated.
Hence don’t look for a repeat of 2017 when the euro-generated strength of EUR/USD (via expectations of the ECB QE tapering) helped to push CEE FX meaningfully higher against the euro itself. Bar the EUR/USD upside no longer being driven by EUR strength, in contrast to 2017, we expect 2019 (and mainly the second half) to see slowing CEE growth (Figure 57) which is in clear contrast to the booming CEE economies back in 2017 which, hand in hand with the ECB-induced EUR rally, led to meaningful CEE FX gains vs EUR. Hence, the CEE FX highs vs EUR reached in early-2018 or late-2017 are unlikely to be re-tested next year. But nonetheless, 2H19 should be a better period for CEE FX vs USD, but as is the case for the EUR outlook itself (page 13), don’t look for fireworks.
Fig 58 Oil matters much more for CEEMEA dollar block Fig 59 Hungary and Czech most exposed to auto-tariffs
Source: ING Source: ING, Macrobond
Oil price: Agnostic CEE FX vs. highly sensitive RUB and TRY (but in different directions) In terms of spillovers from the recent sharp moves in oil prices, and as discussed on pages 9-10, CEE FX is fairly agnostic but there are large variations present in the USD-bloc CEEMEA space. RUB, ILS (both oil exporting currencies) and ZAR (commodity FX) are the most exposed to falling oil prices, while the oil importing TRY benefits the most from lower oil prices.
This is depicted in Figure 58, which shows relative sensitivities of CEEMEA FX to oil prices (which we identify as the third principal component). The individual sensitivities (or PC3 loadings) come from our PCA analysis done on the CEEMEA FX sample only, rather than an entire cross-regional EM segment. As is the case for the wider EM FX sample, oil price is the third most important driver of the CEEMEA crosses (after EM risk and EUR/USD).
HUF and CZK most at risk to the potential imposition of auto tariffs Given the non-negligible risk of the US imposing auto tariffs on the EU at some point next year (given ongoing threats from President Trump), this may place CEE currencies in a vulnerable position given their reliance on auto exports. In Figure 59 we show the share in selected EU countries’ GDP to US demand for European cars. Among CEE countries, Hungary and the Czech Republic are exposed the most, more so than Poland and Romania.
We thus see CZK and HUF as vulnerable to the potential imposition of tariffs and view a short position in an equally-weighted basket of HUF and CZK vs a long position in managed and carry friendly RON as an effective relative value regional hedge to auto
-1.0
-0.8
-0.6
-0.4
-0.2
0.0
0.2
0.4
0.6
RUB ILS ZAR PLN RON CZK HUF TRY
PC3 (the third principal component) loadings to individual CEEMEA currencies vs USD. We identify PC3 as oil price.
CEE FX fairly agnosticvs the USD-block
0.00%
0.05%
0.10%
0.15%
0.20%
0.25%
0.30%
0.35%
GER HUN SVK AUT CZE SWE GBR ITA SVN POL ROM ESP BEL
% share in GDP due to US demand for European cars among EU countries
FX Outlook 2019 November 2018
40
tariff risk. Note that the very saturated positioning in CZK and the potential concerns about execution risk during the start of the Bubor normalisation process may exaggerate the downside moves in both CZK and HUF in a potential non-friendly CEE FX environment.
HUF: The light at the end of the tunnel Omitting the risk of auto-tariffs mentioned above, we are no longer bearish on HUF and see it as unlikely that the cross moves above the 330 level next year. During the first part of 2018, NBH missteps led the market to question its credibility and weakened the forint, which then saw the central bank embarking on a more cautious approach in 2H18 (communicating its intention to gradually exit its ultra-loose monetary stance; lowering upside volatility in Bubor). This is good news for HUF.
Fig 60 PLN is the cheapest CE3 currency, followed by HUF Fig 61 HUF still benefits from the highest C/A surplus
Source: ING Source: ING, Macrobond
Yet, given uncertainty related to how the NBH manages Bubor normalisation (the ‘execution’ risk), we expect EUR/HUF to remain flat (within the 320-325 range) in 1H19. However, we expect EUR/HUF to approach 310 by the end of 2019 for the following reasons: (1) very stretched short positioning; (2) delivery of a well behaved Bubor normalisation; (3) an ongoing current account surplus; and (4) non-negligible undervaluation vs EUR (Figure 60).
The currently stretched positioning is one key difference to the period prior to the 2Q18 forint drop. In the absence of NBH missteps, the one-way positioning will make it virtually impossible for EUR/HUF to sustainably break above 330. In addition, HUF benefits from the highest current account surplus in the CEE region (Figure 61). The flow picture is still positive even though the external position has been deteriorating meaningfully (and is currently not as large a supportive factor as in previous years). We thus expect EUR/HUF moving towards 310 by end-2019.
CZK: The CNB holding it all together CZK has turned into the pain trade of 2018. Despite the ultra-hawkish CNB, the exchange rate did not perform. We look for a modest decline in EUR/CZK in 2019, but our conviction is not overly high. In our view, potential CZK gains are heavily dependent on further tightening from the CNB.
Yet, and as observed this year, CNB hikes alone are not a sufficient condition for CZK strength. This is because the still saturated positioning in large part tames the transmission mechanism from higher interest into CZK, as evident in Figure 62. Indeed, despite the five CNB hikes this year, CZK is down vs EUR year-to-date. Interestingly, the CZK outperformance vis-à-vis what is the perceived higher beta PLN and HUF has been only marginal this year despite that fact that: (1) both PLN and HUF should underperform CZK in an EM risk challenging environment anyway; (2) both suffered from
-15%
-10%
-5%
0%
5%
10%
15%
EUR/CZK EUR/HUF EUR/PLN +/- 1.5 standard deviation Misalignment
%, CEE real exchange rates misalignments vs their BEER fair value
CEE currency undervalued / EUR overvalued
CEE currency overvalued / EUR undervalued
-5
-4
-3
-2
-1
0
1
2
Hungary Czech Rep Poland Romania
%, Current account as % of GDP. ING forecast for 2019
310 End-2019 EUR/HUF
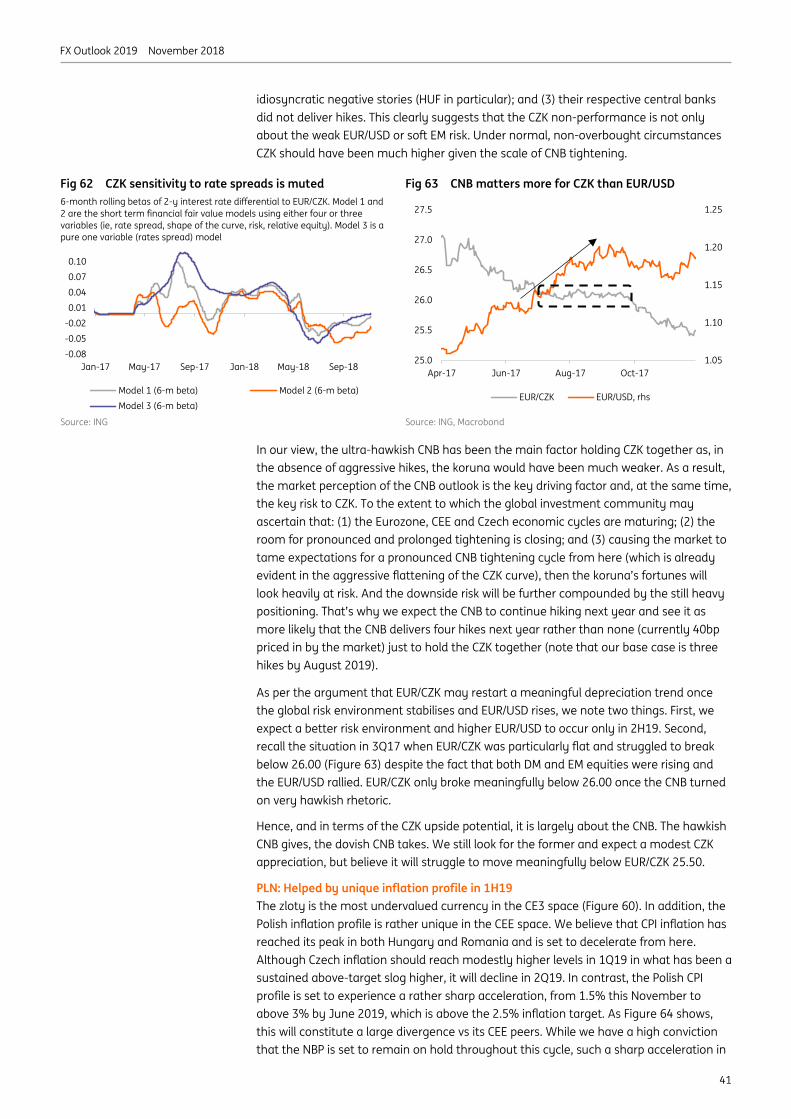
FX Outlook 2019 November 2018
41
idiosyncratic negative stories (HUF in particular); and (3) their respective central banks did not deliver hikes. This clearly suggests that the CZK non-performance is not only about the weak EUR/USD or soft EM risk. Under normal, non-overbought circumstances CZK should have been much higher given the scale of CNB tightening.
Fig 62 CZK sensitivity to rate spreads is muted Fig 63 CNB matters more for CZK than EUR/USD
Source: ING Source: ING, Macrobond
In our view, the ultra-hawkish CNB has been the main factor holding CZK together as, in the absence of aggressive hikes, the koruna would have been much weaker. As a result, the market perception of the CNB outlook is the key driving factor and, at the same time, the key risk to CZK. To the extent to which the global investment community may ascertain that: (1) the Eurozone, CEE and Czech economic cycles are maturing; (2) the room for pronounced and prolonged tightening is closing; and (3) causing the market to tame expectations for a pronounced CNB tightening cycle from here (which is already evident in the aggressive flattening of the CZK curve), then the koruna’s fortunes will look heavily at risk. And the downside risk will be further compounded by the still heavy positioning. That’s why we expect the CNB to continue hiking next year and see it as more likely that the CNB delivers four hikes next year rather than none (currently 40bp priced in by the market) just to hold the CZK together (note that our base case is three hikes by August 2019).
As per the argument that EUR/CZK may restart a meaningful depreciation trend once the global risk environment stabilises and EUR/USD rises, we note two things. First, we expect a better risk environment and higher EUR/USD to occur only in 2H19. Second, recall the situation in 3Q17 when EUR/CZK was particularly flat and struggled to break below 26.00 (Figure 63) despite the fact that both DM and EM equities were rising and the EUR/USD rallied. EUR/CZK only broke meaningfully below 26.00 once the CNB turned on very hawkish rhetoric.
Hence, and in terms of the CZK upside potential, it is largely about the CNB. The hawkish CNB gives, the dovish CNB takes. We still look for the former and expect a modest CZK appreciation, but believe it will struggle to move meaningfully below EUR/CZK 25.50.
PLN: Helped by unique inflation profile in 1H19 The zloty is the most undervalued currency in the CE3 space (Figure 60). In addition, the Polish inflation profile is rather unique in the CEE space. We believe that CPI inflation has reached its peak in both Hungary and Romania and is set to decelerate from here. Although Czech inflation should reach modestly higher levels in 1Q19 in what has been a sustained above-target slog higher, it will decline in 2Q19. In contrast, the Polish CPI profile is set to experience a rather sharp acceleration, from 1.5% this November to above 3% by June 2019, which is above the 2.5% inflation target. As Figure 64 shows, this will constitute a large divergence vs its CEE peers. While we have a high conviction that the NBP is set to remain on hold throughout this cycle, such a sharp acceleration in
-0.08-0.05-0.020.010.040.070.10
Jan-17 May-17 Sep-17 Jan-18 May-18 Sep-18
Model 1 (6-m beta) Model 2 (6-m beta)Model 3 (6-m beta)
6-month rolling betas of 2-y interest rate differential to EUR/CZK. Model 1 and 2 are the short term financial fair value models using either four or three variables (ie, rate spread, shape of the curve, risk, relative equity). Model 3 is a pure one variable (rates spread) model
1.05
1.10
1.15
1.20
1.25
25.0
25.5
26.0
26.5
27.0
27.5
Apr-17 Jun-17 Aug-17 Oct-17
EUR/CZK EUR/USD, rhs
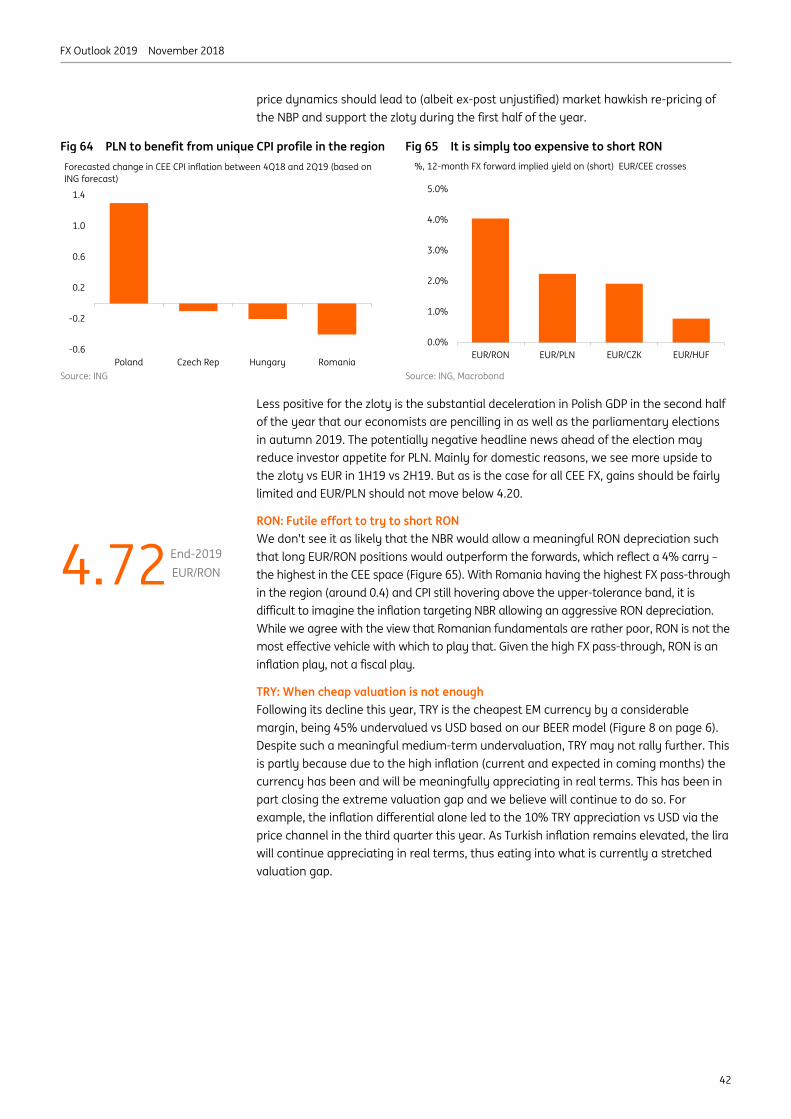
FX Outlook 2019 November 2018
42
price dynamics should lead to (albeit ex-post unjustified) market hawkish re-pricing of the NBP and support the zloty during the first half of the year.
Fig 64 PLN to benefit from unique CPI profile in the region Fig 65 It is simply too expensive to short RON
Source: ING Source: ING, Macrobond
Less positive for the zloty is the substantial deceleration in Polish GDP in the second half of the year that our economists are pencilling in as well as the parliamentary elections in autumn 2019. The potentially negative headline news ahead of the election may reduce investor appetite for PLN. Mainly for domestic reasons, we see more upside to the zloty vs EUR in 1H19 vs 2H19. But as is the case for all CEE FX, gains should be fairly limited and EUR/PLN should not move below 4.20.
RON: Futile effort to try to short RON We don’t see it as likely that the NBR would allow a meaningful RON depreciation such that long EUR/RON positions would outperform the forwards, which reflect a 4% carry – the highest in the CEE space (Figure 65). With Romania having the highest FX pass-through in the region (around 0.4) and CPI still hovering above the upper-tolerance band, it is difficult to imagine the inflation targeting NBR allowing an aggressive RON depreciation. While we agree with the view that Romanian fundamentals are rather poor, RON is not the most effective vehicle with which to play that. Given the high FX pass-through, RON is an inflation play, not a fiscal play.
TRY: When cheap valuation is not enough Following its decline this year, TRY is the cheapest EM currency by a considerable margin, being 45% undervalued vs USD based on our BEER model (Figure 8 on page 6). Despite such a meaningful medium-term undervaluation, TRY may not rally further. This is partly because due to the high inflation (current and expected in coming months) the currency has been and will be meaningfully appreciating in real terms. This has been in part closing the extreme valuation gap and we believe will continue to do so. For example, the inflation differential alone led to the 10% TRY appreciation vs USD via the price channel in the third quarter this year. As Turkish inflation remains elevated, the lira will continue appreciating in real terms, thus eating into what is currently a stretched valuation gap.
-0.6
-0.2
0.2
0.6
1.0
1.4
Poland Czech Rep Hungary Romania
Forecasted change in CEE CPI inflation between 4Q18 and 2Q19 (based on ING forecast)
0.0%
1.0%
2.0%
3.0%
4.0%
5.0%
EUR/RON EUR/PLN EUR/CZK EUR/HUF
%, 12-month FX forward implied yield on (short) EUR/CEE crosses
4.72 End-2019 EUR/RON
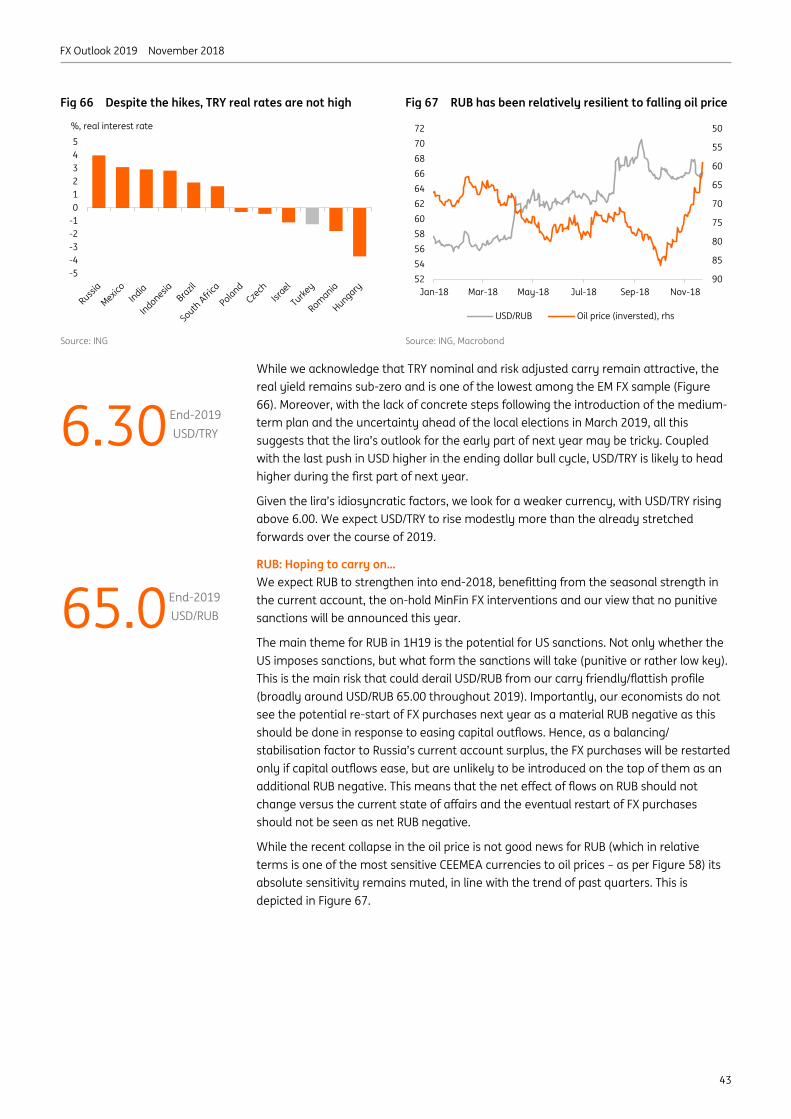
FX Outlook 2019 November 2018
43
Fig 66 Despite the hikes, TRY real rates are not high Fig 67 RUB has been relatively resilient to falling oil price
Source: ING Source: ING, Macrobond
While we acknowledge that TRY nominal and risk adjusted carry remain attractive, the real yield remains sub-zero and is one of the lowest among the EM FX sample (Figure 66). Moreover, with the lack of concrete steps following the introduction of the medium-term plan and the uncertainty ahead of the local elections in March 2019, all this suggests that the lira’s outlook for the early part of next year may be tricky. Coupled with the last push in USD higher in the ending dollar bull cycle, USD/TRY is likely to head higher during the first part of next year.
Given the lira’s idiosyncratic factors, we look for a weaker currency, with USD/TRY rising above 6.00. We expect USD/TRY to rise modestly more than the already stretched forwards over the course of 2019.
RUB: Hoping to carry on… We expect RUB to strengthen into end-2018, benefitting from the seasonal strength in the current account, the on-hold MinFin FX interventions and our view that no punitive sanctions will be announced this year.
The main theme for RUB in 1H19 is the potential for US sanctions. Not only whether the US imposes sanctions, but what form the sanctions will take (punitive or rather low key). This is the main risk that could derail USD/RUB from our carry friendly/flattish profile (broadly around USD/RUB 65.00 throughout 2019). Importantly, our economists do not see the potential re-start of FX purchases next year as a material RUB negative as this should be done in response to easing capital outflows. Hence, as a balancing/ stabilisation factor to Russia’s current account surplus, the FX purchases will be restarted only if capital outflows ease, but are unlikely to be introduced on the top of them as an additional RUB negative. This means that the net effect of flows on RUB should not change versus the current state of affairs and the eventual restart of FX purchases should not be seen as net RUB negative.
While the recent collapse in the oil price is not good news for RUB (which in relative terms is one of the most sensitive CEEMEA currencies to oil prices – as per Figure 58) its absolute sensitivity remains muted, in line with the trend of past quarters. This is depicted in Figure 67.
-5-4-3-2-1012345
%, real interest rate 50
55
60
65
70
75
80
85
905254565860626466687072
Jan-18 Mar-18 May-18 Jul-18 Sep-18 Nov-18
USD/RUB Oil price (inversted), rhs
6.30 End-2019 USD/TRY
65.0 End-2019 USD/RUB
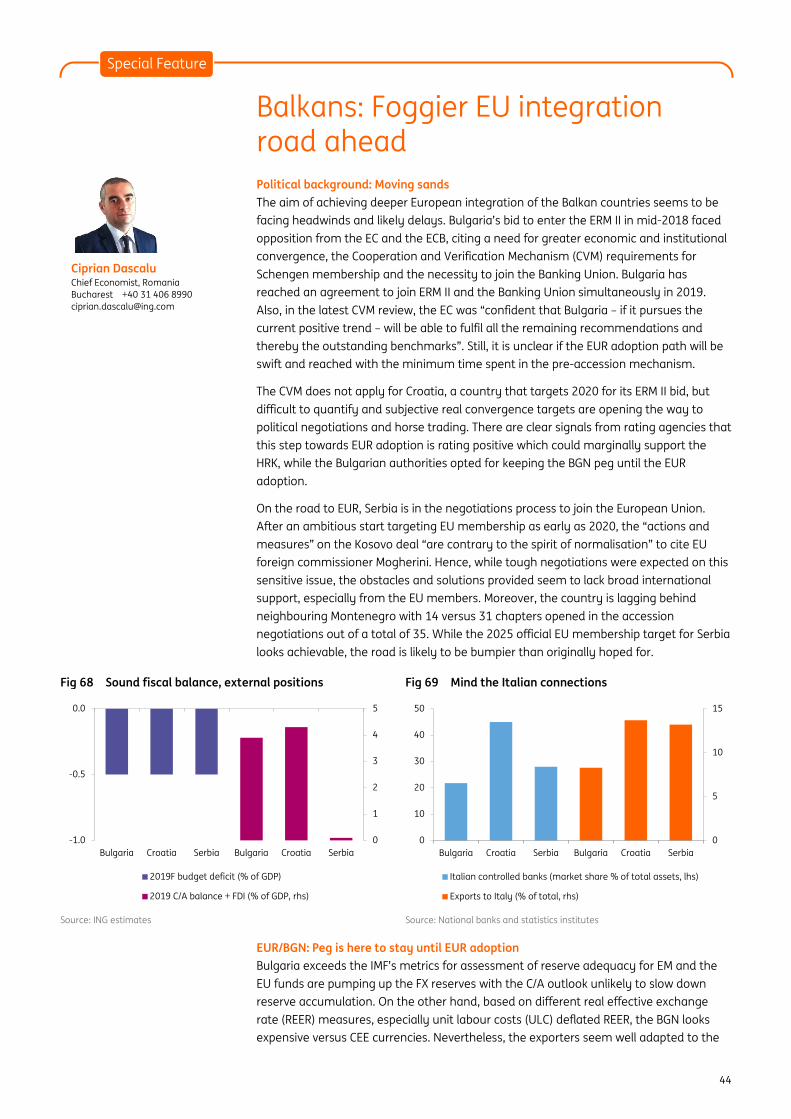
FX Outlook 2019 November 2018
44
Balkans: Foggier EU integration road ahead Political background: Moving sands The aim of achieving deeper European integration of the Balkan countries seems to be facing headwinds and likely delays. Bulgaria’s bid to enter the ERM II in mid-2018 faced opposition from the EC and the ECB, citing a need for greater economic and institutional convergence, the Cooperation and Verification Mechanism (CVM) requirements for Schengen membership and the necessity to join the Banking Union. Bulgaria has reached an agreement to join ERM II and the Banking Union simultaneously in 2019. Also, in the latest CVM review, the EC was “confident that Bulgaria – if it pursues the current positive trend – will be able to fulfil all the remaining recommendations and thereby the outstanding benchmarks”. Still, it is unclear if the EUR adoption path will be swift and reached with the minimum time spent in the pre-accession mechanism.
The CVM does not apply for Croatia, a country that targets 2020 for its ERM II bid, but difficult to quantify and subjective real convergence targets are opening the way to political negotiations and horse trading. There are clear signals from rating agencies that this step towards EUR adoption is rating positive which could marginally support the HRK, while the Bulgarian authorities opted for keeping the BGN peg until the EUR adoption.
On the road to EUR, Serbia is in the negotiations process to join the European Union. After an ambitious start targeting EU membership as early as 2020, the “actions and measures” on the Kosovo deal “are contrary to the spirit of normalisation” to cite EU foreign commissioner Mogherini. Hence, while tough negotiations were expected on this sensitive issue, the obstacles and solutions provided seem to lack broad international support, especially from the EU members. Moreover, the country is lagging behind neighbouring Montenegro with 14 versus 31 chapters opened in the accession negotiations out of a total of 35. While the 2025 official EU membership target for Serbia looks achievable, the road is likely to be bumpier than originally hoped for.
Fig 68 Sound fiscal balance, external positions Fig 69 Mind the Italian connections
Source: ING estimates Source: National banks and statistics institutes
EUR/BGN: Peg is here to stay until EUR adoption Bulgaria exceeds the IMF’s metrics for assessment of reserve adequacy for EM and the EU funds are pumping up the FX reserves with the C/A outlook unlikely to slow down reserve accumulation. On the other hand, based on different real effective exchange rate (REER) measures, especially unit labour costs (ULC) deflated REER, the BGN looks expensive versus CEE currencies. Nevertheless, the exporters seem well adapted to the
0
1
2
3
4
5
-1.0
-0.5
0.0
Bulgaria Croatia Serbia Bulgaria Croatia Serbia
2019F budget deficit (% of GDP)
2019 C/A balance + FDI (% of GDP, rhs)
0
5
10
15
0
10
20
30
40
50
Bulgaria Croatia Serbia Bulgaria Croatia Serbia
Italian controlled banks (market share % of total assets, lhs)
Exports to Italy (% of total, rhs)
Special Feature
Ciprian Dascalu Chief Economist, Romania Bucharest +40 31 406 8990 [email protected]
FX Outlook 2019 November 2018
45
FX regime. That said, there is no political benefit to abandon the peg until the EUR adoption. But this process could take some time due to moving targets as the European institutions are still assessing the lessons from the debt crisis and are coming up with more requirements in terms of real and institutional convergence. Moreover, ECB’s concerns about Bulgaria sustainably meeting the inflation convergence nominal criteria seem to be materialising. That said, the fixed EUR/BGN exchange rate is here to stay.
EUR/HRK: Seasonal rollercoaster within quasi peg margins Croatia’s C/A surplus is supportive of HRK gains with the seasonal pattern making each year new lows, but always running into firm bids from CNB. With CPI pressures well contained and expected inflation imported from abroad likely to see lower revisions, we see no reason for the CNB to lower the bar in EUR/HRK. Croatia has recently elaborated an extensive strategy for adopting the euro, setting 2020 as a target for ERM II entry. The document seems to suggest that the government is comfortable with the average exchange rate for EUR/HRK since 2001 of 7.45 as a likely central parity rate. The ERM II entry would be another positive for the country ratings with the prospect of earning an investment grade status within the next couple of years within reach. The high public debt-to-GDP at around 75% remains the key constraint for now. We see the appreciation profile of the HRK strictly correlated to the CPI outlook, especially for imported inflation from the Eurozone, given the EUR/HRK nominal anchor role in monetary policy implementation for inflation expectations and ultimately inflation itself.
EUR/RSD: The longest convergence journey ahead, despite fading optimism Serbia’s C/A continued to improve, as well as its FDI cover. To prevent further RSD gains, the NBS drew a line in the sand at 118.00 this year. However, tight FX management was in action when pressures to the other side met NBS offers around 118.50. GDP growth moved into a higher gear in 1H18 and the slowdown in 3Q18 seems to be driven by base effects and weaker external demand. As the government plans a bold increase in capital spending for next year for which a -0.5% of GDP budget deficit has already been agreed with the IMF, following two consecutive years of fiscal surpluses, the external shocks can be accommodated. Serbia remained the IMF poster child with the latest review citing “dramatic improvements in the last few years”. However, as the economy increases its openness, it becomes more exposed to troubles from abroad. That said, Italy is the largest export destination for Serbia and Italian banks own the two largest banks in Serbia. The Italian economy is already showing signs of slow down, while Serbian market jitters and contagions are always unpredictable. With no prospect for further monetary policy easing, the bond inflows subsided. Hence, less support for RSD, but progress on EU membership talks, though slower than previously, should be RSD supportive over the medium term.
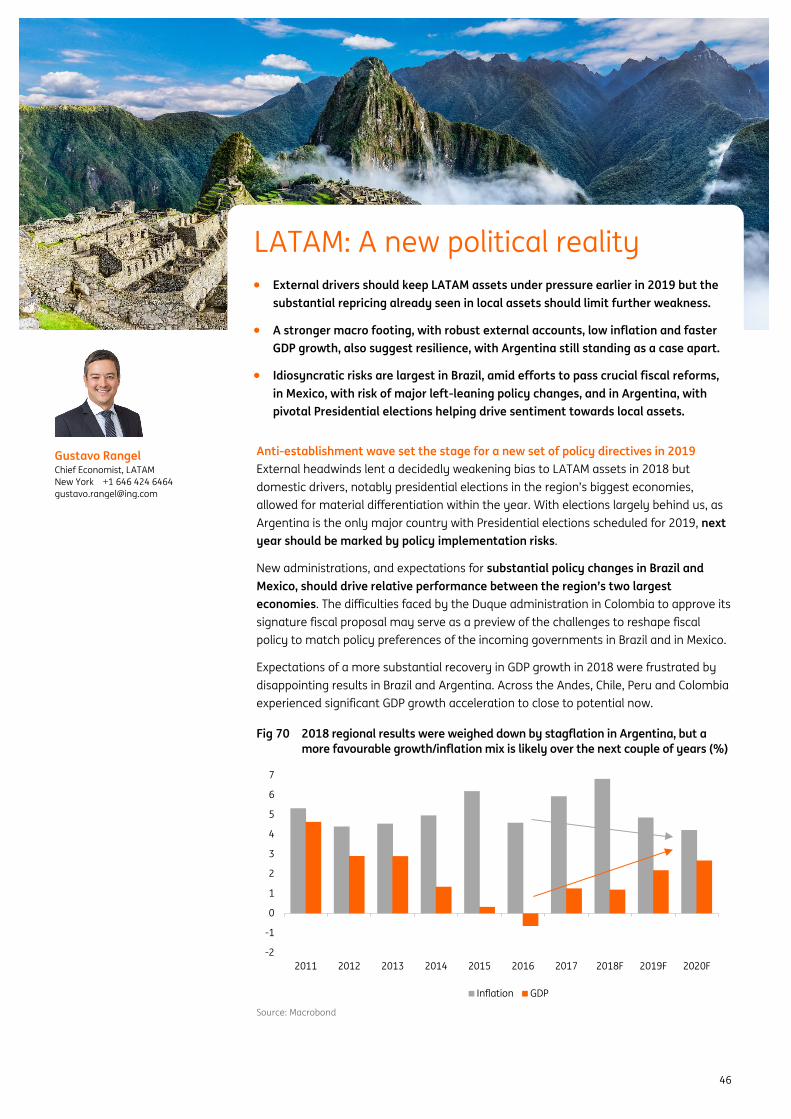
FX Outlook 2019 November 2018
46
Anti-establishment wave set the stage for a new set of policy directives in 2019 External headwinds lent a decidedly weakening bias to LATAM assets in 2018 but domestic drivers, notably presidential elections in the region’s biggest economies, allowed for material differentiation within the year. With elections largely behind us, as Argentina is the only major country with Presidential elections scheduled for 2019, next year should be marked by policy implementation risks.
New administrations, and expectations for substantial policy changes in Brazil and Mexico, should drive relative performance between the region’s two largest economies. The difficulties faced by the Duque administration in Colombia to approve its signature fiscal proposal may serve as a preview of the challenges to reshape fiscal policy to match policy preferences of the incoming governments in Brazil and in Mexico.
Expectations of a more substantial recovery in GDP growth in 2018 were frustrated by disappointing results in Brazil and Argentina. Across the Andes, Chile, Peru and Colombia experienced significant GDP growth acceleration to close to potential now.
Fig 70 2018 regional results were weighed down by stagflation in Argentina, but a more favourable growth/inflation mix is likely over the next couple of years (%)
Source: Macrobond
-2
-1
0
1
2
3
4
5
6
7
2011 2012 2013 2014 2015 2016 2017 2018F 2019F 2020F
Inflation GDP
LATAM: A new political reality • External drivers should keep LATAM assets under pressure earlier in 2019 but the
substantial repricing already seen in local assets should limit further weakness.
• A stronger macro footing, with robust external accounts, low inflation and faster GDP growth, also suggest resilience, with Argentina still standing as a case apart.
• Idiosyncratic risks are largest in Brazil, amid efforts to pass crucial fiscal reforms, in Mexico, with risk of major left-leaning policy changes, and in Argentina, with pivotal Presidential elections helping drive sentiment towards local assets.
Gustavo Rangel Chief Economist, LATAM New York +1 646 424 6464 [email protected]

FX Outlook 2019 November 2018
47
Inflation remained, meanwhile, generally benign across the region, which allowed local monetary authorities to stretch the monetary easing cycle for longer than expected. Mexico and Argentina have been the outliers here, amid persistent FX-related inflation concerns, which forced monetary authorities to keep an aggressively hawkish stance.
We expect Andean countries to implement a gradual monetary policy normalization in the coming quarters, driven less by any spike in inflation than the moderately robust GDP growth, which should contribute to narrow the output gap. Chile has already initiated the policy tightening process, but Colombia and Peru should also move the policy rate gradually towards neutral in the coming quarters.
The outlook for commodity prices will also remain critical to determine relative currency performance among the Andean countries. Despite trade-war concerns and their potential impact on Chinese demand, ING’s commodity team maintains a broadly constructive outlook for metals, which are the chief drivers for terms-of-trade of Chile (i.e. copper) and Peru, thanks in part to tight supply conditions.
The outlook for oil prices, the chief driver for Colombia’s COP, is also more constructive than the recent trajectory would indicate, under the expectation that supply constraints should be adopted by oil producers in the coming months, improving oil price dynamics.
Given the PEN’s tendency to outperform during market sell-offs and to underperform during rallies, the PEN should outperform in the earlier part of the year. A relatively benign outlook for risk appetite in the second half of 2019 suggests however that the CLP and the COP should outperform later in 2019.
The outlook for Argentina’s ARS remains especially hard to assess. The robust financial assistance from the IMF together with the sharp tightening in monetary and fiscal policies have helped stabilize local financial markets. However, the risk of a deep recession and the erosion of President Macri’s political capital has also increased the risk to Macri’s reelection bid. Policy continuity remains critical to ensure Argentina’s medium-term macro stability. As such, investors are likely to closely monitor electoral dynamics, and calibrate their local holdings accordingly.
Fig 71 In Argentina, fast-rising CA deficits and excessive portfolio inflows in 2016-17 became vulnerabilities, but IMF help prevented a collapse in FX financing inflows
Source: Macrobond
In Brazil, elections improved the fiscal outlook, but implementation risks are high Jair Bolsonaro’s recent election in Brazil improved the outlook for fiscal consolidation in the coming years, validating and reinforcing, in our view, a more constructive outlook for local assets. The stronger Brazilian real (BRL), meanwhile, has reduced the central bank’s incentive to end, prematurely, the ongoing monetary stimulus.
-40
-30
-20
-10
0
10
20
30
40
50
2009 2010 2011 2012 2013 2014 2015 2016 2017 2018
12-m
o, b
n
Current account Portfolio Investment FDI
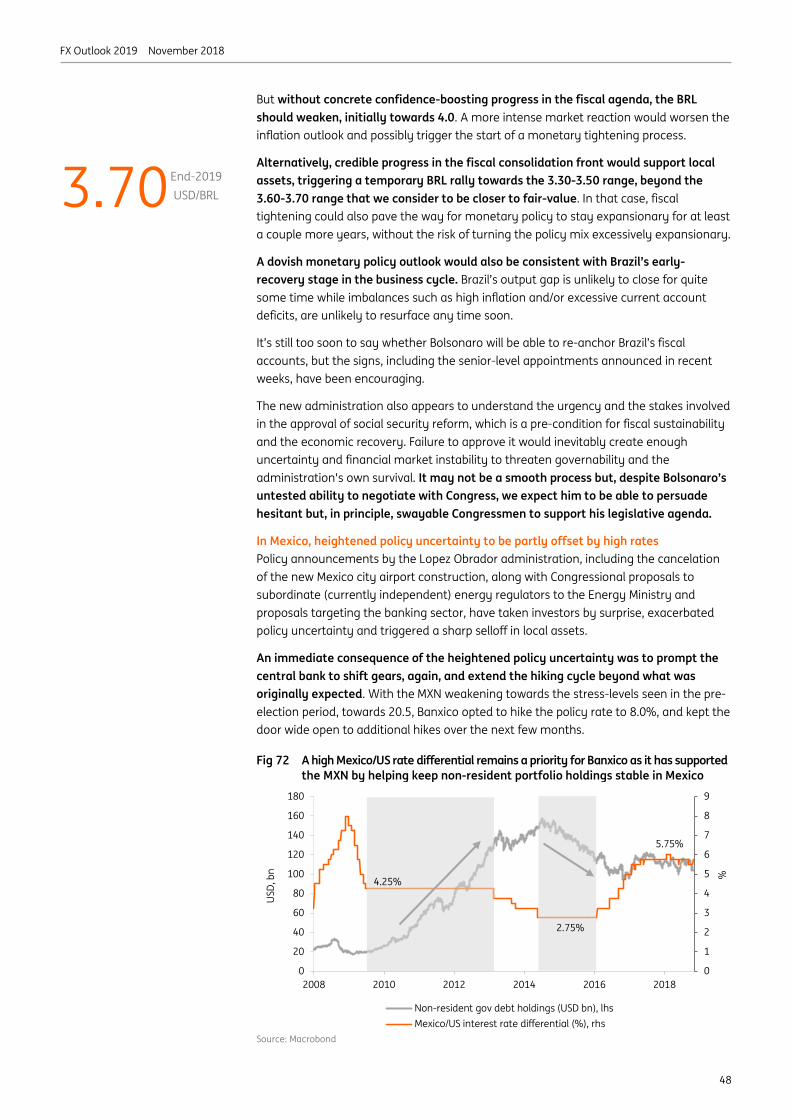
FX Outlook 2019 November 2018
48
But without concrete confidence-boosting progress in the fiscal agenda, the BRL should weaken, initially towards 4.0. A more intense market reaction would worsen the inflation outlook and possibly trigger the start of a monetary tightening process.
Alternatively, credible progress in the fiscal consolidation front would support local assets, triggering a temporary BRL rally towards the 3.30-3.50 range, beyond the 3.60-3.70 range that we consider to be closer to fair-value. In that case, fiscal tightening could also pave the way for monetary policy to stay expansionary for at least a couple more years, without the risk of turning the policy mix excessively expansionary.
A dovish monetary policy outlook would also be consistent with Brazil’s early-recovery stage in the business cycle. Brazil’s output gap is unlikely to close for quite some time while imbalances such as high inflation and/or excessive current account deficits, are unlikely to resurface any time soon.
It’s still too soon to say whether Bolsonaro will be able to re-anchor Brazil’s fiscal accounts, but the signs, including the senior-level appointments announced in recent weeks, have been encouraging.
The new administration also appears to understand the urgency and the stakes involved in the approval of social security reform, which is a pre-condition for fiscal sustainability and the economic recovery. Failure to approve it would inevitably create enough uncertainty and financial market instability to threaten governability and the administration's own survival. It may not be a smooth process but, despite Bolsonaro’s untested ability to negotiate with Congress, we expect him to be able to persuade hesitant but, in principle, swayable Congressmen to support his legislative agenda.
In Mexico, heightened policy uncertainty to be partly offset by high rates Policy announcements by the Lopez Obrador administration, including the cancelation of the new Mexico city airport construction, along with Congressional proposals to subordinate (currently independent) energy regulators to the Energy Ministry and proposals targeting the banking sector, have taken investors by surprise, exacerbated policy uncertainty and triggered a sharp selloff in local assets.
An immediate consequence of the heightened policy uncertainty was to prompt the central bank to shift gears, again, and extend the hiking cycle beyond what was originally expected. With the MXN weakening towards the stress-levels seen in the pre-election period, towards 20.5, Banxico opted to hike the policy rate to 8.0%, and kept the door wide open to additional hikes over the next few months.
Fig 72 A high Mexico/US rate differential remains a priority for Banxico as it has supported the MXN by helping keep non-resident portfolio holdings stable in Mexico
Source: Macrobond
0
1
2
3
4
5
6
7
8
9
0
20
40
60
80
100
120
140
160
180
2008 2010 2012 2014 2016 2018
USD
, bn
Non-resident gov debt holdings (USD bn), lhsMexico/US interest rate differential (%), rhs
%
4.25%
5.75%
2.75%
3.70 End-2019 USD/BRL
FX Outlook 2019 November 2018
49
A hawkish stance by Banxico is warranted also because recent announcements by the upcoming administration call into question its commitment to fiscal prudence. Budget revenue assumptions appear optimistic, while expenditure is bound to rise with the creation of new social programs and the renewed focus on boosting government spending in energy and infrastructure investment.
Private investment remains, in our view, Mexico’s best hope to move beyond the low pace of growth seen in recent years. But recent announcements raised domestic policy uncertainties and highlighted the risk of heavy-handed state intervention over private investment activities, which should have a chilling impact over business sentiment in the foreseeable future.
Private investment in the energy sector seems especially crucial because it affects all major aspects of Mexico’s macro outlook. Over the past five years, oil production has fallen by 27%, output from its refineries have dropped by more than 40%, while the oil-sector external trade balance has deteriorated by more than US$30bn in annual terms, moving from a US$9bn surplus to a US$22bn deficit.
Overall, recent policy announcements added material downside to Mexico’s economic growth outlook and upside to inflation. Sharply expanding the state-presence in the economy would jeopardise Mexico’s fiscal and growth outlook, and cool investor sentiment. And without a vibrant private sector support, prospects for Mexico’s medium-term macro outlook should be much-diminished, marked by low growth and lingering vulnerabilities on the fiscal and external side.
Overall, however, despite the high-stakes idiosyncratic risks faced by Brazil and Mexico, LATAM economies, with the exception of Argentina, should enter 2019 with a stronger macro footing, characterized by robust external accounts, lower inflation and faster GDP growth. A challenging and risk averse external environment should keep local assets under pressure, but solid macro indicators should act as buffers. Given that current prices already incorporate a rather negative risk assessment by investors, room for additional weakening pressure also seems more limited.
19.5 End-2019 USD/MXN

FX Outlook 2019 November 2018
50
Trade growth Q: It feels as though 2018 has been a bad year for trade volumes, while most analysts forecast solid growth for 2018. What has caused this? Raoul: World trade did indeed disappoint in the first half of 2018, especially because the slowdown started before most tariff increases were applied. Trade volumes echoed industrial production, which has slowed since last year, even as GDP growth has remained stable. In 1H, worldwide industrial production grew only at half the speed of last year.
In 3Q, momentum in world trade has picked up, but we don’t expect this to be sustained. The fall of activity indicators including the worldwide Purchasing Managers Index (PMI) and the PMI sub index on new export orders, make it likely that growth in both industrial production and world trade will be subdued in the near term. On top of that the impact of higher tariffs on US-China trade will increasingly have an effect on trade. Thanks to gains made at the end of 2017, trade in 2018 as a whole is on track to grow 2.5% to 3% year on year.
Q: What role does Europe play in the disappointing development of world trade? Raoul: Europe is not the only region that has seen slowing growth in trade volumes, which have trended down in advanced economies as a whole. But the EU’s performance is an important part of the story because the EU 28 is over represented in global trade. The EU accounts for one-third of world trade while only a fourth of world GDP.
Q: What is the outlook for 2019? Raoul: We expect a further weakening of trade with volumes growth of 1.3% only, being the lowest trade growth since 2009 in the wake of the financial crisis.
This forecast is based on continued weakness in industrial production, and a slowing in broader economic activity, as global GDP growth moves past its peak. In addition, next year the effects of the US-China trade war will have more influence on trade growth than this year. This is due to the fact that the largest part of the tariff measures of 2018 have been implemented in the second half of 2018. On top of that, we expect a large package of trade flows to be affected by new measures in 2019.
Trade between the US and China is expected to reflect this development and slow dramatically; we estimate the bilateral trade flows to be 16 percentage points lower if the conflict escalates and all of their bilateral trade will see 25% tariff increases. This would take one percentage point off world trade growth.
Q: If there is an upside surprise, where could it come from? Raoul: It is possible that tariff increases between the US and China will be put on hold while negotiators work, as has happened between the US and EU. That would stop the rise in US tariffs from 10% to 25% on US$200bn of imports from China, which had been planned for January 2019. It could also mean the remaining US$267bn of Chinese exports to the US will avoid higher tariffs. The counter measures by China would be avoided as well. In this scenario trade growth is forecast to be 2.6% in 2019.
But the gap between President Trump’s demands and what China is prepared to offer seems too large for a quick deal. Trump has demanded that the US trade deficit be cut in half by 2020 which would mean a reduction of US$190bn, while China’s offer thus far has been a reduction of US$70bn. However, President Trump is not weary of surprises so an upside surprise cannot be ruled out.
Special Feature
Raoul Leering Head of International Trade Analysis Amsterdam +31 20 563 4407 [email protected]

FX Outlook 2019 November 2018
51
Trade wars – the China effect The outlook for China is covered elsewhere in this report, though can be summarised as “CNY to weaken, but in a controlled and modest fashion”. That reaction to the trade war and impacts on China’s economic growth seems perfectly justifiable, and in line with statements from the authorities. It also sets the starting point for FX for the rest of the region.
A ‘gravity’ approach to FX is one way to look at the region. If the USD represents the currency equivalent of the sun, then for most currencies in the region, the CNY is Jupiter. Where it goes, other currencies will be drawn like orbiting asteroids.
Greater economic integration will allow the CNY to have a greater drag on individual currencies. North Asia is therefore more affected in this sort of model of FX. SE Asia less so.
Another factor is openness. Big economies such as South Korea are even bigger globally in terms of their trade. But the smaller, more open economies, such as Singapore, are also vulnerable to a major global trade slowdown, along the
lines our trade team expects. For the small open economies, trade itself is a source of income and activity. It is also not something policymakers have much control over.
There is some talk that certain economies – notably, Vietnam, Thailand, and possibly Malaysia, may benefit from displaced trade from China. This received wisdom is quite well spread. But we have our doubts. Firms operating in the Asian distribution and logistics space note no such diversion of products. Some anecdote from shipping markets sees increased activity intra-region, but also sees a boost from (earlier) higher oil prices as the driver. At best, we suspect this may be a modifying factor that would reduce the negative consequences of the trade war – not significantly alter its’ sign on the economy or currencies.
EM sentiment – really, who knows? It is not an easy thing to forecast a breakdown in sentiment like the one that hit EM markets earlier this year. The causes of that seemed to stem from individual country-specific economic and financial market crises, and then spilled over into other EM markets in a somewhat unthinking way.
Asia: Overlapping layers of risk • Clearly the main threat to the Asian FX outlook is the trade war – China is front
and centre – but there will be ramifications for the rest of Asia to varying degrees
• Then there is EM sentiment – in 2018, worsening sentiment claimed its victims in Asian FX space, a repeat is certainly possible
• Falling oil prices have helped a lot – both in terms of current accounts and inflation – will that continue?
• And then idiosyncratic country factors play a final role – it isn’t straightforward
Rob Carnell Chief Economist & Head of Research, Asia-Pacific Singapore +65 6232 6020 [email protected]
Prakash Sakpal Economist, Asia Singapore +65 6232 6181 [email protected]
“The base outlook for Asian FX is quite simply the outlook for the US-China
trade war”
FX Outlook 2019 November 2018
52
But there is a good chance that we see a repeat of some magnitude and of questionable longevity during 2019:
1) The Fed is likely to keep tightening, encouraging capital outflows and making it harder to maintain currency stability against the USD
2) Globally, growth is slowing – not good news for any sector heavily dependent on exports and commodities
3) Risk sentiment has been sensitised by aggressive trade and foreign policy from the US
4) A conclusive end to the US-China trade war seems unlikely, even if the mood improves post G20
5) Market valuations for risk assets may still be stretched as a past result of unorthodox stimulation, and a sharp correction may be a part of any normalisation.
Of course, this raises more questions than it answers. On its own, the Asian region looks very good in terms of structural factors. Debt is generally low, external balances generally in surplus and FX reserves ample. Where this is not the case, the imbalances are generally small. Malaysia offers perhaps one additional currency that escaped the worst of the 2018 EM Asian weakness, but might be dragged into that side of the FX spectrum in 2019, despite the prudent policies being undertaken by the new government.
Indonesia, India and the Philippines all raised rates amidst the 2018 turmoil, and Indonesia and the Philippines have continued to nudge rates higher. They may feel obligated to do more still, though it seems the main motivation
currently is an ability to do so, not a need. The currencies of all three countries may be in the front row of any renewed EM currency sell-off. We wouldn’t push this theory too hard though. And there appear to be other more important factors, like the credibility of the central bank response (speed, size and consistency of accompanying message) that will likely play as important a role in determining how these currencies perform. In this, both Indonesia and the Philippines are gaining credibility ahead of India.
Falling oil – boon or curse? Bit of both? The old way of viewing lower oil prices as a global tax cut and vice versa has probably never been an accurate way to view the impact of this commodity on the economy, and
thereby, on exchange rates. But any systematic error in the past was most likely masked in a world where the G7 dominated, and where there were few net oil producers amongst their ranks.
In Asia, only Malaysia distinguishes itself as a sizeable net oil producer, and will likely see some MYR weakness if oil prices drop further. Otherwise, the externally challenged and inflation prone India, Indonesia and Philippines are likely to see benefits from lower energy prices, which will make it easier also for them therefore to keep central bank policy rates from rising too much further and thereby provide some support for domestic demand. Real policy rates are now looking quite high for some economies in the region, and will likely rise further as headline inflation rates drop.
“Asia does not have an Argentina or Venezuela – any future EM contagion
should be limited and short lived”
“For Asia, there is such a thing as too low oil prices”

FX Outlook 2019 November 2018
53
Fig 73 Real policy rates – de-constructed (market 3m rates for Singapore) (%)
Source: Bloomberg
Country-/region-specific factors Even with perfect foresight about the preceding factors, getting the currency right for individual countries in Asia is a long shot given the many and varied country-specific factors at play. In what follows, we list some of these.
North Asia (ex-China) – at the forefront of a tech sell-off As well as being weighed down by China’s proximity, Korea has other issues, some of which are also shared by Taiwan, in particular the global technology cycle. While semiconductors have been the mainstay of Korean production (in Taiwan, add also LCD displays for
tablets, phones, etc), gains in the tech sector seem to have ground to a halt.
Fig 74 North Asia export growth (%YoY)
Source: CEIC
Not only are sales peaking, but the unit prices of these products are also falling. The cause of this is partly a good old-fashioned product cycle. But this has been exacerbated by falling demand for the latest generation of smartphones (probably waiting for 5G), slowing chip demand for crypto-currency mining, and claims of price rigging by China against some of Korea’s top producers. Additional industry supply commissioned when demand was strong has now all come on stream, coinciding with the slowdown in product demand. A perfect storm.
-1
0
1
2
3
4
5
6
7
2018 year-to-date CPI inflation Policy rate
%
-10
-5
0
5
10
15
20
2016 2017 2018 ytd
China Hong Kong Japan Taiwan Korea
“A glut of semiconductor supply is meeting feeble demand with negative
consequences for N Asia”

FX Outlook 2019 November 2018
54
Fig 75 Semiconductor industry – prices (%YoY)
Source: CEIC
Korea’s macro problem has also been made worse by some well-meaning but bungled policy measures, which aimed to increase household wellbeing by limiting hours worked and boosting minimum wages. In turn, these measures were
supposed to provide a productivity boost and reduce inequality. The result has instead been rising unemployment, SME closures and undermined private consumption which had been supporting a weakened domestic economy as business sector tech investment slowed.
Making matters more uncertain, the Bank of Korea has taken a very inconsistent view towards policy rates. At times, they have seemed to be moved by the government’s desire to curb household debt levels, which are admittedly high, and by a property price boom in the Seoul region.
At other times, the reality of the relatively uninspiring macro situation seems to have played a stronger role and kept the BoK on hold. It means we go into each rate meeting with the possibility of a hike, but against a macro backdrop that suggests no
hike until much later next year. Like some other central banks in the region, there also seems to be an ingrained notion that rates are unduly low and that it would be a good idea to raise them before the next downturn hits. For fairly obvious reasons, this is not going down particularly well with markets, which are failing to see the logic behind this.
The net result of all of this is that the KRW is likely to remain under weakening pressure near term, though oscillating on alternating waves of BoK optimism and then pessimism. We suspect the KRW will only slowly strengthen through 2019, more as a result of USD weakness than KRW strength, and as some of the cyclical and structural factors weighing on growth currently begin to fade. By mid-2019, a BoK rate hike might also begin to look more reasonable, pre-supposing that the many other downside risks have not materialised by then.
In contrast, the TWD, with even less likelihood of any central bank support, will remain in orbit around a weakening CNY.
-30
-20
-10
0
10
20
30
40
-8
-6
-4
-2
0
2
4
6
8
Jan 13 Jan 14 Jan 15 Jan 16 Jan 17 Jan 18
US Export prices - SC's Korea Export prices, SC machinesKorea, Export prices, SC display
“Government policies may have inadvertently weakened the Korean
economy in the short term”
“Inconsistent guidance from the BoK and interference from the government is
making rate expectations erratic”

FX Outlook 2019 November 2018
55
SE Asia – mixed bag, but better growth outlook than N Asia SE Asia is a far less homogenous area than North Asia with small rich economies, like Singapore, and bigger, poorer, but faster growing countries, like Indonesia and the Philippines. Malaysia and Thailand lie somewhere in the middle in terms of size, wealth and growth.
Fig 76 ASEAN export growth (%YoY)
Source: CEIC
The Singapore dollar story is a relatively straightforward one. As a pegged currency to a nominal basket of exchange rates, the SGD’s direction will be passively determined by the direction of the main trading
currencies. The CNY is one of the biggest of these and near-term weakness is likely. Coupling this with the modest nominal appreciation built into MAS policy, is likely to leave USD/SGD relatively stable near-term. Unless CNY fails to stabilise mid-2019 as we suspect, or the MAS changes tack, this should then turn to a modest appreciation of the SGD versus the USD later in 2019, though the amplitude of moves is likely to be small.
Fig 77 Singapore production by main component (Index 2015=100)
Source: CEIC
Risks to the outlook include Singapore being hit harder by the trade war than currently expected – given its open nature, the ongoing downtrend in the Singapore electronics sector, and potential for other sectors (pharmaceuticals, petrochemicals) to fail to make up for this slack. If so, and the inflation backdrop moderates, then we will probably see no further tightening of MAS policy, and even possibly some reversal of the recent tightening.
-5
0
5
10
15
20
25
2017 2018 ytd
Sing Thai Malay Indon Phil Viet
70
90
110
130
150
170
190
Jan 15 Jul 15 Jan 16 Jul 16 Jan 17 Jul 17 Jan 18 Jul 18
Chemicals Pharma Computer, electronics etc
“MAS policy should deliver SGD stability absent external shocks”

FX Outlook 2019 November 2018
56
The currencies of Malaysia and Thailand appear to have lost their lustre, swinging from outperformers among Asian FX earlier in the year to underperformers lately. While monetary policies have done nothing to jolt currency performance in either economy, fiscal
policy, at least in Malaysia, has taken a significant negative turn for the ringgit (MYR).
The scrapping of the goods and services tax (GST) by the new Mahathir administration has hit government revenue hard, while an intensified drive to cut back on public debt, now estimated at around MYR1bn, or 80% of GDP, has exerted a further squeeze on public finances. The revised budget for 2018 projects the fiscal deficit spiking to 3.7% (of GDP) this year, wiping out the apparent progress in deficit reduction from the past four years.
Bringing the fiscal situation under control partly hinges on crude oil prices. Slower global growth could keep oil prices subdued, resulting in the double whammy of slower growth in Malaysia’s GDP and also weak government revenues. On the plus side, this will also keep a lid on domestic inflation and keep central bank policy rate hikes off the table throughout 2019. We view such a macro policy mix of restrictive future fiscal policy and stable monetary policy as being mildly negative for the MYR, even as external payments remains comfortable with a 2-3% current account surplus.
The main headwinds for Thailand baht (THB) next year are chronically anaemic domestic demand, a narrowing current account surplus, and, above all, elevated political risk
surrounding national elections in February. While exports have lost some impetus as an engine of growth, there appears to be a significant inventory build-up over the past two years depressing future growth prospects. The lack of fiscal impetus, especially the absence of a much-touted boost to infrastructure spending, suggests growth will remain stuck under 4% in 2019 (ING forecast 3.8%). And absent any inflationary pressure, the BoT will have little scope to start policy normalisation anytime soon.
Fig 78 Year-to-date 2018 Asian FX performance (%)
Source: CEIC, ING
On the external front, things aren’t that bad for the THB just yet. The current account surplus has started to narrow this year, though at 7% of GDP (our surplus projection for 2018) it is still large. The potential relocation of supply chains triggered by the US-China trade war bodes well for foreign direct investment inflows, though this also demands continued political stability. The passage of power to a civilian government after four
-15.0
-12.0
-9.0
-6.0
-3.0
0.0
3.0
6.0
THB MYR SGD TWD KRW CNY PHP IDR INR
10M18 Nov-18, month-to-date
“MYR and THB are losing some of their appeal while central banks are nowhere to
be seen”
“Politics likely to be a source of elevated risk for THB in 2019”
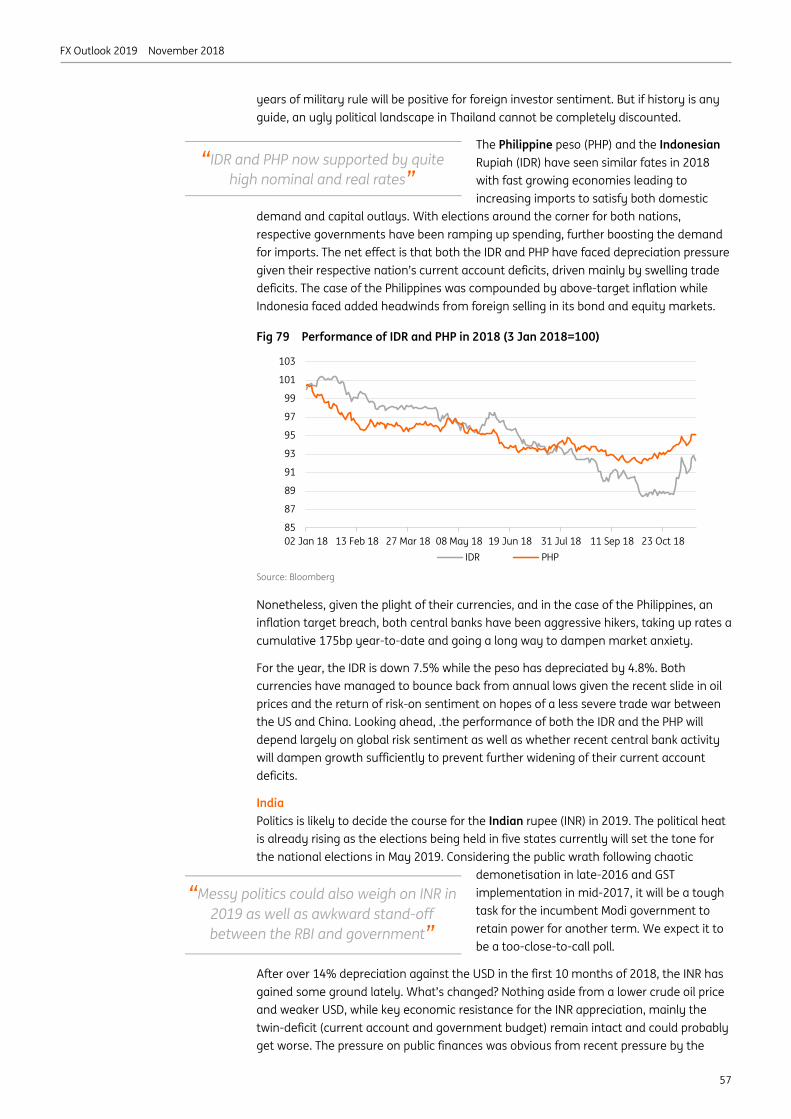
FX Outlook 2019 November 2018
57
years of military rule will be positive for foreign investor sentiment. But if history is any guide, an ugly political landscape in Thailand cannot be completely discounted.
The Philippine peso (PHP) and the Indonesian Rupiah (IDR) have seen similar fates in 2018 with fast growing economies leading to increasing imports to satisfy both domestic
demand and capital outlays. With elections around the corner for both nations, respective governments have been ramping up spending, further boosting the demand for imports. The net effect is that both the IDR and PHP have faced depreciation pressure given their respective nation’s current account deficits, driven mainly by swelling trade deficits. The case of the Philippines was compounded by above-target inflation while Indonesia faced added headwinds from foreign selling in its bond and equity markets.
Fig 79 Performance of IDR and PHP in 2018 (3 Jan 2018=100)
Source: Bloomberg
Nonetheless, given the plight of their currencies, and in the case of the Philippines, an inflation target breach, both central banks have been aggressive hikers, taking up rates a cumulative 175bp year-to-date and going a long way to dampen market anxiety.
For the year, the IDR is down 7.5% while the peso has depreciated by 4.8%. Both currencies have managed to bounce back from annual lows given the recent slide in oil prices and the return of risk-on sentiment on hopes of a less severe trade war between the US and China. Looking ahead, .the performance of both the IDR and the PHP will depend largely on global risk sentiment as well as whether recent central bank activity will dampen growth sufficiently to prevent further widening of their current account deficits.
India Politics is likely to decide the course for the Indian rupee (INR) in 2019. The political heat is already rising as the elections being held in five states currently will set the tone for the national elections in May 2019. Considering the public wrath following chaotic
demonetisation in late-2016 and GST implementation in mid-2017, it will be a tough task for the incumbent Modi government to retain power for another term. We expect it to be a too-close-to-call poll.
After over 14% depreciation against the USD in the first 10 months of 2018, the INR has gained some ground lately. What’s changed? Nothing aside from a lower crude oil price and weaker USD, while key economic resistance for the INR appreciation, mainly the twin-deficit (current account and government budget) remain intact and could probably get worse. The pressure on public finances was obvious from recent pressure by the
85
87
89
91
93
95
97
99
101
103
02 Jan 18 13 Feb 18 27 Mar 18 08 May 18 19 Jun 18 31 Jul 18 11 Sep 18 23 Oct 18IDR PHP
“IDR and PHP now supported by quite high nominal and real rates”
“Messy politics could also weigh on INR in 2019 as well as awkward stand-off between the RBI and government”

FX Outlook 2019 November 2018
58
government on the central bank for more funds. Yes, the thawing of tensions between the Reserve Bank of India (RBI) and the government is another positive for now, though recent tensions will continue to lurk in the background and are not positive for the currency.
The benign inflation backdrop, which is puzzling in view of INR’s dismal performance, has allowed the RBI to hold the line on policy interest rates. But the wide fiscal deficit will eventually be inflationary, while crowding out
of private sector investment will also weigh on GDP growth. That said, we have scaled back our RBI view from a rate hike at the last meeting of the year in December to no more hikes this year. We do, however, expect the RBI to resume tightening once the elections are out of the way by mid-2019. And we see the USD/INR weakening past the 73 level in the next three to six months.
Fig 80 India: Resurgent twin-deficit problem
Source: CEIC, ING
-7
-6
-5
-4
-3
-2
-1
0
2011 2012 2013 2014 2015 2016 2017 2018 INGf
% of GDP
Financial year starting April
Current account balance Fiscal balance
“RBI has not followed in the steps of BSP or BI, and that could see INR slide further
in 2019”
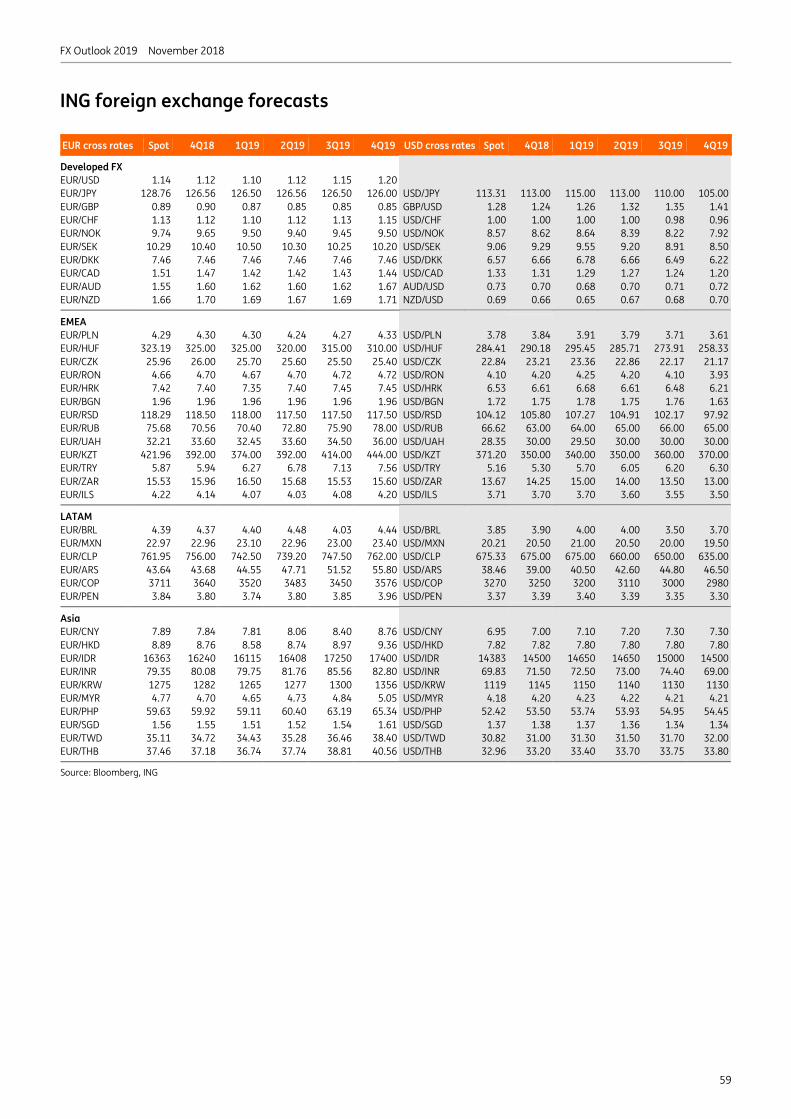
FX Outlook 2019 November 2018
59
ING foreign exchange forecasts
EUR cross rates Spot 4Q18 1Q19 2Q19 3Q19 4Q19 USD cross rates Spot 4Q18 1Q19 2Q19 3Q19 4Q19
Developed FX EUR/USD 1.14 1.12 1.10 1.12 1.15 1.20 EUR/JPY 128.76 126.56 126.50 126.56 126.50 126.00 USD/JPY 113.31 113.00 115.00 113.00 110.00 105.00 EUR/GBP 0.89 0.90 0.87 0.85 0.85 0.85 GBP/USD 1.28 1.24 1.26 1.32 1.35 1.41 EUR/CHF 1.13 1.12 1.10 1.12 1.13 1.15 USD/CHF 1.00 1.00 1.00 1.00 0.98 0.96 EUR/NOK 9.74 9.65 9.50 9.40 9.45 9.50 USD/NOK 8.57 8.62 8.64 8.39 8.22 7.92 EUR/SEK 10.29 10.40 10.50 10.30 10.25 10.20 USD/SEK 9.06 9.29 9.55 9.20 8.91 8.50 EUR/DKK 7.46 7.46 7.46 7.46 7.46 7.46 USD/DKK 6.57 6.66 6.78 6.66 6.49 6.22 EUR/CAD 1.51 1.47 1.42 1.42 1.43 1.44 USD/CAD 1.33 1.31 1.29 1.27 1.24 1.20 EUR/AUD 1.55 1.60 1.62 1.60 1.62 1.67 AUD/USD 0.73 0.70 0.68 0.70 0.71 0.72 EUR/NZD 1.66 1.70 1.69 1.67 1.69 1.71 NZD/USD 0.69 0.66 0.65 0.67 0.68 0.70
EMEA EUR/PLN 4.29 4.30 4.30 4.24 4.27 4.33 USD/PLN 3.78 3.84 3.91 3.79 3.71 3.61 EUR/HUF 323.19 325.00 325.00 320.00 315.00 310.00 USD/HUF 284.41 290.18 295.45 285.71 273.91 258.33 EUR/CZK 25.96 26.00 25.70 25.60 25.50 25.40 USD/CZK 22.84 23.21 23.36 22.86 22.17 21.17 EUR/RON 4.66 4.70 4.67 4.70 4.72 4.72 USD/RON 4.10 4.20 4.25 4.20 4.10 3.93 EUR/HRK 7.42 7.40 7.35 7.40 7.45 7.45 USD/HRK 6.53 6.61 6.68 6.61 6.48 6.21 EUR/BGN 1.96 1.96 1.96 1.96 1.96 1.96 USD/BGN 1.72 1.75 1.78 1.75 1.76 1.63 EUR/RSD 118.29 118.50 118.00 117.50 117.50 117.50 USD/RSD 104.12 105.80 107.27 104.91 102.17 97.92 EUR/RUB 75.68 70.56 70.40 72.80 75.90 78.00 USD/RUB 66.62 63.00 64.00 65.00 66.00 65.00 EUR/UAH 32.21 33.60 32.45 33.60 34.50 36.00 USD/UAH 28.35 30.00 29.50 30.00 30.00 30.00 EUR/KZT 421.96 392.00 374.00 392.00 414.00 444.00 USD/KZT 371.20 350.00 340.00 350.00 360.00 370.00 EUR/TRY 5.87 5.94 6.27 6.78 7.13 7.56 USD/TRY 5.16 5.30 5.70 6.05 6.20 6.30 EUR/ZAR 15.53 15.96 16.50 15.68 15.53 15.60 USD/ZAR 13.67 14.25 15.00 14.00 13.50 13.00 EUR/ILS 4.22 4.14 4.07 4.03 4.08 4.20 USD/ILS 3.71 3.70 3.70 3.60 3.55 3.50
LATAM EUR/BRL 4.39 4.37 4.40 4.48 4.03 4.44 USD/BRL 3.85 3.90 4.00 4.00 3.50 3.70 EUR/MXN 22.97 22.96 23.10 22.96 23.00 23.40 USD/MXN 20.21 20.50 21.00 20.50 20.00 19.50 EUR/CLP 761.95 756.00 742.50 739.20 747.50 762.00 USD/CLP 675.33 675.00 675.00 660.00 650.00 635.00 EUR/ARS 43.64 43.68 44.55 47.71 51.52 55.80 USD/ARS 38.46 39.00 40.50 42.60 44.80 46.50 EUR/COP 3711 3640 3520 3483 3450 3576 USD/COP 3270 3250 3200 3110 3000 2980 EUR/PEN 3.84 3.80 3.74 3.80 3.85 3.96 USD/PEN 3.37 3.39 3.40 3.39 3.35 3.30
Asia EUR/CNY 7.89 7.84 7.81 8.06 8.40 8.76 USD/CNY 6.95 7.00 7.10 7.20 7.30 7.30 EUR/HKD 8.89 8.76 8.58 8.74 8.97 9.36 USD/HKD 7.82 7.82 7.80 7.80 7.80 7.80 EUR/IDR 16363 16240 16115 16408 17250 17400 USD/IDR 14383 14500 14650 14650 15000 14500 EUR/INR 79.35 80.08 79.75 81.76 85.56 82.80 USD/INR 69.83 71.50 72.50 73.00 74.40 69.00 EUR/KRW 1275 1282 1265 1277 1300 1356 USD/KRW 1119 1145 1150 1140 1130 1130 EUR/MYR 4.77 4.70 4.65 4.73 4.84 5.05 USD/MYR 4.18 4.20 4.23 4.22 4.21 4.21 EUR/PHP 59.63 59.92 59.11 60.40 63.19 65.34 USD/PHP 52.42 53.50 53.74 53.93 54.95 54.45 EUR/SGD 1.56 1.55 1.51 1.52 1.54 1.61 USD/SGD 1.37 1.38 1.37 1.36 1.34 1.34 EUR/TWD 35.11 34.72 34.43 35.28 36.46 38.40 USD/TWD 30.82 31.00 31.30 31.50 31.70 32.00 EUR/THB 37.46 37.18 36.74 37.74 38.81 40.56 USD/THB 32.96 33.20 33.40 33.70 33.75 33.80
Source: Bloomberg, ING
FX Outlook 2019 November 2018
60
Disclaimer This publication has been prepared by the Economic and Financial Analysis Division of ING Bank N.V. (“ING”) solely for information purposes without regard to any particular user's investment objectives, financial situation, or means. ING forms part of ING Group (being for this purpose ING Group N.V. and its subsidiary and affiliated companies). The information in the publication is not an investment recommendation and it is not investment, legal or tax advice or an offer or solicitation to purchase or sell any financial instrument. Reasonable care has been taken to ensure that this publication is not untrue or misleading when published, but ING does not represent that it is accurate or complete. ING does not accept any liability for any direct, indirect or consequential loss arising from any use of this publication. Unless otherwise stated, any views, forecasts, or estimates are solely those of the author(s), as of the date of the publication and are subject to change without notice.
The distribution of this publication may be restricted by law or regulation in different jurisdictions and persons into whose possession this publication comes should inform themselves about, and observe, such restrictions.
Copyright and database rights protection exists in this report and it may not be reproduced, distributed or published by any person for any purpose without the prior express consent of ING. All rights are reserved. ING Bank N.V. is authorised by the Dutch Central Bank and supervised by the European Central Bank (ECB), the Dutch Central Bank (DNB) and the Dutch Authority for the Financial Markets (AFM). ING Bank N.V. is incorporated in the Netherlands (Trade Register no. 33031431 Amsterdam). In the United Kingdom this information is approved and/or communicated by ING Bank N.V., London Branch. ING Bank N.V., London Branch is subject to limited regulation by the Financial Conduct Authority (FCA). ING Bank N.V., London branch is registered in England (Registration number BR000341) at 8-10 Moorgate, London EC2 6DA. For US Investors: Any person wishing to discuss this report or effect transactions in any security discussed herein should contact ING Financial Markets LLC, which is a member of the NYSE, FINRA and SIPC and part of ING, and which has accepted responsibility for the distribution of this report in the United States under applicable requirements.
Additional information is available on request. For more information about ING Group, please visit https://www.ing.com.