Embed Size (px)
Citation preview

2018 Real Estate Forecast
Guest Speaker:Dr. Mark J. Eppli

2018 Board of Directors President: Molly McShane, Conor Commercial Real Estate
President-Elect: Mike Powers, Molto Properties LLC
Secretary & Membership Chair: Mike Tenteris, Cushman & Wakefield
Treasurer & Sponsorship Chair: Johnny Carlson, Trammel Crow Company
Program Chair: Steve Groetsema, Bridge Development Partners, LL
Awards Co-Chair: Susan Bergdoll, Duke Realty
Developing Leaders & University Liaison Co-Chair: Keith Stauber, JLL &
Greg Warsek, Associated Bank
Legislative Chair: Taivo Tammaru, Clarius Partners, LLC
Summer Programs Co-Chair: Michelle Herrick, J.P. Morgan &
Dan Leahy, NAI Hiffman
Developing Leaders President: Brett Tomfohrde, NAI Hiffman

2018 Board of DirectorsDirectors:
Christine Choi Moore, John Hancock Real Estate
Jeff Folkmann, Prologis
Cory Grusecki, Northern Builders, Inc.
Ed Harrington, CenterPoint Properties
Peter Kelly, Lincoln Property Company
Brian Kling, Colliers International
Adam Showalter, Cushman & Wakefield
Chris Zubel, CBRE, Inc
Emeritus Board Members:
Carter Andrus, Prologis
Jim Clewlow, CenterPoint Properties
Kevin Clifton, Cushman & Wakefield
Grady Hamilton, Trammell Crow Company
John Heiberger, CIBC
Kevin Matzke, Clarius Partners, LLC
Dan McCarthy, JLL
Ryan O’Leary, Duke Realty
Tony Pricco, Bridge Development Partners
Fred Regnery, Colliers International
Dave Riefe, Seefried Properties, Inc.
Sean Spellman, CA Ventures

2018 Real Estate Forecast
Guest Speaker:Dr. Mark J. Eppli

THANK YOU TO OUR 2018 PROGRAM SPONSORSLEADERSHIP CIRCLE

THANK YOU TO OUR 2018 PROGRAM SPONSORSLEADERSHIP CIRCLE

THANK YOU TO OUR 2018 PROGRAM SPONSORSLEADERSHIP CIRCLE

THANK YOU TO OUR 2018 PROGRAM SPONSORSLEADERSHIP CIRCLE

GOLDTHANK YOU TO OUR 2018 PROGRAM SPONSORS

SILVERTHANK YOU TO OUR 2018 PROGRAM SPONSORS

Become a 2018 Program Sponsor TODAY!
Visit the registration desk for more information.
DON’T MISS YOUR OPPORTUNITY

2018 Real Estate Forecast
Guest Speaker:Dr. Mark J. Eppli

The Current Commercial Real Estate Environment:Sustainable or Bubble?
Mark J. Eppli. Ph.D.Bell Chair in Real Estate, Marquette University
January 11, 2018

I. Investment Speculation (An irrational run up in price – think Bitcoin)
III. Capital Markets (Supply of capital – 2007-08 Bubble)• Equity• Debt
IV. Construction (Supply of space – 1986 bubble)• Construction Put-in-Place• Adjusted Construction Put-in-Place
V. The Economy (Demand for space)• GDP Growth• Employment Growth
Commercial Real Estate Environment: Sustainable or Bubble

Summary (from last page of 2017 forecast presentation)
Employment and GDP• Employment gains will soften across the year (180,000-200,000 per month)
(Actual 171,000, was a bit too bullish)• GDP will be driven by the almighty U.S. consumer at 2.25-2.5%
(GDP grew 2.3% over the past year with 77% of growth from consumption – got it)
Rates and Returns• Long-term debt rates will increase by 50 bps with solid liquidity
(10 USTs increased 0.17% from 2.38% in 2017 to 2.55% in 2018 a bit too hawkish)• Equity will remain abundant but cap rates will increase 25bps
(NCREIF cap rates fell from 4.48% to 4.38%, a bit too hawkish)
Space Markets• Industrial will outperform and retail demise is overstated
(Industrial outperformed, got it)(Retail had major setbacks in 2017, off the mark)

Industrial property investment outperformed
Source: NCREIF Performance Report, 2017Q3.

Speculation(Bitcoin and the 1920 Florida land run)

Commercial property prices have rebounded . . . .
Source: Green Street Advisors and Marquette University

. . . . . the 2012-2017 price increases look different than the 2002-2007 price increases . . . .
Source: Green Street Advisors and Marquette University
2012-17 5-yearCAGR: 6.2%
2002-07 5-year CAGR: 11.2%
2012-17 5-yearCAGR: -0.5%

. . . . however, property cap rates are at all time lows . . . .
Source: NCREIF and Marquette University

. . . . with solid NOI growth . . . .
Source: NCREIF and Marquette University

. . . . over the past two years, property appreciation has been well-behaved, as is the case longer term.
Index 1-Year 2-Year 3-Year 5-Year 10-Year 19.75-YearCommercial Property Price Index 0.3% 2.6% 5.1% 6.2% 2.8% 5.0%Wilshire 5000 14.1% 13.5% 7.2% 12.0% 5.5% 5.2%Consumer Price Index (CPI) 2.2% 1.8% 1.2% 1.3% 1.7% 2.2%Construction Producer Price Index 3.7% 2.5% 1.1% 1.6% 2.0% 2.3%
Index Appreciaiton Rates 1998-2017Q3
Sources: Green Street Advisors, Federal Reserve Economic Data, and Marquette University

Speculative Bubble
• Commercial real estate prices have moderated over the past two years – no bubble
• However, property cap rates are at all time lows – possible bubble• Solid NOI growth has justified part of the price inflation – no bubble
In summary, while commercial real estate is fully priced, it is not over priced relative to risk spreads for other asset classes (more on that later), and is not a speculative bubble.

Capital Markets(the 2007-09 Credit Bubble)
Commercial Real Estate Equity Investment
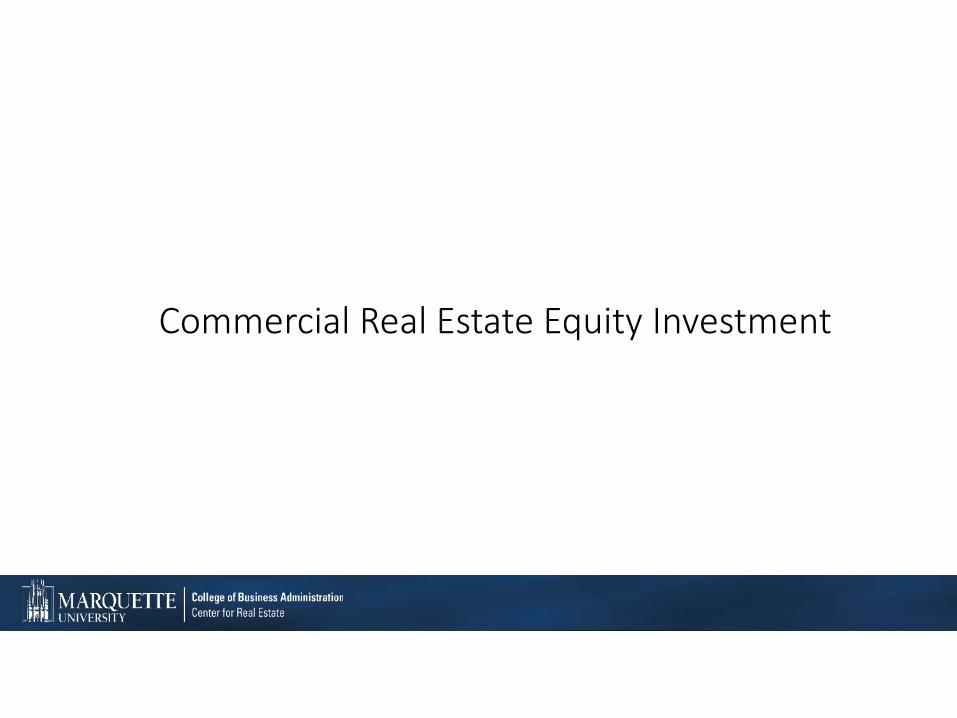
U.S. real estate transaction volume is down year-to-date . . . .
Source: Real Capital Analytics

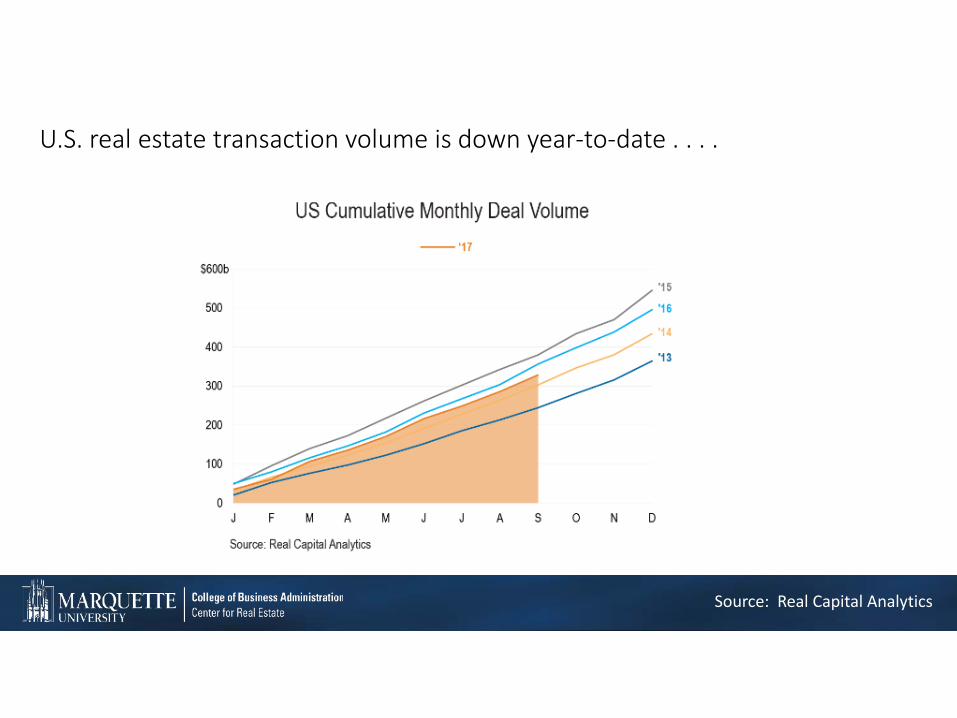
. . . . U.S. real estate transaction volume is off . . . .
Source: Real Capital Analytics
Volume Change
All Property -31%
Apartment -7%
Industrial -31%
Office -50%
Retail -54%Hotel 3%
RCA Commercial Real Estate Transaction Volume (Year-over-Year to November 2017)

. . . . pension fund investment in commercial real estate will remain strong . . . .
Source: Callan and Associates, Risky Business, September 2016and Marquette University
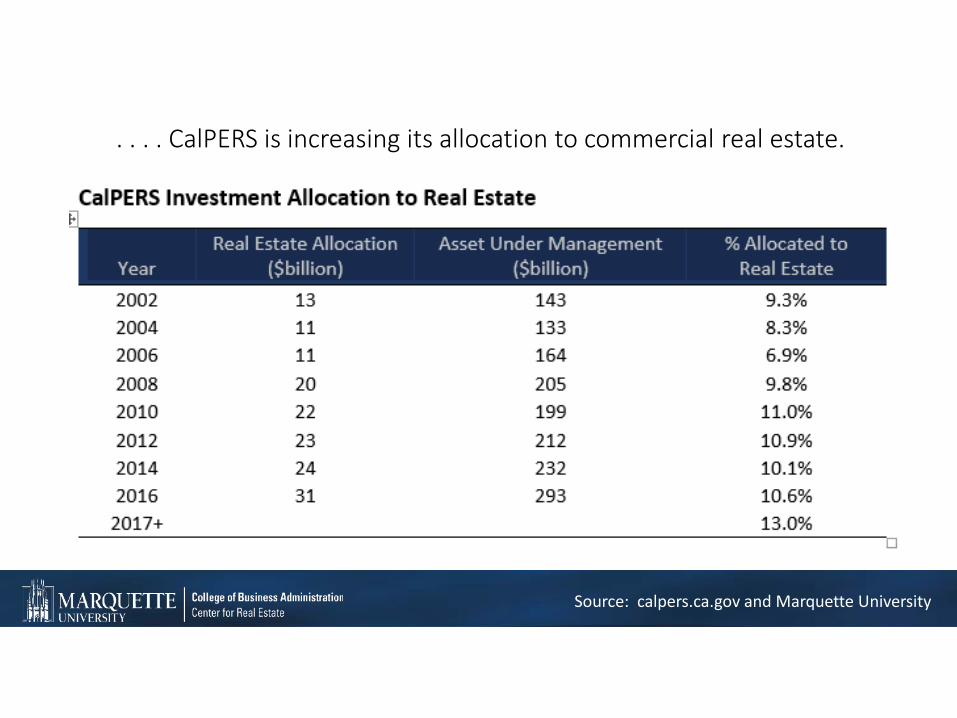
. . . . CalPERS is increasing its allocation to commercial real estate.
Source: calpers.ca.gov and Marquette University

. . . . Actuarial Funded Ratio has dropped from 103% in 2002 to 72% in 2016.
Source: WSJ, January 2, 2018, page A1, and Public Plans Database.
Note: The median discount rate for public pension plans was 8 percent from 1990-2011, and 7.75 percent in 2012.

. . . . pension fund dry power $136 billion in 2017 compared with $120 billion in 2016 . . . .
Source: WSJ, 1/3/18, page B7 and Preqin
Global Private Equity Real Estate Funding
Commercial Real Estate Debt Investment

Total commercial real estate debt outstanding is growing sustainably . . . .
Sources: Federal Reserve Flow of Funds and Marquette University
2007-17 10-yr Commercial CAGR: 1.3%2007-17 10-yr Apartment CAGR: 5.1%
1997-2007 10-year CommercialCAGR: 10.2%
1997-2007 10-year Apartment CAGR: 11.5%

. . . . with low charge-off rates, banks are making money and will stay in the game . . . .
Sources: Federal Reserve Economic Data and Marquette University

. . . . as banks reveal solid discipline, tightening lending standards . . . .
Sources: Federal Reserve Economic Data and Marquette University
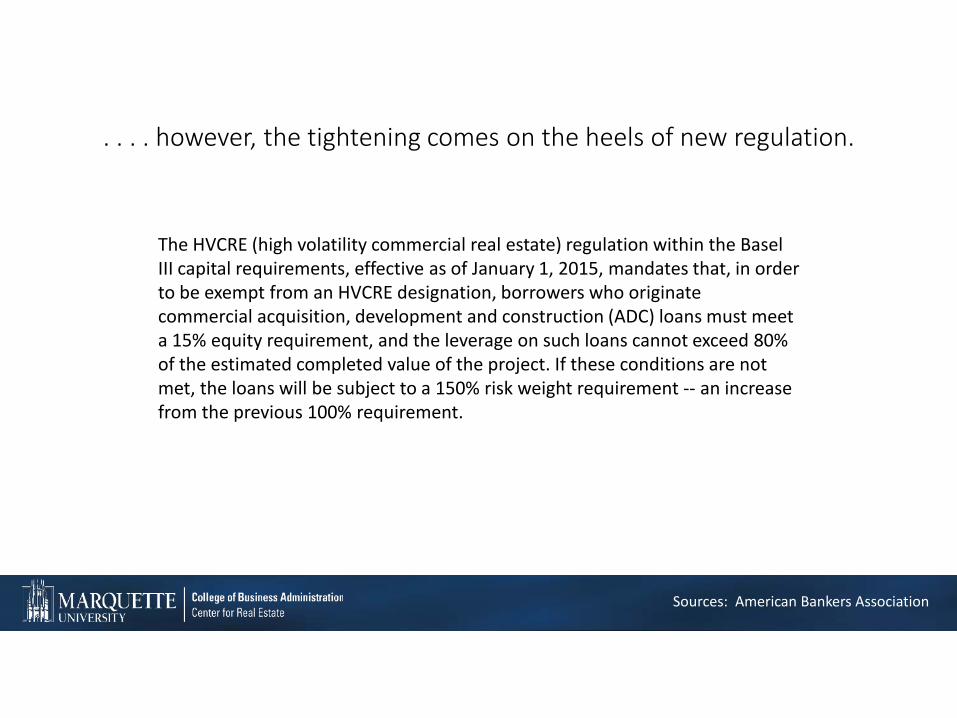
. . . . however, the tightening comes on the heels of new regulation.
The HVCRE (high volatility commercial real estate) regulation within the Basel III capital requirements, effective as of January 1, 2015, mandates that, in order to be exempt from an HVCRE designation, borrowers who originate commercial acquisition, development and construction (ADC) loans must meet a 15% equity requirement, and the leverage on such loans cannot exceed 80% of the estimated completed value of the project. If these conditions are not met, the loans will be subject to a 150% risk weight requirement -- an increase from the previous 100% requirement.
Sources: American Bankers Association

Capital Markets Bubble
• Commercial real estate transaction volume is down the last two years• Institutional and other investors are likely to continue to invest in
commercial real estate• Commercial real estate debt volumes are growing at a sustainable
pace• Lenders have tightened lending standards
In summary, the debt and equity markets are functioning in an appropriate and sustainable manner.

ConstructionThe 1986 Bubble

Average - $188 billion
Sources: U.S. Census and Marquette University
New construction by property type . . . .
Sources: U.S. Census and Marquette University

0
50000
100000
150000
200000
250000
300000
35000019
93
1994
1995
1996
1997
1998
1999
2000
2001
2002
2003
2004
2005
2006
2007
2008
2009
2010
2011
2012
2013
2014
2015
2016
Real Construction Put in Place by Property Type (2016=100)
Type of Construction: Apartments Office
Average - $225 billion
. . . . same chart as the previous slide, but accounting for inflation . . . ‘
Sources: U.S. Census and Marquette University

. . . . same chart as the previous slide but accounting for population growth.
Sources: U.S. Census and Marquette University

Construction or Space Market Bubble
With the exception of fairly narrow pockets of apartment overbuilding, construction is being maintained at sustainable levels,

The Economy

Since the Great Recession, GDP has grown at a modest 2.1%. At 102 months it is the third longest of the 33 economic cycles since 1854 . . . .
Average GDP Growth Rate 1960-2017Q2 = 3.2%
Sources: Federal Reserve Economic Data and Marquette University
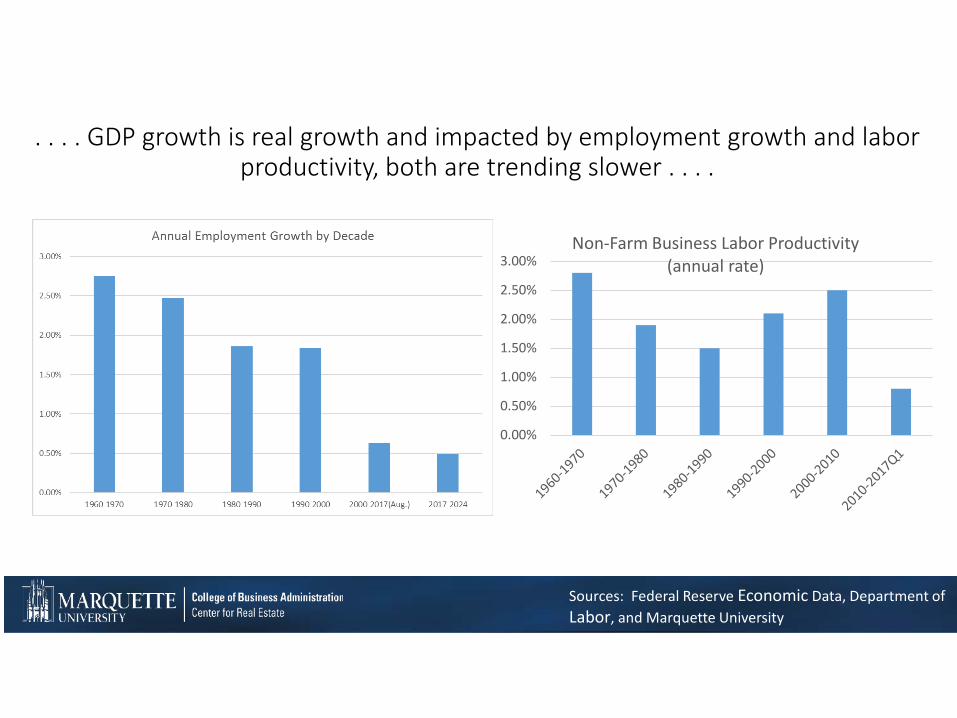
. . . . GDP growth is real growth and impacted by employment growth and labor productivity, both are trending slower . . . .
0.00%
0.50%
1.00%
1.50%
2.00%
2.50%
3.00%Non-Farm Business Labor Productivity
(annual rate)
Sources: Federal Reserve Economic Data, Department of Labor, and Marquette University

. . . . the impact of tax code changes on GDP . . . .
Sources: WSJ, December 20, 2017, p. A1.
Quarterly Change in GDP before and after big Revisions in the Tax Code

. . . . GDP growth by component . . . .
Sources: Federal Reserve Economic Data
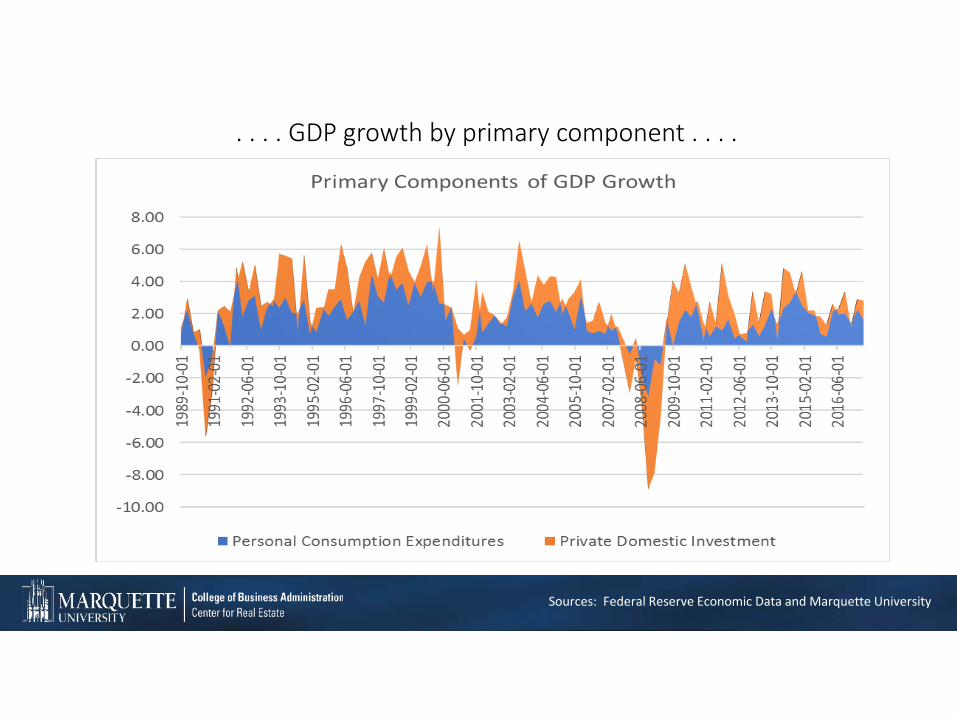
. . . . GDP growth by primary component . . . .
Sources: Federal Reserve Economic Data and Marquette University

. . . . consumers are 68% of the U.S. economy and continue to spend . . . .
Sources: Federal Reserve Economic Data and Marquette University
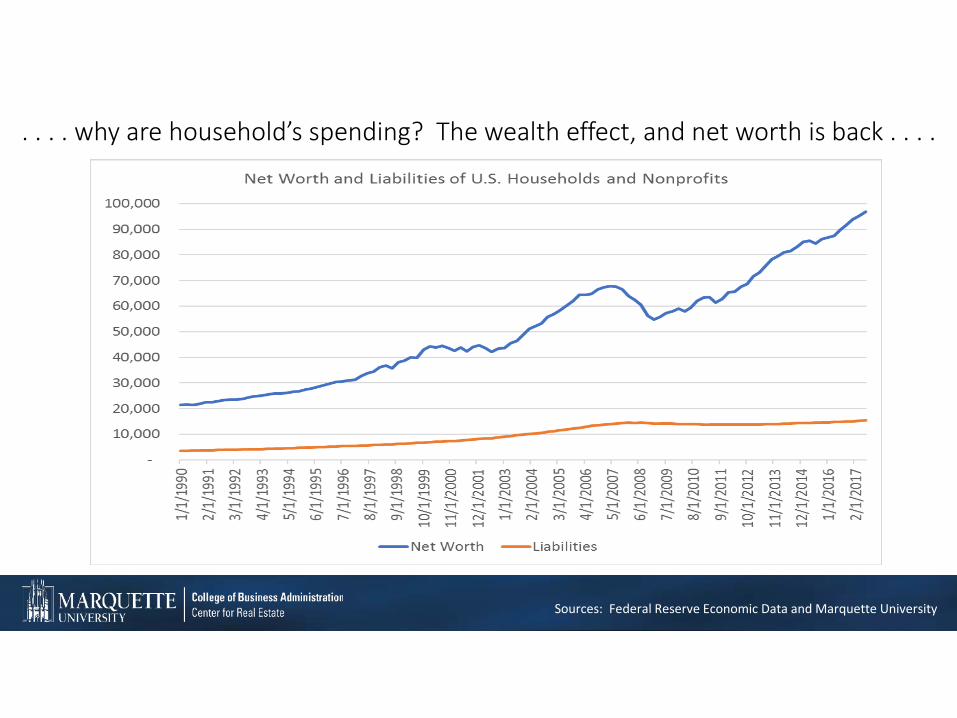
. . . . why are household’s spending? The wealth effect, and net worth is back . . . .
Sources: Federal Reserve Economic Data and Marquette University

. . . . household liabilities growth remains low . . . .
Sources: Federal Reserve Economic Data and Marquette University
2007-2017 CAGR = 0.81%
1997-2007 CAGR = 9.65%
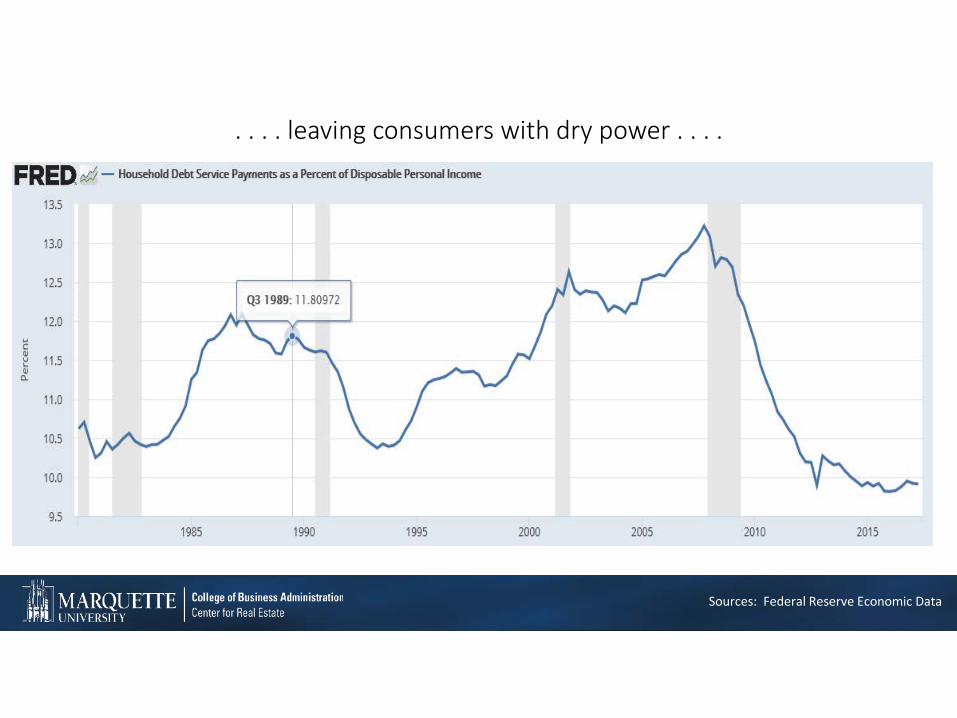
. . . . leaving consumers with dry power . . . .
Sources: Federal Reserve Economic Data
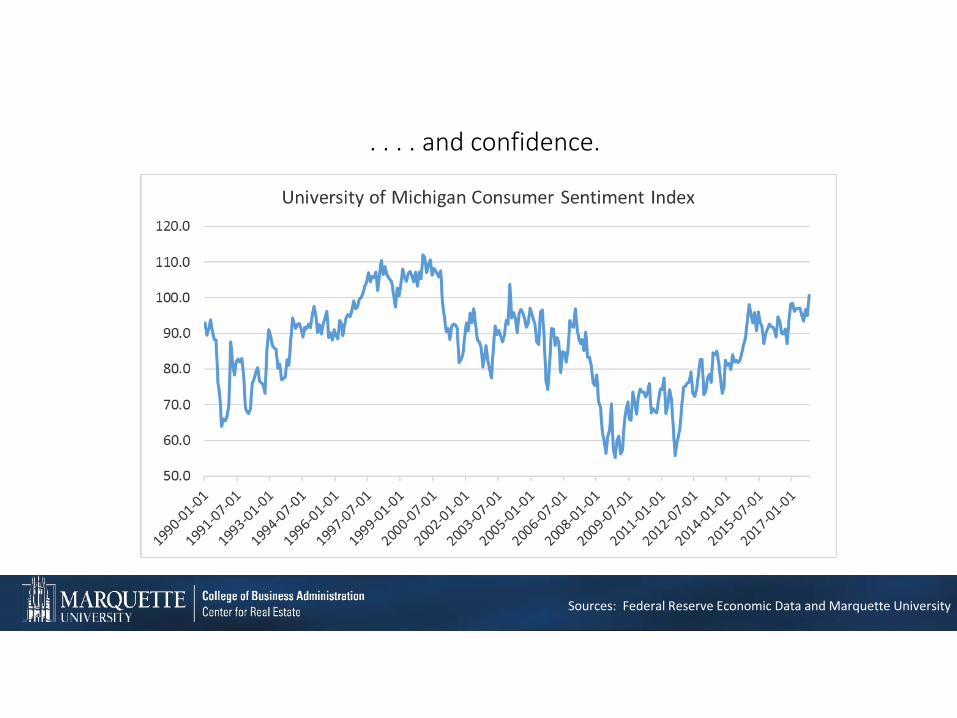
. . . . and confidence.
Sources: Federal Reserve Economic Data and Marquette University

Why the continued GDP growth? Business investment will re-emerge . . . .
Sources: Federal Reserve Economic Data
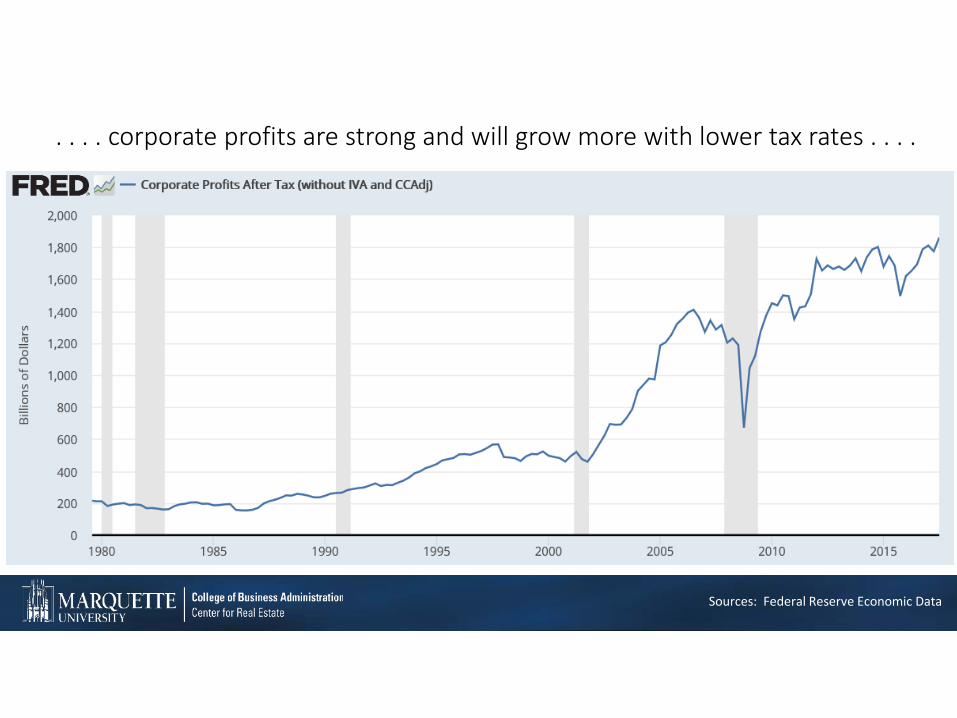
. . . . corporate profits are strong and will grow more with lower tax rates . . . .
Sources: Federal Reserve Economic Data

. . . . and small businesses maintain that same optimism.
Source: National Independent Business Survey

Economic Growth (demand for space)
• GDP never hit a period of rapid growth post-Great Recession• GDP will not take off like a rocket ship• Consumers have high net worth, modest debt and low debt service
payments, and will continue to be the stable force behind GDP growth
• Corporate spending will push growth
In summary, both consumption and business spending is well positioned for the coming 12-18 months

Employment

86 months of employment growth, the longest in history averaging 196,000 monthly jobs . . . .
Source: Federal Reserve Economic Data and Marquette University

. . . . which has dramatically tightened the job market . . . .
Sources: Federal Reserve Economic Data and Marquette University

. . . . service labor costs have pushed service inflation faster than goods inflation . . . .
Sources: Federal Reserve Economic Data, and Marquette University

. . . . wages have been outpacing inflation since 2012 (Baby Boom retirement) . . . .
Sources: Federal Reserve Economic Data, Federal Reserve Bank of Atlanta, and Marquette University

. . . . low unemployment and higher wages have increase labor force participation. . . .
Sources: Federal Reserve Economic Data, and Marquette University

Wage inflation is emerging
• 4.1% current unemployment rate is the lowest in 16 years (at or below full employment)
• 86 months of month-over-month job growth limits the candidate pool
• 16.8 million jobs is the largest job growth in a U.S. expansion• 143 weeks of initial unemployment claims remaining below 300,000
• College educated worker pool is fully employed
In summary, about 70% of everything we purchase is labor and labor rates will increase in the coming year.
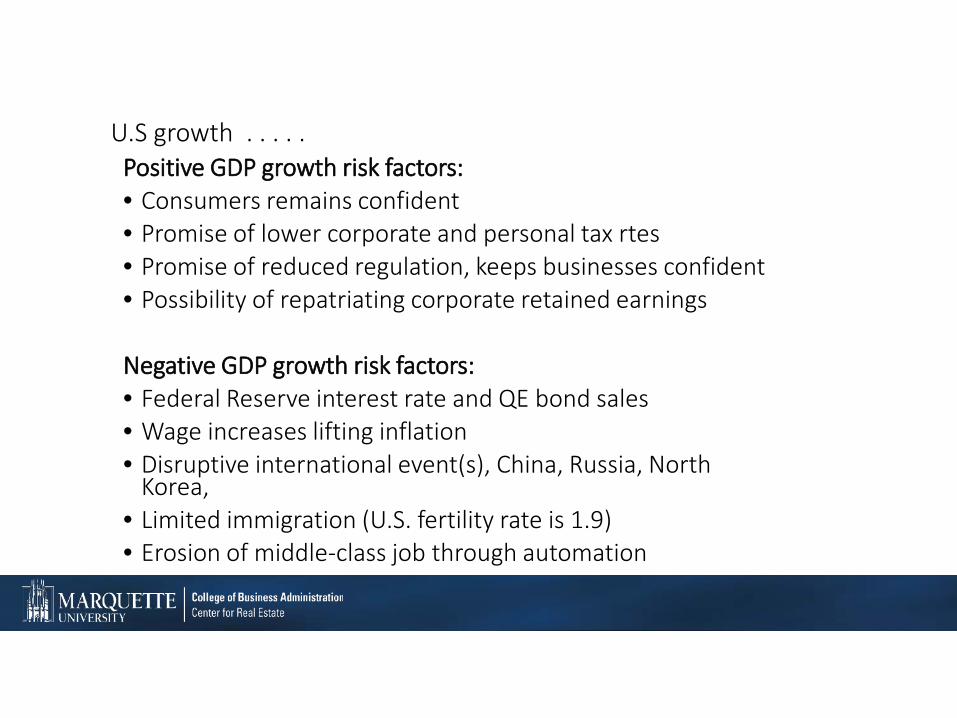
Positive GDP growth risk factors:• Consumers remains confident• Promise of lower corporate and personal tax rtes• Promise of reduced regulation, keeps businesses confident• Possibility of repatriating corporate retained earnings
Negative GDP growth risk factors:• Federal Reserve interest rate and QE bond sales• Wage increases lifting inflation• Disruptive international event(s), China, Russia, North
Korea, • Limited immigration (U.S. fertility rate is 1.9)• Erosion of middle-class job through automation • Lack of productivity growth from the service sector
U.S growth . . . . .

• GDP growth 2.75-3.0%, driven by business spending
• Employment growth 135,000-150,000 new jobs per month
• 10-Year U.S.T. 2.8-3.2%• Cap rates turn up about 25 basis points• Preferred Property type in 2018 remains Industrial• Lack of productivity growth from the service sector
U.S economy, the coming year . . . . .

Sustainable or Bubble• Assets fully priced, but not speculatively priced • Equity capital markets are in check, and stepped back in 2017• Debt capital markets are at a sustainable level• Space markets are not overbuilt• GDP growth looks sustainable through 2018, probably 2019• Wage inflation will push interest rates higher
In summary, sustainable.
The Current Commercial Real Estate Environment:Sustainable or Bubble?
Mark J. Eppli. Ph.D.Bell Chair in Real Estate, Marquette University
January 11, 2018
Real Estate Holding Period Return Research

Determine Holding period Returns (i.e. Total property returns). . . .
. . . . .across the five major property types,. . . . . after adjusting for risk,
. . . . . across geographic area, and. . . . . across market employment size/growth
. . . . using the best data in the industry . . . .
• The NCREIF, NPI Data• Quarterly data• Income and appreciation components• Maintained by property type (office, industrial, retail, hotel and apartment)• Maintained by regions of the U.S. and at the MSA• 2016Q4 market value of over half a trillion dollars and over 10,000 properties• Limited to institutional property owners and mainly core assets

. . . . apartments dominate holding period returns and risk-adjusted returns for 3, 5, 7, 10, and 15-year holding periods . . . .
7-year Holding Period Returns (1987-2016)
Property Type
Mean
S.D.
Sharpe Ratio
All 7.87% 3.56% 0.62 Apartment 9.05% 2.81% 1.21 Industrial 8.27% 3.75% 0.70 Office 6.99% 4.76% 0.28 Retail 8.68% 3.54% 0.85 Hotel 8.63% 4.43% 0.67

Audience Question . . . .
What do you think the breakdown is between income and appreciation for the seven year holding period analysis for all NCREIF NPI properties:
A. 7% income and 1% appreciationB. 6% income and 2% appreciationC. 5% income and 3% appreciationD. 4% income and 4% appreciation

. . . . apartment returns are the best inflation hedge with inflation averaging 2.7% during the analysis time period . . . .
7-year Holding Period Returns by Income and Capital Appreciation Returns
Property Type
Income
Capital Appreciation
Total
Apartment 6.98% 1.97% 9.05% Industrial 7.96% 0.30% 8.27% Office 7.44% -0.43% 6.99% Retail 7.29% 1.33% 8.68% Hotel 8.95% -0.31% 8.63%

. . . . Annual Capital expenditures is consuming property appreciation for hotel, office, and industrial properties . . . .
Source: NCREIF data used in “New NCREIF Value Index and Operations Measures,” Michael S. Young, Jeffrey D. Fisher, and Joseph D’Alessandro, Journal of Real Estate Literature, 25:1 (2017), 221-235.
0.00%
1.00%
2.00%
3.00%
4.00%
5.00%
1988
419
894
1990
419
914
1992
419
934
1994
419
954
1996
419
974
1998
419
994
2000
420
014
2002
420
034
2004
420
054
2006
420
074
2008
420
094
2010
420
114
2012
420
134
2014
420
154
2016
4
Annual Capital Expenditures as a Percent of Market Value By Property Type
Apartments Hotel Industrial Office Retail
Apartment Ave: 1.2% Retail Ave: 1.3%
Hotel Ave: 3.1%
Office Ave: 2.7%

7-year Holding period returns including and excluding Cap Ex
7-year Holding Period Returns with and without Capital Expenditures
Property Type
Returns
Excluding Cap Ex
Capital
Expenditures
Holding Period Returns Including
Cap Ex All 9.86% 1.99% 7.87% Apartment 10.22% 1.18% 9.05% Industrial 9.89% 1.62% 8.27% Office 9.71% 2.72% 6.99% Retail 10.02% 1.34% 8.68% Hotel 11.71% 3.10% 8.63%

Key Research Takeaways
• Apartment returns dominate the other property types when measuring • Unadjusted returns
Risk-adjusted returnsAcross geographic regionsAcross city tiers
• Apartment provide anecdotal hedge for inflation (i.e. positive property appreciation)
• Apartments have the lowest ratio of Annual Cap Ex to Property Value of the property types
• Commercial real estate returns may be challenged in the coming decade as cap rate compression no longer prop-up property appreciation rates

2018 Real Estate Forecast
Guest Speaker:Dr. Mark J. Eppli