Embed Size (px)
Citation preview

2014 Real Estate Market Update & 2015 Outlook
January 22, 2015
Presented by:

about myself
American National
More than 6 years experience in the local real estate industry
Winner of the 2014 Asia CEO Top Young Leader Award
Oversees sales, investments, and agency teams
Also founded KMC Solutions, a facilities and technology
outsourcing services provider
Previously worked in Silicon Valley (San Francisco Bay Area,
California) as a software and IT consultant from 2003 - 2007

kmc mag group introduction
Incorporated in 2009
Full Service Real Estate Firm
International Associate of Savills
Founders: Atty. Amanda Carpo, Michael
McCullough and Gregory Kittelson
Headquarters: Sun Life Centre, Bonifacio Global City
Globally recognized as Best Philippine Real
Estate Agency Award by the International
Property Awards
Over 100 competitive staff employed
300+ companies
assisted in the last few years in their business set up in the Philippines
230,000+ square meters of commercial & residential properties which were leased and sold for
as of 2014
Strong Media Exposure

major regional trends 2015
today’s topics
property trends - philippines
office market update
residential market update
key industry issues & challenges
10 things to look out for in the next 10 years
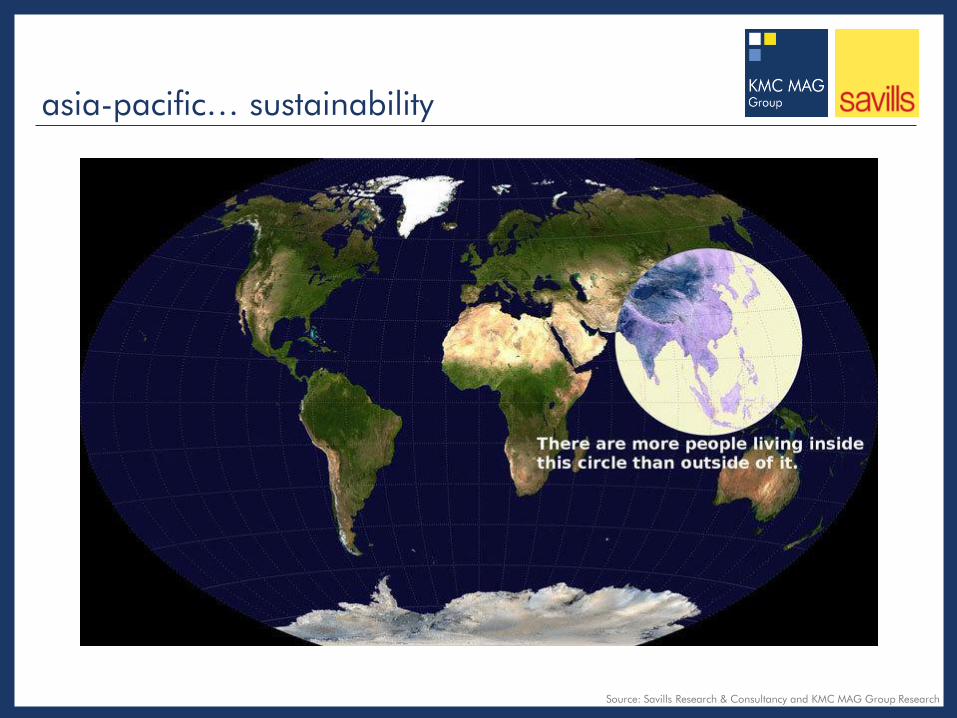
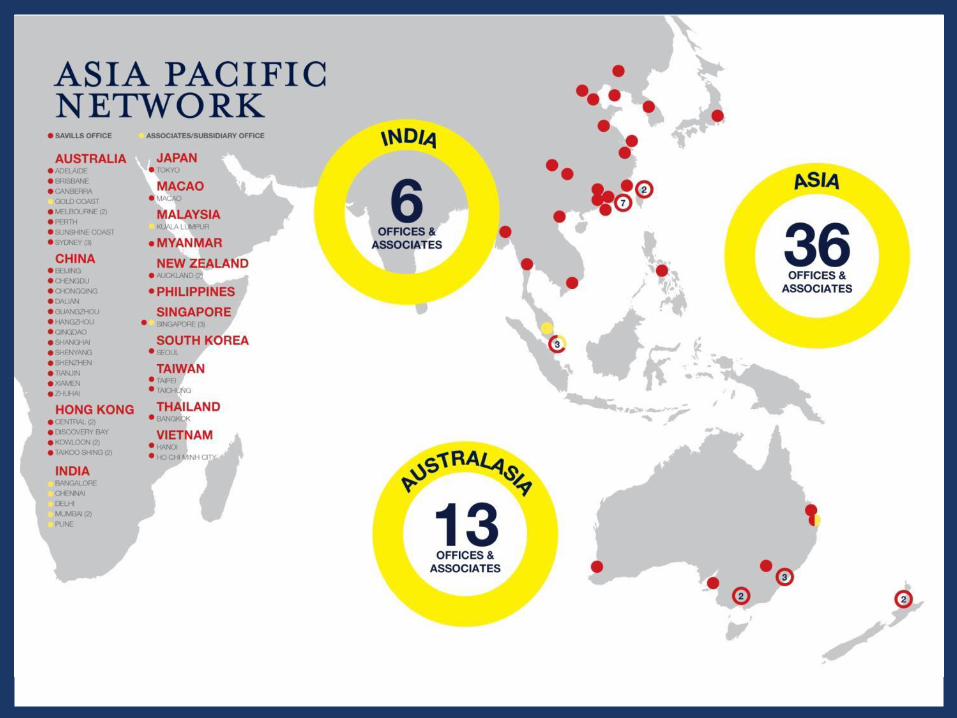
asia-pacific… sustainability
Source: Savills Research & Consultancy and KMC MAG Group Research

major regional trends 2015
The outlook for the Asia and Pacific region remains solid
Asia to remain the most dynamic region in the world
Vigilance and further reforms needed to sustain
momentum
GDP is forecast to grow by 5.5% in 2014, rising slightly to
5.6 % in 2015
Philippines among the top countries with 5.3% (3Q14)
Global QE and its impact on Asia?
Not US so much as Europe, Japan and China
Interest rate rises in 2015?
Real estate in China?
Cooling measures in Singapore, HK and China
Investor sentiment – core assets are scarce so must move up
on risk curve
Source: KMC MAG Group Research, NSCB, IMF
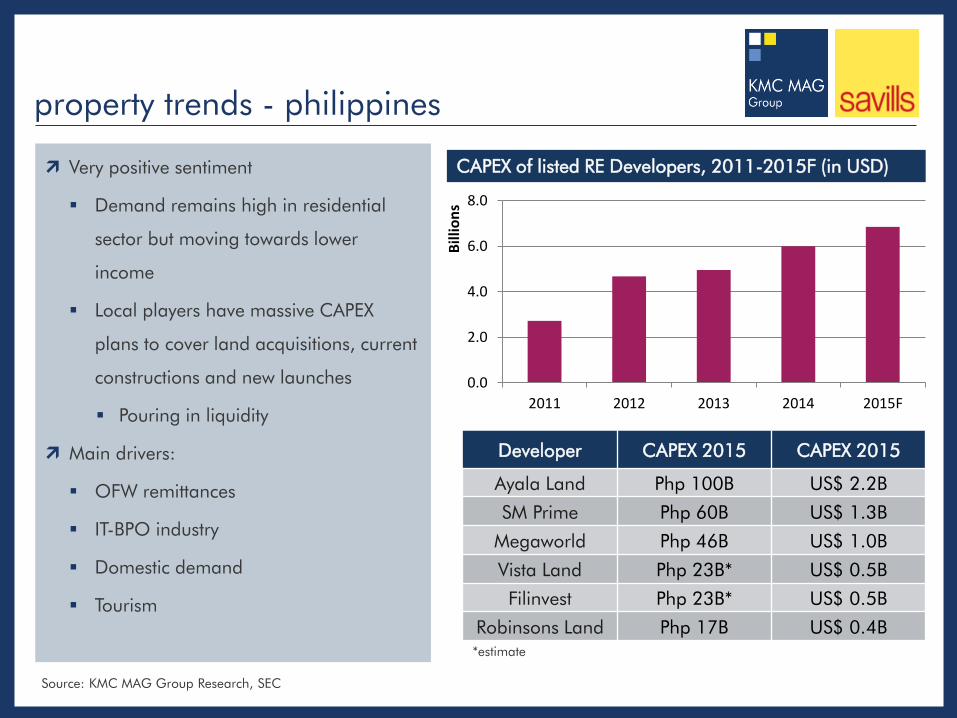
property trends - philippines
Very positive sentiment
Demand remains high in residential
sector but moving towards lower
income
Local players have massive CAPEX
plans to cover land acquisitions, current
constructions and new launches
Pouring in liquidity
Main drivers:
OFW remittances
IT-BPO industry
Domestic demand
Tourism
66% 9%
21%
4%
Office
Other
Dev site
Hotel
Transaction volume by type of use, last 12 months
Developer CAPEX 2015 CAPEX 2015
Ayala Land Php 100B US$ 2.2B
SM Prime Php 60B US$ 1.3B
Megaworld Php 46B US$ 1.0B
Vista Land Php 23B* US$ 0.5B
Filinvest Php 23B* US$ 0.5B
Robinsons Land Php 17B US$ 0.4B
Source: KMC MAG Group Research, SEC
0.0
2.0
4.0
6.0
8.0
2011 2012 2013 2014 2015F
Bill
ion
s
CAPEX of listed RE Developers, 2011-2015F (in USD)
*estimate

property cycle - PH
Mid end residential Hotel and Leisure
Luxury residential Office Industrial
Retail
Late upswing Early downswing Late downswing Early upswing
Sustained growth in demand, increasing construction
Positive but falling demand, increasing vacancy
Increasing demand, decreasing vacancy
Falling demand, decreasing vacancy
Source: KMC MAG Group Research

property trend questions
Questions?

business districts
Several emerging business districts are about to rise in the near future
Most anticipated are Bay City and Quezon City
Challenge for infrastructure on how to connect these together
Source: KMC MAG Group Research

the BPO industry in the Philippines
#2 in non-voice
complex
Began emerging in
2000
Growth at an annual rate of
26 percent over a decade
890,000 direct employees
by 2013
US$16
billion in revenues
2.0 million indirect
employees
Serving North America Asia EU
20+ sectors
Over 700 IT-
BPO companies and Global In-house Centers
Source: Business Process Association Philippines (BPAP)

3.2
4.8 6.1
7.1
8.9
11.0
13.6
16.0
18.0
25.0
0.2
0.4
0.6
0.8
1.0
1.2
1.4
1.6
-
5.0
10.0
15.0
20.0
25.0
30.0
2006 2007 2008 2009 2010 2011 2012 2013 2014F 2016F
Pers
ons
(mill
ion)
US$
(bill
ion)
Industry revenues Direct employment No signs of slowing down
Manila now the 2nd best outsourcing destination by Tholons
Concerted industry efforts and continued government support can get sector to US$20 billion by 2016
Strengthened public-private partnership can increase this to US $25 billion.
Average office space per employee is roughly 6 sqm/person, resulting in the annual demand of roughly 900,000 sqm for office space
CAGR 26%
CAGR ~18%
philippines IT-BPO industry
Source: Business Process Association Philippines (BPAP)

premium and grade a office supply (sq m of GLA)
Source: KMC MAG Group Research
0
1,000,000
2,000,000
3,000,000
4,000,000
5,000,000
6,000,000
2006 2007 2008 2009 2010 2011 2012 2013 2014 2015F2016F2017F2018F2019F
Quezon City Bay Area Eastwood Alabang Ortigas CBD BGC Makati CBD
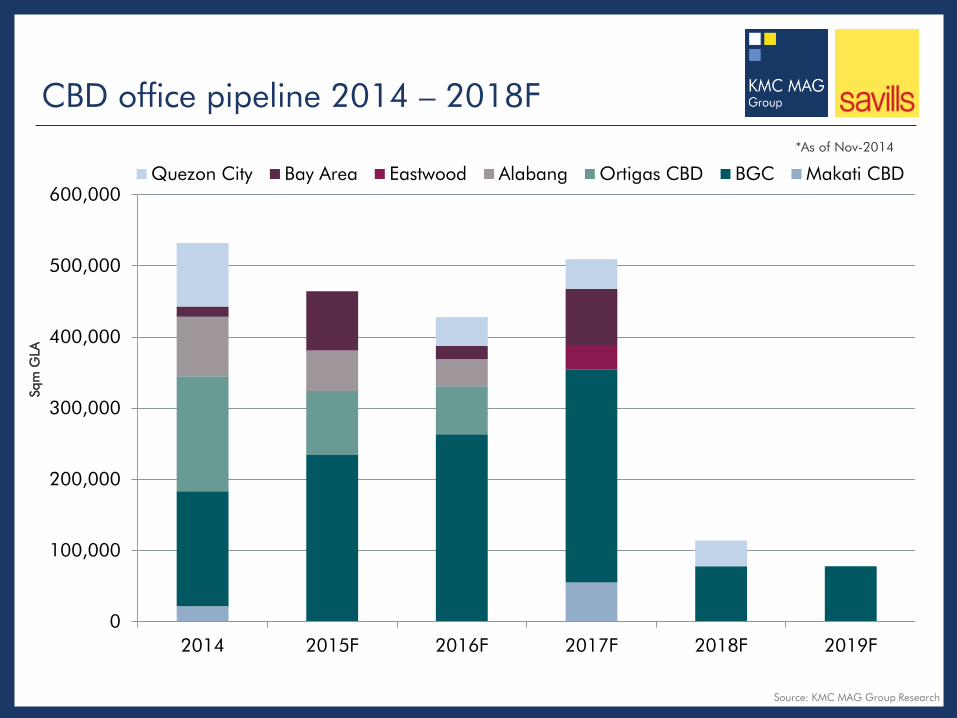
CBD office pipeline 2014 – 2018F *As of Nov-2014
Sqm
GLA
0
100,000
200,000
300,000
400,000
500,000
600,000
2014 2015F 2016F 2017F 2018F 2019F
Quezon City Bay Area Eastwood Alabang Ortigas CBD BGC Makati CBD
Source: KMC MAG Group Research
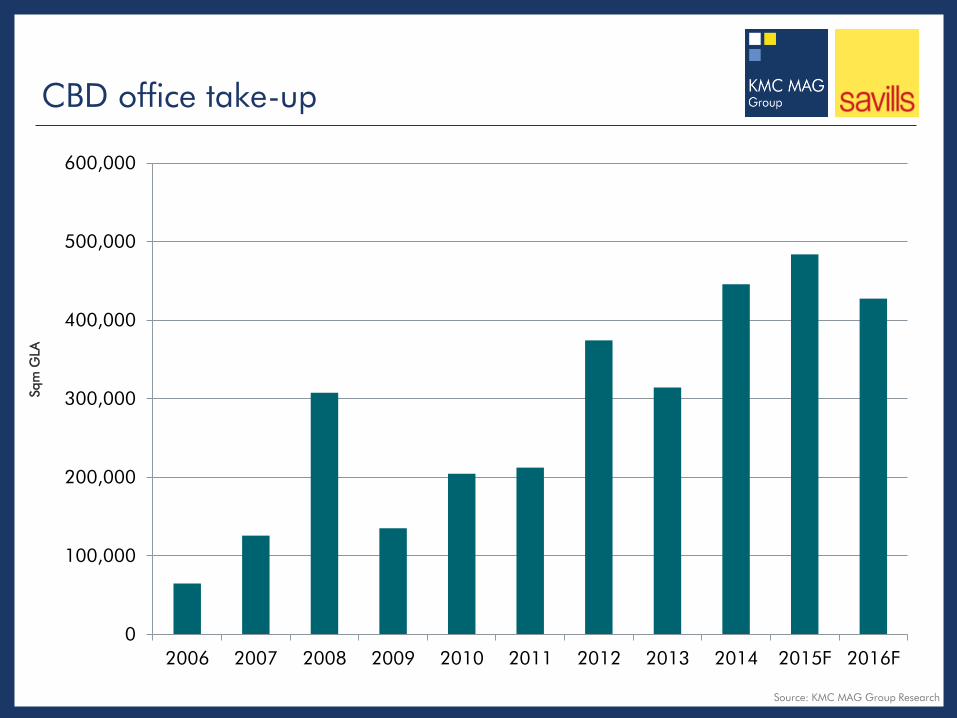
0
100,000
200,000
300,000
400,000
500,000
600,000
2006 2007 2008 2009 2010 2011 2012 2013 2014 2015F 2016F
CBD office take-up
Sqm
GLA
Source: KMC MAG Group Research

investor demand stays high
Leasing activity is
expected to continue and
reach new heights next
year
O&O industry
Tech sector
However, high liquidity in
the system will probably
keep the capital values
outpacing the rental
growth
Cap between capital values and rents is widening
Yield compression
Source: BSP, KMC MAG Group Research
0.0
50.0
100.0
150.0
200.0
250.0
300.0Grade A Office: Rental Index Grade A Office: Price Index

still a yield driven market
As a result of investment
rating upgrades, the
government’s borrowing cost
has reduced significantly
Making real estate look attractive
Despite the small yield compression, the yield spread has actually increased and is historically wider than ever
Suggesting undervalued Grade A Office
Source: PDEX, KMC MAG Group Research
0.0%
2.0%
4.0%
6.0%
8.0%
10.0%
12.0%
14.0%Grade A Office: Yield Government Bonds: 10 Years
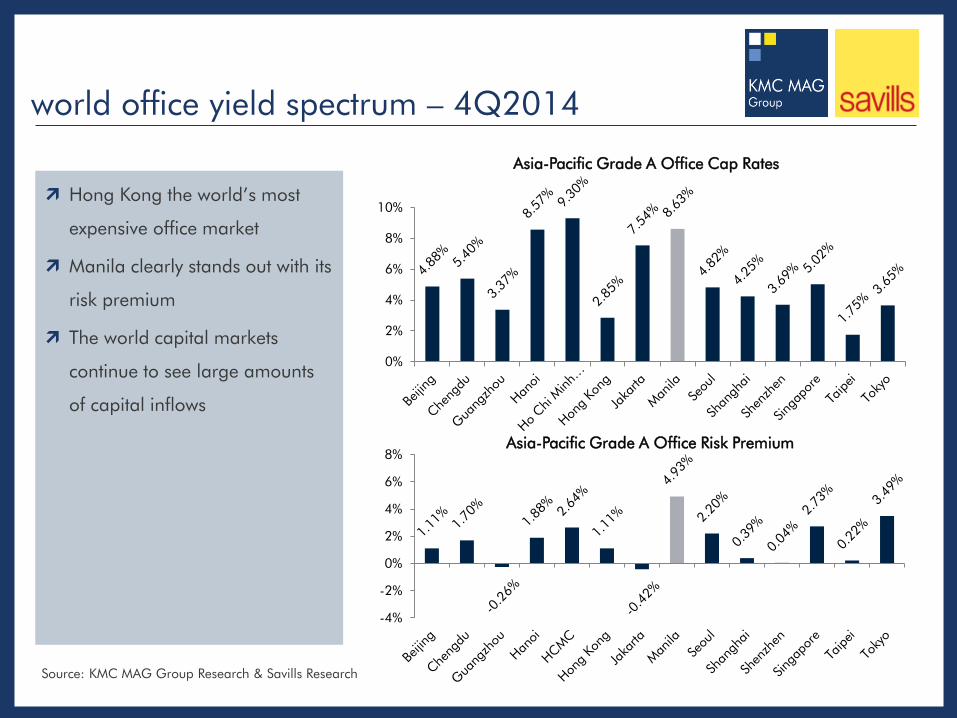
world office yield spectrum – 4Q2014
Hong Kong the world’s most
expensive office market
Manila clearly stands out with its
risk premium
The world capital markets
continue to see large amounts
of capital inflows
0%
2%
4%
6%
8%
10%
Asia-Pacific Grade A Office Cap Rates
-4%
-2%
0%
2%
4%
6%
8%Asia-Pacific Grade A Office Risk Premium
Source: KMC MAG Group Research & Savills Research
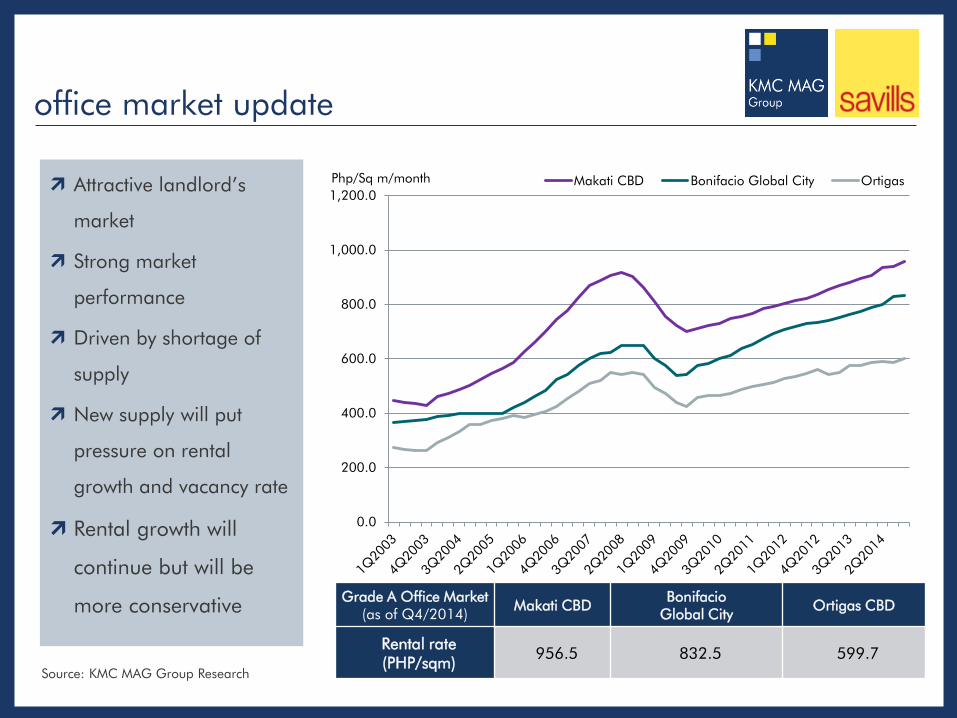
office market update
Attractive landlord’s
market
Strong market
performance
Driven by shortage of
supply
New supply will put
pressure on rental
growth and vacancy rate
Rental growth will
continue but will be
more conservative
Source: KMC MAG Group Research
Grade A Office Market (as of Q4/2014)
Makati CBD Bonifacio
Global City Ortigas CBD
Rental rate (PHP/sqm)
956.5 832.5 599.7 Source: KMC MAG Group Research
0.0
200.0
400.0
600.0
800.0
1,000.0
1,200.0
Php/Sq m/month
Makati CBD Bonifacio Global City Ortigas

trends in flexible work spaces
More and more companies looking towards
flexible work space options
Total capacity of 3 years ago will be built in
this year alone
Demand is expected to remain healthy in the
PH due to high occupancy and lease rates of
CBD buildings
Source: KMC MAG Group Research
Source: KMC MAG Group Research *Recently acquired by Regus
PH Largest Providers
Rank Providers Centres
1 Regus 13
2 KMC Solutions 8
3 Servcorp 2
4 Nomad Offices* 1
5 New Wave Offices 1
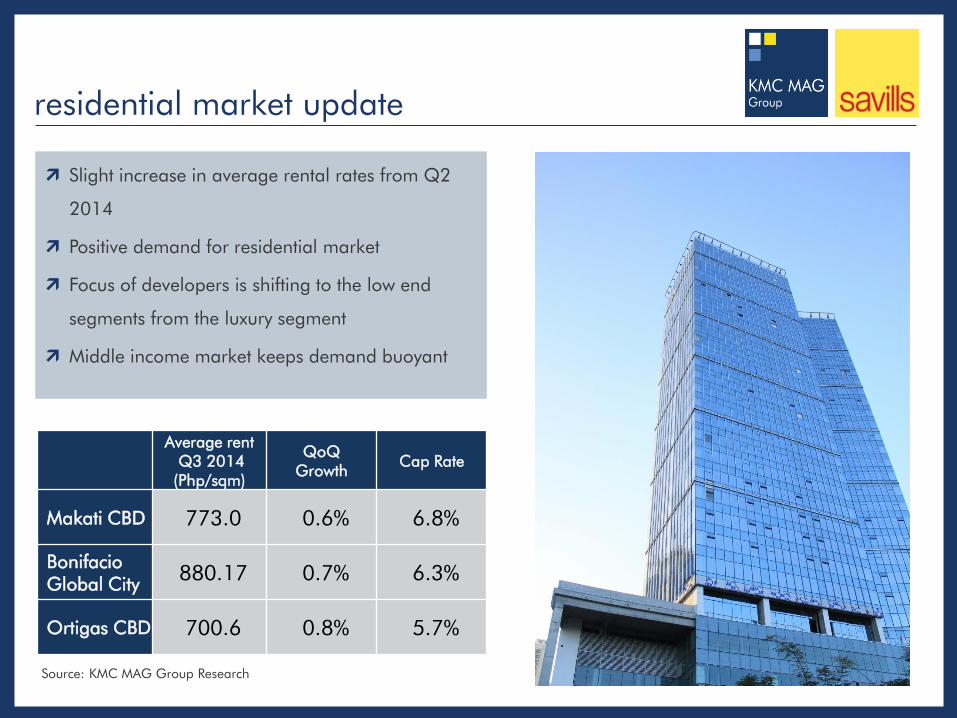
residential market update
Average rent Q3 2014 (Php/sqm)
QoQ Growth
Cap Rate
Makati CBD 773.0 0.6% 6.8%
Bonifacio Global City
880.17 0.7% 6.3%
Ortigas CBD 700.6 0.8% 5.7%
Slight increase in average rental rates from Q2
2014
Positive demand for residential market
Focus of developers is shifting to the low end
segments from the luxury segment
Middle income market keeps demand buoyant
Source: KMC MAG Group Research

residential stock 2013-2017F
BGC will almost double the supply in 5 years
Ayala:
HSS South Block
Avida projects in Uptown
Federal Land
Veritown Fort
Megaworld
Forbestown
Uptown
0
5,000
10,000
15,000
20,000
25,000
30,000
35,000
2013 2014F 2015F 2016F 2017F
Makati CBD Rockwell BGC Ortigas
Source: KMC MAG Group Research

end of office & residential updates
Questions?

property bubble|the central bank’s measures
The high activity has raised
issues of an overheated
property market
The Central Bank introduced
stress tests
Macro prudential measures
Ensure the banking
industry’s healthy exposure
to real estate lending
Good initiative to stabilise
liquidity and restrain
speculation
This will gear up the economy
for the possible normalization
of global interest rates 0.0%
2.0%
4.0%
6.0%
8.0%
10.0%
12.0%
14.0%
0.0
100.0
200.0
300.0
400.0
500.0
600.0
700.0In Billions PHP
Commercial REL Residential REL Bank Average Lending Rate Reverse Repo Rate
Real estate loans and interest rates, 1999-1H/2014
Source: KMC MAG Group Research

upcoming cbd|quezon city
What makes Quezon City the next CBD?
Largest city in Metro Manila
Location of numerous government offices
and headquarters of PNP & AFP
Home of major broadcasting networks
Major educational institutions
Extensive railroad and road network
What areas does QC need to become a full-
fledged CBD?
Infrastructure interconnecting the sub-
districts
Public transport options
Source: KMC MAG Group Research
Average Rental Rate PHP 635.4/sq.m
Vacancy Rate 3.5%
0
100,000
200,000
300,000
400,000
500,000
Quezon City Grade A office stock sqm of GLA

upcoming cbd|bay city
What makes Bay City the next CBD?
Entertainment City
Future tourism hotspot
Multiple business parks being built:
Aseana City
Metropolitan Park (Metrobank Group)
Future City (SM)
What areas does Bay City need to become
a full-fledged CBD?
Proper support infrastructure (roads,
public transport, healthcare, etc.)
Source: KMC MAG Group Research
Average Rental Rate PHP 589.2/sq.m
Vacancy Rate 2.04%
0
100,000
200,000
300,000
400,000
500,000
Bay City Grade A office stock sqm of GLA

decongesting metro manila
Key to decongesting Metro Manila is
fixing the traffic and transport system
Poor infrastructure costs the PH P2.4B/day
All things needed to improve the situation
is ready and waiting for the go signal
The plans are there: JICA Study
The money is there: the Philippines has
the best credit ratings it has ever had
(cheaper debt)
Why is there no go signal?
Main issue is lack of political will
Source: KMC MAG Group Research, JICA, NEDA
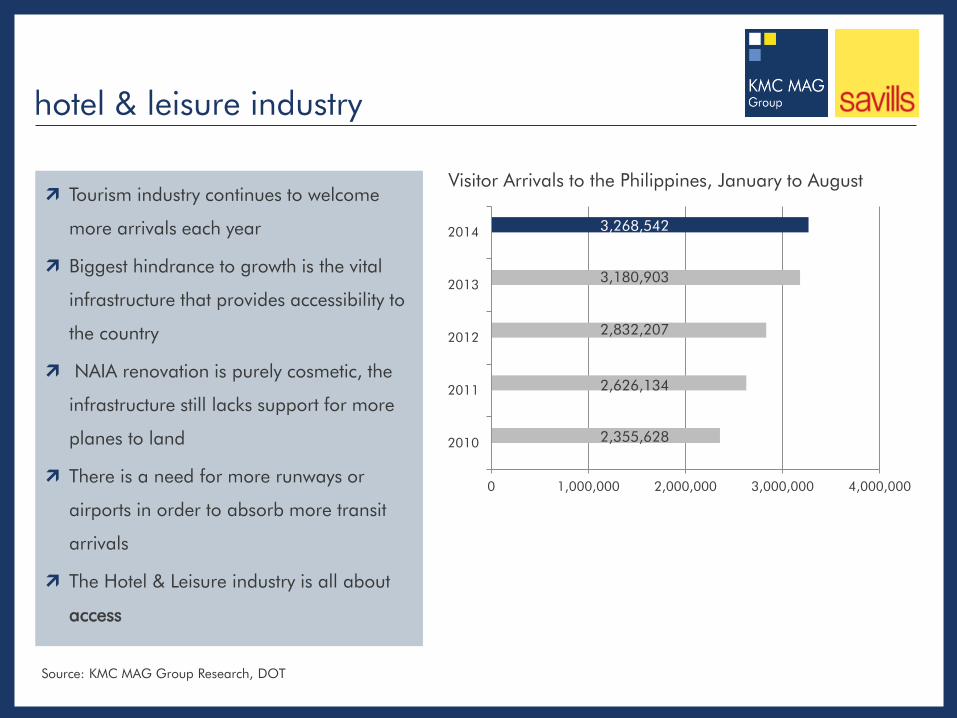
hotel & leisure industry
Tourism industry continues to welcome
more arrivals each year
Biggest hindrance to growth is the vital
infrastructure that provides accessibility to
the country
NAIA renovation is purely cosmetic, the
infrastructure still lacks support for more
planes to land
There is a need for more runways or
airports in order to absorb more transit
arrivals
The Hotel & Leisure industry is all about
access
0 1,000,000 2,000,000 3,000,000 4,000,000
2010
2011
2012
2013
2014
Visitor Arrivals to the Philippines, January to August
2,355,628
2,626,134
2,832,207
3,180,903
3,268,542
Source: KMC MAG Group Research, DOT
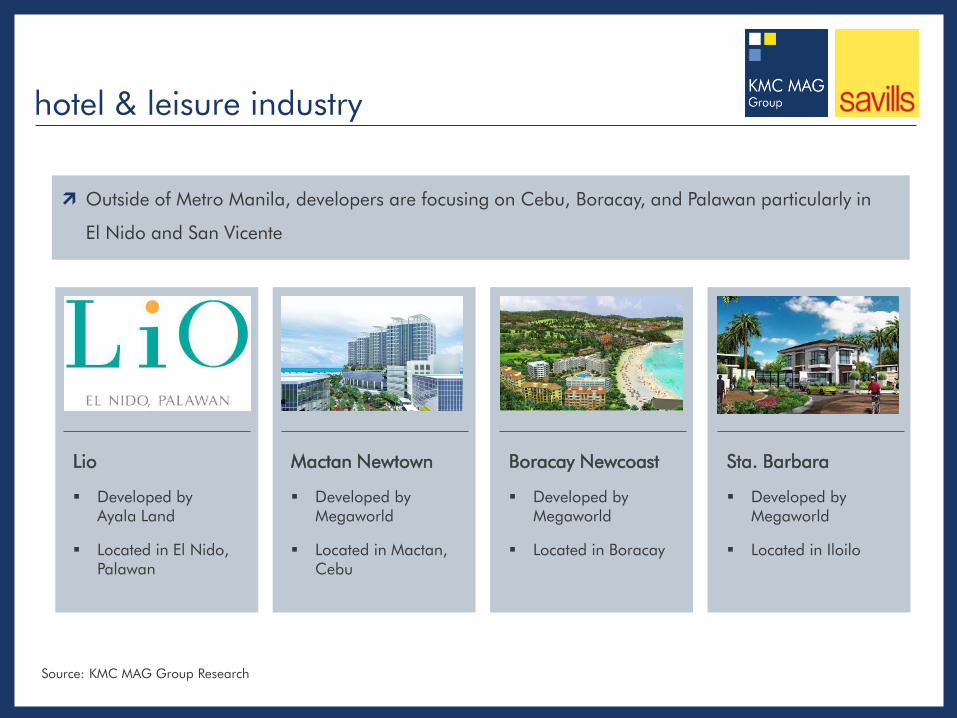
hotel & leisure industry
Outside of Metro Manila, developers are focusing on Cebu, Boracay, and Palawan particularly in
El Nido and San Vicente
Source: KMC MAG Group Research
Lio
Developed by Ayala Land
Located in El Nido, Palawan
Mactan Newtown
Developed by Megaworld
Located in Mactan, Cebu
Boracay Newcoast
Developed by Megaworld
Located in Boracay
Sta. Barbara
Developed by Megaworld
Located in Iloilo

Rents Capital Values
Yields Vacancy Supply
Office
Residential
Retail
property forecast
Source: KMC MAG Group Research
The outlook for the Asia and Pacific region and remains solid
All property sectors will benefit from current economic growth
Risks lie ahead in global monetary policy
Rising Tigers, Sleeping Giant – ASEAN & China
Investor appetite – more opportunistic
Local developers very cash rich and hoarding real estate
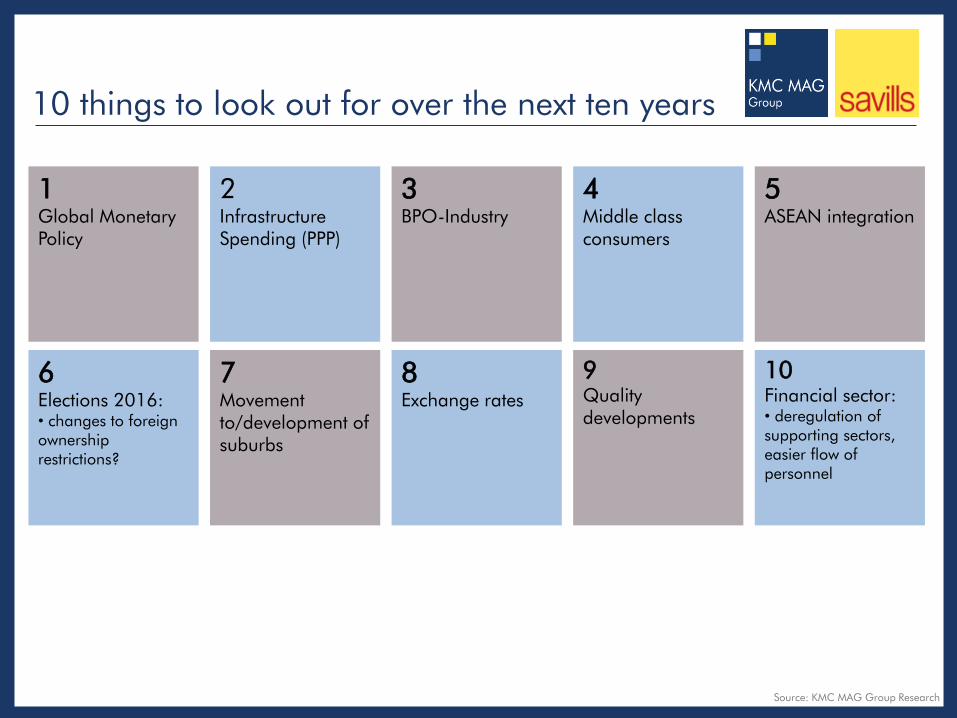
10 things to look out for over the next ten years
1 Global Monetary Policy
2 Infrastructure Spending (PPP)
10 Financial sector: • deregulation of supporting sectors, easier flow of personnel
5 ASEAN integration
4 Middle class consumers
8 Exchange rates
7 Movement to/development of suburbs
6 Elections 2016: • changes to foreign ownership restrictions?
3 BPO-Industry
9 Quality developments
Source: KMC MAG Group Research
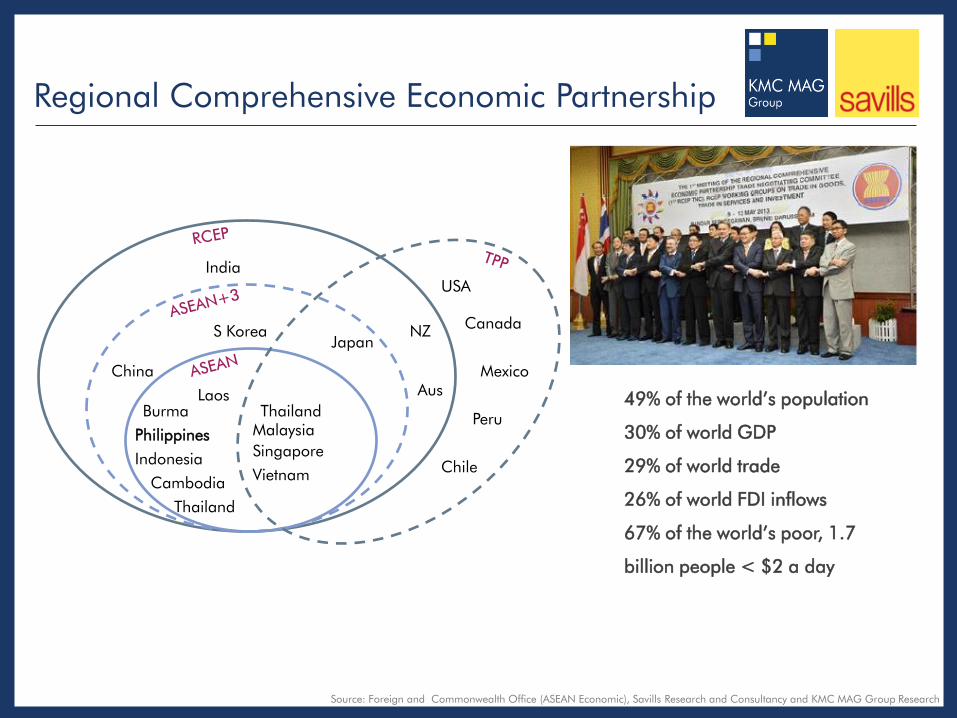
Regional Comprehensive Economic Partnership
India
China
S Korea Japan
NZ
Aus
USA
Canada
Mexico
Peru
Chile
Laos Burma
Philippines
Indonesia
Cambodia
Thailand
Thailand Malaysia
Singapore
Vietnam
49% of the world’s population
30% of world GDP
29% of world trade
26% of world FDI inflows
67% of the world’s poor, 1.7
billion people < $2 a day
Source: Foreign and Commonwealth Office (ASEAN Economic), Savills Research and Consultancy and KMC MAG Group Research

2014 Real Estate Market Update & 2015 Outlook
January 22, 2015
Presented by: