Embed Size (px)
Citation preview

2017 Concordance Study: Linking the Texas STAAR
Scales to the NWEA MAP Growth Scales
November 2017
NWEA Psychometric Services:
Sylvia Li, Research Scientist
Sarah Tran, Sr. Research Associate

© 2017 NWEA. All rights reserved. No part of this document may be modified or further
distributed without written permission from NWEA.
MAP® Growth™ is a registered trademark of NWEA.
Disclaimer: This report is the product of research conducted by NWEA.
2017 Concordance Study: Linking Texas STAAR to NWEA MAP Growth Page i
Table of Contents
1. Introduction ................................................................................................................................. 1
1.1. Purpose of the Study ........................................................................................................ 1
1.2. Assessment Overview ...................................................................................................... 1
1.2.1. State of Texas Assessments of Academic Readiness (STAAR) ........................ 1 1.2.2. MAP Growth ......................................................................................................... 1
2. Data and Analysis ....................................................................................................................... 2
2.1. Data .................................................................................................................................. 2
2.2. Equipercentile Linking Procedure .................................................................................... 3
2.3. Consistency Rate of Classification ................................................................................... 3
2.4. Proficiency Projection ....................................................................................................... 4
3. Estimated MAP Growth Cut Scores Associated with STAAR Readiness Levels ..................... 5
4. Consistency Rate of Classification ........................................................................................... 10
5. Proficiency Projection ............................................................................................................... 11
6. Summary and Discussion ......................................................................................................... 23
7. References ................................................................................................................................ 24
List of Tables
Table 2.1. Demographics of the Study Sample.............................................................................. 2
Table 2.2. Descriptive Statistics of STAAR and MAP Growth Scores from the Study Sample .... 3
Table 2.3. Definition of Consistency Rate for STAAR to MAP Growth Concordance ................... 4
Table 3.1. Concordance of Performance Level Score Ranges between STAAR and MAP
Growth when MAP Growth is taken in Spring—Reading ............................................. 5
Table 3.2. Concordance of Performance Level Score Ranges between STAAR and MAP
Growth when MAP Growth is taken in Spring—Mathematics...................................... 6
Table 3.3. Concordance of Performance Level Score Ranges between STAAR and MAP
Growth when MAP Growth is taken in Spring—Science ............................................. 6
Table 3.4. Concordance of Performance Level Score Ranges between STAAR and MAP
Growth when MAP Growth is taken in Fall or Winter—Reading ................................. 7
Table 3.5. Concordance of Performance Level Score Ranges between STAAR and MAP
Growth when MAP Growth is taken in Fall or Winter—Mathematics .......................... 8
Table 3.6. Concordance of Performance Level Score Ranges between STAAR and MAP
Growth when MAP Growth is taken in Fall or Winter—Science .................................. 9
Table 4.1. Consistency Rate of Classification for MAP Growth and STAAR Level 3
Equipercentile Concordances ..................................................................................... 10
Table 5.1. Proficiency Projection and Probability for Passing STAAR Level 3 when MAP Growth
is taken in the Spring .................................................................................................. 11
Table 5.2. Proficiency Projection and Probability for Passing STAAR Level 3 when MAP Growth
is taken in the Fall or Winter—Reading ...................................................................... 15
Table 5.3. Proficiency Projection and Probability for Passing STAAR Level 3 when MAP Growth
is taken in the Fall or Winter—Mathematics ............................................................... 18
Table 5.4. Proficiency Projection and Probability for Passing STAAR Level 3 when MAP Growth
is taken in the Fall or Winter—Science ...................................................................... 22

2017 Concordance Study: Linking Texas STAAR to NWEA MAP Growth Page 1
1. Introduction
1.1. Purpose of the Study
NWEA™ is committed to providing partners with useful tools to help make inferences from the
MAP® Growth™ interim assessment scores. One important tool is the concordance table
between MAP Growth and state summative assessments. Concordance tables, typically derived
from statistical linking procedures, provide a direct link between scores on different tests that
measure similar but distinct constructs. Aside from describing how a score on one test relates to
performance on another test, these tables can also be used to identify benchmark scores on
one test corresponding to performance categories on another test, or to maintain continuity of
scores on a test after the test is redesigned or changed. Concordance tables are helpful for
educators, parents, administrators, researchers, and policymakers to evaluate and formulate
academic standing and growth.
This document presents the results of a concordance study conducted by NWEA in November
2017 to connect the scales of the State of Texas Assessments of Academic Readiness™
(STAAR™) assessments with those of the MAP Growth assessments. Specifically, this report
presents the following:
• The cut scores on the MAP Growth Reading and Mathematics scales for grades 2–8 and
on the Science scale for grades 5 and 8 that correspond to the benchmarks on the
STAAR Reading, Mathematics, and Science tests
• The consistency rate of classification based on the estimated MAP Growth cut scores
• The probability of receiving a Level 3 (i.e., “meets” grade level) or higher performance
designation on the STAAR assessments based on the observed MAP Growth scores
taken during the same school year
1.2. Assessment Overview
1.2.1. State of Texas Assessments of Academic Readiness (STAAR)
STAAR includes a series of vertically scaled achievement tests aligned to the Texas state
curriculum, the Texas Essential Knowledge and Skills (TEKS), in Mathematics and Reading for
grades 3-8, Writing for grades 4 and 7, Science for grades 5 and 8, Social Science for grade 8,
and end-of-course assessments for English I, English II, Algebra I, Biology, and U.S. History.
STAAR tests can be delivered online and in paper-pencil form. For each grade and content
area, there are three cut scores that distinguish between performance levels—Level 1: Did Not
Meet Grade Level, Level 2: Approaches Grade Level, Level 3: Meets Grade Level, and Level 4:
Masters Grade Level. The Level 3 cut score demarks the minimum level of performance
considered to be “proficient” for accountability purposes.
1.2.2. MAP Growth
MAP Growth tests are adaptive interim assessments aligned to the TEKS standards. They are
constructed to measure student achievement from grades K–12 in Mathematics, Reading,
Language Usage, and Science. MAP Growth scores are reported on a vertical Rasch Unit (RIT)
scale with a range of 100 to 350. Each content area has its own RIT scale. To aid interpretation
of MAP Growth scores, NWEA periodically conducts norming studies of student and school
performance on MAP Growth. For example, the 2015 RIT scale norming study by Thum &
Hauser (2015) employed multi-level growth models on nearly 500,000 longitudinal test scores
from over 100,000 students that were weighted to create large, nationally representative norms.

2017 Concordance Study: Linking Texas STAAR to NWEA MAP Growth Page 2
2. Data and Analysis
2.1. Data
Data used in this study were collected from 351 schools in Texas for students in grades 3–8.
The sample contained 111,980 students for Reading, 112,322 students for Mathematics, and
17,674 students for Science who took both the MAP Growth and STAAR tests in Spring 2017.
Table 2.1 provides the demographics of the study sample. For all content areas, most students
were Hispanic, followed by White, Black, and Asian/Pacific Islander (Asian/PI). Males made up
slightly more of the study sample than females.
To understand the statistical characteristics of the test scores, Table 2.2 provides descriptive
statistics, including the correlation coefficient (r), the mean, standard deviation (SD), minimum,
and maximum. As shown in the table, the correlation coefficients between MAP Growth and
STAAR scores range from 0.73 – 0.80 for Reading, 0.73 – 0.84 for Mathematics, and 0.78 –
0.79 for Science. In general, these correlations indicate a strong relationship between MAP
Growth and STAAR test scores.
Table 2.1. Demographics of the Study Sample
Content
Area
Race/Ethnicity* Gender
Grade N Hispanic White Black Asian/PI AI/AN Other Male Female
Reading
3 21,354 48.6% 21.6% 14.2% 10.1% 3.1% 2.5% 51.4% 48.6%
4 22,182 50.6% 21.0% 14.0% 9.6% 2.5% 2.2% 51.3% 48.7%
5 21,296 48.5% 19.5% 15.0% 10.3% 4.5% 2.1% 50.2% 49.8%
6 20,301 50.3% 16.7% 15.2% 10.9% 4.9% 2.0% 51.4% 48.6%
7 17,464 51.5% 13.3% 16.5% 11.2% 5.5% 2.0% 52.1% 47.9%
8 9,725 61.9% 13.1% 14.8% 5.5% 3.4% 1.4% 53.0% 47.0%
Mathematics
3 21,045 49.1% 21.4% 14.1% 10.0% 3.1% 2.4% 51.4% 48.6%
4 21,951 51.0% 20.8% 14.0% 9.6% 2.5% 2.2% 51.4% 48.6%
5 21,075 48.6% 19.6% 15.0% 10.3% 4.5% 2.1% 50.2% 49.8%
6 19,463 49.3% 18.2% 15.2% 10.6% 4.8% 2.0% 51.4% 48.6%
7 17,149 51.5% 15.1% 15.5% 10.6% 5.4% 1.9% 52.0% 48.0%
8 11,297 63.3% 13.6% 13.7% 4.4% 3.8% 1.1% 54.0% 46.0%
Science 5 13,454 41.9% 20.9% 15.3% 13.0% 6.7% 2.2% 50.2% 49.8%
8 4,220 58.2% 6.6% 15.6% 10.5% 7.4% 1.8% 51.7% 48.3%
*Asian/PI = Asian/Pacific Islander. AI/AN = American Indian/Alaska Native.

2017 Concordance Study: Linking Texas STAAR to NWEA MAP Growth Page 3
Table 2.2. Descriptive Statistics of STAAR and MAP Growth Scores from the Study Sample
Content
Area
STAAR MAP Growth
Grade N r Mean SD Min. Max. Mean SD Min. Max.
Reading
3 21,354 0.78 1478.3 162.9 826 1889 206.0 14.3 135 280
4 22,182 0.83 1568.5 159.2 944 1997 216.0 16.3 140 305
5 21,296 0.84 1634.9 155.9 963 2062 223.6 17.4 144 298
6 20,301 0.80 1629.8 150.0 1068 2137 222.7 18.8 143 304
7 17,464 0.80 1650.7 140.8 1078 2169 225.1 20.6 136 309
8 9,725 0.73 1639.8 121.4 1039 2172 221.1 19.1 136 284
Mathematics
3 21,045 0.77 1438.9 165.4 765 1893 199.0 16.4 138 249
4 21,951 0.80 1512.5 155.4 842 1971 206.0 16.8 129 256
5 21,075 0.77 1559.9 148.8 870 1996 212.0 16.4 141 259
6 19,463 0.77 1571.5 143.9 905 2054 212.0 18.7 142 261
7 17,149 0.76 1625.5 139.0 969 2116 213.9 19.8 138 264
8 11,297 0.73 1633.4 127.1 968 2147 212.6 19.2 139 270
Science 5 13,454 0.78 3857.9 524.7 1174 5566 211.8 13.1 157 255
8 4,220 0.79 3702.6 582.2 2209 6202 211.4 16.0 153 268
2.2. Equipercentile Linking Procedure
The equipercentile procedure (e.g., Kolen & Brennan, 2004) was used to establish the
concordance relationship between STAAR and MAP Growth scores. This procedure matches
scores on the two scales that have the same percentile rank (i.e., the proportion of scores at or
below each score).
Consider the concorded scores between two tests. 𝑥 is a score on Test 𝑋 (e.g., STAAR). Its
equipercentile equivalent score on Test 𝑌 (e.g., MAP Growth), 𝑒𝑦(𝑥), can be obtained through a
cumulative-distribution-based linking function defined in Equation 1:
𝑒𝑦(𝑥) = 𝐺−1[𝑃(𝑥)] (1)
where 𝑒𝑦(𝑥) is the equipercentile equivalent of score on STAAR on the scale of MAP Growth,
𝑃(𝑥) is the percentile rank of a given score on Test 𝑋, and 𝐺−1 is the inverse of the percentile
rank function for Test 𝑌 that indicates the score on Test 𝑌 corresponding to a given percentile.
Polynomial loglinear pre-smoothing was applied to reduce irregularities of the score distributions
and equipercentile linking curve.
2.3. Consistency Rate of Classification
Consistency rate of classification accuracy, expressed in the form of a rate between 0 and 1,
measures the extent to which MAP Growth scores (and the estimated MAP Growth cut scores)
accurately predicted whether students in the sample would pass (i.e., achieve Level 3 or higher)
on STAAR tests.
To calculate consistency rate of classification, sample students were designated “Below STAAR
cut” or “At or Above STAAR cut” based on their actual STAAR scores. Similarly, they were also
designated as “Below MAP Growth cut” or “At or Above MAP Growth cut” based on their actual
MAP Growth scores. A two-way contingency table was then tabulated (see Table 2.3),

2017 Concordance Study: Linking Texas STAAR to NWEA MAP Growth Page 4
classifying students as “proficient” based on the STAAR cut score and concordant MAP Growth
cut score. Students were classified as true positive (TP), true negative (TN), false positive (FP),
or false negative (FN). The overall consistency rate of classification was computed as the
proportion of correct classifications among the entire sample by (TP+TN) / (TP+TN+FP+FN).
• Students classified in the true positive (TP) category were those predicted to be
proficient based on both the MAP Growth cut scores and STAAR cut scores.
• Students classified in the true negative (TN) category were those predicted to be not
proficient based on both the MAP Growth cut scores and STAAR cut scores.
• Students classified in the false positive (FP) category were those predicted to be
proficient based on the MAP Growth cut scores but were classified as not proficient
based on the STAAR cut scores.
• Students classified in the false negative (FN) category were those predicated to be not
proficient based on the MAP Growth cut scores but were classified as proficient based
on the STAAR cut scores.
Table 2.3. Definition of Consistency Rate for STAAR to MAP Growth Concordance
Below STAAR Cut At or Above STAAR Cut
Below MAP Growth Cut True Negative* False Negative
At or Above MAP Growth Cut False Positive True Positive*
*Shaded cells are summed to compute the consistency rate.
2.4. Proficiency Projection
MAP Growth conditional growth norms provide students’ expected score gains across testing
seasons (Thum & Hauser, 2015). This information is used to predict a student’s performance on
STAAR based on that student’s MAP Growth scores from prior seasons (e.g., fall and winter).
The probability of a student achieving Level 3 (“meets” grade level) on STAAR based on his or
her fall or winter MAP Growth score is given in Equation 2:
𝑃𝑟(𝐴𝑐ℎ𝑖𝑒𝑣𝑖𝑛𝑔 𝐿𝑒𝑣𝑒𝑙 3 𝑖𝑛 𝑠𝑝𝑟𝑖𝑛𝑔|𝑎 𝑅𝐼𝑇 𝑠𝑐𝑜𝑟𝑒 𝑜𝑓 𝑥) = Φ ( 𝑥+𝑔−𝑐
𝑆𝐷) (2)
where, Φ is a standardized normal cumulative distribution, 𝑥 is the student’s RIT score in fall or
winter, 𝑔 is the expected growth from fall or winter to spring corresponding to 𝑥, 𝑐 is the MAP
Growth cut score for spring, and 𝑆𝐷 is the conditional standard deviation of growth from fall or
winter to spring.
The probability of a student achieving Level 3 on the STAAR test based on his or her spring
score 𝑠 can be calculated by Equation 3:
𝑃𝑟(𝐴𝑐ℎ𝑖𝑒𝑣𝑖𝑛𝑔 𝐿𝑒𝑣𝑒𝑙 3 𝑖𝑛 𝑠𝑝𝑟𝑖𝑛𝑔|𝑎 𝑅𝐼𝑇 𝑠𝑐𝑜𝑟𝑒 𝑜𝑓 𝑠 𝑖𝑛 𝑠𝑝𝑟𝑖𝑛𝑔) = Φ ( 𝑠−𝑐
𝑆𝐸) (3)
where 𝑆𝐸 is the standard error of measurement for the MAP Growth test.

2017 Concordance Study: Linking Texas STAAR to NWEA MAP Growth Page 5
3. Estimated MAP Growth Cut Scores Associated with STAAR Readiness Levels
Table 3.1 –

2017 Concordance Study: Linking Texas STAAR to NWEA MAP Growth Page 6
Table 3.6 present the STAAR scale scores associated with each performance level, as well as the estimated score range on the MAP Growth tests associated with each performance level. Specifically, Table 3.1 – Table 3.3 apply to MAP Growth scores obtained during the spring testing season for Reading, Mathematics, and Science, respectively. Table 3.4 –
2017 Concordance Study: Linking Texas STAAR to NWEA MAP Growth Page 7
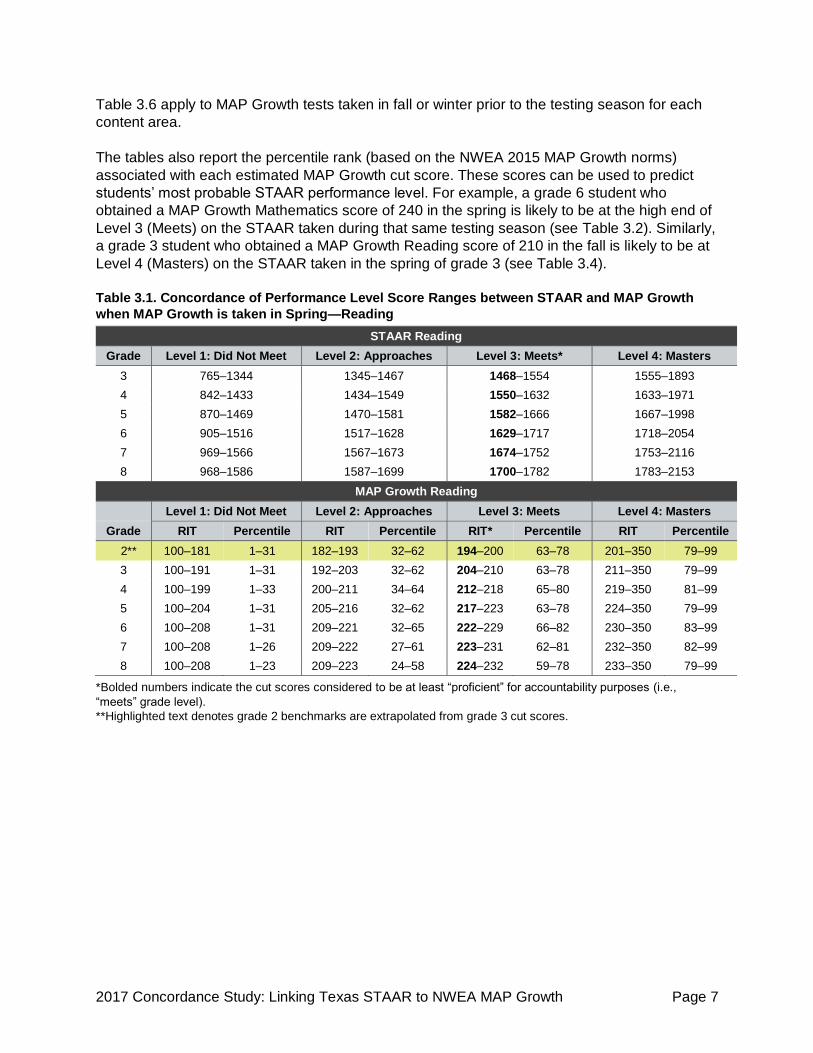
Table 3.6 apply to MAP Growth tests taken in fall or winter prior to the testing season for each
content area.
The tables also report the percentile rank (based on the NWEA 2015 MAP Growth norms)
associated with each estimated MAP Growth cut score. These scores can be used to predict
students’ most probable STAAR performance level. For example, a grade 6 student who
obtained a MAP Growth Mathematics score of 240 in the spring is likely to be at the high end of
Level 3 (Meets) on the STAAR taken during that same testing season (see Table 3.2). Similarly,
a grade 3 student who obtained a MAP Growth Reading score of 210 in the fall is likely to be at
Level 4 (Masters) on the STAAR taken in the spring of grade 3 (see Table 3.4).
Table 3.1. Concordance of Performance Level Score Ranges between STAAR and MAP Growth
when MAP Growth is taken in Spring—Reading
STAAR Reading
Grade Level 1: Did Not Meet Level 2: Approaches Level 3: Meets* Level 4: Masters
3 765–1344 1345–1467 1468–1554 1555–1893
4 842–1433 1434–1549 1550–1632 1633–1971
5 870–1469 1470–1581 1582–1666 1667–1998
6 905–1516 1517–1628 1629–1717 1718–2054
7 969–1566 1567–1673 1674–1752 1753–2116
8 968–1586 1587–1699 1700–1782 1783–2153
MAP Growth Reading
Level 1: Did Not Meet Level 2: Approaches Level 3: Meets Level 4: Masters
Grade RIT Percentile RIT Percentile RIT* Percentile RIT Percentile
2** 100–181 1–31 182–193 32–62 194–200 63–78 201–350 79–99
3 100–191 1–31 192–203 32–62 204–210 63–78 211–350 79–99
4 100–199 1–33 200–211 34–64 212–218 65–80 219–350 81–99
5 100–204 1–31 205–216 32–62 217–223 63–78 224–350 79–99
6 100–208 1–31 209–221 32–65 222–229 66–82 230–350 83–99
7 100–208 1–26 209–222 27–61 223–231 62–81 232–350 82–99
8 100–208 1–23 209–223 24–58 224–232 59–78 233–350 79–99
*Bolded numbers indicate the cut scores considered to be at least “proficient” for accountability purposes (i.e.,
“meets” grade level).
**Highlighted text denotes grade 2 benchmarks are extrapolated from grade 3 cut scores.

2017 Concordance Study: Linking Texas STAAR to NWEA MAP Growth Page 8
Table 3.2. Concordance of Performance Level Score Ranges between STAAR and MAP Growth
when MAP Growth is taken in Spring—Mathematics
STAAR Mathematics
Grade Level 1: Did Not Meet Level 2: Approaches Level 3: Meets* Level 4: Masters
3 826–1359 1360–1485 1468–1595 1596–1889
4 944–1466 1467–1588 1589–1669 1670-1997
5 963–1499 1500–1624 1625–1723 1724-2062
6 1068–1535 1536–1652 1653–1771 1772–2137
7 1078–1574 1575–1687 1688–1797 1798–2169
8 1034–1594 1595–1699 1700–1853 1854–2172
MAP Growth Mathematics
Level 1: Did Not Meet Level 2: Approaches Level 3: Meets Level 4: Masters
Grade RIT Percentile RIT Percentile RIT* Percentile RIT Percentile
2** 100–184 1–28 185–195 29–59 196–204 60–81 205–350 82–99
3 100–196 1–30 197–207 31–61 208–216 62–82 217–350 83–99
4 100–207 1–34 208–219 35–65 220–226 66–80 227–350 81–99
5 100–208 1–21 209–224 22–57 225–234 58–79 235–350 80–99
6 100–212 1–22 213–228 23–57 229–240 58–81 241–350 82–99
7 100–216 1–24 217–233 25–60 234–246 61–84 247–350 85–99
8 100–216 1–22 217–233 23–55 234–249 56–83 250–350 84–99
*Bolded numbers indicate the cut scores considered to be at least “proficient” for accountability purposes (i.e.,
“meets” grade level).
**Highlighted text denotes grade 2 benchmarks are extrapolated from grade 3 cut scores.
Table 3.3. Concordance of Performance Level Score Ranges between STAAR and MAP Growth
when MAP Growth is taken in Spring—Science
STAAR Science
Grade Level 1: Did Not Meet Level 2: Approaches Level 3: Meets* Level 4: Masters
5 1174–3549 3550–3999 4000–4401 4402–5566
8 793–3549 3550–3999 4000–4405 4406–6202
MAP Growth Science
Level 1: Did Not Meet Level 2: Approaches Level 3: Meets Level 4: Masters
Grade RIT Percentile RIT Percentile RIT* Percentile RIT Percentile
5 100–205 1–49 206–216 50–83 217–224 84–95 225–350 96–99
8 100–208 1–34 209–220 35–70 221–229 71–89 230–350 90–99
*Bolded numbers indicate the cut scores considered to be at least “proficient” for accountability purposes (i.e.,
“meets” grade level).

2017 Concordance Study: Linking Texas STAAR to NWEA MAP Growth Page 9
Table 3.4. Concordance of Performance Level Score Ranges between STAAR and MAP Growth
when MAP Growth is taken in Fall or Winter—Reading
STAAR Reading
Grade Level 1: Did Not Meet Level 2: Approaches Level 3: Meets* Level 4: Masters
3 765–1344 1345–1467 1468–1554 1555–1893
4 842–1433 1434–1549 1550–1632 1633–1971
5 870–1469 1470–1581 1582–1666 1667–1998
6 905–1516 1517–1628 1629–1717 1718–2054
7 969–1566 1567–1673 1674–1752 1753–2116
8 968–1586 1587–1699 1700–1782 1783–2153
MAP Growth Reading (Fall)
Level 1: Did Not Meet Level 2: Approaches Level 3: Meets Level 4: Masters
Grade RIT Percentile RIT Percentile RIT* Percentile RIT Percentile
2** 100–166 1–29 167–180 30–64 181–188 65–81 189–350 82–99
3 100–179 1–28 180–194 29–65 195–202 66–81 203–350 82–99
4 100–190 1–31 191–204 32–65 205–212 66–82 213–350 83–99
5 100–197 1–29 198–211 30–64 212–219 65–81 220–350 82–99
6 100–202 1–28 203–217 29–66 218–226 67–85 227–350 86–99
7 100–203 1–23 204–219 24–62 220–229 63–83 230–350 84–99
8 100–203 1–19 204–221 20–60 222–230 61–80 231–350 81–99
MAP Growth Reading (Winter)
Level 1: Did Not Meet Level 2: Approaches Level 3: Meets Level 4: Masters
Grade RIT Percentile RIT Percentile RIT* Percentile RIT Percentile
2** 100–176 1–30 177–189 31–63 190–196 64–79 197–350 80–99
3 100–187 1–29 188–200 30–62 201–208 63–80 209–350 81–99
4 100–196 1–31 197–209 32–65 210–217 66–82 218–350 83–99
5 100–202 1–30 203–214 31–62 215–222 63–80 223–350 81–99
6 100–206 1–29 207–220 30–66 221–228 67–83 229–350 84–99
7 100–206 1–24 207–221 25–62 222–230 63–81 231–350 82–99
8 100–207 1–22 208–222 23–58 223–231 59–79 232–350 80–99
*Bolded numbers indicate the cut scores considered to be at least “proficient” for accountability purposes (i.e.,
“meets” grade level).
**Highlighted text denotes grade 2 benchmarks are extrapolated from grade 3 cut scores.

2017 Concordance Study: Linking Texas STAAR to NWEA MAP Growth Page 10
Table 3.5. Concordance of Performance Level Score Ranges between STAAR and MAP Growth
when MAP Growth is taken in Fall or Winter—Mathematics
STAAR Mathematics
Grade Level 1: Did Not Meet Level 2: Approaches Level 3: Meets* Level 4: Masters
3 826–1359 1360–1485 1486–1595 1596–1889
4 944–1466 1467–1588 1589–1669 1670–1997
5 963–1499 1500–1624 1625–1723 1724–2062
6 1068–1535 1536–1652 1653–1771 1772–2137
7 1078–1574 1575–1687 1688–1797 1798–2169
8 1034–1594 1559–1699 1700–1853 1854–2172
MAP Growth Mathematics (Fall)
Level 1: Did Not Meet Level 2: Approaches Level 3: Meets Level 4: Masters
Grade RIT Percentile RIT Percentile RIT* Percentile RIT Percentile
2** 100–168 1–26 169–180 27–60 181–190 61–84 191–350 85–99
3 100–183 1–29 184–194 30–62 195–204 63–85 205–350 86–99
4 100–195 1–31 196–208 32–68 209–215 69–83 216–350 84–99
5 100–198 1–18 199–214 19–58 215–224 59–81 225–350 82–99
6 100–204 1–19 205–220 20–57 221–233 58–84 234–350 85–99
7 100–210 1–23 211–227 24–61 228–240 62–85 241–350 86–99
8 100–211 1–20 212–228 21–54 229–245 55–85 246–350 86–99
MAP Growth Mathematics (Winter)
Level 1: Did Not Meet Level 2: Approaches Level 3: Meets Level 4: Masters
Grade RIT Percentile RIT Percentile RIT* Percentile RIT Percentile
2** 100–178 1–27 179–189 28–59 190–199 60–84 200–350 85–99
3 100–191 1–30 192–202 31–62 203–211 63–84 212–350 85–99
4 100–202 1–33 203–214 34–65 215–221 66–81 222–350 82–99
5 100–204 1–20 205–220 21–58 221–230 59–80 231–350 81–99
6 100–209 1–21 210–225 22–58 226–237 59–83 238–350 84–99
7 100–214 1–24 215–231 25–62 232–244 63–85 245–350 86–99
8 100–214 1–21 215–231 22–55 232–247 56–84 248–350 85–99
*Bolded numbers indicate the cut scores considered to be at least “proficient” for accountability purposes (i.e.,
“meets” grade level).
**Highlighted text denotes grade 2 benchmarks are extrapolated from grade 3 cut scores.

2017 Concordance Study: Linking Texas STAAR to NWEA MAP Growth Page 11
Table 3.6. Concordance of Performance Level Score Ranges between STAAR and MAP Growth
when MAP Growth is taken in Fall or Winter—Science
STAAR Science
Grade Level 1: Did Not Meet Level 2: Approaches Level 3: Meets* Level4V: Masters
5 1174–3549 3550–3999 4000–4401 4402–5566
8 793–3549 3550–3999 4000–4405 4406–6202
MAP Growth Science (Fall)
Level 1: Did Not Meet Level 2: Approaches Level 3: Meets Level 4: Masters
Grade RIT Percentile RIT Percentile RIT* Percentile RIT Percentile
5 100–199 1–47 200–213 48–88 214–223 89–98 224–350 98–99
8 100–204 1–31 205–218 32–74 219–229 75–94 230–350 95–99
MAP Growth Science (Winter)
Level 1: Did Not Meet Level 2: Approaches Level 3: Meets Level 4: Masters
Grade RIT Percentile RIT Percentile RIT* Percentile RIT Percentile
5 100–203 1–49 204–215 50–86 216–224 87–97 225–350 97–99
8 100–206 1–31 207–219 32–72 220–229 73–92 230–350 93–99
*Bolded numbers indicate the cut scores considered to be at least “proficient” for accountability purposes (i.e.,
“meets” grade level).

2017 Concordance Study: Linking Texas STAAR to NWEA MAP Growth Page 12
4. Consistency Rate of Classification
Consistency rate of classification (Pommerich, Hanson, Harris, & Sconing, 2004), expressed in
the form of a rate between 0 and 1, provides a means to measure the departure from equity for
concordances (Hanson et al., 2001). This index can also be used as an indicator for the
predictive validity of the MAP Growth tests (i.e., how accurately the MAP Growth scores can
predict a students’ proficiency status on the STAAR test).
For each pair of concordant scores, a classification is considered consistent if the student is
classified into the same performance category regardless of the test used for decision-making.
For the “proficient” performance category concordant scores, the consistency rate can be
calculated as the percentage of students who score at or above both concordant scores plus the
percentage of students who score below both concordant scores on each test. Higher
consistency rate indicates stronger congruence between STAAR and MAP Growth cut scores.
The results in Table 4.1 demonstrate that, on average, MAP Growth Reading scores can
consistently classify students’ proficiency (Level 3 or higher) status on the STAAR Reading test
84% of the time; MAP Growth Mathematics scores can consistently classify students on the
STAAR Mathematics test 86% of the time; and MAP Growth Science scores can consistently
classify students on the STAAR Science test 84% of the time. Those numbers are high,
suggesting that MAP Growth Reading, Mathematics, and Science tests are good predictors of
students’ proficiency status on the STAAR tests.
Table 4.1. Consistency Rate of Classification for MAP Growth and STAAR Level 3 Equipercentile
Concordances
Reading Mathematics Science
Consistency
Rate
False* Consistency
Rate
False* Consistency
Rate
False*
Grade Pos. Neg. Pos. Neg. Pos. Neg.
3 0.83 0.08 0.09 0.83 0.09 0.08 -- -- --
4 0.84 0.07 0.09 0.86 0.07 0.07 -- -- --
5 0.82 0.07 0.11 0.86 0.07 0.07 0.82 0.07 0.11
6 0.85 0.07 0.08 0.88 0.07 0.05 -- -- --
7 0.84 0.08 0.08 0.88 0.06 0.06 -- -- --
8 0.83 0.07 0.10 0.83 0.08 0.09 0.86 0.06 0.08
*Pos. = Positives. Neg. = Negatives.

2017 Concordance Study: Linking Texas STAAR to NWEA MAP Growth Page 13
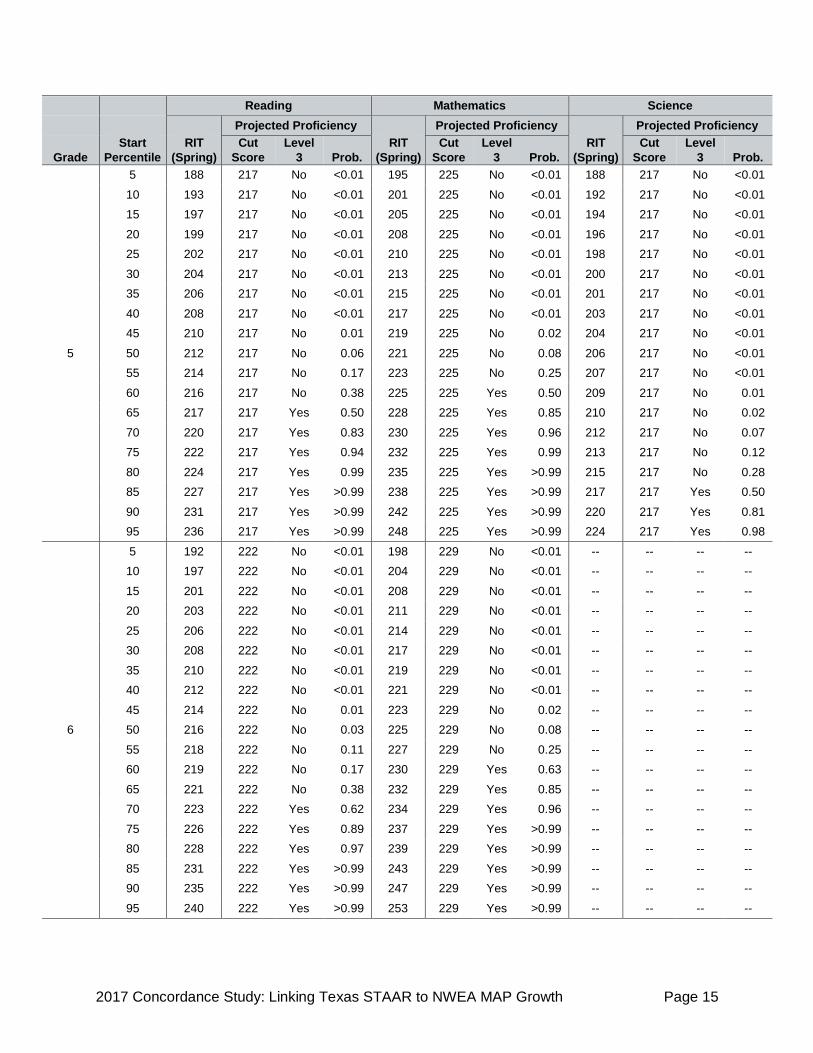
5. Proficiency Projection
Proficiency projection tells how likely a student is classified as “proficient” on STAAR tests
based on his or her observed MAP Growth scores. The conditional growth norms provided in
the 2015 MAP Growth norms report were used to calculate this information (Thum & Hauser,
2015). The results of proficiency projection and corresponding probability of achieving
“proficient” on the STAAR tests are presented in Table 5.1 – Table 5.4. These tables estimate
the probability of scoring at Level 3 or above on STAAR in the spring and the prior fall or winter
testing season. For example, if a grade 3 student obtained a MAP Growth Mathematics score of
201 in the fall, the probability of obtaining a Level 3 or higher STAAR score in the spring of
grade 3 is 78%. Table 5.1 presents the estimated probability of meeting Level 3 benchmark
when MAP Growth is taken in the spring, whereas Table 5.2 – Table 5.4 present the estimated
probability of meeting Level 3 benchmark when MAP Growth is taken in the fall or winter prior to
taking the STAAR tests.
Table 5.1. Proficiency Projection and Probability for Passing STAAR Level 3 when MAP Growth is
taken in the Spring
Reading Mathematics Science
Projected Proficiency Projected Proficiency Projected Proficiency
Grade
Start
Percentile
RIT
(Spring)
Cut
Score
Level
3 Prob.
RIT
(Spring)
Cut
Score
Level
3 Prob.
RIT
(Spring)
Cut
Score
Level
3 Prob.
2
5 164 194 No <0.01 170 196 No <0.01 -- -- -- --
10 169 194 No <0.01 175 196 No <0.01 -- -- -- --
15 173 194 No <0.01 178 196 No <0.01 -- -- -- --
20 176 194 No <0.01 181 196 No <0.01 -- -- -- --
25 178 194 No <0.01 183 196 No <0.01 -- -- -- --
30 181 194 No <0.01 185 196 No <0.01 -- -- -- --
35 183 194 No <0.01 187 196 No <0.01 -- -- -- --
40 185 194 No <0.01 189 196 No 0.01 -- -- -- --
45 187 194 No 0.01 190 196 No 0.02 -- -- -- --
50 189 194 No 0.06 192 196 No 0.08 -- -- -- --
55 191 194 No 0.17 194 196 No 0.25 -- -- -- --
60 193 194 No 0.38 196 196 Yes 0.50 -- -- -- --
65 195 194 Yes 0.62 197 196 Yes 0.63 -- -- -- --
70 197 194 Yes 0.83 199 196 Yes 0.85 -- -- -- --
75 199 194 Yes 0.94 201 196 Yes 0.96 -- -- -- --
80 201 194 Yes 0.99 204 196 Yes >0.99 -- -- -- --
85 204 194 Yes >0.99 206 196 Yes >0.99 -- -- -- --
90 208 194 Yes >0.99 209 196 Yes >0.99 -- -- -- --
95 214 194 Yes >0.99 214 196 Yes >0.99 -- -- -- --

2017 Concordance Study: Linking Texas STAAR to NWEA MAP Growth Page 14
Reading Mathematics Science
Projected Proficiency Projected Proficiency Projected Proficiency
Grade
Start
Percentile
RIT
(Spring)
Cut
Score
Level
3 Prob.
RIT
(Spring)
Cut
Score
Level
3 Prob.
RIT
(Spring)
Cut
Score
Level
3 Prob.
3
5 174 204 No <0.01 181 208 No <0.01 -- -- -- --
10 179 204 No <0.01 186 208 No <0.01 -- -- -- --
15 183 204 No <0.01 189 208 No <0.01 -- -- -- --
20 186 204 No <0.01 192 208 No <0.01 -- -- -- --
25 188 204 No <0.01 194 208 No <0.01 -- -- -- --
30 191 204 No <0.01 196 208 No <0.01 -- -- -- --
35 193 204 No <0.01 198 208 No <0.01 -- -- -- --
40 195 204 No <0.01 200 208 No <0.01 -- -- -- --
45 197 204 No 0.01 202 208 No 0.02 -- -- -- --
50 199 204 No 0.06 203 208 No 0.04 -- -- -- --
55 201 204 No 0.17 205 208 No 0.15 -- -- -- --
60 202 204 No 0.27 207 208 No 0.37 -- -- -- --
65 204 204 Yes 0.50 209 208 Yes 0.63 -- -- -- --
70 207 204 Yes 0.83 211 208 Yes 0.85 -- -- -- --
75 209 204 Yes 0.94 213 208 Yes 0.96 -- -- -- --
80 211 204 Yes 0.99 215 208 Yes 0.99 -- -- -- --
85 214 204 Yes >0.99 218 208 Yes >0.99 -- -- -- --
90 218 204 Yes >0.99 221 208 Yes >0.99 -- -- -- --
95 223 204 Yes >0.99 226 208 Yes >0.99 -- -- -- --
4
5 181 212 No <0.01 189 220 No <0.01 -- -- -- --
10 187 212 No <0.01 194 220 No <0.01 -- -- -- --
15 190 212 No <0.01 198 220 No <0.01 -- -- -- --
20 193 212 No <0.01 201 220 No <0.01 -- -- -- --
25 196 212 No <0.01 203 220 No <0.01 -- -- -- --
30 198 212 No <0.01 206 220 No <0.01 -- -- -- --
35 200 212 No <0.01 208 220 No <0.01 -- -- -- --
40 202 212 No <0.01 210 220 No <0.01 -- -- -- --
45 204 212 No 0.01 212 220 No <0.01 -- -- -- --
50 206 212 No 0.03 213 220 No 0.01 -- -- -- --
55 208 212 No 0.11 215 220 No 0.04 -- -- -- --
60 210 212 No 0.27 217 220 No 0.15 -- -- -- --
65 212 212 Yes 0.50 219 220 No 0.37 -- -- -- --
70 214 212 Yes 0.73 221 220 Yes 0.63 -- -- -- --
75 216 212 Yes 0.89 224 220 Yes 0.92 -- -- -- --
80 218 212 Yes 0.97 226 220 Yes 0.98 -- -- -- --
85 221 212 Yes >0.99 229 220 Yes >0.99 -- -- -- --
90 225 212 Yes >0.99 233 220 Yes >0.99 -- -- -- --
95 230 212 Yes >0.99 238 220 Yes >0.99 -- -- -- --
2017 Concordance Study: Linking Texas STAAR to NWEA MAP Growth Page 15
Reading Mathematics Science
Projected Proficiency Projected Proficiency Projected Proficiency
Grade
Start
Percentile
RIT
(Spring)
Cut
Score
Level
3 Prob.
RIT
(Spring)
Cut
Score
Level
3 Prob.
RIT
(Spring)
Cut
Score
Level
3 Prob.
5
5 188 217 No <0.01 195 225 No <0.01 188 217 No <0.01
10 193 217 No <0.01 201 225 No <0.01 192 217 No <0.01
15 197 217 No <0.01 205 225 No <0.01 194 217 No <0.01
20 199 217 No <0.01 208 225 No <0.01 196 217 No <0.01
25 202 217 No <0.01 210 225 No <0.01 198 217 No <0.01
30 204 217 No <0.01 213 225 No <0.01 200 217 No <0.01
35 206 217 No <0.01 215 225 No <0.01 201 217 No <0.01
40 208 217 No <0.01 217 225 No <0.01 203 217 No <0.01
45 210 217 No 0.01 219 225 No 0.02 204 217 No <0.01
50 212 217 No 0.06 221 225 No 0.08 206 217 No <0.01
55 214 217 No 0.17 223 225 No 0.25 207 217 No <0.01
60 216 217 No 0.38 225 225 Yes 0.50 209 217 No 0.01
65 217 217 Yes 0.50 228 225 Yes 0.85 210 217 No 0.02
70 220 217 Yes 0.83 230 225 Yes 0.96 212 217 No 0.07
75 222 217 Yes 0.94 232 225 Yes 0.99 213 217 No 0.12
80 224 217 Yes 0.99 235 225 Yes >0.99 215 217 No 0.28
85 227 217 Yes >0.99 238 225 Yes >0.99 217 217 Yes 0.50
90 231 217 Yes >0.99 242 225 Yes >0.99 220 217 Yes 0.81
95 236 217 Yes >0.99 248 225 Yes >0.99 224 217 Yes 0.98
6
5 192 222 No <0.01 198 229 No <0.01 -- -- -- --
10 197 222 No <0.01 204 229 No <0.01 -- -- -- --
15 201 222 No <0.01 208 229 No <0.01 -- -- -- --
20 203 222 No <0.01 211 229 No <0.01 -- -- -- --
25 206 222 No <0.01 214 229 No <0.01 -- -- -- --
30 208 222 No <0.01 217 229 No <0.01 -- -- -- --
35 210 222 No <0.01 219 229 No <0.01 -- -- -- --
40 212 222 No <0.01 221 229 No <0.01 -- -- -- --
45 214 222 No 0.01 223 229 No 0.02 -- -- -- --
50 216 222 No 0.03 225 229 No 0.08 -- -- -- --
55 218 222 No 0.11 227 229 No 0.25 -- -- -- --
60 219 222 No 0.17 230 229 Yes 0.63 -- -- -- --
65 221 222 No 0.38 232 229 Yes 0.85 -- -- -- --
70 223 222 Yes 0.62 234 229 Yes 0.96 -- -- -- --
75 226 222 Yes 0.89 237 229 Yes >0.99 -- -- -- --
80 228 222 Yes 0.97 239 229 Yes >0.99 -- -- -- --
85 231 222 Yes >0.99 243 229 Yes >0.99 -- -- -- --
90 235 222 Yes >0.99 247 229 Yes >0.99 -- -- -- --
95 240 222 Yes >0.99 253 229 Yes >0.99 -- -- -- --

2017 Concordance Study: Linking Texas STAAR to NWEA MAP Growth Page 16
Reading Mathematics Science
Projected Proficiency Projected Proficiency Projected Proficiency
Grade
Start
Percentile
RIT
(Spring)
Cut
Score
Level
3 Prob.
RIT
(Spring)
Cut
Score
Level
3 Prob.
RIT
(Spring)
Cut
Score
Level
3 Prob.
7
5 193 223 No <0.01 199 234 No <0.01 -- -- -- --
10 199 223 No <0.01 206 234 No <0.01 -- -- -- --
15 202 223 No <0.01 210 234 No <0.01 -- -- -- --
20 205 223 No <0.01 214 234 No <0.01 -- -- -- --
25 208 223 No <0.01 217 234 No <0.01 -- -- -- --
30 210 223 No <0.01 219 234 No <0.01 -- -- -- --
35 212 223 No <0.01 222 234 No <0.01 -- -- -- --
40 214 223 No <0.01 224 234 No <0.01 -- -- -- --
45 216 223 No 0.01 226 234 No <0.01 -- -- -- --
50 218 223 No 0.06 229 234 No 0.04 -- -- -- --
55 220 223 No 0.17 231 234 No 0.15 -- -- -- --
60 222 223 No 0.38 233 234 No 0.37 -- -- -- --
65 224 223 Yes 0.62 235 234 Yes 0.63 -- -- -- --
70 226 223 Yes 0.83 238 234 Yes 0.92 -- -- -- --
75 228 223 Yes 0.94 241 234 Yes 0.99 -- -- -- --
80 231 223 Yes 0.99 244 234 Yes >0.99 -- -- -- --
85 234 223 Yes >0.99 247 234 Yes >0.99 -- -- -- --
90 238 223 Yes >0.99 251 234 Yes >0.99 -- -- -- --
95 243 223 Yes >0.99 258 234 Yes >0.99 -- -- -- --
8
5 194 224 No <0.01 199 234 No <0.01 193 221 No <0.01
10 200 224 No <0.01 206 234 No <0.01 197 221 No <0.01
15 204 224 No <0.01 211 234 No <0.01 200 221 No <0.01
20 207 224 No <0.01 215 234 No <0.01 203 221 No <0.01
25 209 224 No <0.01 218 234 No <0.01 205 221 No <0.01
30 212 224 No <0.01 221 234 No <0.01 207 221 No <0.01
35 214 224 No <0.01 224 234 No <0.01 209 221 No <0.01
40 216 224 No 0.01 226 234 No <0.01 210 221 No <0.01
45 218 224 No 0.03 229 234 No 0.04 212 221 No <0.01
50 220 224 No 0.11 231 234 No 0.15 214 221 No 0.02
55 222 224 No 0.27 233 234 No 0.37 215 221 No 0.04
60 224 224 Yes 0.50 236 234 Yes 0.75 217 221 No 0.12
65 226 224 Yes 0.73 238 234 Yes 0.92 218 221 No 0.19
70 228 224 Yes 0.89 241 234 Yes 0.99 220 221 No 0.38
75 231 224 Yes 0.99 244 234 Yes >0.99 222 221 Yes 0.62
80 233 224 Yes >0.99 247 234 Yes >0.99 224 221 Yes 0.81
85 236 224 Yes >0.99 251 234 Yes >0.99 227 221 Yes 0.96
90 240 224 Yes >0.99 255 234 Yes >0.99 230 221 Yes >0.99
95 246 224 Yes >0.99 262 234 Yes >0.99 234 221 Yes >0.99

2017 Concordance Study: Linking Texas STAAR to NWEA MAP Growth Page 17
Table 5.2. Proficiency Projection and Probability for Passing STAAR Level 3 when MAP Growth is
taken in the Fall or Winter—Reading
Reading (Fall) Reading (Winter)
Start
Percentile
Projected Proficiency Projected Proficiency
Grade RIT (Fall) Cut Score Level 3 Prob. RIT (Winter) Cut Score Level 3 Prob.
2
5 149 194 No <0.01 160 194 No <0.01
10 155 194 No <0.01 165 194 No <0.01
15 159 194 No 0.01 169 194 No <0.01
20 162 194 No 0.02 172 194 No <0.01
25 164 194 No 0.04 174 194 No <0.01
30 167 194 No 0.06 176 194 No 0.01
35 169 194 No 0.10 178 194 No 0.02
40 171 194 No 0.15 180 194 No 0.05
45 173 194 No 0.19 182 194 No 0.10
50 175 194 No 0.26 184 194 No 0.18
55 177 194 No 0.35 186 194 No 0.23
60 179 194 No 0.40 188 194 No 0.36
65 181 194 Yes 0.50 190 194 Yes 0.50
70 183 194 Yes 0.60 192 194 Yes 0.64
75 185 194 Yes 0.65 194 194 Yes 0.77
80 188 194 Yes 0.78 197 194 Yes 0.90
85 191 194 Yes 0.85 200 194 Yes 0.97
90 195 194 Yes 0.94 203 194 Yes 0.99
95 200 194 Yes 0.98 209 194 Yes >0.99
3
5 162 204 No <0.01 171 204 No <0.01
10 168 204 No <0.01 176 204 No <0.01
15 172 204 No <0.01 180 204 No <0.01
20 175 204 No 0.01 183 204 No <0.01
25 178 204 No 0.03 185 204 No <0.01
30 180 204 No 0.05 188 204 No 0.01
35 182 204 No 0.06 190 204 No 0.02
40 184 204 No 0.10 192 204 No 0.04
45 186 204 No 0.16 194 204 No 0.09
50 188 204 No 0.20 196 204 No 0.17
55 190 204 No 0.29 198 204 No 0.28
60 192 204 No 0.39 199 204 No 0.35
65 194 204 No 0.44 201 204 Yes 0.50
70 197 204 Yes 0.61 204 204 Yes 0.72
75 199 204 Yes 0.71 206 204 Yes 0.78
80 202 204 Yes 0.80 208 204 Yes 0.87
85 205 204 Yes 0.90 211 204 Yes 0.96
90 209 204 Yes 0.95 215 204 Yes 0.99
95 214 204 Yes 0.99 221 204 Yes >0.99

2017 Concordance Study: Linking Texas STAAR to NWEA MAP Growth Page 18
Reading (Fall) Reading (Winter)
Start
Percentile
Projected Proficiency Projected Proficiency
Grade RIT (Fall) Cut Score Level 3 Prob. RIT (Winter) Cut Score Level 3 Prob.
4
5 173 212 No <0.01 179 212 No <0.01
10 178 212 No <0.01 184 212 No <0.01
15 182 212 No <0.01 188 212 No <0.01
20 185 212 No 0.01 191 212 No <0.01
25 188 212 No 0.01 194 212 No <0.01
30 190 212 No 0.03 196 212 No 0.01
35 192 212 No 0.05 198 212 No 0.02
40 194 212 No 0.07 200 212 No 0.04
45 196 212 No 0.12 202 212 No 0.06
50 198 212 No 0.18 204 212 No 0.12
55 200 212 No 0.23 205 212 No 0.16
60 202 212 No 0.33 207 212 No 0.28
65 204 212 No 0.44 209 212 No 0.42
70 206 212 Yes 0.56 211 212 Yes 0.58
75 209 212 Yes 0.67 214 212 Yes 0.78
80 211 212 Yes 0.77 216 212 Yes 0.88
85 214 212 Yes 0.85 219 212 Yes 0.94
90 218 212 Yes 0.95 223 212 Yes 0.99
95 224 212 Yes 0.99 228 212 Yes >0.99
5
5 181 217 No <0.01 186 217 No <0.01
10 186 217 No <0.01 191 217 No <0.01
15 190 217 No <0.01 195 217 No <0.01
20 193 217 No 0.01 197 217 No <0.01
25 195 217 No 0.02 200 217 No <0.01
30 198 217 No 0.04 202 217 No 0.01
35 200 217 No 0.07 204 217 No 0.02
40 202 217 No 0.12 206 217 No 0.04
45 204 217 No 0.15 208 217 No 0.09
50 206 217 No 0.23 210 217 No 0.17
55 208 217 No 0.33 212 217 No 0.28
60 210 217 No 0.44 214 217 No 0.42
65 212 217 Yes 0.50 215 217 Yes 0.50
70 214 217 Yes 0.62 218 217 Yes 0.72
75 216 217 Yes 0.72 220 217 Yes 0.78
80 218 217 Yes 0.77 222 217 Yes 0.88
85 221 217 Yes 0.88 225 217 Yes 0.96
90 225 217 Yes 0.95 229 217 Yes 0.99
95 231 217 Yes 0.99 234 217 Yes >0.99

2017 Concordance Study: Linking Texas STAAR to NWEA MAP Growth Page 19
Reading (Fall) Reading (Winter)
Start
Percentile
Projected Proficiency Projected Proficiency
Grade RIT (Fall) Cut Score Level 3 Prob. RIT (Winter) Cut Score Level 3 Prob.
6
5 186 222 No <0.01 190 222 No <0.01
10 192 222 No <0.01 196 222 No <0.01
15 196 222 No <0.01 199 222 No <0.01
20 198 222 No <0.01 202 222 No <0.01
25 201 222 No 0.01 204 222 No <0.01
30 203 222 No 0.03 207 222 No 0.01
35 205 222 No 0.06 209 222 No 0.02
40 207 222 No 0.07 211 222 No 0.04
45 209 222 No 0.12 212 222 No 0.06
50 211 222 No 0.19 214 222 No 0.12
55 213 222 No 0.28 216 222 No 0.17
60 215 222 No 0.33 218 222 No 0.28
65 217 222 No 0.44 220 222 No 0.42
70 219 222 Yes 0.56 222 222 Yes 0.58
75 221 222 Yes 0.61 224 222 Yes 0.72
80 224 222 Yes 0.77 226 222 Yes 0.83
85 226 222 Yes 0.84 229 222 Yes 0.94
90 230 222 Yes 0.93 233 222 Yes 0.99
95 236 222 Yes 0.99 238 222 Yes >0.99
7
5 189 223 No <0.01 192 223 No <0.01
10 195 223 No <0.01 198 223 No <0.01
15 199 223 No <0.01 201 223 No <0.01
20 202 223 No 0.01 204 223 No <0.01
25 204 223 No 0.02 207 223 No <0.01
30 206 223 No 0.04 209 223 No 0.01
35 209 223 No 0.07 211 223 No 0.03
40 211 223 No 0.12 213 223 No 0.04
45 213 223 No 0.19 215 223 No 0.09
50 214 223 No 0.23 217 223 No 0.17
55 216 223 No 0.28 219 223 No 0.28
60 218 223 No 0.39 221 223 No 0.42
65 220 223 Yes 0.50 223 223 Yes 0.58
70 222 223 Yes 0.61 225 223 Yes 0.72
75 225 223 Yes 0.72 227 223 Yes 0.83
80 227 223 Yes 0.81 230 223 Yes 0.94
85 230 223 Yes 0.90 232 223 Yes 0.96
90 234 223 Yes 0.96 236 223 Yes 0.99
95 240 223 Yes >0.99 242 223 Yes >0.99

2017 Concordance Study: Linking Texas STAAR to NWEA MAP Growth Page 20
Reading (Fall) Reading (Winter)
Start
Percentile
Projected Proficiency Projected Proficiency
Grade RIT (Fall) Cut Score Level 3 Prob. RIT (Winter) Cut Score Level 3 Prob.
8
5 191 224 No <0.01 194 224 No <0.01
10 197 224 No <0.01 199 224 No <0.01
15 201 224 No 0.01 203 224 No <0.01
20 204 224 No 0.03 206 224 No <0.01
25 207 224 No 0.05 209 224 No 0.01
30 209 224 No 0.08 211 224 No 0.01
35 211 224 No 0.13 213 224 No 0.03
40 213 224 No 0.16 215 224 No 0.07
45 215 224 No 0.22 217 224 No 0.14
50 217 224 No 0.31 219 224 No 0.23
55 219 224 No 0.40 221 224 No 0.36
60 221 224 No 0.45 223 224 Yes 0.50
65 223 224 Yes 0.55 225 224 Yes 0.64
70 225 224 Yes 0.65 227 224 Yes 0.77
75 228 224 Yes 0.74 229 224 Yes 0.86
80 230 224 Yes 0.81 232 224 Yes 0.93
85 234 224 Yes 0.92 235 224 Yes 0.98
90 237 224 Yes 0.95 239 224 Yes >0.99
95 243 224 Yes 0.99 244 224 Yes >0.99
Table 5.3. Proficiency Projection and Probability for Passing STAAR Level 3 when MAP Growth is
taken in the Fall or Winter—Mathematics
Mathematics (Fall) Mathematics (Winter)
Start
Percentile
Projected Proficiency Projected Proficiency
Grade RIT (Fall) Cut Score Level 3 Prob. RIT (Winter) Cut Score Level 3 Prob.
2
5 155 196 No <0.01 165 196 No <0.01
10 160 196 No <0.01 170 196 No <0.01
15 163 196 No 0.01 173 196 No <0.01
20 166 196 No 0.03 175 196 No <0.01
25 168 196 No 0.04 178 196 No 0.01
30 170 196 No 0.07 180 196 No 0.02
35 172 196 No 0.12 181 196 No 0.03
40 174 196 No 0.19 183 196 No 0.08
45 175 196 No 0.19 185 196 No 0.15
50 177 196 No 0.28 186 196 No 0.21
55 179 196 No 0.39 188 196 No 0.34
60 180 196 No 0.44 190 196 Yes 0.50
65 182 196 Yes 0.56 191 196 Yes 0.58
70 184 196 Yes 0.61 193 196 Yes 0.66
75 186 196 Yes 0.72 195 196 Yes 0.79
80 188 196 Yes 0.81 197 196 Yes 0.89
85 191 196 Yes 0.90 200 196 Yes 0.97
90 194 196 Yes 0.94 203 196 Yes 0.99
95 199 196 Yes 0.99 208 196 Yes >0.99

2017 Concordance Study: Linking Texas STAAR to NWEA MAP Growth Page 21
Mathematics (Fall) Mathematics (Winter)
Start
Percentile
Projected Proficiency Projected Proficiency
Grade RIT (Fall) Cut Score Level 3 Prob. RIT (Winter) Cut Score Level 3 Prob.
3
5 169 208 No <0.01 176 208 No <0.01
10 174 208 No <0.01 181 208 No <0.01
15 177 208 No <0.01 184 208 No <0.01
20 179 208 No 0.01 187 208 No <0.01
25 182 208 No 0.03 189 208 No <0.01
30 184 208 No 0.04 191 208 No 0.01
35 185 208 No 0.06 193 208 No 0.02
40 187 208 No 0.11 195 208 No 0.05
45 189 208 No 0.17 197 208 No 0.10
50 190 208 No 0.22 198 208 No 0.14
55 192 208 No 0.32 200 208 No 0.26
60 194 208 No 0.44 202 208 No 0.42
65 195 208 Yes 0.50 203 208 Yes 0.50
70 197 208 Yes 0.62 205 208 Yes 0.66
75 199 208 Yes 0.68 207 208 Yes 0.80
80 201 208 Yes 0.78 209 208 Yes 0.90
85 204 208 Yes 0.89 212 208 Yes 0.97
90 207 208 Yes 0.96 215 208 Yes 0.99
95 212 208 Yes 0.99 220 208 Yes >0.99
4
5 179 220 No <0.01 185 220 No <0.01
10 184 220 No <0.01 190 220 No <0.01
15 188 220 No <0.01 194 220 No <0.01
20 190 220 No <0.01 197 220 No <0.01
25 193 220 No 0.01 199 220 No <0.01
30 195 220 No 0.02 201 220 No <0.01
35 197 220 No 0.04 203 220 No 0.01
40 198 220 No 0.06 205 220 No 0.02
45 200 220 No 0.11 207 220 No 0.05
50 202 220 No 0.17 209 220 No 0.10
55 204 220 No 0.27 211 220 No 0.20
60 205 220 No 0.27 212 220 No 0.26
65 207 220 No 0.38 214 220 No 0.42
70 209 220 Yes 0.50 216 220 Yes 0.58
75 211 220 Yes 0.62 218 220 Yes 0.74
80 214 220 Yes 0.78 221 220 Yes 0.90
85 216 220 Yes 0.86 223 220 Yes 0.95
90 220 220 Yes 0.96 227 220 Yes 0.99
95 225 220 Yes 0.99 232 220 Yes >0.99

2017 Concordance Study: Linking Texas STAAR to NWEA MAP Growth Page 22
Mathematics (Fall) Mathematics (Winter)
Start
Percentile
Projected Proficiency Projected Proficiency
Grade RIT (Fall) Cut Score Level 3 Prob. RIT (Winter) Cut Score Level 3 Prob.
5
5 187 225 No <0.01 192 225 No <0.01
10 193 225 No <0.01 198 225 No <0.01
15 196 225 No <0.01 201 225 No <0.01
20 199 225 No 0.01 204 225 No <0.01
25 202 225 No 0.03 207 225 No <0.01
30 204 225 No 0.05 209 225 No 0.01
35 206 225 No 0.09 211 225 No 0.02
40 208 225 No 0.15 213 225 No 0.05
45 210 225 No 0.23 215 225 No 0.11
50 211 225 No 0.28 217 225 No 0.20
55 213 225 No 0.38 219 225 No 0.34
60 215 225 Yes 0.50 221 225 Yes 0.50
65 217 225 Yes 0.62 223 225 Yes 0.66
70 219 225 Yes 0.72 225 225 Yes 0.80
75 221 225 Yes 0.81 228 225 Yes 0.93
80 224 225 Yes 0.91 230 225 Yes 0.97
85 227 225 Yes 0.96 233 225 Yes 0.99
90 230 225 Yes 0.99 237 225 Yes >0.99
95 236 225 Yes >0.99 242 225 Yes >0.99
6
5 192 229 No <0.01 196 229 No <0.01
10 198 229 No <0.01 202 229 No <0.01
15 202 229 No <0.01 205 229 No <0.01
20 205 229 No 0.01 209 229 No <0.01
25 207 229 No 0.02 211 229 No <0.01
30 209 229 No 0.04 214 229 No 0.01
35 212 229 No 0.09 216 229 No 0.02
40 214 229 No 0.15 218 229 No 0.05
45 216 229 No 0.23 220 229 No 0.11
50 218 229 No 0.33 222 229 No 0.20
55 220 229 No 0.44 224 229 No 0.34
60 222 229 Yes 0.56 226 229 Yes 0.50
65 224 229 Yes 0.67 228 229 Yes 0.66
70 226 229 Yes 0.77 230 229 Yes 0.80
75 228 229 Yes 0.85 233 229 Yes 0.93
80 231 229 Yes 0.93 236 229 Yes 0.98
85 234 229 Yes 0.96 239 229 Yes >0.99
90 238 229 Yes 0.99 243 229 Yes >0.99
95 243 229 Yes >0.99 248 229 Yes >0.99

2017 Concordance Study: Linking Texas STAAR to NWEA MAP Growth Page 23
Mathematics (Fall) Mathematics (Winter)
Start
Percentile
Projected Proficiency Projected Proficiency
Grade RIT (Fall) Cut Score Level 3 Prob. RIT (Winter) Cut Score Level 3 Prob.
7
5 195 234 No <0.01 198 234 No <0.01
10 201 234 No <0.01 204 234 No <0.01
15 205 234 No <0.01 208 234 No <0.01
20 209 234 No <0.01 212 234 No <0.01
25 211 234 No <0.01 215 234 No <0.01
30 214 234 No 0.02 217 234 No <0.01
35 216 234 No 0.03 220 234 No 0.01
40 218 234 No 0.06 222 234 No 0.02
45 221 234 No 0.14 224 234 No 0.05
50 223 234 No 0.22 226 234 No 0.10
55 225 234 No 0.32 228 234 No 0.20
60 227 234 No 0.44 230 234 No 0.34
65 229 234 Yes 0.56 233 234 Yes 0.58
70 231 234 Yes 0.68 235 234 Yes 0.74
75 234 234 Yes 0.82 238 234 Yes 0.90
80 237 234 Yes 0.92 240 234 Yes 0.95
85 240 234 Yes 0.97 244 234 Yes 0.99
90 244 234 Yes 0.99 248 234 Yes >0.99
95 250 234 Yes >0.99 254 234 Yes >0.99
8
5 197 234 No <0.01 199 234 No <0.01
10 203 234 No <0.01 206 234 No <0.01
15 208 234 No <0.01 210 234 No <0.01
20 211 234 No 0.01 214 234 No <0.01
25 214 234 No 0.02 217 234 No <0.01
30 217 234 No 0.06 220 234 No 0.01
35 219 234 No 0.10 222 234 No 0.02
40 222 234 No 0.18 225 234 No 0.08
45 224 234 No 0.26 227 234 No 0.16
50 226 234 No 0.35 229 234 No 0.28
55 229 234 Yes 0.50 231 234 No 0.42
60 231 234 Yes 0.60 234 234 Yes 0.65
65 233 234 Yes 0.70 236 234 Yes 0.79
70 236 234 Yes 0.78 239 234 Yes 0.92
75 238 234 Yes 0.85 241 234 Yes 0.96
80 241 234 Yes 0.92 245 234 Yes >0.99
85 245 234 Yes 0.98 248 234 Yes >0.99
90 249 234 Yes 0.99 253 234 Yes >0.99
95 256 234 Yes >0.99 259 234 Yes >0.99

2017 Concordance Study: Linking Texas STAAR to NWEA MAP Growth Page 24
Table 5.4. Proficiency Projection and Probability for Passing STAAR Level 3 when MAP Growth is
taken in the Fall or Winter—Science
Science (Fall) Science (Winter)
Start
Percentile
Projected Proficiency Projected Proficiency
Grade RIT (Fall) Cut Score Level 3 Prob. RIT (Winter) Cut Score Level 3 Prob.
5
5 182 217 No <0.01 186 217 No <0.01
10 186 217 No <0.01 190 217 No <0.01
15 189 217 No <0.01 192 217 No <0.01
20 191 217 No <0.01 195 217 No <0.01
25 193 217 No 0.01 196 217 No <0.01
30 194 217 No 0.01 198 217 No <0.01
35 196 217 No 0.01 200 217 No <0.01
40 197 217 No 0.02 201 217 No 0.01
45 199 217 No 0.04 202 217 No 0.01
50 200 217 No 0.05 204 217 No 0.02
55 202 217 No 0.07 205 217 No 0.03
60 203 217 No 0.09 206 217 No 0.05
65 204 217 No 0.12 208 217 No 0.10
70 206 217 No 0.15 209 217 No 0.10
75 208 217 No 0.23 211 217 No 0.18
80 210 217 No 0.28 213 217 No 0.29
85 212 217 No 0.38 215 217 No 0.43
90 214 217 Yes 0.50 218 217 Yes 0.57
95 218 217 Yes 0.67 221 217 Yes 0.77
8
5 190 221 No <0.01 192 221 No <0.01
10 195 221 No <0.01 197 221 No <0.01
15 198 221 No 0.01 200 221 No <0.01
20 200 221 No 0.01 202 221 No <0.01
25 202 221 No 0.03 204 221 No <0.01
30 204 221 No 0.04 206 221 No 0.01
35 206 221 No 0.07 208 221 No 0.03
40 207 221 No 0.09 209 221 No 0.03
45 209 221 No 0.11 211 221 No 0.06
50 210 221 No 0.14 212 221 No 0.08
55 212 221 No 0.21 214 221 No 0.14
60 213 221 No 0.25 215 221 No 0.19
65 215 221 No 0.29 217 221 No 0.30
70 217 221 No 0.39 219 221 No 0.43
75 219 221 Yes 0.50 221 221 Yes 0.57
80 221 221 Yes 0.61 223 221 Yes 0.64
85 223 221 Yes 0.66 225 221 Yes 0.76
90 226 221 Yes 0.79 228 221 Yes 0.89
95 230 221 Yes 0.89 232 221 Yes 0.97

2017 Concordance Study: Linking Texas STAAR to NWEA MAP Growth Page 25
6. Summary and Discussion
This study produced a set of cut scores on MAP Growth Reading and Mathematics for grades
2–8 and Science for grades 5 and 8 that correspond to each STAAR performance level. By
using matched score data from a sample of students from Texas, the study demonstrates that
MAP Growth scores can accurately predict whether a student would reach proficiency on
STAAR based on his or her MAP Growth scores. This study also used the 2015 NWEA norming
study results to project a student’s probability to meet proficiency based on that student’s prior
MAP Growth scores in fall and winter.
However, while concordance tables can be helpful and informative, they have some limitations:
1. The concordance tables provide information about score comparability on different tests,
but the scores cannot be assumed to be interchangeable. In the case for STAAR and
MAP Growth tests, as they are not parallel in content, scores from these two tests
should not be directly compared.
2. The sample data used in this study were collected from 351 schools in Texas. Caution
should be exercised when generalizing the results to students who differ significantly
from this sample.
3. Caution should be exercised if the concorded scores are used for a subpopulation.
NWEA will continue to gather information about STAAR performance from other schools
in Texas to enhance the quality and generalizability of the study.
Regardless of these limitations, the results of this study will help educators predict student
performance in STAAR tests as early as possible and identify students at risk of failing to meet
required standards so they can receive necessary resources and assistance to meet their goals.

2017 Concordance Study: Linking Texas STAAR to NWEA MAP Growth Page 26
7. References
Hanson, B. A., Harris, D. J., Pommerich, M., Sconing, J. A., & Yi, Q. (2001). Suggestions for the
evaluation and use of concordance results. (ACT Research Report No. 2001-1). Iowa City,
IA: ACT, Inc.
Kolen, M. J., & Brennan, R. L. (2004). Test equating, scaling, and linking. New York: Springer.
Pommerich, M., Hanson, B., Harris, D., & Sconing, J. (2004). Issues in conducting linkage
between distinct tests. Applied Psychological Measurement, 28(4), 247–273.
Thum Y. M., & Hauser, C. H. (2015). NWEA 2015 MAP norms for student and school
achievement status and growth. NWEA Research Report. Portland, OR: NWEA.