Embed Size (px)
Citation preview

Miami-Dade
All Ages 100.0% White 81.6%
Under 18 561,800 20.8% Black 16.4%
Under 60 79.0% Other Minorities 1.7%
18-59 58.2% Total Hispanic 67.6%
60+ 21.0% White 64.8%
65+ 15.5% Non-White 2.8%
70+ 10.9% Total Non-Hispanic 32.4%
75+ 7.3% Total Racial and Hispanic
80+ 4.4% Minorities2
83.2%
85+ 2.2% Source: EDR, 2016
%
118,291 20.8%
Male 43.3%
Female 56.7% 163,741 28.8% Source: EDR, 2016
108,288 19.1%
234,262 150,119 26.4% Source: DOEA calculations based on EDR and 2010-14 ACS data
Source: Office of Economic and Demographic Research, 2016
Population Projections
Source: DOEA calculations based on EDR and 2010-14 ACS data
With Limited English Proficiency1 Minority Below 125% of
Poverty Guideline
Minority Below
Poverty GuidelineEnglish Proficiency
59,379 Source: Office of Economic and Demographic Research, 2016
Financial Status
322,342 Below 125% of
Poverty Guideline
Population by Gender Below Poverty
Guideline245,756
472,403
419,289 16,056
117,575
295,238
384,128
368,072
183,970
2016 Profile of Older Floridians
2,132,696
1,570,896
568,098
196,842
2,700,794
Population by Age Category Population by Race and Ethnicity
92,913
9,872
463,767
561,800 575,233 608,572 636,026
1,570,896 1,622,080 1,716,425
1,821,615
568,098634,723
830,345 966,005
0
200,000
400,000
600,000
800,000
1,000,000
1,200,000
1,400,000
1,600,000
1,800,000
2,000,000
2 0 1 6 2 0 2 0 2 0 3 0 2 0 4 0
Nu
mb
er
Year
<18 18-59 60+
Unless otherwise noted, the data presented in this Profile refers to elder
populations in Florida age 60 and older. 1
Miami-Dade
Source: Office of Economic and Demographic Research, 2016
Living With Own 61,281 Total Medically Underserved4
Grandchildren*
9,424 126,409
Grandparent Not Responsible 51,857 1,406
Not Living With Own 506,817 Source: DOH and U.S. HHS, Data as of 8/25/2017
Grandchildren*
*Grandchildren Under Age 18
Source: DOEA calculations based on EDR and 2010-14 ACS data
Participants
Potentially Eligible
Participation Rate 118.2%
Rural (Yes/No) NOSource: Rural Economic Development Initiative
Rural Designation
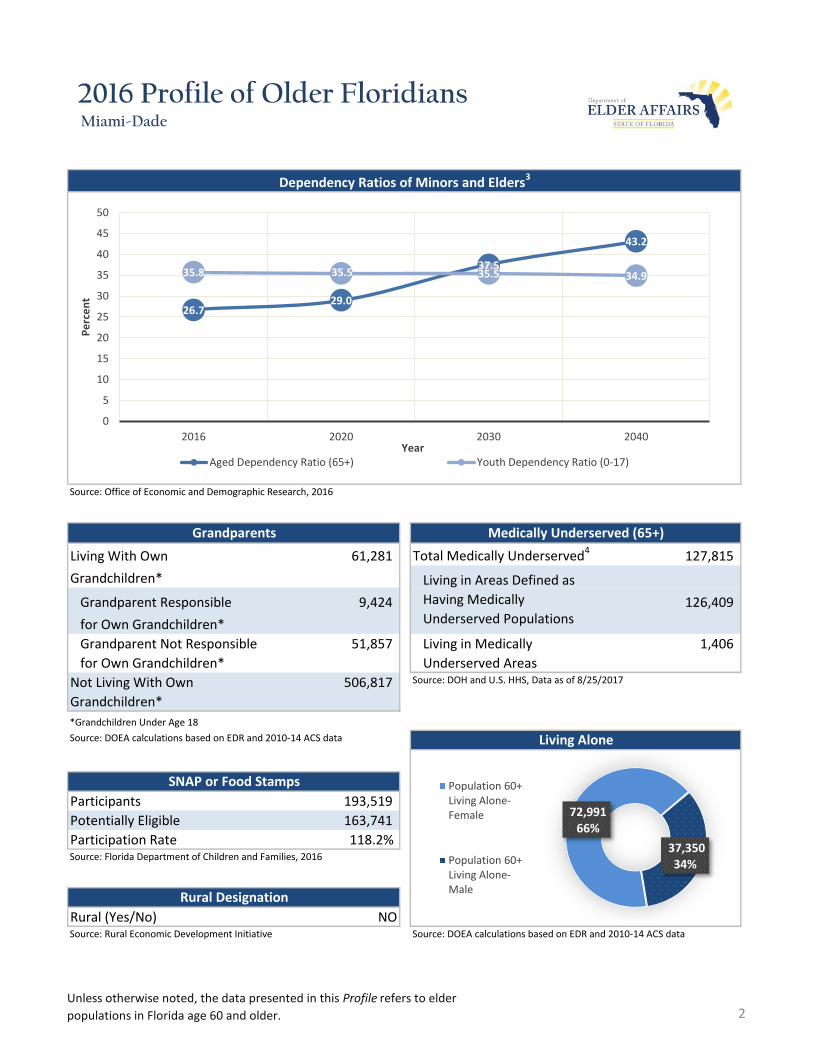
Source: DOEA calculations based on EDR and 2010-14 ACS data
Living in Medically
Underserved Areas
Source: Florida Department of Children and Families, 2016
SNAP or Food Stamps
193,519
163,741
Living Alone
for Own Grandchildren*
Grandparent Responsible
for Own Grandchildren*
Living in Areas Defined as
Having Medically
Underserved Populations
Grandparents Medically Underserved (65+)
127,815
Dependency Ratios of Minors and Elders3
2016 Profile of Older Floridians
72,991 66%
37,350 34%
Population 60+Living Alone-Female
Population 60+Living Alone-Male
26.729.0
37.5
43.2
35.8 35.5 35.5 34.9
0
5
10
15
20
25
30
35
40
45
50
2016 2020 2030 2040
Pe
rce
nt
YearAged Dependency Ratio (65+) Youth Dependency Ratio (0-17)
Unless otherwise noted, the data presented in this Profile refers to elder
populations in Florida age 60 and older. 2

Miami-Dade
Elder Voters 325,117
Percent of All Voters 30.5% Source: FL Department of State, 2016 Percent OASDI Beneficiaries 77.5%
Elder Drivers
Percent of All Drivers 21.7% Source: FL Department of Highway Safety & Motor Vehicles, 2016 Source: U.S. Census Bureau, 2011-2015 American Community Survey 5-Year
Estimates timates
With One Type of Disability7
With Two or More Disabilities 103,956
Total With Any Disability
Hearing
Vision
Cognitive
Ambulatory
Self-Care
Independent LivingSource: FL Department of Veterans' Affairs
With No Disabilities
57,867
Elder Households
Percent of All HouseholdsSource: The Shimberg Center for Housing Studies, 2016 Medical Doctors
Licensed
Limited License
Single Elders Critical Need Area License
Owner without Mortgage Restricted
Renter, one bedroom Medical Faculty Certification
Owner with Mortgage Public Health Certificate
Elder Couple Specialties
Owner without Mortgage Licensed Podiatric Physicians 208
Renter, one bedroom Licensed Osteopathic Physicians 564
Owner with Mortgage Licensed Chiropractic Physicians 388
Licensed Registered NursesSource: Florida Department of Health, 2016
2016 Profile of Older Floridians
25,869
Probable Alzheimer's Cases (65+) 8
$23,520
$28,236
$35,928 Source: Wider Opportunities for Women Elder Economic Security Standard™
Index (Elder Index), Data as of 8/16/2017
30
$29,052 1
Households With Cost Burden Above 30% and Income
Below 50% Area Median Income (65+)5
Source: DOEA calculations based on EDR, 2010-14 ACS data,
and Alzheimer’s Disease Facts and Figures Report, 2017
94
$16,644 0
$21,360
7,552
225,368
Cost of Living, Annual Expenses(65+)62
35.7% Medical Professionals
393,735
46,519
84,685
118,357
50,773
$43,129
Veterans Disability Status
70,418
35,886
65,197
445,489 Median Household Income for All Ages
Source: DOEA calculations based on EDR and the U.S. Social Security
Administration data, 2016Florida Driver's License
2011-2015
Florida Registered Voters Retirement (65+)
425,651 Old-Age, Survivors, and
Disability Insurance (OASDI)
Beneficiaries
61,075
22,740 17,659
4,156
Total Age 45-64 Age 65-84 Age 85+
Unless otherwise noted, the data presented in this Profile refers to elder
populations in Florida age 60 and older. 3

Miami-Dade
SNF Beds 8,687
6,371
64 2,316
Veterans' Affairs Administration Beds - 787
- 18
57 441
55 Facilities with LNS License12
53
2
Veterans' Affairs Administration Beds -
- Homes 16
SNFs With Community Beds 55 Beds 79
Community Bed Days
Community Patient Days
Medicaid Patient Days Facilities
Occupancy Rate 90.6% Operating Rooms
Percent Medicaid 68.9% Recovery Beds 209
Agencies 35
Medicaid Certified Agencies Hospitals with Skilled Nursing Units 1
Medicare Certified Agencies 290 9,452
672
Companies 172
Medicaid Eligible - All Ages
60+ Medicaid Eligible
Facilities Dual Eligible - All Ages
60+ Dual EligibleSource for Page: AHCA, 2016
2016 Profile of Older Floridians
Adult Day Care 205,586
136
Homemaker & Companion Service Companies
Medicaid & Medicare Eligibility
199,415
Capacity 7,428 176,088
735,083
Hospital Beds
Skilled Nursing Unit Beds
145
1,932,456 27
Hospitals
342 Hospitals
Home Health Agencies
Community Beds
Other Beds
3,094,896
72
2,805,372 Ambulatory Surgical Centers
Sheltered Beds Non-OSS Beds
Sheltered Beds
Adult Family Care Homes
Other Beds Facilities with ECC License10
SNFs With Beds Facilities with LMH License11
Total Facilities
Skilled Nursing Facility (SNF) Utilization Assisted Living Facility
8,520 Total Beds
Community Beds 8,456 OSS Beds9
Unless otherwise noted, the data presented in this Profile refers to elder
populations in Florida age 60 and older. 4

Miami-Dade
Office of Economic & Demographic Research (EDR) FL Division of Emergency Management (Shelters)
U.S. Census Bureau, American Community Survey Florida Housing Data Clearinghouse
U.S. Census Bureau, Quick Facts County Chronic Disease Profile
Agency for Health Care Administration (AHCA)
2016 Profile of Older Floridians
Useful Websites
Source: Florida Department of Elder Affairs using U.S. Census Bureau, 2008-12 ACS data
Elder Needs Index
The Elder Needs Index (ENI) is a composite measure that includes: (1) the percentage of the 60 and older population that is age 85 and older; (2) the percentage of the 55 and older population who are members of racial or ethnic minority groups; (3) the percentage of the 65 and older population with one or more disability; and (4) the percentage of the 55 and older population living below 125% of the Federal Poverty Level. The Index is an averaged score that indicates senior citizens’ overall level of risk for a probable need of social services within a geographic area. It is not a percentage of the area’s population. The green areas of the map represent current conservation land such as national parks, state forests, wildlife management areas, local and private preserves. The blue areas of the map represent current water features such as lakes, streams, rivers, and coastlines.Complete maps available at http://elderaffairs.state.fl.us/doea/eni_home.php
Unless otherwise noted, the data presented in this Profile refers to elder
populations in Florida age 60 and older. 5

Miami-Dade
2016 Profile of Older Floridians
Unless otherwise noted, the data presented in this Profile refers to elder
populations in Florida age 60 and older. 6
2 Total Minorities = (60+ Population) - (White Non-Hispanic 60+)
6 Wider Opportunities for Women Elder Economic Security Standard™ Index (Elder Index) measures how much income retired older adults require to meet their basic needs without public or private assistance. The Elder Index measures basic expenses for elders age 65+ living in the community, not in institutions. Annual expenses include: housing, including utilities, taxes, insurance; food; transportation; health care, based on good health; and miscellaneous. Data found at http://www.basiceconomicsecurity.org/EI/7 With One Type of Disability: 60+ people who have only one type of disability
1 Those who report speaking English "Not well" or "Not at all" are defined as having Limited English Proficiency (LEP) in this profile.
3 A “dependency ratio” is commonly depicted as a ratio of workers to non-workers. Rather than using labor-force participation rates, which fluctuate, a stable dependency ratio can be estimated by using the number of individuals in the population who fall into age groups generally aligned with school-aged kids, working age adults, and retired seniors. For this graphic, working age adults (defined as 18-59) were compared to minors (age 0-17)(youth dependency ratio) and seniors (age 65+)(aged dependency ratio).4 Medically Underserved Areas/Populations are areas or populations designated by Health Resources & Services Administration(HRSA) as having too few primary care providers, high infant mortality, high poverty or a high elderly population.5 Households age 65 and older paying more than 30 percent of income for housing costs (including utilities) and have an
income below 50 percent of the area median income.
8 Probable Alzheimer’s Cases = (65-74 Population x 0.036592) + (75-84 Population x 0.174333) + (85+ Population x 0.433872)Alzheimer’s by Age in 2017 Alzheimer’s Disease Facts and Figures Report used to develop calculation can be found at: http://www.alz.org/documents_custom/facts_2017/statesheet_florida.pdf?type=interior_map&facts=undefined&facts=fa cts
10 ECC License: Extended Congregate Care License. The ECC license is a specialty license that enables a facility to provide, directly or through contract, services beyond those permissible under the standard license, including acts performed by licensed nurses, and supportive services defined by rule to persons who otherwise would be disqualified from continued residence in a facility licensed under this part.
9 OSS Beds: Optional State Supplementation Beds. Optional State Supplementation (OSS) is a cash assistance program. Its purpose is to supplement a person's income to help pay for costs in an assisted living facility, mental health residential treatment facility, and adult family care home. It is NOT a Medicaid program.
11 LMH License: Limited Mental Health License. Any facility intending to admit three or more mental health residents must apply for and obtain a limited mental health license from AHCA’s Assisted Living Unit before accepting the third mental health resident. 12 LNS License: Limited Nursing Services License. The LNS license is a specialty license that enables a facility to provide a
select number of nursing services.