Embed Size (px)
Citation preview
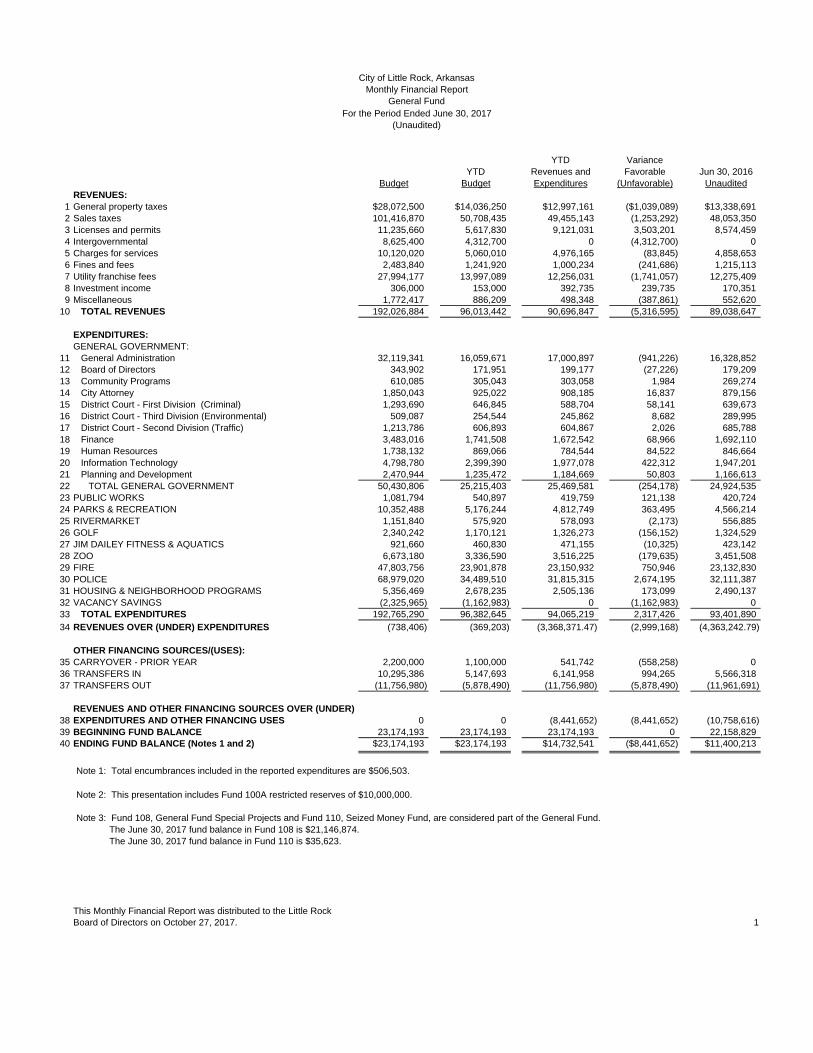
YTD VarianceYTD Revenues and Favorable Jun 30, 2016
Budget Budget Expenditures (Unfavorable) UnauditedREVENUES:
1 General property taxes $28,072,500 $14,036,250 $12,997,161 ($1,039,089) $13,338,6912 Sales taxes 101,416,870 50,708,435 49,455,143 (1,253,292) 48,053,3503 Licenses and permits 11,235,660 5,617,830 9,121,031 3,503,201 8,574,4594 Intergovernmental 8,625,400 4,312,700 0 (4,312,700) 05 Charges for services 10,120,020 5,060,010 4,976,165 (83,845) 4,858,6536 Fines and fees 2,483,840 1,241,920 1,000,234 (241,686) 1,215,1137 Utility franchise fees 27,994,177 13,997,089 12,256,031 (1,741,057) 12,275,4098 Investment income 306,000 153,000 392,735 239,735 170,3519 Miscellaneous 1,772,417 886,209 498,348 (387,861) 552,620
10 TOTAL REVENUES 192,026,884 96,013,442 90,696,847 (5,316,595) 89,038,647
EXPENDITURES:GENERAL GOVERNMENT:
11 General Administration 32,119,341 16,059,671 17,000,897 (941,226) 16,328,852 12 Board of Directors 343,902 171,951 199,177 (27,226) 179,209 13 Community Programs 610,085 305,043 303,058 1,984 269,27414 City Attorney 1,850,043 925,022 908,185 16,837 879,15615 District Court - First Division (Criminal) 1,293,690 646,845 588,704 58,141 639,673 16 District Court - Third Division (Environmental) 509,087 254,544 245,862 8,682 289,995 17 District Court - Second Division (Traffic) 1,213,786 606,893 604,867 2,026 685,788 18 Finance 3,483,016 1,741,508 1,672,542 68,966 1,692,110 19 Human Resources 1,738,132 869,066 784,544 84,522 846,664 20 Information Technology 4,798,780 2,399,390 1,977,078 422,312 1,947,201 21 Planning and Development 2,470,944 1,235,472 1,184,669 50,803 1,166,613 22 TOTAL GENERAL GOVERNMENT 50,430,806 25,215,403 25,469,581 (254,178) 24,924,535 23 PUBLIC WORKS 1,081,794 540,897 419,759 121,138 420,724 24 PARKS & RECREATION 10,352,488 5,176,244 4,812,749 363,495 4,566,214 25 RIVERMARKET 1,151,840 575,920 578,093 (2,173) 556,885 26 GOLF 2,340,242 1,170,121 1,326,273 (156,152) 1,324,52927 JIM DAILEY FITNESS & AQUATICS 921,660 460,830 471,155 (10,325) 423,14228 ZOO 6,673,180 3,336,590 3,516,225 (179,635) 3,451,50829 FIRE 47,803,756 23,901,878 23,150,932 750,946 23,132,83030 POLICE 68,979,020 34,489,510 31,815,315 2,674,195 32,111,387 31 HOUSING & NEIGHBORHOOD PROGRAMS 5,356,469 2,678,235 2,505,136 173,099 2,490,137 32 VACANCY SAVINGS (2,325,965) (1,162,983) 0 (1,162,983) 033 TOTAL EXPENDITURES 192,765,290 96,382,645 94,065,219 2,317,426 93,401,890
34 REVENUES OVER (UNDER) EXPENDITURES (738,406) (369,203) (3,368,371.47) (2,999,168) (4,363,242.79)
OTHER FINANCING SOURCES/(USES):35 CARRYOVER - PRIOR YEAR 2,200,000 1,100,000 541,742 (558,258) 036 TRANSFERS IN 10,295,386 5,147,693 6,141,958 994,265 5,566,318 37 TRANSFERS OUT (11,756,980) (5,878,490) (11,756,980) (5,878,490) (11,961,691)
REVENUES AND OTHER FINANCING SOURCES OVER (UNDER)38 EXPENDITURES AND OTHER FINANCING USES 0 0 (8,441,652) (8,441,652) (10,758,616)39 BEGINNING FUND BALANCE 23,174,193 23,174,193 23,174,193 0 22,158,829 40 ENDING FUND BALANCE (Notes 1 and 2) $23,174,193 $23,174,193 $14,732,541 ($8,441,652) $11,400,213
Note 1: Total encumbrances included in the reported expenditures are $506,503.
Note 2: This presentation includes Fund 100A restricted reserves of $10,000,000.
Note 3: Fund 108, General Fund Special Projects and Fund 110, Seized Money Fund, are considered part of the General Fund. The June 30, 2017 fund balance in Fund 108 is $21,146,874. The June 30, 2017 fund balance in Fund 110 is $35,623.
This Monthly Financial Report was distributed to the Little RockBoard of Directors on October 27, 2017. 1
(Unaudited)
City of Little Rock, ArkansasMonthly Financial Report
General FundFor the Period Ended June 30, 2017

YTD Variance YTD Revenues and Favorable Jun 30, 2016
Budget Budget Expenditures (Unfavorable) UnauditedREVENUES:
1 Charges for services $0 $0 $60,473 $60,473 $60,1712 Intergovernmental 0 0 0 0 03 Interest income 0 0 0 0 04 Miscellaneous 0 0 1,000,226 1,000,226 643,141 5 TOTAL REVENUES 0 0 1,060,699 1,060,699 703,312
EXPENDITURES: 6 Mayor 0 0 0 0 07 City Manager 0 0 722,416 (722,416) 866,1458 City Attorney 0 0 0 0 09 Finance 0 0 252,612 (252,612) 4,550
10 Information Technology 0 0 620,515 (620,515) 770,41711 Human Resources 0 0 37,832 (37,832) 28,29112 Planning 0 0 0 0 46,04613 Community Programs 0 0 3,026,784 (3,026,784) 5,322,57114 Public Works 0 0 818,000 (818,000) 469,39715 Parks and Recreation 0 0 334,289 (334,289) 200,11216 Jim Dailey Fitness and Aquatics 0 0 0 0 016 Fire 0 0 0 0 017 Police 0 0 19,348 (19,348) 904,50418 Housing 0 0 684,677 (684,677) 331,23719 Fleet 0 0 513,951 (513,951) 1,103,37020 Zoo 0 0 234,262 (234,262) 22,80721 TOTAL EXPENDITURES 0 0 7,264,687 (7,264,687) 10,069,446
22 REVENUES OVER (UNDER) EXPENDITURES 0 0 (6,203,988) (6,203,988) (9,366,134)
OTHER FINANCING SOURCES (USES):23 Transfers In 0 0 11,271,004 11,271,004 11,376,67624 Transfers Out 0 0 (828,854) (828,854) (282,291)
REVENUES AND OTHER FINANCING SOURCES OVER (UNDER)25 EXPENDITURES AND OTHER FINANCING USES 0 0 4,238,163 4,238,163 1,728,251
26 BEGINNING FUND BALANCE 0 0 16,908,711 16,908,711 17,011,334
27 ENDING FUND BALANCE (Note 1) $0 $0 $21,146,874 $21,146,874 $18,739,585
Note 1: As of June 30, 2017, fund balance is composed of 309 projects utilizing full fund balance.
This Monthly Financial Report was distributed to the Little RockBoard of Directors on October 27, 2017. 2
(Unaudited)
City of Little Rock, ArkansasMonthly Financial Report
General Fund Special Projects FundFor the Period Ended June 30, 2017

YTD Variance YTD Revenues and Favorable Jun 30, 2016
Budget Budget Expenditures (Unfavorable) UnauditedREVENUES:
1 General property taxes $5,865,100 $2,932,550 $2,690,023 ($242,527) $2,760,7192 Licenses and permits 17,060 8,530 16,850 8,320 03 Intergovernmental 12,430,546 6,215,273 6,581,245 $365,972 6,394,0924 Charges for services 18,500 9,250 9,877 627 14,6005 Investment income 93,400 46,700 207,084 160,384 81,6146 Miscellaneous 221,500 110,750 18,823 (91,927) 204,3167 TOTAL REVENUES 18,646,106 9,323,053 9,523,902 200,849 9,455,341
EXPENDITURES:Public Works:
8 General Administration 1,014,776 507,388 280,736 226,652 321,5809 Operations Administration 825,955 412,978 300,317 112,661 349,261
10 Street & Drainage Maintenance 7,710,054 3,855,027 3,309,942 545,085 3,267,34411 Storm Drainage Maintenance 860,736 430,368 418,169 12,199 408,38612 Work Pool 156,431 78,216 40,431 37,784 55,12513 Resource Control & Scheduling 337,742 168,871 203,239 (34,368) 189,54314 Control Devices 900,339 450,170 391,046 59,123 373,64515 Signals 961,914 480,957 319,502 161,455 373,69116 Parking Meters 111,102 55,551 51,870 3,681 58,59217 Civil Engineering 1,858,582 929,291 968,871 (39,580) 682,41418 Traffic Engineering 3,304,499 1,652,250 1,533,573 118,677 1,567,77719 Parking Enforcement 286,985 143,493 122,723 20,769 128,95720 TOTAL EXPENDITURES 18,329,115 9,164,558 7,940,419 1,224,138 7,776,315
21 REVENUES OVER (UNDER) EXPENDITURES 316,991 158,496 1,583,483 1,424,987 1,679,026
OTHER FINANCING SOURCES (USES):22 Transfers In 1,526,726 763,363 1,167,700 404,337 1,355,70023 Transfers Out (1,843,717) (921,859) (2,163,717) (1,241,859) (2,377,717)
REVENUES AND OTHER FINANCING SOURCES OVER (UNDER)24 EXPENDITURES AND OTHER FINANCING USES 0 0 587,466 587,466 657,009
25 BEGINNING FUND BALANCE 14,247,452 14,247,452 14,247,452 0 11,170,724
26 ENDING FUND BALANCE (Note 1) $14,247,452 $14,247,452 $14,834,918 $587,466 $11,827,733
Note 1: Fund 205, Street Special Projects Fund, is considered part of the Street Fund.
The June 30, 2017 fund balance in Fund 205 is $2,038,433.
This Monthly Financial Report was distributed to the Little RockBoard of Directors on October 27, 2017. 3
(Unaudited)
City of Little Rock, ArkansasMonthly Financial Report
Street FundFor the Period Ended June 30, 2017

YTD Variance YTD Revenues and Favorable Jun 30, 2016
Budget Budget Expenditures (Unfavorable) UnauditedREVENUES:
1 Charges for services $0 $0 $0 $0 $02 Interest income 0 0 0 0 03 Miscellaneous 0 0 0 0 191,4104 TOTAL REVENUES 0 0 0 0 191,410
EXPENDITURES:5 Public Works 0 0 1,042,602 (1,042,602) 1,286,3436 TOTAL EXPENDITURES 0 0 1,042,602 (1,042,602) 1,286,343
7 REVENUES OVER (UNDER) EXPENDITURES 0 0 (1,042,602) (1,042,602) (1,094,933)
OTHER FINANCING SOURCES (USES):8 Transfers In 0 0 1,420,000 0 1,400,0009 Transfers Out 0 0 0 0 0
REVENUES AND OTHER FINANCING SOURCES OVER (UNDER)10 EXPENDITURES AND OTHER FINANCING USES 0 0 377,398 (1,042,602) 305,067
11 BEGINNING FUND BALANCE 0 0 1,661,036 1,661,036 1,506,361
12 ENDING FUND BALANCE (Note 1) $0 $0 $2,038,433 $618,433 $1,811,428
Note 1: As of June 30, 2017, special project commitments for 14 projects utilizing full fund balance.
This Monthly Financial Report was distributed to the Little RockBoard of Directors on October 27, 2017. 4
(Unaudited)
City of Little Rock, ArkansasMonthly Financial Report
Street Fund Special Projects FundFor the Period Ended June 30, 2017

YTD Variance YTD Revenues and Favorable Jun 30, 2016
Budget Budget Expenditures (Unfavorable) UnauditedREVENUES:
1 Charges for services $0 $0 $0 $0 $02 Interest income 0 0 1,141 1,141 7363 Miscellaneous 0 0 78,659 78,659 65,9304 TOTAL REVENUES 0 0 79,800 79,800 66,667
EXPENDITURES:5 Police 0 0 84,083 (84,083) 90,6546 TOTAL EXPENDITURES 0 0 84,083 (84,083) 90,654
7 REVENUES OVER (UNDER) EXPENDITURES 0 0 (4,283) (4,283) (23,988)
OTHER FINANCING SOURCES (USES):8 Transfers In 0 0 0 0 09 Transfers Out 0 0 0 0 0
REVENUES AND OTHER FINANCING SOURCES OVER (UNDER)10 EXPENDITURES AND OTHER FINANCING USES 0 0 (4,283) (4,283) (23,988)
11 BEGINNING FUND BALANCE 0 0 39,906 39,906 49,083
12 ENDING FUND BALANCE $0 $0 $35,623 $35,623 $25,095
This Monthly Financial Report was distributed to the Little RockBoard of Directors on October 27, 2017. 5
City of Little Rock, Arkansas
(Unaudited)For the Period Ended June 30, 2017
Seized Money FundMonthly Financial Report

YTD Variance YTD Revenues and Favorable Jun 30, 2016
Budget Budget Expenditures (Unfavorable) UnauditedREVENUES:
1 Licenses and permits $0 $0 $36,842 $36,842 $02 Intergovernmental 0 0 234,496 234,496 234,9003 Charges for services 0 0 630,747 630,747 544,917 4 Fines and fees 0 0 427,969 427,969 592,444 5 Interest income 0 0 30,270 30,270 9846 Miscellaneous 0 0 672,243 672,243 437,355 7 TOTAL REVENUES 0 0 2,032,566 2,032,566 1,810,600
EXPENDITURES:8 General Government 0 0 0 0 09 City Manager 0 0 46,557 (46,557) 22,249
10 Community Programs 0 0 23,211 (23,211) 22,38911 City Attorney 0 0 0 0 012 District Court - First Division (Criminal) 0 0 8,178 (8,178) 8,40713 District Court - Second Division (Traffic) 0 0 10,608 (10,608) 22,17314 District Court - Third Division (Environmental) 0 0 0 0 015 Finance 0 0 255,002 (255,002) 247,23216 Human Resources 0 0 90,849 (90,849) 6,77717 Information Technology 0 0 0 0 018 Planning 0 0 11,832 (11,832) 7,04919 Fleet 0 0 78,403 (78,403) 163,11820 Public Works 0 0 17,607 (17,607) 103,57021 Parks and Recreation 0 0 832,118 (832,118) 679,91022 Jim Dailey Fitness & Aquatics 0 0 0 0 023 Fire 0 0 244,283 (244,283) 132,21924 Police 0 0 113,939 (113,939) 68,90825 Housing 0 0 115,195 (115,195) 127,37926 Zoo 0 0 44,031 (44,031) 49,12927 TOTAL EXPENDITURES 0 0 1,891,812 (1,891,812) 1,660,511
28 REVENUES OVER (UNDER) EXPENDITURES 0 0 140,754 140,754 150,089
OTHER FINANCING SOURCES (USES):29 Transfers In 0 0 29,821 29,821 030 Transfers Out 0 0 (119,522) (119,522) 0
REVENUES AND OTHER FINANCING SOURCES OVER (UNDER)31 EXPENDITURES AND OTHER FINANCING USES 0 0 51,053 51,053 150,089
32 BEGINNING FUND BALANCE 0 0 3,603,334 3,603,334 2,767,906
33 ENDING FUND BALANCE (Note 1) $0 $0 $3,654,387 $3,654,387 $2,917,995
Note 1: Fund balance is comprised of 88 special projects with appropriations totaling $5,981,599and 11 special projects with negative balances of $2,328,584.
This Monthly Financial Report was distributed to the Little RockBoard of Directors on October 27, 2017. 6
City of Little Rock, Arkansas
(Unaudited)For the Period Ended June 30, 2017
Special Projects FundMonthly Financial Report
YTD Variance YTD Revenues and Favorable Jun 30, 2016
Budget Budget Expenditures (Unfavorable) UnauditedREVENUES:
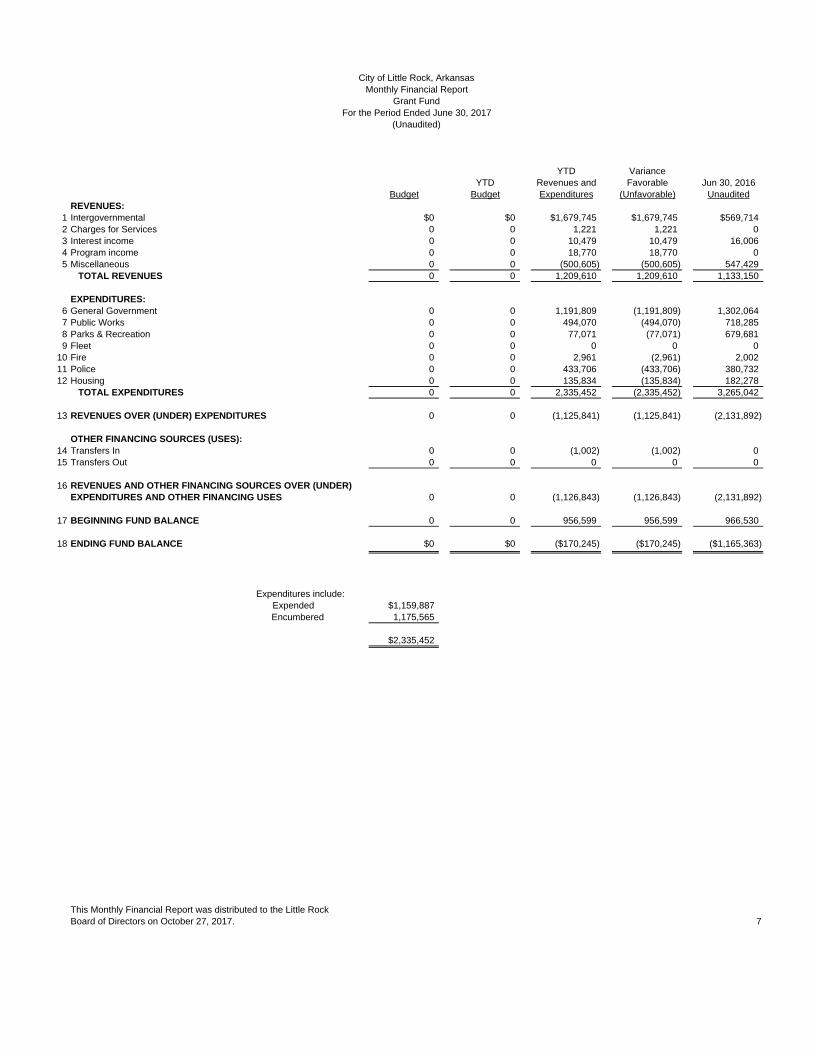
1 Intergovernmental $0 $0 $1,679,745 $1,679,745 $569,7142 Charges for Services 0 0 1,221 1,221 03 Interest income 0 0 10,479 10,479 16,0064 Program income 0 0 18,770 18,770 05 Miscellaneous 0 0 (500,605) (500,605) 547,429
TOTAL REVENUES 0 0 1,209,610 1,209,610 1,133,150
EXPENDITURES:6 General Government 0 0 1,191,809 (1,191,809) 1,302,0647 Public Works 0 0 494,070 (494,070) 718,2858 Parks & Recreation 0 0 77,071 (77,071) 679,6819 Fleet 0 0 0 0 0
10 Fire 0 0 2,961 (2,961) 2,00211 Police 0 0 433,706 (433,706) 380,73212 Housing 0 0 135,834 (135,834) 182,278
TOTAL EXPENDITURES 0 0 2,335,452 (2,335,452) 3,265,042
13 REVENUES OVER (UNDER) EXPENDITURES 0 0 (1,125,841) (1,125,841) (2,131,892)
OTHER FINANCING SOURCES (USES):14 Transfers In 0 0 (1,002) (1,002) 015 Transfers Out 0 0 0 0 0
16 REVENUES AND OTHER FINANCING SOURCES OVER (UNDER)EXPENDITURES AND OTHER FINANCING USES 0 0 (1,126,843) (1,126,843) (2,131,892)
17 BEGINNING FUND BALANCE 0 0 956,599 956,599 966,530
18 ENDING FUND BALANCE $0 $0 ($170,245) ($170,245) ($1,165,363)
Expenditures include: Expended $1,159,887
Encumbered 1,175,565
$2,335,452
This Monthly Financial Report was distributed to the Little RockBoard of Directors on October 27, 2017. 7
(Unaudited)
City of Little Rock, ArkansasMonthly Financial Report
Grant FundFor the Period Ended June 30, 2017

YTD Variance YTD Revenues and Favorable Jun 30, 2016
Budget Budget Expenditures (Unfavorable) UnauditedREVENUES:
1 Charges for services $0 $0 $345,144 $345,144 $627,9612 Interest income 0 0 0 0 03 Miscellaneous 0 0 0 0 04 TOTAL REVENUES 0 0 345,144 345,144 627,961
EXPENDITURES:5 Police 0 0 815,371 (815,371) 751,7786 TOTAL EXPENDITURES 0 0 815,371 (815,371) 751,778
7 REVENUES OVER (UNDER) EXPENDITURES 0 0 (470,228) (470,228) (123,817)
OTHER FINANCING SOURCES (USES):8 Transfers In 0 0 0 0 09 Transfers Out 0 0 0 0 0
REVENUES AND OTHER FINANCING SOURCES OVER (UNDER)10 EXPENDITURES AND OTHER FINANCING USES 0 0 (470,228) (470,228) (123,817)
11 BEGINNING FUND BALANCE 0 0 103,135 103,135 96,441
12 ENDING FUND BALANCE $0 $0 ($367,093) ($367,093) ($27,376)
This Monthly Financial Report was distributed to the Little RockBoard of Directors on October 27, 2017. 8
(Unaudited)
City of Little Rock, ArkansasMonthly Financial Report
Emergency 911 FundFor the Period Ended June 30, 2017

YTD Variance YTD Revenues and Favorable Jun 30, 2016
Budget Budget Expenditures (Unfavorable) UnauditedREVENUES:
1 Intergovernmental $0 $0 $693,608 $693,608 $582,2002 Charges for Services 0 0 0 0 03 Miscellaneous 0 0 0 0 04 TOTAL REVENUES 0 0 693,608 693,608 582,200
EXPENDITURES:5 General Government 0 0 0 0 06 Housing 0 0 870,713 (870,713) 889,5407 TOTAL EXPENDITURES 0 0 870,713 (870,713) 889,540
8 REVENUES OVER (UNDER) EXPENDITURES 0 0 (177,106) (177,106) (307,340)
OTHER FINANCING SOURCES (USES):9 Transfers In 0 0 0 0 0
10 Transfers Out 0 0 0 0 0
REVENUES AND OTHER FINANCING SOURCES OVER (UNDER)11 EXPENDITURES AND OTHER FINANCING USES 0 0 (177,106) (177,106) (307,340)
12 BEGINNING FUND BALANCE 0 0 839,253 839,253 1,059,167
13 ENDING FUND BALANCE $0 $0 $662,147 $662,147 $751,826
Expenditures include: Expended $771,893
Encumbered 98,821
$870,713
This Monthly Financial Report was distributed to the Little RockBoard of Directors on October 27, 2017. 9
(Unaudited)
City of Little Rock, ArkansasMonthly Financial Report
Community Development Block Grant FundFor the Period Ended June 30, 2017

YTD Variance YTD Revenues and Favorable Jun 30, 2016
Budget Budget Expenditures (Unfavorable) UnauditedREVENUES:
1 Intergovernmental $0 $0 $320,704 $320,704 $438,1672 Charges for Services 0 0 0 0 03 Miscellaneous 0 0 0 0 04 TOTAL REVENUES 0 0 320,704 320,704 438,167
EXPENDITURES:5 General Government 0 0 0 0 06 Housing 0 0 725,154 (725,154) 978,2127 TOTAL EXPENDITURES 0 0 725,154 (725,154) 978,212
8 REVENUES OVER (UNDER) EXPENDITURES 0 0 (404,450) (404,450) (540,045)
OTHER FINANCING SOURCES (USES):9 Transfers In 0 0 0 0 0
10 Transfers Out 0 0 0 0 0
REVENUES AND OTHER FINANCING SOURCES OVER (UNDER)11 EXPENDITURES AND OTHER FINANCING USES 0 0 (404,450) (404,450) (540,045)
12 BEGINNING FUND BALANCE 0 0 884,211 884,211 872,326
13 ENDING FUND BALANCE $0 $0 $479,761 $479,761 $332,281
Expenditures include: Expended $258,528
Encumbered 466,626
$725,154
This Monthly Financial Report was distributed to the Little RockBoard of Directors on October 27, 2017. 10
(Unaudited)
City of Little Rock, ArkansasMonthly Financial Report
HIPP FundFor the Period Ended June 30, 2017
YTD Variance YTD Revenues and Favorable Jun 30, 2016
Budget Budget Expenditures (Unfavorable) UnauditedREVENUES:
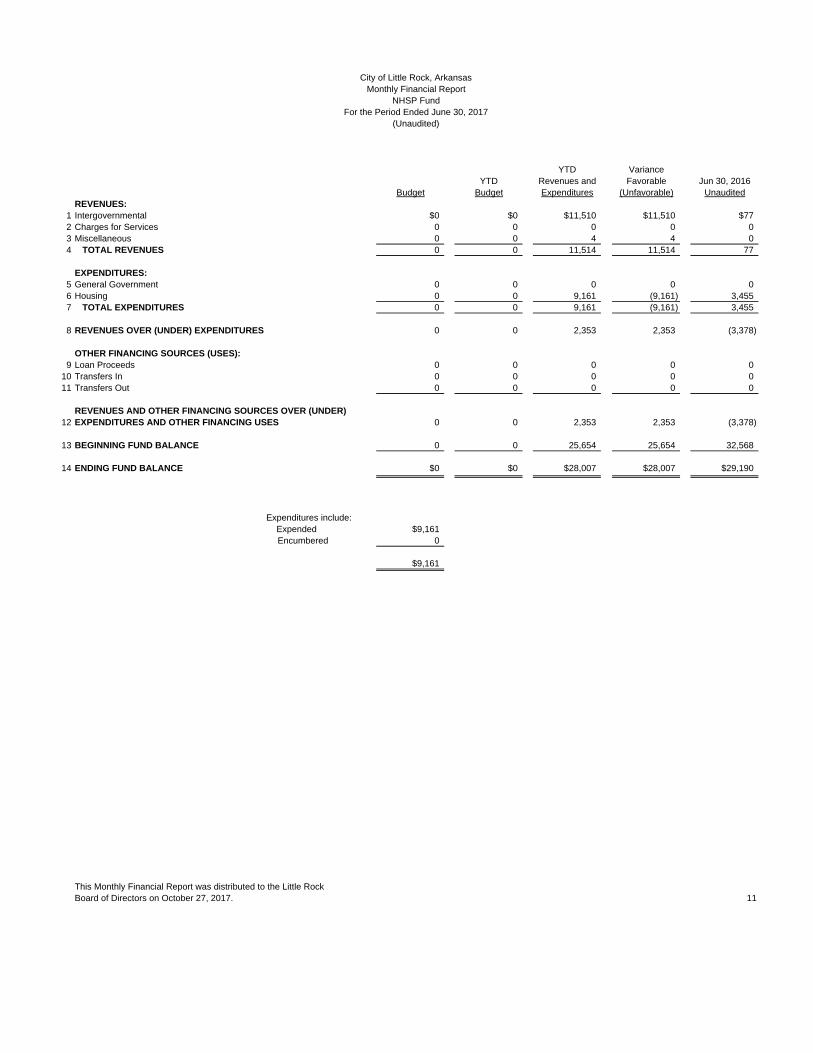
1 Intergovernmental $0 $0 $11,510 $11,510 $772 Charges for Services 0 0 0 0 03 Miscellaneous 0 0 4 4 04 TOTAL REVENUES 0 0 11,514 11,514 77
EXPENDITURES:5 General Government 0 0 0 0 06 Housing 0 0 9,161 (9,161) 3,4557 TOTAL EXPENDITURES 0 0 9,161 (9,161) 3,455
8 REVENUES OVER (UNDER) EXPENDITURES 0 0 2,353 2,353 (3,378)
OTHER FINANCING SOURCES (USES):9 Loan Proceeds 0 0 0 0 0
10 Transfers In 0 0 0 0 011 Transfers Out 0 0 0 0 0
REVENUES AND OTHER FINANCING SOURCES OVER (UNDER)12 EXPENDITURES AND OTHER FINANCING USES 0 0 2,353 2,353 (3,378)
13 BEGINNING FUND BALANCE 0 0 25,654 25,654 32,568
14 ENDING FUND BALANCE $0 $0 $28,007 $28,007 $29,190
Expenditures include: Expended $9,161
Encumbered 0
$9,161
This Monthly Financial Report was distributed to the Little RockBoard of Directors on October 27, 2017. 11
(Unaudited)
City of Little Rock, ArkansasMonthly Financial Report
NHSP FundFor the Period Ended June 30, 2017

YTD VarianceYTD Revenues and Favorable Jun 30, 2016
Budget Budget Expenditures (Unfavorable) UnauditedREVENUES:
1 Charges for Services $0 $0 $0 $0 $02 Interest income 0 0 20,305 20,305 2,8043 Donations 0 0 0 0 04 TOTAL REVENUES 0 0 20,305 20,305 2,804
EXPENDITURES:5 General Government 0 0 34,502 (34,502) 06 Public Works 0 0 0 0 07 Parks and Recreation 0 0 0 0 08 Fire 0 0 10,691 (10,691) 09 Police 0 0 100,569 (100,569) 737,424
10 Housing 0 0 0 0 011 TOTAL EXPENDITURES 0 0 145,762 (145,762) 737,424
12 REVENUES OVER (UNDER) EXPENDITURES 0 0 (125,457) (125,457) (734,620)
OTHER FINANCING SOURCES (USES):13 Temporary Note Proceeds 0 0 0 0 4,525,00014 Transfers Out 0 0 0 0 0
REVENUES AND OTHER FINANCING SOURCES OVER (UNDER)15 EXPENDITURES AND OTHER FINANCING USES 0 0 (125,457) (125,457) 3,790,380
16 BEGINNING FUND BALANCE 0 0 1,367,182 1,367,182 147,209
17 ENDING FUND BALANCE $0 $0 $1,241,725 $1,241,725 $3,937,588
This Monthly Financial Report was distributed to the Little RockBoard of Directors on October 27, 2017. 12
For the Period Ended June 30, 2017(Unaudited)
City of Little Rock, ArkansasMonthly Financial ReportShort Term Capital Fund

YTD VarianceYTD Revenues and Favorable Jun 30, 2016
Budget Budget Expenditures (Unfavorable) UnauditedREVENUES:
1 3/8 Cent Sales Tax $0 $0 $9,180,986 $9,180,986 $8,873,6792 Interest income 0 0 532,638 532,638 194,7933 Miscellaneous Income 0 0 0 0 04 TOTAL REVENUES 0 0 9,713,624 9,713,624 9,068,472
EXPENDITURES:5 General Government 0 0 4,634,969 (4,634,969) 1,420,0556 Housing 0 0 63,333 (63,333) 27,6507 Public Works 0 0 15,900,799 (15,900,799) 4,524,6678 Parks and Recreation 0 0 489,809 (489,809) 3,853,0189 Fire 0 0 77,912 (77,912) 11,623
10 Police 0 0 394,647 (394,647) 1,361,89011 Fleet 0 0 85,544 (85,544) 1,63912 Zoo 0 0 364,950 (364,950) 410,16913 TOTAL EXPENDITURES 0 0 22,011,962 (22,011,962) 11,610,711
14 REVENUES OVER (UNDER) EXPENDITURES 0 0 (12,298,338) (12,298,338) (2,542,239)
OTHER FINANCING SOURCES (USES):15 Temporary Note Proceeds 0 0 0 0 016 Transfers Out 0 0 (4,180,570) (4,180,570) (3,657,651)
REVENUES AND OTHER FINANCING SOURCES OVER (UNDER)17 EXPENDITURES AND OTHER FINANCING USES 0 0 (16,478,908) (16,478,908) (6,199,891)
18 BEGINNING FUND BALANCE 0 0 38,727,097 38,727,097 29,813,516
19 ENDING FUND BALANCE $0 $0 $22,248,189 $22,248,189 $23,613,625
Expenditures include: Expended $10,261,627
Encumbered 11,750,335
Total $22,011,962
This Monthly Financial Report was distributed to the Little RockBoard of Directors on October 27, 2017. 13
For the Period Ended June 30, 2017(Unaudited)
City of Little Rock, ArkansasMonthly Financial Report
2012-2021 Capital Project Fund

YTD Variance YTD Revenues and Favorable Jun 30, 2016
Budget Budget Expenditures (Unfavorable) UnauditedREVENUES:
1 Intergovernmental $0 $0 $0 $0 $02 Charges for Services 0 0 0 0 03 Interest income 0 0 - - 755 4 TOTAL REVENUES 0 0 0 0 755
EXPENDITURES:5 Public Works 0 0 0 0 168,3896 Housing 0 0 0 0 07 TOTAL EXPENDITURES 0 0 0 0 168,389
8 REVENUES OVER (UNDER) EXPENDITURES 0 0 0 0 (167,634)
OTHER FINANCING SOURCES (USES):9 Transfer In 0 0 0 0 0
10 Transfers Out 0 0 0 0 0
REVENUES AND OTHER FINANCING SOURCES OVER (UNDER)11 EXPENDITURES AND OTHER FINANCING USES 0 0 - 0 (167,634)
12 BEGINNING FUND BALANCE 0 0 0 0 160,039
13 ENDING FUND BALANCE (Note 1) $0 $0 $0 $0 ($7,595)
Note 1: As of June 30, 2017, the fund balance has been allocated to special projects,including an infrastructure reserve in the amount of $.
This Monthly Financial Report was distributed to the Little RockBoard of Directors on October 27, 2017. 14
(Unaudited)
City of Little Rock, ArkansasMonthly Financial Report
1998 Capital Improvement FundFor the Period Ended June 30, 2017

YTD VarianceYTD Revenues and Favorable Jun 30, 2016
Budget Budget Expenditures (Unfavorable) UnauditedREVENUES:
1 Interest income $0 $0 $35 $35 $422 Miscellaneous 0 0 0 0 03 TOTAL REVENUES 0 0 35 35 42
EXPENDITURES:4 General Government 0 0 84 (84) 845 TOTAL EXPENDITURES 0 0 84 (84) 84
6 REVENUES OVER (UNDER) EXPENDITURES 0 0 (49) (49) (42)
OTHER FINANCING SOURCES (USES):7 Bond Proceeds 0 0 0 0 08 Transfers In 0 0 0 0 09 Transfers Out 0 0 0 0 0
REVENUES AND OTHER FINANCING SOURCES OVER (UNDER)10 EXPENDITURES AND OTHER FINANCING USES 0 0 (49) (49) (42)
11 BEGINNING FUND BALANCE 0 0 1,872 1,872 5,835
12 ENDING FUND BALANCE $0 $0 $1,823 $1,823 $5,794
Note 1: As of June 30, 2017, the fund balance has been allocated to 3 special projects.
This Monthly Financial Report was distributed to the Little RockBoard of Directors on October 27, 2017. 15
(Unaudited)
City of Little Rock, ArkansasMonthly Financial Report
2004 Capital ImprovementsFor the Period Ended June 30, 2017

YTD VarianceYTD Revenues and Favorable Jun 30, 2016
Budget Budget Expenditures (Unfavorable) ActualREVENUES:
1 Interest income $0 $0 $4 $4 ($13,781)2 Miscellaneous 0 0 0 0 03 TOTAL REVENUES 0 0 4 4 (13,781)
EXPENDITURES:4 General Government 0 0 0 0 2,037,1505 TOTAL EXPENDITURES 0 0 0 0 2,037,150
6 REVENUES OVER (UNDER) EXPENDITURES 0 0 4 4 (2,050,931)
OTHER FINANCING SOURCES (USES):7 Bond Proceeds 0 0 0 0 08 Transfers In 0 0 0 0 09 Transfers Out 0 0 0 0 0
REVENUES AND OTHER FINANCING SOURCES OVER (UNDER)10 EXPENDITURES AND OTHER FINANCING USES 0 0 4 4 (2,050,931)
11 BEGINNING FUND BALANCE 0 0 879 879 2,721,541
12 ENDING FUND BALANCE $0 $0 $883 $883 $670,610
Note 1: This fund reflects bond proceeds and interest earnings dedicated to Library improvements.
This Monthly Financial Report was distributed to the Little RockBoard of Directors on October 27, 2017. 16
(Unaudited)
City of Little Rock, ArkansasMonthly Financial Report
2012 Library Improvement BondFor the Period Ended June 30, 2017

YTD VarianceYTD Revenues and Favorable Jun 30, 2016
Budget Budget Expenditures (Unfavorable) ActualREVENUES:
1 Interest income $0 $0 21,073 $21,073 $79,7172 Miscellaneous 0 0 - 0 03 TOTAL REVENUES 0 0 21,073 21,073 79,717
EXPENDITURES:4 General Government 0 0 4,120,800 (4,120,800) 2,666,0335 TOTAL EXPENDITURES 0 0 4,120,800 (4,120,800) 2,666,033
6 REVENUES OVER (UNDER) EXPENDITURES 0 0 (4,099,728) (4,099,728) (2,586,315)
OTHER FINANCING SOURCES (USES):7 Bond Proceeds 0 0 - 0 08 Discount on Bonds Issued 0 0 - 0 09 Bond Reoffering Premium 0 0 - 0 0
10 Other, net 0 0 - 0 011 Transfers In 0 0 - 0 012 Transfers Out 0 0 - 0 0
REVENUES AND OTHER FINANCING SOURCES OVER (UNDER)13 EXPENDITURES AND OTHER FINANCING USES 0 0 (4,099,728) (4,099,728) (2,586,315)
14 BEGINNING FUND BALANCE 0 0 10,600,674 10,600,674 18,353,173
15 ENDING FUND BALANCE $0 $0 $6,500,946 $6,500,946 $15,766,857
Note 1: This fund reflects bond proceeds and interest earnings dedicated to Library improvements.
This Monthly Financial Report was distributed to the Little RockBoard of Directors on October 27, 2017. 17
City of Little Rock, ArkansasMonthly Financial Report
2015 Library Improvement BondFor the Period Ended June 30, 2017
(Unaudited)
YTD VarianceYTD Revenues and Favorable Jun 30, 2016
Budget Budget Expenditures (Unfavorable) UnauditedREVENUES:
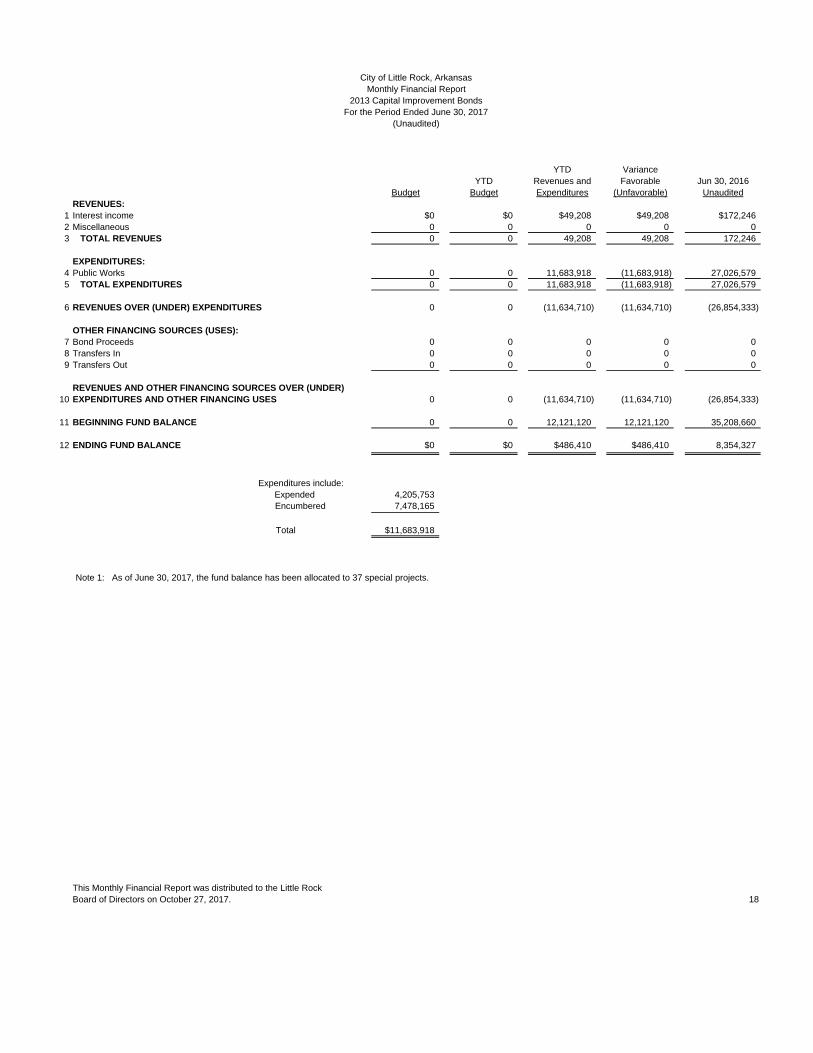
1 Interest income $0 $0 $49,208 $49,208 $172,2462 Miscellaneous 0 0 0 0 03 TOTAL REVENUES 0 0 49,208 49,208 172,246
EXPENDITURES:4 Public Works 0 0 11,683,918 (11,683,918) 27,026,5795 TOTAL EXPENDITURES 0 0 11,683,918 (11,683,918) 27,026,579
6 REVENUES OVER (UNDER) EXPENDITURES 0 0 (11,634,710) (11,634,710) (26,854,333)
OTHER FINANCING SOURCES (USES):7 Bond Proceeds 0 0 0 0 08 Transfers In 0 0 0 0 09 Transfers Out 0 0 0 0 0
REVENUES AND OTHER FINANCING SOURCES OVER (UNDER)10 EXPENDITURES AND OTHER FINANCING USES 0 0 (11,634,710) (11,634,710) (26,854,333)
11 BEGINNING FUND BALANCE 0 0 12,121,120 12,121,120 35,208,660
12 ENDING FUND BALANCE $0 $0 $486,410 $486,410 8,354,327
Expenditures include: Expended 4,205,753
Encumbered 7,478,165
Total $11,683,918
Note 1: As of June 30, 2017, the fund balance has been allocated to 37 special projects.
This Monthly Financial Report was distributed to the Little RockBoard of Directors on October 27, 2017. 18
City of Little Rock, ArkansasMonthly Financial Report
2013 Capital Improvement BondsFor the Period Ended June 30, 2017
(Unaudited)

YTD VarianceYTD Revenues and Favorable Jun 30, 2016
Budget Budget Expenditures (Unfavorable) UnauditedREVENUES:
1 Interest income $0 $0 $24 $24 $22 Miscellaneous 0 0 0 0 03 TOTAL REVENUES 0 0 24 24 2
EXPENDITURES:4 Public Works 0 0 0 0 05 TOTAL EXPENDITURES 0 0 0 0 0
6 REVENUES OVER (UNDER) EXPENDITURES 0 0 24 24 2
OTHER FINANCING SOURCES (USES):7 Bond Proceeds 0 0 0 0 08 Transfers In 0 0 0 0 09 Transfers Out 0 0 0 0 0
REVENUES AND OTHER FINANCING SOURCES OVER (UNDER)10 EXPENDITURES AND OTHER FINANCING USES 0 0 24 24 2
11 BEGINNING FUND BALANCE 0 0 6 6 2
12 ENDING FUND BALANCE $0 $0 $30 $30 $4
Expenditures include: Expended -
Encumbered -
Total $0
This Monthly Financial Report was distributed to the Little RockBoard of Directors on October 27, 2017. 19
City of Little Rock, ArkansasMonthly Financial Report
2014 TIF #1 Capital Improvement BondFor the Period Ended June 30, 2017
(Unaudited)

YTD VarianceYTD Revenues and Favorable Jun 30, 2016
Budget Budget Expenditures (Unfavorable) UnauditedREVENUES:
1 General Property Taxes $0 $0 $23,661 $23,661 $13,5272 Interest income 0 0 8,576 8,576 2,5673 Miscellaneous 0 0 0 0 04 TOTAL REVENUES 0 0 32,237 32,237 16,095
EXPENDITURES:5 Street & Drainage 0 0 528,000 (528,000) 06 TOTAL EXPENDITURES 0 0 528,000 (528,000) 0
7 REVENUES OVER (UNDER) EXPENDITURES 0 0 (495,763) (495,763) 16,095
OTHER FINANCING SOURCES (USES):8 Bond Proceeds 0 0 0 0 09 Transfers In 0 0 0 0 0
10 Transfers Out 0 0 0 0 0
REVENUES AND OTHER FINANCING SOURCES OVER (UNDER)11 EXPENDITURES AND OTHER FINANCING USES 0 0 (495,763) (495,763) 16,095
12 BEGINNING FUND BALANCE 0 0 700,454 700,454 562,882
13 ENDING FUND BALANCE $0 $0 $204,691 $204,691 $578,977
This Monthly Financial Report was distributed to the Little RockBoard of Directors on October 27, 2017. 20
City of Little Rock, ArkansasMonthly Financial ReportTIF - Port Authority Fund
For the Period Ended June 30, 2017(Unaudited)

YTD Variance YTD Revenues and Favorable Jun 30, 2016
Budget Budget Expenditures (Unfavorable) UnauditedREVENUES:
1 Franchise Fees $0 $0 $0 $0 $02 Charges for Services 0 0 1,308,100 1,308,100 1,308,1003 Interest income 0 0 7,483 7,483 5,3904 TOTAL REVENUES 0 0 1,315,583 1,315,583 1,313,490
EXPENDITURES:5 Issuance Cost 0 0 0 0 06 Debt Service 0 0 849,785 (849,785) 846,5617 TOTAL EXPENDITURES 0 0 849,785 (849,785) 846,561
8 REVENUES OVER (UNDER) EXPENDITURES 0 0 465,798 465,798 466,929
OTHER FINANCING SOURCES (USES):9 Bond Proceeds 0 0 0 0 0
10 Bond Reoffering Premium 0 0 0 0 011 Discount on Bonds Issued 0 0 0 0 012 Payment to Refunded Bond Escrow Agent 0 0 0 0 013 Transfer In 0 0 0 0 014 Transfers Out 0 0 0 0 0
REVENUES AND OTHER FINANCING SOURCES OVER (UNDER)15 EXPENDITURES AND OTHER FINANCING USES 0 0 465,798 465,798 466,929
16 BEGINNING FUND BALANCE 0 0 2,245,989 2,245,989 2,237,185
17 ENDING FUND BALANCE $0 $0 $2,711,787 $2,711,787 $2,704,114
This Monthly Financial Report was distributed to the Little RockBoard of Directors on October 27, 2017. 21
(Unaudited)
City of Little Rock, ArkansasMonthly Financial Report
2009A Parks & Recreation Debt Service FundFor the Period Ended June 30, 2017

YTD Variance YTD Revenues and Favorable Jun 30, 2016
Budget Budget Expenditures (Unfavorable) UnauditedREVENUES:
1 Franchise Fees $0 $0 $1,438,375 $1,438,375 $1,438,3752 Interest income 0 0 3,521 3,521 9,4693 TOTAL REVENUES 0 0 1,441,896 1,441,896 1,447,844
EXPENDITURES:4 Issuance Cost 0 0 0 0 05 Debt Service 0 0 89,875 (89,875) 119,8756 TOTAL EXPENDITURES 0 0 89,875 (89,875) 119,875
7 REVENUES OVER (UNDER) EXPENDITURES 0 0 1,352,021 1,352,021 1,327,969
OTHER FINANCING SOURCES (USES):8 Bond Proceeds 0 0 0 0 09 Bond Reoffering Premium 0 0 0 0 0
10 Discount on Bonds Issued 0 0 0 0 011 Payment to Refunded Bond Escrow Agent 0 0 0 0 012 Transfer In 0 0 0 0 013 Transfers Out 0 0 0 0 0
REVENUES AND OTHER FINANCING SOURCES OVER (UNDER)14 EXPENDITURES AND OTHER FINANCING USES 0 0 1,352,021 1,352,021 1,327,969
15 BEGINNING FUND BALANCE 0 0 43,799 43,799 33,028
16 ENDING FUND BALANCE $0 $0 $1,395,820 $1,395,820 $1,360,997
This Monthly Financial Report was distributed to the Little RockBoard of Directors on October 27, 2017. 22
(Unaudited)
City of Little Rock, ArkansasMonthly Financial Report
2007 Infrastructure Debt Service FundFor the Period Ended June 30, 2017

YTD Variance YTD Revenues and Favorable Jun 30, 2016
Budget Budget Expenditures (Unfavorable) UnauditedREVENUES:
1 Franchise Fees $0 $0 $322,838 $322,838 $320,2982 Interest income 0 0 879 879 2,2123 TOTAL REVENUES 0 0 323,716 323,716 322,509
EXPENDITURES:4 Debt Service 0 0 14,606 (14,606) 20,8365 TOTAL EXPENDITURES 0 0 14,606 (14,606) 20,836
6 REVENUES OVER (UNDER) EXPENDITURES 0 0 309,110 309,110 301,673
OTHER FINANCING SOURCES (USES):7 Transfer In 0 0 0 0 08 Transfers Out 0 0 0 0 0
REVENUES AND OTHER FINANCING SOURCES OVER (UNDER)9 EXPENDITURES AND OTHER FINANCING USES 0 0 309,110 309,110 301,673
10 BEGINNING FUND BALANCE 0 0 19,536 19,536 18,496
11 ENDING FUND BALANCE $0 $0 $328,646 $328,646 $320,169
This Monthly Financial Report was distributed to the Little RockBoard of Directors on October 27, 2017. 23
(Unaudited)
City of Little Rock, ArkansasMonthly Financial Report
2002 CIP Junior Lien Bonds Debt Service FundFor the Period Ended June 30, 2017

YTD Variance YTD Revenues and Favorable Jun 30, 2016
Budget Budget Expenditures (Unfavorable) UnauditedREVENUES:
1 Property Tax $0 $0 $0 $0 $02 Interest Income 0 0 0 0 3313 TOTAL REVENUES 0 0 0 0 331
EXPENDITURES:4 Debt Service 0 0 0 0 05 TOTAL EXPENDITURES 0 0 0 0 0
6 REVENUES OVER (UNDER) EXPENDITURES 0 0 0 0 331
OTHER FINANCING SOURCES (USES):7 Bond Proceeds 0 0 0 0 08 Payment to Refunded Bond Escrow Agent 0 0 0 0 09 Transfers In 0 0 0 0 0
10 Transfers Out 0 0 0 0 0
REVENUES AND OTHER FINANCING SOURCES OVER (UNDER)11 EXPENDITURES AND OTHER FINANCING USES 0 0 0 0 331
12 BEGINNING FUND BALANCE 0 0 0 0 100,316
13 ENDING FUND BALANCE $0 $0 $0 $0 $100,646
This Monthly Financial Report was distributed to the Little RockBoard of Directors on October 27, 2017. 24
(Unaudited)
City of Little Rock, ArkansasMonthly Financial Report
2008 & 2009 Library Improvement Bonds Debt Service FundFor the Period Ended June 30, 2017
YTD Variance YTD Revenues and Favorable Jun 30, 2016
Budget Budget Expenditures (Unfavorable) UnauditedREVENUES:
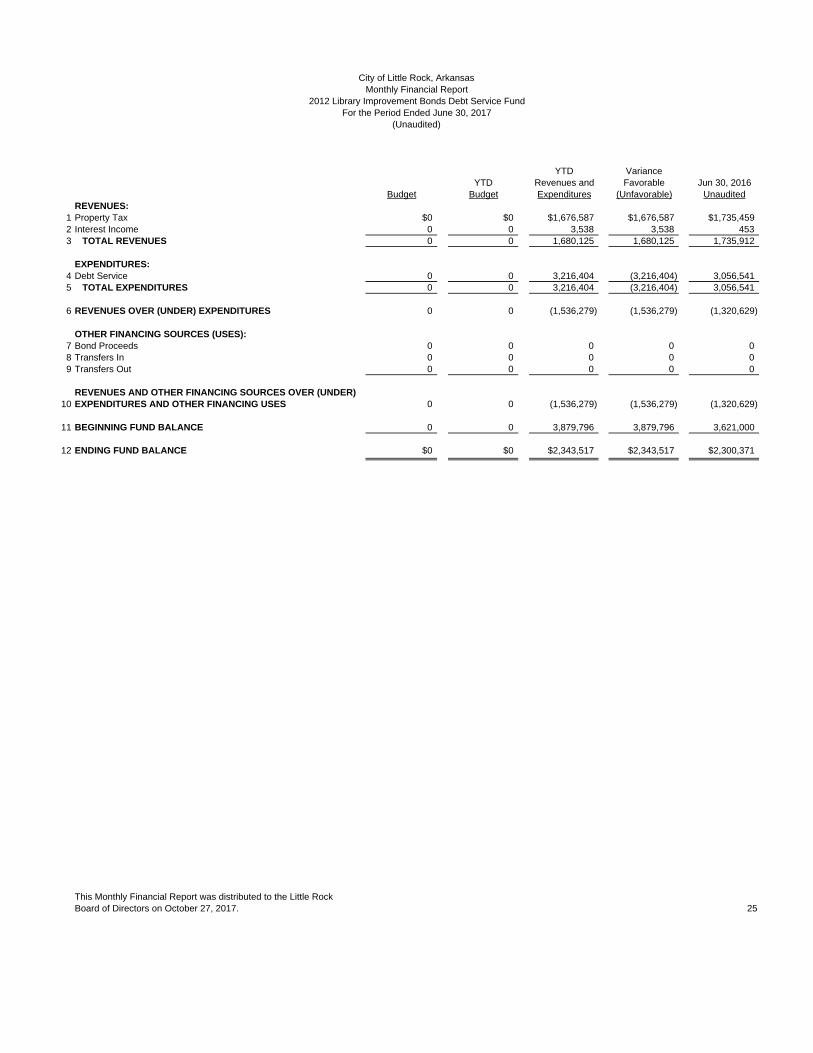
1 Property Tax $0 $0 $1,676,587 $1,676,587 $1,735,4592 Interest Income 0 0 3,538 3,538 4533 TOTAL REVENUES 0 0 1,680,125 1,680,125 1,735,912
EXPENDITURES:4 Debt Service 0 0 3,216,404 (3,216,404) 3,056,5415 TOTAL EXPENDITURES 0 0 3,216,404 (3,216,404) 3,056,541
6 REVENUES OVER (UNDER) EXPENDITURES 0 0 (1,536,279) (1,536,279) (1,320,629)
OTHER FINANCING SOURCES (USES):7 Bond Proceeds 0 0 0 0 08 Transfers In 0 0 0 0 09 Transfers Out 0 0 0 0 0
REVENUES AND OTHER FINANCING SOURCES OVER (UNDER)10 EXPENDITURES AND OTHER FINANCING USES 0 0 (1,536,279) (1,536,279) (1,320,629)
11 BEGINNING FUND BALANCE 0 0 3,879,796 3,879,796 3,621,000
12 ENDING FUND BALANCE $0 $0 $2,343,517 $2,343,517 $2,300,371
This Monthly Financial Report was distributed to the Little RockBoard of Directors on October 27, 2017. 25
(Unaudited)
City of Little Rock, ArkansasMonthly Financial Report
2012 Library Improvement Bonds Debt Service FundFor the Period Ended June 30, 2017

YTD Variance YTD Revenues and Favorable Jun 30, 2016
Budget Budget Expenditures (Unfavorable) UnauditedREVENUES:
1 Property Tax $0 $0 $1,676,587 $1,676,587 $1,719,9932 Interest Income 0 0 2,468 2,468 283 TOTAL REVENUES 0 0 1,679,055 1,679,055 1,720,021
EXPENDITURES:4 Debt Service 0 0 2,462,306 (2,462,306) 303,0215 TOTAL EXPENDITURES 0 0 2,462,306 (2,462,306) 303,021
6 REVENUES OVER (UNDER) EXPENDITURES 0 0 (783,252) (783,252) 1,417,000
OTHER FINANCING SOURCES (USES):7 Bond Proceeds 0 0 0 0 08 Transfers In 0 0 0 0 09 Transfers Out 0 0 0 0 0
REVENUES AND OTHER FINANCING SOURCES OVER (UNDER)10 EXPENDITURES AND OTHER FINANCING USES 0 0 (783,252) (783,252) 1,417,000
11 BEGINNING FUND BALANCE 0 0 3,057,407 3,057,407 136,121
12 ENDING FUND BALANCE $0 $0 $2,274,155 $2,274,155 $1,553,121
This Monthly Financial Report was distributed to the Little RockBoard of Directors on October 27, 2017. 26
City of Little Rock, ArkansasMonthly Financial Report
2015 Library Improvement Bonds Debt Service FundFor the Period Ended June 30, 2017
(Unaudited)

YTD Variance YTD Revenues and Favorable Jun 30, 2016
Budget Budget Expenditures (Unfavorable) UnauditedREVENUES:
1 Property Tax $0 $0 $5,582,225 $5,582,225 $5,721,2212 Interest Income 0 0 20,989 20,989 7,5633 Miscellaneous 0 0 0 0 04 TOTAL REVENUES 0 0 5,603,214 5,603,214 5,728,783
EXPENDITURES:5 Debt Service 0 0 11,225,319 (11,225,319) 10,652,8246 TOTAL EXPENDITURES 0 0 11,225,319 (11,225,319) 10,652,824
7 REVENUES OVER (UNDER) EXPENDITURES 0 0 (5,622,105) (5,622,105) (4,924,041)
OTHER FINANCING SOURCES (USES):8 Bond Proceeds 0 0 0 0 09 Transfers In 0 0 0 0 0
10 Transfers Out 0 0 0 0 0
REVENUES AND OTHER FINANCING SOURCES OVER (UNDER)11 EXPENDITURES AND OTHER FINANCING USES 0 0 (5,622,105) (5,622,105) (4,924,041)
12 BEGINNING FUND BALANCE 0 0 12,363,961 12,363,961 11,295,331
13 ENDING FUND BALANCE $0 $0 $6,741,856 $6,741,856 $6,371,289
This Monthly Financial Report was distributed to the Little RockBoard of Directors on October 27, 2017. 27
City of Little Rock, ArkansasMonthly Financial Report
2013 Capital Improvement Bonds Debt Service FundFor the Period Ended June 30, 2017
(Unaudited)

YTD Variance YTD Revenues and Favorable Jun 30, 2016
Budget Budget Expenditures (Unfavorable) UnauditedREVENUES:
1 Property Tax $0 $0 $96,774 $96,774 $02 Interest Income 0 0 818 818 2,4293 Miscellaneous 0 0 0 0 04 TOTAL REVENUES 0 0 97,591 97,591 2,429
EXPENDITURES:5 Debt Service 0 0 78,450 (78,450) 78,4506 TOTAL EXPENDITURES 0 0 78,450 (78,450) 78,450
7 REVENUES OVER (UNDER) EXPENDITURES 0 0 19,141 19,141 (76,021)
OTHER FINANCING SOURCES (USES):8 Bond Proceeds 0 0 0 0 09 Transfers In 0 0 0 0 0
10 Transfers Out 0 0 0 0 0
REVENUES AND OTHER FINANCING SOURCES OVER (UNDER)11 EXPENDITURES AND OTHER FINANCING USES 0 0 19,141 19,141 (76,021)
12 BEGINNING FUND BALANCE 0 0 247,279 247,279 350,216
13 ENDING FUND BALANCE $0 $0 $266,420 $266,420 $274,196
This Monthly Financial Report was distributed to the Little RockBoard of Directors on October 27, 2017. 28
City of Little Rock, ArkansasMonthly Financial Report
2014 TIF #1 Capital Improvement Bonds Debt Service FundFor the Period Ended June 30, 2017
(Unaudited)

YTD Variance YTD Revenues and Favorable Jun 30, 2016
Budget Budget Expenditures (Unfavorable) UnauditedOPERATING REVENUES:
1 Charges for services $12,241,727 $6,120,864 $5,937,167 ($183,697) $5,783,2362 Interest Income 0 0 0 0 03 TOTAL OPERATING REVENUES 12,241,727 6,120,864 5,937,167 (183,697) 5,783,236
OPERATING EXPENSES:4 Personnel Services 3,707,793 1,853,897 1,668,774 185,123 1,783,5935 Supplies and materials 5,227,640 2,613,820 2,028,012 585,808 2,084,1576 Services and other expenses 2,529,201 1,264,601 1,158,157 106,443 1,073,0427 Repairs and maintenance 529,965 264,983 93,648 171,334 92,5348 Capital outlay 0 0 0 0 09 Depreciation and amortization 237,953 118,977 140,996 (22,019) 92,883
10 TOTAL OPERATING EXPENSES 12,232,552 6,116,276 5,089,587 1,026,689 5,126,20711 OPERATING INCOME/(LOSS) 9,175 4,588 847,579 842,992 657,029
NONOPERATING REVENUES/(EXPENSES):12 Investment income 0 0 23,405 23,405 7,36413 Grants received 0 0 0 0 014 Interest expense 0 0 0 0 015 Gain (loss) on disposal of fixed assets 0 0 0 0 016 Other, net 0 0 0 0 017 INCOME (LOSS) BEFORE OPERATING TRANSFERS 9,175 4,588 870,984 866,397 664,393
OPERATING TRANSFERS:18 Operating transfers in 0 0 0 0 019 Operating transfers out 0 0 0 0 020 NET INCOME/(LOSS) 9,175 4,588 870,984 866,397 664,393
21 BEGINNING NET POSITION 5,255,767 5,255,767 5,255,767 0 4,255,387
22 ENDING NET POSITION $5,264,942 $5,260,355 $6,126,751 $866,397 $4,919,780
Cash Operating $2,661,547 Debt Reserve - Receivable 22,415 Inventory 477,336 Capital Assets, net 3,414,780 Other Assets 432,526 Liabilities (881,852)
Net Position $6,126,751
This Monthly Financial Report was distributed to the Little RockBoard of Directors on October 27, 2017. 29
Analysis of Net Position
(Unaudited)
City of Little Rock, ArkansasMonthly Financial Report
Fleet Services FundFor the Period Ended June 30, 2017

YTD VarianceYTD Revenues and Favorable Jun 30, 2016
Budget Budget Expenditures (Unfavorable) UnauditedOPERATING REVENUES:
1 Licenses and permits $22,300 $11,150 $18,595 $7,445 $02 Charges for services 1,353,710 676,855 738,856 62,001 715,5123 Other 0 0 0 0 04 TOTAL OPERATING REVENUES 1,376,010 688,005 757,451 69,446 715,512
OPERATING EXPENSES:5 Personnel Services 712,530 356,265 344,945 11,320 349,9156 Supplies and materials 39,270 19,635 17,386 2,249 18,2777 Services and other expenses 570,850 285,425 263,781 21,644 291,8888 Repairs and maintenance 21,460 10,730 7,605 3,125 16,2309 Capital outlay 0 0 0 0 0
10 Depreciation and amortization 31,900 15,950 13,459 2,491 13,21011 TOTAL OPERATING EXPENSES 1,376,010 688,005 647,175 40,830 689,52012 OPERATING INCOME/(LOSS) 0 0 110,276 110,276 25,992
NONOPERATING REVENUES/(EXPENSES):13 Investment income 0 0 92 92 014 Grants received 0 0 0 0 015 Interest expense 0 0 0 0 016 Gain (loss) on disposal of fixed assets 0 0 0 0 017 Other, net 0 0 0 0 018 INCOME (LOSS) BEFORE OPERATING TRANSFERS 0 0 110,368 110,368 25,992
OPERATING TRANSFERS:19 Operating transfers in 0 0 0 0 020 Operating transfers out 0 0 0 0 021 NET INCOME/(LOSS) 0 0 110,368 110,368 25,992
22 BEGINNING NET POSITION (919,314) (919,314) (919,314) 0 (786,455)
23 ENDING NET POSITION ($919,314) ($919,314) ($808,946) $110,368 ($760,463)
Cash Operating ($731,984) Debt Reserve 0Receivable 0Inventory 0Capital Assets, net 111,593Other Assets 42,052Liabilities (230,607)
Net Position ($808,946)
This Monthly Financial Report was distributed to the Little RockBoard of Directors on October 27, 2017. 30
Analysis of Net Position
(Unaudited)
City of Little Rock, ArkansasMonthly Financial Report
Vehicle Storage Facility FundFor the Period Ended June 30, 2017
YTD Variance
YTD Revenues and Favorable Jun 30, 2016Budget Budget Expenditures (Unfavorable) Unaudited
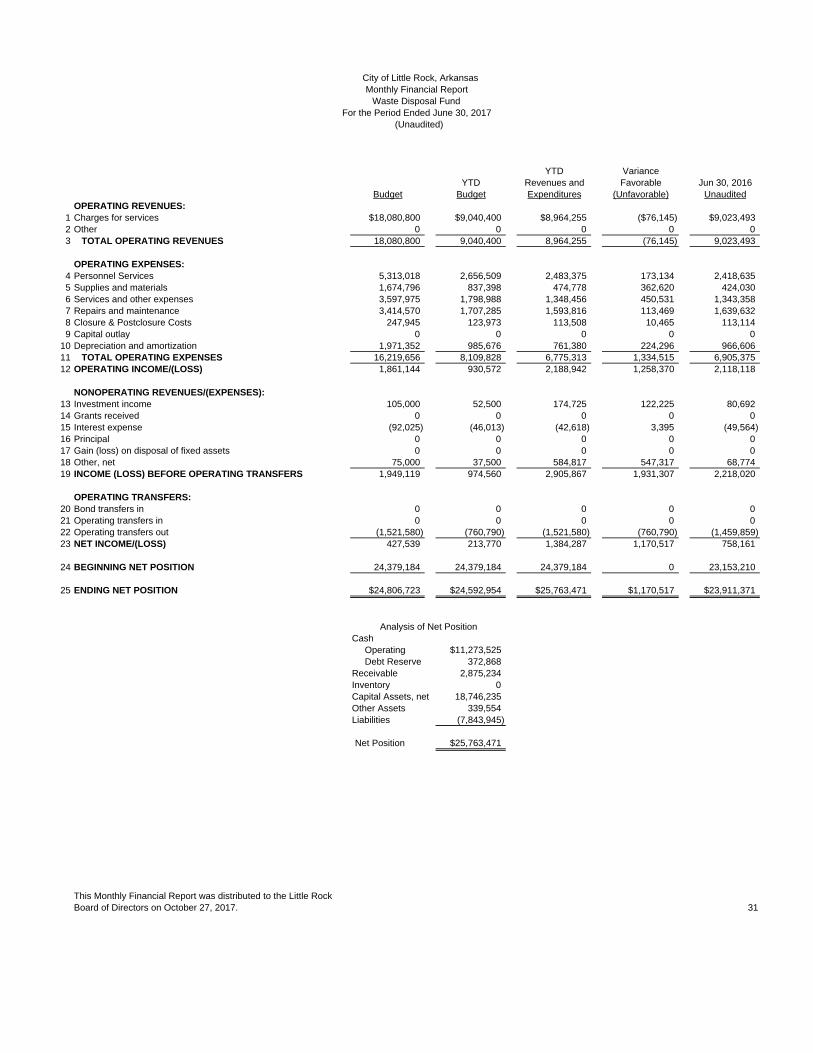
OPERATING REVENUES:1 Charges for services $18,080,800 $9,040,400 $8,964,255 ($76,145) $9,023,4932 Other 0 0 0 0 03 TOTAL OPERATING REVENUES 18,080,800 9,040,400 8,964,255 (76,145) 9,023,493
OPERATING EXPENSES:4 Personnel Services 5,313,018 2,656,509 2,483,375 173,134 2,418,6355 Supplies and materials 1,674,796 837,398 474,778 362,620 424,0306 Services and other expenses 3,597,975 1,798,988 1,348,456 450,531 1,343,3587 Repairs and maintenance 3,414,570 1,707,285 1,593,816 113,469 1,639,6328 Closure & Postclosure Costs 247,945 123,973 113,508 10,465 113,1149 Capital outlay 0 0 0 0 0
10 Depreciation and amortization 1,971,352 985,676 761,380 224,296 966,60611 TOTAL OPERATING EXPENSES 16,219,656 8,109,828 6,775,313 1,334,515 6,905,37512 OPERATING INCOME/(LOSS) 1,861,144 930,572 2,188,942 1,258,370 2,118,118
NONOPERATING REVENUES/(EXPENSES):13 Investment income 105,000 52,500 174,725 122,225 80,69214 Grants received 0 0 0 0 015 Interest expense (92,025) (46,013) (42,618) 3,395 (49,564)16 Principal 0 0 0 0 017 Gain (loss) on disposal of fixed assets 0 0 0 0 018 Other, net 75,000 37,500 584,817 547,317 68,77419 INCOME (LOSS) BEFORE OPERATING TRANSFERS 1,949,119 974,560 2,905,867 1,931,307 2,218,020
OPERATING TRANSFERS:
20 Bond transfers in 0 0 0 0 021 Operating transfers in 0 0 0 0 022 Operating transfers out (1,521,580) (760,790) (1,521,580) (760,790) (1,459,859)23 NET INCOME/(LOSS) 427,539 213,770 1,384,287 1,170,517 758,161
24 BEGINNING NET POSITION 24,379,184 24,379,184 24,379,184 0 23,153,210
25 ENDING NET POSITION $24,806,723 $24,592,954 $25,763,471 $1,170,517 $23,911,371
Cash Operating $11,273,525 Debt Reserve 372,868Receivable 2,875,234Inventory 0Capital Assets, net 18,746,235Other Assets 339,554Liabilities (7,843,945)
Net Position $25,763,471
This Monthly Financial Report was distributed to the Little RockBoard of Directors on October 27, 2017. 31
Analysis of Net Position
(Unaudited)
City of Little Rock, ArkansasMonthly Financial Report
Waste Disposal FundFor the Period Ended June 30, 2017

YTD VarianceYTD Revenues and Favorable Jun 30, 2016
Budget Budget Expenditures (Unfavorable) UnauditedOPERATING REVENUES:
1 Statehouse Parking $861,120 $430,560 $429,350 ($1,210) $379,8622 RiverMarket Parking 860,400 430,200 392,881 (37,319) 401,6453 Business Licenses 275,600 137,800 265,085 127,285 275,6004 Street Repairs 345,300 172,650 106,436 (66,214) 191,0065 Parking Meters 460,000 230,000 226,919 (3,081) 229,2886 Other 0 0 0 0 07 TOTAL OPERATING REVENUES 2,802,420 1,401,210 1,420,670 19,460 1,477,400
OPERATING EXPENSES:8 Statehouse Parking 485,640 242,820 246,215 (3,395) 293,7839 RiverMarket Parking 640,265 320,133 324,608 (4,476) 441,350
10 Other 128,000 64,000 0 64,000 011 Depreciation and amortization 269,097 134,549 134,548 0 120,77512 TOTAL OPERATING EXPENSES 1,523,002 761,501 705,371 56,130 855,90913 OPERATING INCOME/(LOSS) 1,279,418 639,709 715,300 75,591 621,491
NONOPERATING REVENUES/(EXPENSES):14 Investment income 8,550 4,275 15,402 11,127 4,20215 Debt Service 0 0 0 0 016 Interest expense (459,161) (229,581) (235,029) (5,449) (229,839)17 Principal 0 0 0 0 018 Gain (loss) on disposal of fixed assets 0 0 0 0 019 Other, net 500 250 0 (250) (16,118)20 INCOME (LOSS) BEFORE OPERATING TRANSFERS 829,307 414,654 495,672 81,019 379,737
OPERATING TRANSFERS:21 Operating transfers in 0 0 0 0 022 Operating transfers out (359,026) (179,513) 0 179,513 023 NET INCOME/(LOSS) 470,281 235,141 495,672 260,532 379,737
24 BEGINNING NET POSITION 1,121,285 1,121,285 1,121,285 0 612,948
25 ENDING NET POSITION $1,591,566 $1,356,426 $1,616,957 $260,532 $992,685
Cash Operating $1,130,092 Debt Reserve 1,678,897Receivable 37,368Inventory 0Capital Assets, net 6,581,331Other Assets 328,345Liabilities (8,139,076)
Net Position $1,616,957
This Monthly Financial Report was distributed to the Little RockBoard of Directors on October 27, 2017. 32
Analysis of Net Position
(Unaudited)
City of Little Rock, ArkansasMonthly Financial Report
Rivermarket Garage FundFor the Period Ended June 30, 2017

YTD VarianceYTD Revenues and Favorable Jun 30, 2016
Budget Budget Expenditures (Unfavorable) UnauditedADDITIONS:
Contributions:1 Employer $0 $0 $0 $0 $02 Plan members 0 0 0 0 03 General property taxes 0 0 0 0 04 State insurance turnback and guarantee fund 0 0 0 0 05 Other 0 0 0 0 06 Total Contributions 0 0 0 0 0
Investment income (loss):7 Net increase (decrease) in fair value of investments 0 0 0 0 08 Interest and dividends 0 0 0 0 09 0 0 0 0 0
10 Less investment expense 0 0 0 0 011 Net investment income (loss) 0 0 0 0 012 TOTAL ADDITIONS 0 0 0 0 0
DEDUCTIONS:13 Benefits paid directly to participants 0 0 0 0 014 Administrative expenses 0 0 0 0 015 Other Deductions 0 0 0 0 016 TOTAL DEDUCTIONS 0 0 0 0 017 NET INCREASE (DECREASE) 0 0 0 0 0
18 NET POSITION HELD IN TRUST FOR PENSION BENEFITS, BEGINNING 0 0 1,744,382 1,744,382 2,205,615
19 NET POSITION HELD IN TRUST FOR PENSION BENEFITS, ENDING $0 $0 $1,744,382 $1,744,382 $2,205,615
Note 1: Administration of the Police Pension and Relief Fund was transferred to LOPFI in December 2013.
This Monthly Financial Report was distributed to the Little RockBoard of Directors on October 27, 2017. 33
(Unaudited)
City of Little Rock, ArkansasMonthly Financial Report
Police Pension and Relief FundFor the Period Ended June 30, 2017
YTD Variance
YTD Revenues and Favorable Jun 30, 2016Budget Budget Expenditures (Unfavorable) Unaudited
ADDITIONS:Contributions:
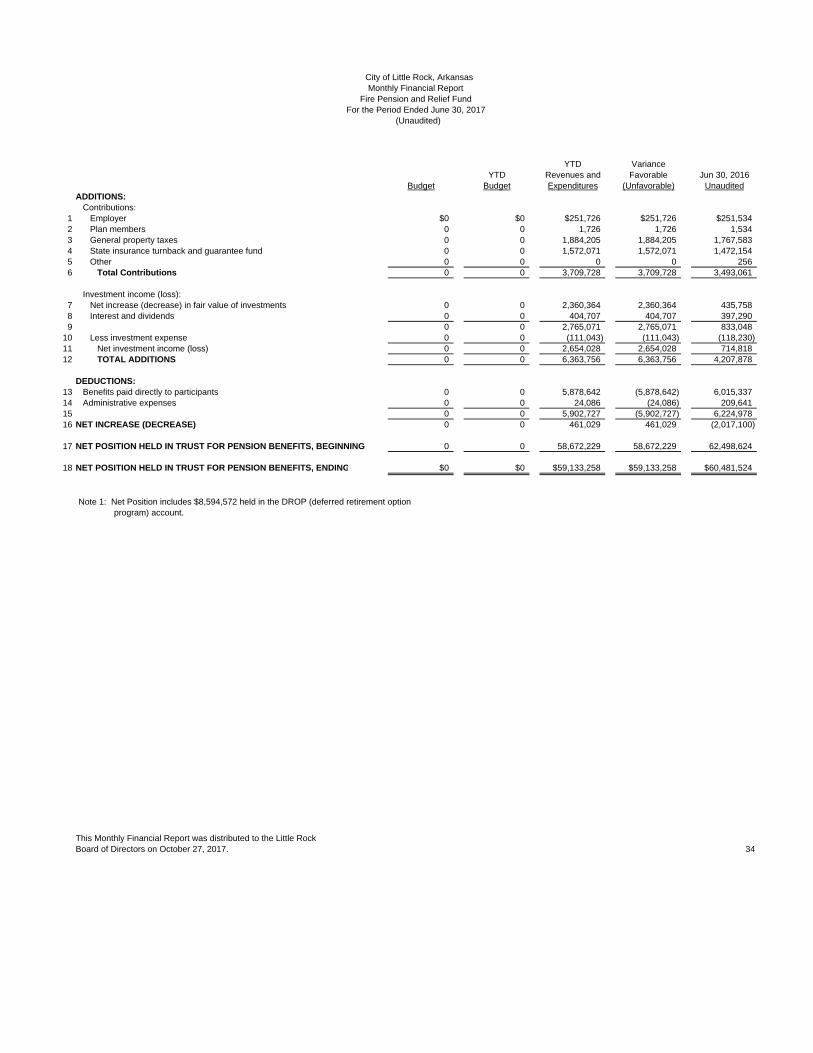
1 Employer $0 $0 $251,726 $251,726 $251,5342 Plan members 0 0 1,726 1,726 1,5343 General property taxes 0 0 1,884,205 1,884,205 1,767,5834 State insurance turnback and guarantee fund 0 0 1,572,071 1,572,071 1,472,1545 Other 0 0 0 0 2566 Total Contributions 0 0 3,709,728 3,709,728 3,493,061
Investment income (loss):7 Net increase (decrease) in fair value of investments 0 0 2,360,364 2,360,364 435,7588 Interest and dividends 0 0 404,707 404,707 397,2909 0 0 2,765,071 2,765,071 833,048
10 Less investment expense 0 0 (111,043) (111,043) (118,230)11 Net investment income (loss) 0 0 2,654,028 2,654,028 714,81812 TOTAL ADDITIONS 0 0 6,363,756 6,363,756 4,207,878
DEDUCTIONS:13 Benefits paid directly to participants 0 0 5,878,642 (5,878,642) 6,015,33714 Administrative expenses 0 0 24,086 (24,086) 209,64115 0 0 5,902,727 (5,902,727) 6,224,97816 NET INCREASE (DECREASE) 0 0 461,029 461,029 (2,017,100)
17 NET POSITION HELD IN TRUST FOR PENSION BENEFITS, BEGINNING 0 0 58,672,229 58,672,229 62,498,624
18 NET POSITION HELD IN TRUST FOR PENSION BENEFITS, ENDING $0 $0 $59,133,258 $59,133,258 $60,481,524
Note 1: Net Position includes $8,594,572 held in the DROP (deferred retirement option program) account.
This Monthly Financial Report was distributed to the Little RockBoard of Directors on October 27, 2017. 34
(Unaudited)
City of Little Rock, ArkansasMonthly Financial Report
Fire Pension and Relief FundFor the Period Ended June 30, 2017

YTD Variance
YTD Revenues and Favorable Jun 30, 2016Budget Budget Expenditures (Unfavorable) Unaudited
ADDITIONS:Contributions:
1 Employer $0 $0 $0 $0 $2,4962 Plan members 0 0 1,089 1,089 427,8083 General property taxes 0 0 0 0 04 State insurance turnback and guarantee fund 0 0 0 0 05 Other 0 0 2,778 2,778 3,2156 Total Contributions 0 0 3,866 3,866 433,519
Investment income (loss):7 Net increase (decrease) in fair value of investments 0 0 688,044 688,044 205,6118 Interest and dividends 0 0 117,150 117,150 108,7859 0 0 805,194 805,194 314,395
10 Less investment expense 0 0 (40,168) (40,168) (40,719)11 Net investment income (loss) 0 0 765,026 765,026 273,67612 TOTAL ADDITIONS 0 0 768,892 768,892 707,195
DEDUCTIONS:13 Benefits paid directly to participants 0 0 869,940 (869,940) 862,60614 Administrative expenses 0 0 0 0 015 TOTAL DEDUCTIONS 0 0 869,940 (869,940) 862,60616 NET INCREASE (DECREASE) 0 0 (101,047) (101,047) (155,411)
17 NET POSITION HELD IN TRUST FOR PENSION BENEFITS, BEGINNING 0 0 12,120,598 12,120,598 11,756,089
18 NET POSITION HELD IN TRUST FOR PENSION BENEFITS, ENDING $0 $0 $12,019,551 $12,019,551 $11,600,678
This Monthly Financial Report was distributed to the Little RockBoard of Directors on October 27, 2017. 35
(Unaudited)For the Period Ended June 30, 2017
City of Little Rock, ArkansasMonthly Financial Report
Non-Uniform Defined Benefit Fund

YTD Variance
YTD Revenues and Favorable Jun 30, 2016Budget Budget Expenditures (Unfavorable) Unaudited
ADDITIONS:Contributions:
1 Employer $0 $0 $70,819 $70,819 $273,2782 Plan members 0 0 58,952 58,952 39,5193 General property taxes 0 0 0 0 04 State insurance turnback and guarantee fund 0 0 0 0 05 Other 0 0 3,327 3,327 3,5236 Total Contributions 0 0 133,098 133,098 316,320
Investment income (loss):7 Net increase (decrease) in fair value of investments 0 0 (192,996) (192,996) 206,3538 Interest and dividends 0 0 141,195 141,195 122,2849 0 0 (51,800) (51,800) 328,637
10 Less investment expense 0 0 (31,831) (31,831) (30,547)11 Net investment income (loss) 0 0 (83,631) (83,631) 298,09012 TOTAL ADDITIONS 0 0 49,467 49,467 614,410
DEDUCTIONS:13 Benefits paid directly to participants 0 0 461,911 (461,911) 974,75114 Administrative expenses 0 0 0 0 015 TOTAL DEDUCTIONS 0 0 461,911 (461,911) 974,75116 NET INCREASE (DECREASE) 0 0 (412,444) (412,444) (360,342)
17 NET POSITION HELD IN TRUST FOR PENSION BENEFITS, BEGINNING 0 0 17,816,451 17,816,451 18,460,917
18 NET POSITION HELD IN TRUST FOR PENSION BENEFITS, ENDING $0 $0 $17,404,007 $17,404,007 $18,100,575
Note: The City implemented a new defined benefit plan for non-uniform employees in 2014. Employees were given the option topurchase prior service credit by rolling over assets from the Non-Uniform Defined Contribution Fund.
This Monthly Financial Report was distributed to the Little RockBoard of Directors on October 27, 2017. 36
City of Little Rock, Arkansas
(Unaudited)For the Period Ended June 30, 2017
Non-Uniform Defined Contribution FundMonthly Financial Report

YTD Variance
YTD Revenues and Favorable Jun 30, 2016Budget Budget Expenditures (Unfavorable) Unaudited
ADDITIONS:Contributions:
1 Employer $0 $0 $275,618 $275,618 $308,4372 Plan members 0 0 120,884 120,884 101,3253 General property taxes 0 0 0 0 04 State insurance turnback and guarantee fund 0 0 0 0 05 Other 0 0 0 0 06 Total Contributions 0 0 396,502 396,502 409,763
Investment income (loss):7 Net increase (decrease) in fair value of investments 0 0 641,267 641,267 08 Interest and dividends 0 0 0 0 83,0079 0 0 641,267 641,267 83,007
10 Less investment expense 0 0 0 0 011 Net investment income (loss) 0 0 641,267 641,267 83,00712 TOTAL ADDITIONS 0 0 1,037,769 1,037,769 492,769
DEDUCTIONS:13 Benefits paid directly to participants 0 0 643,265 (643,265) 636,85314 Administrative expenses 0 0 190 (190) 015 TOTAL DEDUCTIONS 0 0 643,455 (643,455) 636,85316 NET INCREASE (DECREASE) 0 0 394,315 394,315 (144,084)
17 NET POSITION HELD IN TRUST FOR PENSION BENEFITS, BEGINNING 0 0 7,640,197 7,640,197 7,485,645
18 NET POSITION HELD IN TRUST FOR PENSION BENEFITS, ENDING $0 $0 $8,034,512 $8,034,512 $7,341,561
Note: The City implemented a new defined benefit plan for non-uniform employees in 2014. Employees were given the option topurchase prior service credit by rolling over assets from the 401 (a) Pension Fund.
This Monthly Financial Report was distributed to the Little RockBoard of Directors on October 27, 2017. 37
(Unaudited)
City of Little Rock, ArkansasMonthly Financial Report
401 (a) Pension FundFor the Period Ended June 30, 2017

YTD Variance
YTD Revenues and Favorable Jun 30, 2016Budget Budget Expenditures (Unfavorable) Unaudited
ADDITIONS:Contributions:
1 Employer $0 $0 $0 $0 $02 Plan members 0 0 531,555 531,555 618,9033 General property taxes 0 0 0 0 04 State insurance turnback and guarantee fund 0 0 0 0 05 Other 0 0 0 0 06 Total Contributions 0 0 531,555 531,555 618,903
Investment income (loss):7 Net increase (decrease) in fair value of investments 0 0 103,148 103,148 90,4578 Interest and dividends 0 0 32,646 32,646 27,6899 0 0 135,794 135,794 118,146
10 Less investment expense 0 0 (18,229) (18,229) (15,442)11 Net investment income (loss) 0 0 117,565 117,565 102,70312 TOTAL ADDITIONS 0 0 649,120 649,120 721,607
DEDUCTIONS:13 Benefits paid directly to participants 0 0 0 0 014 Administrative expenses 0 0 0 0 015 TOTAL DEDUCTIONS 0 0 0 0 016 NET INCREASE (DECREASE) 0 0 649,120 649,120 721,607
17 NET POSITION HELD IN TRUST FOR PENSION BENEFITS, BEGINNING 0 0 3,575,346 3,575,346 2,780,728
18 NET POSITION HELD IN TRUST FOR PENSION BENEFITS, ENDING $0 $0 $4,224,466 $4,224,466 $3,502,335
This Monthly Financial Report was distributed to the Little RockBoard of Directors on October 27, 2017. 38
City of Little Rock, ArkansasMonthly Financial Report
Health Management Trust FundFor the Period Ended June 30, 2017
(Unaudited)

YTD Variance
YTD Revenues and Favorable Jun 30, 2016Budget Budget Expenditures (Unfavorable) Unaudited
ADDITIONS:Contributions:
1 Employer $0 $0 $2,063,058 $2,063,058 $1,723,1802 Plan members 0 0 1,031,799 1,031,799 902,2363 Participant Directed Transfer 0 0 42,016 42,016 809,9384 General property taxes 0 0 0 0 05 State insurance turnback and guarantee fund 0 0 0 0 06 Other 0 0 5,098 5,098 8,7267 Total Contributions 0 0 3,141,970 3,141,970 3,444,080
Investment income (loss):8 Net increase (decrease) in fair value of investments 0 0 $2,250,325 2,250,325 515,0849 Interest and dividends 0 0 424,130 424,130 264,128
10 0 0 2,674,456 2,674,456 779,21111 Less investment expense 0 0 (133,963) (133,963) (111,448)12 Net investment income (loss) 0 0 2,540,493 2,540,493 667,76313 TOTAL ADDITIONS 0 0 5,682,462 5,682,462 4,111,843
DEDUCTIONS:14 Benefits paid directly to participants 0 0 321,994 (321,994) 329,48115 Administrative expenses 0 0 0 0 016 TOTAL DEDUCTIONS 0 0 321,994 (321,994) 329,48117 NET INCREASE (DECREASE) 0 0 5,360,468 5,360,468 3,782,361
18 NET POSITION HELD IN TRUST FOR PENSION BENEFITS, BEGINNING 0 0 42,715,131 42,715,131 35,509,110
19 NET POSITION HELD IN TRUST FOR PENSION BENEFITS, ENDING $0 $0 $48,075,599 $48,075,599 $39,291,471
Note: The City implemented a new defined benefit plan for non-uniform employees in 2014. Employees were given the option to purchase prior service credit by rolling over assets from the Non-Uniform Defined Contribution Fund, the 401(a) Pension Fund, and other available sources.
This Monthly Financial Report was distributed to the Little RockBoard of Directors on October 27, 2017. 39
City of Little Rock, ArkansasMonthly Financial Report2014 Defined Benefit Plan
For the Period Ended June 30, 2017(Unaudited)

City of Little Rock, ArkansasMonthly Financial Report
DefinitionsFor the Period Ended June 30, 2017
(Unaudited)
Accrual Basis of Accounting means a Basis of Accounting that recognizes the financial effect of transactions, events and interfund activities when they occur, regardless of the timing of related cash flows.
Revenue(s) means: (1) Increases in the net current assets of a Governmental Fund Type from other than expenditure refunds and residual equity transfers, but does not include any general long-term debt proceeds and operating transfers in - which are classified as "other financing sources" -- unless these constitute a reservation of fund balances for encumbrances carried forward from the prior year and the expenditure for which the fund balance was created has also been carried forward; or (2) Increases in the net total assets of a Proprietary Fund Type from other than expense refunds, capital contributions and residual equity transfers, but does not include operating transfer in which are classified separately from revenues unless these constitute a reservation of fund balances for encumbrances carried forward from the prior year and the expense for which the fund balance was created has also been carried forward.
Expenditures means decreases in net financial resources under the current financial resources measurement focus, and pertains to payment of normal operating payments and encumbrances. Expenditures are measured in governmental fund accounting.
Expenses mean the cost of doing business in a proprietary organization, and can be either outflows or the using up of assets - cost expiration - such as the depreciation of fixed assets.
Fund Balance means the difference between assets and liabilities reported in the governmental fund. The Fund Balance is the excess of revenue or expenditures that has accumulated since the inception of the fund.
Note: The financials reports for all funds are prepared using the accrual basis of accounting.
40

Accounts Payable, Bonds Payable and Other PayablesFor the Period Ended June 30, 2017
Accounts Wages and Benefits Other Deferred Revenue Bonds Total PayablesFund Payable Payable Payables Revenues Payable Total Encumbrances
100 General 415,572 9,102,618 1,240,103 17,756,468 28,514,761 506,503108 General - Special Projects 591 542,082 542,673 2,132,746110 Seized Money 275,139 275,139 35,382200 Street 3,438,969 3,438,969 521,559205 Street - Special Projects 0 621,046210 Special Projects 6,235 6,235 175,676215 Infrastructure 0 0220 911 0 3,584230 CDBG 43,200.35 43,200 98,821240 HIPP 22,545 22,545 466,626250 NHSP 0 0270 Grants 955,957 955,957 1,175,565304 1998 Capital Improvement - Infrastructure 0 0305 2009 Capital Improvements 0 0310 Issuance and Reserve Fund 0 84322 2008 Library Improvement Bonds 0 0323 2012 Library Improvement Bonds 0 0324 2015 Library Improvement Bonds 0 0325 Short Term Financing Capital Improvements 0 11,338326 2012-2021 Capital Project Fund 0 11,750,335330 2013 Capital Improvement Bond 0 7,478,165351 TIF #1 2014 Capital Improvement Bond 0 0352 TIF - Port Authority 136,855 136,855 0505 2009 Parks & Rec Cap Improvement 0 0506 Infrastructure Debt Service 0 0509 2002 CIP Jr. Lien Bonds 0 0522 2008 Library Improvement Bonds Debt Service 0 0523 2012 Library Improvement Bonds Debt Service 2,149,284 2,149,284 0524 2015 Library Improvement Bonds Debt Service 2,149,285 2,149,285 0530 2013 Improvement Bonds Debt Service Fund 7,175,020 7,175,020 0551 TIF #1 2014 Cap Improvement Bond Debt Service 186,218 186,218 0600 Fleet 807,256 807,256 0601 Vehicle Storage Facility 14,805 171,749 31,620 218,174 0603 Waste Disposal 24,203 6,265,281 0 1,455,000 7,744,485 0612 Rivermarket Garage Fund 201,650 187,425 7,750,000 8,139,075 0800 Police Pension 0 0801 Fire Pension (22) 3,691 3,669 0803 Non-Uniform Defined Benefit 0 0804 Non-Uniform Defined Contribution 0 0805 401 (a) Pensions 0 0806 Health Management Trust Fund 0 0807 2014 DB Plan 0 0940 Accounts Payable Clearing Fund 158,433 158,433 0
Totals 613,013 9,102,596 9,031,205 34,715,418 9,205,000 62,667,232 24,977,428
41

.
PRINCIPAL BONDS PRINCIPAL BONDS PRINCIPAL INTERESTORIGINAL MATURITY INTEREST BALANCE ISSUED PAID IN RETIRED BALANCE PAID IN
GENERAL OBLIGATION DEBT TRUSTEE AMOUNT DATE RATE AT 12/31/16 2017 2017 2017 AT 05/31/17 2017
2012 Library Construction and Refunding Bonds Regions Bank (Paying Agent & Registrar) $31,015,000 3/1/2032 2.00% - 4.00% $22,420,000 $0 $1,290,000 $1,540,000 $19,590,000 $386,4042015 Library Construction and Refunding Bonds Regions Bank (Paying Agent & Registrar) 36,620,000 3/1/2038 2.05% - 4.00% 36,620,000 - 1,135,000 765,000 34,720,000 562,306 2013 Limited Tax Capital Improvement First Security Bank (Paying Agent & Registrar) 58,105,000 4/1/2033 1.00% - 5.00% 29,455,000 - 1,895,000 8,750,000 18,810,000 576,919 2014 Tax Increment Improvement Bonds (Redevelopment DistRegions Bank 2,615,000 3/1/2036 6.00% 2,615,000 - - - 2,615,000 78,450
REVENUE BONDS
2007 Capital Improvement Revenue Refunding Bonds U.S, Bank 13,350,000 10/1/2019 4.00% - 5.00% 3,935,000 - - - 3,935,000 89,188 2002 Junior Lien Revenue Bonds U.S, Bank 3,630,000 10/1/2018 3.50% - 4.65% 605,000 - - - 605,000 13,919 2009A Parks & Rec Revenue Bonds Bank of the Ozarks 7,830,000 1/1/2039 2.00% - 5.50% 6,690,000 - 150,000 - 6,540,000 174,503 2003 Capital Improvement and Refunding-Parking Projects U.S. Bank 11,855,000 7/1/2028 1.50% - 5.30% 7,750,000 - - - 7,750,000 201,650 2007 Waste Disposal Revenue Bond Citizens Bank 3,400,000 5/1/2022 5.30% - 5.87% 1,700,000 - 245,000 - 1,455,000 48,814 2009B Parks & Rec Bank of the Ozarks 12,120,000 1/1/2039 2.00% - 5.375% 10,660,000 - 245,000 - 10,415,000 277,948
TEMPORARY NOTE
2012 Temporary Note Banc of America Public Capital Corp. 18,580,000 3/28/2017 1.38% 3,818,573 - 3,818,573 - (0) 52,586 2013 Temporary Note USBank 7,700,000 7/30/2018 1.61% 3,153,909 - - - 3,153,909 - 2014 Temporary Note Branch Banking and Trust Company 5,916,000 6/27/2019 1.46% 3,601,033 - 1,182,989 - 2,418,044 52,575 2015 Temporary Note First Security Bank 5,910,000 6/24/2020 1.81% 4,769,785 - 1,160,555 - 3,609,230 86,333 2016 1st Temporary Note Banc of America Public Capital Corp. 4,525,000 6/10/2021 1.54% 4,525,000 - 878,141 - 3,646,859 68,966 2016 A&P Temporary Note Simmons First National Bank 2,850,000 10/25/2021 1.89% 2,850,000 - - - 2,850,000 - 2016 2nd Temporary Note Relyance Bank 4,603,000 12/22/2021 1.85% 4,603,000 - - - 4,603,000 -
Grand Total $230,624,000 $149,771,300 $0 $12,000,258 $11,055,000 $126,716,042 $2,670,559
SUMMARY OF BOND INDEBTEDNESSFor the month ended June 30, 2017