Embed Size (px)
Citation preview
2 0 1 6 F C C F A R M L A N D V A L U E S R E P O R T
This report covers the period from January 1 to December 31, 2016For more information, contact us at 1-888-332-3301 or email [email protected]
This report was published on April 10, 2017
1
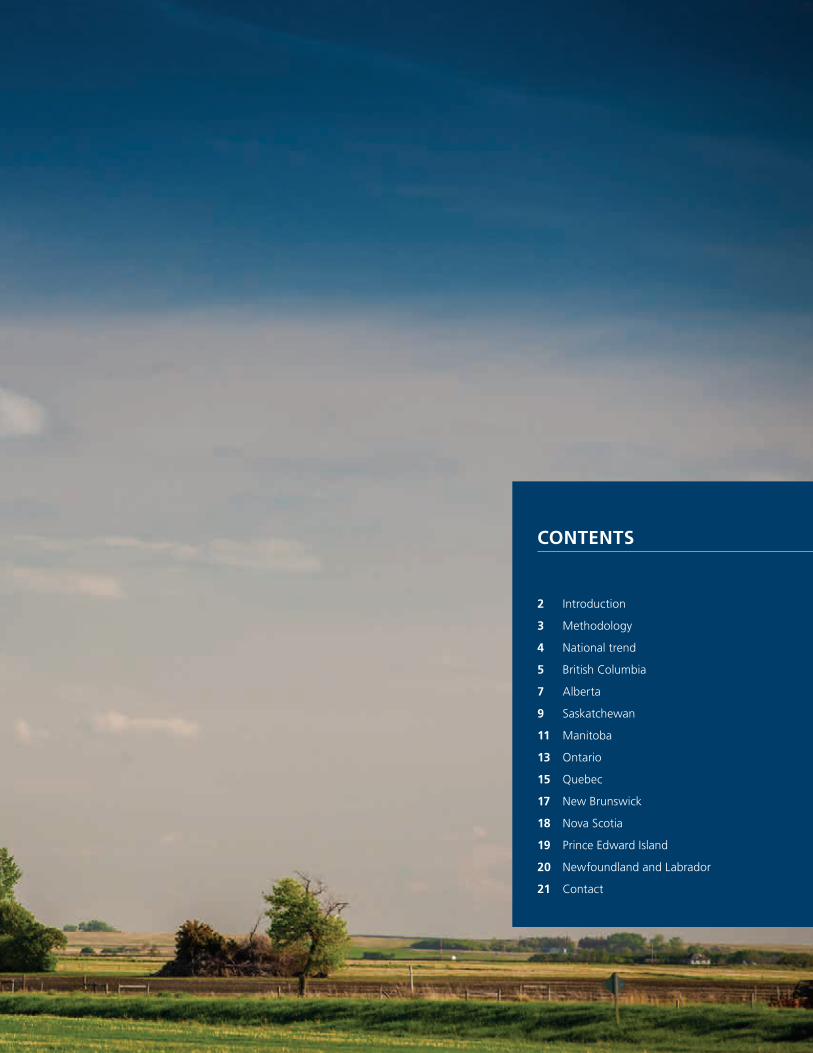
2 Introduction
3 Methodology
4 National trend
5 British Columbia
7 Alberta
9 Saskatchewan
11 Manitoba
13 Ontario
15 Quebec
17 New Brunswick
18 Nova Scotia
19 Prince Edward Island
20 Newfoundland and Labrador
21 Contact
CONTENTS
INTRODUCTION
Farm Credit Canada (FCC) understands the value of having access to
solid market-value information when making management decisions.
That’s why FCC compiles and releases the FCC Farmland Values Report.
It tracks and highlights average changes in farmland values – regionally,
provincially and nationally – and provides one source of information to
help producers manage risk and make wise business decisions.
Price is only one factor that must be considered when purchasing land.
Other factors include the location, timing of an expansion, and the
individual’s financial situation and personal goals. Producers should do
additional homework, such as ensuring their budgets have room to flex
if land prices or trends shift. Market conditions and trends can change
rapidly and this can impact values.
This report describes changes from January 1 to December 31, 2016.
2 0 1 6 F C C F A R M L A N D V A L U E S R E P O R T
INTRODUCTION
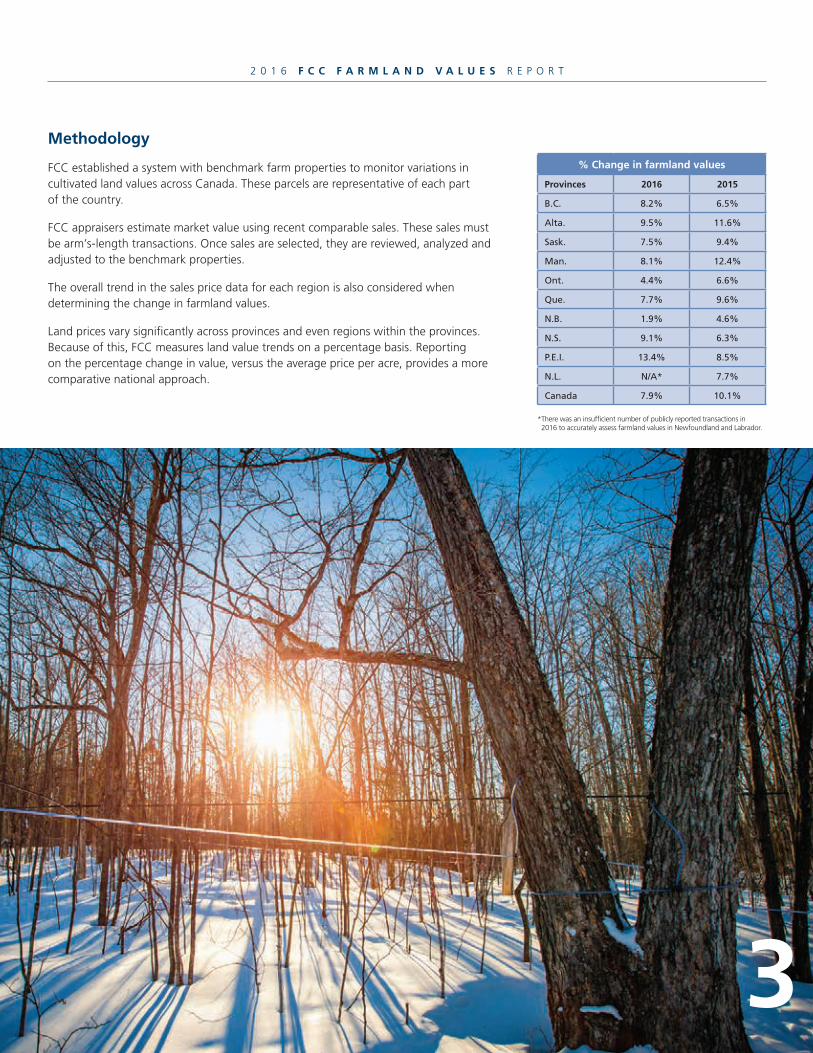
Methodology
FCC established a system with benchmark farm properties to monitor variations in cultivated land values across Canada. These parcels are representative of each part of the country.
FCC appraisers estimate market value using recent comparable sales. These sales must be arm’s-length transactions. Once sales are selected, they are reviewed, analyzed and adjusted to the benchmark properties.
The overall trend in the sales price data for each region is also considered when determining the change in farmland values.
Land prices vary significantly across provinces and even regions within the provinces. Because of this, FCC measures land value trends on a percentage basis. Reporting on the percentage change in value, versus the average price per acre, provides a more comparative national approach.
% Change in farmland values
Provinces 2016 2015
B.C. 8.2% 6.5%
Alta. 9.5% 11.6%
Sask. 7.5% 9.4%
Man. 8.1% 12.4%
Ont. 4.4% 6.6%
Que. 7.7% 9.6%
N.B. 1.9% 4.6%
N.S. 9.1% 6.3%
P.E.I. 13.4% 8.5%
N.L. N/A* 7.7%
Canada 7.9% 10.1%
3
* There was an insufficient number of publicly reported transactions in 2016 to accurately assess farmland values in Newfoundland and Labrador.

2 0 1 6 F C C F A R M L A N D V A L U E S R E P O R T
CanadaAnnual % change in farmland values
11.6%
11.7%
6.6%
5.2%
14.8%
19.5%
22.1%
14.3%
10.1%
7.9%2016
2015
2014
2013
2012
2011
2010
2009
2008
2007
B.C.8.2%
ALTA.9.5%
SASK.7.5%
MAN.8.1%
ONT.4.4%
QUE.7.7%
N.B.1.9%
N.S.9.1%
N.L.N/A*
P.E.I.13.4%
Canada7.9%
*There was an insufficient number of publicly reported transactions in 2016 to accurately assess farmland values in Newfoundland and Labrador.
Provincial comparison of farmland values Annual % change in farmland values January 1 to December 31, 2016
National trend
The average value of Canadian farmland increased 7.9 per cent in 2016, following gains of 10.1 per cent in 2015 and 14.3 per cent in 2014. Overall, the average national values have continued to increase since 1993.
In all provinces farmland values increased, except in Newfoundland and Labrador, where there were not enough publicly reported transactions to accurately assess farmland values. Prince Edward Island experienced the highest average increase at 13.4 per cent, followed by Alberta at 9.5 per cent, Nova Scotia at 9.1 per cent, British Columbia at 8.2 per cent and Manitoba at 8.1 per cent.
The average increase in Quebec was 7.7 per cent. Saskatchewan was 7.5 per cent, followed by Ontario at 4.4 per cent and New Brunswick at 1.9 per cent.
When looking at the national results, it is important to remember the reported number is an average. The differences between regions within each province vary widely.

2 0 1 6 F C C F A R M L A N D V A L U E S R E P O R T
British Columbia
The average value of British Columbia farmland increased 8.2 per cent in 2016, following gains of 6.5 per cent in 2015 and 4.2 per cent in 2014. Values in the province have continued to climb since 2011.
The farmland values variance in the province was significant, from no change to the highest regional farmland value increase in Canada, reflecting the unique circumstances and diverse markets throughout the province.
South Coast region, including the Fraser Valley, saw an overall above-average number of farmland sales in the first half of the year, resulting in the highest farmland value increase in Canada. The 17.7 per cent increase was due to continued expansion by local producers, as well as some demand driven by increased interest in rural property. Moderate commodity yields and prices later in the season tempered the farmland market.
Peace Region-Northern B.C. saw a 9.1 per cent average increase in farmland values, largely driven by continued demand from local expanding producers, with the strongest demand for good quality land for both grain and hay production. There was also increased interest from outside buyers, as farmland in the area was still considered relatively affordable. There was substantial variance in land prices paid through various transactions, notably those that took place through numerous public farm auctions. Overall, this area had the province’s second-highest increase for 2016.
5
British Columbia farmland regions Annual % change in farmland values
Peace Region-Northern B.C. – 9.1% Cariboo-Chilcotin – 2.7% Vancouver Island – 4.4% South Coast – 17.7% Thompson-Nicola – 0.0% Okanagan – 7.4% Kootenay – 4.0%
British ColumbiaAnnual % change in farmland values
18.7%
5.4%
-0.7%
-0.5%
0.2%
0.1%
3.0%
4.2%
6.5%
8.2%2016
2015
2014
2013
2012
2011
2010
2009
2008
2007

2 0 1 6 F C C F A R M L A N D V A L U E S R E P O R T
Okanagan region saw more outside buyer interest, leading to strong demand for even large holdings and an overall 7.4 per cent increase in farmland values. Local producers were also expanding and willing to make substantial investments when the right properties came on the market. Smaller acreage or lifestyle farms continued to command strong prices, which were partly influenced by the strong urban market.
Vancouver Island farmland values increased by 4.4 per cent, a result of a relatively quiet market; there was noticeably more activity involving smaller acreage or lifestyle farms. Overall there was an average volume of farmland sale transactions.
Kootenay region experienced a four per cent increase in farmland values, spurred on by renewed optimism in the region. In addition, the relatively low farmland value in the region attracted interest from producers in higher-priced areas of the province, such as the Okanagan.
Cariboo-Chilcotin region saw a modest increase of 2.7 per cent in farmland values, supported by an average volume of farm and ranch transactions. While some large operations experienced extended periods on the market, there was generally good demand with sales concluding within a reasonable time. Demand was mostly from local expansions or new entrants, though there were some outside buyers.
Thompson-Nicola region had an active but stable farmland market in 2016, resulting in no change to farmland values. The sales were comprised of a cross-section of properties, including larger blocks and smaller parcels, as well as irrigated land. Part of the increased activity over previous years was due to a more tempered expectation on the part of some vendors, resulting in reduced asking prices and greater market interest.

2 0 1 6 F C C F A R M L A N D V A L U E S R E P O R T
7
Alberta
The average value of Alberta farmland increased 9.5 per cent in 2016, following gains of 11.6 per cent in 2015 and 8.8 per cent in 2014. Values in the province have continued to climb since 1993.
Despite an economy hurt by depressed oil and gas prices, Alberta reported the second-highest average farmland values increase in Canada, eclipsed only by Prince Edward Island. The province’s 9.5 per cent average increase was largely buoyed by grain sector expansion in the north, as well as activity from non-traditional buyers in the south. While competition for available farmland also increased prices in other regions, farmland on the outskirts of urban centres saw reduced prices due to the general economic downturn.
The Peace region saw the province’s smallest average increase in farmland values at 7.7 per cent. Some adverse weather, as well as depressed oil and gas prices, placed downward pressure on farmland values, while large farm expansion and competition between beef and grains sectors in some areas helped boost the value of marginal cultivated forage or pasture acres.
Buoyed by grain sector expansion, land values in the northern region saw a recovery from 2015, recording the highest average land value increase in the province at 11.8 per cent. Land sales took place mostly through auction sales or sealed bids, as grain producers continued to compete for less productive land. This region was also impacted by lower oil and gas prices.
AlbertaAnnual % change in farmland values
17.4%
9.1%
4.8%
4.4%
8.7%
13.3%
12.9%
8.8%
11.6%
9.5%2016
2015
2014
2013
2012
2011
2010
2009
2008
2007

2 0 1 6 F C C F A R M L A N D V A L U E S R E P O R T
Producers aggressively competing for any land that became available was the main driver behind the central region’s 8.6 per cent average farmland value increase. This aggressive purchasing was observed in a majority of the areas in the region, while there was some divestment of land near urban centres, which sold at significant discounts. Record rainfall in the eastern Grasslands has significantly impacted usage and value of land in this area, while other areas have experienced strong competition from supply-managed operations.
Alberta’s southern region saw an average nine per cent increase in farmland values. Most of this region experienced good growing conditions, which resulted in a good harvest. Larger farms continued to expand, creating strong demand for all types of land in all areas of the southern region. Irrigation in the southern region also provided contract opportunities for specialty crops and investment by non-typical buyers, who commonly lease back to area growers.
Alberta farmland regions Annual % change in farmland values
Peace – 7.7% Northern – 11.8% Central – 8.6% Southern – 9.0%

2 0 1 6 F C C F A R M L A N D V A L U E S R E P O R T
9
Saskatchewan
The average value of Saskatchewan farmland increased 7.5 per cent in 2016, following gains of 9.4 per cent in 2015 and 18.7 per cent in 2014. Values in the province have continued to rise since 2002.
Provincially, there was strong demand and sales activity, including opportunities for producers to purchase leased land from the province. However, not all areas of the province saw increases in land prices. In fact, some rural municipalities saw land prices trending downward, while other areas remained stable. Adverse weather conditions throughout the growing season appeared to depress prices, but not necessarily temper demand.
The southwest corner of the province had steady demand and values increased in that area by an average of 16.6 per cent, representing the highest increase in the province. Although there were challenges with the lentil harvest, the resulting yields and quality ended up being better than expected.
The northwest part of the province continued to see strong demand and increased prices throughout the year, resulting in a 10.3 per cent increase in farmland values. Areas with larger farm operations continued to compete for land that came up for sale, causing land values to increase.
SaskatchewanAnnual % change in farmland values
11.0%
14.9%
6.9%
5.7%
22.9%
19.7%
28.5%
18.7%
9.4%
7.5%2016
2015
2014
2013
2012
2011
2010
2009
2008
2007
Saskatchewan farmland regions Annual % change in farmland values
North Western – 10.3% North Eastern – 9.3% West Central – 7.8% East Central – 0.0% South Western – 16.6% South Eastern – 0.0%

2 0 1 6 F C C F A R M L A N D V A L U E S R E P O R T
The northeast region saw a 9.3 per cent increase in farmland values, despite experiencing some adverse weather conditions. This may have suppressed the appetite to buy land and helped stabilize prices in most of the area.
The west-central region saw a moderate increase of 7.8 per cent in farmland values. Prices and demand tended to increase closer to the Saskatoon corridor, while western areas (toward the Kindersley-Rosetown area) that were more heavily impacted by weather saw limited activity and stable prices.
Farmland values in east-central and southeast Saskatchewan remained unchanged in 2016. The impact of the oil and gas industry slowdown continued to be felt in the southeast region.
2 0 1 6 F C C F A R M L A N D V A L U E S R E P O R T
11
Manitoba
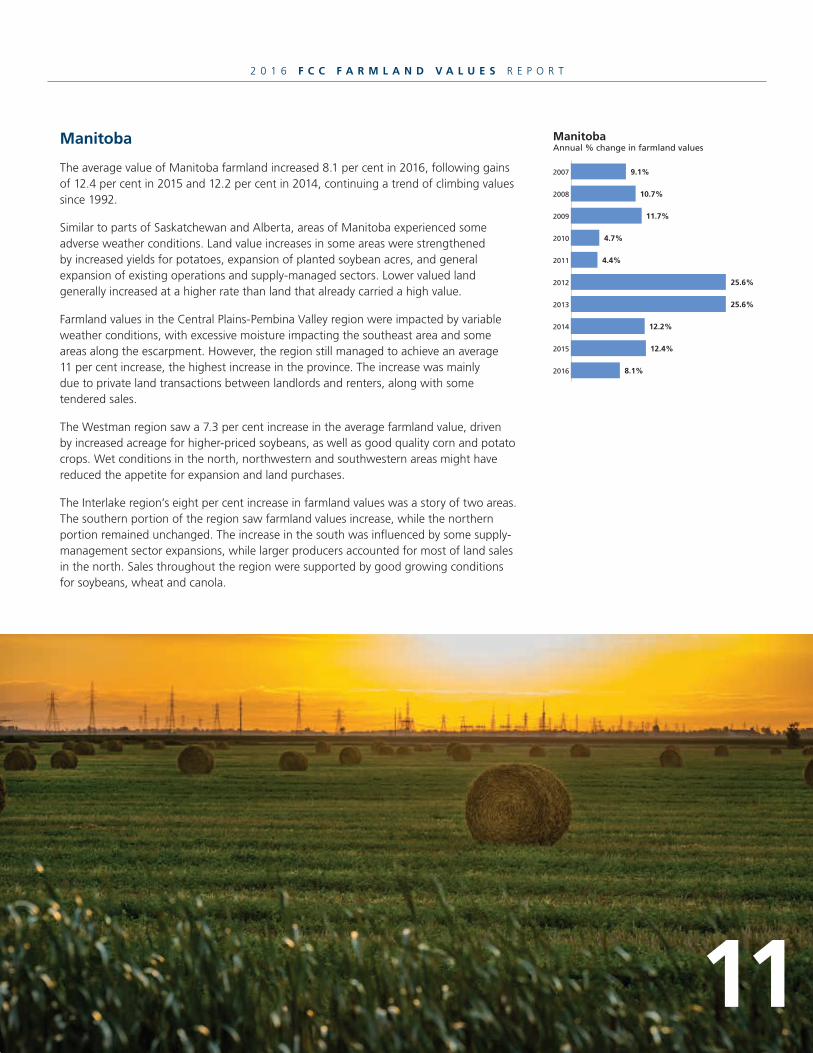
The average value of Manitoba farmland increased 8.1 per cent in 2016, following gains of 12.4 per cent in 2015 and 12.2 per cent in 2014, continuing a trend of climbing values since 1992.
Similar to parts of Saskatchewan and Alberta, areas of Manitoba experienced some adverse weather conditions. Land value increases in some areas were strengthened by increased yields for potatoes, expansion of planted soybean acres, and general expansion of existing operations and supply-managed sectors. Lower valued land generally increased at a higher rate than land that already carried a high value.
Farmland values in the Central Plains-Pembina Valley region were impacted by variable weather conditions, with excessive moisture impacting the southeast area and some areas along the escarpment. However, the region still managed to achieve an average 11 per cent increase, the highest increase in the province. The increase was mainly due to private land transactions between landlords and renters, along with some tendered sales.
The Westman region saw a 7.3 per cent increase in the average farmland value, driven by increased acreage for higher-priced soybeans, as well as good quality corn and potato crops. Wet conditions in the north, northwestern and southwestern areas might have reduced the appetite for expansion and land purchases.
The Interlake region’s eight per cent increase in farmland values was a story of two areas. The southern portion of the region saw farmland values increase, while the northern portion remained unchanged. The increase in the south was influenced by some supply- management sector expansions, while larger producers accounted for most of land sales in the north. Sales throughout the region were supported by good growing conditions for soybeans, wheat and canola.
ManitobaAnnual % change in farmland values
9.1%
10.7%
11.7%
4.7%
4.4%
25.6%
25.6%
12.2%
12.4%
8.1%2016
2015
2014
2013
2012
2011
2010
2009
2008
2007
2 0 1 6 F C C F A R M L A N D V A L U E S R E P O R T
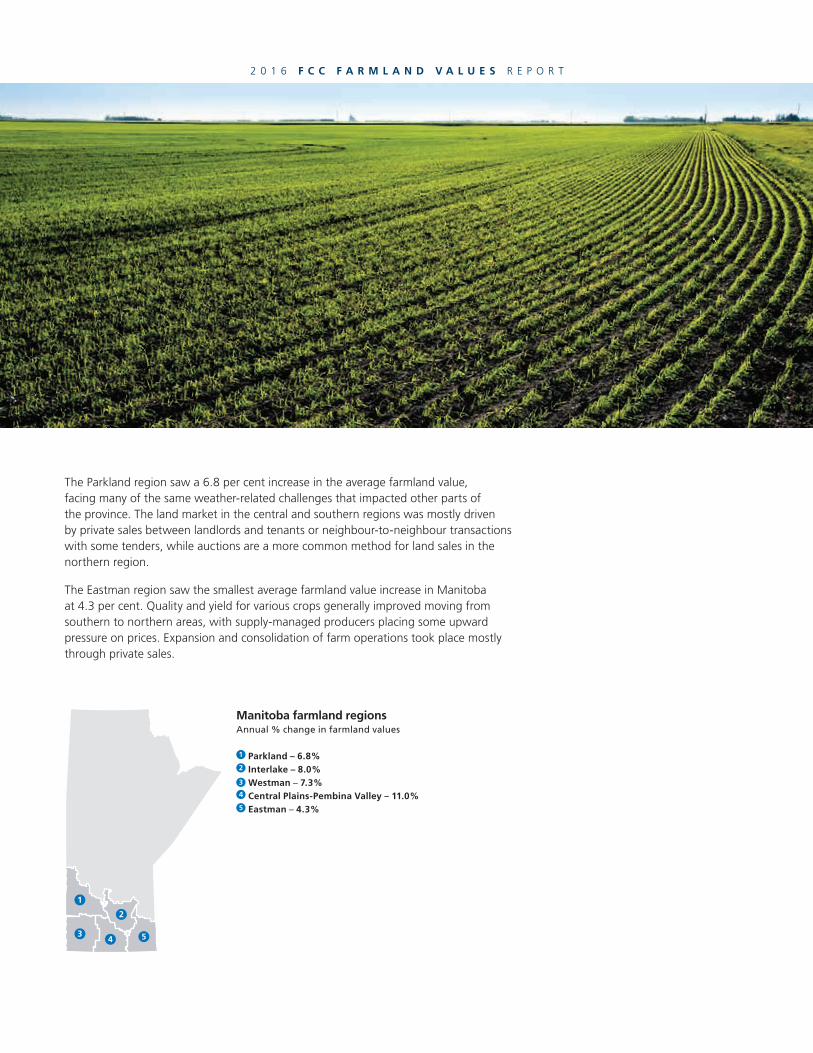
The Parkland region saw a 6.8 per cent increase in the average farmland value, facing many of the same weather-related challenges that impacted other parts of the province. The land market in the central and southern regions was mostly driven by private sales between landlords and tenants or neighbour-to-neighbour transactions with some tenders, while auctions are a more common method for land sales in the northern region.
The Eastman region saw the smallest average farmland value increase in Manitoba at 4.3 per cent. Quality and yield for various crops generally improved moving from southern to northern areas, with supply-managed producers placing some upward pressure on prices. Expansion and consolidation of farm operations took place mostly through private sales.
Manitoba farmland regions Annual % change in farmland values
Parkland – 6.8% Interlake – 8.0% Westman – 7.3% Central Plains-Pembina Valley – 11.0% Eastman – 4.3%

2 0 1 6 F C C F A R M L A N D V A L U E S R E P O R T
13
Ontario
The average value of Ontario farmland increased 4.4 per cent in 2016, following gains of 6.6 per cent in 2015 and 12.4 per cent in 2014. Values in the province have continued to rise since 1988.
Most of the province continued with a stable upward trend, reflected by modest, single-digit increases in all regions. A mix of transactions was observed, including real estate brokered, property auction and sales through tender.
Ontario’s overall farmland values increase was fuelled by high demand for a limited amount of available land, expansion of supply-managed farm operations and strong demand for farmland to grow cash crops throughout the province. Softer demand was seen in areas where expansion had already taken place or areas affected by lower commodity prices.
Southern and northern Ontario led the province with the most significant increases at 6.9 and 6.2 per cent, respectively. Within some regions of the province, land values appeared to have levelled off. The demand for land still remains, but only at a realistic price level that can be supported by crop production.
OntarioAnnual % change in farmland values
3.9%
6.6%
6.2%
6.8%
14.3%
30.1%
15.9%
12.4%
6.6%
4.4%2016
2015
2014
2013
2012
2011
2010
2009
2008
2007
Ontario farmland regions Annual % change in farmland values
Northern – 6.2% Eastern – 5.1% North Western – 4.2% North Central – 2.6% South Western – 1.6% South Central – 5.0% Southern – 6.9% South Eastern – 1.5%
2 0 1 6 F C C F A R M L A N D V A L U E S R E P O R T
There was an increase in the demand for land in eastern Ontario, which reported a 5.1 per cent increase in farmland values. This was due to local farmers wanting to expand their operations, as well as more farmers coming from other regions of Ontario and Quebec, where land prices are higher. These factors, combined with a strong and diverse farm economy, helped strengthen the demand for land in the region.
There was strong demand for farmland in some areas within southern and south central Ontario, as the favourable soil types allow for a variety of specialty crops to be grown, thus creating potentially higher returns for producers in that area.
Southeastern and southwestern Ontario reported the most modest farmland value increases at 1.5 per cent and 1.6 per cent, respectively. There are various pockets throughout southwestern Ontario that continued to show signs of extended vibrancy, with some areas having experienced record values in 2016.

2 0 1 6 F C C F A R M L A N D V A L U E S R E P O R T
15
Quebec
The average value of Quebec farmland increased 7.7 per cent in 2016, following gains of 9.6 per cent in 2015 and 15.7 per cent in 2014. Values have continued to increase in Quebec since 1986.
The general upward trend in farmland values fed consistent demand throughout the province. Slower growth in land values was observed, in areas where land prices were already high, such as the Montérégie.
The strongest increase was noted in the Saguenay–Lac-Saint-Jean region, where the increase was 16.2 per cent, followed by the regions of Centre-du-Québec with 10.8 per cent and Estrie with 10.4 per cent. In those regions, land sale prices were more affordable.
QuebecAnnual % change in farmland values
4.8%
11.7%
5.7%
3.2%
8.9%
27.4%
24.7%
15.7%
9.6%
7.7%2016
2015
2014
2013
2012
2011
2010
2009
2008
2007
Quebec farmland regions Annual % change in farmland values
Abitibi-Témiscamingue – 3.6% Outaouais – 4.2% Laurentides-Lanaudière – 0.0% Saguenay–Lac-Saint-Jean – 16.2% Mauricie-Portneuf – 0.0% Montérégie – 9.2% Centre-du-Québec – 10.8% Bas-Saint-Laurent–Gaspésie – 8.9% Chaudière-Appalaches – 6.6% Estrie – 10.4%
2 0 1 6 F C C F A R M L A N D V A L U E S R E P O R T
The highest land values in the province were found in the regions of Montérégie, Lanaudière and Laurentides.
In the Montérégie region, land located in lower-priced areas showed the most significant growth. Higher-priced land tended to remain on the market longer than in past years. The record prices in 2014 and 2015 were not exceeded in 2016.
Most of the other regions saw slight increases or minimal change.
Farmers, particularly crop producers and those in supply-managed sectors, continued to be the primary buyers of farmland in 2016 across all Quebec regions.

2 0 1 6 F C C F A R M L A N D V A L U E S R E P O R T
17
New Brunswick
The average value of New Brunswick farmland increased 1.9 per cent in 2016, following gains of 4.6 per cent in 2015 and eight per cent in 2014. Values in the province have continued to rise since 2008.
The greatest increase was observed in the western part of the province, where growth reached four per cent, while values remained stable in the southern and northern regions.
New Brunswick’s potato processing industry is stable and a number of producers have acquired land in the region, particularly the Carleton area, in an attempt to improve crop rotation practices. Potato production land should ideally be under crop for a year and then fallow for the next two years. By buying more land, potato growers can work toward this ultimate objective.
In the southern region, dominated by dairy operations, few transactions were observed and values remained stable. The few transactions noted were to purchase additional land and increase forage production for dairy cattle.
In the northern region, despite some declines in the blueberry industry, farmland values also remained stable.
The presence of non-traditional buyers contributed to higher demand for farmland, driving up prices, particularly in the western region. Agriculture, nonetheless, accounted for the majority of farmland buyers in 2016.
New BrunswickAnnual % change in farmland values
-1.4%
6.0%
8.2%
2.4%
1.3%
0.0%
7.2%
8.0%
4.6%
1.9%2016
2015
2014
2013
2012
2011
2010
2009
2008
2007
New Brunswick farmland regions Annual % change in farmland values
Western – 4.0% Northern – 0.0% Southern – 0.0%

2 0 1 6 F C C F A R M L A N D V A L U E S R E P O R T
Nova Scotia
The average value of Nova Scotia farmland increased 9.1 per cent in 2016, following gains of 6.3 per cent in 2015 and seven per cent in 2014. Values in the province have continued to increase since 2005.
There was significant upward pressure on farmland values across the province. Values increased for all types of agricultural land, including those related to the production of poultry, dairy, vineyards, orchards and vegetable production, as well as lifestyle farms.
Competition for farmland in the Annapolis Valley region remained strong and parcels did not stay on the market for long. Purchasers ranged from farmers wanting to expand their operations, increase feed production or spread manure, to retirees wanting to move back to their home communities to establish lifestyle farms.
Increased land values were noted in all regions of Nova Scotia in 2016, except the northern part of Truro-Shubenacadie, where farmland values remained stable. The rest of the Truro-Shubenacadie region accounted for the average 9.2 per cent farmland value increase.
The Pictou-Antigonish region – known mostly for its dairy and beef production – saw an average 8.8 per cent increase in farmland values. This increase was driven primarily by dairy producers seeking additional forage land and was part of an overall gradual increase in land prices for both the beef and dairy sectors.
Nova ScotiaAnnual % change in farmland values
3.1%
9.7%
5.7%
3.7%
6.2%
9.8%
1.9%
7.0%
6.3%
9.1%2016
2015
2014
2013
2012
2011
2010
2009
2008
2007
Nova Scotia farmland regions Annual % change in farmland values
Annapolis Valley – 9.0% Truro-Shubenacadie – 9.2% Pictou-Antigonish – 8.8%
19
2 0 1 6 F C C F A R M L A N D V A L U E S R E P O R T
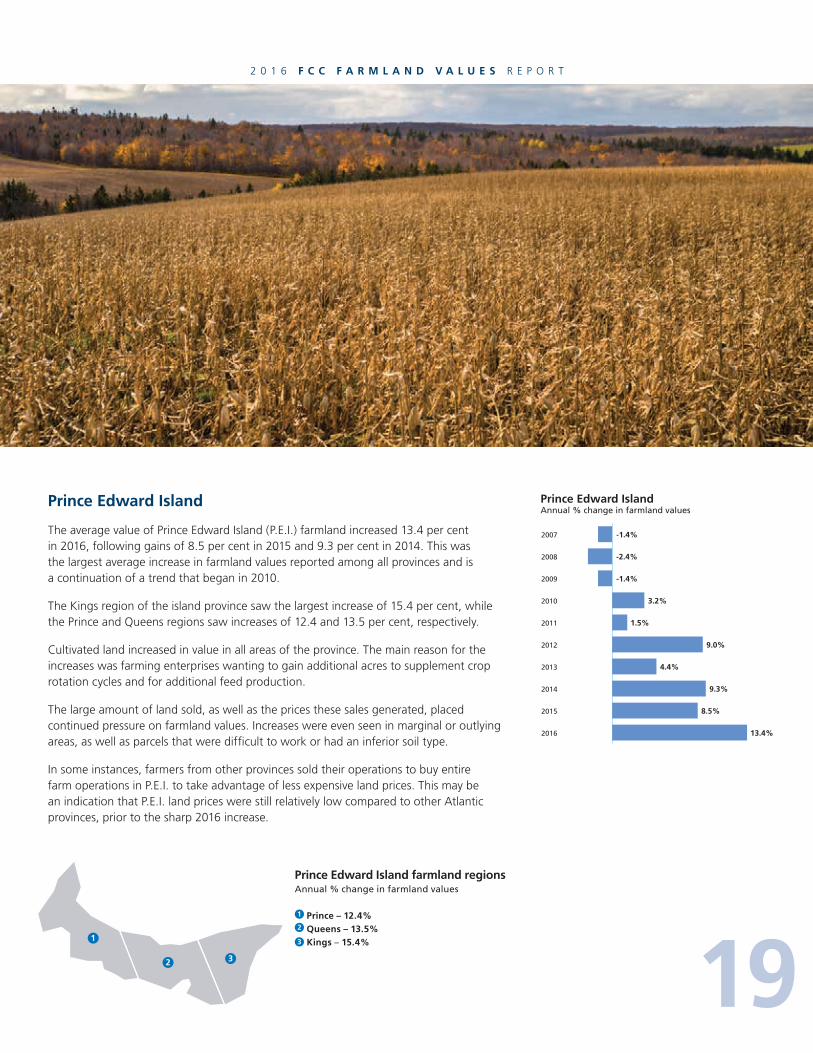
Prince Edward Island
The average value of Prince Edward Island (P.E.I.) farmland increased 13.4 per cent in 2016, following gains of 8.5 per cent in 2015 and 9.3 per cent in 2014. This was the largest average increase in farmland values reported among all provinces and is a continuation of a trend that began in 2010.
The Kings region of the island province saw the largest increase of 15.4 per cent, while the Prince and Queens regions saw increases of 12.4 and 13.5 per cent, respectively.
Cultivated land increased in value in all areas of the province. The main reason for the increases was farming enterprises wanting to gain additional acres to supplement crop rotation cycles and for additional feed production.
The large amount of land sold, as well as the prices these sales generated, placed continued pressure on farmland values. Increases were even seen in marginal or outlying areas, as well as parcels that were difficult to work or had an inferior soil type.
In some instances, farmers from other provinces sold their operations to buy entire farm operations in P.E.I. to take advantage of less expensive land prices. This may be an indication that P.E.I. land prices were still relatively low compared to other Atlantic provinces, prior to the sharp 2016 increase.
Prince Edward IslandAnnual % change in farmland values
-1.4%
-2.4%
-1.4%
3.2%
1.5%
9.0%
4.4%
9.3%
8.5%
13.4%2016
2015
2014
2013
2012
2011
2010
2009
2008
2007
Prince Edward Island farmland regions Annual % change in farmland values
Prince – 12.4% Queens – 13.5% Kings – 15.4%
2 0 1 6 F C C F A R M L A N D V A L U E S R E P O R T
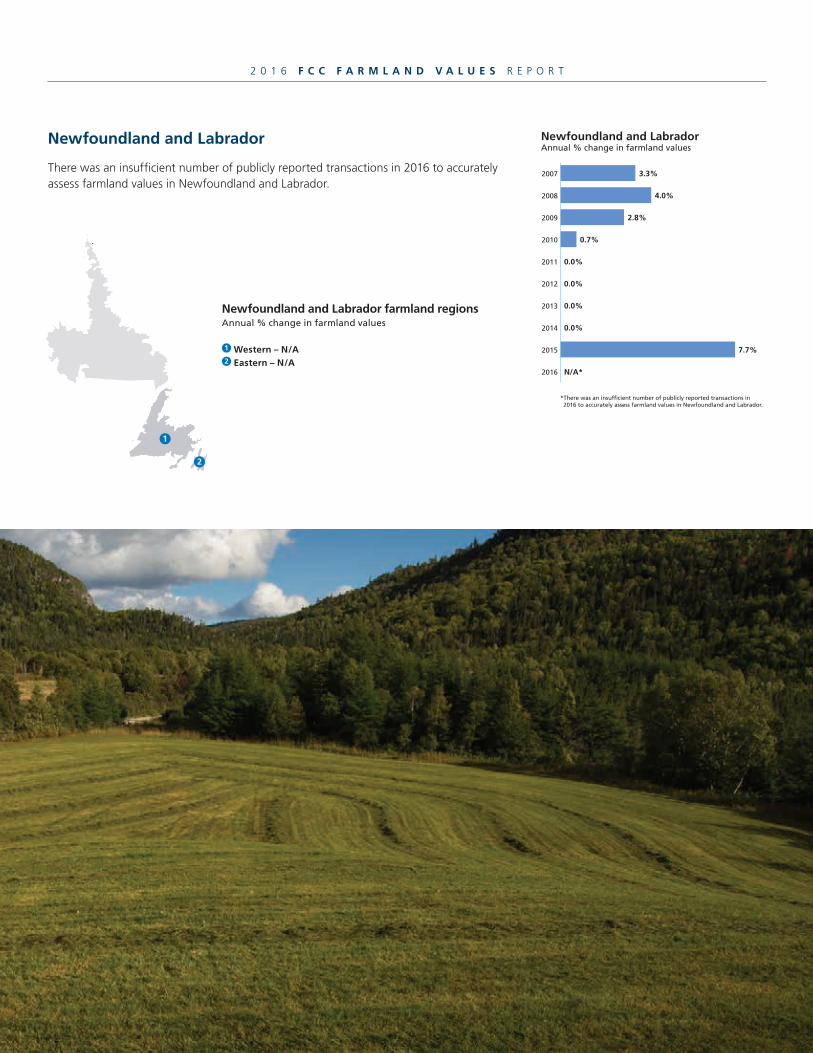
Newfoundland and Labrador
There was an insufficient number of publicly reported transactions in 2016 to accurately assess farmland values in Newfoundland and Labrador.
Newfoundland and Labrador farmland regions Annual % change in farmland values
Western – N/A Eastern – N/A
Newfoundland and LabradorAnnual % change in farmland values
3.3%
4.0%
2.8%
0.7%
0.0%
0.0%
0.0%
0.0%
7.7%
N/A*2016
2015
2014
2013
2012
2011
2010
2009
2008
2007
*There was an insufficient number of publicly reported transactions in 2016 to accurately assess farmland values in Newfoundland and Labrador.

Contact
British Columbia
Bill Wiebe Senior Appraiser [email protected] 604-870-2719
Alberta
Kenneth Gurney Senior Appraiser [email protected] 403-382-2907
Lisa Land Manager, Valuation and Environmental Risk [email protected] 403-292-8624
Saskatchewan
Cathy Gale Director, Valuation and Environmental Risk [email protected] 306-780-8336
Manitoba
Claude Jacques Senior Appraiser (bilingual) [email protected] 204-239-8472
Ontario
Dale Litt Senior Appraiser [email protected] 519-291-2192
Janet Metherel Manager, Valuation and Environmental Risk [email protected] 519-826-3019
Quebec
Hugues Laverdure Director, Valuation and Environmental Risk (bilingual) [email protected] 450-771-6771
Jean Lacroix Manager, Valuation and Environmental Risk (bilingual) [email protected] 418-837-0257
Atlantic Canada
Charles Dubé Senior Appraiser (bilingual) [email protected] 506-851-7141
Cette publication est également offerte en français.

39422 E 20170410 RH


![ALBERTA SECURITIES COMMISSION DECISION … Decisions...2 B. Westside Projects [8] Westside projects involved Westside purchasing farmland near Calgary, and then taking "steps to bring](https://img.dokumen.tips/doc/110x75/5f2df43be797213a6e0d2a27/alberta-securities-commission-decision-decisions-2-b-westside-projects-8-westside.jpg)