Embed Size (px)
Citation preview
AAPEX February 2011
© 2011 1
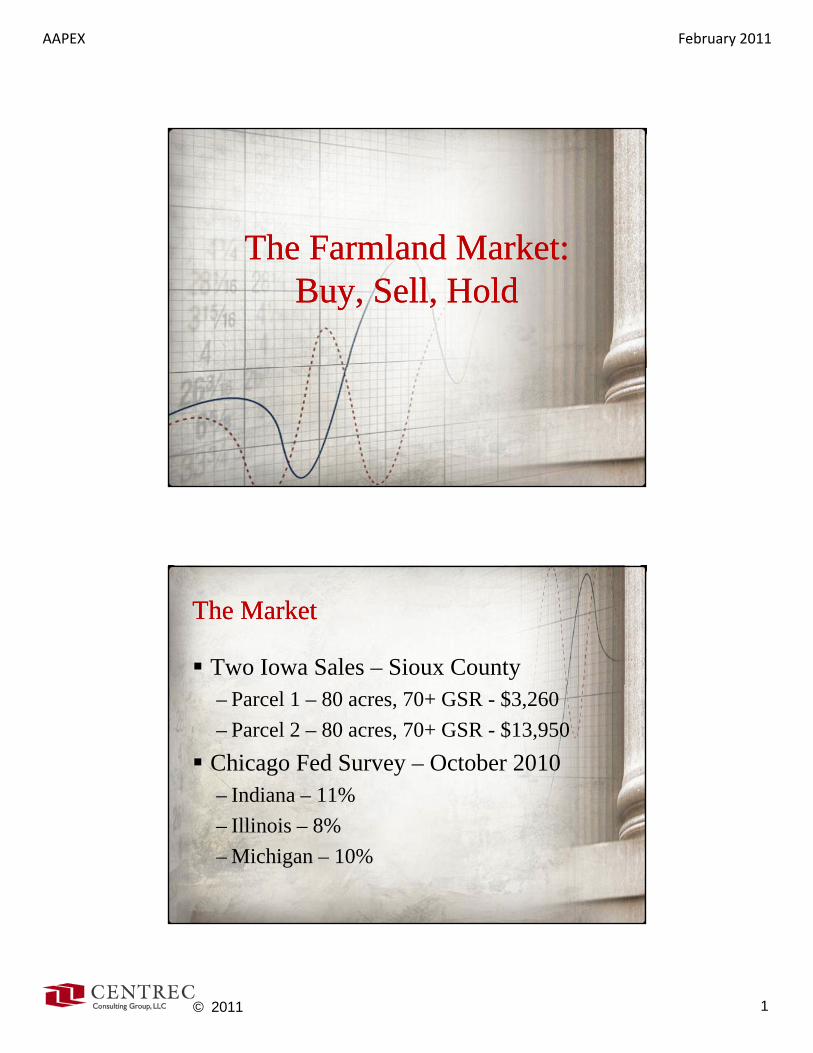
The Farmland Market:The Farmland Market:The Farmland Market: The Farmland Market: Buy, Sell, HoldBuy, Sell, Hold
The MarketThe Market
Two Iowa Sales – Sioux County– Parcel 1 – 80 acres, 70+ GSR - $3,260– Parcel 2 – 80 acres, 70+ GSR - $13,950Chicago Fed Survey – October 2010– Indiana – 11%– Illinois – 8%– Michigan – 10%
AAPEX February 2011
© 2011 2
The MarketThe Market
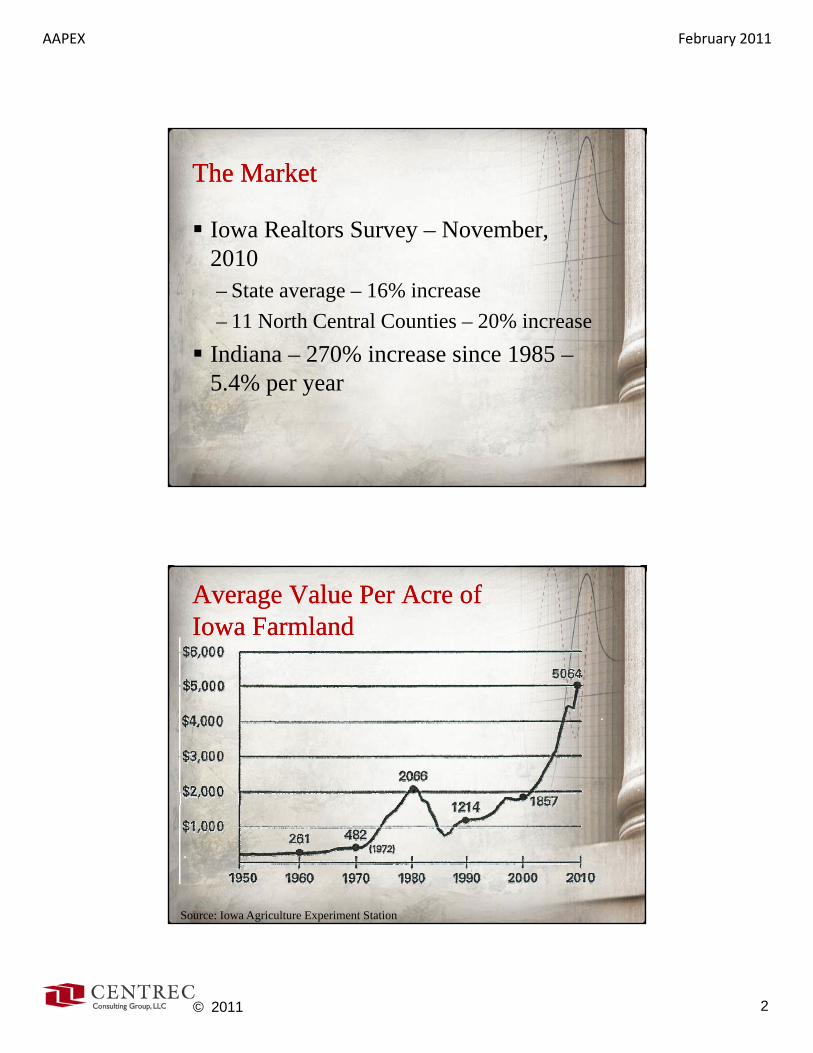
Iowa Realtors Survey – November, 2010– State average – 16% increase– 11 North Central Counties – 20% increaseIndiana – 270% increase since 1985 –5.4% per year
Average Value Per Acre of Average Value Per Acre of Iowa FarmlandIowa Farmland
Source: Iowa Agriculture Experiment Station
AAPEX February 2011
© 2011 3
First line:
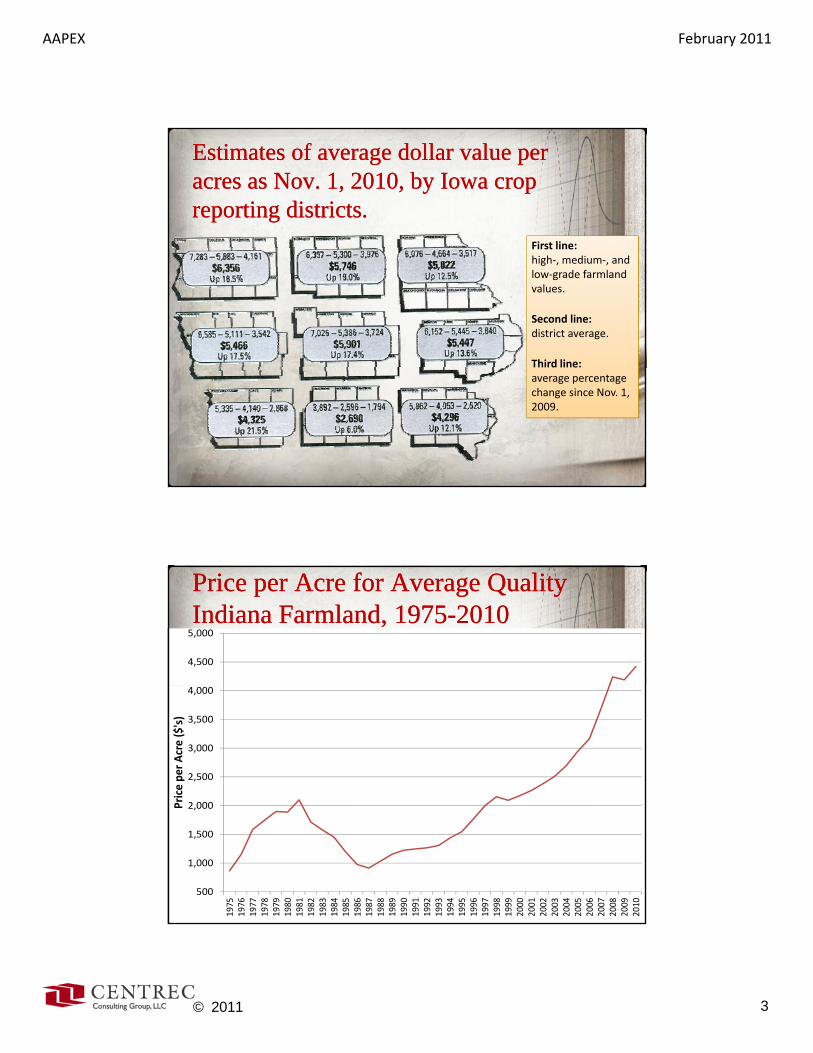
Estimates of average dollar value per Estimates of average dollar value per acres as Nov. 1, 2010, by Iowa crop acres as Nov. 1, 2010, by Iowa crop reporting districts.reporting districts.
First line: high‐, medium‐, and low‐grade farmland values.
Second line: district average.
Third line: Third line:average percentage change since Nov. 1, 2009.
4,500
5,000
Price per Acre for Average Quality Price per Acre for Average Quality Indiana Farmland, 1975Indiana Farmland, 1975--20102010
2 000
2,500
3,000
3,500
4,000
Price pe
r Acre ($'s)
500
1,000
1,500
2,000
1975
1976
1977
1978
1979
1980
1981
1982
1983
1984
1985
1986
1987
1988
1989
1990
1991
1992
1993
1994
1995
1996
1997
1998
1999
2000
2001
2002
2003
2004
2005
2006
2007
2008
2009
2010
P
AAPEX February 2011
© 2011 4
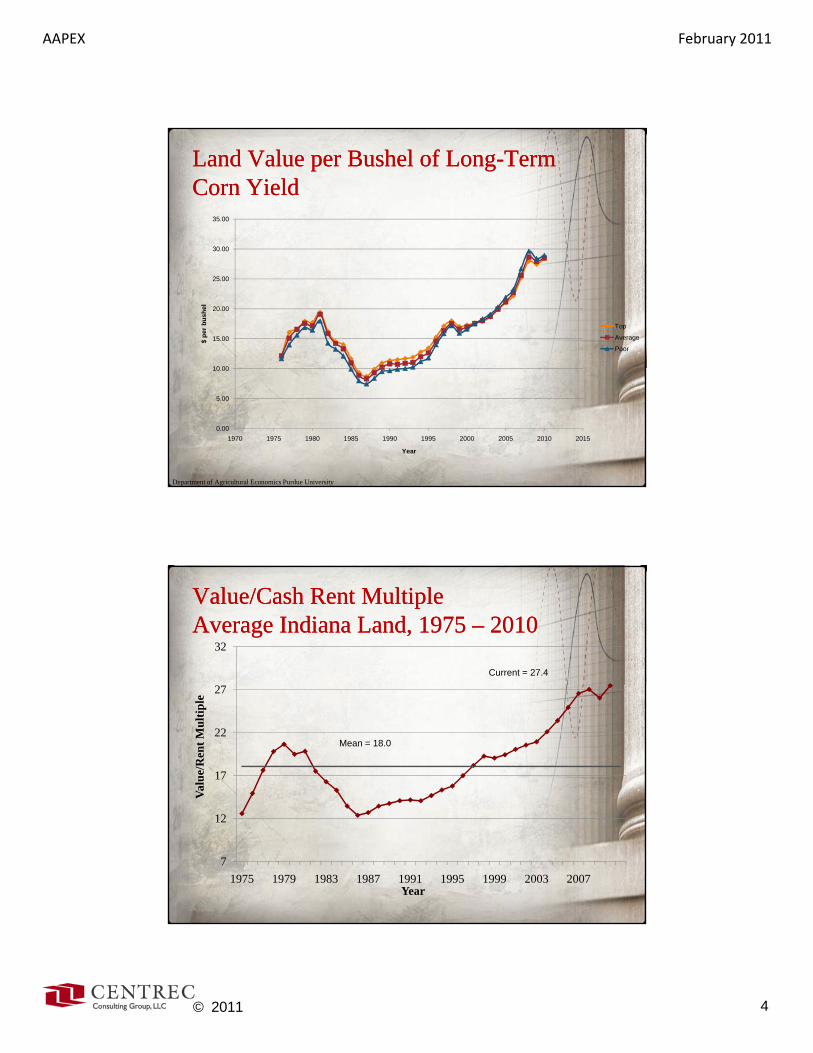
Land Value per Bushel of LongLand Value per Bushel of Long--Term Term Corn YieldCorn Yield
30 00
35.00
10 00
15.00
20.00
25.00
30.00
$ pe
r bus
hel
Top
Average
Poor
0.00
5.00
10.00
1970 1975 1980 1985 1990 1995 2000 2005 2010 2015
Year
Department of Agricultural Economics Purdue University
Value/Cash Rent Multiple Value/Cash Rent Multiple Average Indiana Land, 1975 Average Indiana Land, 1975 –– 20102010
32
Current = 27.4
17
22
27
Valu
e/R
ent M
ultip
le
Mean = 18.0
7
12
1975 1979 1983 1987 1991 1995 1999 2003 2007Year
AAPEX February 2011
© 2011 5
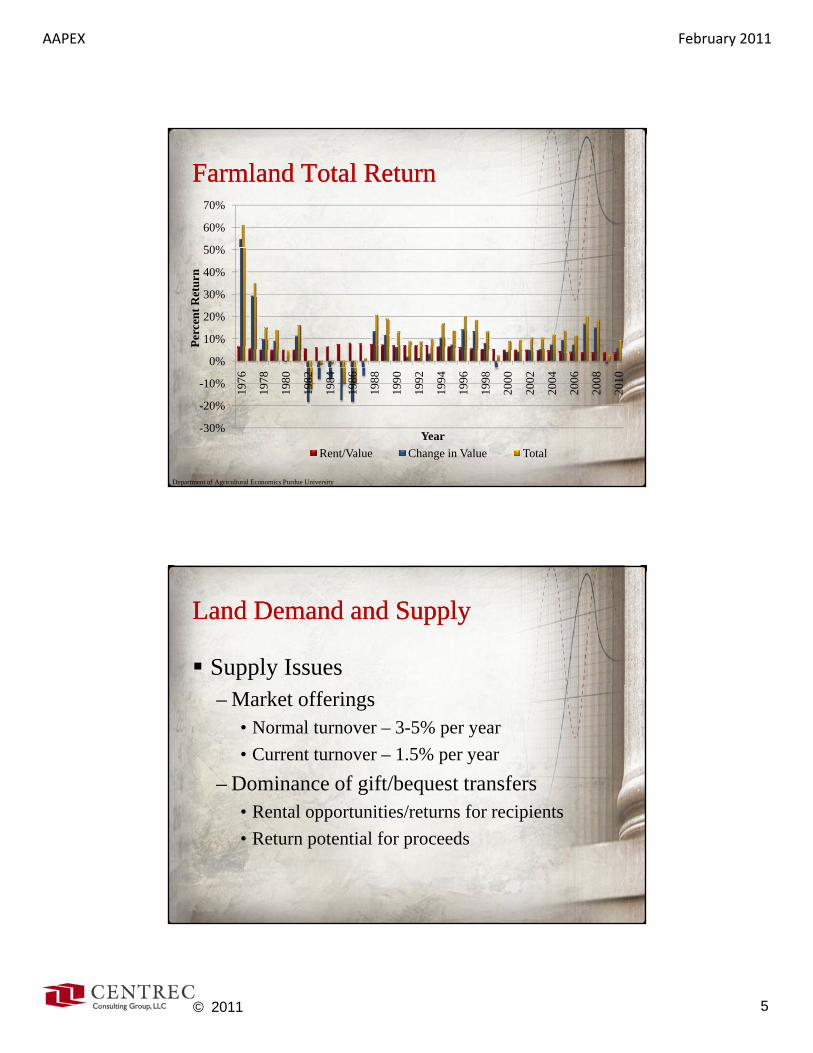
Farmland Total ReturnFarmland Total Return
50%
60%
70%
0%
10%
20%
30%
40%
50%
Perc
ent R
etur
n
-30%
-20%
-10%
1976
1978
1980
1982
1984
1986
1988
1990
1992
1994
1996
1998
2000
2002
2004
2006
2008
2010
YearRent/Value Change in Value Total
Department of Agricultural Economics Purdue University
Land Demand and SupplyLand Demand and Supply
Supply Issues– Market offerings
• Normal turnover – 3-5% per year• Current turnover – 1.5% per year
– Dominance of gift/bequest transfersl i i / f i i• Rental opportunities/returns for recipients
• Return potential for proceeds
AAPEX February 2011
© 2011 6
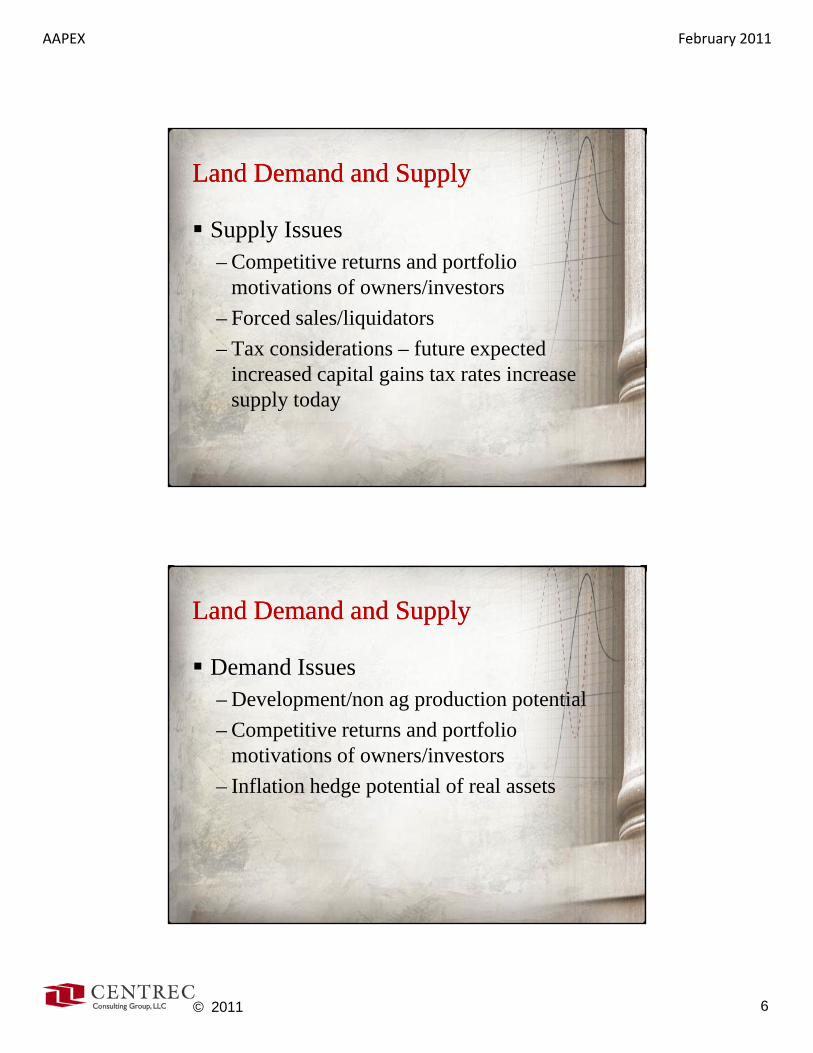
Land Demand and SupplyLand Demand and Supply
Supply Issues– Competitive returns and portfolio
motivations of owners/investors– Forced sales/liquidators– Tax considerations – future expected
i d i l i iincreased capital gains tax rates increase supply today
Land Demand Land Demand and Supplyand Supply
Demand Issues– Development/non ag production potential– Competitive returns and portfolio
motivations of owners/investors– Inflation hedge potential of real assets
AAPEX February 2011
© 2011 7
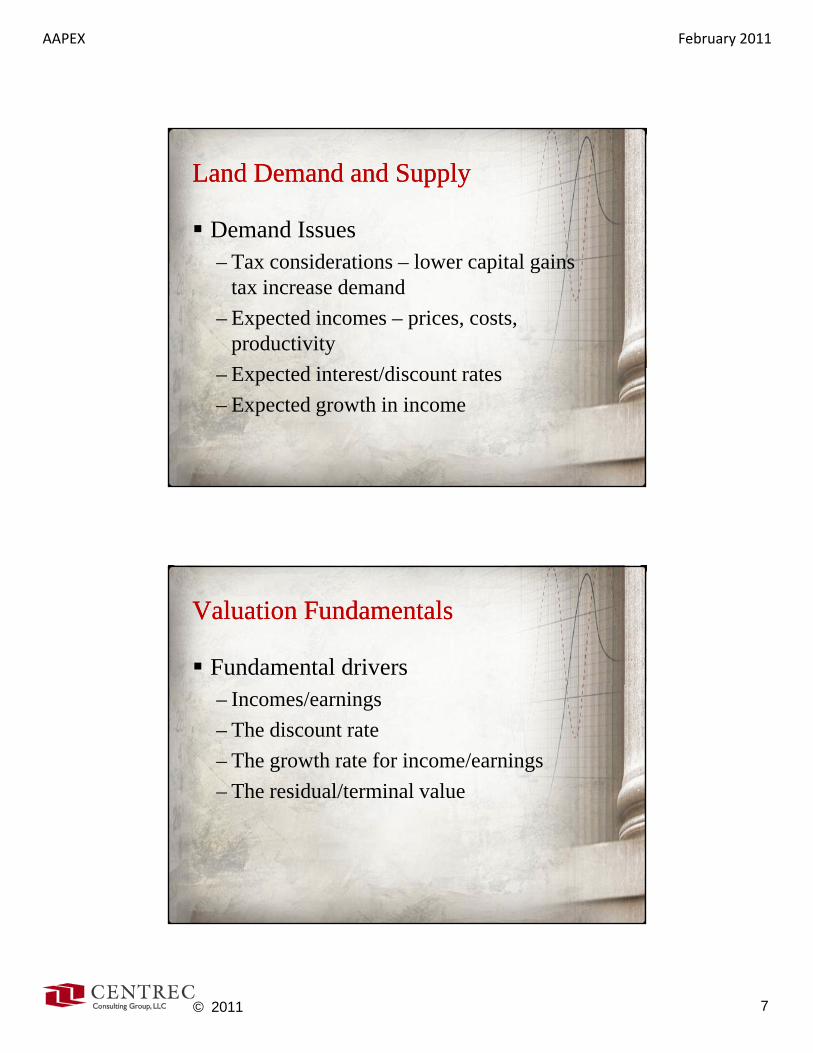
Land Demand Land Demand and Supplyand Supply
Demand Issues– Tax considerations – lower capital gains
tax increase demand– Expected incomes – prices, costs,
productivityE d i /di– Expected interest/discount rates
– Expected growth in income
Valuation FundamentalsValuation Fundamentals
Fundamental drivers– Incomes/earnings– The discount rate– The growth rate for income/earnings– The residual/terminal value
AAPEX February 2011
© 2011 8
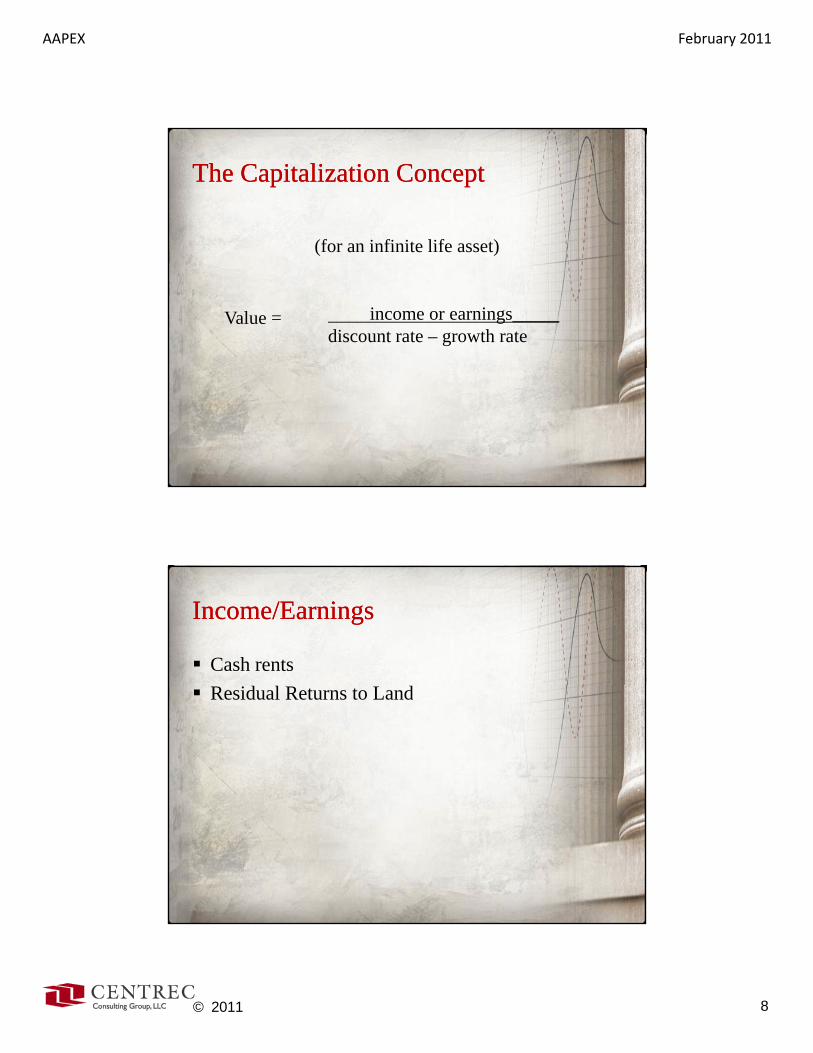
(for an infinite life asset)
The Capitalization ConceptThe Capitalization Concept
(for an infinite life asset)
Value = income or earnings_____discount rate – growth rate
Income/EarningsIncome/Earnings
Cash rentsResidual Returns to Land
AAPEX February 2011
© 2011 9
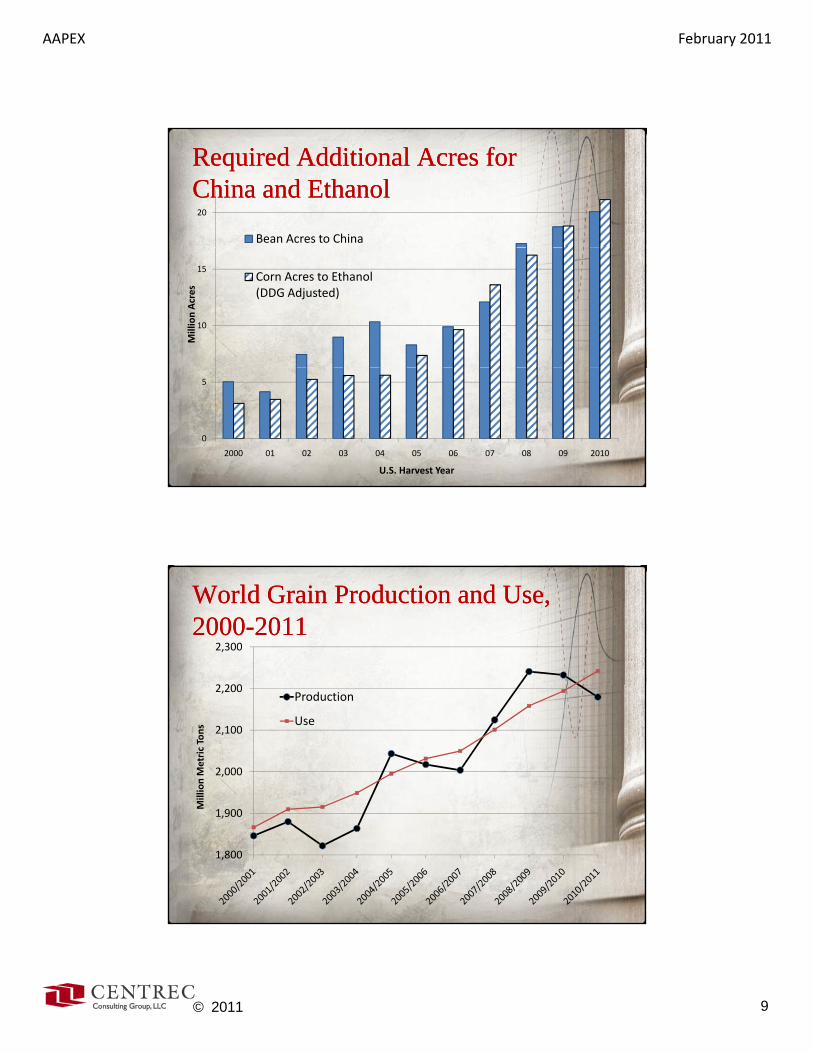
20
Bean Acres to China
Required Additional Acres forRequired Additional Acres forChina and EthanolChina and Ethanol
10
15
Million Acres
Corn Acres to Ethanol (DDG Adjusted)
0
5
2000 01 02 03 04 05 06 07 08 09 2010
U.S. Harvest Year
2 200
2,300
World Grain Production and Use, World Grain Production and Use, 20002000--20112011
2,000
2,100
2,200
Million Metric Tons
Production
Use
1,800
1,900
M

AAPEX February 2011
© 2011 10
Per Acre Cropland Cash Rent, January 1Per Acre Cropland Cash Rent, January 1
$169$180
180
200 3.7% 1.4% 2.9% 4.4% 0.0%
$169
$141
$94 $101
60
80
100
120
140
160
180
$ pe
r ac
re 2006200720082009
0
20
40
60
IL IN IA MO OHState
2010
Source: NASS, USDA
Indiana Cash Rent Per Bu. CornIndiana Cash Rent Per Bu. Corn
1.15
0 65
0.75
0.85
0.95
1.05
$/B
u.
0.55
0.65
1970 1980 1990 2000 2010 2020Year
Top Average Poor
Department of Agricultural Economics Purdue University
AAPEX February 2011
© 2011 11
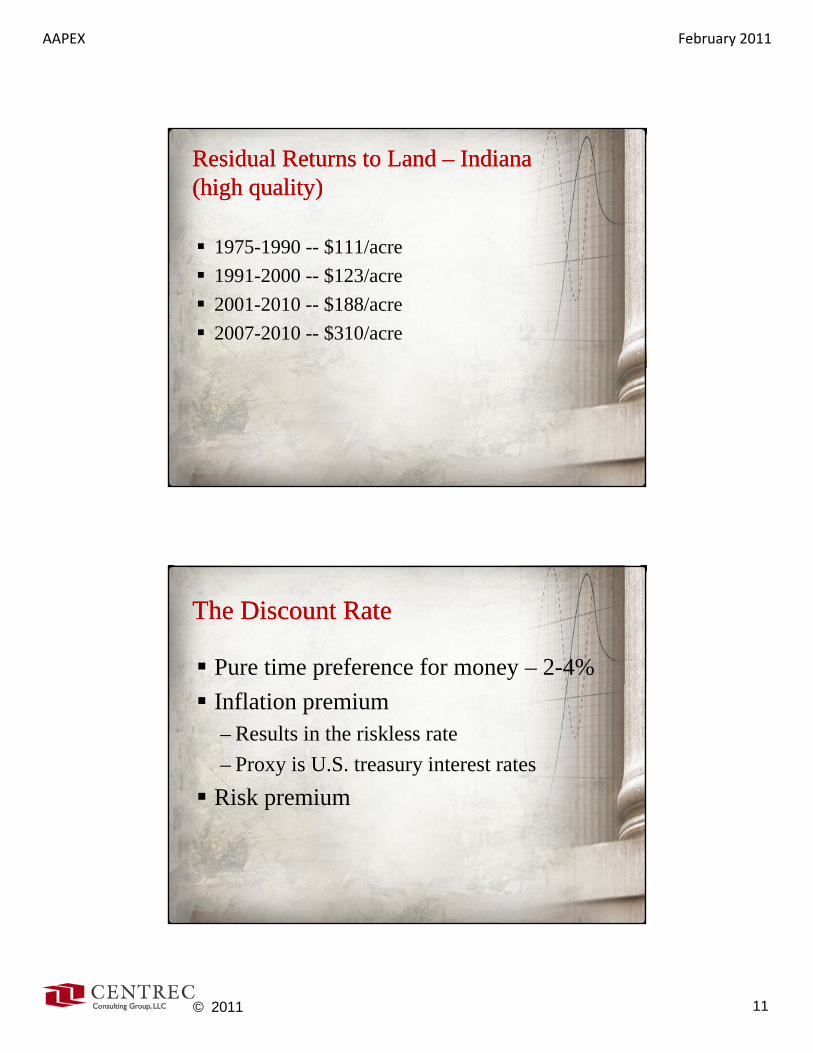
Residual Returns to Land Residual Returns to Land –– Indiana Indiana (high quality)(high quality)
1975 1990 $111/acre1975-1990 -- $111/acre1991-2000 -- $123/acre2001-2010 -- $188/acre2007-2010 -- $310/acre
The Discount RateThe Discount Rate
Pure time preference for money – 2-4%Inflation premium– Results in the riskless rate– Proxy is U.S. treasury interest ratesRisk premiumRisk premium
AAPEX February 2011
© 2011 12
14
16
18
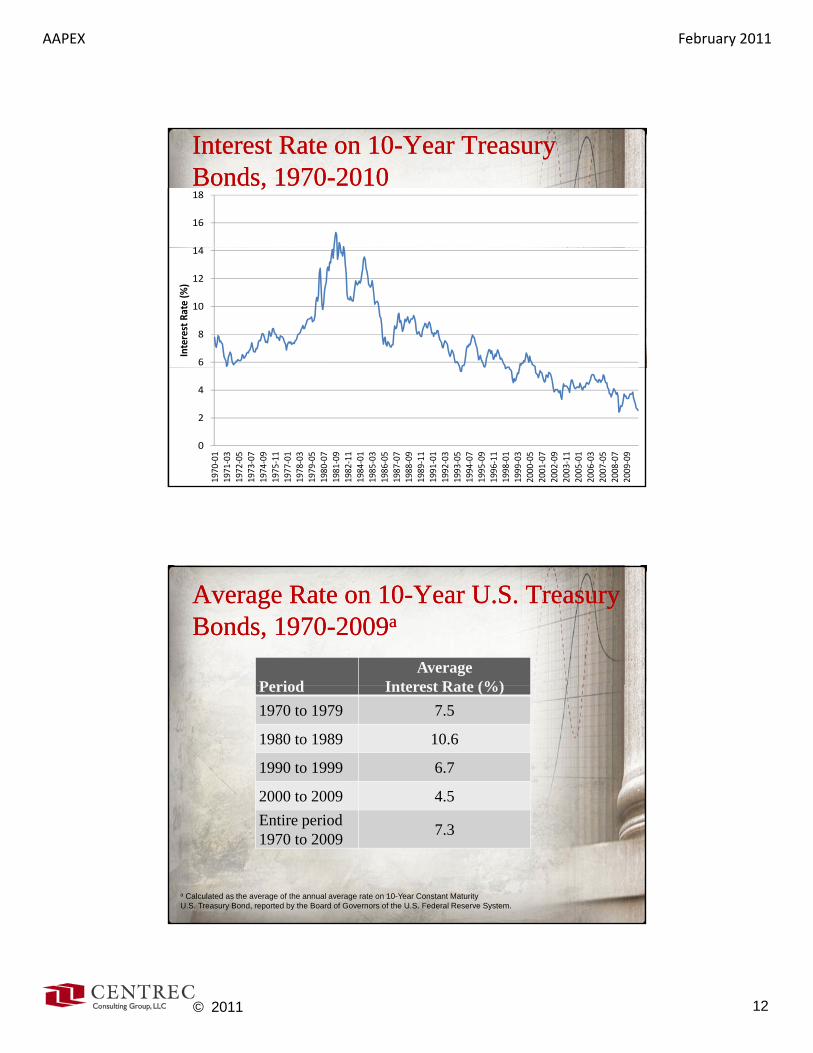
Interest Rate on 10Interest Rate on 10--Year Treasury Year Treasury Bonds, 1970Bonds, 1970--20102010
6
8
10
12
14
Interest Rate (%
)
0
2
4
1970
‐01
1971
‐03
1972
‐05
1973
‐07
1974
‐09
1975
‐11
1977
‐01
1978
‐03
1979
‐05
1980
‐07
1981
‐09
1982
‐11
1984
‐01
1985
‐03
1986
‐05
1987
‐07
1988
‐09
1989
‐11
1991
‐01
1992
‐03
1993
‐05
1994
‐07
1995
‐09
1996
‐11
1998
‐01
1999
‐03
2000
‐05
2001
‐07
2002
‐09
2003
‐11
2005
‐01
2006
‐03
2007
‐05
2008
‐ 07
2009
‐09
PeriodAverage
Interest Rate (%)
Average Rate on 10Average Rate on 10--Year U.S. Treasury Year U.S. Treasury Bonds, 1970Bonds, 1970--20092009aa
Period Interest Rate (%)1970 to 1979 7.5
1980 to 1989 10.6
1990 to 1999 6.7
2000 to 2009 4.5Entire period 1970 to 2009 7.3
a Calculated as the average of the annual average rate on 10-Year Constant Maturity U.S. Treasury Bond, reported by the Board of Governors of the U.S. Federal Reserve System.
AAPEX February 2011
© 2011 13
Risk PremiumRisk Premium
Low for cash rents –a “real” bond – 1-2%Higher for farm operators – 2-4%
The Growth RateThe Growth Rate
Cash rents – 3% Residual returns – 2-3%
AAPEX February 2011
© 2011 14
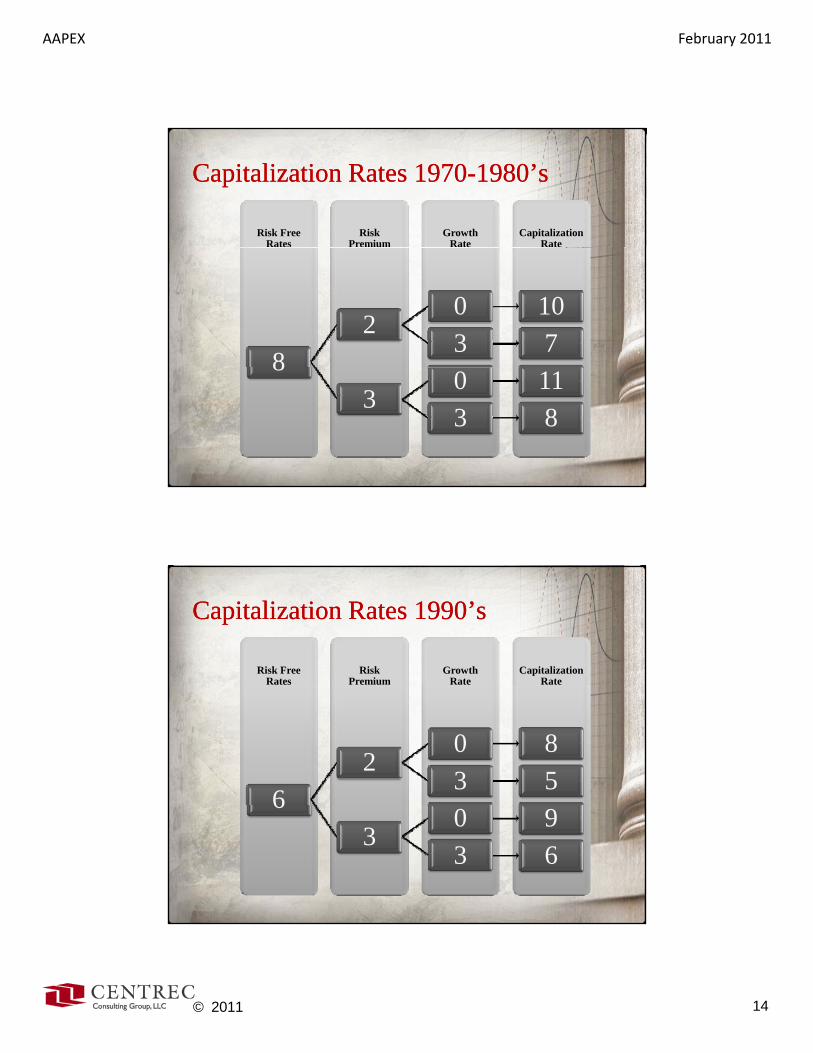
Capitalization Rates 1970Capitalization Rates 1970--1980’s1980’s
Capitalization Rate
GrowthRate
RiskPremium
Risk Free Rates
82
0 103 7
83
0 113 8
Capitalization Rates 1990’sCapitalization Rates 1990’s
Capitalization Rate
GrowthRate
RiskPremium
Risk Free Rates
62
0 83 5
63
0 93 6
AAPEX February 2011
© 2011 15
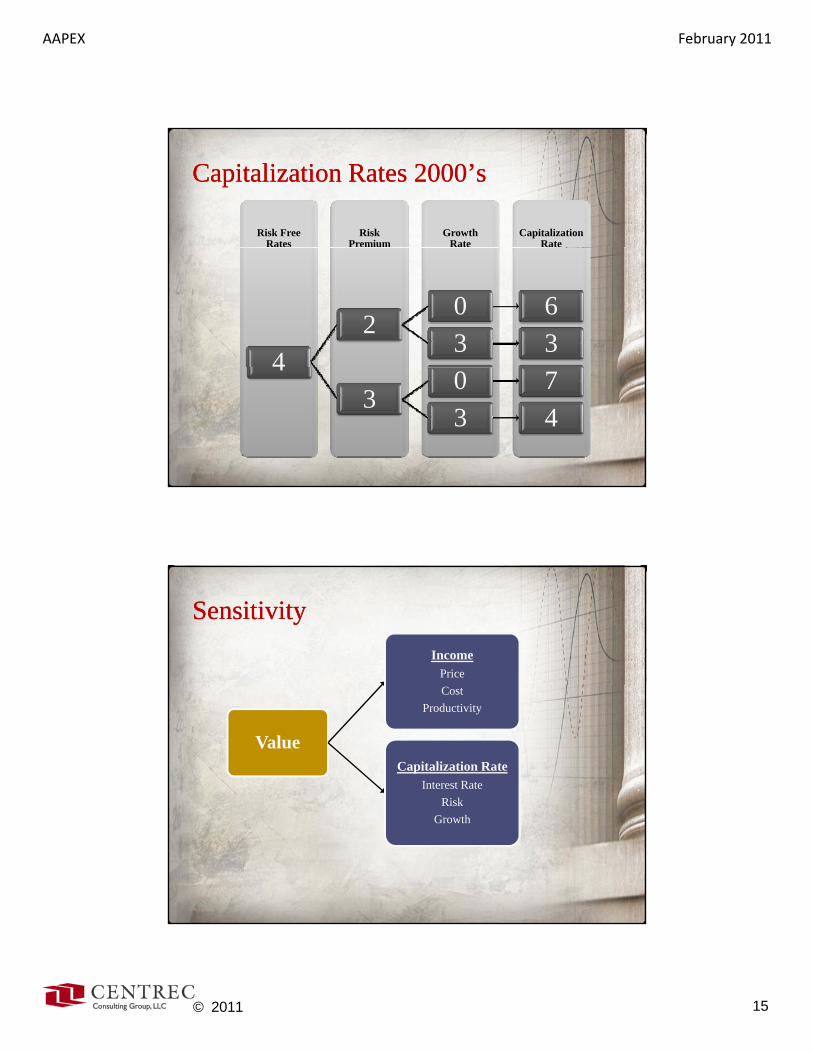
Capitalization Rates 2000’sCapitalization Rates 2000’s
Capitalization Rate
GrowthRate
RiskPremium
Risk Free Rates
42
0 63 3
43
0 73 4
SensitivitySensitivityIncome
Price
Value
CostProductivity
Capitalization RateInterest Rate
RiskRiskGrowth
AAPEX February 2011
© 2011 16
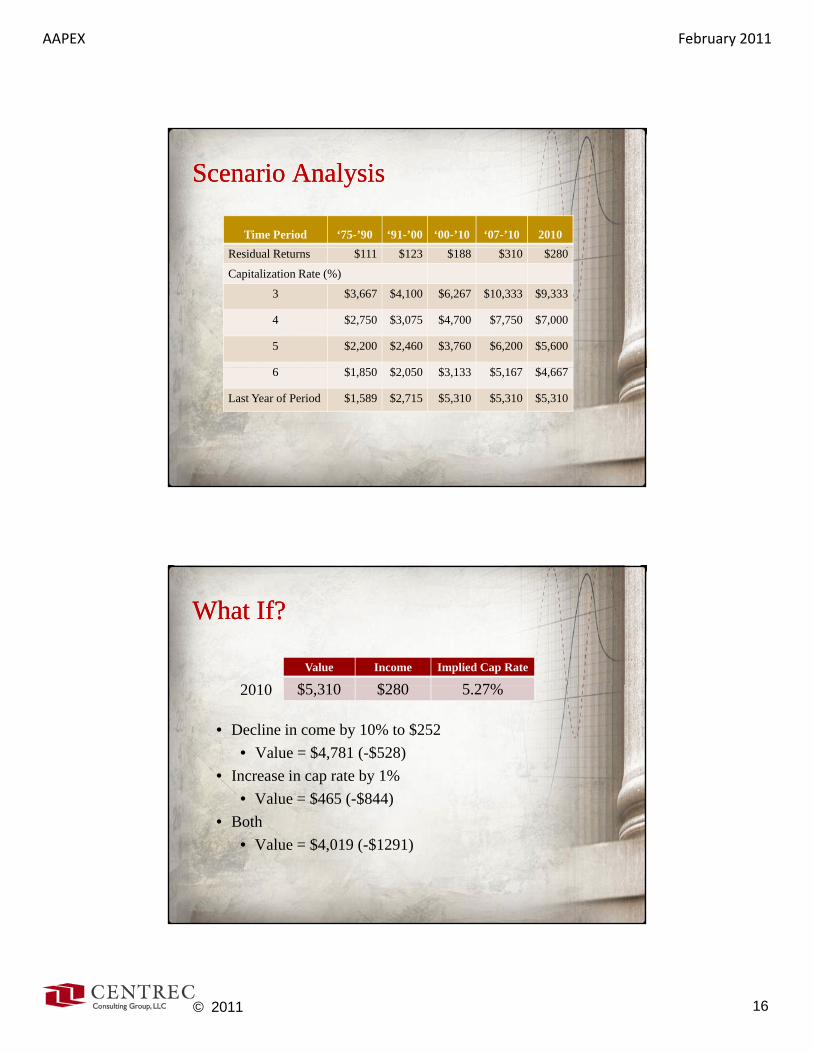
Scenario AnalysisScenario Analysis
Time Period ‘75-’90 ‘91-’00 ‘00-’10 ‘07-’10 2010Residual Returns $111 $123 $188 $310 $280
Capitalization Rate (%)
3 $3,667 $4,100 $6,267 $10,333 $9,333
4 $2,750 $3,075 $4,700 $7,750 $7,000
5 $2,200 $2,460 $3,760 $6,200 $5,600
6 $1,850 $2,050 $3,133 $5,167 $4,667
Last Year of Period $1,589 $2,715 $5,310 $5,310 $5,310
What If?What If?
Value Income Implied Cap Rate
$5 310 $280 5 27%2010
• Decline in come by 10% to $252• Value = $4,781 (-$528)
• Increase in cap rate by 1%• Value = $465 (-$844)
$5,310 $280 5.27%2010
$ ( $ )• Both
• Value = $4,019 (-$1291)
AAPEX February 2011
© 2011 17
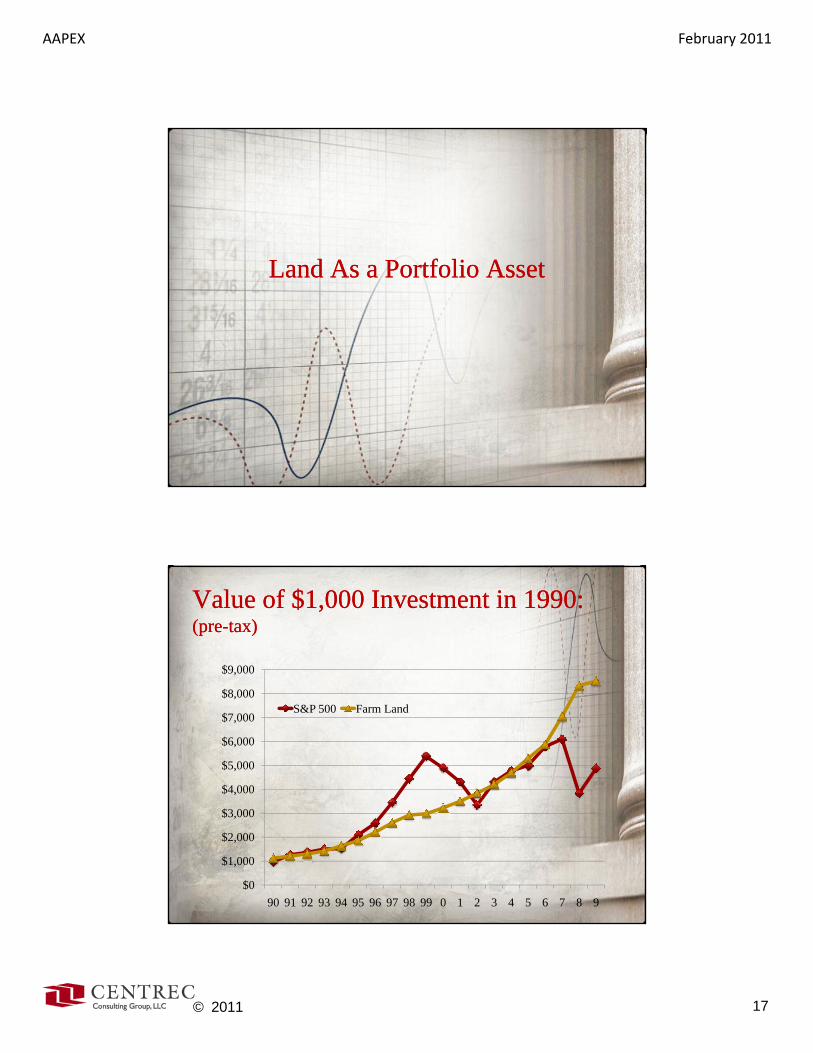
Land As a Portfolio AssetLand As a Portfolio Asset
$9,000
Value of $1,000 Investment in 1990: Value of $1,000 Investment in 1990: (pre(pre--tax)tax)
$4,000
$5,000
$6,000
$7,000
$8,000S&P 500 Farm Land
$0
$1,000
$2,000
$3,000
90 91 92 93 94 95 96 97 98 99 0 1 2 3 4 5 6 7 8 9
AAPEX February 2011
© 2011 18
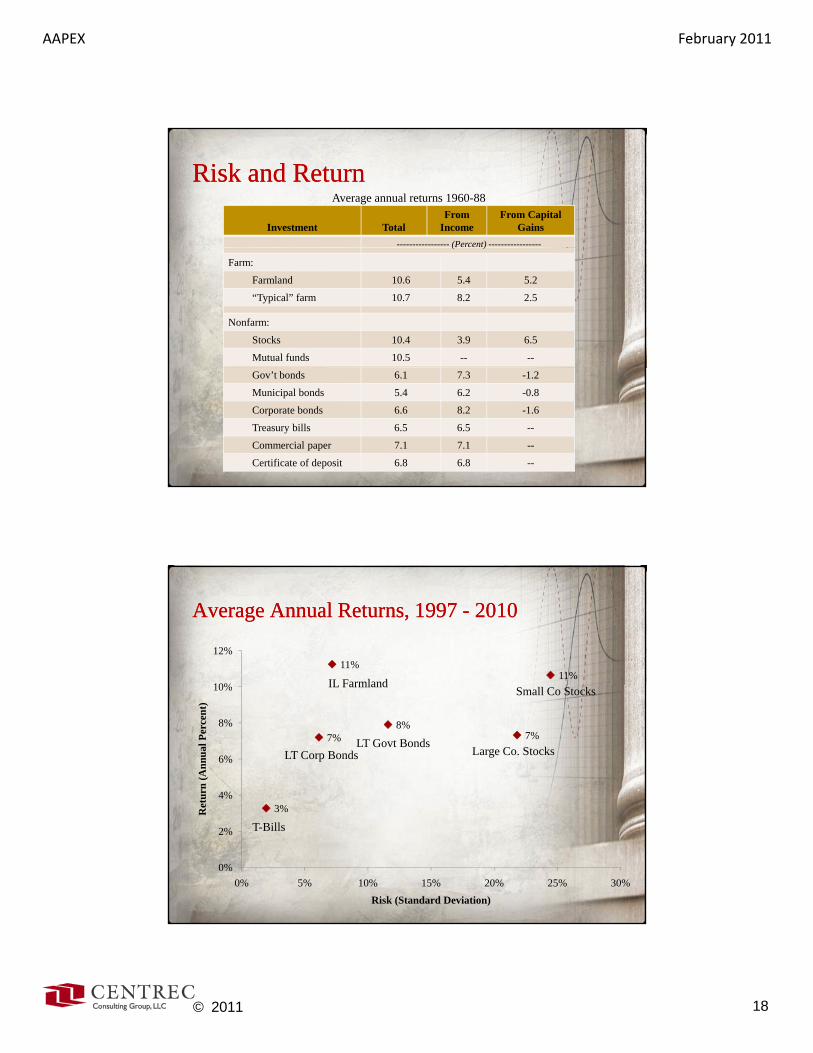
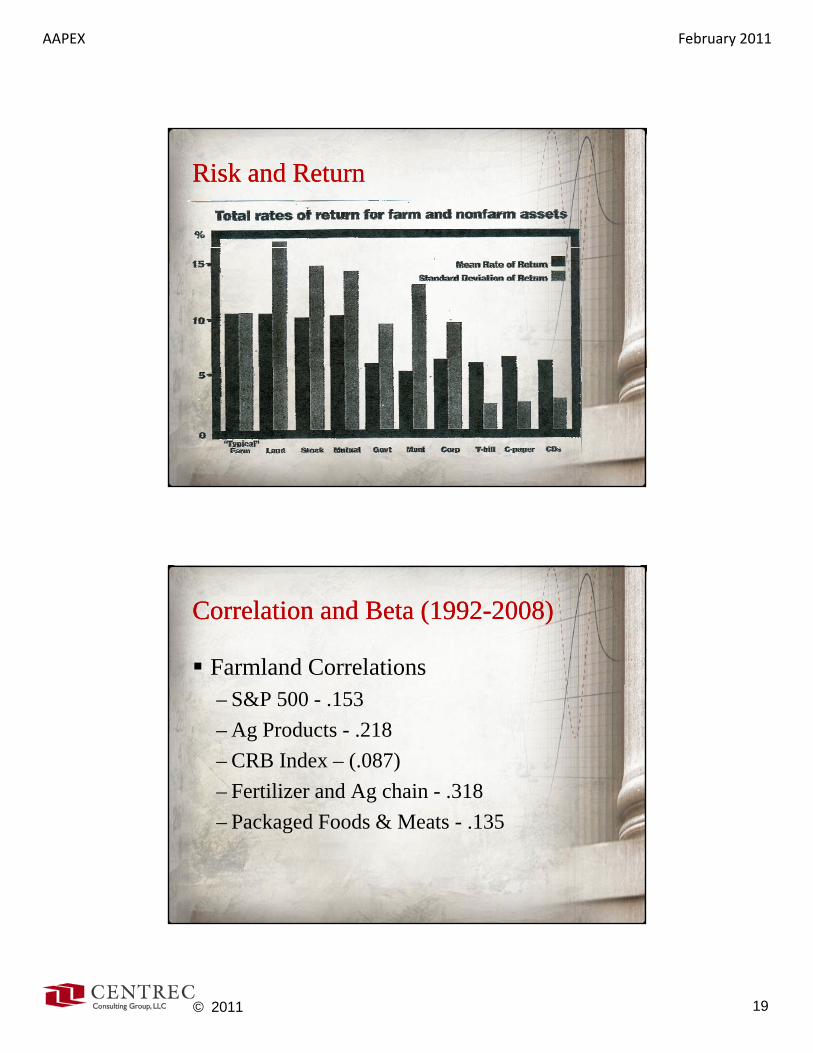
Risk and ReturnRisk and Return
Investment TotalFrom
IncomeFrom Capital
Gains----------------- (Percent) -----------------
Average annual returns 1960-88
( )
Farm:
Farmland 10.6 5.4 5.2
“Typical” farm 10.7 8.2 2.5
Nonfarm:
Stocks 10.4 3.9 6.5
Mutual funds 10.5 -- --
Gov’t bonds 6.1 7.3 -1.2
Municipal bonds 5.4 6.2 -0.8
Corporate bonds 6.6 8.2 -1.6
Treasury bills 6.5 6.5 --
Commercial paper 7.1 7.1 --
Certificate of deposit 6.8 6.8 --
Average Annual Returns, 1997 Average Annual Returns, 1997 -- 20102010
11%11%
10%
12%
IL Farmland
7%7%8%
%4%
6%
8%
10%
etur
n (A
nnua
l Per
cent
)
IL Farmland
Large Co. Stocks
Small Co Stocks
LT Corp BondsLT Govt Bonds
3%
0%
2%
0% 5% 10% 15% 20% 25% 30%
Re
Risk (Standard Deviation)
T-Bills
AAPEX February 2011
© 2011 19
Risk and ReturnRisk and Return
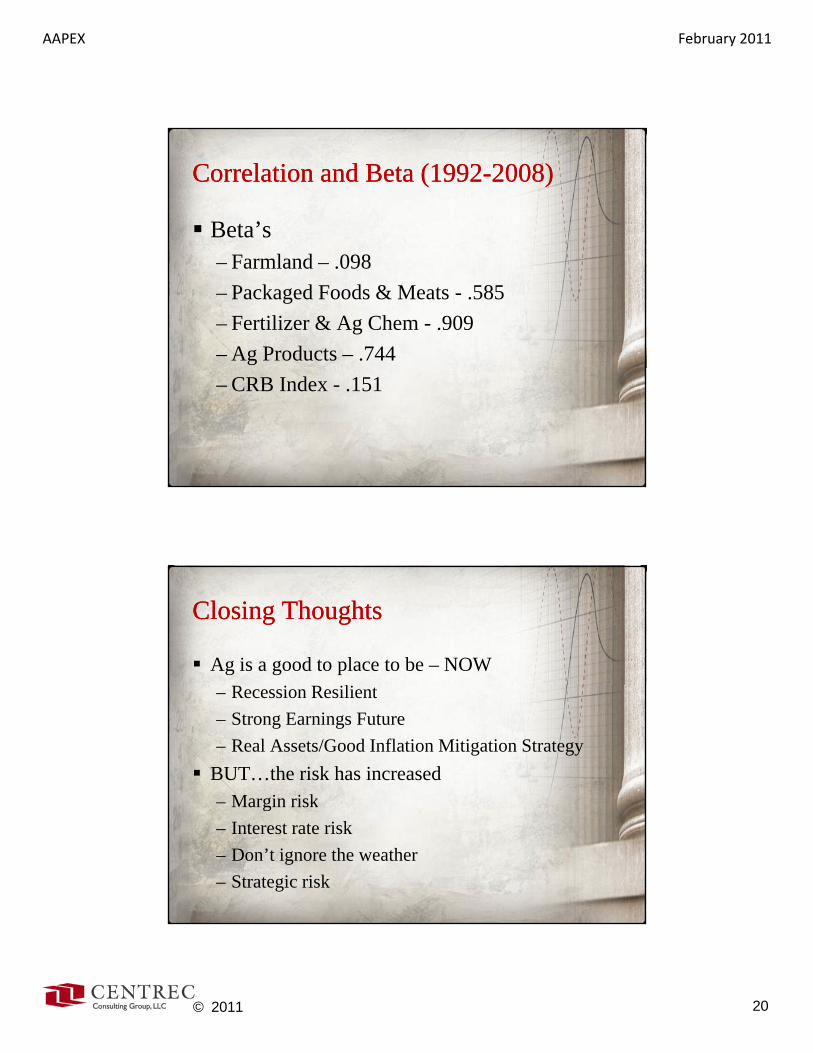
Correlation and Beta (1992Correlation and Beta (1992--2008)2008)
Farmland Correlations– S&P 500 - .153– Ag Products - .218– CRB Index – (.087)– Fertilizer and Ag chain - .318– Packaged Foods & Meats - .135
AAPEX February 2011
© 2011 20
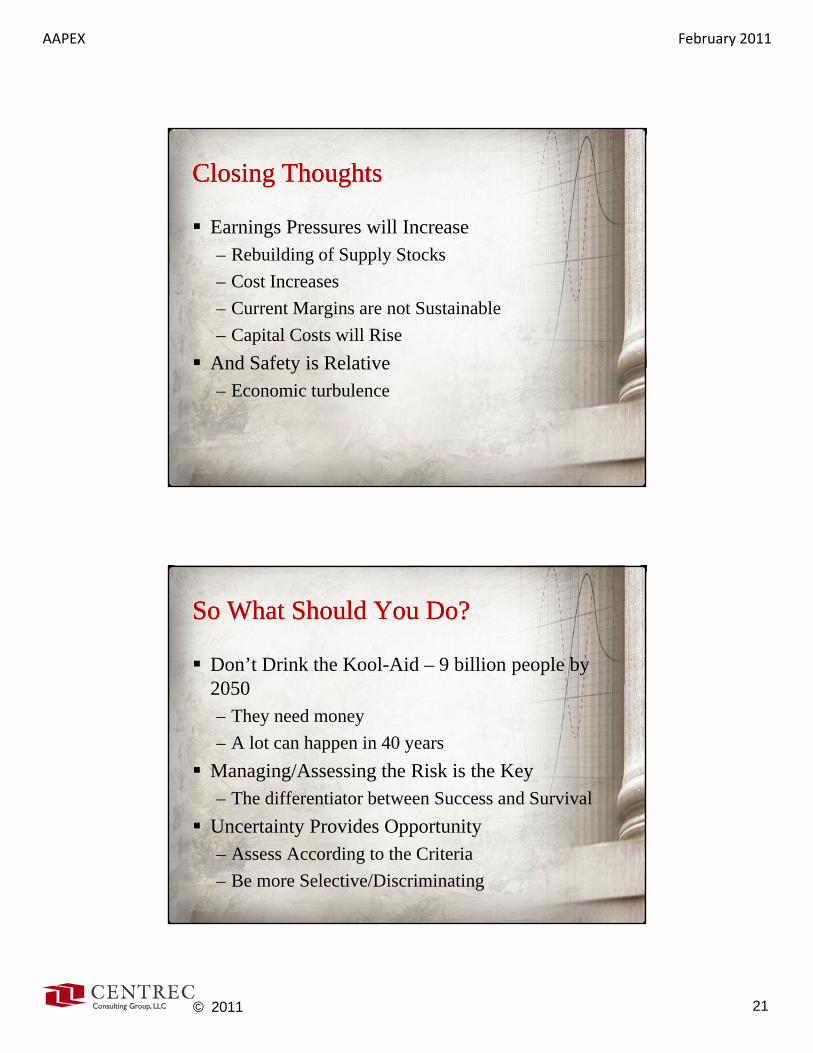
Correlation and Beta (1992Correlation and Beta (1992--2008)2008)
Beta’s– Farmland – .098– Packaged Foods & Meats - .585– Fertilizer & Ag Chem - .909– Ag Products – .744– CRB Index - .151
Closing ThoughtsClosing Thoughts
Ag is a good to place to be – NOWi ili– Recession Resilient
– Strong Earnings Future– Real Assets/Good Inflation Mitigation Strategy
BUT…the risk has increased– Margin riskMargin risk– Interest rate risk– Don’t ignore the weather– Strategic risk
AAPEX February 2011
© 2011 21
Closing ThoughtsClosing Thoughts
Earnings Pressures will Increaseb ildi f l k– Rebuilding of Supply Stocks
– Cost Increases– Current Margins are not Sustainable– Capital Costs will Rise
And Safety is RelativeAnd Safety is Relative– Economic turbulence
So What Should You Do?So What Should You Do?
Don’t Drink the Kool-Aid – 9 billion people by 20502050– They need money– A lot can happen in 40 years
Managing/Assessing the Risk is the Key– The differentiator between Success and Survival
Uncertainty Provides Opportunity– Assess According to the Criteria– Be more Selective/Discriminating
AAPEX February 2011
© 2011 22
So What Should You Do?So What Should You Do?
Manage operating/financial Risk in your current b i t tbusiness so you can capture new venturesIncrease your hurdle rate for new ventures –risk is higher, you need a higher returnLock in interest rates and deleverage – maybe it’s time to take some money off the table
Thanks!!Thanks!!