Embed Size (px)
Citation preview
The FARMLAND INFORMATION CENTER (FIC) is a clearinghouse for information about farmland protection and stewardship.The FIC is a public/private partnership between the USDA Natural Resources Conservation Service and American Farmland Trust.
A m e r i c a n f a r m l a n d t r u s t · F a r m l a n d i n f o r m a t i o n c e n t e r
FACTSHEET
COST OF
COMMUNITY
SERVICES
STUDIES
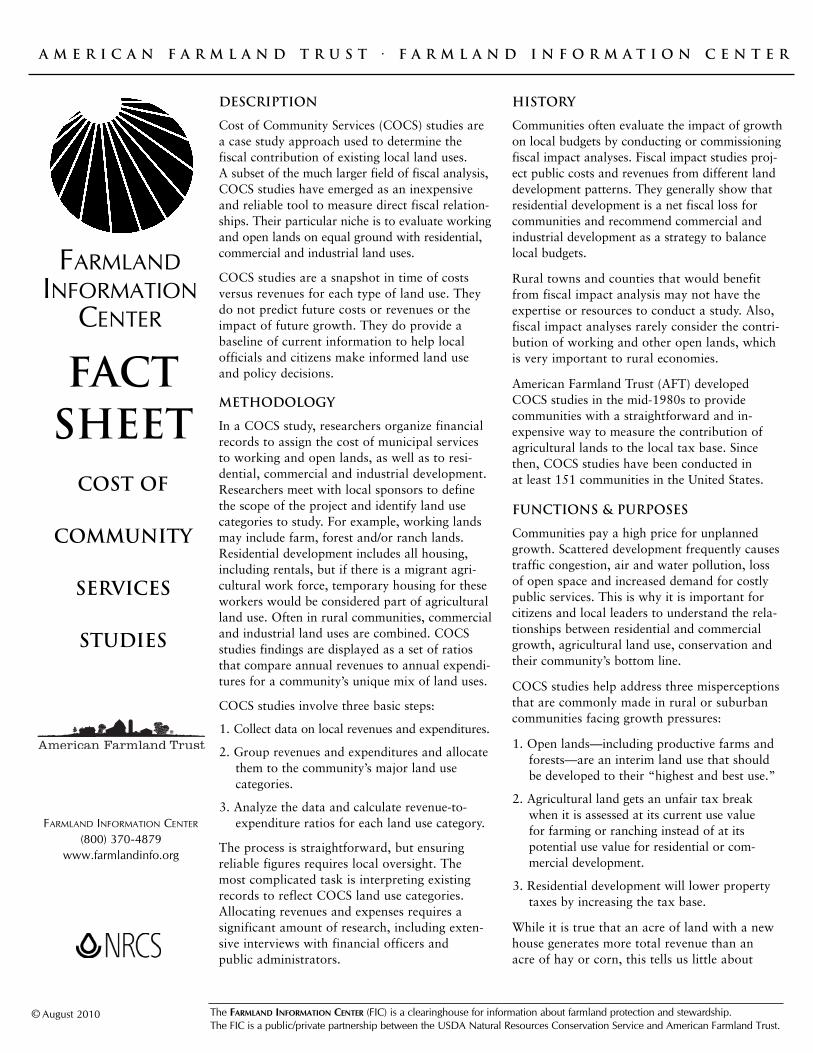
DESCRIPTION
Cost of Community Services (COCS) studies area case study approach used to determine the fiscal contribution of existing local land uses. A subset of the much larger field of fiscal analysis,COCS studies have emerged as an inexpensiveand reliable tool to measure direct fiscal relation-ships. Their particular niche is to evaluate workingand open lands on equal ground with residential,commercial and industrial land uses.
COCS studies are a snapshot in time of costsversus revenues for each type of land use. Theydo not predict future costs or revenues or theimpact of future growth. They do provide abaseline of current information to help local officials and citizens make informed land use and policy decisions.
METHODOLOGY
In a COCS study, researchers organize financialrecords to assign the cost of municipal servicesto working and open lands, as well as to resi-dential, commercial and industrial development.Researchers meet with local sponsors to definethe scope of the project and identify land usecategories to study. For example, working landsmay include farm, forest and/or ranch lands.Residential development includes all housing,including rentals, but if there is a migrant agri-cultural work force, temporary housing for theseworkers would be considered part of agriculturalland use. Often in rural communities, commercialand industrial land uses are combined. COCSstudies findings are displayed as a set of ratiosthat compare annual revenues to annual expendi-tures for a community’s unique mix of land uses.
COCS studies involve three basic steps:
1. Collect data on local revenues and expenditures.
2. Group revenues and expenditures and allocatethem to the community’s major land usecategories.
3. Analyze the data and calculate revenue-to-expenditure ratios for each land use category.
The process is straightforward, but ensuring reliable figures requires local oversight. The most complicated task is interpreting existingrecords to reflect COCS land use categories.Allocating revenues and expenses requires a significant amount of research, including exten-sive interviews with financial officers and public administrators.
HISTORY
Communities often evaluate the impact of growthon local budgets by conducting or commissioningfiscal impact analyses. Fiscal impact studies proj-ect public costs and revenues from different landdevelopment patterns. They generally show thatresidential development is a net fiscal loss forcommunities and recommend commercial andindustrial development as a strategy to balancelocal budgets.
Rural towns and counties that would benefitfrom fiscal impact analysis may not have theexpertise or resources to conduct a study. Also,fiscal impact analyses rarely consider the contri-bution of working and other open lands, whichis very important to rural economies.
American Farmland Trust (AFT) developedCOCS studies in the mid-1980s to providecommunities with a straightforward and in-expensive way to measure the contribution ofagricultural lands to the local tax base. Sincethen, COCS studies have been conducted in at least 151 communities in the United States.
FUNCTIONS & PURPOSES
Communities pay a high price for unplannedgrowth. Scattered development frequently causestraffic congestion, air and water pollution, lossof open space and increased demand for costlypublic services. This is why it is important forcitizens and local leaders to understand the rela-tionships between residential and commercialgrowth, agricultural land use, conservation andtheir community’s bottom line.
COCS studies help address three misperceptionsthat are commonly made in rural or suburbancommunities facing growth pressures:
1. Open lands—including productive farms andforests—are an interim land use that shouldbe developed to their “highest and best use.”
2. Agricultural land gets an unfair tax breakwhen it is assessed at its current use value for farming or ranching instead of at its potential use value for residential or com-mercial development.
3. Residential development will lower propertytaxes by increasing the tax base.
While it is true that an acre of land with a newhouse generates more total revenue than an acre of hay or corn, this tells us little about
FARMLANDINFORMATION
CENTER
© August 2010
FARMLAND INFORMATION CENTER
(800) 370-4879www.farmlandinfo.org
A M E R I C A N F A R M L A N D T R U S T F A R M L A N D I N F O R M A T I O N C E N T E R
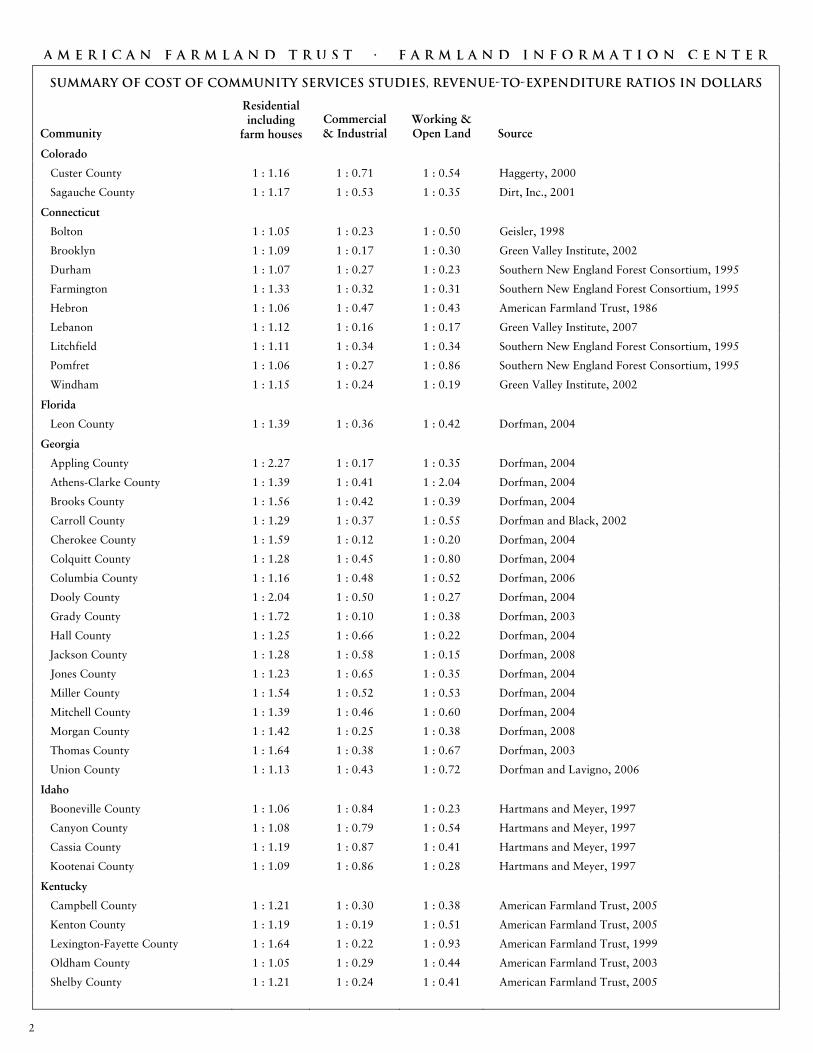
SUMMARY OF COST OF COMMUNITY SERVICES STUDIES, REVENUE-TO-EXPENDITURE RATIOS IN DOLLARS
Community
Residential including
farm houses Commercial & Industrial
Working &Open Land Source
Colorado
Custer County 1 : 1.16 1 : 0.71 1 : 0.54 Haggerty, 2000
Sagauche County 1 : 1.17 1 : 0.53 1 : 0.35 Dirt, Inc., 2001
Connecticut
Bolton 1 : 1.05 1 : 0.23 1 : 0.50 Geisler, 1998
Brooklyn 1 : 1.09 1 : 0.17 1 : 0.30 Green Valley Institute, 2002
Durham 1 : 1.07 1 : 0.27 1 : 0.23 Southern New England Forest Consortium, 1995
Farmington 1 : 1.33 1 : 0.32 1 : 0.31 Southern New England Forest Consortium, 1995
Hebron 1 : 1.06 1 : 0.47 1 : 0.43 American Farmland Trust, 1986
Lebanon 1 : 1.12 1 : 0.16 1 : 0.17 Green Valley Institute, 2007
Litchfield 1 : 1.11 1 : 0.34 1 : 0.34 Southern New England Forest Consortium, 1995
Pomfret 1 : 1.06 1 : 0.27 1 : 0.86 Southern New England Forest Consortium, 1995
Windham 1 : 1.15 1 : 0.24 1 : 0.19 Green Valley Institute, 2002
Florida
Leon County 1 : 1.39 1 : 0.36 1 : 0.42 Dorfman, 2004
Georgia
Appling County 1 : 2.27 1 : 0.17 1 : 0.35 Dorfman, 2004
Athens-Clarke County 1 : 1.39 1 : 0.41 1 : 2.04 Dorfman, 2004
Brooks County 1 : 1.56 1 : 0.42 1 : 0.39 Dorfman, 2004
Carroll County 1 : 1.29 1 : 0.37 1 : 0.55 Dorfman and Black, 2002
Cherokee County 1 : 1.59 1 : 0.12 1 : 0.20 Dorfman, 2004
Colquitt County 1 : 1.28 1 : 0.45 1 : 0.80 Dorfman, 2004
Columbia County 1 : 1.16 1 : 0.48 1 : 0.52 Dorfman, 2006
Dooly County 1 : 2.04 1 : 0.50 1 : 0.27 Dorfman, 2004
Grady County 1 : 1.72 1 : 0.10 1 : 0.38 Dorfman, 2003
Hall County 1 : 1.25 1 : 0.66 1 : 0.22 Dorfman, 2004
Jackson County 1 : 1.28 1 : 0.58 1 : 0.15 Dorfman, 2008
Jones County 1 : 1.23 1 : 0.65 1 : 0.35 Dorfman, 2004
Miller County 1 : 1.54 1 : 0.52 1 : 0.53 Dorfman, 2004
Mitchell County 1 : 1.39 1 : 0.46 1 : 0.60 Dorfman, 2004
Morgan County 1 : 1.42 1 : 0.25 1 : 0.38 Dorfman, 2008
Thomas County 1 : 1.64 1 : 0.38 1 : 0.67 Dorfman, 2003
Union County 1 : 1.13 1 : 0.43 1 : 0.72 Dorfman and Lavigno, 2006
Idaho
Booneville County 1 : 1.06 1 : 0.84 1 : 0.23 Hartmans and Meyer, 1997
Canyon County 1 : 1.08 1 : 0.79 1 : 0.54 Hartmans and Meyer, 1997
Cassia County 1 : 1.19 1 : 0.87 1 : 0.41 Hartmans and Meyer, 1997
Kootenai County 1 : 1.09 1 : 0.86 1 : 0.28 Hartmans and Meyer, 1997
Kentucky
Campbell County 1 : 1.21 1 : 0.30 1 : 0.38 American Farmland Trust, 2005
Kenton County 1 : 1.19 1 : 0.19 1 : 0.51 American Farmland Trust, 2005
Lexington-Fayette County 1 : 1.64 1 : 0.22 1 : 0.93 American Farmland Trust, 1999
Oldham County 1 : 1.05 1 : 0.29 1 : 0.44 American Farmland Trust, 2003
Shelby County 1 : 1.21 1 : 0.24 1 : 0.41 American Farmland Trust, 2005
2
A M E R I C A N F A R M L A N D T R U S T F A R M L A N D I N F O R M A T I O N C E N T E R
SUMMARY OF COST OF COMMUNITY SERVICES STUDIES, REVENUE-TO-EXPENDITURE RATIOS IN DOLLARS
Community
Residential including
farm houses Commercial & Industrial
Working &Open Land Source
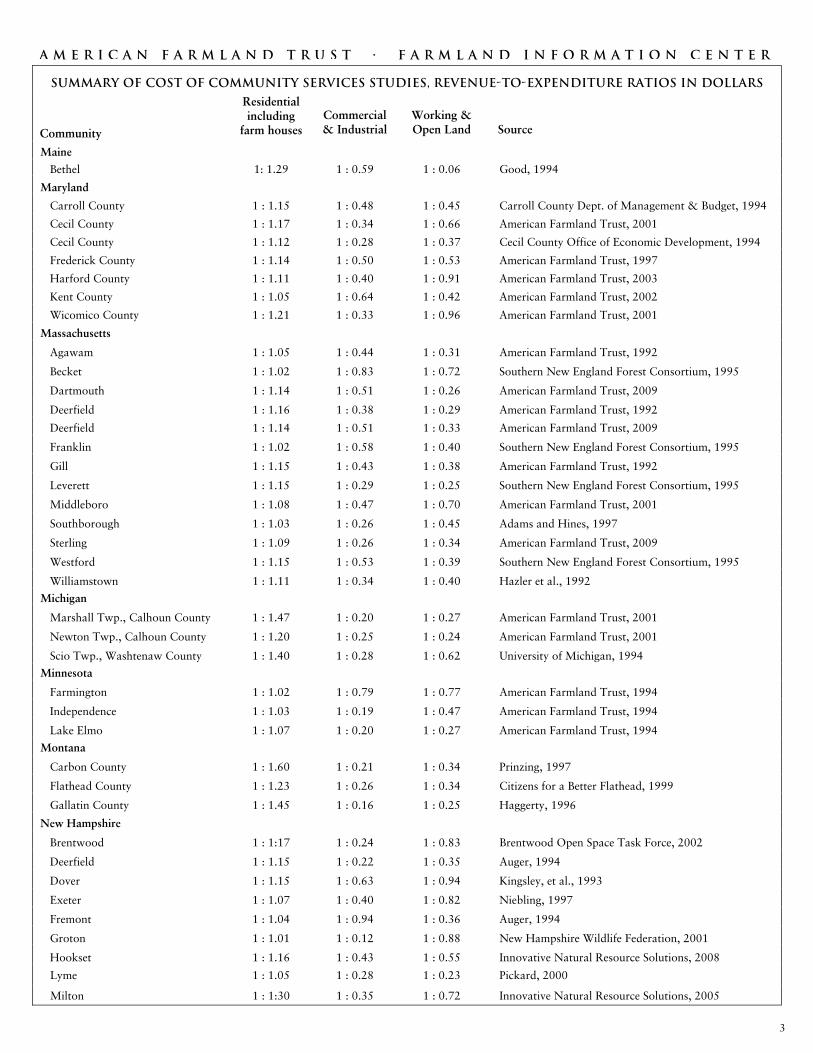
Maine
Bethel 1: 1.29 1 : 0.59 1 : 0.06 Good, 1994
Maryland
Carroll County 1 : 1.15 1 : 0.48 1 : 0.45 Carroll County Dept. of Management & Budget, 1994
Cecil County 1 : 1.17 1 : 0.34 1 : 0.66 American Farmland Trust, 2001
Cecil County 1 : 1.12 1 : 0.28 1 : 0.37 Cecil County Office of Economic Development, 1994
Frederick County 1 : 1.14 1 : 0.50 1 : 0.53 American Farmland Trust, 1997
Harford County 1 : 1.11 1 : 0.40 1 : 0.91 American Farmland Trust, 2003
Kent County 1 : 1.05 1 : 0.64 1 : 0.42 American Farmland Trust, 2002
Wicomico County 1 : 1.21 1 : 0.33 1 : 0.96 American Farmland Trust, 2001
Massachusetts
Agawam 1 : 1.05 1 : 0.44 1 : 0.31 American Farmland Trust, 1992
Becket 1 : 1.02 1 : 0.83 1 : 0.72 Southern New England Forest Consortium, 1995
Dartmouth 1 : 1.14 1 : 0.51 1 : 0.26 American Farmland Trust, 2009
Deerfield 1 : 1.16 1 : 0.38 1 : 0.29 American Farmland Trust, 1992
Deerfield 1 : 1.14 1 : 0.51 1 : 0.33 American Farmland Trust, 2009
Franklin 1 : 1.02 1 : 0.58 1 : 0.40 Southern New England Forest Consortium, 1995
Gill 1 : 1.15 1 : 0.43 1 : 0.38 American Farmland Trust, 1992
Leverett 1 : 1.15 1 : 0.29 1 : 0.25 Southern New England Forest Consortium, 1995
Middleboro 1 : 1.08 1 : 0.47 1 : 0.70 American Farmland Trust, 2001
Southborough 1 : 1.03 1 : 0.26 1 : 0.45 Adams and Hines, 1997
Sterling 1 : 1.09 1 : 0.26 1 : 0.34 American Farmland Trust, 2009
Westford 1 : 1.15 1 : 0.53 1 : 0.39 Southern New England Forest Consortium, 1995
Williamstown 1 : 1.11 1 : 0.34 1 : 0.40 Hazler et al., 1992
Michigan
Marshall Twp., Calhoun County 1 : 1.47 1 : 0.20 1 : 0.27 American Farmland Trust, 2001
Newton Twp., Calhoun County 1 : 1.20 1 : 0.25 1 : 0.24 American Farmland Trust, 2001
Scio Twp., Washtenaw County 1 : 1.40 1 : 0.28 1 : 0.62 University of Michigan, 1994
Minnesota
Farmington 1 : 1.02 1 : 0.79 1 : 0.77 American Farmland Trust, 1994
Independence 1 : 1.03 1 : 0.19 1 : 0.47 American Farmland Trust, 1994
Lake Elmo 1 : 1.07 1 : 0.20 1 : 0.27 American Farmland Trust, 1994
Montana
Carbon County 1 : 1.60 1 : 0.21 1 : 0.34 Prinzing, 1997
Flathead County 1 : 1.23 1 : 0.26 1 : 0.34 Citizens for a Better Flathead, 1999
Gallatin County 1 : 1.45 1 : 0.16 1 : 0.25 Haggerty, 1996
New Hampshire
Brentwood 1 : 1:17 1 : 0.24 1 : 0.83 Brentwood Open Space Task Force, 2002
Deerfield 1 : 1.15 1 : 0.22 1 : 0.35 Auger, 1994
Dover 1 : 1.15 1 : 0.63 1 : 0.94 Kingsley, et al., 1993
Exeter 1 : 1.07 1 : 0.40 1 : 0.82 Niebling, 1997
Fremont 1 : 1.04 1 : 0.94 1 : 0.36 Auger, 1994
Groton 1 : 1.01 1 : 0.12 1 : 0.88 New Hampshire Wildlife Federation, 2001
Hookset 1 : 1.16 1 : 0.43 1 : 0.55 Innovative Natural Resource Solutions, 2008
Lyme 1 : 1.05 1 : 0.28 1 : 0.23 Pickard, 2000
Milton 1 : 1:30 1 : 0.35 1 : 0.72 Innovative Natural Resource Solutions, 2005
3
A M E R I C A N F A R M L A N D T R U S T F A R M L A N D I N F O R M A T I O N C E N T E R
SUMMARY OF COST OF COMMUNITY SERVICES STUDIES, REVENUE-TO-EXPENDITURE RATIOS IN DOLLARS
Community
Residential including
farm houses Commercial &
Industrial Working & Open Land Source
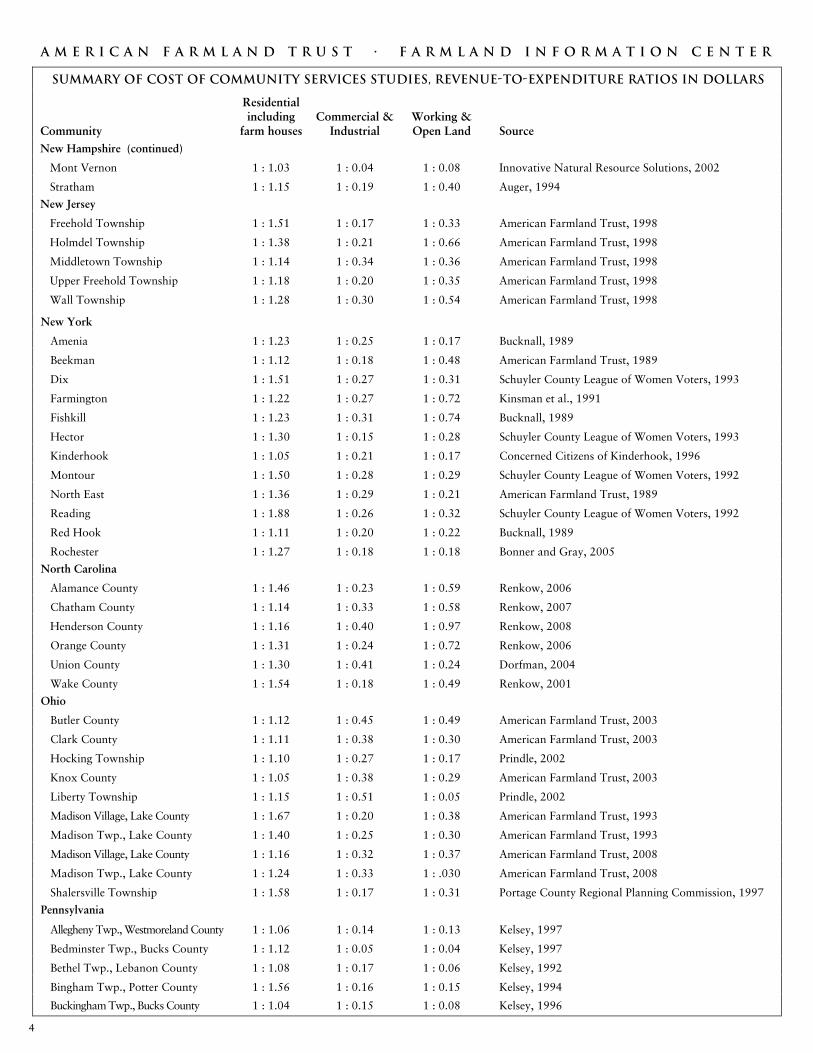
New Hampshire (continued)
Mont Vernon 1 : 1.03 1 : 0.04 1 : 0.08 Innovative Natural Resource Solutions, 2002
Stratham 1 : 1.15 1 : 0.19 1 : 0.40 Auger, 1994
New Jersey
Freehold Township 1 : 1.51 1 : 0.17 1 : 0.33 American Farmland Trust, 1998
Holmdel Township 1 : 1.38 1 : 0.21 1 : 0.66 American Farmland Trust, 1998
Middletown Township 1 : 1.14 1 : 0.34 1 : 0.36 American Farmland Trust, 1998
Upper Freehold Township 1 : 1.18 1 : 0.20 1 : 0.35 American Farmland Trust, 1998
Wall Township 1 : 1.28 1 : 0.30 1 : 0.54 American Farmland Trust, 1998
New York
Amenia 1 : 1.23 1 : 0.25 1 : 0.17 Bucknall, 1989
Beekman 1 : 1.12 1 : 0.18 1 : 0.48 American Farmland Trust, 1989
Dix 1 : 1.51 1 : 0.27 1 : 0.31 Schuyler County League of Women Voters, 1993
Farmington 1 : 1.22 1 : 0.27 1 : 0.72 Kinsman et al., 1991
Fishkill 1 : 1.23 1 : 0.31 1 : 0.74 Bucknall, 1989
Hector 1 : 1.30 1 : 0.15 1 : 0.28 Schuyler County League of Women Voters, 1993
Kinderhook 1 : 1.05 1 : 0.21 1 : 0.17 Concerned Citizens of Kinderhook, 1996
Montour 1 : 1.50 1 : 0.28 1 : 0.29 Schuyler County League of Women Voters, 1992
North East 1 : 1.36 1 : 0.29 1 : 0.21 American Farmland Trust, 1989
Reading 1 : 1.88 1 : 0.26 1 : 0.32 Schuyler County League of Women Voters, 1992
Red Hook 1 : 1.11 1 : 0.20 1 : 0.22 Bucknall, 1989
Rochester 1 : 1.27 1 : 0.18 1 : 0.18 Bonner and Gray, 2005
North Carolina
Alamance County 1 : 1.46 1 : 0.23 1 : 0.59 Renkow, 2006
Chatham County 1 : 1.14 1 : 0.33 1 : 0.58 Renkow, 2007
Henderson County 1 : 1.16 1 : 0.40 1 : 0.97 Renkow, 2008
Orange County 1 : 1.31 1 : 0.24 1 : 0.72 Renkow, 2006
Union County 1 : 1.30 1 : 0.41 1 : 0.24 Dorfman, 2004
Wake County 1 : 1.54 1 : 0.18 1 : 0.49 Renkow, 2001
Ohio
Butler County 1 : 1.12 1 : 0.45 1 : 0.49 American Farmland Trust, 2003
Clark County 1 : 1.11 1 : 0.38 1 : 0.30 American Farmland Trust, 2003
Hocking Township 1 : 1.10 1 : 0.27 1 : 0.17 Prindle, 2002
Knox County 1 : 1.05 1 : 0.38 1 : 0.29 American Farmland Trust, 2003
Liberty Township 1 : 1.15 1 : 0.51 1 : 0.05 Prindle, 2002
Madison Village, Lake County 1 : 1.67 1 : 0.20 1 : 0.38 American Farmland Trust, 1993
Madison Twp., Lake County 1 : 1.40 1 : 0.25 1 : 0.30 American Farmland Trust, 1993
Madison Village, Lake County 1 : 1.16 1 : 0.32 1 : 0.37 American Farmland Trust, 2008
Madison Twp., Lake County 1 : 1.24 1 : 0.33 1 : .030 American Farmland Trust, 2008
Shalersville Township 1 : 1.58 1 : 0.17 1 : 0.31 Portage County Regional Planning Commission, 1997
Pennsylvania
Allegheny Twp., Westmoreland County 1 : 1.06 1 : 0.14 1 : 0.13 Kelsey, 1997
Bedminster Twp., Bucks County 1 : 1.12 1 : 0.05 1 : 0.04 Kelsey, 1997
Bethel Twp., Lebanon County 1 : 1.08 1 : 0.17 1 : 0.06 Kelsey, 1992
Bingham Twp., Potter County 1 : 1.56 1 : 0.16 1 : 0.15 Kelsey, 1994
Buckingham Twp., Bucks County 1 : 1.04 1 : 0.15 1 : 0.08 Kelsey, 1996
4
A M E R I C A N F A R M L A N D T R U S T F A R M L A N D I N F O R M A T I O N C E N T E R
SUMMARY OF COST OF COMMUNITY SERVICES STUDIES, REVENUE-TO-EXPENDITURE RATIOS IN DOLLARS
Community
Residential including
farm houses Commercial &
Industrial Working & Open Land Source
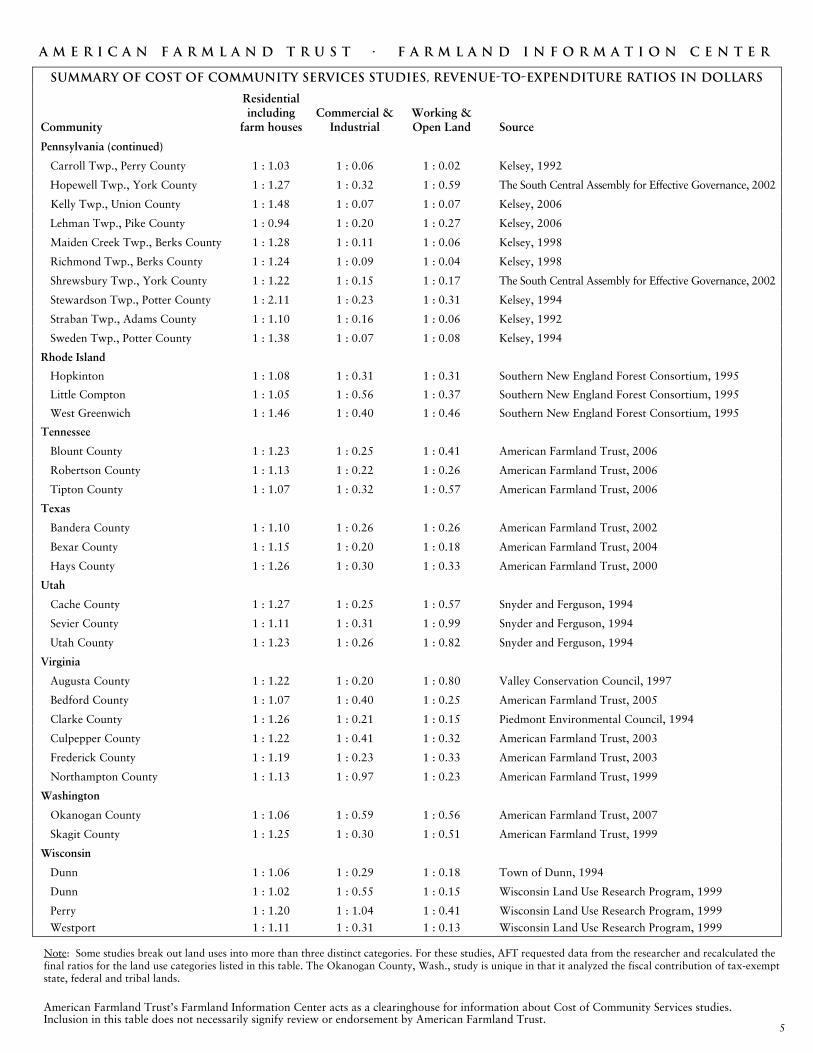
Pennsylvania (continued)
Carroll Twp., Perry County 1 : 1.03 1 : 0.06 1 : 0.02 Kelsey, 1992
Hopewell Twp., York County 1 : 1.27 1 : 0.32 1 : 0.59 The South Central Assembly for Effective Governance, 2002
Kelly Twp., Union County 1 : 1.48 1 : 0.07 1 : 0.07 Kelsey, 2006
Lehman Twp., Pike County 1 : 0.94 1 : 0.20 1 : 0.27 Kelsey, 2006
Maiden Creek Twp., Berks County 1 : 1.28 1 : 0.11 1 : 0.06 Kelsey, 1998
Richmond Twp., Berks County 1 : 1.24 1 : 0.09 1 : 0.04 Kelsey, 1998
Shrewsbury Twp., York County 1 : 1.22 1 : 0.15 1 : 0.17 The South Central Assembly for Effective Governance, 2002
Stewardson Twp., Potter County 1 : 2.11 1 : 0.23 1 : 0.31 Kelsey, 1994
Straban Twp., Adams County 1 : 1.10 1 : 0.16 1 : 0.06 Kelsey, 1992
Sweden Twp., Potter County 1 : 1.38 1 : 0.07 1 : 0.08 Kelsey, 1994
Rhode Island
Hopkinton 1 : 1.08 1 : 0.31 1 : 0.31 Southern New England Forest Consortium, 1995
Little Compton 1 : 1.05 1 : 0.56 1 : 0.37 Southern New England Forest Consortium, 1995
West Greenwich 1 : 1.46 1 : 0.40 1 : 0.46 Southern New England Forest Consortium, 1995
Tennessee
Blount County 1 : 1.23 1 : 0.25 1 : 0.41 American Farmland Trust, 2006
Robertson County 1 : 1.13 1 : 0.22 1 : 0.26 American Farmland Trust, 2006
Tipton County 1 : 1.07 1 : 0.32 1 : 0.57 American Farmland Trust, 2006
Texas
Bandera County 1 : 1.10 1 : 0.26 1 : 0.26 American Farmland Trust, 2002
Bexar County 1 : 1.15 1 : 0.20 1 : 0.18 American Farmland Trust, 2004
Hays County 1 : 1.26 1 : 0.30 1 : 0.33 American Farmland Trust, 2000
Utah
Cache County 1 : 1.27 1 : 0.25 1 : 0.57 Snyder and Ferguson, 1994
Sevier County 1 : 1.11 1 : 0.31 1 : 0.99 Snyder and Ferguson, 1994
Utah County 1 : 1.23 1 : 0.26 1 : 0.82 Snyder and Ferguson, 1994
Virginia
Augusta County 1 : 1.22 1 : 0.20 1 : 0.80 Valley Conservation Council, 1997
Bedford County 1 : 1.07 1 : 0.40 1 : 0.25 American Farmland Trust, 2005
Clarke County 1 : 1.26 1 : 0.21 1 : 0.15 Piedmont Environmental Council, 1994
Culpepper County 1 : 1.22 1 : 0.41 1 : 0.32 American Farmland Trust, 2003
Frederick County 1 : 1.19 1 : 0.23 1 : 0.33 American Farmland Trust, 2003
Northampton County 1 : 1.13 1 : 0.97 1 : 0.23 American Farmland Trust, 1999
Washington
Okanogan County 1 : 1.06 1 : 0.59 1 : 0.56 American Farmland Trust, 2007
Skagit County 1 : 1.25 1 : 0.30 1 : 0.51 American Farmland Trust, 1999
Wisconsin
Dunn 1 : 1.06 1 : 0.29 1 : 0.18 Town of Dunn, 1994
Dunn 1 : 1.02 1 : 0.55 1 : 0.15 Wisconsin Land Use Research Program, 1999
Perry 1 : 1.20 1 : 1.04 1 : 0.41 Wisconsin Land Use Research Program, 1999
Westport 1 : 1.11 1 : 0.31 1 : 0.13 Wisconsin Land Use Research Program, 1999
Note: Some studies break out land uses into more than three distinct categories. For these studies, AFT requested data from the researcher and recalculated the final ratios for the land use categories listed in this table. The Okanogan County, Wash., study is unique in that it analyzed the fiscal contribution of tax-exempt state, federal and tribal lands.
American Farmland Trust’s Farmland Information Center acts as a clearinghouse for information about Cost of Community Services studies. Inclusion in this table does not necessarily signify review or endorsement by American Farmland Trust.
5
A m e r i c a n f a r m l a n d t r u s t · F a r m l a n d i n f o r m a t i o n c e n t e r
COST OF
COMMUNITY
SERVICES
STUDIES
For additional information on farmland protection and
stewardship contact the Farmland Information Center. The FIC offers a staffed answer service and online library with
fact sheets, laws, sample documentsand other educational materials.
a community’s bottom line. In areas where agriculture or forestry are major industries, it is especially important to consider the real prop-erty tax contribution of privately owned work-ing lands. Working and other open lands maygenerate less revenue than residential, commer-cial or industrial properties, but they require little public infrastructure and few services.
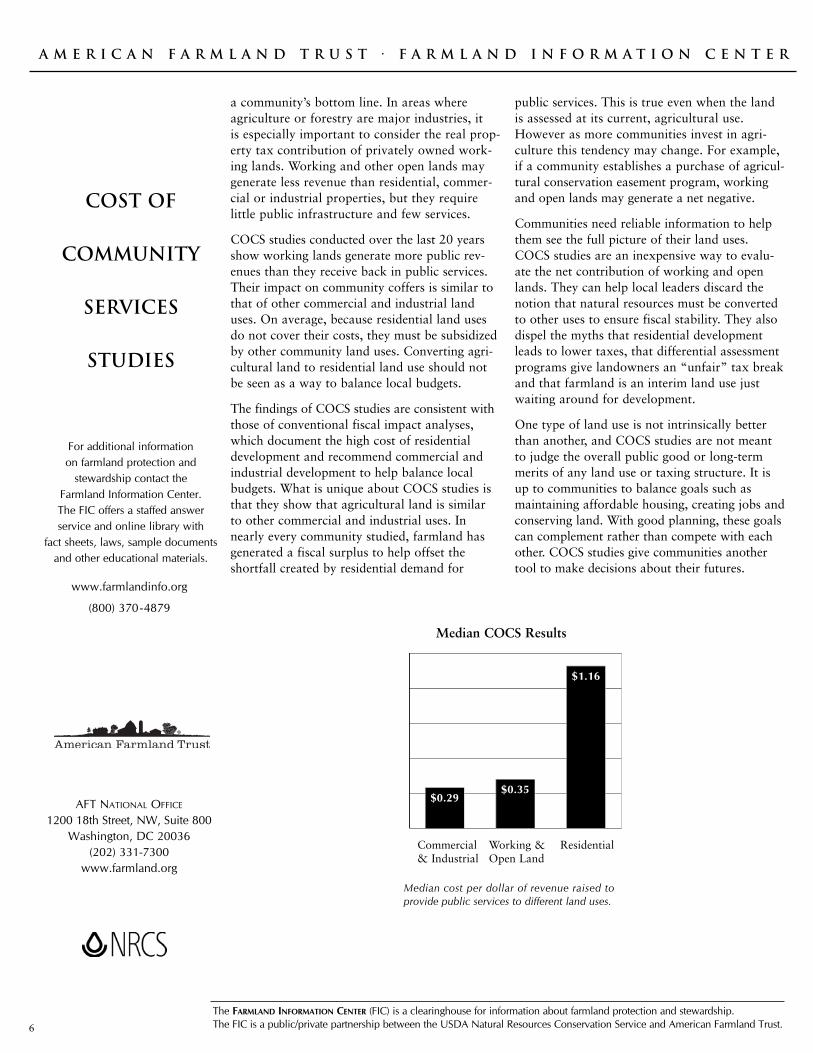
COCS studies conducted over the last 20 yearsshow working lands generate more public rev-enues than they receive back in public services.Their impact on community coffers is similar tothat of other commercial and industrial landuses. On average, because residential land usesdo not cover their costs, they must be subsidizedby other community land uses. Converting agri-cultural land to residential land use should notbe seen as a way to balance local budgets.
The findings of COCS studies are consistent withthose of conventional fiscal impact analyses,which document the high cost of residentialdevelopment and recommend commercial andindustrial development to help balance localbudgets. What is unique about COCS studies isthat they show that agricultural land is similar to other commercial and industrial uses. In nearly every community studied, farmland hasgenerated a fiscal surplus to help offset theshortfall created by residential demand for
public services. This is true even when the landis assessed at its current, agricultural use.However as more communities invest in agri-culture this tendency may change. For example,if a community establishes a purchase of agricul-tural conservation easement program, workingand open lands may generate a net negative.
Communities need reliable information to helpthem see the full picture of their land uses.COCS studies are an inexpensive way to evalu-ate the net contribution of working and openlands. They can help local leaders discard thenotion that natural resources must be convertedto other uses to ensure fiscal stability. They alsodispel the myths that residential developmentleads to lower taxes, that differential assessmentprograms give landowners an “unfair” tax breakand that farmland is an interim land use justwaiting around for development.
One type of land use is not intrinsically betterthan another, and COCS studies are not meantto judge the overall public good or long-termmerits of any land use or taxing structure. It isup to communities to balance goals such asmaintaining affordable housing, creating jobs and conserving land. With good planning, these goalscan complement rather than compete with eachother. COCS studies give communities anothertool to make decisions about their futures.
$0.29$0.35
$1.16
www.farmlandinfo.org
(800) 370-4879
Median cost per dollar of revenue raised toprovide public services to different land uses.
Commercial& Industrial
Working &Open Land
Residential
Median COCS Results
AFT NATIONAL OFFICE
1200 18th Street, NW, Suite 800Washington, DC 20036
(202) 331-7300www.farmland.org
The FARMLAND INFORMATION CENTER (FIC) is a clearinghouse for information about farmland protection and stewardship.The FIC is a public/private partnership between the USDA Natural Resources Conservation Service and American Farmland Trust.6