Embed Size (px)
Citation preview

2016 Annual Report
Georgia Economic Highlights from Traditional and Real-time LMI
Prepared By: Workforce Statistics and Economic Research
(404) 232-3875www.dol.georgia.gov

2016 Annual Report - Georgia Economic Highlights from Traditional and Real-time LMI
Georgia Department of Labor Mark Butler, Commissioner
Published by Workforce Statistics & Economic Research Division
Equal Opportunity Employer/Program - Auxiliary Aids and Services Available upon Request to Individuals with Disabilities

2016 Report Overview
The “2016 Annual Report - Georgia Economic Highlights from Traditional and Real-time LMI” is a broad overview of the current economic situation in Georgia. A vast array of labor market information (LMI) data have been used to illustrate the current trends in employment and the forecast for the future.
Traditional LMI data from official government led programs have long been the most common standard used for measuring workforce statistics. As the world has changed and information has become readily available via the internet, the demand for more data and newer data has increased. While traditional LMI data will continue to be the gold standard, there is now a new data source currently available. This new data set is called Real-time LMI.
Real-time LMI is labor market intelligence derived from the analysis of job postings and resumes placed into public and private labor exchanges on the world wide web. These data are pulled from a wide variety of internet sites on a daily basis resulting in the “real-time” name. These data provide a myriad of job posting and employer details that can be used to indicate supply and demand trends,emerging occupations, current and emerging skill requirements and market-based demand for education and certifications desired by employers.
Real-time LMI is a relatively new product which is being introduced in this publication. It promises to expand the horizons of labor market research regarding economic and workforce development. The Georgia Department of Labor is utilizing Burning Glass© Technology as the source for the real-time LMI data.
Questions or comments on the content of this publication should be directed to: Georgia Department of Labor Workforce Statistics & Economic Research Division 148 Andrew Young International Blvd. Atlanta, Georgia 30303-1751 (404) 232-3875 (404) 232-3888 Fax www.dol.georgia.gov
3

Georgia – Distance Traveled to Work and Total Employment by MSA*Traditional LMI – Census Local Employment Dynamics and QCEW
Data Source: U.S. Census Bureau, Local Employment Dynamics and Workforce Statistics and Economic Research, QCEW Data. Reports Prepared By: Workforce Statistics and Economic Research, Georgia Department of Labor.
The first chart illustrates the home locations of all Georgia workers. Thirty-nine percent (39%) of workers drive less than ten miles to work. Twenty-nine percent (29%) of workers drive in excess of twenty-five miles to get to work.
The table shows the average employment by MSA in Georgia for 2015. Larger metropolitan areas tend to offer better work opportunities and workers flock to these areas as a result.
Area NameAverage
EmploymentArea Name
Average Employment
Area NameAverage
Employment
Atlanta-Sandy Springs-Roswell, GA MSA 2,418,016 Athens-Clarke County, GA MSA 81,318 Valdosta, GA MSA 53,831Savannah, GA MSA 162,115 Gainesville, GA MSA 79,671 Brunswick, GA MSA 40,281Augusta-Richmond County, GA-SC MSA 150,604 Warner Robins, GA MSA 68,630 Rome, GA MSA 38,248Columbus, GA-AL MSA 101,956 Dalton, GA MSA 64,135 Chattanooga, TN-GA MSA 30,844Macon, GA MSA 97,205 Albany, GA MSA 58,279 Hinesville, GA MSA 18,942*Metropolitan
Statistical Area
Annual 2015 Quarterly Census of Employment and Wages (QCEW) - Total All Industries
4

Georgia – Job Postings by Metropolitan Statistical Area (MSA)Real-time LMI – 2nd Quarter 2016
Data Source: Burning Glass Technology. Reports Prepared By: Workforce Statistics and Economic Research, Georgia Department of Labor.
This chart details the number of job postings by MSA in Georgia.
For the second quarter (April, May and June) of 2016, there were a total of 199,544 unique job postings listed on the internet for the state. Of the total openings in Georgia, 180,078 posted jobs were within the fifteen MSAs.
These openings account for 90% of all job postings found on the internet using Burning Glass Technology.
5

Georgia – Jobs with the Fastest Growth and Largest GrowthTraditional LMI – Long-Term Projections 2012-2022These charts detail the top twenty-five occupations expecting the fastest and largest growth. All jobs on the fastest growth chart have annual growth rates exceeding the overall rate. Jobs listed on the largest growth chart will account for 39% of all new positions.
Data Source: Workforce Statistics and Economic Research, Long-term Projections. Reports Prepared By: Workforce Statistics and Economic Research, Georgia Department of Labor.
Top 25 Occupations – Fastest Growth Top 25 Occupations – Largest Growth
Occupational TitleEDU Code
Annual Growth
Rate
Annual Openings
from Growth
Physician Assistants 2 5.3% 190Health Specialties Teachers, Postsecondary 1 5.2% 320
Agents and Business Managers of Artists, Performers, and Athletes 3 5.0% 30
Personal Care Aides 8 4.9% 1,020
Interpreters and Translators 3 4.7% 100
Nursing Instructors and Teachers, Postsecondary 2 4.5% 80
Psychiatric Aides 7 4.5% 80Home Health Aides 8 4.5% 440Nurse Practitioners 2 4.4% 180
Nurse Midwives 2 4.4% 10
Ophthalmic Medical Technicians 5 4.2% 40
Medical Secretaries 7 4.2% 680Medical Assistants 5 4.1% 880
Audiologists 1 4.1% 10
Meeting, Convention, and Event Planners 3 4.1% 110
Philosophy/Religion Teachers, Postsecondary 1 4.0% 30
Diagnostic Medical Sonographers 4 4.0% 70
Dental Hygienists 4 4.0% 240Mental Health Counselors 2 4.0% 100
Occupational Therapy Assistants 4 4.0% 20
Stonemasons 7 4.0% 30Brickmasons and Blockmasons 7 3.9% 30
Mental Health and Substance Abuse Social Workers 3 3.8% 70
Law Teachers, Postsecondary 1 3.8% 10
Surgeons 1 3.8% 70
Georgia Statewide Average Annual Growth Rate is 1.5%
Occupational TitleEDU Code
Annual Growth
Rate
Annual Openings
from Growth
Comb. Food Prep. Serving Workers, Incl. Fast Food 8 1.3% 2,340Customer Service Representatives 7 1.9% 1,950Laborers/ Freight, Stock, and Material Movers, Hand 8 2.0% 1,870
Elementary School Teachers, Except Special Ed. 3 2.9% 1,390General and Operations Managers 3 1.7% 1,350
Sales Representatives, Wholesale/Manufacturing, Except Technical and Scientific Products 7 1.8% 1,120Secretaries and Administrative Assistants, Except Legal, Medical, and Executive 7 2.0% 1,120Office Clerks, General 7 1.3% 1,110Janitors/Cleaners, Except Maids/Housekeeping Cleaners 8 1.9% 1,070Childcare Workers 7 2.5% 1,060Registered Nurses 4 1.5% 1,040Personal Care Aides 8 4.9% 1,020Accountants and Auditors 3 2.3% 1,010Team Assemblers 7 2.1% 980Management Analysts 3 2.4% 950Maids and Housekeeping Cleaners 8 2.1% 880Medical Assistants 5 4.1% 880Bookkeeping, Accounting, and Auditing Clerks 7 1.7% 860Construction Laborers 8 2.7% 860First-Line Supervisors of Office/Admin. Support Workers 7 1.9% 820Teacher Assistants 6 2.2% 810Retail Salespersons 8 0.5% 780Nursing Assistants 5 1.9% 770Middle School Teachers, Except Special and Career/Technical Education 3 2.9% 730Maintenance and Repair Workers, General 7 1.6% 720
Georgia Statewide Expected Annual Openings from Growth is 71,040
Education Codes
1 Doctoral or professional degree
2 Master's degree
3 Bachelor's degree
4 Associate's degree
5 Postsecondary non-degree award
6 Some college, no degree
7 High school diploma or equivalent
8 Less than high school
6

Georgia – Top Occupations - Job Postings by Occupational TitleReal-time LMI – 2nd Quarter 2016
Data Source: Burning Glass Technology. Reports Prepared By: Workforce Statistics and Economic Research, Georgia Department of Labor.
This chart details the top twenty-five occupations according to real-time job postings data.
Ninety-seven percent (97%) of job postings were classified and ranked from largest to smallest. The top twenty-five occupations are shown here.
The remaining % of all postings found did not have SOC (Standard Occupational Classification) codes assigned due to the lack of job posting detail available.
7

Georgia – Top Occupations Based on EmploymentTraditional LMI – Occupational Employment Statistics (OES)This chart details the top twenty-five occupations based on occupational employment in Georgia.
Data for each occupation shown includes the basic level of education, the number of jobs, the average hourly wage, the average annual wage and the median wage.
Data Source: Workforce Statistics and Economic Research, Occupational Employment Statistics. Reports Prepared By: Workforce Statistics and Economic Research, Georgia Department of Labor.
*** Indicates data were either not available or suppressed due to BLS confidentiality.
Education Codes
1 Doctoral or professional degree
2 Master's degree
3 Bachelor's degree
4 Associate's degree
5 Postsecondary non-degree award
6 Some college, no degree
7 High school diploma or equivalent
8 Less than high school
SOC Code
Occupational TitleEDU Level
EmploymentAverage Hourly Wage
Average Annual Wage
Median Hourly Wage
41-2031 Retail Salespersons 8 140,210 $12.10 $25,168 $9.78
53-7062 Laborers and Freight, Stock, and Material Movers, Hand 8 102,550 $13.25 $27,560 $11.70
41-2011 Cashiers 8 98,940 $9.36 $19,469 $9.04
35-3021 Combined Food Preparation and Serving Workers, Including Fast Food 8 96,800 $8.71 $18,117 $8.73
43-4051 Customer Service Representative 7 91,540 $16.68 $34,694 $15.56
11-1021 General and Operations Managers 3 79,830 $54.30 $112,944 $45.42
43-9061 Office Clerks, General 7 78,320 $13.32 $27,706 $12.55
35-3031 Waiters and Waitresses 8 75,800 $9.26 $19,261 $8.81
29-1141 Registered Nurses 4 68,010 $30.60 $63,648 $30.68
43-6014 Secretaries and Administrative Assistants, Except Legal, Medical, and Executive
7 58,770 $16.48 $34,278 $15.80
43-5081 Stock Clerks and Order Fillers 8 57,350 $11.83 $24,606 $10.79
41-4012 Sales Representatives, Wholesale and Manufacturing, Except Technical and Scientific Products
7 52,040 $29.51 $61,381 $24.84
53-3032 Heavy and Tractor-Trailer Truck Drivers 5 50,820 $19.97 $41,538 $19.34
37-2011 Janitors and Cleaners, Except Maids and Housekeeping Cleaners 8 49,110 $11.16 $23,213 $10.08
25-2021 Elementary School Teachers, Except Special Education 3 47,440 *** $55,137 $55,010
51-2092 Team Assemblers 7 46,630 $13.77 $28,642 $13.13
43-3031 Bookkeeping, Accounting, and Auditing Clerks 7 44,540 $18.05 $37,544 $17.27
49-9071 Maintenance and Repair Workers, General 7 43,690 $17.97 $37,378 $17.12
41-1011 First-Line Supervisors of Retail Sales Workers 7 38,340 $19.30 $40,144 $17.08
43-1011 First-Line Supervisors of Office and Administrative Support Workers 7 38,260 $26.28 $54,662 $24.36
31-1014 Nursing Assistants 5 36,350 $10.94 $22,755 $10.65
13-2011 Accountants and Auditors 3 35,950 $37.58 $78,166 $33.76
43-4171 Receptionists and Information Clerks 7 33,040 $13.41 $27,893 $12.95
13-1199 Business Operations Specialists, All Other 7 32,100 $34.48 $71,718 $32.24
25-9041 Teacher Assistants 6 31,570 *** $20,736 $19,341
8

This chart details the top twenty-five job titles in job postings data.
There can be many different job titles used by employers for the same SOC (Standard Occupational Classification) code. For example, in this chart there are several different titles for truck drivers including Class A CDL Truck Driver, CDL Driver, Truck Driver, and Company Driver all of which represent a single SOC code.
Georgia – Top Job Titles - Job Postings by Employer Working TitlesReal-time LMI – 2nd Quarter 2016
Data Source: Burning Glass Technology. Reports Prepared By: Workforce Statistics and Economic Research, Georgia Department of Labor.
9
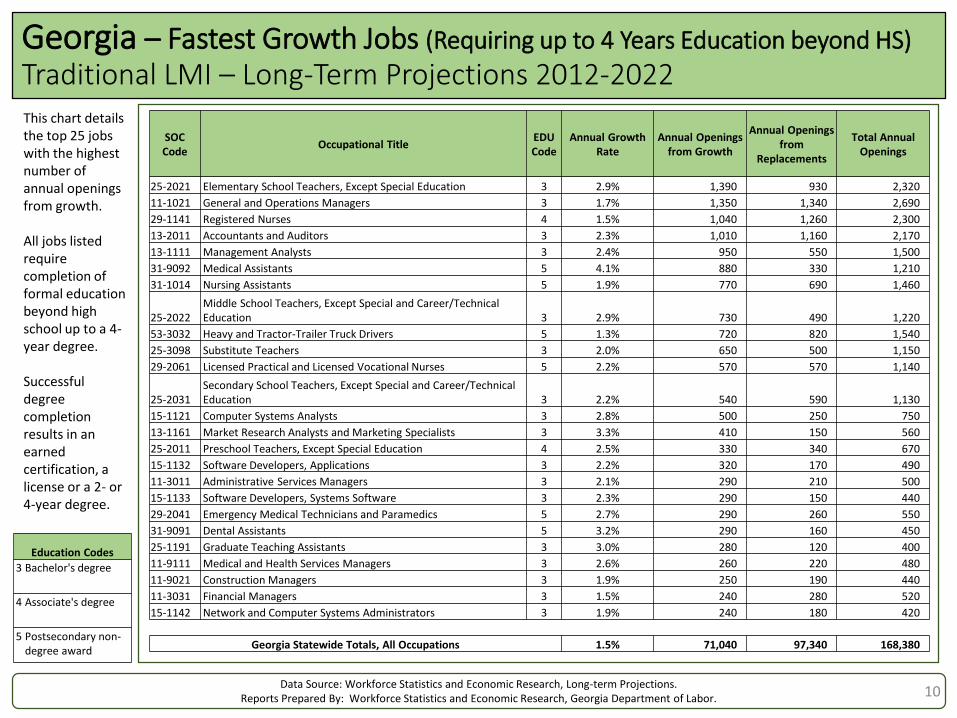
Georgia – Fastest Growth Jobs (Requiring up to 4 Years Education beyond HS)
Traditional LMI – Long-Term Projections 2012-2022This chart details the top 25 jobs with the highest number of annual openings from growth.
All jobs listed require completion of formal education beyond high school up to a 4-year degree.
Successful degree completion results in an earned certification, a license or a 2- or 4-year degree.
Data Source: Workforce Statistics and Economic Research, Long-term Projections. Reports Prepared By: Workforce Statistics and Economic Research, Georgia Department of Labor.
Education Codes
3 Bachelor's degree
4 Associate's degree
5 Postsecondary non-degree award
SOC Code
Occupational TitleEDU Code
Annual Growth Rate
Annual Openings from Growth
Annual Openings from
Replacements
Total Annual Openings
25-2021 Elementary School Teachers, Except Special Education 3 2.9% 1,390 930 2,320
11-1021 General and Operations Managers 3 1.7% 1,350 1,340 2,690
29-1141 Registered Nurses 4 1.5% 1,040 1,260 2,300
13-2011 Accountants and Auditors 3 2.3% 1,010 1,160 2,170
13-1111 Management Analysts 3 2.4% 950 550 1,500
31-9092 Medical Assistants 5 4.1% 880 330 1,210
31-1014 Nursing Assistants 5 1.9% 770 690 1,460
25-2022Middle School Teachers, Except Special and Career/Technical Education 3 2.9% 730 490 1,220
53-3032 Heavy and Tractor-Trailer Truck Drivers 5 1.3% 720 820 1,540
25-3098 Substitute Teachers 3 2.0% 650 500 1,150
29-2061 Licensed Practical and Licensed Vocational Nurses 5 2.2% 570 570 1,140
25-2031Secondary School Teachers, Except Special and Career/Technical Education 3 2.2% 540 590 1,130
15-1121 Computer Systems Analysts 3 2.8% 500 250 750
13-1161 Market Research Analysts and Marketing Specialists 3 3.3% 410 150 560
25-2011 Preschool Teachers, Except Special Education 4 2.5% 330 340 670
15-1132 Software Developers, Applications 3 2.2% 320 170 490
11-3011 Administrative Services Managers 3 2.1% 290 210 500
15-1133 Software Developers, Systems Software 3 2.3% 290 150 440
29-2041 Emergency Medical Technicians and Paramedics 5 2.7% 290 260 550
31-9091 Dental Assistants 5 3.2% 290 160 450
25-1191 Graduate Teaching Assistants 3 3.0% 280 120 400
11-9111 Medical and Health Services Managers 3 2.6% 260 220 480
11-9021 Construction Managers 3 1.9% 250 190 440
11-3031 Financial Managers 3 1.5% 240 280 520
15-1142 Network and Computer Systems Administrators 3 1.9% 240 180 420
Georgia Statewide Totals, All Occupations 1.5% 71,040 97,340 168,380
10

Georgia – Top Skills - Job Postings by Skills RequiredReal-time LMI – 2nd Quarter 2016
Data Source: Burning Glass Technology. Reports Prepared By: Workforce Statistics and Economic Research, Georgia Department of Labor.
This chart details the top twenty-five job skills listed in job postings data.
Approximately 28% of job postings do not provide information concerning skills sought but 97% of postings provide a SOC (Standard Occupational Classification) code title which can be used to research the basic skills and education required using ONET Online.
11

SOC Code
Occupational Title License Title(s)EDU Code
Annual Growth
Rate
Annual Openings
from Growth
Annual Openings from Replacement
Total Annual
Openings
25-2021 Elementary School Teachers, Except Special EducationElementary School Teachers
3 2.9% 1,390 930 2,320Preschool and Kindergarten Teacher
41-4012Sales Representatives, Wholesale and Manufacturing, Except Technical and Scientific Products
Merchandise Dealer 7 1.8% 1,120 1,100 2,220
29-1141 Registered Nurses
Advanced Practice - CNM
4 1.5% 1,040 1,260 2,300
Advanced Practice - CNS
Advanced Practice - CNS/PMH
Advanced Practice - CRNA
Advanced Practice - NP
Licensed Undergraduate Nurse
Registered Professional Nurse
13-2011 Accountants and AuditorsCertified Public Accountant
3 2.3% 1,010 1,160 2,170Foreign AccountantTemporary Accountant
25-9041 Teacher Assistants Teacher Aides 6 2.2% 810 750 1,560
31-1014 Nursing Assistants Qualified Medication Aide 5 1.9% 770 690 1,460
25-2022Middle School Teachers, Except Special and Career/Technical Education
Middle School Teachers 3 2.9% 730 490 1,220
49-9071 Maintenance and Repair Workers, GeneralUtility Contractor
7 1.6% 720 810 1,530Utility ForemanUtility Manager
29-2061 Licensed Practical and Licensed Vocational Nurses Licensed Practical Nurse 5 2.2% 570 570 1,140
25-2031Secondary School Teachers, Except Special and Career/Technical Education
High School Teachers
3 2.2% 540 590 1,130Special Education Teacher
Vocational Education Teacher
29-1069 Physicians and Surgeons, All Other Physician 1 3.5% 470 290 760
41-3099 Sales Representatives, Services, All OtherAuctioneer
7 2.5% 450 430 880Auctioneer-Non Resident
33-9032 Security Guards
Employee - In-House Armed Security
7 1.2% 400 480 880Employee - Private Detective/Security Guard
Employee - Security Guard
23-1011 Lawyers Lawyer 1 1.8% 370 310 680
41-9022 Real Estate Sales AgentsReal Estate Agent
7 1.8% 310 150 460Salesperson
Georgia Statewide Totals, All Occupations 1.5% 71,040 97,340 168,380
Georgia – Top Fastest Growth Jobs (Requiring Licensing or Certification)Traditional LMI – Long-Term Projections 2012-2022This chart details the top fifteen jobs requiring licensing or certification that project the highest number of annual openings from growth.
Many of these jobs do not require the completion of formal education beyond high school and are a part of Georgia’s Go Build Program from the Governors Office of Workforce Development.
Data Source: Workforce Statistics and Economic Research, Long-term Employment Projections. Reports Prepared By: Workforce Statistics and Economic Research, Georgia Department of Labor.
Education Codes
1 Doctoral or professional degree
2 Master's degree
3 Bachelor's degree
4 Associate's degree
5 Postsecondary non-degree award
6 Some college, no degree
7 High school diploma or equivalent
12

Georgia – Top Certifications - Job Postings by Certifications RequiredReal-time LMI – 2nd Quarter 2016
Data Source: Burning Glass Technology. Reports Prepared By: Workforce Statistics and Economic Research, Georgia Department of Labor.
This chart details the top twenty-five certifications listed in job postings data.
Approximately 77% of job postings do not provide information concerning special certifications sought. Many of the certifications listed separately are evident by the job title alone
13

Georgia – Employment By IndustryTraditional LMI – Quarterly Census of Employment and WagesThis series of charts detail the industry in Georgia including the number of establishments, the average monthly employment and the average weekly wage.
Data Source: Workforce Statistics and Economic Research. Quarterly Census of Employment and Wages. Reports Prepared By: Workforce Statistics and Economic Research, Georgia Department of Labor.
Georgia Industry Mix – Annual 2015Average Average Average Average
Number of Monthly Monthly Weekly
INDUSTRY Establishments Employment Percent Wages
Goods-Producing 35,196 571,203 13.8 1,041
Agriculture, Forestry, Fishing & Hunting 2,519 25,242 0.6 626
Mining 242 4,839 0.1 1,243
Construction 22,591 165,329 4.0 1,018
Manufacturing 9,844 375,794 9.1 1,077
Service-Providing 229,781 2,923,602 70.4 950
Utilities 510 19,972 0.5 1,718
Wholesale Trade 23,930 216,386 5.2 1,426
Retail Trade 33,904 482,431 11.6 559
Transportation and Warehousing 7,474 175,710 4.2 1,085
Information 5,249 106,700 2.6 1,648
Finance and Insurance 15,574 162,351 3.9 1,642
Real Estate and Rental and Leasing 12,006 62,399 1.5 1,032
Professional, Scientific & Technical Svc 39,635 259,190 6.2 1,555
Management of Companies and Enterprises 1,670 65,558 1.6 2,069
Admin., Support, Waste Mgmt, Remediation 18,235 310,280 7.5 701
Education Services 3,317 67,656 1.6 970
Health Care and Social Assistance 24,325 448,623 10.8 934
Arts, Entertainment, and Recreation 3,492 46,239 1.1 641
Accommodation and Food Services 20,493 398,973 9.6 332
Other Services (except Public Admin.) 19,964 101,134 2.4 652
Public Administration 3 * * *
Unclassified - industry not assigned 22,341 18,380 0.4 1,128
Total - Private Sector 287,318 3,513,185 84.6 966
Total - Government 8,734 637,597 15.4 880
Federal Government 2,063 98,862 2.4 1,408
State Government 2,672 141,150 3.4 852
Local Government 3,999 397,585 9.6 759
ALL INDUSTRIES 296,052 4,150,782 100.0 953
Note: *Denotes confidential data relating to individual employers and cannot be released. These data use the North American Industrial Classification System(NAICS) categories. Average weekly
wage is derived by dividing gross payroll dollars paid to all employees - both hourly and salaried - by the average number of employees who had earnings; average earnings are then divided by the
number of weeks in a reporting period to obtain weekly figures. Figures in other columns may not sum accurately due to rounding. All data represent the Annual 2015.
Average Establishments
Goods-Producing
Service-Providing
Government
375,794
482,431448,623
398,973 403,382
Manufacturing Retail Trade Heath Careand Social
Asst.
Accomodationand FoodServices
LocalGovernment
Top 5 Industry Sectors based on Employment
14
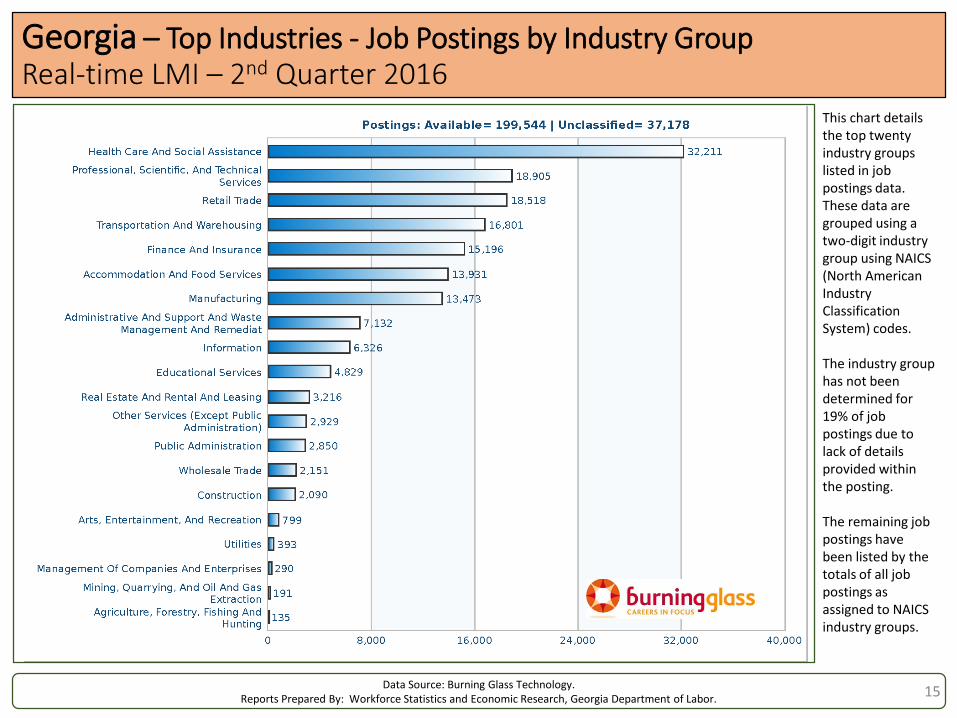
Georgia – Top Industries - Job Postings by Industry GroupReal-time LMI – 2nd Quarter 2016
Data Source: Burning Glass Technology. Reports Prepared By: Workforce Statistics and Economic Research, Georgia Department of Labor.
This chart details the top twenty industry groups listed in job postings data. These data are grouped using a two-digit industry group using NAICS (North American Industry Classification System) codes.
The industry group has not been determined for 19% of job postings due to lack of details provided within the posting.
The remaining job postings have been listed by the totals of all job postings as assigned to NAICS industry groups.
15

Georgia – Top Employers Based on EmploymentTraditional LMI – Quarterly Census of Employment and WagesThese charts include a listing of the top fifty employers based on total employment and a size class chart illustrating the levels of employment based on the size of the company.
Data Source: Workforce Statistics and Economic Research, Quarterly Census of Employment and Wages. Reports Prepared By: Workforce Statistics and Economic Research, Georgia Department of Labor.
Top 50 Employers in GeorgiaAll (Government and Private Sector) for Annual 2015
Employer NameAT&T Services, Inc. Ingles Markets, Inc.
Atlanta - City Municipal Government Lockheed Martin Corp.
Atlanta Public School System Lowes Home Centers, Inc.
Augusta University Mohawk Carpet Distribution LP
Bank of America, N.A. Northeast Georgia Medical Center, Inc.
Children’s Healthcare of Atlanta Northside Hospital
Clayton County School System Pilgrim's Pride Corporation
Cobb County School System Publix Super Markets, Inc.
Darden Restaurants, Inc. Randstad U.S., LP
DeKalb County Shaw Industries Group, Inc.
DeKalb County School System State Farm Mutual Auto Insurance Company
Delta Air Lines, Inc. SunTrust Bank
Department of Defense Target
Dollar General The Home Depot
Emory Healthcare, Inc. The Kroger Company
Emory University Turner Services, Inc.
Fulton County School System United Parcel Service
GA Dept. Of Human Resources Family & Children United States Postal Service
Georgia Department of Corrections University of Georgia
Georgia Institute of Technology US Dept. Of Health/Human Services
Georgia Power Company US Dept. of Veterans Admin
Grady Health System Waffle House, Inc.
Gulfstream Aerospace Corp. Walmart
Gwinnett County School System Wells Fargo Bank, N.A.
Henry County School System Wellstar Health System, Inc.
Note: Employers are listed in alphabetical order only and are not ranked in any way.
230,333
267,611
382,025
659,906
611,582
753,735
423,314
309,839
552,724
0-4
5-9
10-19
20-49
50-99
100-249
250-499
500-999
1000 & over
Employment by Size Class
16

Georgia – Top Employer - Job Postings by Employer NameReal-time LMI – 2nd Quarter 2016
Data Source: Burning Glass Technology. Reports Prepared By: Workforce Statistics and Economic Research, Georgia Department of Labor.
This chart details the top twenty-five employer names listed in job postings data.
Approximately 33% of job postings do not provide the actual employer name within the job details. The remaining postings have been ranked according to the numbers of postings listed by each employer.
17


![Teaching Colloquial / Oral Language in Classroom Dr ... · PDF filethen studied Gulf Arabic [GA] • Group 2 - studied GA for a year and then MSA ... • Arabic: colloquial MSA •](https://img.dokumen.tips/doc/110x75/5a7f32087f8b9aa24f8b721f/teaching-colloquial-oral-language-in-classroom-dr-studied-gulf-arabic-ga.jpg)