Embed Size (px)
Citation preview

2015 Wildfire Season: An Overview
Southwestern U.S.MAY 2016

Intermountain West Frequent-fire Forest Restoration
Ecological restoration is a practice that seeks to heal degraded ecosystems by reestablishing native species, structural characteristics, and ecological processes. The Society for Ecological Restoration International defines ecological restoration as “an intentional activity that initiates or accelerates the recovery of an ecosystem with respect to its health, integrity and sustainability….Restoration attempts to return an ecosystem to its historic trajectory” (Society for Ecological Restoration International Science & Policy Working Group 2004).
Most frequent-fire forests throughout the Intermountain West have been degraded during the last 150 years. Many of these forests are now dominated by unnaturally dense thickets of small trees, and lack their once diverse understory of grasses, sedges, and forbs. Forests in this condition are highly susceptible to damaging, stand-replacing fires and increased insect and disease epidemics. Restoration of these forests centers on reintroducing frequent, low-severity surface fires—often after thinning dense stands—and reestablishing productive understory plant communities.
The Ecological Restoration Institute at Northern Arizona University is a pioneer in researching, implementing, and monitoring ecological restoration of frequent-fire forests of the Intermountain West. By allowing natural processes, such as low-severity fire, to resume self-sustaining patterns, we hope to reestablish healthy forests that provide ecosystem services, wildlife habitat, and recreational opportunities.
The Southwest Fire Science Consortium (SWFSC) is a way for managers, scientists, and policy makers to interact and share science. SWFSC’s goal is to see the best available science used to make management decisions and scientists working on the questions managers need answered. The SWFSC tries to bring together localized efforts to develop scientific information and to disseminate that to practitioners on the ground through an inclusive and open process.
Author: Alexander EvansReviewers: Jose Iniguez, USDA Forest Service Rocky Mountain Research Station and Barb Satink Wolfson, Southwest Fire Science Consortium.
Acknowledgements: Chuck Maxwell, Southwest Coordination Center, Predictive Services contributed to the Regional Context section and produced the energy release component graphs. Shaula Hedwall, U.S. Fish and Wildlife Service, contributed to the discussion of the Camillo Fire.
Cover photo: Payson Helitack crew Zack Romero conducts burnout operations (far right) along Forest Road 124C southeast of Mormon Lake near Flagstaff, Arizona. The Camillo Fire burned 23,885 acres. Firefighters used burnout operations to maintain low to moderate severity of this lightning-caused fire. Photo taken June 24, 2015 by Liza Simmons, Public Information Officer, USFS. Photo courtesy of U.S. Forest Service, Coconino National Forest.
Please use the following citation when referring to this report: Evans, A. 2016. 2015 Wildfire Season: An Overview, Southwestern U.S. Ecological Restoration Institute and Southwest Fire Science Consortium, Northern Arizona University. 13 p.
Northern Arizona University is an Equal Opportunity/Affirmative Action Institution. This report was funded by a grant from the USDA Forest Service.
In accordance with Federal law and U.S. Department of Agriculture policy, this institution is prohibited from discriminating on the basis of race, color, national origin, sex, age, or disability. (Not all prohibited bases apply to all programs.)
To file a complaint of discrimination, write USDA, Director, Office of Civil Rights, Room 326-W, Whitten Building, 1400 Independence Avenue, SW, Washington, DC 20250-9410 or call (202) 720-5964 (voice and TDD). USDA is an equal opportunity provider and employer.

Table of Contents
Introduction . . . . . . . . . . . . . . . . . . . . . . . . . . . . . . . . . . . . . . . . . . . . . . . . . . . . . . . . . . . . 1
Regional Context . . . . . . . . . . . . . . . . . . . . . . . . . . . . . . . . . . . . . . . . . . . . . . . . . . . . . . . . 2
Data Sources . . . . . . . . . . . . . . . . . . . . . . . . . . . . . . . . . . . . . . . . . . . . . . . . . . . . . . . . . . . 2
Whitetail Fire . . . . . . . . . . . . . . . . . . . . . . . . . . . . . . . . . . . . . . . . . . . . . . . . . . . . . . . . . . . 3
Camillo Fire . . . . . . . . . . . . . . . . . . . . . . . . . . . . . . . . . . . . . . . . . . . . . . . . . . . . . . . . . . . . . 4
Red Canyon Fire . . . . . . . . . . . . . . . . . . . . . . . . . . . . . . . . . . . . . . . . . . . . . . . . . . . . . . . . . 5
Hog Fire . . . . . . . . . . . . . . . . . . . . . . . . . . . . . . . . . . . . . . . . . . . . . . . . . . . . . . . . . . . . . . . 5
Springs Fire . . . . . . . . . . . . . . . . . . . . . . . . . . . . . . . . . . . . . . . . . . . . . . . . . . . . . . . . . . . . 6
Guadalupe Fire . . . . . . . . . . . . . . . . . . . . . . . . . . . . . . . . . . . . . . . . . . . . . . . . . . . . . . . . . . 7
Sawmill Fire . . . . . . . . . . . . . . . . . . . . . . . . . . . . . . . . . . . . . . . . . . . . . . . . . . . . . . . . . . . . 7
North Cut Fire . . . . . . . . . . . . . . . . . . . . . . . . . . . . . . . . . . . . . . . . . . . . . . . . . . . . . . . . . . . 8
Playground Fire . . . . . . . . . . . . . . . . . . . . . . . . . . . . . . . . . . . . . . . . . . . . . . . . . . . . . . . . . 8
Rattlesnake Fire . . . . . . . . . . . . . . . . . . . . . . . . . . . . . . . . . . . . . . . . . . . . . . . . . . . . . . . . . 9
Jar Complex . . . . . . . . . . . . . . . . . . . . . . . . . . . . . . . . . . . . . . . . . . . . . . . . . . . . . . . . . . . . 9
SA Hill Fire . . . . . . . . . . . . . . . . . . . . . . . . . . . . . . . . . . . . . . . . . . . . . . . . . . . . . . . . . . . . . 10
Conclusion . . . . . . . . . . . . . . . . . . . . . . . . . . . . . . . . . . . . . . . . . . . . . . . . . . . . . . . . . . . . . 10
Appendix I Fire Statistics . . . . . . . . . . . . . . . . . . . . . . . . . . . . . . . . . . . . . . . . . . . . . . . . . 13
1
Ecological Restoration Institute 2015 WILDFIRE SEASON: AN OVERVIEW / SOUTHWESTERN U.S.
IntroductionSouthwestern ecosystems are fire-adapted and fire is arguably the most important process in our forests and grass lands. This overview is designed to help everyone from the general public to natural resource managers better understand the past fire season. This report describes the vegetation impacted by the 12 largest fires in Arizona and New Mexico of 2015 (greater than 4,000 acres) and the degree to which the fires affected resources including soils, vegetation, and structures.
Weather, climate, vegetation type, fuel conditions, and topography all influence how an individual wildfire burns on the landscape and whether it will have beneficial effects on the landscape. Some fires will leave a large number of unburned patches creating a mosaic burn pattern, whereas others will burn more contiguously. Managers approach each fire with multiple objectives that range from managing the fire for public safety and to protect homes and property to managing the fire to improve natural resources. As federal wildland fire management policy states:
“Response to wildland fires is based on ecological, social and legal consequences of the fire. The circumstances under which a fire occurs, and the likely consequences on firefighter and public safety and welfare, natural and cultural resources, and, values to be protected, dictate the appropriate response to the fire.”1
A full range of wildland fire response strategies may be employed to meet these objectives, including containing, confining or suppressing the wildfire. In a notable change, the national Incident Management Situation Report (IMSR) in 2015 began noting fires managed for full suppression in contrast to those using a strategy other than full suppression monitor, confine, or point protection. The Southwest Coordinating Committee recognized that multiple strategies are often used in an individual fire and lists the percentage of each fire managed with monitor, confine, point protection, or suppression.2 It is important to note that federal agencies only recognize two types of fires: prescribed fires and wildfire.
Wildland fire management strategies are based on a thoughtful and systematic risk-based approach that takes into account firefighter and public safety, cause of the wildfire, location, existing land management plans, availability of resources, values at risk, and social factors. Federal policy dictates that “initial action on human-caused wildfire will be to suppress the fire.”1
This report follows the format of past years’ overviews3 to facilitate a comparison between years. As in previous overviews, this report covers the temporal period, fire management costs, vegetation types, previous burn footprints, and burn severity. The conclusion section summarizes these same measures for the large fires in the region and also touches on how these fires burned in relation to communities. In 2013, the eight largest fires burned 215,380 acres. In 2014, the 12 largest fires burned 177,907 acres. In 2015, the largest 12 fires burned 125,746, or 62 percent of the total number of acres burned by wildfire in the Southwest in 2015.
All wildfires and prescribed fires in Arizona and New Mexico.4
Prescribed fires made up 37% of the acres burned, the highest percentage of acres burned in the Southwest since 2003. Based on the Southwest Coordination Center’s listing, managers used full suppression strategies on 11% and other strategies on 89% of the acres burned in fires over 100 acres in 2015.5 Eighty-six percent and 65% of fires over 100 acres were managed with full suppression strategies in 2013 and 2014, respectively.
Most of the fires in the Southwest in 2015 burned in Arizona (79%). This overview only includes three New Mexico fires: the Red Canyon, North Cut and Guadalupe fires; eight fires burned in Arizona: Whitetail, Camillo, Springs, Sawmill, Playground, Rattlesnake, Jar Complex, and SA Hill; and the remaining fire, the Hog Fire, burned in both states. These 12 fires are listed in order of size starting with the largest.
3 2014 and 2013 Wildfire Season: An Overview, Southwestern U.S. http://library.eri.nau.edu/gsdl/collect../erilibra/archives/D2015022.dir/doc.pdf http://library.eri.nau.edu/gsdl/collect/erilibra/index/assoc/D2014008.dir/doc.pdf
4 National Interagency Coordination Center Wildland Fire Annual Reports www.predictiveservices.nifc.gov/intelligence/intelligence.htm
5 Southwest Coordination Center http://gacc.nifc.gov/swcc/predictive/intelligence/ytd_historical/historical/fire_data/historical_fires_and_acres.htm
1 Guidance for Implementation of Federal Wildland Fire Management Policy www.nifc.gov/policies/policies_documents/GIFWFMP.pdf
2 2015 Southwest Area Year-To-Date Wildland Fires > 100 Acres http://gacc.nifc.gov/swcc/predictive/intelligence/ytd_historical/historical/fire_data/ICS-209_Fires/Data_Tables/2015/Documents/YTD_ICS-209_Incidents.pdf

2
Ecological Restoration Institute 2015 WILDFIRE SEASON: AN OVERVIEW / SOUTHWESTERN U.S.
The large fires from 2015 analyzed in this report (smaller fires are indicated with X’s) .
Regional ContextThe snowpack from the 2014/2015 winter was below normal, but extensive wetting events from April through the early summer effectively mitigated the severity and extent of the Southwest fire season. Fine herbaceous fuels that normally cure out and support fire ignition and spread during the late spring instead saw robust plant growth, or “green-up,” which reduced fire potential. Further, the El Niño pattern of warm sea surface temperatures across the central Pacific combined with other factors to drive an active and moist storm track most of the spring season. This pattern worked to minimize windy and dry conditions, and also left only a few weeks of relatively warm and dry weather in June before the monsoon onset in July. Summer temperatures were slightly above normal and fuels experienced drying during late July. However, most areas in the Southwest received above normal precipitation during the late summer. Unusually warm temperatures extended into the fall and the first widespread low elevation freeze event did not occur until November 5.
The Energy Release Component (ERC) is an index that estimates potential available energy released per unit area in the flaming front of a fire based on the fuel model and live and dead fuel moistures. The ERC is often used to track seasonal fire danger focused on fuel loading, woody fuel moistures, and larger fuel moistures (lighter fuels have less influence and wind speed has no influence on ERC). Graphs of ERCs for two regions show the 2015 fire season (blue line) in comparison to the 10-year average (gray line) and 10-year maximums (red line). Wildfire ignition dates are noted as black dots.6 In both regions (particularly the
White Mountains – Gila region), ERCs tended to be below the 10-year average between May and August of 2015.
Energy release component (ERC) index for the 2015 fire season in the southeast Arizona region . The first black dot is the Guadalupe Fire start date and the second is the Hog Fire .
Energy release component (ERC) index for the 2015 fire season in the White Mountains – Gila region . The black dot shows the start date of the Whitetail, Sawmill, and Red Canyon fires .
Data SourcesMost details on the 2015 fires were drawn from the Inciweb website. Inciweb (inciweb.nwcg.gov) is an interagency information management system designed to provide the public a single source of incident related information. Because Inciweb only sporadically reports costs, where possible, Incident Status Summary (ICS-209) reports were collected to document suppression or management costs. The cost data from each fire is collected in a final table at the end of the document. The Incident Status Summaries also provide Strategic Objectives which briefly describe the desired outcome for the incident, high-level objectives, and in some cases strategic benefits. Though the strategic objectives change during a fire, review of the most common or persistent strategic objectives for each fire provides some insight into the overarching objectives.
6 Graphs produced by Charles Maxwell, Predictive Services Meteorologist, Southwest Coordination Center. For more information see http://gacc.nifc.gov/swcc//predictive/fuels_fire-danger/nfdrs_charts/Areawide.htm

3
Ecological Restoration Institute 2015 WILDFIRE SEASON: AN OVERVIEW / SOUTHWESTERN U.S.
Boundaries for each fire were taken from the Geospatial Multi-Agency Coordination (GeoMAC) archive of fire perimeter maps (rmgsc.cr.usgs.gov/outgoing/GeoMAC/). GeoMAC also provides the perimeters of fires back to 2000, which provided a historic context for this year’s fires. Notably two fire perimeters, the North Cut and Playground fires, were not documented in GeoMAC database.
LANDFIRE: Vegetation Basic information about the vegetation and topography of the area burned is available from the LANDFIRE project (www.landfire.gov). LANDFIRE provides nationally consistent, scientifically based maps of existing vegetation as well as Vegetation Condition Class (VCC). Vegetation Condition Class was formerly referred to as Fire Regime Condition Class, or FRCC. Vegetation Condition Class is a map of how the existing vegetation has departed from an estimated natural or historic condition. In the Southwest, this departure is generally due to fire suppression, past logging, and grazing and results in greater density of trees and less healthy conditions. Vegetation Condition Class is a particularly useful metric because it integrates information on existing vegetation, historic vegetation, and fire regimes into one variable and has been used to help determine where to focus restoration efforts. In this overview, the most current VCC maps (2012) were used.
Soil Burn SeveritySoil burn severity maps provide Burned Area Emergency Response (BAER) teams a method to quantify soil impacts and the potential for post-fire erosion (http://activefiremaps.fs.fed.us/baer/download.php). In the immediate aftermath of a fire, BAER teams perform an emergency assessment of post-fire soil conditions based on a combination of field observations and remote sensing change detection products derived from the differenced Normalized Burn Ratio (dNBR). The dNBR measures the change in the ratio of the near infrared reflected by healthy green vegetation to the shortwave infrared reflected by bare soil and rock. Most soil burn severity maps have four classes: high, moderate, low, and unburned; but some combine the last two categories into a “low/unchanged” category. The distribution of soil burn severity is included for those fires for which it is available both in the individual fire discussions as well as in final summary table.
Rapid Assessment of Vegetation Condition after Wildfire (RAVG)RAVG maps estimate canopy mortality (www.fs.fed.us/postfirevegcondition). The U.S. Forest Service Remote Sensing Applications Center provides RAVG analysis as a first approximation of areas that may require reforestation treatments because of canopy killed by
high severity fire. RAVG maps are created for wildfires that burn greater than 1,000 acres of forested U.S. Forest Service land or for fires where it is requested. The maps are produced by measuring the change between a satellite image before and immediately after a wildfire using an algorithm called relative differenced Normalized Burn Ratio (RdNBR), which is sensitive to vegetation mortality resulting from the wildfire event. The RdNBR is derived directly from the dNBR but is more sensitive to vegetation mortality than the dNBR.
While soil burn severity maps and RAVG canopy mortality maps use similar satellite change detection methods, they measure fundamentally different forest attributes. In many areas, canopy mortality and soil burn severity patterns are similar. However, in some vegetation types, such as chaparral or grass, it is possible for a fire to cause complete canopy mortality with little effect on soils.
Wildland Urban Interface (WUI)Another geospatial dataset that helps put fires in context is the location and density of housing, often referred to as the WUI. The Silvis Lab at the University of Wisconsin developed a nationwide map of the WUI based on U.S. Census data (www.silvis.forest.wisc.edu/maps/wui/2010/download). The Silvis map uses fairly standard definitions of the two main WUI conditions: intermix (one or more structures per 40 acres) and interface (three or more structures per acre, with shared municipal services).
CaveatsThere are important caveats for all the data used in in this summary. First, the fire information presented here was taken from official sources in December 2015 and may not include updates or revisions. Second, the geospatial data used to generate the maps and tables is also based on the best available information, but these data have errors and uncertainties. For example, the remote sensing data used in all these datasets can include errors introduced during collection, processing, and interpretation. Management decisions should be based on more detailed observations on the ground.
Whitetail FireThe Whitetail Fire burned for 30 days starting on June 16 and covered 33,633 acres of rugged grassland and woodland in the central part of San Carlos Apache Reservation in southeastern Arizona. Management objectives were to confine the fire to roads and natural barriers while preventing intense fire activity on the north flank to protect commercial timber. Total fire management cost was $2.8 million dollars, or $82 an acre, for the Whitetail Fire.

4
Ecological Restoration Institute 2015 WILDFIRE SEASON: AN OVERVIEW / SOUTHWESTERN U.S.
effective manner. There were two Mexican spotted owl protected activity centers (PACs) within the Camillo Fire that were allowed to burn as part of the fire once it was determined that owls were not nesting in these PACs. The incident team and wildlife biologists worked together to manage for predominately low to moderate fire effects within owl the PACs, reducing surface fuels while protecting the large trees and high canopy cover preferred by the owls.
Vegetation and Past FiresMost of the area burned in the Camillo Fire was ponderosa pine. It burned near the 2009 Raptor Fire, but no wildfires had burned within the perimeter of the Camillo Fire in the last 10 years. However, managers burned significant portions of the northern half of the Camillo Fire in a prescribed fire in 2011.
Vegetation Type Percent within Fire Perimeter
Piñon-juniper 6%
Ponderosa pine 78%
Scrub 2%
Grassland 6%
Riparian 7%
Fire SeverityBased on RAVG data 63% of the Camillo Fire perimeter had no canopy mortality and another 35% had less than 25% canopy mortality. Patches of nearly complete mortality (≥90%) only covered 64 acres. The VCC maps indicate that none of the area burned in the Camillo Fire was highly departed from historic conditions, with most of the area at moderate (77%) or low (22%) departure from historic conditions.
RAVG map of canopy mortality for the Camillo Fire
Vegetation and Past FiresThe Whitetail Fire burned mainly in piñon-juniper and chaparral.
Vegetation Type Percent within Fire Perimeter
Piñon-juniper 56%
Conifer-oak 9%
Ponderosa pine 1%
Scrub 1%
Chaparral 20%
Grassland 9%
Riparian 3%
More than half (55%) of the Whitetail Fire burned in the footprint of the 2009 Bear Fire and the southeast edge burned up to the perimeter of the 2014 Skunk Fire. The 2012 VCC maps appears to reflect the 2009 Bear Fire, because only 8% of the area is moderate departure and 92% is low. The smaller Sawmill Fire (discussed below) burned at the same time as the Whitetail Fire.
Fire SeverityRAVG and soil burn severity maps were not available for the Whitetail Fire.
Existing vegetation map for the Whitetail and Sawmill fires .
Camillo FireThe Camillo Fire burned during the same time as the Whitetail and Sawmill fires, between June 14 and July 16. Over this 32 day period, the Camillo Fire burned 23,885 acres at a cost of $1.3 million dollars ($54 per acre). Firefighters used burnout operations to maintain low to moderate severity. Their goal was to contain this lightning strike fire and reintroduce fire in a safe and

5
Ecological Restoration Institute 2015 WILDFIRE SEASON: AN OVERVIEW / SOUTHWESTERN U.S.
Soil burn severity map for the Red Canyon Fire .
Piñon-juniper had a greater percentage of very low or no soil impacts compared to conifer-oak woodlands or ponderosa pine forests. Mixed conifer forests had the highest percentage of high soil burn severity, though they only covered 3% of the fire perimeter.
Soil burn severity by vegetation type for the Red Canyon Fire .
The RAVG data indicates that only 1% of the ponderosa pine and 7% of the mixed conifer forests had essentially complete canopy mortality (>90% canopy mortality). Eighty-six percent and 94% of the conifer-oak and piñon-juniper woodlands had minimum canopy mortality (<25% canopy mortality).
Hog FireThe Hog Fire burned on the Coronado National Forest across both Arizona and New Mexico. It burned for 17 days after a lightning ignition on June 17, covering 8,057 acres. Firefighters used burnouts between the main fire and point protected locations, including Cascabel Ranch and critical wildlife habitat, to direct fire away from these areas. Management of the Hog Fire cost $500,000, or $62 an acre.
Red Canyon FireLightning ignited the Red Canyon Fire on June 15, and it burned 17,843 acres in New Mexico over the next eight days. Management of the Red Canyon Fire cost $1.7 million dollars, or $92 per acre. Most of the management on the Red Canyon Fire was focused on monitoring the fire but 5% of the fire was managed with a point protection strategy.
Vegetation and Past FiresMost of the vegetation within the Red Canyon Fire was a conifer and oak mixed woodland. About a third of the area that burned in the Red Canyon Fire was classified as scrub vegetation which includes sagebrush, deciduous scrub, sand scrub, and mesquite.
Vegetation Type Percent within Fire Perimeter
Piñon-juniper 3%
Conifer-oak 39%
Ponderosa pine 13%
Scrub 35%
Riparian 4%
No fires burned within the Red Canyon perimeter in the last 10 years and three quarters (75%) of the fire’s footprint was moderately departed from historic conditions (25% was low departure from historic conditions).
Fire SeverityThe available RAVG map only covered half of the Red Canyon Fire perimeter because of issues with the satellite image. Of the area covered by the RAVG map, 37% detected no canopy mortality and 53% was less than 25% canopy mortality. Only 2% of the area burned had more than 75% canopy mortality. The soil burn severity map also had some data lost due to remote sensing problems (visible as striping in the map). Seventy-nine percent of the fire had very low or no soil impacts and again only 2% of the area had high soil burn severity.

6
Ecological Restoration Institute 2015 WILDFIRE SEASON: AN OVERVIEW / SOUTHWESTERN U.S.
These levels of soil burn severity were relatively evenly distributed in each cover type except for ponderosa pine which had 88% very low or no soil burn severity.
Springs FireThe Springs Fire was ignited by lightning on July 2 and burned for 56 days on the Kaibab National Forest in northern Arizona. The objective for the Springs Fire was to allow fire to play its natural role as a disturbance factor across the landscape. By the time it went out, the Springs Fire burned 7,111 acres. Management focused on monitoring and point protection and cost about $200,000, or about $28 per acre.
Vegetation and Past FiresMost of the Springs Fire burned through ponderosa pine forests.
Vegetation Type Percent within Fire Perimeter
Mixed conifer 1%
Piñon-juniper 2%
Ponderosa pine 88%
Scrub 1%
Grassland 1%
Riparian 8%
The Springs Fire burned up to the edge of the 2013 Mud Fire and 2009 Cross Fire though did not reburn into either past fires. Most of the area burned was mapped as having moderate (86%) to low (14%) departure from historic conditions.
Fire SeverityThe RAVG maps showed the vast majority of the Springs Fire burned with little canopy mortality. Ninety-three percent of the fire area had less than 25% canopy mortality. Remote sensing indicated that about 24 acres of the fire had complete or near complete canopy mortality. The soil burn severity maps indicated similarly low severity with 59% very low or unburned, 13% low severity, 19% moderate severity, and no areas of high soil burn severity. The distribution of soil burn severity across vegetation types reflected the overall percentages, though ponderosa pine had a slightly higher percentage of low soil burn severity (47%, 37%, and 16% for very low, low, and moderate soil burn severity).
Vegetation and Past FiresMost of the Hog Fire burned in piñon-juniper, conifer-oak woodlands, or grasslands. Small portions burned in ponderosa pine forests, riparian areas, chaparral, and scrub. The Hog Fire burned up to the perimeter of the Guadalupe Fire that burned for the two weeks before the Hog Fire started. The Hog Fire burned in a matrix of past fires. Twenty-two precent of the footprint of the Hog Fire had burned previously in the 2008 Whitmire Fire and another 31% had burn in the 2009 Hog Fire. Two thirds (66%) of the 2015 Hog Fire burned what was labeled as low departure, one-third (33%) was labeled moderately departed, and only 1% as highly departed from historic conditions.
Vegetation Type Percent within Fire Perimeter
Piñon-juniper 22%
Conifer-oak 28%
Ponderosa 2%
Scrub 8%
Chaparral 1%
Grassland 58%
Riparian 3%
Fire SeverityThough most of the Hog Fire burned at low to moderate severity, 29% of the area had almost complete canopy mortality. The majority of the high canopy mortality areas were in grassland, but 478 acres of conifer-oak and 481 acres of piñon-juniper also had 90% or greater canopy mortality. The soil burn severity was similar to the canopy mortality with 28% high, 33% moderate, 16% low, and 24% very low soil burn severity.
RAVG map of the Hog and Guadalupe fires .

7
Ecological Restoration Institute 2015 WILDFIRE SEASON: AN OVERVIEW / SOUTHWESTERN U.S.
As mentioned previously, the Hog Fire burned up to the Guadalupe Fire perimeter after the Guadalupe Fire was extinguished. Though the Guadalupe Fire did not burn over any recent wildfire perimeters, Inciweb reported that “the area has had a number of prescribed fires over the past 15 years and the Guadalupe Fire has been much more manageable as a result.” Most area was listed as low departure (71%) from historic conditions on the VCC maps with 28% moderately departed and 1% highly departed.
Fire SeverityThe RAVG fire severity data show 19% of the Guadalupe Fire caused greater than 90% canopy mortality. However, in the majority of the perimeter (58%) there was less than 50% canopy mortality. Grasslands had the highest percentage of complete canopy mortality (30%) while conifer-oak and piñon-juniper had only 13% and 8% respectively.
The soil burn severity maps show an even starker picture of fire impacts. Fifty-two percent of the Guadalupe Fire had high soil burn severity and another 17% had moderate soil burn severity. Grasslands within the fire had 60% high soil burn severity, conifer-oak had 51%, and piñon-juniper had 30%.
Soil burn severity map for the Hog and Guadalupe fires .
Sawmill FireThe Sawmill Fire started the day after the Whitetail Fire (discussed previously) and both burned until the July 16. The Sawmill Fire burned across 5,667 acres of the San Carlos Apache Nation in southeastern Arizona. The strategic objective for the fire was to hold it within a predetermined box: north of Double Circle Tank Road, west of Sawmill Canyon, and east and south of Bloody
Soil burn severity map for the Springs Fire .
Guadalupe FireThe Guadalupe Fire was the earliest fire in this report. Lightning ignited the fire on the Coronado National Forest in southern Arizona on June 2. It burned for two weeks and covered 5,974 acres. The Guadalupe Fire was managed with strategies and tactics that used a combination of indirect and direct fire management actions. The strategic objective in the ICS-209 was full suppression, though in the Southwest Coordination Center summary the Guadalupe Fire was not listed as full suppression. These contrasting descriptions may be in part due to the use of different strategies on different sides of the fire. The description on Inciweb said “some sections of the fire will be managed for resource benefits while other segments will see active suppression to direct the fire into acceptable areas.” Fire managers worked to protect nearby private property structures and also to allow fire in its natural setting to benefit the landscapes of the Peloncillo Mountains where possible. The Guadalupe Fire had moderate fire behavior with uphill runs and single tree torching. Management of the Guadalupe Fire cost $1.1 million dollars, or $184 per acre.
Vegetation and Past FiresLarge portions of the Guadalupe Fire burned in grasslands, conifer-oak woodlands, or piñon-juniper woodlands.
Vegetation Type Percent within Fire Perimeter
Piñon-juniper 12%
Conifer-oak 33%
Scrub 7%
Grassland 42%
Riparian 3%

8
Ecological Restoration Institute 2015 WILDFIRE SEASON: AN OVERVIEW / SOUTHWESTERN U.S.
Map of existing vegetation in the area of the North Cut Fire .
Playground FireAs with the North Cut Fire, no exact perimeter is available for the final extent of the Playground Fire, which burned for 54 days after a lightning strike on August 28. Over this time the fire burned 4,960 acres on the White Mountain Apache Nation in Arizona. No Inciweb listing was available but the Bureau of Indian Affair’s Fort Apache Agency Twitter feed indicated that the Playground Fire was managed to achieve natural resource benefits and to reduce hazardous fuels within a predetermined area of 5,000 acres. The strategic objective was first to minimize risk to firefighter and public safety and then allow the fire to play its natural ecological role. The cost of managing the Playground Fire was $200,000, or $40 per acre.
Vegetation and Past FiresBased on the vegetation in a 4,960-acre circle around the recorded point location of the Playground Fire, it burned mainly in conifer-oak and ponderosa pine.
Vegetation Type Percent within Fire Perimeter
Mixed conifer 1%
Piñon-juniper 4%
Conifer-oak 69%
Ponderosa pine 21%
Grassland 2%
Riparian 4%
Basin Tank. Management of the Sawmill Fire cost $61 per acre for a total of $346,000.
Vegetation and Past FiresMost of the Sawmill Fire burned in piñon-juniper, conifer-oak, and ponderosa pine. The Sawmill Fire burned a lower percentage of chaparral and a greater percentage of ponderosa pine than the nearby Whitetail Fire.
Vegetation Type Percent within Fire Perimeter
Piñon-juniper 49%
Conifer-oak 20%
Ponderosa 19%
Scrub 1%
Chaparral 1%
Grassland 1%
Riparian 9%
Small portions of the Sawmill Fire burned previously in the 2014 Spring Fire (7%) and the 2012 Indian Fire (4%). These recent fires are not included in the most recent VCC maps which relies on data from before 2012. The maps report that 38% of the Sawmill Fire perimeter was moderately departed from historic conditions and 62% was low.
Fire SeverityNeither soil burn severity or RAVG maps are available for the Sawmill Fire.
North Cut FireVery little information is available about the North Cut Fire. Not even a perimeter map is available. The North Cut Fire started March 13 and burned for one day. It covered 5,000 acres in eastern New Mexico and cost $15,000 to manage. A full suppression strategy was used to control this grass fire.
Vegetation and Past FiresAlthough the exact perimeter of the North Cut Fire is not available, based on the vegetation in a 5,000-acre circle around the fire’s recorded point location, a vast majority of it was grassland: 86% shortgrass prairie and 8% other grassland types. No other wildfires are record in the vicinity in the last 10 years. The majority vegetation in the area was moderately departed from historic conditions (87%) on the VCC maps.

9
Ecological Restoration Institute 2015 WILDFIRE SEASON: AN OVERVIEW / SOUTHWESTERN U.S.
Though it did not overlap with recent past fires, the Rattlesnake Fire did burn near the 2008 Lane Fire and the 2005 Sunset Point Fire. Almost all (99%) of the Rattlesnake Fire was moderately departed from historic conditions on the VCC maps.
Fire SeverityNeither soil burn severity or RAVG maps are available for the Rattlesnake Fire.
Existing vegetation map for the Rattlesnake and SA Hill Fire .
Jar ComplexThe Jar Complex fires started on July 1 on the Kaibab National Forest in Arizona and burned for 19 days over 4,370 acres. The Jar Complex fires were managed in order to improve forest health and meet other natural resource objectives at a cost of $430,000 or $18 per acre.
Vegetation and Past FiresThe Jar Complex burned through piñon-juniper woodlands, ponderosa pine forests, and a small portion of riparian vegetation.
Vegetation Type Percent within Fire Perimeter
Piñon-juniper 27%
Ponderosa pine 67%
Riparian 6%
The northeastern quarter (26%) of the Jar Complex burned over an area that had burned in the 2008 Twenty Two Fire. Numerous other fire footprints encircled the Jar Complex including the 2011 Parallel Fire, 2011 Skinner Fire, 2005 North Fire, 2014 McRae Complex,
No recent wildfires are record in the immediate vicinity of the Playground Fire. Most of the area around the Playground Fire point location is moderately departed on the VCC maps (79%).
Fire SeverityNo fire severity information is available for the Playground Fire.
Map of existing vegetation in the area of the Playground Fire with a circle indicating the size but not the location of the Playground Fire .
Rattlesnake FireLightning ignited the Rattlesnake Fire and it burned for 10 days from August 16–26 in the Castle Creek Wilderness of the Prescott National Forest in Arizona for a total of 4,910 acres. The strategic objective listed on the ICS-209 form was “100% containment” and according to Inciweb, “the Rattlesnake Fire burned naturally and completely within the predefined boundaries established by fire managers.” The SWCC lists the management of the Rattlesnake Fire as a full suppression. Management of the Rattlesnake Fire cost $430,000, or $88 per acre.
Vegetation and Past FiresMost of the vegetation in Rattlesnake Fire perimeter was grass, scrub, or chaparral.
Vegetation Type Percent within Fire Perimeter
Piñon-juniper 1%
Scrub 18%
Chaparral 5%
Grassland 76%

10
Ecological Restoration Institute 2015 WILDFIRE SEASON: AN OVERVIEW / SOUTHWESTERN U.S.
Vegetation Type Percent within Fire Perimeter
Piñon-juniper 17%
Scrub 10%
Chaparral 72%
Riparian 1%
Fire SeverityNo fire severity information was available for the SA Hill Fire.
ConclusionThis report covers the 12 largest fires and about 62% of the area burned by wildfire in the Southwest in 2015. It is worth reiterating that these data are based on remote sensing information, some of which is preliminary. These data are the best currently available and could be improved by in-depth local investigations.
Like 2014, ponderosa pine was the most common forest type burned in large fires during 2015, though almost as many acres of piñon-juniper burned. The Whitetail Fire contributed the most acres of piñon-juniper woodland, while the Camillo contributed the most acres of ponderosa pine to the total number of acres burned. One difference between 2014 and 2015 is the increase in the number of grassland acres burned in 2015.
Summary of acres burned by major vegetation types .
Like 2014, a significant portion (35%) of the large fires and again in 2015 the largest fire (Whitetail Fire) occurred on the San Carlos Apache Nation. In 2015 the percentage of fires managed with a full suppression decreased again. Though it should be reiterated that the label of “suppression fire” is not an official federal agency term and that multiple tactics were used in each individual fire. In 2013, 86% of fires were managed with a full suppression strategy; in 2014 that number dropped to 65%; and in 2015 only 34% of the fires over 100 acres were managed with a full suppression strategy.
and the 2005 Muddersbach Fire. The VCC maps indicated that the majority of the Jar Complex (70%) burned in vegetation that had moderate departure from historic conditions and the remainder had low departure.
Fire SeverityIt is likely that the low departure from historic conditions and history of past fires contributed to the low severity observed on the Jar Complex. The RAVG maps showed 69% of the Jar Complex burned with no canopy mortality and 29% burned with less than 25% canopy mortality. Similarly, 79% of the Jar Complex had very low or no soil burn severity and 13% had low soil burn severity.
RAVG canopy mortality map for the Jar Complex
SA Hill FireLightning started the SA Hill Fire on August 2 on the Prescott National Forest north of the 2015 Rattlesnake Fire. By the time cool temperatures and precipitation extinguished the SA Hill Fire on August 11, it had burned 4,336 acres and cost $761,000 or $176 per acre. The strategic objective of land managers was to keep the fire from moving toward communities to the north and south. As with the Rattlesnake Fire, the SWCC listed the SA Hill Fire as a full suppression fire.
Vegetation and Past FiresThe SA Hill Fire burned mainly in chaparral, piñon-juniper, and scrub. Almost all of the SA Hill Fire burned in vegetation with low departure from historic conditions on the VCC map (92%).
11
Ecological Restoration Institute 2015 WILDFIRE SEASON: AN OVERVIEW / SOUTHWESTERN U.S.
None of the 12 largest wildfires of 2015 burn in areas mapped as WUI areas on the WUI Silvis maps. Similarly, there were no evacuations caused by these fires.
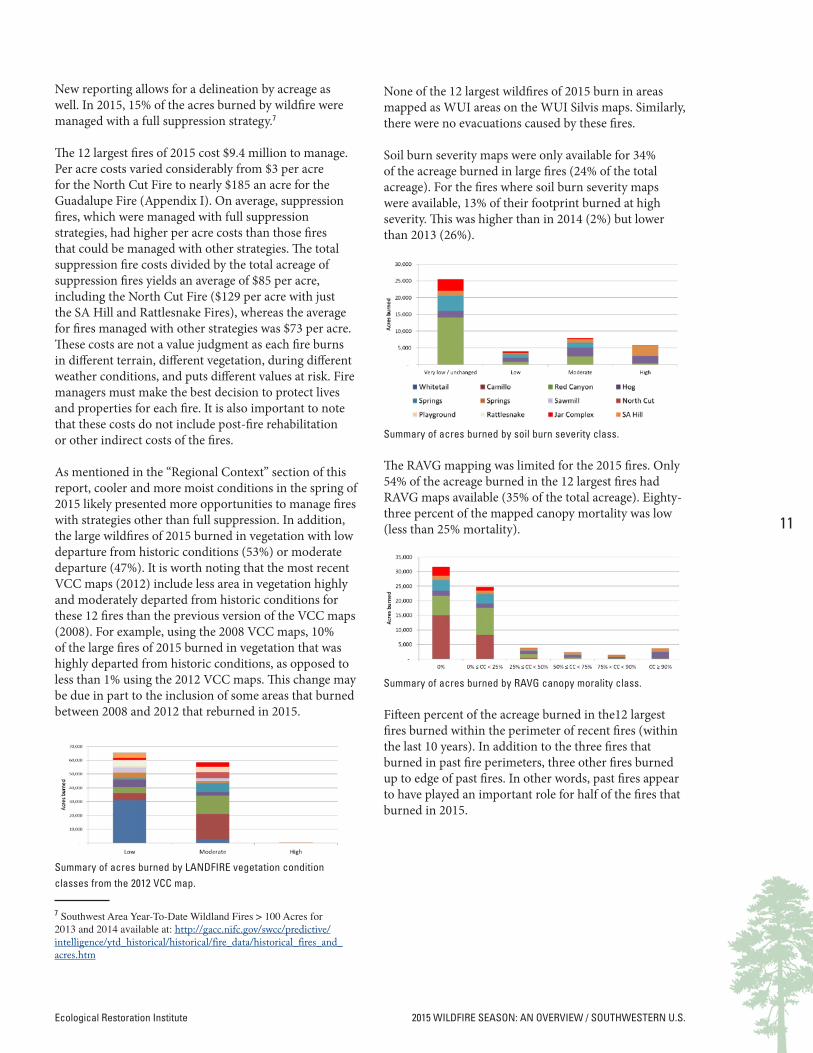
Soil burn severity maps were only available for 34% of the acreage burned in large fires (24% of the total acreage). For the fires where soil burn severity maps were available, 13% of their footprint burned at high severity. This was higher than in 2014 (2%) but lower than 2013 (26%).
Summary of acres burned by soil burn severity class.
The RAVG mapping was limited for the 2015 fires. Only 54% of the acreage burned in the 12 largest fires had RAVG maps available (35% of the total acreage). Eighty-three percent of the mapped canopy mortality was low (less than 25% mortality).
Summary of acres burned by RAVG canopy morality class.
Fifteen percent of the acreage burned in the12 largest fires burned within the perimeter of recent fires (within the last 10 years). In addition to the three fires that burned in past fire perimeters, three other fires burned up to edge of past fires. In other words, past fires appear to have played an important role for half of the fires that burned in 2015.
New reporting allows for a delineation by acreage as well. In 2015, 15% of the acres burned by wildfire were managed with a full suppression strategy.7
The 12 largest fires of 2015 cost $9.4 million to manage. Per acre costs varied considerably from $3 per acre for the North Cut Fire to nearly $185 an acre for the Guadalupe Fire (Appendix I). On average, suppression fires, which were managed with full suppression strategies, had higher per acre costs than those fires that could be managed with other strategies. The total suppression fire costs divided by the total acreage of suppression fires yields an average of $85 per acre, including the North Cut Fire ($129 per acre with just the SA Hill and Rattlesnake Fires), whereas the average for fires managed with other strategies was $73 per acre. These costs are not a value judgment as each fire burns in different terrain, different vegetation, during different weather conditions, and puts different values at risk. Fire managers must make the best decision to protect lives and properties for each fire. It is also important to note that these costs do not include post-fire rehabilitation or other indirect costs of the fires.
As mentioned in the “Regional Context” section of this report, cooler and more moist conditions in the spring of 2015 likely presented more opportunities to manage fires with strategies other than full suppression. In addition, the large wildfires of 2015 burned in vegetation with low departure from historic conditions (53%) or moderate departure (47%). It is worth noting that the most recent VCC maps (2012) include less area in vegetation highly and moderately departed from historic conditions for these 12 fires than the previous version of the VCC maps (2008). For example, using the 2008 VCC maps, 10% of the large fires of 2015 burned in vegetation that was highly departed from historic conditions, as opposed to less than 1% using the 2012 VCC maps. This change may be due in part to the inclusion of some areas that burned between 2008 and 2012 that reburned in 2015.
Summary of acres burned by LANDFIRE vegetation condition classes from the 2012 VCC map.
7 Southwest Area Year-To-Date Wildland Fires > 100 Acres for 2013 and 2014 available at: http://gacc.nifc.gov/swcc/predictive/intelligence/ytd_historical/historical/fire_data/historical_fires_and_acres.htm

Appendix I Fire Statistics
Vegetation DepartureName Acres Cost cost/ac Low Medium High
Whitetail 33,633 $2,770,500 $82 92% 8% 0%
Camillo 23,885 $1,300,000 $54 22% 77% 0%
Red Canyon 17,843 $1,650,000 $92 25% 75% 0%
Hog 8,057 $500,000 $62 66% 33% 1%
Springs 7,111 $200,000 $28 14% 86% 0%
Guadalupe 5,974 $1,105,000 $185 71% 28% 1%
Sawmill 5,667 $346,000 $61 62% 38% 0%
North Cut 5,000 $15,000 $3 1% 87% 1%
Playground 4,960 $200,000 $40 15% 79% 6%
Rattlesnake 4,910 $430,000 $88 99% 1% 0%
Jar Complex 4,370 $80,000 $18 30% 70% 0%
SA Hill 4,336 $761,000 $176 92% 6% 1%
Soil Burn Severity RAVG Canopy Mortality
Name Unburned Low Moderate High 0% < 25% < 50% < 75% < 90% ≥ 90%
Whitetail
Camillo 63% 35% 1% 0% 0% 0%
Red Canyon 79% 5% 14% 2% 37% 53% 8% 2% 1% 1%
Hog 24% 16% 33% 28% 22% 17% 12% 12% 8% 29%
Springs 64% 14% 21% 0% 52% 47% 5% 1% 0% 0%
Guadalupe 25% 7% 17% 52% 25% 18% 14% 14% 9% 19%
Sawmill
North Cut
Playground
Rattlesnake
Jar Complex 79% 13% 8% 0% 69% 29% 1% 0% 0% 0%
SA Hill
13
Ecological Restoration Institute 2015 WILDFIRE SEASON: AN OVERVIEW / SOUTHWESTERN U .S .

Northern Arizona University is an Equal Opportunity/Affirmative Action Institution/60066/05.16
Ecological Restoration InstituteP.O. Box 15017Flagstaff, AZ 86011-5017nau.edu/eri
G1002747G1002747