Embed Size (px)
Citation preview

2015-2016IOWAASSESSMENTS
____________________________________________________________________________________________
AnnualReport

| Iowa Assessments Annual Report 1
IowaAssessmentsAnnualReportCouncilBluffsCommunitySchoolDistrict2015-2016
OverviewThisisthefifthyearthatthedistricthasadministeredIowaAssessmentstoallstudentsingrades2-11intheareasofreading,mathematics,andscience.IowaAssessmentsareanationallynorm-referencedtestthatisusedinthestateofIowatomeetfederalaccountabilityrequirementsformerlyknownasAdequateYearlyProgress(AYP).Duetochangesinfederallaw,theEveryStudentSucceedsAct(ESSA),nolongerrequiresstatestoreportAYP.However,statesarestillrequiredtoadministerandreportasummativemeasure.Thisreportcontainspreliminaryinformationonthedistrict’sperformanceonIowaAssessments.IowaAssessmentdataprovidesasummarylookonstudentachievementatonepointintime,asnapshotofdistrictperformance.Thedistrictanalyzesthedatatodeterminewhatprogresshasbeenmadeovertimeandtodetermineifstudentachievementisimproving.
| Iowa Assessments Annual Report 2
ReadingPerformancePercentProficientbyGradeLevels
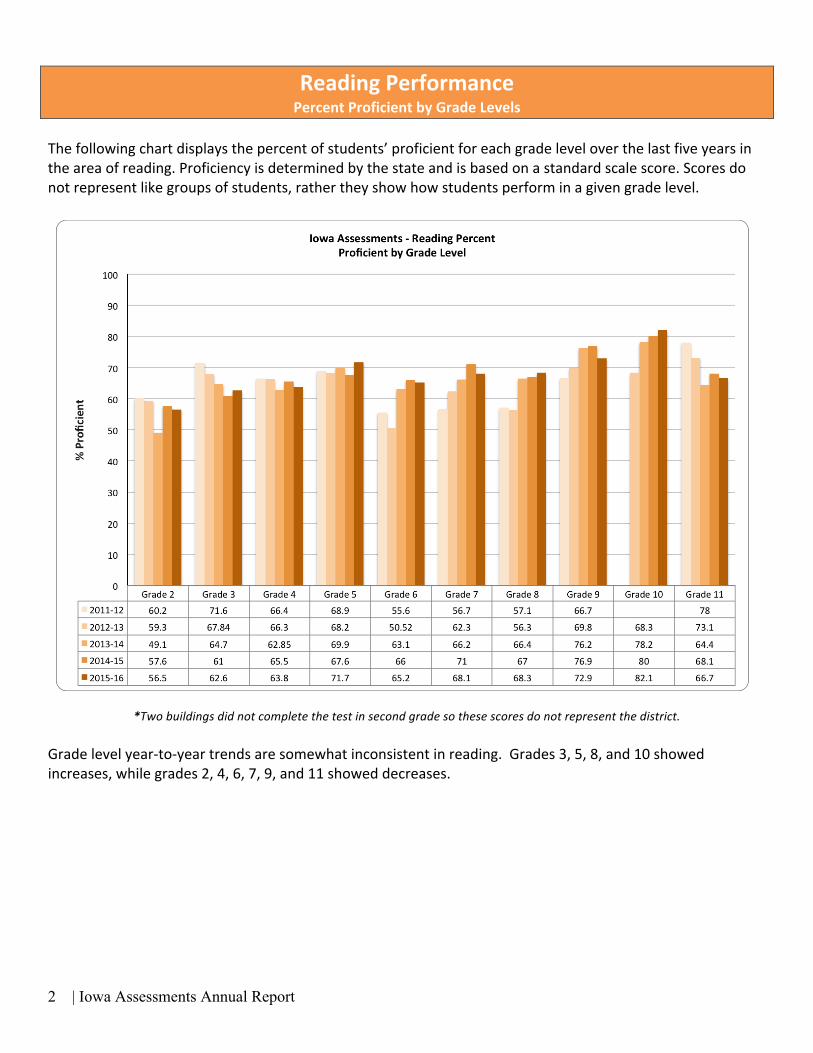
Thefollowingchartdisplaysthepercentofstudents’proficientforeachgradeleveloverthelastfiveyearsintheareaofreading.Proficiencyisdeterminedbythestateandisbasedonastandardscalescore.Scoresdonotrepresentlikegroupsofstudents,rathertheyshowhowstudentsperforminagivengradelevel.
*Twobuildingsdidnotcompletethetestinsecondgradesothesescoresdonotrepresentthedistrict.
Gradelevelyear-to-yeartrendsaresomewhatinconsistentinreading.Grades3,5,8,and10showedincreases,whilegrades2,4,6,7,9,and11showeddecreases.

| Iowa Assessments Annual Report 3
ReadingPerformancePercentProficientbyBuilding&GradeLevels
Thetablebelowdisplaysthepercentofstudentsproficientinreadingbygradelevelandbuildingforthelastfiveyears.
Grade2 Grade3 Grade4 Grade5
11-12 12-13 13-14 14-15 15-16 11-12 12-13 13-14 14-15 15-16 11-12 12-13 13-14 14-15 15-16 11-12 12-13 13-14 14-15 15-16
District 60.2 59.3 49.1 57.6 57.9 71.6 67.84 64.7 61 62.6 66.4 66.3 62.5 65.5 63.8 68.9 68.2 68.9 67.6 71.7
Bloomer 65.7 66.7 45.3 51.4 53.3 80 61.3 60.8 58.8 48.4 59.1 68.6 59.3 65.2 61.2 63.9 54.4 68.5 58 72.7
CarterLake 45.5 54.2 58 51.9 55.8 77.6 63 56.9 61.1 53.7 69 68.1 50 47.7 53.4 66.1 78.4 64.1 51 58
CollegeView 74.1 58.6 57 75.6 81.4 78.7 74.2 79.1 73.7 73.4 73.3 72.3 68.3 76.8 73.4 78 77.4 75.8 82.1 83.1
Crescent 82.6 66.7 55.6 44.4 71.4 100 85.2 85 92.3 70 100 86.7 74.1 75 80 100 70 90 75 79.2
Edison 59.6 55.9 28.4 58.8 55.9 64.7 68 61 45.7 61.1 68.2 60.6 57.4 55.6 47.3 67.4 60.3 54.3 55.9 70.4
Franklin 60.3 58.1 41.9 66.7 59.7 75.4 73.1 70.3 53.8 74.7 72.3 64.3 68.6 58.3 53.4 66.2 68.8 75.4 66.7 68.1
Hoover 74 63.2 65 61.3 73.2 85.7 81 67.5 68.8 67.6 72.2 82.9 80.3 74.7 77.8 83.3 71.3 75.6 87.5 76.9
Lewis&Clark 67.7 64.9 67.9 69.2 57.6 73.8 82.9 78.9 76.9 80.8 72.2 73.3 88.6 72.2 89.7 65.8 78.4 79.3 81.3 72.7
Longfellow 55.3 57.3 49.4 54.2 38.9 59.7 67.2 56.8 62.8 59.7 63.4 60.7 54 68 66.7 53.1 64.3 67.6 64.1 72.7
Roosevelt 51.6 50 50 51.7 37.7 59.2 57.1 52.9 57.1 50.8 58.5 67.3 59.4 66.1 60.3 69.6 74.4 77.4 68.1 61
Rue 55.8 61.4 50 31.3 52.9 66.7 54.2 71.4 55.2 57.4 55.8 54 54.5 70 70 80 65.5 55.6 54.3 80
WalnutGrove 45.5 56.4 34.1 51.9 59.3 43.8 55.3 37.8 41.5 60 63.4 45.2
Grade6 Grade7 Grade8
11-12 12-13 13-14 14-15 15-16 11-12 12-13 13-14 14-15 15-16 11-12 12-13 13-14 14-15 15-16
District 55.6 50.52 63.1 66 65.2 56.7 62.3 66.2 71 68.1 57.1 56.3 66.4 67 68.3
Kirn 57 52.6 62.8 68.7 70.9 59.6 68.4 71 74.8 77.1 57.9 59.1 69.2 68.1 72.1
Wilson 54.2 48.5 63.4 62.6 59.2 54 56.3 61.4 67.1 58.2 56.4 53.3 63.8 65.8 64.5
Grade9 Grade10 Grade11
11-12 12-13 13-14 14-15 15-16 11-12 12-13 13-14 14-15 15-16 11-12 12-13 13-14 14-15 15-16
District 66.7 69.8 76.2 76.9 72.9 68.3 78.2 80 82.1 78 73.1 64.4 68.1 66.7
Lincoln 65.5 71.9 79.9 78.4 74.6 70.1 78.6 84 85.5 79.1 75 65.1 72 70
Jefferson 66.9 67.6 72.5 75.5 70.9 66.6 77.9 76 78.7 76.7 71.3 64.1 64 63.1

| Iowa Assessments Annual Report 4
ReadingPerformancePercentProficientbyCohorts
Thefollowingchartdisplaysthepercentofstudents’proficientforeachcurrentgradelevelcohortforthelastfiveyearsintheareaofreading.Acohortisdefinedalikegroupofstudents.Proficiencyisdeterminedbythestateandisbasedonastandardscalescore.Scoresrepresentlikegroupsofstudents’progressovertime.
*Twobuildingsdidnotcompletethetestinsecondgradesothesescoresdonotrepresentthedistrict.
Apositivetrendispresentingrades3,4,5,9,and10withthepercentofstudentsachievingproficiencygenerallyincreasingeachyear.Proficiencyingrades6,7,and8hasremainedrelativelyflat,whileproficiencyhasincreasedingrade11withtheexceptionof2016
| Iowa Assessments Annual Report 5
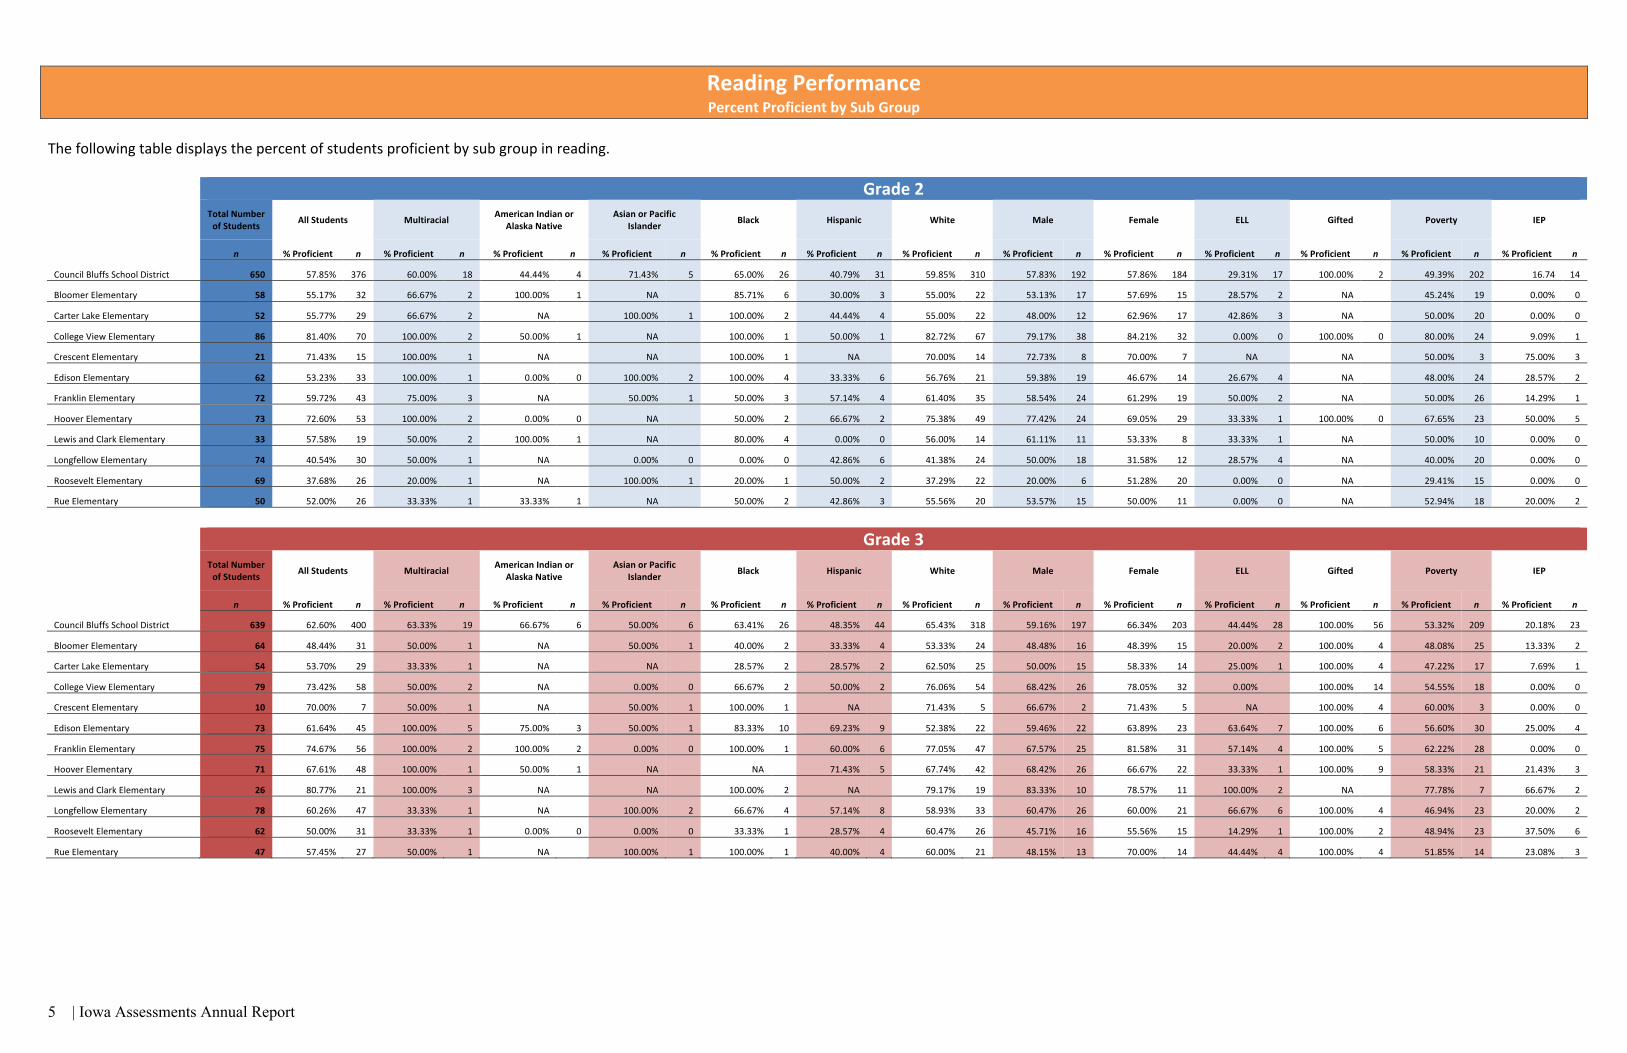
ReadingPerformancePercentProficientbySubGroup
Thefollowingtabledisplaysthepercentofstudentsproficientbysubgroupinreading.
Grade2
TotalNumberofStudents AllStudents Multiracial AmericanIndianor
AlaskaNativeAsianorPacific
Islander Black Hispanic White Male Female ELL Gifted Poverty IEP
n %Proficient n %Proficient n %Proficient n %Proficient n %Proficient n %Proficient n %Proficient n %Proficient n %Proficient n %Proficient n %Proficient n %Proficient n %Proficient n
CouncilBluffsSchoolDistrict 650 57.85% 376 60.00% 18 44.44% 4 71.43% 5 65.00% 26 40.79% 31 59.85% 310 57.83% 192 57.86% 184 29.31% 17 100.00% 2 49.39% 202 16.74 14
BloomerElementary 58 55.17% 32 66.67% 2 100.00% 1 NA 85.71% 6 30.00% 3 55.00% 22 53.13% 17 57.69% 15 28.57% 2 NA
45.24% 19 0.00% 0
CarterLakeElementary 52 55.77% 29 66.67% 2 NA
100.00% 1 100.00% 2 44.44% 4 55.00% 22 48.00% 12 62.96% 17 42.86% 3 NA
50.00% 20 0.00% 0
CollegeViewElementary 86 81.40% 70 100.00% 2 50.00% 1 NA 100.00% 1 50.00% 1 82.72% 67 79.17% 38 84.21% 32 0.00% 0 100.00% 0 80.00% 24 9.09% 1
CrescentElementary 21 71.43% 15 100.00% 1 NA
NA 100.00% 1 NA 70.00% 14 72.73% 8 70.00% 7 NA NA
50.00% 3 75.00% 3
EdisonElementary 62 53.23% 33 100.00% 1 0.00% 0 100.00% 2 100.00% 4 33.33% 6 56.76% 21 59.38% 19 46.67% 14 26.67% 4 NA
48.00% 24 28.57% 2
FranklinElementary 72 59.72% 43 75.00% 3 NA
50.00% 1 50.00% 3 57.14% 4 61.40% 35 58.54% 24 61.29% 19 50.00% 2 NA
50.00% 26 14.29% 1
HooverElementary 73 72.60% 53 100.00% 2 0.00% 0 NA 50.00% 2 66.67% 2 75.38% 49 77.42% 24 69.05% 29 33.33% 1 100.00% 0 67.65% 23 50.00% 5
LewisandClarkElementary 33 57.58% 19 50.00% 2 100.00% 1 NA 80.00% 4 0.00% 0 56.00% 14 61.11% 11 53.33% 8 33.33% 1 NA
50.00% 10 0.00% 0
LongfellowElementary 74 40.54% 30 50.00% 1 NA
0.00% 0 0.00% 0 42.86% 6 41.38% 24 50.00% 18 31.58% 12 28.57% 4 NA
40.00% 20 0.00% 0
RooseveltElementary 69 37.68% 26 20.00% 1 NA
100.00% 1 20.00% 1 50.00% 2 37.29% 22 20.00% 6 51.28% 20 0.00% 0 NA
29.41% 15 0.00% 0
RueElementary 50 52.00% 26 33.33% 1 33.33% 1 NA 50.00% 2 42.86% 3 55.56% 20 53.57% 15 50.00% 11 0.00% 0 NA
52.94% 18 20.00% 2
Grade3
TotalNumberofStudents AllStudents Multiracial AmericanIndianor
AlaskaNativeAsianorPacific
Islander Black Hispanic White Male Female ELL Gifted Poverty IEP
n %Proficient n %Proficient n %Proficient n %Proficient n %Proficient n %Proficient n %Proficient n %Proficient n %Proficient n %Proficient n %Proficient n %Proficient n %Proficient n
CouncilBluffsSchoolDistrict 639 62.60% 400 63.33% 19 66.67% 6 50.00% 6 63.41% 26 48.35% 44 65.43% 318 59.16% 197 66.34% 203 44.44% 28 100.00% 56 53.32% 209 20.18% 23
BloomerElementary 64 48.44% 31 50.00% 1 NA
50.00% 1 40.00% 2 33.33% 4 53.33% 24 48.48% 16 48.39% 15 20.00% 2 100.00% 4 48.08% 25 13.33% 2
CarterLakeElementary 54 53.70% 29 33.33% 1 NA
NA 28.57% 2 28.57% 2 62.50% 25 50.00% 15 58.33% 14 25.00% 1 100.00% 4 47.22% 17 7.69% 1
CollegeViewElementary 79 73.42% 58 50.00% 2 NA
0.00% 0 66.67% 2 50.00% 2 76.06% 54 68.42% 26 78.05% 32 0.00% 100.00% 14 54.55% 18 0.00% 0
CrescentElementary 10 70.00% 7 50.00% 1 NA
50.00% 1 100.00% 1 NA 71.43% 5 66.67% 2 71.43% 5 NA 100.00% 4 60.00% 3 0.00% 0
EdisonElementary 73 61.64% 45 100.00% 5 75.00% 3 50.00% 1 83.33% 10 69.23% 9 52.38% 22 59.46% 22 63.89% 23 63.64% 7 100.00% 6 56.60% 30 25.00% 4
FranklinElementary 75 74.67% 56 100.00% 2 100.00% 2 0.00% 0 100.00% 1 60.00% 6 77.05% 47 67.57% 25 81.58% 31 57.14% 4 100.00% 5 62.22% 28 0.00% 0
HooverElementary 71 67.61% 48 100.00% 1 50.00% 1 NA NA
71.43% 5 67.74% 42 68.42% 26 66.67% 22 33.33% 1 100.00% 9 58.33% 21 21.43% 3
LewisandClarkElementary 26 80.77% 21 100.00% 3 NA
NA 100.00% 2 NA 79.17% 19 83.33% 10 78.57% 11 100.00% 2 NA
77.78% 7 66.67% 2
LongfellowElementary 78 60.26% 47 33.33% 1 NA
100.00% 2 66.67% 4 57.14% 8 58.93% 33 60.47% 26 60.00% 21 66.67% 6 100.00% 4 46.94% 23 20.00% 2
RooseveltElementary 62 50.00% 31 33.33% 1 0.00% 0 0.00% 0 33.33% 1 28.57% 4 60.47% 26 45.71% 16 55.56% 15 14.29% 1 100.00% 2 48.94% 23 37.50% 6
RueElementary 47 57.45% 27 50.00% 1 NA
100.00% 1 100.00% 1 40.00% 4 60.00% 21 48.15% 13 70.00% 14 44.44% 4 100.00% 4 51.85% 14 23.08% 3

| Iowa Assessments Annual Report 6
ReadingPerformancePercentProficientbySubGroup
Grade4
TotalNumberofStudents AllStudents Multiracial AmericanIndianor
AlaskaNativeAsianorPacific
Islander Black Hispanic White Male Female ELL Gifted Poverty IEP
n %Proficient n %Proficient n %Proficient n %Proficient n %Proficient n %Proficient n %Proficient n %Proficient n %Proficient n %Proficient n %Proficient n %Proficient n %Proficient n
CouncilBluffsSchoolDistrict 690 63.77% 440 72.00% 18 50.00% 4 66.67% 6 57.14% 20 46.92% 61 68.70% 349 61.94% 223 65.76% 217 44.94% 40 98.86% 87 56.62% 248 27.42% 34
BloomerElementary 86 60.47% 52 80.00% 4 100.00% 2 NA 100.00% 4 35.71% 10 69.23% 36 59.57% 28 61.54% 24 40.00% 8 100.00% 7 56.25% 36 28.57% 4
CarterLakeElementary 59 54.24% 32 100.00% 1 0.00% 0 NA 20.00% 1 33.33% 3 63.64% 28 56.67% 17 51.72% 15 25.00% 1 100.00% 4 45.45% 20 14.29% 2
CollegeViewElementary 79 73.42% 58 NA 0.00% 0 100.00% 1 100.00% 1 75.00% 3 73.61% 53 68.75% 22 76.60% 36 NA 100.00% 19 40.00% 8 33.33% 4
CrescentElementary 15 80.00% 12 NA NA
NA NA
NA 80.00% 12 90.91% 10 50.00% 2 NA 66.67% 2 100.00% 10 66.67% 2
EdisonElementary 73 46.58% 34 66.67% 4 0.00% 0 50.00% 1 33.33% 2 31.58% 6 55.56% 25 42.42% 14 50.00% 20 47.37% 9 100.00% 5 42.00% 21 31.82% 7
FranklinElementary 89 53.93% 48 100.00% 2 NA
NA 100.00% 4 35.71% 5 54.93% 39 47.17% 25 63.89% 23 37.50% 3 100.00% 7 45.45% 30 15.38% 2
HooverElementary 72 77.78% 56 50.00% 2 100.00% 1 NA 25.00% 1 78.57% 11 81.13% 43 74.29% 26 81.08% 30 60.00% 3 100.00% 9 71.79% 28 38.46% 5
LewisandClarkElementary 29 89.66% 26 0.00% 0 NA
NA 100.00% 1 NA 89.29% 25 88.89% 16 90.91% 10 NA 100.00% 6 86.67% 13 0.00% 0
LongfellowElementary 70 65.71% 46 100.00% 2 NA
66.67% 2 50.00% 1 59.09% 13 69.77% 30 72.22% 26 58.82% 20 52.63% 10 100.00% 9 62.22% 28 33.33% 3
RooseveltElementary 68 60.29% 41 100.00% 2 NA
50.00% 1 60.00% 3 41.67% 5 65.31% 32 61.11% 22 59.38% 19 28.57% 2 100.00% 10 60.78% 31 30.77% 4
RueElementary 50 70.00% 35 50.00% 1 50.00% 1 100.00% 1 66.67% 2 62.50% 5 72.22% 26 58.62% 17 85.71% 18 57.14 4 100.00% 9 67.65% 23 12.50% 1
Grade5
TotalNumberofStudents AllStudents Multiracial AmericanIndianor
AlaskaNativeAsianorPacific
Islander Black Hispanic White Male Female ELL Gifted Poverty IEP
n %Proficient n %Proficient n %Proficient n %Proficient n %Proficient n %Proficient n %Proficient n %Proficient n %Proficient n %Proficient n %Proficient n %Proficient n %Proficient n
CouncilBluffsSchoolDistrict 678 71.68% 486 65.00% 13 55.56% 5 55.56% 5 77.14% 27 57.73% 56 74.43% 393 69.89% 246 73.62% 240 56.72% 38 100.00% 134 65.55% 274 29.10% 39
BloomerElementary 67 71.64% 48 100.00% 2 0.00% 0 NA 100.00% 2 69.23% 9 72.55% 37 61.54% 24 85.71% 24 70.00% 7 100.00% 14 72.00% 36 15.38% 2
CarterLakeElementary 70 58.57% 41 50.00% 1 100.00% 1 NA 80.00% 4 42.86% 6 60.00% 30 57.14% 20 60.00% 21 41.67% 5 100.00% 6 51.06% 24 18.18% 2
CollegeViewElementary 71 83.10% 59 33.33% 1 NA
NA 25.00% 1 100.00% 5 85.48% 53 83.33% 30 82.86% 29 100.00% 1 100.00% 21 63.33% 19 36.36% 4
CrescentElementary 24 79.17% 19 0.00% 0 NA
0.00% 0 NA
NA 82.61% 19 61.54% 8 100.00% 11 NA 100.00% 3 84.62% 11 0.00% 0
EdisonElementary 71 70.42% 50 100.00% 3 NA
66.67%% 2 100.00% 5 64.29% 9 69.39% 34 61.54% 24 81.25% 26 72.73% 8 100.00% 10 73.58% 39 52.94% 9
FranklinElementary 73 68.49% 50 100.00% 1 NA
NA 66.67% 2 66.67% 10 69.09% 38 77.14% 27 60.53% 23 50.00% 3 100.00% 10 64.71% 33 13.33% 2
HooverElementary 79 75.95% 60 66.67% 2 50.00% 1 0.00% 0 85.71% 6 66.67% 2 77.27% 51 75.00% 30 76.92% 30 100.00% 2 100.00% 18 63.16% 24 43.48% 10
LewisandClarkElementary 33 72.73% 24 100.00% 2 NA
NA 100.00% 1 33.33% 1 75.86% 22 77.78% 14 66.67% 10 50.00% 1 100.00% 8 58.33% 7 0.00% 0
LongfellowElementary 79 72.15% 57 100.00% 1 33.33% 1 50.00% 1 100.00% 4 55.00% 11 80.00% 40 70.59% 24 73.33% 33 50.00% 8 100.00% 17 65.31% 32 21.43% 3
RooseveltElementary 59 61.02% 36 0.00% 0 NA
100.00% 1 33.33% 1 0.00% 0 69.39% 34 61.29% 19 60.71% 17 0.00% 0 100.00% 14 52.78% 19 7.69% 1
RueElementary 52 80.77% 42 NA 100.00% 2 100.00% 1 100.00% 1 75.00% 3 79.55% 35 81.25% 26 80.00% 16 75.00% 3 100.00% 13 76.92% 30 50.00% 6

| Iowa Assessments Annual Report 7
ReadingPerformancePercentProficientbySubGroup
Grade6
TotalNumberofStudents AllStudents Multiracial AmericanIndianor
AlaskaNativeAsianorPacific
Islander Black Hispanic White Male Female ELL Gifted Poverty IEP
n %Proficient n %Proficient n %Proficient n %Proficient n %Proficient n %Proficient n %Proficient n %Proficient n %Proficient n %Proficient n %Proficient n %Proficient n %Proficient n
CouncilBluffsSchoolDistrict 580 65.17% 378 62.50% 15 60.00% 3 90.91% 10 58.62% 17 51.11% 46 67.87% 302 67.87% 302 70.59% 204 50.00% 32 99.07% 107 59.40% 218 22.34% 21
KirnMiddleSchool 287 71.08% 204 66.67% 8 75.00% 3 80.00% 4 50.00% 6 60.00% 21 73.59% 170 73.59% 170 75.33% 113 50.00% 11 100.00% 61 64.24% 97 23.08% 9
WilsonMiddleSchool 293 59.39% 174 58.33% 7 0.00% 0 100.00% 6 64.71% 11 45.45% 25 61.68% 132 61.68% 132 65.47% 91 50.00% 21 97.87% 46 56.02% 121 21.82% 12
Grade7
TotalNumberofStudents AllStudents Multiracial AmericanIndianor
AlaskaNativeAsianorPacific
Islander Black Hispanic White Male Female ELL Gifted Poverty IEP
n %Proficient n %Proficient n %Proficient n %Proficient n %Proficient n %Proficient n %Proficient n %Proficient n %Proficient n %Proficient n %Proficient n %Proficient n %Proficient n
CouncilBluffsSchoolDistrict 640 68.13% 436 76.92% 20 57.14% 8 80.00% 8 80.00% 8 60.58% 63 70.90% 346 66.67% 210 69.54% 226 58.44% 45 100.00% 106 59.85% 246 20.95% 22
KirnMiddleSchool 341 76.83% 262 90.91% 10 62.50% 5 66.67% 2 66.67% 2 66.67% 30 79.27% 218 76.27% 135 77.44% 127 67.57% 25 100.00% 69 67.68% 134 25.00% 12
WilsonMiddleSchool 299 58.19% 174 66.67% 10 50.00% 3 85.71% 6 85.71% 6 55.93% 33 60.09% 128 54.35% 75 61.49% 99 50.00% 20 100.00% 37 52.58% 112 17.54% 10
Grade8
TotalNumberofStudents
AllStudents Multiracial AmericanIndianorAlaskaNative
AsianorPacificIslander
Black Hispanic White Male Female ELL Gifted Poverty IEP
n %Proficient n %Proficient n %Proficient n %Proficient n %Proficient n %Proficient n %Proficient n %Proficient n %Proficient n %Proficient n %Proficient n %Proficient n %Proficient n
CouncilBluffsSchoolDistrict 628 68.31% 429 59.26% 16 33.33% 1 72.73% 8 63.89% 23 70.11% 61 68.43% 336 65.27% 203 71.29% 226 64.91% 37 100.00% 101 61.83% 243 19.00% 19
KirnMiddleSchool 332 71.69% 238 61.54% 8 50.00% 1 83.33% 5 63.64% 7 65.85% 27 72.79% 198 68.35% 108 74.71% 130 53.33% 16 100.00% 56 63.54% 115 22.92% 11
WilsonMiddleSchool 296 64.53% 191 57.14% 8 0.00% 0 60.00% 3 64.00% 16 73.91% 34 63.01% 138 62.09% 95 67.13% 96 77.78% 21 100.00% 45 60.38% 128 15.38% 8
Grade9
TotalNumberofStudents AllStudents Multiracial
AmericanIndianorAlaskaNative
AsianorPacificIslander Black Hispanic White Male Female ELL Gifted Poverty IEP
n %Proficient n %Proficient n %Proficient n %Proficient n %Proficient n %Proficient n %Proficient n %Proficient n %Proficient n %Proficient n %Proficient n %Proficient n %Proficient n
CouncilBluffsSchoolDistrict 524 72.90% 382 72.22% 13 100.00% 5 50.00% 2 77.27% 17 65.79% 50 73.86% 308 69.85% 183 75.95% 199 63.83% 30 97.74% 130 68.85% 210 35.80% 29
AbrahamLincolnHighSchool 276 74.64% 206 87.50% 7 100.00% 4 50.00% 2 90.00% 9 72.41% 21 74.24% 170 72.73% 96 76.39% 110 68.42% 13 100.00% 79 70.39% 107 41.30% 19
ThomasJeffersonHighSchool 248 70.97% 176 60.00% 6 100.00% 1 NA 66.67% 8 61.70% 29 73.40% 138 66.92% 87 75.42% 89 60.71% 17 94.44% 51 67.32% 103 28.57% 10

| Iowa Assessments Annual Report 8
ReadingPerformancePercentProficientbySubGroup
Grade10
TotalNumberofStudents AllStudents Multiracial AmericanIndianor
AlaskaNativeAsianorPacific
Islander Black Hispanic White Male Female ELL Gifted Poverty IEP
n %Proficient n %Proficient n %Proficient n %Proficient n %Proficient n %Proficient n %Proficient n %Proficient n %Proficient n %Proficient n %Proficient n %Proficient n %Proficient n
CouncilBluffsSchoolDistrict 577 81.98% 473 85.00% 17 100.00% 4 100.00% 9 73.08% 19 81.71% 67 82.02% 374 78.74% 237 85.51% 236 82.98% 39 99.24% 130 79.45% 259 44.44% 40
AbrahamLincolnHighSchool 291 85.22% 248 87.50% 7 100.00% 2 100.00% 4 85.71% 6 86.21% 25 84.74% 211 84.46% 125 86.01% 123 81.25% 13 100.00% 70 82.07% 119 50.00% 21
ThomasJeffersonHighSchool 286 78.67% 225 83.33% 10 100.00% 2 100.00% 5 68.42% 13 79.25% 42 78.74% 163 73.20% 112 84.96% 113 83.87% 26 98.36% 60 77.35% 140 39.58% 19
Grade11
TotalNumberofStudents AllStudents Multiracial AmericanIndianor
AlaskaNativeAsianorPacific
Islander Black Hispanic White Male Female ELL Gifted Poverty IEP
n %Proficient n %Proficient n %Proficient n %Proficient n %Proficient n %Proficient n %Proficient n %Proficient n %Proficient n %Proficient n %Proficient n %Proficient n %Proficient n
CouncilBluffsSchoolDistrict 590 66.78% 394 77.78% 14 50.00% 4 80.00% 8 65.71% 23 60.26% 47 67.97% 312 62.26% 193 71.79% 201 56.86% 29 98.99% 98 60.33% 181 21.28% 20
AbrahamLincolnHighSchool 300 70.33% 211 88.89% 8 50.00% 1 87.50% 7 50.00% 6 59.26% 16 72.11% 181 67.92% 108 73.05% 103 72.22% 13 98.33% 59 59.85% 79 26.67% 12
ThomasJeffersonHighSchool 290 63.10% 183 66.67% 6 50.00% 3 50.00% 1 73.91% 17 60.78% 31 62.98% 131 56.29% 85 70.50% 98 48.48% 16 100.00% 39 60.71% 102 16.33% 8
| Iowa Assessments Annual Report 9
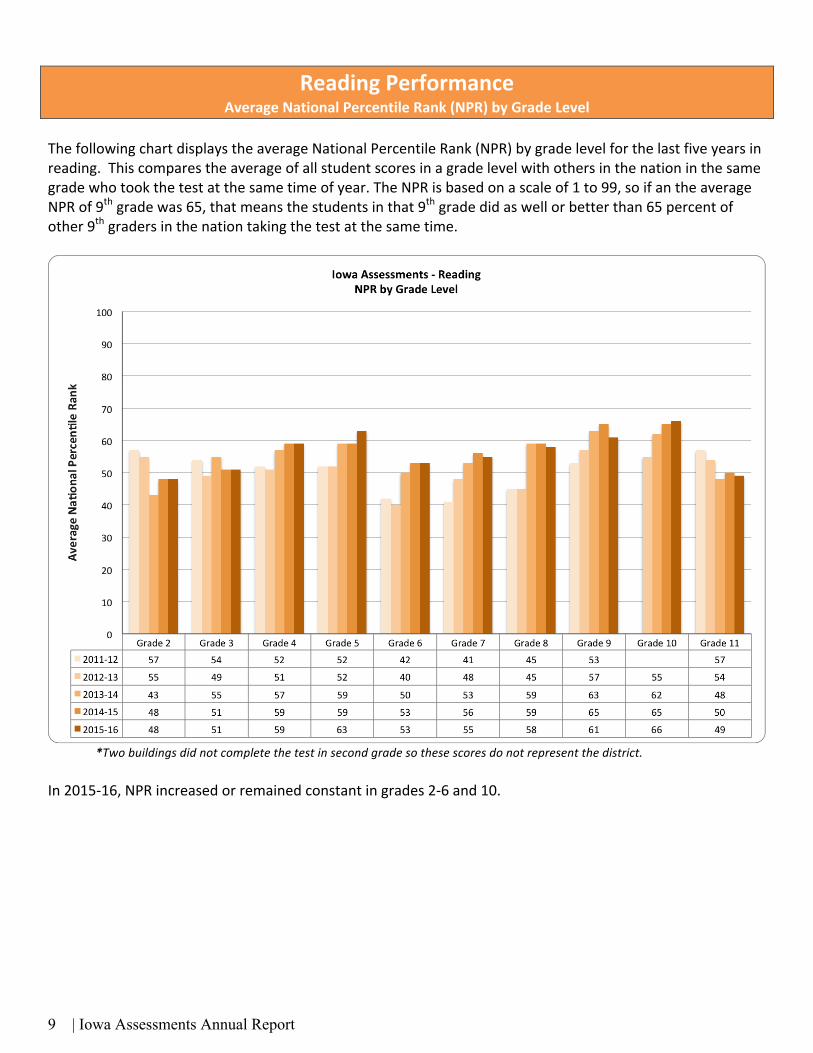
ReadingPerformanceAverageNationalPercentileRank(NPR)byGradeLevel
ThefollowingchartdisplaystheaverageNationalPercentileRank(NPR)bygradelevelforthelastfiveyearsinreading.Thiscomparestheaverageofallstudentscoresinagradelevelwithothersinthenationinthesamegradewhotookthetestatthesametimeofyear.TheNPRisbasedonascaleof1to99,soifantheaverageNPRof9thgradewas65,thatmeansthestudentsinthat9thgradedidaswellorbetterthan65percentofother9thgradersinthenationtakingthetestatthesametime.
*Twobuildingsdidnotcompletethetestinsecondgradesothesescoresdonotrepresentthedistrict.In2015-16,NPRincreasedorremainedconstantingrades2-6and10.

| Iowa Assessments Annual Report 10
ReadingPerformanceAverageNationalPercentileRank(NPR)byCohort
ThefollowingchartdisplaystheaverageNationalPercentileRank(NPR)bycohortforthelastfiveyearsinreading.Scoresrepresentlikegroupsofstudents’progressovertime.
*Twobuildingsdidnotcompletethetestinsecondgradesothesescoresdonotrepresentthedistrict.Apositivetrendispresentinallgradesexcept6and11.
*

| Iowa Assessments Annual Report 11
MathematicsPerformancePercentProficientbyGradeLevels
Thefollowingchartdisplaysthepercentofstudents’proficientforeachgradeleveloverthelastfiveyearsintheareaofmathematics.Proficiencyisdeterminedbythestateandisbasedonastandardscalescore.Scoresdonotrepresentlikegroupsofstudents,rathertheyshowhowstudentsperformatagradelevel.
Thepercentofstudentsscoringproficientinmathingrades2,5,6,7,9,and10increasedcomparedto2015.Scoresatgrades4,8,and11dippedslightlyfromthepreviousyear.

| Iowa Assessments Annual Report 12
MathematicsPerformancePercentProficientbyBuilding&GradeLevel
Thetablebelowdisplaysthepercentproficientbygradelevelandbuildingforthelastfiveyears.
Grade2 Grade3 Grade4 Grade5
11-12 12-13 13-14 14-15 15-16 11-12 12-13 13-14 14-15 15-16 11-12 12-13 13-14 14-15 15-16 11-12 12-13 13-14 14-15 15-16
District 62.11 65.28 62.35 63 64.3 72.05 51.86 67.97 70.9 70.6 64.81 65.5 70.41 67.5 65.8 64.08 65.85 66.41 67.8 69.4
Bloomer 70.1 78.6 62.8 62.5 64.4 86.7 64.5 68.9 70.6 68.3 62.1 84.3 66.7 61.4 65.1 69.4 63.2 74.1 52 68.2
CarterLake 54.5 56.7 68 55.6 64 67.3 48.9 63.8 63 66.7 56.9 68.1 50 55.4 55.2 53.3 64 76.3 40.8 56.5
CollegeView 79.3 71.4 74.4 79.5 77.9 70.5 65.2 74.6 75 74.7 83.3 64.6 75 82.6 74.7 72.5 74.2 77.8 83.9 78.9
Crescent 87 66.7 72.2 66.7 61.9 100 66.7 80 92.3 80 100 73.3 85.2 80 66.7 100 60 90 75 87.5
Edison 52.1 58.8 53.7 55.9 56.5 61.8 72 59.3 67.1 74 63.2 50.7 77.4 63.5 54.7 58.8 69.5 54.3 69.5 52.1
Franklin 54.7 61.3 60.3 64.1 69.4 77 60.8 79.4 64.8 63.4 76.9 64.3 70.6 69 59.8 67.6 78.1 59 68 73.6
Hoover 76 63.6 72.9 74.7 69.9 88.3 75.9 63.8 80.5 66.2 73.6 80.5 76.9 69.6 70.8 81.5 73.8 77.8 87.5 79.5
Lewis&Clark 68.6 73 75 69.2 66.7 78.7 60 76.3 84.6 92.3 61.1 78.3 80 80.6 82.8 55.3 59.5 74.1 78.1 72.7
Longfellow 53.8 53.9 57.1 56.9 54.6 66.7 50.8 61.7 69.2 72.7 60.6 62.3 73 65.3 69.1 42.9 56 61.8 65.6 65
Roosevelt 58.1 72.9 51 59 55.1 53.1 57.8 68.6 65.2 70.5 52.4 69.2 72.5 55.9 60.3 57.9 60.5 61.5 59.7 63
Rue 50 62.2 59.7 45.8 64.6 66.7 63.3 78.6 72.4 66 50 56 75 72 78 82.5 61.8 66.7 65.2 82
WalnutGrove 58.2 50 48.8 59.3 57.4 46.9 55.3 31.1 41.5 52.5 58.5 28.6
Grade6 Grade7 Grade8
11-12 12-13 13-14 14-15 15-16 11-12 12-13 13-14 14-15 15-16 11-12 12-13 13-14 14-15 15-16
District 56.8 57.61 65.14 66.6 67.5 64.89 67.47 73.65 75.7 77.2 59.23 54.73 58.91 65.7 65
Kirn 63.5 62 67.1 72.7 76.8 64.8 68.9 73.1 76.9 83.2 56 56 65.6 66.8 66.8
Wilson 50.7 53.4 63.1 59.4 58 65 66.1 74.2 74.4 70.7 62.4 53.3 52.6 64.6 63.2
Grade9 Grade10 Grade11
11-12 12-13 13-14 14-15 15-16 11-12 12-13 13-14 14-15 15-16 11-12 12-13 13-14 14-15 15-16
District 65.5 66.32 62.68 67.1 67.5 66.24 70.93 66.9 71.8 70.52 67.18 67.41 70.2 64.9
Lincoln 67.3 66.4 64.9 67.4 68 70.1 72.6 70.2 73.3 71.4 71.1 68.8 71.4 64
Jefferson 63.8 66.2 60.6 66.9 66.8 62.4 69.2 63.6 70.4 69.5 63.5 65.9 69 66.1
| Iowa Assessments Annual Report 13
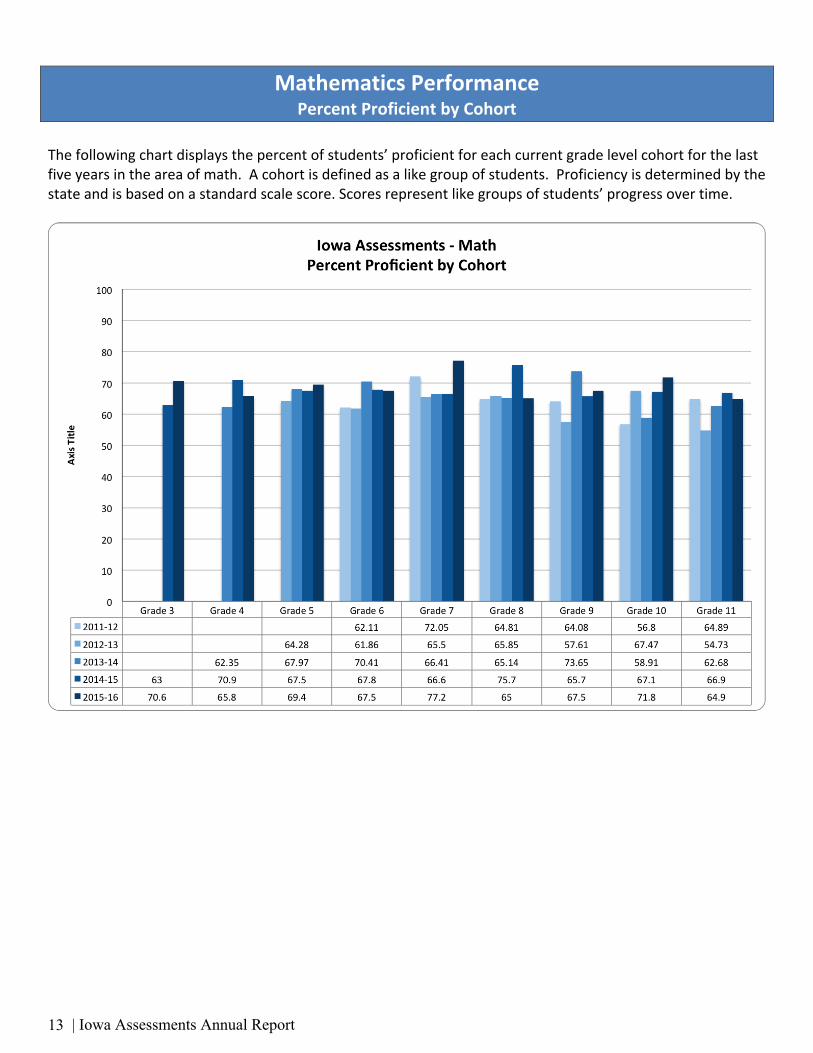
MathematicsPerformancePercentProficientbyCohort
Thefollowingchartdisplaysthepercentofstudents’proficientforeachcurrentgradelevelcohortforthelastfiveyearsintheareaofmath.Acohortisdefinedasalikegroupofstudents.Proficiencyisdeterminedbythestateandisbasedonastandardscalescore.Scoresrepresentlikegroupsofstudents’progressovertime.

| Iowa Assessments Annual Report 14
MathematicsPerformancePercentProficientbySubGroup
Thefollowingtabledisplaysthepercentofstudentsproficientbysubgroupinmathematics.
Grade2
TotalNumberofStudents AllStudents Multiracial AmericanIndianor
AlaskaNativeAsianorPacific
Islander Black Hispanic White Male Female ELL Gifted Poverty IEP
n %Proficient n %Proficient n %Proficient n %Proficient n %Proficient n %Proficient n %Proficient n %Proficient n %Proficient n %Proficient n %Proficient n %Proficient n %Proficient n
CouncilBluffsSchoolDistrict 674 64.09% 432 56.67% 17 33.33% 3 75.00% 6 65.00% 26 45.12% 37 67.29% 360 67.35% 231 60.73% 201 33.33% 21 68.18% 15 58.02% 246 19.10% 17
BloomerElementary 59 64.41% 38 33.33% 1 0.00% 0 NA 71.43% 5 45.45% 5 70.00% 28 66.67% 22 61.54% 16 37.50% 3 NA 64.29% 27 40.00% 4
CarterLakeElementary 52 63.46% 33 66.67% 2 NA 100.00% 1 100.00% 2 44.44% 4 65.00% 26 64.00% 16 62.96% 17 28.57% 2 NA 57.50% 23 0.00% 0
CollegeViewElementary 86 77.91% 67 100.00% 2 50.00% 1 NA 100.00% 1 50.00% 1 79.01% 64 81.25% 39 73.68% 28 100.00% 1 50.00% 1 70.00% 21 18.18% 2
CrescentElementary 21 61.90% 13 100.00% 1 NA NA 100.00% 1 NA 60.00% 12 54.55% 6 70.00% 7 NA 100.00% 5 66.67% 4 0.00% 0
EdisonElementary 62 58.06% 36 100.00% 1 0.00% 0 100.00% 2 100.00% 4 33.33% 6 64.86% 24 65.63% 21 50.00% 15 26.67% 4 NA 54.00% 27 28.57% 2
FranklinElementary 72 69.44% 50 50.00% 2 NA 100.00% 2 50.00% 3 42.86% 3 73.68% 42 68.29% 28 70.97% 22 25.00% 1 66.67% 2 61.54% 32 28.57% 2
HooverElementary 73 69.86% 51 50.00% 1 0.00% 0 NA 25.00% 1 66.67% 2 73.85% 48 77.42% 24 64.29% 27 33.33% 1 100.00% 1 55.88% 19 20.00% 2
LewisandClarkElementary 33 66.67% 22 75.00% 3 100.00% 1 NA 80.00% 4 50.00% 1 64.00% 16 61.11% 11 73.33% 11 66.67% 2 NA 65.00% 13 0.00% 0
LongfellowElementary 97 54.64% 53 50.00% 1 NA 0.00% 0 100.00% 1 42.11% 8 58.67% 44 54.35% 25 54.90% 28 33.33% 6 54.55% 6 50.77% 33 11.11% 1
RooseveltElementary 69 55.07% 38 20.00% 1 NA 100.00% 1 20.00% 1 100.00% 4 54.24% 32 63.33% 19 48.72% 19 50.00% 1 NA 52.94% 27 25.00% 2
RueElementary 50 62.00% 31 66.67% 2 33.33% 1 NA 75.00% 3 42.86% 3 66.67% 24 71.43% 20 50.00% 11 0.00% 0 NA 58.82% 20 20.00% 2
Grade3
TotalNumberofStudents AllStudents Multiracial AmericanIndianor
AlaskaNativeAsianorPacific
Islander Black Hispanic White Male Female ELL Gifted Poverty IEP
n %Proficient n %Proficient n %Proficient n %Proficient n %Proficient n %Proficient n %Proficient n %Proficient n %Proficient n %Proficient n %Proficient n %Proficient n %Proficient n
CouncilBluffsSchoolDistrict 637 70.64% 450 82.76% 24 77.78% 7 83.33% 10 70.00% 28 58.06% 54 72.67% 351 69.91% 230 71.43% 220 60.94% 39 98.21% 55 62.05% 242 38.39% 43
BloomerElementary 63 68.25% 43 100.00% 2 NA 50.00% 1 60.00% 3 58.33% 7 72.73% 32 59.38% 19 77.42% 24 50.00% 5 100.00% 4 74.51% 38 57.14% 8
CarterLakeElementary 54 66.67% 36 33.33% 1 NA NA 42.86% 3 57.14% 4 72.50% 29 63.33% 19 70.83% 17 50.00% 2 100.00% 4 58.33% 21 7.69% 1
CollegeViewElementary 79 74.68% 59 75.00% 3 NA 100.00% 1 66.67% 2 50.00% 2 76.06% 54 68.42% 26 80.49% 33 0.00% 100.00% 14 51.52% 17 11.11% 1
CrescentElementary 10 80.00% 8 100.00% 2 NA 100.00% 2 100.00% 1 NA 71.43% 5 66.67% 2 85.71% 6 NA 100.00% 4 80.00% 4 50.00% 1
EdisonElementary 74 74.32% 55 100.00% 5 75.00% 3 100.00% 2 83.33% 10 78.57% 11 69.05% 29 78.38% 29 70.27% 26 81.82% 9 100.00% 6 68.52% 37 56.25% 9
FranklinElementary 74 63.51% 47 100.00% 2 100.00% 2 0.00% 0 0.00% 0 40.00% 4 68.33% 41 58.33% 21 68.42% 26 42.86% 3 100.00% 5 47.73% 21 0.00% 0
HooverElementary 71 66.20% 47 100.00% 1 50.00% 1 NA NA 71.43% 5 66.13% 41 71.05% 27 60.61% 20 66.67% 2 88.89% 8 52.78% 19 21.43% 3
LewisandClarkElementary 26 92.31% 24 100.00% 3 NA NA 100.00% 2 NA 91.67% 22 100.00% 12 85.71% 12 100.00% 2 100.00% 4 100.00% 9 66.67% 2
LongfellowElementary 78 73.08% 57 66.67% 2 NA 100.00% 2 83.33% 5 66.67% 10 72.73% 40 76.19% 32 69.44% 25 70.00% 7 NA 69.39% 34 30.00% 3
RooseveltElementary 61 70.49% 43 100.00% 2 100.00% 1 100.00% 1 100.00% 2 42.86% 6 76.74% 33 70.59% 24 70.37% 19 57.14% 4 100.00% 2 65.22% 30 46.67% 7
RueElementary 47 65.96% 31 50.00% 1 NA 100.00% 1 0.00% 0 50.00% 5 71.43% 25 70.37% 19 60.00% 12 55.56% 5 100.00% 4 44.44% 12 61.54% 8

| Iowa Assessments Annual Report 15
MathematicsPerformancePercentProficientbySubGroup
Grade4
TotalNumberofStudents AllStudents Multiracial AmericanIndianor
AlaskaNativeAsianorPacific
Islander Black Hispanic White Male Female ELL Gifted Poverty IEP
n %Proficient n %Proficient n %Proficient n %Proficient n %Proficient n %Proficient n %Proficient n %Proficient n %Proficient n %Proficient n %Proficient n %Proficient n %Proficient n
CouncilBluffsSchoolDistrict 690 65.80% 454 64.00% 16 44.44% 4 55.56% 5 57.14% 20 55.73% 73 69.57% 352 66.85% 242 64.63% 212 56.67% 51 100.00% 88 59.86% 261 28.23% 35
BloomerElementary 87 65.52% 57 80.00% 4 50.00% 1 NA 100.00% 4 51.72% 15 71.15% 37 66.67% 32 64.10% 25 57.14% 12 100.00% 7 62.50% 40 21.43% 3
CarterLakeElementary 59 55.93% 33 100.00% 1 0.00% 0 NA 20.00% 1 55.56% 5 61.36% 27 60.00% 18 51.72% 15 50.00% 2 100.00% 4 47.73% 21 21.43% 3
CollegeViewElementary 79 74.68% 59 NA 0.00% 0 100.00% 1 0.00% 75.00% 3 76.39% 55 71.88% 23 76.60% 36 NA 100.00% 19 50.00% 10 33.33% 4
CrescentElementary 15 66.67% 10 NA NA NA NA NA 66.67% 10 72.73% 8 50.00% 2 NA 100.00% 3 70.00% 7 66.67% 2
EdisonElementary 74 54.05% 40 50.00% 3 50.00% 1 50.00% 1 66.67% 4 47.37% 9 55.56% 25 64.71% 22 45.00% 18 63.16% 12 100.00% 5 50.00% 25 36.36% 8
FranklinElementary 88 60.23% 53 50.00% 1 NA NA 50.00% 2 42.86% 6 64.29% 45 60.38% 32 60.00% 21 37.50% 3 100.00% 7 52.31% 34 23.08% 3
HooverElementary 72 70.83% 51 50.00% 2 100.00% 1 NA 50.00% 2 78.57% 11 69.81% 37 68.57% 24 72.97% 27 60.00% 3 100.00% 9 64.10% 25 15.38% 2
LewisandClarkElementary 29 82.76% 24 0.00% NA NA 100.00% 1 NA 82.14% 23 83.33% 15 81.82% 9 NA 100.00% 6 80.00% 12 0.00% 0
LongfellowElementary 69 68.12% 47 100.00% 2 NA 66.67% 2 50.00% 1 59.09% 13 73.81% 31 66.67% 24 69.70% 23 52.63% 10 100.00% 9 65.91% 29 33.33% 3
RooseveltElementary 68 60.29% 41 100.00% 2 NA 0.00% 0 60.00% 3 41.67% 5 67.35% 33 66.67% 24 53.13% 17 57.14% 4 100.00% 10 62.75% 32 23.08% 3
RueElementary 50 78.00% 39 50.00% 1 50.00% 1 100.00% 1 66.67% 2 75.00% 6 80.56% 29 68.97% 20 90.48% 19 71.43% 5 100.00% 9 76.47% 26 50.00% 4
Grade5
TotalNumberofStudents AllStudents Multiracial AmericanIndianor
AlaskaNativeAsianorPacific
Islander Black Hispanic White Male Female ELL Gifted Poverty IEP
n %Proficient n %Proficient n %Proficient n %Proficient n %Proficient n %Proficient n %Proficient n %Proficient n %Proficient n %Proficient n %Proficient n %Proficient n %Proficient n
CouncilBluffsSchoolDistrict 679 69.37% 471 55.00% 11 66.67% 6 77.78% 7 60.00% 21 56.12% 55 72.35% 382 72.35% 382 66.56% 217 52.17% 36 100.00% 134 62.68% 262 25.37% 34
BloomerElementary 67 67.16% 45 50.00% 1 0.00% 0 NA 50.00% 1 61.54% 8 70.59% 36 70.59% 36 82.14% 23 60.00% 6 100.00% 14 66.00% 33 15.38% 2
CarterLakeElementary 70 55.71% 39 50.00% 1 100.00% 1 NA 80.00% 4 42.86% 6 56.00% 28 56.00% 28 45.71% 16 50.00% 6 100.00% 6 42.55% 20 18.18% 2
CollegeViewElementary 71 78.87% 56 33.33% 1 NA NA 25.00% 1 100.00% 5 80.65% 50 80.65% 50 80.00% 28 100.00% 1 100.00% 21 63.33% 19 18.18% 2
CrescentElementary 24 87.50% 21 100.00% 1 NA 100.00% 1 NA NA 86.96% 20 86.96% 20 100.00% 11 NA 100.00% 3 100.00% 13 0.00% 0
EdisonElementary 71 52.11% 37 33.33% 1 NA 33.33% 1 40.00% 2 50.00% 7 55.10% 27 55.10% 27 46.88% 15 36.36% 4 100.00% 10 49.06% 26 23.53% 4
FranklinElementary 73 73.97% 54 100.00% 1 NA NA 66.67% 2 66.67% 10 76.36% 42 76.36% 42 68.42% 26 66.67% 4 100.00% 10 72.55% 37 33.33% 5
HooverElementary 78 79.49% 62 100.00% 3 50.00% 1 100.00% 1 71.43% 5 100.00% 2 80.30% 53 80.30% 53 78.95% 30 100.00% 2 100.00% 18 71.05% 27 43.48% 10
LewisandClarkElementary 33 72.73% 24 50.00% 1 NA NA 100.00% 1 33.33% 1 75.86% 22 75.86% 22 66.67% 10 50.00% 1 100.00% 8 58.33% 7 0.00% 0
LongfellowElementary 80 65.00% 52 100.00% 1 66.67% 2 100.00% 2 75.00% 3 52.38% 11 68.00% 34 68.00% 34 57.78% 26 47.06% 8 100.00% 17 61.22% 30 14.29% 2
RooseveltElementary 60 63.33% 38 0.00% 0 NA 100.00% 1 33.33% 1 28.57% 2 69.39% 34 69.39% 34 58.62% 17 25.00% 1 100.00% 14 52.78% 19 15.38% 2
RueElementary 52 82.69% 43 NA 100.00% 2 100.00% 1 100.00% 1 75.00% 3 81.82% 36 81.82% 36 75.00% 15 75.00% 3 100.00% 13 79.49% 31 41.67% 5

| Iowa Assessments Annual Report 16
MathematicsPerformancePercentProficientbySubGroup
Grade6
TotalNumberofStudents AllStudents Multiracial AmericanIndianor
AlaskaNativeAsianorPacific
Islander Black Hispanic White Male Female ELL Gifted Poverty IEP
n %Proficient n %Proficient n %Proficient n %Proficient n %Proficient n %Proficient n %Proficient n %Proficient n %Proficient n %Proficient n %Proficient n %Proficient n %Proficient n
CouncilBluffsSchoolDistrict 581 67.47% 392 66.67% 16 40.00% 2 90.91% 10 67.50% 27 51.65% 47 71.01% 316 67.35% 196 67.35% 196 50.77% 33 97.22% 105 59.13% 217 25.53% 24
KirnMiddleSchool 287 77.00% 221 66.67% 8 50.00% 2 80.00% 4 64.71% 11 57.14% 20 81.39% 188 74.45% 102 74.45% 102 54.55% 12 98.36% 60 66.89% 101 30.77% 12
WilsonMiddleSchool 294 58.16% 171 66.67% 8 0.00% 0 100.00% 6 69.57% 16 48.21% 27 59.81% 128 61.04% 94 61.04% 94 48.84% 21 95.74% 45 53.70% 116 21.82% 12
Grade7
TotalNumberofStudents AllStudents Multiracial AmericanIndianor
AlaskaNativeAsianorPacific
Islander Black Hispanic White Male Female ELL Gifted Poverty IEP
n %Proficient n %Proficient n %Proficient n %Proficient n %Proficient n %Proficient n %Proficient n %Proficient n %Proficient n %Proficient n %Proficient n %Proficient n %Proficient n
CouncilBluffsSchoolDistrict 641 77.22% 495 77.22% 495 57.14% 8 80.00% 8 70.83% 17 75.47% 80 78.44% 382 77.46% 244 76.99% 251 73.42% 58 99.06% 105 71.60% 295 25.00% 26
KirnMiddleSchool 341 82.99% 283 82.99% 283 75.00% 6 100.00% 3 90.00% 9 75.56% 34 84.00% 231 83.05% 147 82.93% 136 75.68% 28 100.00% 69 77.27% 153 29.17% 14
WilsonMiddleSchool 300 70.67% 212 70.67% 212 33.33% 2 71.43% 5 57.14% 8 75.41% 46 71.23% 151 70.29% 97 70.99% 115 71.43% 30 97.30% 36 66.36% 142 21.43% 12
Grade8
TotalNumberofStudents
AllStudents Multiracial AmericanIndianorAlaskaNative
AsianorPacificIslander
Black Hispanic White Male Female ELL Gifted Poverty IEP
n %Proficient n %Proficient n %Proficient n %Proficient n %Proficient n %Proficient n %Proficient n %Proficient n %Proficient n %Proficient n %Proficient n %Proficient n %Proficient n
CouncilBluffsSchoolDistrict 632 65.03% 411 65.03% 411 33.33% 1 81.82% 9 52.78% 19 64.04% 57 65.92% 325 66.77% 209 63.32% 202 61.02% 36 99.01% 100 59.90% 236 15.69% 16
KirnMiddleSchool 336 66.67% 224 66.67% 224 0.00% 0 100.00% 6 45.45% 5 58.14% 25 68.61% 188 69.38% 111 64.20% 113 46.88% 15 100.00% 56 57.69% 105 12.00% 6
WilsonMiddleSchool 296 63.18% 187 63.18% 187 100.00% 1 60.00% 3 56.00% 14 69.57% 32 62.56% 137 64.05% 98 62.24% 89 77.78% 21 97.78% 44 61.79% 131 19.23% 10
Grade9
TotalNumberofStudents AllStudents Multiracial
AmericanIndianorAlaskaNative
AsianorPacificIslander Black Hispanic White Male Female ELL Gifted Poverty IEP
n %Proficient n %Proficient n %Proficient n %Proficient n %Proficient n %Proficient n %Proficient n %Proficient n %Proficient n %Proficient n %Proficient n %Proficient n %Proficient n
CouncilBluffsSchoolDistrict 526 67.49% 355 72.22% 13 60.00% 3 50.00% 2 68.18% 15 54.67% 41 70.00% 294 68.44% 180 66.54% 175 54.35% 25 99.25% 132 64.17% 197 37.80% 31
AbrahamLincolnHighSchool 275 68.00% 187 75.00% 6 75.00% 3 50.00% 2 80.00% 8 57.14% 16 69.00% 158 71.97% 95 64.34% 92 55.56% 10 98.72% 77 62.25% 94 38.30% 18
ThomasJeffersonHighSchool 251 66.93% 168 70.00% 7 0.00% 0 NA 58.33% 7 53.19% 25 71.20% 136 64.89% 85 69.17% 83 53.57% 15 100.00% 55 66.03% 103 37.14% 13

| Iowa Assessments Annual Report 17
MathematicsPerformancePercentProficientbySubGroup
Grade10
TotalNumberofStudents AllStudents Multiracial AmericanIndianor
AlaskaNativeAsianorPacific
Islander Black Hispanic White Male Female ELL Gifted Poverty IEP
n %Proficient n %Proficient n %Proficient n %Proficient n %Proficient n %Proficient n %Proficient n %Proficient n %Proficient n %Proficient n %Proficient n %Proficient n %Proficient n
CouncilBluffsSchoolDistrict 580 71.72% 416 80.00% 16 75.00% 3 77.78% 7 57.69% 15 69.88% 58 72.71% 333 72.37% 220 71.01% 196 74.47% 35 96.95% 127 68.20% 223 34.41% 32
AbrahamLincolnHighSchool 293 73.04% 214 87.50% 7 100.00% 2 100.00% 4 57.14% 4 76.67% 23 72.40% 181 73.51% 111 72.54% 103 75.00% 12 98.57% 69 69.18% 101 27.27% 12
ThomasJeffersonHighSchool 287 70.38% 202 75.00% 9 50.00% 1 60.00% 3 57.89% 11 66.04% 35 73.08% 152 71.24% 109 69.40% 93 74.19% 23 95.08% 58 67.40% 122 40.82% 20
Grade11
TotalNumberofStudents AllStudents Multiracial AmericanIndianor
AlaskaNativeAsianorPacific
Islander Black Hispanic White Male Female ELL Gifted Poverty IEP
n %Proficient n %Proficient n %Proficient n %Proficient n %Proficient n %Proficient n %Proficient n %Proficient n %Proficient n %Proficient n %Proficient n %Proficient n %Proficient n
CouncilBluffsSchoolDistrict 590 64.92% 383 94.44% 17 50.00% 4 90.00% 9 68.57% 24 62.34% 48 64.78% 298 62.58% 194 67.50% 189 66.67% 34 98.99% 98 59.47% 179 23.66% 22
AbrahamLincolnHighSchool 301 63.79% 192 88.89% 8 50.00% 1 87.50% 7 66.67% 8 51.85% 14 64.29% 162 61.88% 99 65.96% 93 63.16% 12 98.33% 59 55.64% 74 22.22% 10
ThomasJeffersonHighSchool 289 66.09% 191 100.00% 9 50.00% 3 100.00% 2 69.57% 16 68.00% 34 65.38% 136 63.33% 95 69.06% 96 68.75% 22 100.00% 39 62.50% 105 25.00% 12

| Iowa Assessments Annual Report 18
MathematicsPerformanceAverageNationalPercentileRank(NPR)byGradeLevel
ThefollowingchartdisplaystheaverageNationalPercentileRank(NPR)bygradelevelforthelastfiveyearsinmath.Thiscomparestheaverageofallstudentscoresinagradelevelwithothersinthenationinthesamegradewhotookthetestatthesametimeofyear.TheNPRisbasedonascaleof1to99,soifantheaverageNPRof9thgradewas65,thatmeansthestudentsinthat9thgradedidaswellorbetterthan65percentofother9thgradersinthenationtakingthetestatthesametime.
In2015-16,NPRinmathimprovedormaintainedineverygradelevel,exceptfor9and11.

| Iowa Assessments Annual Report 19
MathematicsPerformanceAverageNationalPercentileRank(NPR)byCohort
ThefollowingchartdisplaystheaverageNationalPercentileRank(NPR)bycohortforthelastfouryearsinmath.Scoresrepresentlikegroupsofstudents’progressovertime.
Apositivetrendispresentinnearlyeverygradelevelwiththeexceptionofgrades4,5,and8.
| Iowa Assessments Annual Report 20
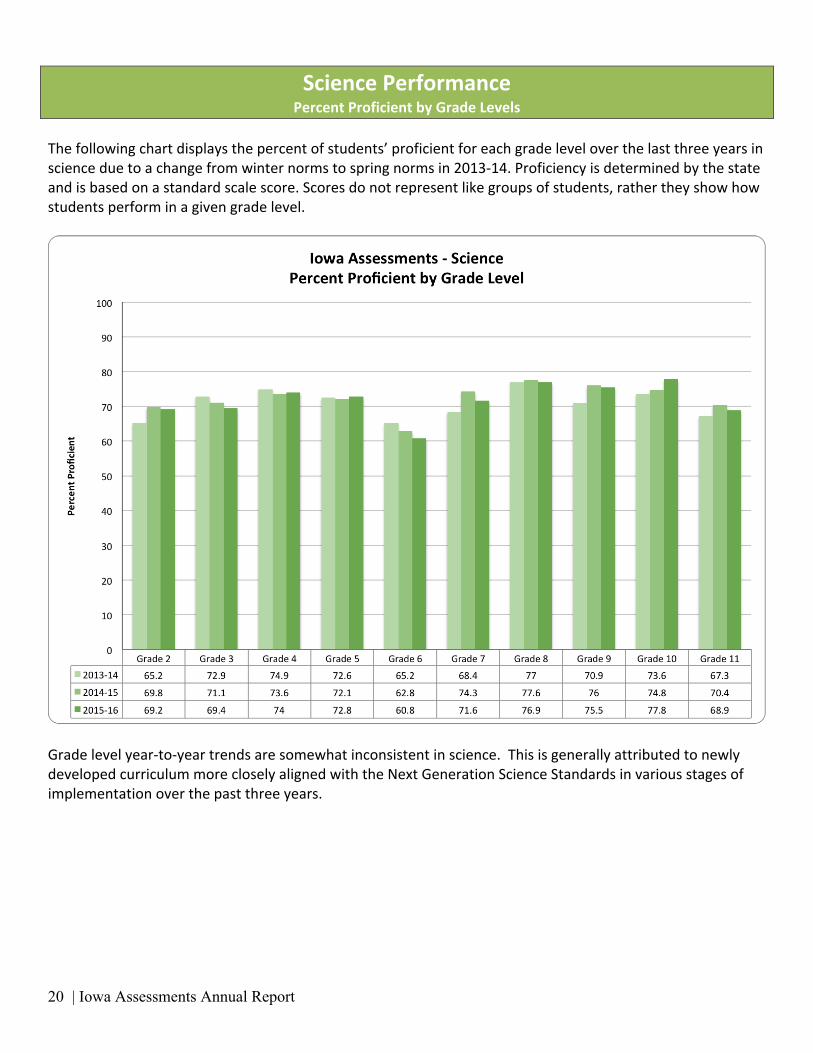
SciencePerformancePercentProficientbyGradeLevels
Thefollowingchartdisplaysthepercentofstudents’proficientforeachgradeleveloverthelastthreeyearsinscienceduetoachangefromwinternormstospringnormsin2013-14.Proficiencyisdeterminedbythestateandisbasedonastandardscalescore.Scoresdonotrepresentlikegroupsofstudents,rathertheyshowhowstudentsperforminagivengradelevel.
Gradelevelyear-to-yeartrendsaresomewhatinconsistentinscience.ThisisgenerallyattributedtonewlydevelopedcurriculummorecloselyalignedwiththeNextGenerationScienceStandardsinvariousstagesofimplementationoverthepastthreeyears.

| Iowa Assessments Annual Report 21
SciencePerformancePercentProficientbyBuilding&GradeLevels
Thetablebelowdisplaysthepercentofstudentsproficientinsciencebygradelevelandbuildingforthelastfouryears.
Grade2 Grade3 Grade4 Grade5
12-13 13-14 14-15 15-16 12-13 13-14 14-15 15-16 12-13 13-14 14-15 15-16 12-13 13-14 14-15 15-16
District 70.1 65.2 69.9 69.2 74.9 72.9 71.1 69.4 77.7 74.9 73.6 74 74.1 72.6 72.1 72.8
Bloomer 80.72 59.3 66.66 65 87.09 77.02 65.4 59.37 92.15 74.07 78.57 73.56 71.64 81.48 72 77.61
CarterLake 56.66 58 68.51 71.15 69.56 67.24 67.3 70.37 80.85 62.5 63.07 66.1 74.5 63.15 55.1 62.85
CollegeView 75.71 84.81 84.61 76.74 78.78 77.61 81.1 74.68 76.92 78.12 73.91 75.94 80.64 85.71 89.28 77.46
Crescent 77.77 66.66 100 71.42 92.59 75 75 80 80 96.29 80 73.33 80 85 87.5 83.33
Edison 61.76 46.26 61.76 61.29 77.55 62.71 65.2 72.6 63.38 74.07 60.31 67.56 79.66 55.71 72.88 63.38
Franklin 80.64 69.84 75.64 75 75 71.87 61.6 73.33 73.21 82.69 72.61 69.31 71.87 81.96 73.33 72.6
Hoover 80.51 76.27 80 82.19 93.1 83.75 82.8 71.83 90.24 83.33 86.07 86.11 77.77 83.14 80.55 84.61
Lewis&Clark 62.16 67.85 76.92 72.72 82.85 81.57 76.9 76.92 80 77.14 75 89.65 72.97 77.58 81.25 78.78
Longfellow 60.52 66.23 59.72 57.73 65.62 67.9 79.4 68.35 80.32 74.6 76 71.42 66.66 66.17 64.06 63.75
Roosevelt 75 72.54 62.29 65.21 61.53 71.15 73 54.83 75.47 75.36 64.4 72.05 76.74 81.13 55.55 61.66
Rue 64.44 61.29 54.16 66 77.55 80.95 69.4 72.34 80 65.9 82 78 78.18 62.22 76.08 86.53
WalnutGrove 58.97 48.78 49.05 50 57.77 56.09 62.5 39.02
Grade6 Grade7 Grade8
12-13 13-14 14-15 15-16 12-13 13-14 14-15 15-16 12-13 13-14 14-15 15-16
District 64.5 65.2 62.79 60.82 66 68.4 74.28 71.56 67.1 77 77.56 76.86
Kirn 69.47 68.82 69.01 63.41 68.27 74.32 77.25 79.17 70.33 80.83 78.67 78.2
Wilson 59.79 61.36 55.36 58.3 63.72 62.37 71.14 62.87 63.78 73.35 76.42 75.33
Grade9 Grade10 Grade11
12-13 13-14 14-15 15-16 12-13 13-14 14-15 15-16 12-13 13-14 14-15 15-16
District 78.4 70.9 75.98 75.53 76.4 73.6 74.75 77.85 73.3 67.3 70.4 68.87
Lincoln 78.37 74.17 80.9 77.09 77.85 76.1 77.37 81.16 76.32 76.1 72.46 70.52
Jefferson 78.49 67.75 71.23 73.79 75 70.86 72.13 74.47 70.43 70.86 68.28 67.12
| Iowa Assessments Annual Report 22
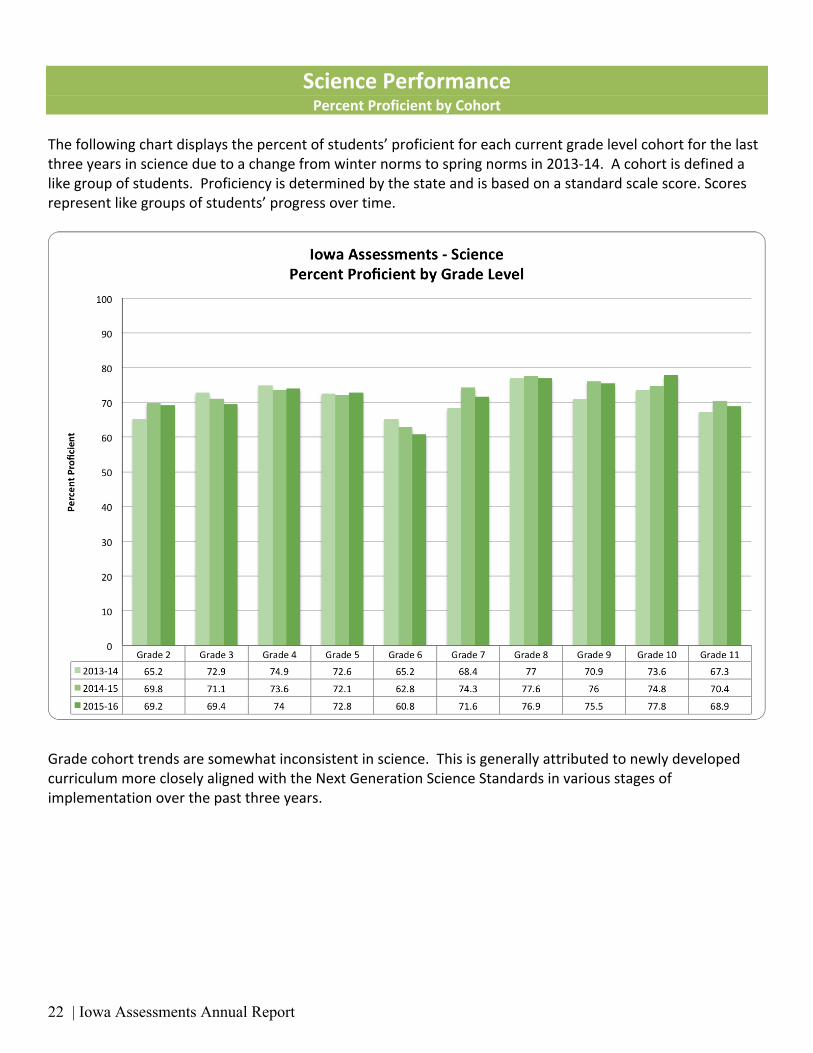
SciencePerformancePercentProficientbyCohort
Thefollowingchartdisplaysthepercentofstudents’proficientforeachcurrentgradelevelcohortforthelastthreeyearsinscienceduetoachangefromwinternormstospringnormsin2013-14.Acohortisdefinedalikegroupofstudents.Proficiencyisdeterminedbythestateandisbasedonastandardscalescore.Scoresrepresentlikegroupsofstudents’progressovertime.
Gradecohorttrendsaresomewhatinconsistentinscience.ThisisgenerallyattributedtonewlydevelopedcurriculummorecloselyalignedwiththeNextGenerationScienceStandardsinvariousstagesofimplementationoverthepastthreeyears.

| Iowa Assessments Annual Report 23
SciencePerformancePercentProficientbySubGroup
Thefollowingtabledisplaysthepercentofstudentsproficientbysubgroupinscience.
Grade2
TotalNumberofStudents AllStudents Multiracial AmericanIndianor
AlaskaNativeAsianorPacific
Islander Black Hispanic White Male Female ELL Gifted Poverty IEP
n %Proficient n %Proficient n %Proficient n %Proficient n %Proficient n %Proficient n %Proficient n %Proficient n %Proficient n %Proficient n %Proficient n %Proficient n %Proficient n
CouncilBluffsSchoolDistrict 674 69.14% 466 63.33% 19 44.44% 4 50.00% 4 67.50% 27 51.22% 42 72.71% 389 69.10% 237 69.18% 229 39.68% 25 77.27% 17 63.92% 271 37.08% 33
BloomerElementary 59 64.41% 38 66.67% 2 0.00% 0 NA 85.71% 6 36.36% 4 70.00% 28 60.61% 20 69.23% 18 25.00% 2 NA 57.14% 24 30.00% 3
CarterLakeElementary 52 71.15% 37 66.67% 2 NA 100.00% 1 100.00% 2 55.56% 5 72.50% 29 64.00% 16 77.78% 21 42.86% 3 NA 72.50% 29 40.00% 4
CollegeViewElementary 86 76.74% 66 100.00% 2 50.00% 1 NA 100.00% 1 50.00% 1 77.78% 63 75.00% 36 78.95% 30 0.00% 50.00% 1 73.33% 22 18.18% 2
CrescentElementary 21 71.43% 15 100.00% 1 NA NA 100.00% 1 NA 70.00% 14 63.64% 7 80.00% 8 NA 100.00% 5 66.67% 4 25.00% 1
EdisonElementary 62 61.29% 38 100.00% 1 100.00% 1 50.00% 1 100.00% 4 38.89% 7 67.57% 25 71.88% 23 50.00% 15 40.00% 6 NA 56.00% 28 42.86% 3
FranklinElementary 72 75.00% 54 75.00% 3 NA 50.00% 1 66.67% 4 57.14% 4 78.95% 45 73.17% 30 77.42% 24 50.00% 2 66.67% 2 67.31% 35 42.86% 3
HooverElementary 73 82.19% 60 50.00% 1 0.00% 0 NA 50.00% 2 100.00% 3 84.62% 55 87.10% 27 78.57% 33 66.67% 2 100.00% 1 73.53% 25 70.00% 7
LewisandClarkElementary 33 72.73% 24 50.00% 2 100.00% 1 NA 60.00% 3 50.00% 1 76.00% 19 61.11% 11 86.67% 13 66.67% 2 NA 65.00% 13 33.33% 1
LongfellowElementary 97 57.73% 56 50.00% 1 NA 0.00% 0 0.00% 52.63% 10 61.33% 46 56.52% 26 58.82% 30 38.89% 7 72.73% 8 58.46% 38 33.33% 3
RooseveltElementary 69 65.22% 45 40.00% 2 NA 100.00% 1 20.00% 1 75.00% 3 67.80% 40 66.67% 20 64.10% 25 0.00% NA 60.78% 31 25.00% 2
RueElementary 50 66.00% 33 66.67% 2 33.33% 1 NA 75.00% 3 57.14% 4 69.44% 25 75.00% 21 54.55% 12 50.00% 1 NA 64.71% 22 40.00% 4
Grade3
TotalNumberofStudents AllStudents Multiracial AmericanIndianor
AlaskaNativeAsianorPacific
Islander Black Hispanic White Male Female ELL Gifted Poverty IEP
n %Proficient n %Proficient n %Proficient n %Proficient n %Proficient n %Proficient n %Proficient n %Proficient n %Proficient n %Proficient n %Proficient n %Proficient n %Proficient n
CouncilBluffsSchoolDistrict 640 69.38% 444 63.33% 19 44.44% 4 75.00% 9 56.10% 23 53.26% 49 73.87% 359 73.87% 359 69.06% 212 57.81% 37 100.00% 56 61.22% 240 42.98% 49
BloomerElementary 64 59.38% 38 50.00% 1 NA 50.00% 1 60.00% 3 33.33% 4 66.67% 30 66.67% 30 61.29% 19 40.00% 4 100.00% 4 57.69% 30 40.00% 6
CarterLakeElementary 54 70.37% 38 0.00% NA NA 28.57% 2 57.14% 4 80.00% 32 80.00% 32 75.00% 18 50.00% 2 100.00% 4 66.67% 24 38.46% 5
CollegeViewElementary 79 74.68% 59 75.00% 3 NA 100.00% 1 66.67% 2 25.00% 1 77.46% 55 77.46% 55 80.49% 33 0.00% 100.00% 14 57.58% 19 0.00% 0
CrescentElementary 10 80.00% 8 50.00% 1 NA 50.00% 1 100.00% 1 NA 85.71% 6 85.71% 6 85.71% 6 NA 100.00% 4 60.00% 3 50.00% 1
EdisonElementary 73 72.60% 53 80.00% 4 50.00% 2 100.00% 2 66.67% 8 76.92% 10 73.81% 31 73.81% 31 63.89% 23 72.73% 8 100.00% 6 66.04% 35 62.50% 10
FranklinElementary 75 73.33% 55 100.00% 2 100.00% 2 0.00% 0.00% 0 50.00% 5 78.69% 48 78.69% 48 73.68% 28 57.14% 4 100.00% 5 64.44% 29 0.00% 0
HooverElementary 71 71.83% 51 0.00% 0.00% 0 NA NA 71.43% 5 74.19% 46 74.19% 46 66.67% 22 66.67% 2 100.00% 9 66.67% 24 35.71% 5
LewisandClarkElementary 26 76.92% 20 100.00% 3 NA NA 50.00% 1 NA 79.17% 19 79.17% 19 71.43% 10 50.00% 1 NA 77.78% 7 33.33% 1
LongfellowElementary 79 68.35% 54 66.67% 2 NA 100.00% 2 66.67% 4 53.33% 8 71.43% 40 71.43% 40 66.67% 24 60.00% 6 100.00% 4 57.14% 28 50.00% 5
RooseveltElementary 62 54.84% 34 66.67% 2 0.00% 0 100.00% 1 66.67% 2 35.71% 5 60.47% 26 60.47% 26 48.15% 13 42.86% 3 100.00% 2 53.19% 25 50.00% 8
RueElementary 47 72.34% 34 50.00% 1 NA 100.00% 1 0.00% 0 70.00% 7 74.29% 26 74.29% 26 80.00% 16 77.78% 7 100.00% 4 59.26% 16 61.54% 8

| Iowa Assessments Annual Report 24
SciencePerformancePercentProficientbySubGroup
Grade4
TotalNumberofStudents AllStudents Multiracial AmericanIndianor
AlaskaNativeAsianorPacific
Islander Black Hispanic White Male Female ELL Gifted Poverty IEP
n %Proficient n %Proficient n %Proficient n %Proficient n %Proficient n %Proficient n %Proficient n %Proficient n %Proficient n %Proficient n %Proficient n %Proficient n %Proficient n
CouncilBluffsSchoolDistrict 691 73.95% 511 84.00% 21 77.78% 7 66.67% 6 54.29% 19 64.89% 85 77.71% 394 74.59% 270 73.25% 241 64.44% 58 98.86% 87 68.65% 300 51.61% 64
BloomerElementary 87 73.56% 64 100.00% 5 50.00% 1 NA 100.00% 4 58.62% 17 80.77% 42 77.08% 37 69.23% 27 57.14% 12 100.00% 7 71.88% 46 50.00% 7
CarterLakeElementary 59 66.10% 39 100.00% 1 100.00% 1 NA 20.00% 1 33.33% 3 77.27% 34 66.67% 20 65.52% 19 0.00% 100.00% 4 61.36% 27 42.86% 6
CollegeViewElementary 79 75.95% 60 NA 0.00% 0 100.00% 1 0.00% 75.00% 3 77.78% 56 75.00% 24 76.60% 36 NA 100.00% 19 50.00% 10 50.00% 6
CrescentElementary 15 73.33% 11 NA NA NA NA NA 73.33% 11 72.73% 8 75.00% 3 NA 100.00% 3 70.00% 7 100.00% 3
EdisonElementary 74 67.57% 50 66.67% 4 100.00% 2 50.00% 1 50.00% 3 68.42% 13 68.89% 31 70.59% 24 65.00% 26 73.68% 14 100.00% 5 62.00% 31 68.18% 15
FranklinElementary 88 69.32% 61 50.00% 1 NA NA 25.00% 1 92.86% 13 67.14% 47 66.04% 35 74.29% 26 100.00% 8 100.00% 7 64.62% 42 38.46% 5
HooverElementary 72 86.11% 62 100.00% 4 100.00% 1 NA 50.00% 2 92.86% 13 86.79% 46 88.57% 31 83.78% 31 80.00% 4 100.00% 9 84.62% 33 61.54% 8
LewisandClarkElementary 29 89.66% 26 100.00% 1 NA NA 100.00% 1 NA 89.29% 25 88.89% 16 90.91% 10 NA 100.00% 6 80.00% 12 33.33% 1
LongfellowElementary 70 71.43% 50 100.00% 2 NA 66.67% 2 50.00% 1 50.00% 11 83.72% 36 75.00% 27 67.65% 23 52.63% 10 88.89% 8 68.89% 31 66.67% 6
RooseveltElementary 68 72.06% 49 100.00% 2 NA 50.00% 1 80.00% 4 58.33% 7 75.51% 37 75.00% 27 68.75% 22 85.71% 6 100.00% 10 68.63% 35 30.77% 4
RueElementary 50 78.00% 39 50.00% 1 100.00% 2 100.00% 1 66.67% 2 62.50% 5 80.56% 29 72.41% 21 85.71% 18 57.14% 4 100.00% 9 76.47% 26 37.50% 3
Grade5
TotalNumberofStudents AllStudents Multiracial AmericanIndianor
AlaskaNativeAsianorPacific
Islander Black Hispanic White Male Female ELL Gifted Poverty IEP
n %Proficient n %Proficient n %Proficient n %Proficient n %Proficient n %Proficient n %Proficient n %Proficient n %Proficient n %Proficient n %Proficient n %Proficient n %Proficient n
CouncilBluffsSchoolDistrict 679 72.75% 494 60.00% 12 55.56% 5 88.89% 8 65.71% 23 56.12% 55 76.33% 403 74.79% 264 70.55% 230 53.62% 37 99.25% 133 66.03% 276 35.82% 48
BloomerElementary 67 77.61% 52 100.00% 2 0.00% 0 NA 100.00% 2 76.92% 10 78.43% 40 69.23% 27 89.29% 25 70.00% 7 100.00% 14 78.00% 39 46.15% 6
CarterLakeElementary 70 62.86% 44 0.00% 0.00% 0 NA 60.00% 3 50.00% 7 68.00% 34 65.71% 23 60.00% 21 58.33% 7 100.00% 6 57.45% 27 18.18% 2
CollegeViewElementary 71 77.46% 55 33.33% 1 NA NA 25.00% 1 100.00% 5 79.03% 49 72.22% 26 82.86% 29 100.00% 1 100.00% 21 53.33% 16 18.18% 2
CrescentElementary 24 83.33% 20 100.00% 1 NA 100.00% 1 NA NA 82.61% 19 69.23% 9 100.00% 11 NA 100.00% 3 92.31% 12 0.00% 0
EdisonElementary 71 63.38% 45 66.67% 2 NA 66.67% 2 80.00% 4 50.00% 7 65.31% 32 69.23% 27 56.25% 18 45.45% 5 100.00% 10 60.38% 32 41.18% 7
FranklinElementary 73 72.60% 53 100.00% 1 NA NA 66.67% 2 60.00% 9 76.36% 42 82.86% 29 63.16% 24 50.00% 3 100.00% 10 68.63% 35 33.33% 5
HooverElementary 78 84.62% 66 66.67% 2 100.00% 2 100.00% 1 71.43% 5 100.00% 2 84.85% 56 87.50% 35 81.58% 31 100.00% 2 94.44% 17 76.32% 29 65.22% 15
LewisandClarkElementary 33 78.79% 26 100.00% 2 NA NA 100.00% 1 33.33% 1 82.76% 24 77.78% 14 80.00% 12 50.00% 1 100.00% 8 66.67% 8 0.00% 0
LongfellowElementary 80 63.75% 51 100.00% 1 33.33% 1 100.00% 2 75.00% 3 42.86% 9 72.00% 36 68.57% 24 60.00% 27 35.29% 6 100.00% 17 55.10% 27 7.14% 1
RooseveltElementary 60 61.67% 37 0.00% 0 NA 100.00% 1 33.33% 1 28.57% 2 67.35% 33 64.52% 20 58.62% 17 50.00% 2 100.00% 14 50.00% 18 15.38% 2
RueElementary 52 86.54% 45 NA 100.00% 2 100.00% 1 100.00% 1 75.00% 3 86.36% 38 93.75% 30 75.00% 15 75.00% 3 100.00% 13 84.62% 33 66.67% 8

| Iowa Assessments Annual Report 25
SciencePerformancePercentProficientbySubGroup
Grade6
TotalNumberofStudents AllStudents Multiracial AmericanIndianor
AlaskaNativeAsianorPacific
Islander Black Hispanic White Male Female ELL Gifted Poverty IEP
n %Proficient n %Proficient n %Proficient n %Proficient n %Proficient n %Proficient n %Proficient n %Proficient n %Proficient n %Proficient n %Proficient n %Proficient n %Proficient n
CouncilBluffsSchoolDistrict 583 60.89% 355 50.00% 12 40.00% 2 100.00% 11 48.28% 14 41.76% 38 64.88% 290 60.41% 177 61.38% 178 46.15% 30 98.15% 106 54.62% 201 23.96% 23
KirnMiddleSchool 287 63.41% 182 50.00% 6 50.00% 2 100.00% 5 33.33% 4 40.00% 14 67.97% 157 62.04% 85 64.67% 97 40.91% 9 98.36% 60 56.29% 85 20.51% 8
WilsonMiddleSchool 296 58.45% 173 50.00% 6 0.00% 0 100.00% 6 58.82% 10 42.86% 24 61.57% 133 58.97% 92 57.86% 81 48.84% 21 97.87% 46 53.46% 116 26.32% 15
Grade7
TotalNumberofStudents AllStudents Multiracial AmericanIndianor
AlaskaNativeAsianorPacific
Islander Black Hispanic White Male Female ELL Gifted Poverty IEP
n %Proficient n %Proficient n %Proficient n %Proficient n %Proficient n %Proficient n %Proficient n %Proficient n %Proficient n %Proficient n %Proficient n %Proficient n %Proficient n
CouncilBluffsSchoolDistrict 640 71.56% 458 80.77% 21 64.29% 9 100.00% 10 50.00% 12 63.21% 67 74.07% 360 74.92% 236 68.31% 222 63.29% 50 100.00% 106 63.50% 261 28.16% 29
KirnMiddleSchool 341 79.18% 270 90.91% 10 75.00% 6 100.00% 3 90.00% 9 66.67% 30 80.73% 222 84.75% 150 73.17% 120 67.57% 25 100.00% 69 71.72% 142 33.33% 16
WilsonMiddleSchool 299 62.88% 188 73.33% 11 50.00% 3 100.00% 7 21.43% 3 60.66% 37 65.40% 138 62.32% 86 63.35% 102 59.52% 25 100.00% 37 55.87% 119 23.64% 13
Grade8
TotalNumberofStudents AllStudents Multiracial AmericanIndianor
AlaskaNativeAsianorPacific
Islander Black Hispanic White Male Female ELL Gifted Poverty IEP
n %Proficient n %Proficient n %Proficient n %Proficient n %Proficient n %Proficient n %Proficient n %Proficient n %Proficient n %Proficient n %Proficient n %Proficient n %Proficient n
CouncilBluffsSchoolDistrict 335 76.86% 485 59.26% 16 33.33% 1 63.64% 7 61.11% 22 71.91% 64 79.47% 391 78.21% 244 75.55% 241 67.80% 40 100.00% 101 72.77% 286 40.59% 41
KirnMiddleSchool 296 78.21% 262 61.54% 8 50.00% 1 66.67% 4 54.55% 6 67.44% 29 81.32% 222 80.50% 128 76.14% 134 59.38% 19 100.00% 56 72.38% 131 44.90% 22
WilsonMiddleSchool 631 75.34% 223 57.14% 8 0.00% 0 60.00% 3 64.00% 16 76.09% 35 77.17% 169 75.82% 116 74.83% 107 77.78% 21 100.00% 45 73.11% 155 36.54% 19
Grade9
TotalNumberofStudents AllStudents Multiracial AmericanIndianor
AlaskaNativeAsianorPacific
Islander Black Hispanic White Male Female ELL Gifted Poverty IEP
n %Proficient n %Proficient n %Proficient n %Proficient n %Proficient n %Proficient n %Proficient n %Proficient n %Proficient n %Proficient n %Proficient n %Proficient n %Proficient n
CouncilBluffsSchoolDistrict 523 75.53% 395 61.11% 11 61.11% 11 75.00% 3 77.27% 17 67.57% 50 76.79% 321 71.26% 186 79.77% 209 67.39% 31 96.99% 129 71.71% 218 45.68% 37
AbrahamLincolnHighSchool 275 77.09% 212 62.50% 5 62.50% 5 75.00% 3 90.00% 9 75.00% 21 76.42% 175 76.52% 101 77.62% 111 77.78% 14 100.00% 78 70.86% 107 45.65% 21
ThomasJeffersonHighSchool 248 73.79% 183 60.00% 6 60.00% 6 NA 66.67% 8 63.04% 29 77.25% 146 65.89% 85 82.35% 98 60.71% 17 92.73% 51 72.55% 111 45.71% 16
| Iowa Assessments Annual Report 26
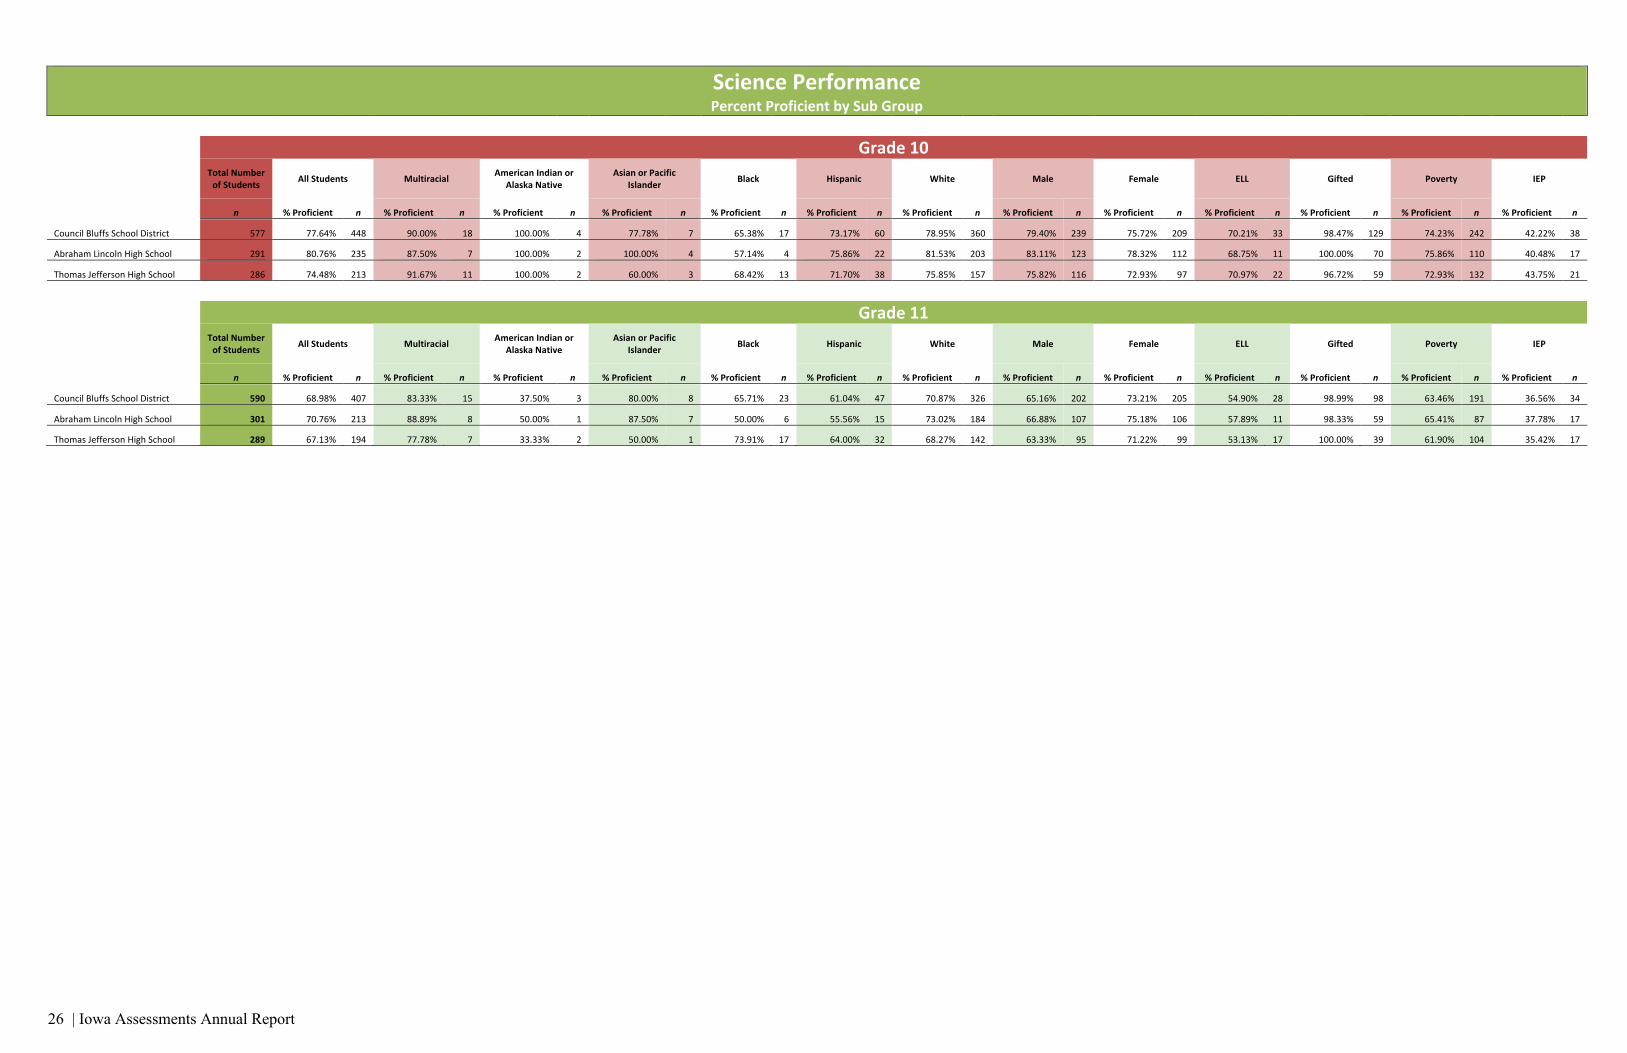
SciencePerformancePercentProficientbySubGroup
Grade10
TotalNumberofStudents AllStudents Multiracial AmericanIndianor
AlaskaNativeAsianorPacific
Islander Black Hispanic White Male Female ELL Gifted Poverty IEP
n %Proficient n %Proficient n %Proficient n %Proficient n %Proficient n %Proficient n %Proficient n %Proficient n %Proficient n %Proficient n %Proficient n %Proficient n %Proficient n
CouncilBluffsSchoolDistrict 577 77.64% 448 90.00% 18 100.00% 4 77.78% 7 65.38% 17 73.17% 60 78.95% 360 79.40% 239 75.72% 209 70.21% 33 98.47% 129 74.23% 242 42.22% 38
AbrahamLincolnHighSchool 291 80.76% 235 87.50% 7 100.00% 2 100.00% 4 57.14% 4 75.86% 22 81.53% 203 83.11% 123 78.32% 112 68.75% 11 100.00% 70 75.86% 110 40.48% 17
ThomasJeffersonHighSchool 286 74.48% 213 91.67% 11 100.00% 2 60.00% 3 68.42% 13 71.70% 38 75.85% 157 75.82% 116 72.93% 97 70.97% 22 96.72% 59 72.93% 132 43.75% 21
Grade11
TotalNumberofStudents AllStudents Multiracial AmericanIndianor
AlaskaNativeAsianorPacific
Islander Black Hispanic White Male Female ELL Gifted Poverty IEP
n %Proficient n %Proficient n %Proficient n %Proficient n %Proficient n %Proficient n %Proficient n %Proficient n %Proficient n %Proficient n %Proficient n %Proficient n %Proficient n
CouncilBluffsSchoolDistrict 590 68.98% 407 83.33% 15 37.50% 3 80.00% 8 65.71% 23 61.04% 47 70.87% 326 65.16% 202 73.21% 205 54.90% 28 98.99% 98 63.46% 191 36.56% 34
AbrahamLincolnHighSchool 301 70.76% 213 88.89% 8 50.00% 1 87.50% 7 50.00% 6 55.56% 15 73.02% 184 66.88% 107 75.18% 106 57.89% 11 98.33% 59 65.41% 87 37.78% 17
ThomasJeffersonHighSchool 289 67.13% 194 77.78% 7 33.33% 2 50.00% 1 73.91% 17 64.00% 32 68.27% 142 63.33% 95 71.22% 99 53.13% 17 100.00% 39 61.90% 104 35.42% 17

| Iowa Assessments Annual Report 27
SciencePerformanceAverageNationalPercentileRank(NPR)byGradeLevel
ThefollowingchartdisplaystheaverageNationalPercentileRank(NPR)bygradelevelforthelastthreeyearsinscienceduetoachangefromwinternormstospringnormsin2013-14.Thiscomparestheaverageofallstudentscoresinagradelevelwithothersinthenationinthesamegradewhotookthetestatthesametimeofyear.TheNPRisbasedonascaleof1to99,soifantheaverageNPRof9thgradewas65,thatmeansthestudentsinthat9thgradedidaswellorbetterthan65percentofother9thgradersinthenationtakingthetestatthesametime.
Gradelevelyear-to-yeartrendsaresomewhatinconsistentinscience.ThisisgenerallyattributedtonewlydevelopedcurriculummorecloselyalignedwiththeNextGenerationScienceStandardsinvariousstagesofimplementationoverthepastthreeyears.

| Iowa Assessments Annual Report 28
SciencePerformanceAverageNationalPercentileRank(NPR)byCohort
ThefollowingchartdisplaystheaverageNationalPercentileRank(NPR)bycohortforthelastthreeyearsinscienceduetoachangefromwinternormstospringnormsin2013-14.Scoresrepresentlikegroupsofstudents’progressovertime.
Gradelevelyear-to-yeartrendsaresomewhatinconsistentinscience.ThisisgenerallyattributedtonewlydevelopedcurriculummorecloselyalignedwiththeNextGenerationScienceStandardsinvariousstagesofimplementationoverthepastthreeyears.