Embed Size (px)
Citation preview
This document helps educators and parents understand the information provided in reports from the Iowa Assessments. Three different sample reports are included here.
1. Individual Profile Narrative
2. Individual Performance Profile
3. Individual Reading Performance Summary
Descriptions of the purpose and use for these reports, and the key elements of these reports, are provided.
Interpreting Reports from the Iowa Assessments™
Individual Profile Narrative
1 2
3
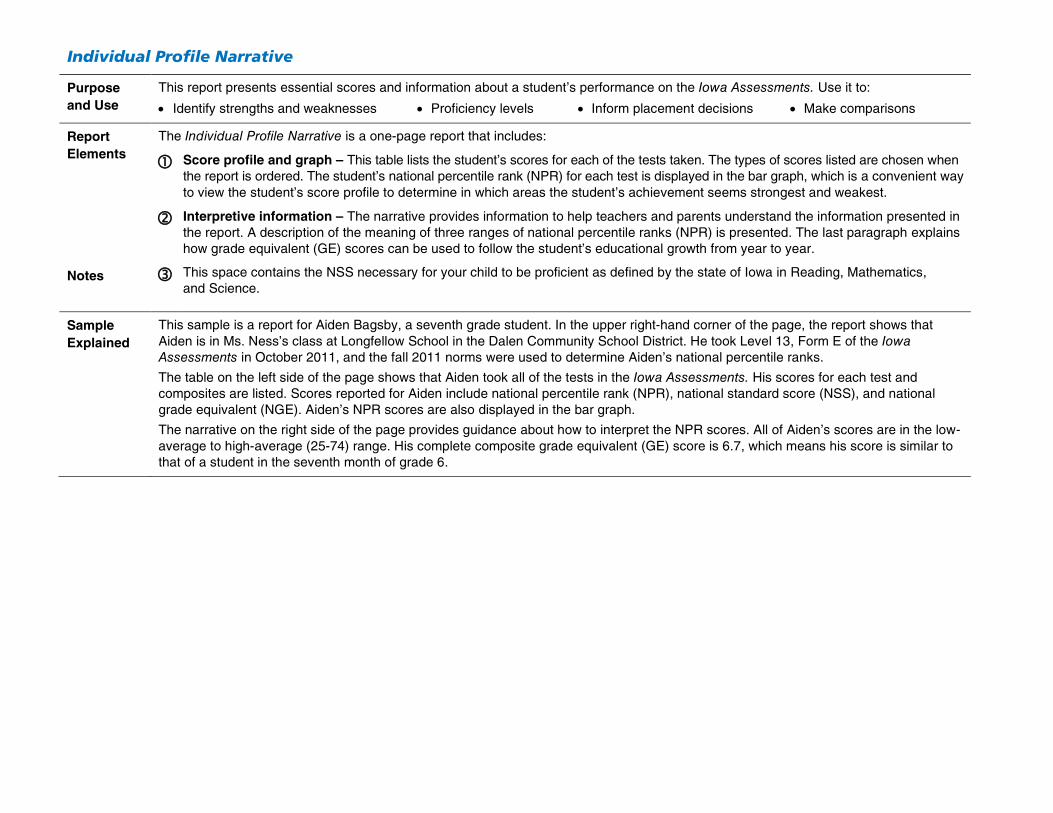
Individual Profile Narrative
Purpose and Use
This report presents essential scores and information about a student’s performance on the Iowa Assessments. Use it to:
• Identify strengths and weaknesses • Proficiency levels • Inform placement decisions • Make comparisons
Report Elements Notes
The Individual Profile Narrative is a one-page report that includes:
Score profile and graph – This table lists the student’s scores for each of the tests taken. The types of scores listed are chosen when the report is ordered. The student’s national percentile rank (NPR) for each test is displayed in the bar graph, which is a convenient way to view the student’s score profile to determine in which areas the student’s achievement seems strongest and weakest.
Interpretive information – The narrative provides information to help teachers and parents understand the information presented in the report. A description of the meaning of three ranges of national percentile ranks (NPR) is presented. The last paragraph explains how grade equivalent (GE) scores can be used to follow the student’s educational growth from year to year.
This space contains the NSS necessary for your child to be proficient as defined by the state of Iowa in Reading, Mathematics, and Science.
Sample Explained
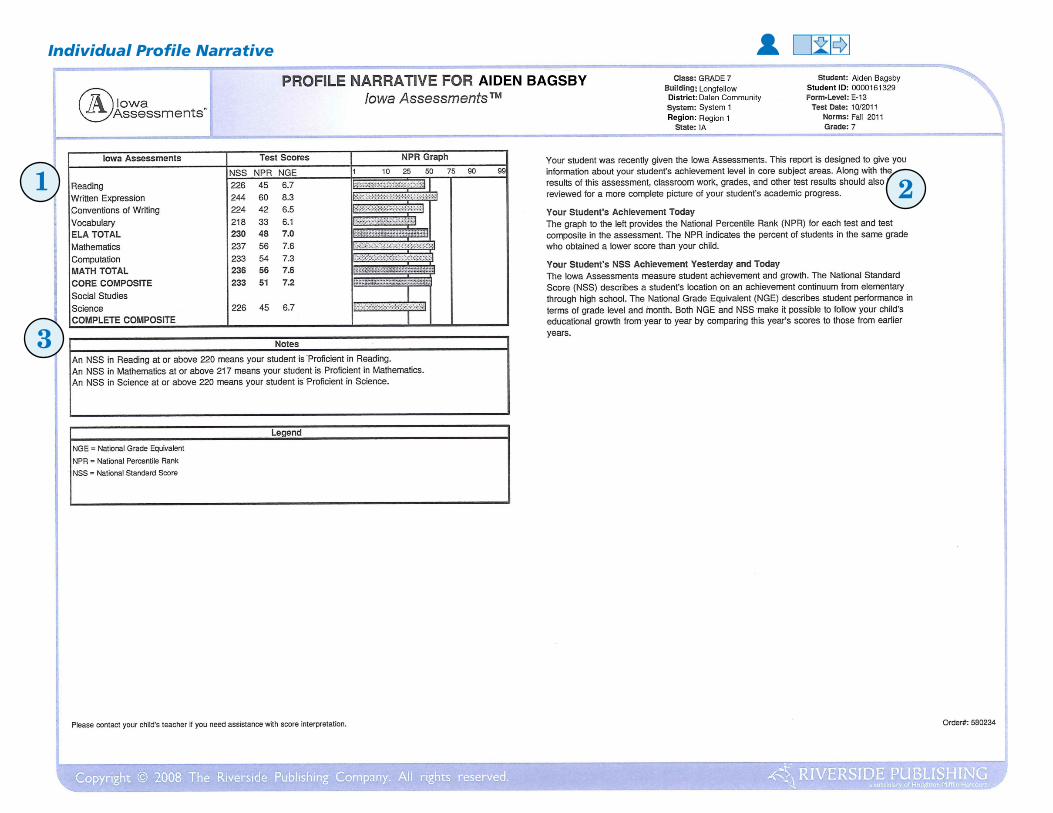
This sample is a report for Aiden Bagsby, a seventh grade student. In the upper right-hand corner of the page, the report shows that Aiden is in Ms. Ness’s class at Longfellow School in the Dalen Community School District. He took Level 13, Form E of the Iowa Assessments in October 2011, and the fall 2011 norms were used to determine Aiden’s national percentile ranks.
The table on the left side of the page shows that Aiden took all of the tests in the Iowa Assessments. His scores for each test and composites are listed. Scores reported for Aiden include national percentile rank (NPR), national standard score (NSS), and national grade equivalent (NGE). Aiden’s NPR scores are also displayed in the bar graph.
The narrative on the right side of the page provides guidance about how to interpret the NPR scores. All of Aiden’s scores are in the low-average to high-average (25-74) range. His complete composite grade equivalent (GE) score is 6.7, which means his score is similar to that of a student in the seventh month of grade 6.
Individual Performance Profile
3
4
1 2
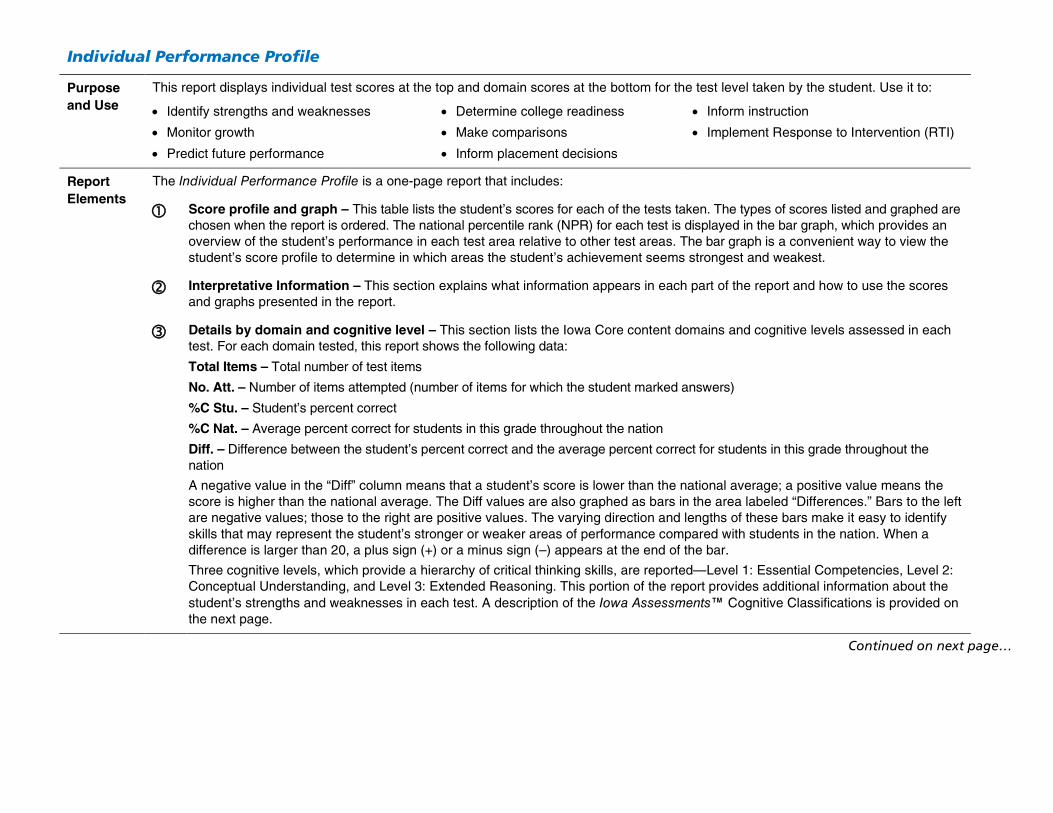
Individual Performance Profile
Purpose and Use
This report displays individual test scores at the top and domain scores at the bottom for the test level taken by the student. Use it to:
• Identify strengths and weaknesses
• Monitor growth
• Predict future performance
• Determine college readiness
• Make comparisons
• Inform placement decisions
• Inform instruction
• Implement Response to Intervention (RTI)
Report Elements
The Individual Performance Profile is a one-page report that includes:
Score profile and graph – This table lists the student’s scores for each of the tests taken. The types of scores listed and graphed are chosen when the report is ordered. The national percentile rank (NPR) for each test is displayed in the bar graph, which provides an overview of the student’s performance in each test area relative to other test areas. The bar graph is a convenient way to view the student’s score profile to determine in which areas the student’s achievement seems strongest and weakest.
Interpretative Information – This section explains what information appears in each part of the report and how to use the scores and graphs presented in the report.
Details by domain and cognitive level – This section lists the Iowa Core content domains and cognitive levels assessed in each test. For each domain tested, this report shows the following data:
Total Items – Total number of test items
No. Att. – Number of items attempted (number of items for which the student marked answers)
%C Stu. – Student’s percent correct
%C Nat. – Average percent correct for students in this grade throughout the nation
Diff. – Difference between the student’s percent correct and the average percent correct for students in this grade throughout the nation
A negative value in the “Diff” column means that a student’s score is lower than the national average; a positive value means the score is higher than the national average. The Diff values are also graphed as bars in the area labeled “Differences.” Bars to the left are negative values; those to the right are positive values. The varying direction and lengths of these bars make it easy to identify skills that may represent the student’s stronger or weaker areas of performance compared with students in the nation. When a difference is larger than 20, a plus sign (+) or a minus sign (–) appears at the end of the bar.
Three cognitive levels, which provide a hierarchy of critical thinking skills, are reported—Level 1: Essential Competencies, Level 2: Conceptual Understanding, and Level 3: Extended Reasoning. This portion of the report provides additional information about the student’s strengths and weaknesses in each test. A description of the Iowa Assessments™ Cognitive Classifications is provided on the next page.
Continued on next page…
Individual Performance Profile, continued
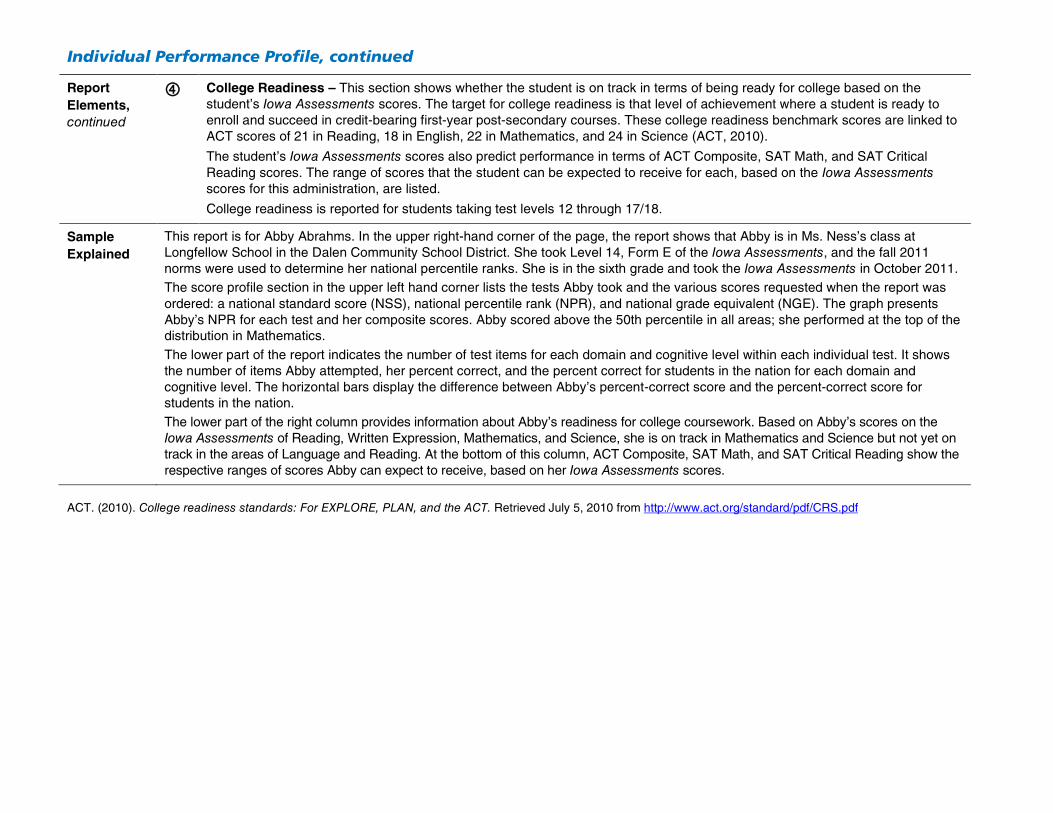
Report Elements, continued
College Readiness – This section shows whether the student is on track in terms of being ready for college based on the student’s Iowa Assessments scores. The target for college readiness is that level of achievement where a student is ready to enroll and succeed in credit-bearing first-year post-secondary courses. These college readiness benchmark scores are linked to ACT scores of 21 in Reading, 18 in English, 22 in Mathematics, and 24 in Science (ACT, 2010).
The student’s Iowa Assessments scores also predict performance in terms of ACT Composite, SAT Math, and SAT Critical Reading scores. The range of scores that the student can be expected to receive for each, based on the Iowa Assessments scores for this administration, are listed.
College readiness is reported for students taking test levels 12 through 17/18.
Sample Explained
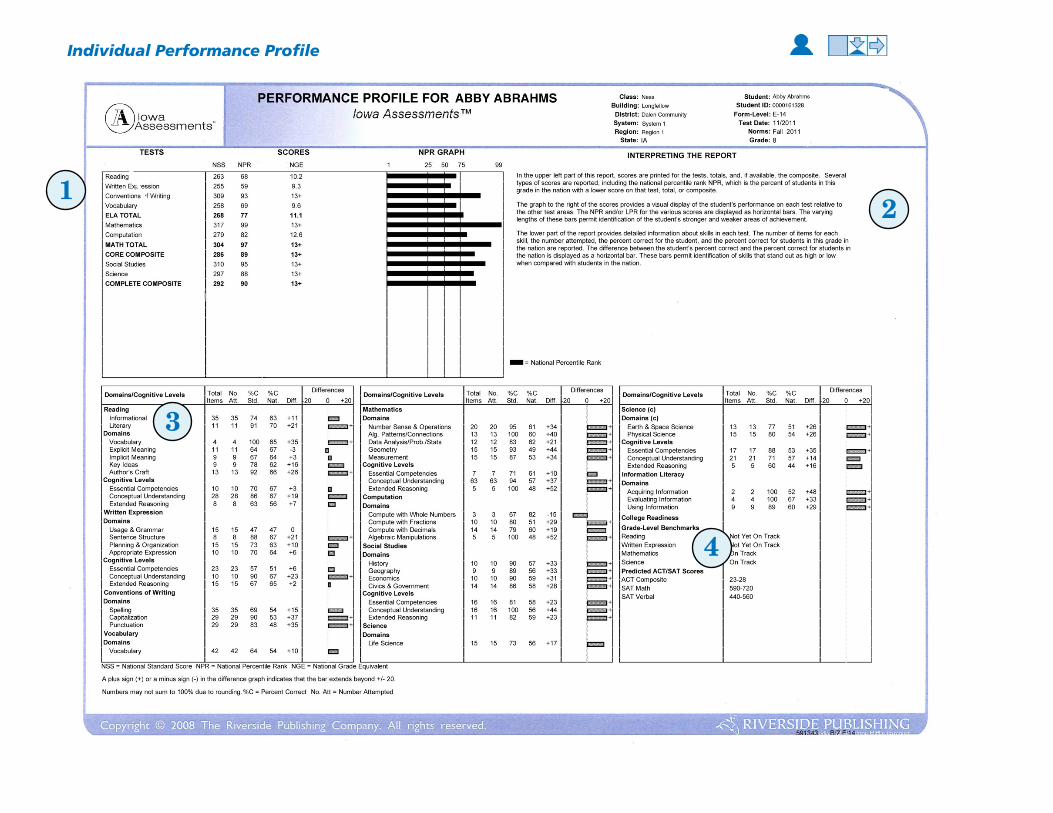
This report is for Abby Abrahms. In the upper right-hand corner of the page, the report shows that Abby is in Ms. Ness’s class at Longfellow School in the Dalen Community School District. She took Level 14, Form E of the Iowa Assessments, and the fall 2011 norms were used to determine her national percentile ranks. She is in the sixth grade and took the Iowa Assessments in October 2011. The score profile section in the upper left hand corner lists the tests Abby took and the various scores requested when the report was ordered: a national standard score (NSS), national percentile rank (NPR), and national grade equivalent (NGE). The graph presents Abby’s NPR for each test and her composite scores. Abby scored above the 50th percentile in all areas; she performed at the top of the distribution in Mathematics. The lower part of the report indicates the number of test items for each domain and cognitive level within each individual test. It shows the number of items Abby attempted, her percent correct, and the percent correct for students in the nation for each domain and cognitive level. The horizontal bars display the difference between Abby’s percent-correct score and the percent-correct score for students in the nation. The lower part of the right column provides information about Abby’s readiness for college coursework. Based on Abby’s scores on the Iowa Assessments of Reading, Written Expression, Mathematics, and Science, she is on track in Mathematics and Science but not yet on track in the areas of Language and Reading. At the bottom of this column, ACT Composite, SAT Math, and SAT Critical Reading show the respective ranges of scores Abby can expect to receive, based on her Iowa Assessments scores.
ACT. (2010). College readiness standards: For EXPLORE, PLAN, and the ACT. Retrieved July 5, 2010 from http://www.act.org/standard/pdf/CRS.pdf
Individual Reading Performance Summary
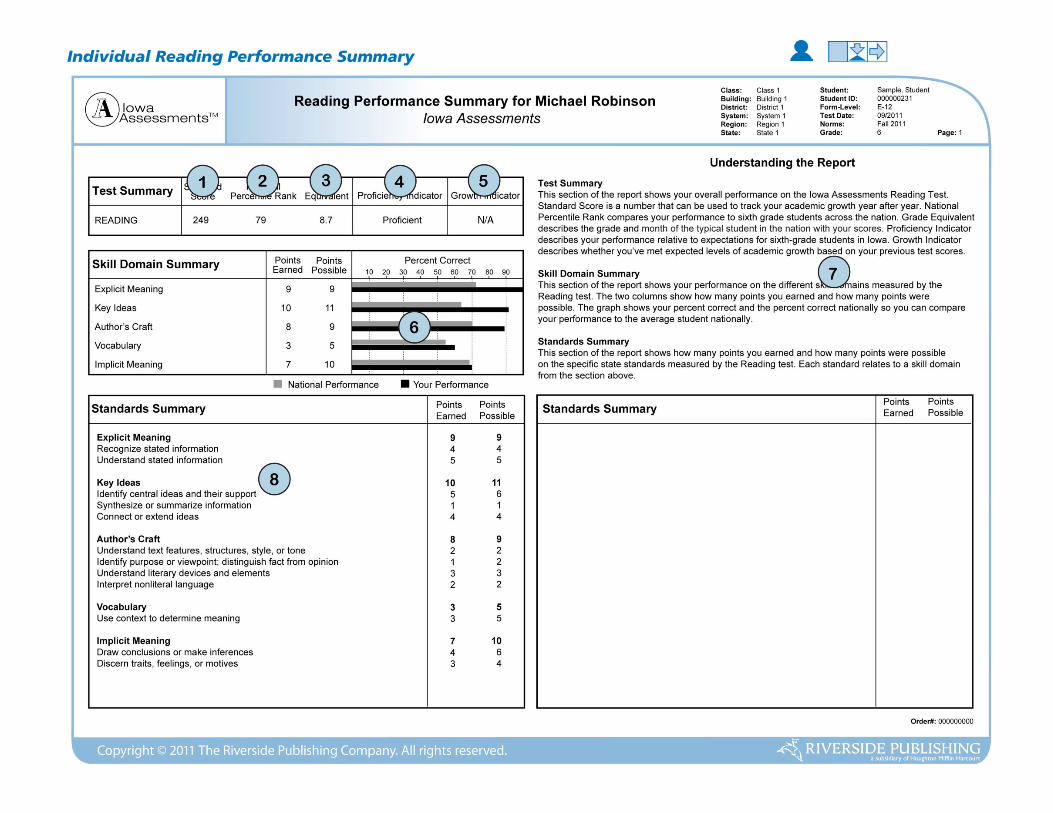
Individual Reading Performance Summary
Purpose and Use
This report displays test scores in reading. Use it to:
• Inform instruction
• Identify proficiency levels
• Identify strengths and weaknesses within reading
• Monitor growth across years
• Measure the Iowa Core
Report Elements
The Individual Reading Performance Summary is a one-page report that includes:
to Student Scores – This table lists the student’s scores (NPR, NSS, and NGE).
Proficiency Indicator – This section identifies whether the student’s performance in reading is not proficient, proficient, or advanced as defined by the state of Iowa.
Growth Indicator – This section identifies whether the student’s performance between two subsequent years of testing achieved expected growth, fell short of expected growth, or exceeded expected growth. (Available beginning 2012 – 2013 academic year.)
Domain Profile and Graph – This section lists the performance of the student within domains that are key elements of the Iowa Core. The number of questions answered correctly by the student and the total number of questions asked of the student are presented. The graph represents the student’s performance compared to national performance on these questions.
Interpretive Information – This section explains what information appears in each part of the report and how to use the scores and graphs presented on the report.
Standards Summary – This section provides details by content domains from the Iowa Core that are measured by the Iowa Assessments™ and the standards within each domain. The number of questions answered correctly by the student and the total number of questions asked of the student are presented.