Embed Size (px)
Citation preview

Pla
nA
dm
iniste
rIm
ple
men
tFin
alize
Inte
rpre
tA
DO
PT
AssessmentsIowa
TM
Research and D
evelopment G
uide
Research and Development Guide
FORMS E and F
FOR
MS E an
d F

Prepared at The University of Iowaunder the direction of
Stephen Dunbar and Catherine Welchwith contributions from
H. D. Hoover, Robert A. Forsyth, David A. Frisbie and Timothy N. Ansley
Acknowledgments
PhotographsCover: Photograph titled Earth. Copyright © Stocktrek/Getty Images. (ST000517)
TrademarksSAT® is a registered trademark of the College Board, which was not involved in the production of, and does not endorse, this product.
ACT® is a trademark of ACT, Inc., and is registered in the United States and abroad. ACT, Inc., was not involved in the production of, and does not endorse, this product.
Copyright © 2015 by The University of Iowa. All rights reserved. No part of this work may be reproduced or transmitted in any form or by any means, electronic or mechanical, including photocopying and recording, or by any information storage or retrieval system without the prior written permission of The Riverside Publishing Company unless such copying is expressly permitted by federal copyright law. Requests for permission to make copies of any part of the work should be addressed to Houghton Miffl in Harcourt Publishing Company, 9400 Southpark Center Loop, Orlando, FL 32819-8647; https://customercare.hmhco.com/permission/Permissions.html.
These tests contain questions that are to be used solely for testing purposes. No test items may be disclosed or used for any other reason. By accepting delivery of or using these tests, the recipient acknowledges responsibility for maintaining test security that is required by professional standards and applicable state and local policies and regulations governing proper use of tests and for complying with federal copyright law which prohibits unauthorized reproduction and use of copyrighted test materials.

v1 Contents i
Contents
Part 1 Introduction ................................................................... 1
About This Guide................................................................................................. 1 Purpose ............................................................................................................ 1 How to Use This Guide ..................................................................................... 1
Getting More Help .............................................................................................. 1
Part 2 Nature and Purpose of the Iowa Assessments ................ 3
In Brief ................................................................................................................ 3 About the Iowa Assessments ............................................................................... 3 Major Purposes of the Iowa Assessments ............................................................. 3 Validity of the Tests ............................................................................................ 4 Description of the Iowa Assessments ................................................................... 5
Name of the Tests............................................................................................. 5 Description of the Tests .................................................................................... 5 Grade Levels and Test Levels ............................................................................ 6 Test Lengths and Times .................................................................................... 6
Level 5/6 ........................................................................................................ 6 Levels 7 and 8 Complete and Core Tests ........................................................ 7 Levels 7 and 8 Survey Tests ............................................................................ 7 Levels 9–14 Complete and Core Tests............................................................. 7 Level 9 Optional Word Analysis and Listening Tests ...................................... 8 Levels 9–14 Survey Tests ................................................................................ 8 Levels 15–17/18.............................................................................................. 9
Nature of the Questions ................................................................................... 9 Mode of Responding ........................................................................................ 9 Directions for Administration ......................................................................... 10 Online Test Administration............................................................................. 10
Part 3 National Comparison Study .......................................... 11
In Brief .............................................................................................................. 11 Development of National Comparative Information .......................................... 11
Procedures for Selecting the Fall National Comparison Sample ...................... 12 Public School Sample ................................................................................... 12 Catholic School Sample................................................................................ 12 Private (Non-Catholic) School Sample .......................................................... 13
Design for Data Collection ............................................................................. 13 Weighting the Samples .................................................................................. 13

ii Iowa Assessments Research and Development Guide
Fall 2010 National Comparison Study ................................................................ 13 Participation of Students in Special Groups .................................................... 16 Racial-Ethnic Representation .......................................................................... 18
Spring 2011 National Comparison Study ............................................................ 19
Part 4 Validity ......................................................................... 21
In Brief .............................................................................................................. 21 Criteria for Evaluating Assessments ................................................................... 21 Validity of the Assessments ............................................................................... 22 Statistical Data to Be Considered ....................................................................... 23 Validity of the Tests in the Local School ............................................................ 23 Domain Specifications ....................................................................................... 24 Content Fidelity and Test Development Procedures ........................................... 24
Test Specifications .......................................................................................... 25 Item Writing ................................................................................................... 25 Internal Review Stage One ............................................................................. 26 External Review .............................................................................................. 26 Internal Review Stage Two ............................................................................. 26 Item Tryout .................................................................................................... 26 Data Review ................................................................................................... 26 Operational Forms Construction ..................................................................... 26 Forms Review ................................................................................................. 27
Test Descriptions ............................................................................................... 27 Level 5/6 ......................................................................................................... 27 Levels 7 and 8 ................................................................................................. 28 Levels 9–14 ..................................................................................................... 30 Levels 15–17/18............................................................................................... 31
Distribution of Domains and Skills for the Iowa Assessments ............................ 32 Cognitive Level Difficulty Descriptors ................................................................ 33 Internal Structure of the Iowa Assessments ....................................................... 33 Predictive Validity and College Readiness .......................................................... 35
Tracking Readiness for Postsecondary Education ............................................ 36 Interpretation and Utility of Readiness Information ....................................... 37
Validity in the Assessment of Growth ................................................................ 38 Description and Primary Interpretation of the NSS Scale ................................ 39 Validity Framework and Statistical Foundation of Growth Metrics ................. 39
Validity ........................................................................................................ 39 Statistical Foundation .................................................................................. 41 Growth Metrics............................................................................................ 42
Data Requirements and Properties of Measures ............................................. 43 Relationship to Other Growth Models ............................................................ 44
Concurrent Validity ........................................................................................... 45 Form E/CogAT Correlations ............................................................................. 45

Contents iii
Iowa Assessments Form E and ITBS/ITED Form A Correlations ......................... 46 Other Validity Considerations ............................................................................ 47
Universal Design ............................................................................................. 47 Color Blindness ............................................................................................... 48 Text Complexity and Readability .................................................................... 48 Use of Assessments to Evaluate Instruction .................................................... 50
Part 5 Scaling, Norms, and Equating ....................................... 53
In Brief .............................................................................................................. 53 Comparability of Developmental Scores across Levels ........................................ 53
Origin and Evolution of the Iowa Growth Scale .............................................. 54 The Iowa Growth Model .................................................................................... 55
Grade-to-Grade Overlap in Student Achievement ........................................... 56 National Trends in Achievement Test Performance ............................................ 59 Norms for Special School Populations ................................................................ 63 Comparability of Forms ..................................................................................... 64 Relationships of Form E and Form F to Previous Forms of the ITBS and ITED ..... 65
Evolution and Change in Test Content and Organization ............................... 65 Assessments in the Primary Grades ................................................................. 66 Assessments in the High School Grades .......................................................... 67
Part 6 Reliability ..................................................................... 69
In Brief .............................................................................................................. 69 Methods of Determining, Reporting, and Using Reliability Data ....................... 69 Sources of Variation in Measurement ................................................................ 90 Conditional Standard Errors of Measurement for Selected Score Levels ............ 92
Part 7 Item and Test Analysis ................................................. 105
In Brief .............................................................................................................105 Difficulty of the Assessments ............................................................................105 Item Discrimination ..........................................................................................129 Ceiling and Floor Effects ..................................................................................129 Completion Rates .............................................................................................142
Part 8 Group Differences in Item and Test Performance ........ 149
In Brief .............................................................................................................149 Standard Errors of Measurement for Groups ....................................................149 Review Procedures to Ensure Test Fairness .......................................................153
Differential Item Functioning (DIF) ................................................................153 Conclusion .....................................................................................................154
Works Cited ................................................................................ 157
Index .......................................................................................... 163


Introduction 1
Part 1 Introduction
About This Guide Purpose
This Research and Development Guide summarizes the development and analysis of research data for the Iowa Assessments™ Form E and Form F. It also details test-construction procedures, including selecting and weighting samples, collecting national comparative data, establishing national norms, and gathering validity evidence for the new tests.
How to Use This Guide
This guide supports the Adopt phase of the assessment life cycle.
Understand your options and make informed decisions
Get organized and prepare for testing
Administer the tests according to the directions
Prepare answer documents for scoring
Analyze test results and communicate with students, parents, and staff
Getting More Help If you need help beyond the information provided in this guide, please make use of the following resources:
• Your HMH—Riverside Assessment Consultant
• HMH—Riverside Customer Service E-mail: [email protected] TEL: 1-800-323-9540

2 Iowa Assessments Research and Development Guide

Nature and Purpose of the Iowa Assessments 3
Part 2 Nature and Purpose of the Iowa Assessments
In Brief The Iowa Assessments are large-scale achievement tests that assess students’ skills in Reading, Language, Mathematics, Social Studies, and Science. The tests assess both foundation skills and higher-order thinking skills.
Testing with the Iowa Assessments can provide information that can be used to improve instruction and student learning. Teachers can use test results to inform parents of an individual student’s progress and to evaluate the progress of an entire class. Educators can monitor student growth by comparing results from multiple test administrations to determine whether individuals and groups are progressing as planned. Achievement tests also help identify students’ strengths and weaknesses in different content areas by serving as a supplement to teacher observations and other classroom assessments. Identification of weaknesses can help explain students’ learning difficulties in related areas and provide a basis for improving instruction and identifying strengths, which can serve as a foundation on which students can build additional skills and can also guide instruction.
This part of the guide presents an overview of the Iowa Assessments, including discussing the purposes of testing and the validity of the tests and providing a description of the tests.
About the Iowa Assessments The Iowa Assessments are developed by the faculty and professional staff at Iowa Testing Programs (ITP) at The University of Iowa. The Levels 5/6–14 assessments measure educational achievement in six to twelve subject areas (depending on level) for students in kindergarten through grade 8. The Levels 15–17/18 assessments measure educational achievement in seven subject areas for students in grades 9–12. These assessments share a history of development that has been an integral part of the research program in educational measurement at The University of Iowa for the past 85 years.
Major Purposes of the Iowa Assessments The Iowa Assessments have been designed, developed, and researched to support a variety of important educational purposes that involve the collection and use of information describing either an individual student or groups of students. The following examples of appropriate uses of results from the Iowa Assessments support a broad range of educational decisions
• To identify strengths and weaknesses in student performance – Make relative comparisons of student performance from one content area to another.
• To inform instruction – Make judgments about past and future instructional strategies.
• To monitor growth – Describe change in student performance over time.
Nature and Purpose of the Iowa Assessments Part 2

4 Iowa Assessments Research and Development Guide
• To measure performance in terms of core standards – Determine the degree to which students have acquired the essential skills and concepts of core standards.
• To implement Response to Intervention (RTI) – Identify students at risk for poor learning outcomes who may benefit from intensive, systematic learning interventions.
• To inform placement decisions – Place students into programs; assign students to different levels of a learning program.
• To make comparisons – Compare student performance with that of local, state, and national groups.
• To evaluate programs – Provide information that can be used to evaluate the effectiveness of curricular changes.
• To predict future performance – Use current information to predict future student performance.
• To support accountability – Provide reliable and valid information that can be used to meet district and state reporting requirements.
Validity of the Tests The most valid assessment of achievement for a particular school is one that most closely defines that school’s education standards and goals for teaching and learning. Ideally, the skills and abilities required for success in the assessment should be the same skills and abilities developed through local instruction.
The assessment framework for the Iowa Assessments is an extension of the educational purposes the tests are intended to support. The framework describes the full scope of the test content and relies on a variety of resources for the purpose of content validity, including:
• State, professional, and international standards
• Curriculum surveys
• National Assessment of Educational Progress (NAEP) frameworks and test specifications
• Scholarly research
• Feedback from educators, students, and parents
• Assessment data
A comprehensive and iterative process based on the content of the framework guides the item design and development, extensive review process, tryout and field test administrations, and final forms assembly of the Iowa Assessments. These aspects of research and development are detailed throughout this document.

Nature and Purpose of the Iowa Assessments 5
Description of the Iowa Assessments Name of the Tests
Iowa Assessments Form E and Form F, Levels 5/6–17/18.
Description of the Tests
The Iowa Assessments can be administered either as a Complete, Core, or Survey configuration.
• Complete consists of the entire collection of tests and measures a broad range of skills.
• Core consists of the same tests as Complete except for the Science and Social Studies tests.
• Survey consists of a subset of questions from the Reading, Language/Written Expression, and Mathematics tests.
The table below shows the tests in each assessment configuration by level.
Level Grade Assessment Configuration
Complete (Core in Bold) Survey
Level 5/6 K Vocabulary
Word Analysis
Listening
Language
Mathematics
Reading (2 parts)
(Survey not available for Level 5/6)
(Core not available for Level 5/6)
Levels 7 and 8 1–2 Vocabulary
Word Analysis
Reading (2 parts)
Listening
Language
Mathematics (2 parts)
Computation
Social Studies
Science
Reading
Language
Mathematics
Levels 9–14 3–8 Reading (2 parts)
Written Expression
Mathematics (2 parts)
Vocabulary
Spelling
Capitalization
Punctuation
Computation
Science
Social Studies
Word Analysis (Level 9 only)
Listening (Level 9 only)
Reading
Written Expression
Mathematics
Levels 15–17/18 9–12 Reading
Written Expression
Mathematics
Vocabulary
Computation
Science
Social Studies
(Survey not available for Levels 15–17/18)

6 Iowa Assessments Research and Development Guide
Grade Levels and Test Levels
Levels 5/6–17/18 represent a comprehensive K–12 assessment program. Test levels are numbered to correspond roughly to the chronological ages of the students for whom they are best suited. The table below shows how test levels relate to grade levels.
Grade
Test Level
Fall Midyear Spring
K — 5/6 5/6
1 5/6 5/6–7 7
2 7–8 8 8
3 8–9 9 9
4 10 10 10
5 11 11 11
6 12 12 12
7 13 13 13
8 14 14 14
9 14–15 14–15 14–15
10 16 16 16
11 17/18 17/18 17/18
12 17/18 17/18 17/18
Test Lengths and Times
The tables below and on the following pages show the recommended testing times and number of questions for each test by level and configuration.
Level 5/6
Core and Survey are not available for Level 5/6.
Test Approximate Time*
(min) Number of Questions
Vocabulary 20 27
Word Analysis 20 33
Listening 30 27
Language 25 31
Mathematics 25 35
Reading (Parts 1 and 2) 40 34
TOTALS 2 hr 40 min 187
* All tests except Reading (Part 2) are read aloud by the test administrator.

Nature and Purpose of the Iowa Assessments 7
Levels 7 and 8 Complete and Core Tests
The names of the Core tests are shown in bold type.
Test (Core tests in bold)
Approximate Time* (min)
Number of Questions
Level 7 Level 8
Vocabulary 15 26 26
Word Analysis 15 32 33
Reading (Parts 1 and 2) 45 35 38
Listening 25 27 27
Language 25 34 42
Mathematics (Parts 1 and 2) 50 41 46
Computation 25 25 27
Social Studies 25 29 29
Science 25 29 29
TOTALS — Complete 4 hr 10 min 278 297
TOTALS — Core 3 hr 20 min 220 239
* All tests except Vocabulary and Reading are read aloud by the test administrator.
Levels 7 and 8 Survey Tests
Test Approximate Time* (min)
Number of Questions
Level 7 Level 8
Reading 35 28 30
Language 25 34 42
Mathematics 35 29 32
TOTALS 95 min 91 104
* All tests except Reading are read aloud by the test administrator.
Levels 9–14 Complete and Core Tests
The names of the Core tests are shown in bold type.
Test Time (min) Number of Questions
Level 9 Level 10 Level 11 Level 12 Level 13 Level 14
Reading (Parts 1 and 2) 60 41 42 43 44 45 46
Written Expression 40 35 38 40 43 45 48
Mathematics (Parts 1 and 2) 60 50 55 60 65 70 75
Science 35 30 34 37 39 41 43
Continued on next page…

8 Iowa Assessments Research and Development Guide
Levels 9–14 Complete and Core Tests, continued
Test Time (min) Number of Questions
Level 9 Level 10 Level 11 Level 12 Level 13 Level 14
Social Studies 35 30 34 37 39 41 43
Vocabulary 15 29 34 37 39 41 42
Spelling 10 24 27 30 32 34 35
Capitalization 10 20 22 24 25 27 29
Punctuation 10 20 22 24 25 27 29
Computation 20 25 27 29 30 31 32
TOTALS — Complete 4 hr
55 min 304 335 361 381 402 422
TOTALS — Core 3 hr
45 min 244 267 287 303 320 336
Level 9 Optional Word Analysis and Listening Tests
Test Approximate Time (min)
Number of Questions
Word Analysis* 20 33
Listening* 25 28
TOTALS — Complete with Optional Tests
5 hr 40 min
365
TOTALS — Core with Optional Tests
4 hr 30 min
305
* This test is read aloud by the test administrator. The time given is approximate.
Levels 9–14 Survey Tests
Test Time (min)
Number of Questions
Level 9 Level 10 Level 11 Level 12 Level 13 Level 14
Reading 30 21 21 22 22 23 23
Written Expression 40 35 38 40 43 45 48
Mathematics 30 26 29 31 34 36 39
TOTALS 1 hr 40 min
82 88 93 99 104 110

Nature and Purpose of the Iowa Assessments 9
Levels 15–17/18
The names of the Core tests are shown in bold type.
Test (Core tests in bold)
Time (min)
Number of Questions
Level 15 Level 16 Level 17/18
Reading 40 40 40 40
Written Expression 40 54 54 54
Mathematics 40 40 40 40
Science 40 48 48 48
Social Studies 40 50 50 50
Vocabulary 15 40 40 40
Computation 20 30 30 30
TOTALS — Complete 3 hr
55 min 302 302 302
TOTALS — Core 2 hr
35 min 204 204 204
Nature of the Questions
All questions in the Iowa Assessments are in multiple-choice format. At Levels 5/6, 7, and 8, response choices are presented in pictures, letters, numerals, or words, depending on the test and level. Questions at these levels are read aloud except for the following:
• most of the Reading test at Level 5/6
• all of the Reading test at Levels 7 and 8
• all of the Vocabulary test at Levels 7 and 8
• parts of the Computation test at Levels 7 and 8
• parts of the Science and Social Studies tests at Level 8
In addition, parts of the Word Analysis and Listening tests at Level 9 are read aloud.
Mode of Responding
Students mark their answers in one of these types of answer documents:
• At Levels 5/6, 7, and 8, students mark their responses in machine-scorable test booklets.
• At Level 9, there is an option to use either machine-scorable test booklets, which allow students to mark their answers directly in the test booklets, or reusable test booklets and separate answer documents.
• At Levels 10–17/18, students use reusable test booklets and separate answer documents.

10 Iowa Assessments Research and Development Guide
Directions for Administration
A separate Directions for Administration is provided for each Complete, Core, and Survey configuration.
Directions for Administration by Configuration
Complete/Core Survey
Level 5/6
Level 7
Level 8
Level 9 Machine-Scorable Edition
Levels 9–14
Levels 15–17/18
Level 7
Level 8
Level 9 Machine-Scorable Edition
Levels 9–14
Online Test Administration
The Iowa Assessments are available in an online format. Extensive comparability studies of results from online and paper-based test administrations have been conducted as part of the national research program supporting ongoing test interpretation and use (see, for example, Welch and Dunbar, 2014a). The results of these additional studies are available from Iowa Testing Programs or from the publisher.

National Comparison Study 11
Part 3 National Comparison Study
In Brief Scores, scales, and norms are developed through a process in which the Iowa Assessments were administered nationwide to large groups of students under standard conditions. Norms compare one student’s scores with those obtained by other students. Such comparisons let educators assess the performance of their students in relation to that of a nationally representative student group. This part of the guide discusses the procedures used in the standardization of the Iowa Assessments and the results of the National Comparison Study.
Development of National Comparative Information Comparative data collected under standard conditions of test administration enable norm-referenced interpretations of student performance in addition to standards-based interpretations. Scores, scales, and norms are developed through this standardization process. The procedures used for the Iowa Assessments are designed to make the norming sample reflect the national population as closely as possible, ensuring proportional representation of important groups of students.
Many public and nonpublic schools cooperated in the National Comparison Study, which included the fall 2010 and spring 2011 test administrations and a series of field tests and equating studies.
The standardization program, planned jointly by ITP and HMH—Riverside, was carried out as a single enterprise. After reviewing earlier national programs, the basic principles and conditions of those programs were adapted to meet the following specifications:
• The sample should be selected to represent the national population with respect to ability and achievement. It should be large enough to represent the diverse characteristics of the population, but a carefully selected sample of reasonable size would be preferred over a larger but less carefully selected sample.
• Sampling units should be chosen primarily on the basis of district size, region of the country, and socioeconomic characteristics as determined by the school’s Title I status and percentage of students eligible for free and reduced-price lunch. A balance between public and nonpublic schools should be obtained.
• The sample of attendance centers should be sufficiently large and selected to provide dependable norms for building averages.
• Attendance centers in each part of the sample should represent the central tendency and variability of the population.
• To ensure comparability of norms from grade to grade, all grades in a selected
12 Iowa Assessments Research and Development Guide
attendance center (or a designated fraction thereof) should be tested.
• To ensure applicability of norms to all students, testing accommodations for students who require them should be a regular part of the standard administrative conditions as designated in a student’s Individualized Education Program (IEP) and in the accommodation practices of the participating schools.
Procedures for Selecting the Fall National Comparison Sample
The National Comparison Study met current specifications for sampling through the following means:
• a national probability sample representative of students nationwide
• a nationwide sample of schools for school-building norms
• data for Catholic/private (non-Catholic) norms and other special norms
Public School Sample
Three stratifying variables were used to classify public school buildings across the nation: geographic region, district enrollment, and Title I status (and, thereby, socioeconomic status). Within each geographic region (Northeast, Midwest, South, and West), school buildings were stratified into nine district-enrollment categories.
Stratification variables for the study design were determined with data from the National Center for Education Statistics (NCES) Common Core of Data (CCD), Public Elementary/ Secondary School Universe Survey: School Year 2008–2009 (NCES 2010-350 rev., Washington, DC: National Center for Education Statistics; see also Tudor, 2015). For each combination of geographic region, Title I status, and district size, school buildings were selected at random and designated as first, second, or third choices. Administrators in the selected districts were contacted by HMH—Riverside and invited to participate. If a district declined, the next choice was contacted.
Catholic School Sample
The primary source for selecting and weighting the Catholic school sample was the National Catholic Educational Association (NCEA)/Ganley’s (2010) Catholic Schools in America. Within each geographic region used for the public sample, Catholic schools were stratified into five categories on the basis of diocesan enrollment. A two-stage random-sampling procedure was used to select the sample.
In the first stage, dioceses were randomly selected from each of the five enrollment categories. Different sampling fractions were used, ranging from 1.0 for dioceses with a total student enrollment above 100,000 (all four were selected) to 0.07 for dioceses with fewer than 10,000 students (seven of 102 were selected). In the second stage, schools were randomly chosen from each diocese selected in the first stage. In all but the dioceses with the smallest enrollments—where only one school was selected—two schools were randomly chosen. If the selected school declined to participate, the alternate school was contacted. If neither school agreed to participate, additional schools randomly selected from the diocese were contacted.

National Comparison Study 13
Private (Non-Catholic) School Sample
The sample of private (non-Catholic) schools was obtained from the Quality Education Data (QED) data file. Schools within each of the four geographic regions were randomly sampled from the data file until the targeted number of students in each region was reached. For each school selected, an alternate school was chosen to be contacted in the event that the selected school declined to participate.
Design for Data Collection
During the fall 2010 research study, the appropriate level (Levels 5/6 through 17/18) of Form E Complete of the Iowa Assessments was administered to each student. In addition, some students took either Form 7 of the Cognitive Abilities Test™ (CogAT®) or Form A of the Iowa Tests of Basic Skills® (ITBS®). All students in the National Comparison Study for Form E took the Iowa Assessments first, followed by either CogAT Form 7 or ITBS Form A. In approximately half of the grade 3 classrooms, Form E, Level 8 of the Iowa Assessments was administered; in the remaining grade 3 classrooms, Form E, Level 9 was administered.
Weighting the Samples
After materials from the fall research study had been received by Riverside Scoring Service™, the number and percentages of students in each sample (public, Catholic, and private/non-Catholic) and stratification category were determined. The percentages were adjusted by weighting to compensate for missing categories and to correct for schools that tested more or fewer students than required.
Once the optimal weight for each sample was obtained, the stratification variables were simultaneously considered to assign final weights. These weights (integer values 0 through 12, with 3 denoting perfect proportional representation) were assigned to synthesize the characteristics of a missing unit or to adjust the frequencies in other units. As a result, the weighted distributions in the three comparison samples closely approximated those of the total student population.
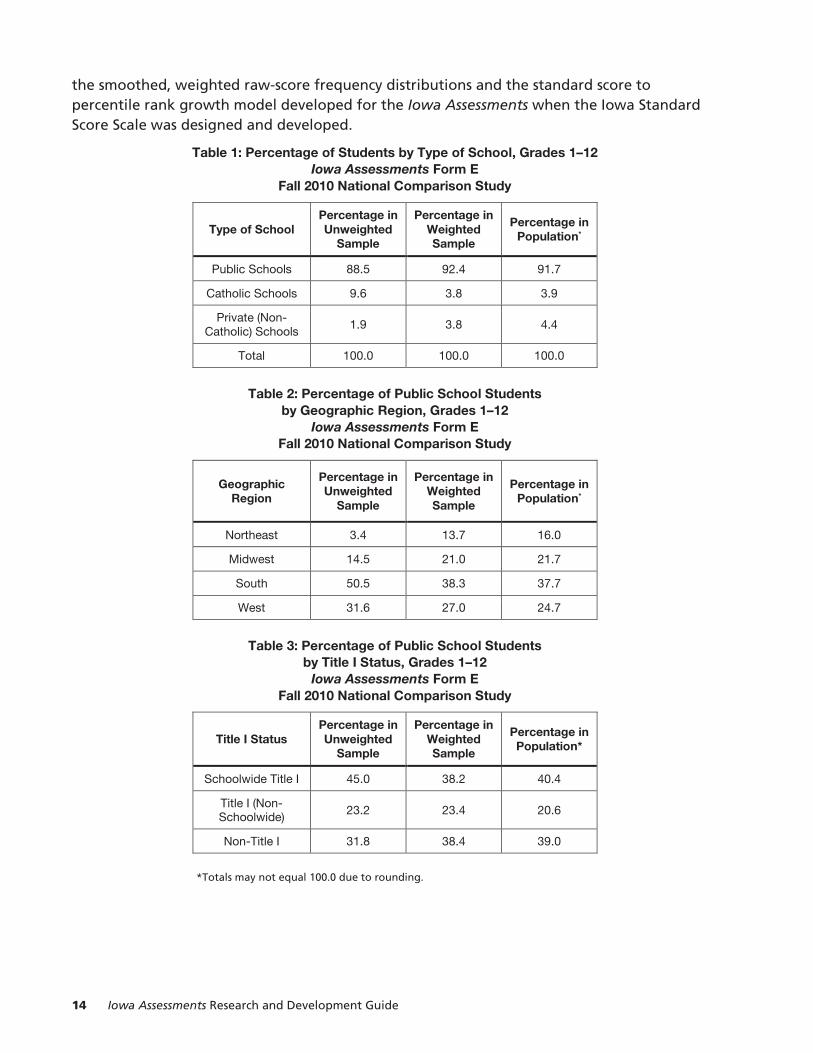
Fall 2010 National Comparison Study The percentages of students in the fall 2010 National Comparison Study of the Iowa Assessments are listed in Table 1 for the public, Catholic, and private (non-Catholic) samples. Figures are given for both the unweighted and weighted samples and the population percentages for each cohort. Optimal weights for these samples were determined by comparing the proportion of students nationally in each cohort to the corresponding sample proportion. Table 1 through Table 6 summarize the unweighted and weighted sample characteristics of students in the fall 2010 National Comparison Study of the Iowa Assessments based on the principal stratification variables of the public school sample and other key characteristics of the nonpublic sample. National norms for student scores were obtained from the weighted raw-score frequency distribution at each grade for students in the fall 2010 National Comparison Study. The cumulative distributions were plotted and smoothed. Raw score to standard score conversions for each test level were derived from the relation between
14 Iowa Assessments Research and Development Guide
the smoothed, weighted raw-score frequency distributions and the standard score to percentile rank growth model developed for the Iowa Assessments when the Iowa Standard Score Scale was designed and developed.
Table 1: Percentage of Students by Type of School, Grades 1–12 Iowa Assessments Form E
Fall 2010 National Comparison Study
Type of School Percentage in Unweighted
Sample
Percentage in Weighted Sample
Percentage in Population*
Public Schools 88.5 92.4 91.7
Catholic Schools 9.6 3.8 3.9
Private (Non-Catholic) Schools
1.9 3.8 4.4
Total 100.0 100.0 100.0
Table 2: Percentage of Public School Students by Geographic Region, Grades 1–12
Iowa Assessments Form E Fall 2010 National Comparison Study
Geographic Region
Percentage in Unweighted
Sample
Percentage in Weighted Sample
Percentage in Population*
Northeast 3.4 13.7 16.0
Midwest 14.5 21.0 21.7
South 50.5 38.3 37.7
West 31.6 27.0 24.7
Table 3: Percentage of Public School Students by Title I Status, Grades 1–12
Iowa Assessments Form E Fall 2010 National Comparison Study
Title I Status Percentage in Unweighted
Sample
Percentage in Weighted Sample
Percentage in Population*
Schoolwide Title I 45.0 38.2 40.4
Title I (Non-Schoolwide) 23.2 23.4 20.6
Non-Title I 31.8 38.4 39.0
*Totals may not equal 100.0 due to rounding.

National Comparison Study 15
Table 4: Percentage of Public School Students by District Enrollment, Grades 1–12
Iowa Assessments Form E Fall 2010 National Comparison Study
District K–12 Enrollment
Percentage in Unweighted
Sample
Percentage in Weighted Sample
Percentage in Population*
50,000–100,000+ 3.4 9.5 18.9
25,000–49,999 34.8 21.8 14.5
10,000–24,999 21.2 18.4 19.0
5,000–9,999 8.9 12.3 15.1
2,500–4,999 19.2 17.0 14.7
1,200–2,499 7.7 9.0 9.7
600–1,199 2.4 4.8 4.7
Less than 600 2.4 7.1 3.4
Table 5: Percentage of Catholic School Students by Diocese Size and Geographic Region, Grades 1–12
Iowa Assessments Form E Fall 2010 National Comparison Study
Diocese Size Percentage in Unweighted
Sample
Percentage in Weighted Sample
Percentage in Population*
50,000–100,000+ 15.6 14.9 16.5
20,000–49,999 18.6 27.2 32.3
10,000–19,999 39.1 34.0 28.4
Less than 10,000 26.7 23.9 22.9
Geographic Region
Northeast 30.0 27.3 28.1
Midwest 36.5 36.8 33.0
South 11.0 19.2 22.5
West 22.6 16.7 16.3
*Totals may not equal 100.0 due to rounding.

16 Iowa Assessments Research and Development Guide
Table 6: Percentage of Private (Non-Catholic) School Students by Geographic Region, Grades 1–12
Iowa Assessments Form E Fall 2010 National Comparison Study
Geographic Region
Percentage in Unweighted
Sample
Percentage in Weighted Sample
Percentage in Population*
Northeast 3.2 14.6 20.0
Midwest 80.1 40.9 16.9
South 16.8 44.5 41.3
West 0.0 0.0 21.8
*Totals may not equal 100.0 due to rounding.
Participation of Students in Special Groups
In the fall 2010 National Comparison Study, schools were given detailed instructions on testing English language learners (ELLs) and students with special needs. Schools were asked to identify all students with those classifications, decide whether they should participate in the assessment, and, if so, determine whether accommodations in testing procedures were needed.
Among students with special needs, nearly all were identified as eligible for special education services and had an Individualized Education Program (IEP), an Individual Accommodation Plan (IAP), or a Section 504 Plan. Schools were asked to examine the IEP or other plan for these students, decide whether the students should receive accommodations, and determine the nature of those accommodations.
Schools were told that an accommodation refers to a change in the procedures for administering the assessment and that an accommodation is intended to neutralize, as much as possible, the effect of the student’s special needs on the assessment process. Accommodations should not change the kind of achievement being measured but change how achievement is measured. If chosen appropriately, an accommodation should provide neither too much nor too little help to the student who receives it.
When accommodations were provided, their use was recorded on each student’s answer document by the test administrator. The accommodations most frequently used by students with IEPs or Section 504 Plans were listed on the student’s answer document; space for indicating other accommodations was included.
For students whose native language was not English and who had been in an English-only classroom for a limited time, two decisions had to be made prior to administering the assessment. First, was English-language acquisition developed sufficiently to warrant participation, and second, should the assessment involve the use of any particular accommodations? In all instances, the guidelines in place in the school district were to be implemented in making decisions about each student.
National Comparison Study 17
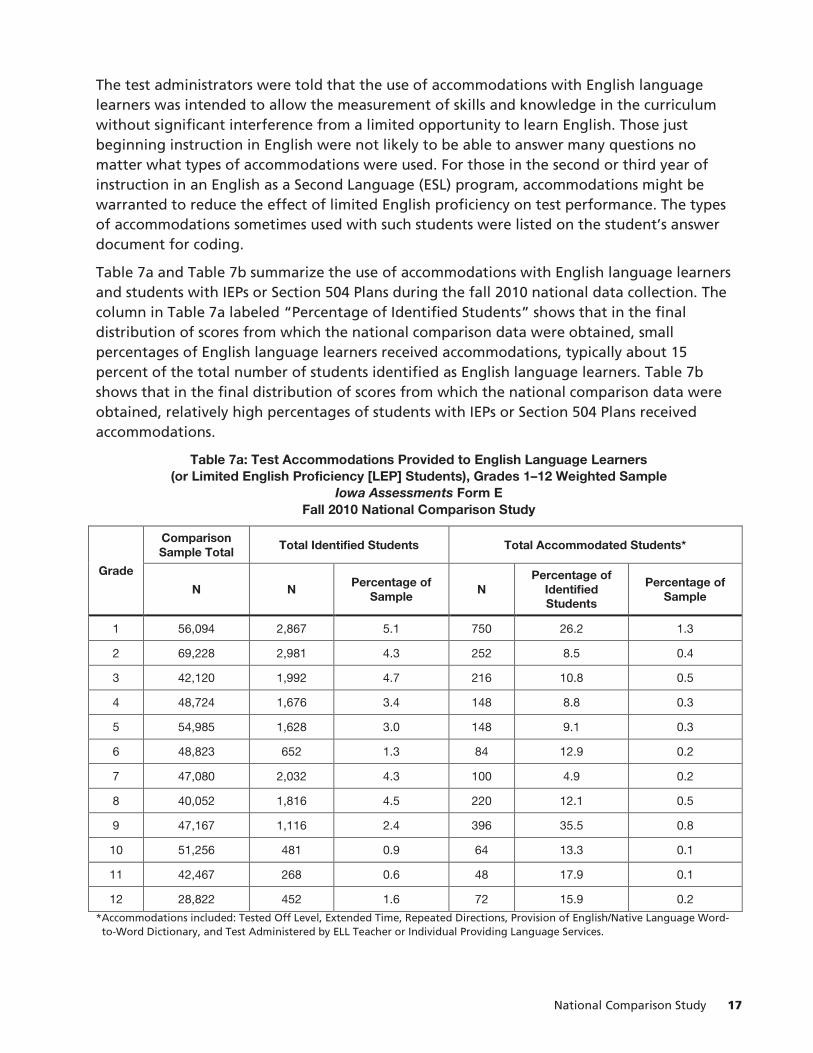
The test administrators were told that the use of accommodations with English language learners was intended to allow the measurement of skills and knowledge in the curriculum without significant interference from a limited opportunity to learn English. Those just beginning instruction in English were not likely to be able to answer many questions no matter what types of accommodations were used. For those in the second or third year of instruction in an English as a Second Language (ESL) program, accommodations might be warranted to reduce the effect of limited English proficiency on test performance. The types of accommodations sometimes used with such students were listed on the student’s answer document for coding.
Table 7a and Table 7b summarize the use of accommodations with English language learners and students with IEPs or Section 504 Plans during the fall 2010 national data collection. The column in Table 7a labeled “Percentage of Identified Students” shows that in the final distribution of scores from which the national comparison data were obtained, small percentages of English language learners received accommodations, typically about 15 percent of the total number of students identified as English language learners. Table 7b shows that in the final distribution of scores from which the national comparison data were obtained, relatively high percentages of students with IEPs or Section 504 Plans received accommodations.
Table 7a: Test Accommodations Provided to English Language Learners (or Limited English Proficiency [LEP] Students), Grades 1–12 Weighted Sample
Iowa Assessments Form E Fall 2010 National Comparison Study
Grade
Comparison Sample Total
Total Identified Students Total Accommodated Students*
N N Percentage of
Sample N
Percentage of Identified Students
Percentage of Sample
1 56,094 2,867 5.1 750 26.2 1.3
2 69,228 2,981 4.3 252 8.5 0.4
3 42,120 1,992 4.7 216 10.8 0.5
4 48,724 1,676 3.4 148 8.8 0.3
5 54,985 1,628 3.0 148 9.1 0.3
6 48,823 652 1.3 84 12.9 0.2
7 47,080 2,032 4.3 100 4.9 0.2
8 40,052 1,816 4.5 220 12.1 0.5
9 47,167 1,116 2.4 396 35.5 0.8
10 51,256 481 0.9 64 13.3 0.1
11 42,467 268 0.6 48 17.9 0.1
12 28,822 452 1.6 72 15.9 0.2
*Accommodations included: Tested Off Level, Extended Time, Repeated Directions, Provision of English/Native Language Word-to-Word Dictionary, and Test Administered by ELL Teacher or Individual Providing Language Services.

18 Iowa Assessments Research and Development Guide
Table 7b: Test Accommodations Provided to IEP and Section 504 Plan Students, Grades 1–12 Weighted Sample
Iowa Assessments Form E Fall 2010 National Comparison Study
Grade
Comparison Sample Total Total Identified Students Total Accommodated Students*
N N Percentage of Sample
N Percentage of
Identified Students
Percentage of Sample
1 56,094 675 1.2 198 29.3 0.4
2 69,228 1,315 1.9 463 35.2 0.7
3 42,120 1,099 2.6 466 42.4 1.1
4 48,724 1,816 3.7 1,003 55.2 2.1
5 54,985 2,024 3.7 1,136 56.1 2.1
6 48,823 1,219 2.5 877 71.9 1.8
7 47,080 1,160 2.5 1,062 91.6 2.3
8 40,052 1,087 2.7 913 84.0 2.3
9 47,167 379 0.8 266 70.2 0.6
10 51,256 388 0.8 235 60.6 0.5
11 42,467 559 1.3 390 69.8 0.9
12 28,822 255 0.9 184 72.2 0.6
*Accommodations included: Read Aloud, Tested Off Level, Extended Time, Assistance with Answer Document, Separate Location, Repeated Directions, and Other.
Racial-Ethnic Representation
Although not a direct part of a typical sampling plan, the ethnic and racial composition of a national sample should represent that of the school population. The racial-ethnic composition of the 2010 Iowa Assessment fall standardization sample was estimated from responses to demographic questions on answer documents. In all grades, students were asked to indicate their ethnicity as Hispanic or non-Hispanic. A separate entry was provided in which students were told to indicate the racial group or groups defined by the 2010 U.S. Census to which they belonged. In grade 1 through grade 3, teachers furnished this information. In the remaining grades, students furnished it.
Table 8 summarizes racial-ethnic representation in the weighted grade 1 through grade 12 sample. The differences between the sample and population percentages are generally small. Note that the percentages in the categories for race sum to the percentage of students who indicated they were not Hispanic or Latino.

National Comparison Study 19
Table 8: Grades 1–12 Racial-Ethnic Representation Iowa Assessments Form E
Fall 2010 National Comparison Study
Ethnicity Percentage in
Weighted Sample1
Percentage in Population2
Hispanic or Latino 22.1 21.8
Not Hispanic or Latino 77.9 78.2
Race
American Indian or Alaska Native 1.7 0.9
Asian 2.8 4.3
Black or African American 14.2 14.1
Native Hawaiian or Other Pacific Islander 0.5 0.2
White 55.2 56.1
Two or more races 3.6 2.7
1 The weighted sample includes Catholic and other private schools. 2 Digest of Education Statistics: 2010, 2010 population for 5- to 17-year-olds.
Spring 2011 National Comparison Study The spring 2011 National Comparison Study served the following three major purposes:
• To establish empirical spring norms for the assessments standardized in the fall of 2010
• To obtain the national item-level data for Form E, which was needed for item, skill, and test percentage correct analyses as well as to calculate means, standard deviations, and reliability indices
• To validate fall to spring changes in student performance in terms of national standard scores for the measurement of growth
Approximately 20 percent of the schools that participated in the fall 2010 national comparison study participated in the spring 2011 study. Selection procedures were used to ensure representative participation across the stratification categories of public, Catholic, and private (non-Catholic) fall samples. However, because the participating sample was not completely representative of the fall sample, additional schools were contacted to participate.
All schools participating in the spring 2011 National Comparison Study administered an appropriate level of the Iowa Assessments. Student records were examined in reference to stratification variables, and distributions of standard scores were obtained on tests and composites. The mean differences between fall and spring standard scores were compared to expected differences based on the standard score growth model. In general, observed and

20 Iowa Assessments Research and Development Guide
expected differences between fall and spring means were similar in magnitude. These differences are reported in Part 6.

Validity 21
Part 4 Validity
In Brief Validity is an attribute of information from tests that, according to the Standards for Educational and Psychological Testing, “refers to the degree to which evidence and theory support the interpretations of test scores entailed by proposed uses of tests” (AERA, APA, and NCME, 2014, p. 11).
Assessment information is not considered valid or invalid in any absolute sense. Rather, the information is considered valid for a particular use or interpretation and invalid for another. The Standards further state that validation involves the accumulation of evidence to support the proposed score interpretations.
This part of this guide provides an overview of the data collected over the history of the Iowa Assessments that pertain to validity. Data and research pertaining to the Iowa Assessments consider the five major sources of validity evidence that are outlined in the standards:
• Test content
• Response processes
• Internal structure
• Relations to other variables and to growth
• Other considerations and consequences of testing
The rationale for the professional judgments that lie behind the content standards and organization of the Iowa Assessments and the process used to translate those judgments into developmentally appropriate test materials are presented in the following sections. A range of appropriate uses of results and methods for reporting information on test performance to various audiences are also described.
Criteria for Evaluating Assessments Evaluating an elementary school assessment is much like evaluating other instructional materials. In the latter case, the recommendations of other educators as well as of the test’s developers and publisher would be considered. The decision to adopt materials locally, however, would require closer scrutiny of the materials to understand their content and organization. The alignment of the materials with local educational standards and compatibility with instructional methods would be important factors in the review of the materials.
The evaluation of an elementary and secondary achievement test is much the same process. What the test’s developers and publisher can say about how the assessment was developed, what the statistical data indicate about the technical characteristics of the test, and what

22 Iowa Assessments Research and Development Guide
judgments about quality are made by unbiased experts as they review the test all contribute to the final evaluation. The decision about the potential validity of the test, however, rests primarily on local review and inspection of the test itself. Local analysis of test content—including judgments about its appropriateness for students, teachers, other school personnel, and the community at large—is critical.
Validity of the Assessments Validity must be judged in relation to purpose. Different purposes may call for tests built to different specifications. For example, a test intended to determine whether students have reached a performance standard in a local district is unlikely to have much validity for measuring differences in progress toward individually determined goals. Similarly, a testing program designed primarily to answer “accountability” questions may not be the best program to stimulate differential instruction and creative teaching.
Cronbach long ago made the point that validation is the task of the interpreter: “In the end, the responsibility for valid use of a test rests on the person who interprets it. The published research merely provides the interpreter with some facts and concepts. He has to combine these with his other knowledge about the person he tests. . . .” (1971, p. 445). Messick contended that published research should bolster facts and concepts with “some exposition of the critical value contents in which the facts are embedded and with provisional accounting of the potential social consequences of alternative test uses” (1989, p. 88). More recently, Kane proposed that validation is a way of thinking about the use of test results that (1) establishes a framework for test development based in the interpretations to be made of test results, (2) structures the evidence that should be gathered to support an argument for validity of the intended interpretations, and (3) clarifies the extent to which the argument for validity is adequate for the purpose the test is intended to serve (2006, p. 60). All of these perspectives reflect important aspects of validity in large-scale assessment.
Instructional decisions involve the combination of test validity evidence and prior information about the person or group tested. The information that test developers can reasonably be expected to provide about all potential uses of tests in decision making is limited. Nevertheless, one should explain how tests are developed and provide recommendations for appropriate uses. In addition, guidelines should be established for reporting results that lead to valid score interpretations so that the consequences of test use at the local level are clear.
The procedures used to develop and revise test materials and interpretive information lay the foundation for test validity. Meaningful evidence related to inferences based on test scores, not to mention desirable consequences from those inferences, can provide scores with social utility only if test development produces meaningful test materials. Content quality is thus the essence of arguments for test validity (Linn, Baker, and Dunbar, 1991; Schmeiser and Welch, 2006). The guiding principle for the development of the Iowa Assessments is that materials presented to students be of sufficient quality to make the time spent testing useful for both assessment and instruction. Passages are selected for the reading tests, for example, not only because they yield good comprehension questions, but because they are interesting to read. Items that measure discrete skills (for example, capitalization and punctuation) contain factual content that promotes incidental learning during the test. Experimental contexts in science

Validity 23
expose students to novel situations through which their understanding of scientific reasoning can be measured. These examples show ways in which developers of the Iowa Assessments try to design tests so that taking the test can itself be considered a learning experience. Such efforts represent the cornerstone of test validity.
Statistical Data to Be Considered The types of statistical data that might be considered as evidence of test validity include reliability coefficients, difficulty indices of individual test items, indices of the discriminating power of the items, indices of differential functioning of the items, and correlations with other measures, such as course grades, scores on other tests of the same type, or novel measures of the same content or skills.
All of these types of evidence reflect on the validity of the test, but they do not guarantee its validity. They do not prove that the test measures what it purports to measure. They certainly cannot reveal whether the things being measured are those that ought to be measured. A high reliability coefficient, for example, shows that the test is measuring something consistently but does not indicate what that “something” is. Given two tests with the same title, the one with the higher reliability may actually be the less valid for a particular purpose (Feldt, 1997). For example, one can build a highly reliable mathematics test by including only simple computation items, but this would not be a valid test of problem-solving skills in mathematics. Similarly, a poor test may show the same distribution of item difficulties as a good test, or it may show a higher average index of discrimination than a more valid test.
Correlations of test scores with other measures are evidence of the validity of a test only if the other measures are as good as or better than the test that is being evaluated. Suppose, for example, that three math tests, A, B, and C, show high correlations among themselves. These correlations may be due simply to the three tests exhibiting the same defects, such as overemphasis on memorization of basic facts. If test D, on the other hand, is a superior measure of the student’s ability to apply those math principles to real-world problems, it is unlikely to correlate highly with the other three tests. In this case, its lack of correlation with tests A, B, and C is evidence that test D is the more valid test for interpretations about problem solving.
This discussion is not meant to imply that well-designed validation studies are of no value; published tests should be supported by a continuous program of research and evaluation. Rational judgment also plays a key role in evaluating the validity of achievement tests against content and process standards and in interpreting statistical evidence from validity studies.
Validity of the Tests in the Local School Standardized tests such as the Iowa Assessments are constructed to correspond to widely accepted goals of instruction in schools across the nation. No standardized test, no matter how carefully planned and constructed, can ever be equally suited for use in all schools. Local differences in curricular standards, grade placement, and instructional emphasis, as well as differences in the nature and characteristics of the student population, should be taken into account in evaluating the validity of a test.

24 Iowa Assessments Research and Development Guide
The two most important questions in the selection and evaluation of achievement tests at the local level should be:
1. Are the skills and abilities required for successful performance those that are appropriate for the students in our school?
2. Are our standards for content and instructional practices represented in the questions?
To answer these questions, those making the determination should take the test or at least answer a sample of representative questions. In taking the test, they should try to decide which cognitive processes the student is likely to use to reach the correct answers. They should then ask:
• Are all the cognitive processes considered important in the school represented in the test?
• Are any desirable cognitive processes omitted?
• Are any specific skills or abilities required for successful test performance unrelated to the goals of instruction?
Evaluating an achievement test configuration in this manner is time-consuming. It is, however, the only way to discern the most important differences among tests and their relationships to local curriculum standards. Considering the importance of the inferences that will later be drawn from test results and the influence the test may exert on instruction and guidance in the school, this type of careful review is important.
Domain Specifications The content and process specifications for the Iowa Assessments have undergone constant revision for more than sixty years. They have involved the experience, research, and expertise of professionals from a variety of education specialties. In particular, research in content standards, curriculum practices, test design, technical measurement procedures, and test interpretation and utilization has been a continuing feature of test development.
Form E and Form F of the Iowa Assessments reflect today’s curricula and content standards: the tests have been carefully designed using the Common Core State Standards (CCSS), individual state standards, surveys of classroom teachers, reviews of curriculum guides and instructional materials, and responses from students in extensive research studies and field testing.
Content Fidelity and Test Development Procedures The new forms of the Iowa Assessments are the result of an extended, iterative process during which “experimental” test materials are developed and administered to national and state samples to evaluate their measurement quality and appropriateness. Figure 1 shows the process involved in test development (see also Schmeiser and Welch, 2006).

Validity 25
Figure 1: Steps in Development of the Iowa Assessments
Test Specifications
Test specifications are created that outline (among other attributes) the statistical specifications; distribution of content, skills, and cognitive levels across the test form; test organization; and special accommodations and other conditions of test administration. By establishing these parameters beforehand, test specifications help ensure the new forms are comparable to existing forms to the degree desired. The test specifications provide the “blueprint” for test construction, defining the necessary steps and procedures. As test development proceeds, the test specifications are continually revisited and evaluated in an iterative process to ensure that the materials available for assembly of final forms reflect the evolving purposes of the assessments.
Item Writing
Items and stimulus sets (reading passages, graphs, maps, tables, and so on that support a group of items) are then created according to the test specifications. Content specialists at ITP convene item writing workshops and train educators on sound item writing practices. Educators are assigned to write items in the content areas and grade levels that best align with their experience in the classroom. Item production goals ensure a significant “overage” of items across subject areas at each cognitive level so that the pool of available items in each subject and level is far greater than what is needed to build each test. This overage allows content experts to discard those items that do not survive internal and external item review or post-tryout data review.
Test Specifications Item Writing
Internal Review Stage One
External Review Internal Review
Stage Two Item Tryout
Data Review Operational
Forms Construction
External Forms Review

26 Iowa Assessments Research and Development Guide
Internal Review Stage One
After items are written, content specialists review these items for content accuracy, fairness, and universal design (see “Universal Design” on page 47 for more information). The goal of these reviews is to make sure the items are accurate, fair, and accessible to all student subgroups in the diverse population of test takers. The items and associated materials are edited to ensure that they are clearly written and that reading loads are grade appropriate. The items are also copyedited for grammar and spelling at this stage in the process.
External Review
Once the items have been reviewed internally, ITP convenes panels of educators to review the items and associated stimuli (reading passages, tables, graphs, maps, and so forth). After participating in a formal training session about the review process, educators review the items for grade-level appropriateness, content relevance, and accuracy. Since they have not been involved in the development process up to this point, external reviewers provide an objective “cold read” of potential test materials. A main goal of the educator review is to confirm that the items are appropriate for the intended grade level and content area.
Internal Review Stage Two
ITP development staff reviews the items again after the educator panel review. This review focuses on edits made to the items during previous steps in the process and again checks for content accuracy, fairness, and universal design considerations.
Item Tryout
Items that have passed the review process are assembled into field test forms for the item tryout. ITP collects data on the performance of the items by conducting a field test to determine how well the items are likely to perform operationally. When a field test is conducted, test booklets are created to be tried out at predetermined grade bands spanning two, three, or four grade levels. Students complete the field tests when they take the operational tests in numbers sufficient to ensure the associated statistical results are sound. Trying out test materials at multiple grades provides the data necessary to ensure optimal placement of items for the measurement of growth.
Data Review
The data collected during the field test are analyzed for technical qualities related to item difficulty and discrimination. This analysis determines whether the items are appropriate measures of students’ knowledge and the extent to which they will contribute to the test’s overall reliability. Other aspects of the data review include key checks and the analysis of distractor choices, subgroup differences, and correlations with operational test forms. Only items that display acceptable descriptive statistics are eligible to appear on operational forms.
Operational Forms Construction
Items that ITP has determined should appear on operational test forms become part of the pool of items that are eligible for selection. Forms construction procedures ensure the final subject area test has adequate content coverage while being meaningful to students of varying achievement levels; the items within a typical subject area’s item pool are diverse in

Validity 27
terms of skill alignment, cognitive level, and difficulty. Items are then selected from the item pool into test forms. Careful attention is paid to item selection so that the final tests follow the predetermined test specifications and meet psychometric targets for difficulty, discrimination, and reliability.
Forms Review
Once tests have been constructed, the materials are submitted for another round of external reviews. Educators are recruited to evaluate the materials from a variety of perspectives, including appropriateness for the intended audience. Additionally, experts are recruited to evaluate materials for perceived fairness and sensitivity concerns. Educators/reviewers are selected to represent various ethnic and racial groups, genders, and student subgroups, such as English language learners (ELLs), students with special needs, and students who are visually impaired (the latter aids in the adaptation of test forms in braille).
Test Descriptions The following tables provide a description of each subject-area test in the Iowa Assessments, grouped by level as appropriate. As students progress through the elementary, middle, and high school grades and gain greater mastery in a given subject area, the skills and concepts on which they are assessed change accordingly. Broadly speaking, each assessment can be viewed as measuring a continuum of achievement that spans ages 5/6 through 17/18, which are referred to as test levels.
Level 5/6
Test Description
Vocabulary • Questions measure listening vocabulary.
• Students hear a word and select a picture that illustrates the meaning of the word.
• Nouns, verbs, and modifiers are included.
Word Analysis • Questions emphasize the recognition of letters and letter–sound relationships.
• Response choices are a mix of letters, pictures, or words.
Listening • Questions emphasize literal and inferential understanding of material that is heard.
• Stories are read aloud and followed by a question.
• Response choices are pictorial.
• Reading is not required.
Continued on the next page…

28 Iowa Assessments Research and Development Guide
Level 5/6, continued
Test Description
Language • Questions measure the student’s ability to use language to express ideas.
• Some questions cover the use of prepositions, singular and plural, and comparative and superlative forms.
• Some questions are aimed at word classifications, verb tenses, or spatial–directional relationships.
• Questions are read aloud.
• Response choices are pictorial.
Mathematics • Questions emphasize beginning math concepts, problem solving, and math operations.
• Questions are drawn from numeration, geometry, measurement, and applications of addition and subtraction in word problems.
• Questions are read aloud.
• Response choices are pictorial and numeral.
Reading • Test is administered in two parts.
• Questions emphasize the ability to identify words based on verbal and visual cues.
• Questions measure comprehension of sentences, pictures that tell a story, and printed stories.
Levels 7 and 8
Test Description
Vocabulary • Students are presented with a pictorial or written stimulus and select the answer from a set of written responses.
• Nouns, verbs, and modifiers are included.
• Content focus is on general vocabulary.
• Test consists of two untimed sections.
Word Analysis • Questions measure comprehension of letter-sound associations and word structures using affixes and the formation of compound words.
• Response choices are a mix of pictures and words.
Reading • Test is administered in two parts.
• Questions emphasize the ability to complete sentences based on visual cues.
• Questions measure the ability to demonstrate both literal and inferential understanding.
Listening • Questions emphasize literal and inferential understanding of material that is heard.
• Stories are read aloud and followed by one or more questions.
• Response choices are pictorial.
Continued on the next page…

Validity 29
Levels 7 and 8, continued
Test Description
Language • Questions measure the student’s ability to use some conventions of standard written English.
• Four test sections assess spelling, capitalization, punctuation, and skill in written usage and expression.
• Questions and response choices are read aloud.
Mathematics • Test is administered in two untimed parts.
• Questions measure the understanding and ability to apply concepts in the areas of number properties and operations, geometry, measurement, and number sentences.
• Questions emphasize the interpretation of data presented in graphs or tables, where students’ response options are pictorial, numbers, or words.
• Some questions require students to select a number sentence that could be used to solve the problem, while other questions require students to solve brief word problems with answer options that include “N,” indicating that the solution is not provided with the answer choices.
• If the correct answer is not given, students select “N,” which means “Not given.”
• Questions are read aloud.
Computation • First section is an oral presentation of addition and subtraction problems.
• Second section is not read aloud and addition and subtraction questions are presented in the test booklet.
• If the correct answer is not given, students select “N,” which means “Not given.”
Social Studies • Questions emphasize the interpretation of social studies-related materials, as well as knowledge drawn from the areas of history, geography, economics, civics, and government.
• Most questions are read aloud.
• Response choices are pictorial or text.
• At the end of the test, students respond to sets of stimuli. (Questions and stimuli are not read aloud.)
Science • Questions emphasize the methods and processes used in scientific inquiry, as well as knowledge in the areas of life science, earth and space science, and physical science.
• Most questions are read aloud.
• Response choices are pictorial or text.
• At the end of the test, students respond to sets of stimuli. (Questions and stimuli are not read aloud.)
30 Iowa Assessments Research and Development Guide
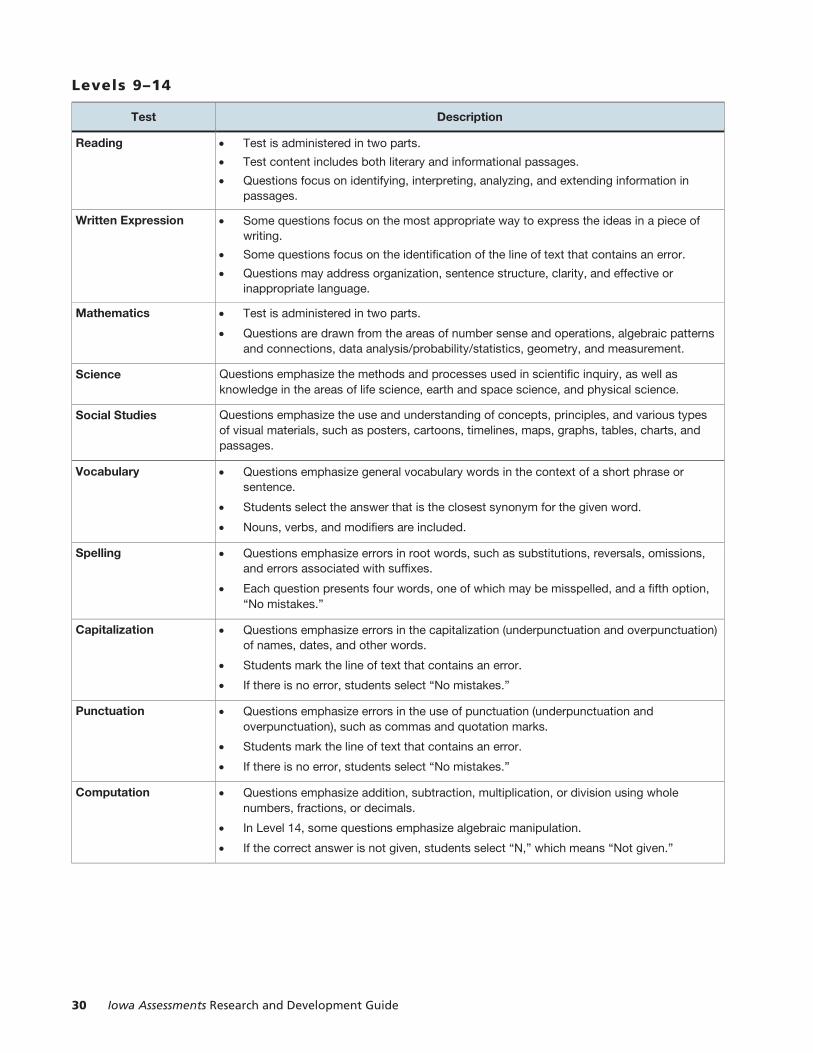
Levels 9–14
Test Description
Reading • Test is administered in two parts.
• Test content includes both literary and informational passages.
• Questions focus on identifying, interpreting, analyzing, and extending information in passages.
Written Expression • Some questions focus on the most appropriate way to express the ideas in a piece of writing.
• Some questions focus on the identification of the line of text that contains an error.
• Questions may address organization, sentence structure, clarity, and effective or inappropriate language.
Mathematics • Test is administered in two parts.
• Questions are drawn from the areas of number sense and operations, algebraic patterns and connections, data analysis/probability/statistics, geometry, and measurement.
Science Questions emphasize the methods and processes used in scientific inquiry, as well as knowledge in the areas of life science, earth and space science, and physical science.
Social Studies Questions emphasize the use and understanding of concepts, principles, and various types of visual materials, such as posters, cartoons, timelines, maps, graphs, tables, charts, and passages.
Vocabulary • Questions emphasize general vocabulary words in the context of a short phrase or sentence.
• Students select the answer that is the closest synonym for the given word.
• Nouns, verbs, and modifiers are included.
Spelling • Questions emphasize errors in root words, such as substitutions, reversals, omissions, and errors associated with suffixes.
• Each question presents four words, one of which may be misspelled, and a fifth option, “No mistakes.”
Capitalization • Questions emphasize errors in the capitalization (underpunctuation and overpunctuation) of names, dates, and other words.
• Students mark the line of text that contains an error.
• If there is no error, students select “No mistakes.”
Punctuation • Questions emphasize errors in the use of punctuation (underpunctuation and overpunctuation), such as commas and quotation marks.
• Students mark the line of text that contains an error.
• If there is no error, students select “No mistakes.”
Computation • Questions emphasize addition, subtraction, multiplication, or division using whole numbers, fractions, or decimals.
• In Level 14, some questions emphasize algebraic manipulation.
• If the correct answer is not given, students select “N,” which means “Not given.”

Validity 31
Levels 15–17/18
Test Description
Reading • Questions measure the ability to understand a range of process levels associated with reading comprehension.
• Each test level has five passages.
• Questions focus on inferring, analyzing, evaluating, and generalizing information in passages.
Written Expression • Questions measure the ability to recognize the correct and effective use of standard American English in writing.
• Some questions focus on the most appropriate way to revise a piece of writing based on focus, organization, diction and clarity, sentence structure, usage, mechanics, and spelling.
• Questions pose alternatives that may correct or improve underlined portions of texts, including errors in mechanics or usage, problems with fluency or clarity, or issues of organization.
Mathematics • Questions measure the students’ ability to solve quantitative problems.
• Problems require basic arithmetic and measurement, estimation, and data interpretation.
• Questions are drawn from the areas of number sense and operations, algebraic patterns and connections, data analysis/probability/statistics, geometry, and measurement.
Science • Questions emphasize the methods and processes used in scientific inquiry.
• Questions assess knowledge and skill in life science, earth and space sciences, and physical science.
Social Studies • Questions emphasize the use and understanding of concepts, principles, and various types of visual materials, such as posters, cartoons, timelines, maps, graphs, tables, charts, and passages.
• Questions are drawn from knowledge in the areas of history, geography, economics, and civics and government.
Vocabulary • Questions represent a cross section of vocabulary in general communication.
• Technical words and specialized vocabulary are not included.
• Words are presented in short sentences, and the student must choose an alternative word or phrase that is closest in meaning to the tested word.
Computation • Questions emphasize addition, subtraction, multiplication, and division using whole numbers, fractions, decimals, and percentages.
• Questions measure the ability to manipulate variables and to evaluate expressions with exponents or with square roots.

32 Iowa Assessments Research and Development Guide
Distribution of Domains and Skills for the Iowa Assessments Table 9 lists the distribution of domains and skills in Levels 5/6 through 17/18 of the Iowa Assessments. The table indicates major categories in the test specifications for each test during item development.
Table 9: Distribution of Skills Objectives for the Iowa Assessments (Form E)
Test
Level 5/6 Levels 7 and 8 Levels 9–14 Levels 15–17/18
Number of
Domain Skills
Number of
Standards
Number of
Domain Skills
Number of
Standards
Number of
Domain Skills
Number of
Standards
Number of
Domain Skills
Number of
Standards
Reading 2 6 3–5 8–11 5 11–12 5 11–12
Math 4 10 5 13–15 5 20–22 5 16–19
Written Expression
– – – – 4 14–16 5 17–18
Science – – 3 11–12 3 10–11 3 10–12
Social Studies – – 4 10 4 9–12 4 10–11
Vocabulary 1 3 1 3 1 3 1 3
Computation – – 1 4 1–4 7–19 4 8
Spelling – – – – 1 5 – –
Capitalization – – – – 1 9–12 – –
Punctuation – – – – 1 6–9 – –
Word Analysis 2 6 2 7 2* 8* – –
Listening 2 8 2 8 2* 8* – –
Language 7 7 4 14–15 – – – –
Common Core Reading
– – 3** – 3 – 3 –
Common Core Foundational Skills
– – 2** – 2*** – – –
Common Core Speaking and Listening
– – 1** – 1*** – – –
Common Core Language and Writing
– – 2** – 5 – 5 –
Common Core Mathematics
– – 4** – 5–6 – 5 –
* Word Analysis and Listening are supplementary tests at Level 9.
** Level 8 only
*** Level 9 only

Validity 33
Cognitive Level Difficulty Descriptors In order to help educators see the full range of item complexity in the Iowa Assessments and how their students perform on items of varying cognitive complexity, each item in Form E and Form F has been assigned one of three Cognitive Level Difficulty descriptors:
Level 1: Essential Competencies
This level of difficulty involves recalling information, such as facts, definitions, terms, or simple one-step procedures.
Level 2: Conceptual Understanding
This level of difficulty requires engaging in some cognitive processing beyond recalling or reproducing a response. A conceptual understanding item requires students to make some decisions as to how to approach the problem or activity and may require them to employ more than a single step.
Level 3: Extended Reasoning
This level of difficulty requires problem solving, planning, and/or using evidence. These items require students to develop a strategy to connect and relate ideas in order to solve the problem, and the problem may require that the student use multiple steps and draw upon a variety of skills.
Internal Structure of the Iowa Assessments The internal structure of the Iowa Assessments was analyzed using exploratory factor analysis (EFA) techniques. In general, the results of these analyses, particularly in grades 3 through 11, reflect a composition of constructs consistent with the major domains of the Common Core State Standards: (1) reading and writing aspects of literacy in connection with analysis of information in social studies and science and (2) concepts and procedural skills in mathematics. Correlations among national standard scores were used with least-squares estimates of communality:
• In kindergarten, the factor solution was based on the six tests in Level 5/6.
• In grades 1 and 2, the factor solutions were based on the nine tests in Levels 7 and 8.
• In grades 3–8, the solutions were based on the twelve tests in Level 9 and the ten tests in Levels 10–14.
• In grades 9–12, the solutions were based on the seven tests in Levels 15–17/18.
After the least-squares factor solutions were obtained, both orthogonal and oblique simple structure transformations were performed. Three factors were retained for Levels 7–14 and for Levels 15–17/18; two were retained for Level 5/6.
For Levels 9–14, the three factors were primarily determined by tests in Reading, Vocabulary, Written Expression, and Mathematics. These tests are considered the major subject areas in the elementary school curriculum and are consistent with the emphasis found in the CCSS. Tests in Social Studies, Science, and Spelling were less uniform in their factor composition and loaded on a secondary factor.
The three constructs were identified as a literacy factor, a mathematics factor, and a mechanics of written language factor. The literacy factor was determined by subtests under the umbrella of English Language Arts. Among those, Vocabulary and Reading contributed

34 Iowa Assessments Research and Development Guide
the most to the interpretation of this factor, with substantial influence from Written Expression, Social Studies, and Science. The inclusion of the Social Studies and Science tests in the literacy factor is also consistent with the structure of the CCSS, which includes processes such as the following in the ELA Literacy standards:
• Using textual evidence to support analysis of science and technical texts
• Determining the central ideas or information of a primary or secondary source (or of a text)
• Using textual evidence to support analysis of primary and secondary sources, connecting insights gained from specific details
The Mathematics test and the Computation test clearly identified the mathematics factor. This factor was the most clearly defined of the three. Although it was correlated with the other achievement constructs, it suggests that the mathematics domain in the Iowa Assessments is focused on well-defined and coherent standards of the curriculum.
The mechanics of the written language factor was principally defined by subtests in Conventions of Writing (Spelling, Capitalization, and Punctuation). Written Expression also loaded in this factor at six test levels. This could be expected because the Written Expression test contains questions about specific points of Standard English syntax, verb forms, and other points of grammar often taught in conjunction with all aspects of written language and used by students editing their own written work or the work of their peers. The tests loading on this factor closely correspond to the Structure of Language and Writing Conventions strands of the CCSS in English language arts.
Levels 7 and 8 have a subtest structure similar to that of Levels 9–14 except in ELA, where the test specifications have features unique to these test levels. The three factors defined reveal contrasts between the tests in Levels 7 and 8 and those in Levels 9–14. The first two factors were similar to the ones described above. The Word Analysis and Language tests helped define the first factor; the two Mathematics tests defined the second factor. The third factor related to the tests that require interpreting stories and pictures (Listening, Social Studies, and Science) while listening to a teacher read the stories aloud.
Only six tests are included in Level 5/6, and the test composition is slightly different from that of the higher levels. Two factors were defined at this level. The first factor was defined by the Vocabulary, Listening, Language, and Mathematics tests. The second factor was influenced by the Reading, Word Analysis, and, to a lesser extent, Mathematics tests. The two factors probably reflect the integrated curriculum of the early elementary grades.
A similar procedure was performed at the high school level. The factor solutions were based on correlations among the seven tests for Levels 15 through 17/18. Again, three factors were retained for all three levels. The literacy factor was determined by the Reading, Vocabulary, and Written Expression tests. The mathematics factor was defined by the Mathematics and Computation tests. The third factor was primarily defined by Social Studies and Science, which require analysis of a variety of stimulus materials and questions tapping broad reasoning skills and principles of interpreting results of empirical research in science and social science. The Vocabulary test also loaded in this factor.

Validity 35
Predictive Validity and College Readiness Tests such as the Iowa Assessments have been used in many ways to support judgments about how well students are prepared for future instruction—that is, as general measures of readiness. Over the years, ITP has conducted numerous studies to establish the predictive “power” of the Iowa Assessments with respect to a variety of criterion measures, including high school GPA, college GPA, and scores on college entrance exams, such as the ACT® and SAT® (for example, Ansley and Forsyth, 1983; Iowa Testing Programs, 1999; Loyd, Forsyth, and Hoover, 1980; Qualls and Ansley, 1995; Rosemeier, 1962; Scannell, 1958; Wood and Ansley, 2008). The Guide for Research and Development, Forms A and B includes the details of these studies.
More recently, Furgol, Fina, and Welch (2011) investigated the relationship between performance on the Iowa Assessments and college admissions test scores in a matched longitudinal cohort of more than 25,000 students in grades 5 through 11 who tested annually over a five-year period. Evidence of a strong relationship between Iowa Assessments scores and the ACT composite score suggests that the Iowa Assessments and college readiness measures assess the same achievement domains. As shown in Figure 2, this relationship sustains itself and strengthens from grades 5 to 11.
Figure 2: Correlations Between Iowa Assessments and ACT Composite Scores
Furgol et al. (2011) also reported correlations between ACT and Iowa Assessments subject-area test scores for approximately 18,000 students in grades 8–11. The correlations are reported in Table 10.
Table 10: Correlations Between ACT and Iowa Assessments Subject-Area Test Scores
Grade Reading English Math Science
8 0.74 0.72 0.75 0.60
9 0.75 0.76 0.74 0.65
10 0.72 0.79 0.75 0.67
11 0.75 0.76 0.76 0.68
Each correlation in the table is based on the students who have both an ACT score in the subject area of interest and an Iowa Assessments score in both the subject area and grade of interest. These correlations are generally highest in grade 11, ranging from 0.68 (Science) to
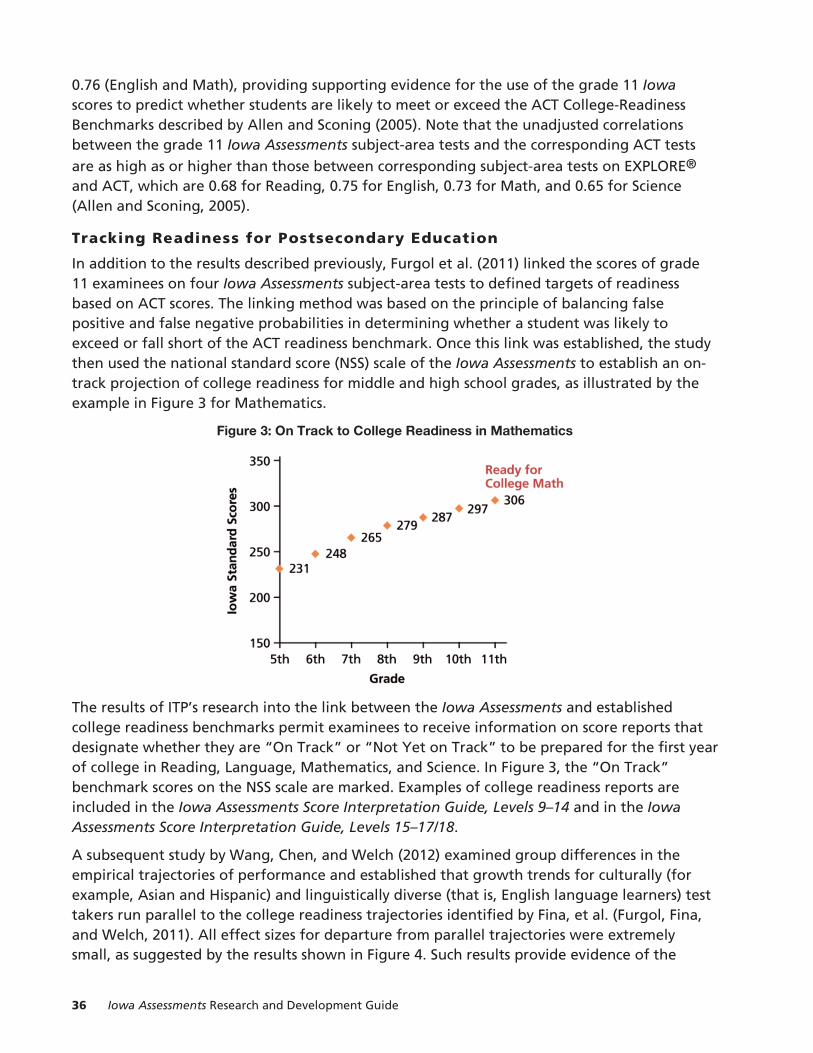
36 Iowa Assessments Research and Development Guide
0.76 (English and Math), providing supporting evidence for the use of the grade 11 Iowa scores to predict whether students are likely to meet or exceed the ACT College-Readiness Benchmarks described by Allen and Sconing (2005). Note that the unadjusted correlations between the grade 11 Iowa Assessments subject-area tests and the corresponding ACT tests are as high as or higher than those between corresponding subject-area tests on EXPLORE® and ACT, which are 0.68 for Reading, 0.75 for English, 0.73 for Math, and 0.65 for Science (Allen and Sconing, 2005).
Tracking Readiness for Postsecondary Education
In addition to the results described previously, Furgol et al. (2011) linked the scores of grade 11 examinees on four Iowa Assessments subject-area tests to defined targets of readiness based on ACT scores. The linking method was based on the principle of balancing false positive and false negative probabilities in determining whether a student was likely to exceed or fall short of the ACT readiness benchmark. Once this link was established, the study then used the national standard score (NSS) scale of the Iowa Assessments to establish an on-track projection of college readiness for middle and high school grades, as illustrated by the example in Figure 3 for Mathematics.
Figure 3: On Track to College Readiness in Mathematics
The results of ITP’s research into the link between the Iowa Assessments and established college readiness benchmarks permit examinees to receive information on score reports that designate whether they are “On Track” or “Not Yet on Track” to be prepared for the first year of college in Reading, Language, Mathematics, and Science. In Figure 3, the “On Track” benchmark scores on the NSS scale are marked. Examples of college readiness reports are included in the Iowa Assessments Score Interpretation Guide, Levels 9–14 and in the Iowa Assessments Score Interpretation Guide, Levels 15–17/18.
A subsequent study by Wang, Chen, and Welch (2012) examined group differences in the empirical trajectories of performance and established that growth trends for culturally (for example, Asian and Hispanic) and linguistically diverse (that is, English language learners) test takers run parallel to the college readiness trajectories identified by Fina, et al. (Furgol, Fina, and Welch, 2011). All effect sizes for departure from parallel trajectories were extremely small, as suggested by the results shown in Figure 4. Such results provide evidence of the
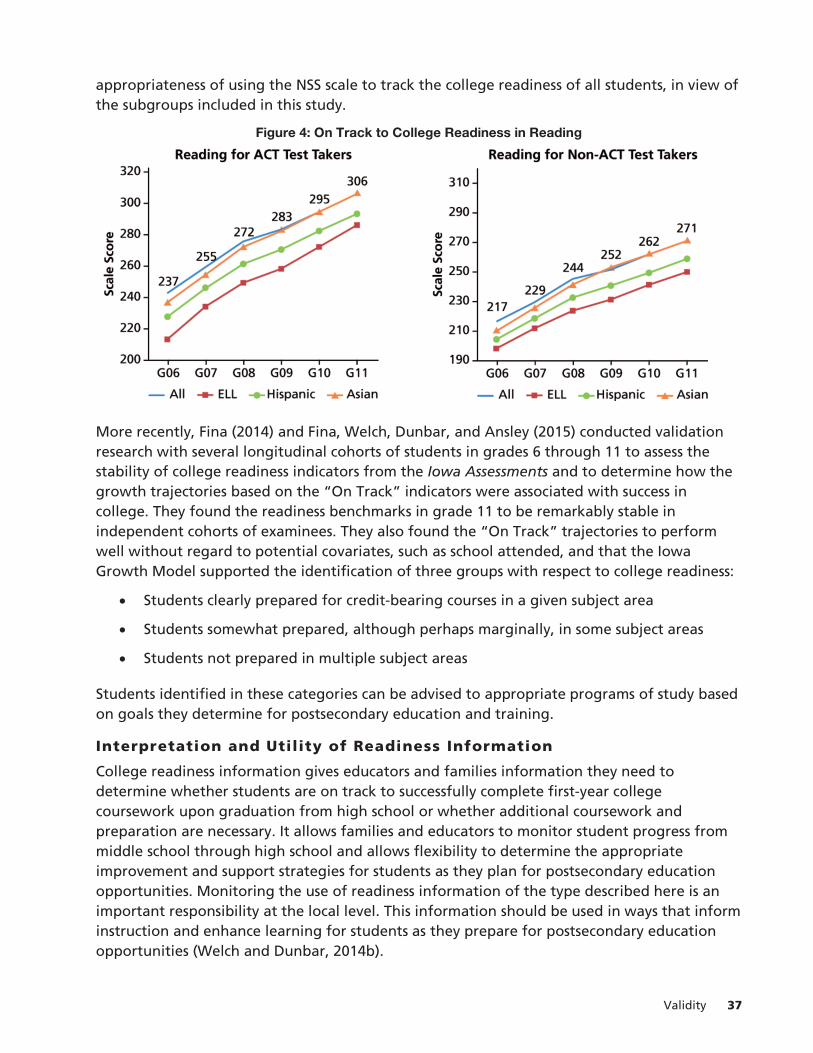
Validity 37
appropriateness of using the NSS scale to track the college readiness of all students, in view of the subgroups included in this study.
Figure 4: On Track to College Readiness in Reading
More recently, Fina (2014) and Fina, Welch, Dunbar, and Ansley (2015) conducted validation research with several longitudinal cohorts of students in grades 6 through 11 to assess the stability of college readiness indicators from the Iowa Assessments and to determine how the growth trajectories based on the “On Track” indicators were associated with success in college. They found the readiness benchmarks in grade 11 to be remarkably stable in independent cohorts of examinees. They also found the “On Track” trajectories to perform well without regard to potential covariates, such as school attended, and that the Iowa Growth Model supported the identification of three groups with respect to college readiness:
• Students clearly prepared for credit-bearing courses in a given subject area
• Students somewhat prepared, although perhaps marginally, in some subject areas
• Students not prepared in multiple subject areas
Students identified in these categories can be advised to appropriate programs of study based on goals they determine for postsecondary education and training.
Interpretation and Utility of Readiness Information
College readiness information gives educators and families information they need to determine whether students are on track to successfully complete first-year college coursework upon graduation from high school or whether additional coursework and preparation are necessary. It allows families and educators to monitor student progress from middle school through high school and allows flexibility to determine the appropriate improvement and support strategies for students as they plan for postsecondary education opportunities. Monitoring the use of readiness information of the type described here is an important responsibility at the local level. This information should be used in ways that inform instruction and enhance learning for students as they prepare for postsecondary education opportunities (Welch and Dunbar, 2014b).

38 Iowa Assessments Research and Development Guide
Validity in the Assessment of Growth Score interpretations that provide for the assessment of student growth over time are an important aspect of large-scale assessment in education. The measurement of growth through the Iowa Assessments is based on the Iowa Growth Model and the underlying vertical scale used in reporting, the NSS scale. Vertical scaling is the term used for the process of linking assessments to describe student growth over time. Although the methods can be complex, the goal is quite simple: to create a framework and metric for reporting the educational development of individuals and groups. The challenge of vertical scaling of assessments has existed since the first use of standards-based assessments to measure individual and group progress (Patz, 2007), and it has a history that predates that work. Today vertical scaling is needed for assessments of growth toward college and career readiness standards and for adaptive testing. In these applications, comparative information about results from assessments of different levels of difficulty is needed to build a vertical scale.
Assembling test forms with an evidence-based approach to growth on established content standards is a key element in vertical scaling. The methods used to build a vertical scale will work as intended only if the assessment being scaled yields meaningful and stable changes in measured achievement across time. Assessments that are matched to content standards that are not vertically aligned across grades or that reflect an overly granular approach to domain definitions and content specifications may show irregular patterns of growth across grades for both individuals and groups. Worse yet, such assessments will not support meaningful use of the term growth to describe changes in scores over time (Kapoor, 2014).
The conceptual framework for a vertical scale is established when the content standards and learning progressions of the achievement domain are determined. In developing vertical scales for the Iowa Assessments, special assessments were designed in each content area based on prevailing sets of standards. These assessments were wide-range achievement tests consisting of items that spanned multiple grade levels to provide comparative information about the expected performance of students at different developmental levels of the content-area learning continuum. Comparative results on the special assessments administered across grades were used to define the range of student performance within each grade level and the amount of overlap between the distributions of student scores at different grade levels. Finally, a numerical scale that described the growth pattern observed on the special assessments was determined, resulting in the NSS scale.
The growth model for Mathematics in grades 3 through 6 is illustrated in Figure 5. In the figure, each unit on the NSS scale is associated with a specific achievement level in each grade. From the plot, one can determine, for example, the percentage of students scoring at or below an NSS of 185 in grade 3 (about 75) and that the equivalent achievement level in grade 4 corresponds to an NSS of about 204. Starting at 185 and following the lines, the model says a student in grade 3 who scores 185 in math is expected to score 204 in grade 4, other things being equal. Similar relationships between NSS scores at multiple grade levels provide a comprehensive framework for determining growth expectations, comparing those expectations to observed growth, and describing the value added or response to intervention resulting from students’ instructional programs and learning experiences.

Validity 39
Figure 5: Standard Score Growth Model of the Iowa Assessments (Mathematics)—The NSS Scale
Description and Primary Interpretation of the NSS Scale
The NSS scale is a metric that ranges numerically from 80 to 400 and spans a developmental continuum from kindergarten to grade 12 in major content domains, such as reading, mathematics, science, social studies, and written expression.
National research studies in the 2010–2011 school year were conducted to validate the reference points on the NSS scale that represent the medians for each grade level and the model-based inferences about the amount of growth typical of students at different achievement levels. The primary interpretations supported by the NSS scale have to do with (1) how much a student is growing from one assessment occasion to the next compared to his or her assessment peers (a relative growth interpretation) and (2) how much growth would be expected for this student’s assessment peers (a normative growth interpretation). This basic information about growth can be used for a variety of purposes in student and program evaluation, such as individual and group decisions about instructional interventions and responses to interventions that can be gauged by the amount of growth achieved.
Validity Framework and Statistical Foundation of Growth Metrics
The validity framework for a growth model involves fundamental considerations about the content of the assessments used to measure growth; the scale and modeling requirements; the definition of targets that represent typical grade-level performance or other benchmarks, such as college readiness; and the utility of information leading to sound interpretations of student growth and effective decisions about enhancing growth for individuals and groups. Camara (2013) and Kapoor (2014) discuss some of these aspects of validation for growth.
Validity
In the context of achievement over time, validity pertains to evidence that supports interpretations relative to growth. With the assessment imperative of college and career readiness at the forefront of efforts to reform education, a critical aspect of validity arguments for related claims involves the underlying model used to measure and report growth and change. Psychometric frameworks for quantifying growth are evolving rapidly (e.g., Betebenner, 2010; Castellano and Ho, 2013; Reardon and Raudenbush, 2009). For any growth model, validity considerations encompass evidence that ranges from the content

40 Iowa Assessments Research and Development Guide
definition of the domain to the utility of growth reports. Regardless of the approach to growth, general validation concerns remain. Table 11 summarizes several of these issues as they pertain to a validity framework for growth.
Table 11: Examples of Validity Evidence Related to the Measurement of Growth
Validity Evidence Consideration for Growth
Content validity evidence
Content-related validity evidence is tied to test development. The proposed interpretations of growth and readiness should guide the development of a test and the inferences leading from the test scores to conclusions about a student’s readiness.
Content alignment studies will serve as the foundation for a trail of evidence needed for establishing the validity of growth and readiness tracking and reporting.
Alignment studies will inform the interpretation of growth and readiness research findings from the statistical relationship studies and shape assessments that are making the claim to identify students who are on track.
Scale requirements Scales or linking studies that allow for the longitudinal estimation and tracking of growth are a necessity in the present context. The scales need to be anchored in terms of both content and student performance within and between grades.
Definition of targets Targets must exist that quantify the level of growth expected, observed, and desired for a given period of time (that is, fall-to-spring testing; year-to-year testing).
For college readiness, targets must also exist that quantify the level of achievement where a student is ready to enroll and succeed in credit-bearing, first-year postsecondary courses. To date, these targets are currently defined by the ACT Benchmarks, by the College Board Readiness Index, or by individual institutions of higher education.
Collection of concurrent validity evidence
Many tests will claim to measure college readiness, but a plan must be in place for validating that claim. Validity studies should be conducted to determine the relationship between the assessments and the indicators of readiness, including the content of entry-level college courses.
Utility A primary goal of this information is that students, K–12 educators, policymakers, and higher-education representatives can use it to better understand the knowledge and skills necessary for college readiness in English language arts and mathematics. The information must be easily understandable and actionable by a broad range of audiences.
Developing a domain and model for growth begins with defining content standards that describe continuous learning. Discrete, granular descriptions of content that are the objectives of small instructional units in, for example, signed-number arithmetic, may be useful in tracking progress toward small unit objectives, but they may not be the best focus for an assessment of growth being used to track progress across large spans of time, such as grade-to-grade growth over the elementary school years, sometimes called a learning continuum or progression (Welch and Dunbar, 2014b). The five stages of development in reading (Chall, 1996) are a good example of a learning continuum—there is an underlying construct and a progression that describes how children change from “learning to read” to “reading to learn.” In this sense, the learning continuum constitutes a broad definition of the achievement
Validity 41
domain and what it means to “grow” with respect to important content standards or guideposts of the domain. The important point is that measuring growth requires test design and development that keeps the focus on the domain (Koretz and Hamilton, 2006).
Assessing a child’s growth on a learning continuum requires measures aligned to broad content standards and a level of cognitive complexity appropriate for that child’s stage of development. Developmental appropriateness is (1) guided by research and practice in the achievement domain (for example, the major domains of the Common Core State Standards in English language arts) and (2) established through extensive field testing of assessment materials in multiple grades. Valid and reliable measurement of growth requires both.
The importance of field testing in multiple grades was underscored recently in Kapoor (2104), who compared growth statistics derived from assessments with and without items common to adjacent grade levels. She found that common items across grades could be used to evaluate the capability of an assessment to provide growth information to examinees as well as to inform test developers about the construction of tests well-suited to growth measurement. Measures of growth in different metrics (for example, student growth percentiles versus percentile ranks of residuals) were much more highly correlated for assessments with a common item structure. When a field test design administers the same items in multiple grades, item analysis statistics can include measures that differentiate items with respect to growth sensitivity. Growth-sensitive items included in final forms promote the use of scores on those forms for the measurement of growth for individuals and groups.
Statistical Foundation
The NSS scale of the Iowa Assessments quantifies and describes student growth over time via a growth metric. One of the defining attributes of the growth metric is that the projection of subsequent performance can be made conditional on prior performance through the vertical scale (Furgol, Fina, and Welch, 2011). The expected NSS scores for each grade level and content area on the Iowa Assessments show the relative standing of students’ achievement within the score distribution of students in a national probability sample (Hoover et al., 2003).
Many tests used to measure yearly growth are vertically aligned and scaled. This means that each successive test level builds upon the content and skills measured by the previous test level. It assures that tests taken over multiple grade levels show a coherent progression in learning. The design frameworks for these tests incorporate several defining technical characteristics (Patz, 2007), including:
• an increase in difficulty of associated assessments across grades
• an increase in scale score means with grade level
• a pattern of increase that is regular and not erratic
Assessing annually does not necessarily mean that the change in scores reflects a year’s growth in student achievement. That is where vertical scaling adds interpretive value: tests are developed for different grade levels—for example, for grades 4 and 5—but reported on the same scale. This way, educators are assured that a change in scores represents a change in student achievement instead of differences in the tests themselves.

42 Iowa Assessments Research and Development Guide
Growth Metrics
Growth metrics that allow for the longitudinal estimation and tracking of growth are a necessity. The metrics need to be anchored in terms of both content and student performance within and between grades. Three growth metrics are an integral part of the Iowa Growth Model, and all three are expressed in terms of the NSS scale as indicated in Table 12.
Table 12: Growth Metrics Associated with the Iowa Growth Model
Iowa Growth Metric Notation Related Terminology
Expected Growth NSS2NSS1 Estimated Growth
Observed Growth NSS2–NSS1 Gain Score
Change
Observed–Expected NSS2–(NSS2NSS1) Value-Added
Expected Growth. The relationship between national standard score (NSS) and national percentile rank (NPR) was illustrated previously in Figure 5. Relationships like the one illustrated define, for any student at any level of achievement in one grade, the expected NSS in a subsequent grade (Cunningham, Welch, and Dunbar, 2013). When a student has grown as much as expected since the previous year, this student is keeping pace with other students in the nation who started at the same achievement level. The growth chart in Figure 6 consists of a series of curves that illustrates the typical pace of performance for five different students who started in third grade at different achievement levels. For each of these students, the expected NSS for subsequent years is identified. In Table 12, the notation NSS2NSS1 (meaning NSS at time 2 given NSS at time 1) is used to represent the expected score.
Figure 6: Expected Growth Curves for Five Observed Scores (Levels 1–5)
Observed Growth. The observed growth is simply the difference between the second NSS and the first NSS. Observed growth reflects the change in a student’s performance between
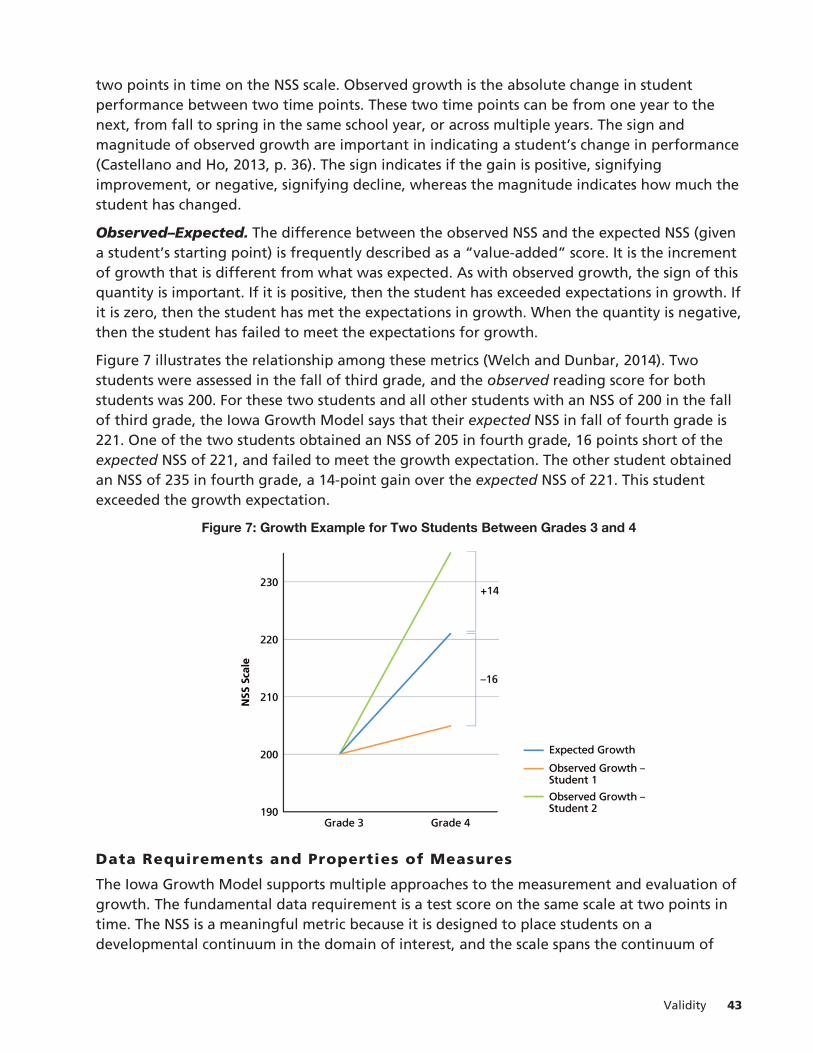
Validity 43
two points in time on the NSS scale. Observed growth is the absolute change in student performance between two time points. These two time points can be from one year to the next, from fall to spring in the same school year, or across multiple years. The sign and magnitude of observed growth are important in indicating a student’s change in performance (Castellano and Ho, 2013, p. 36). The sign indicates if the gain is positive, signifying improvement, or negative, signifying decline, whereas the magnitude indicates how much the student has changed.
Observed–Expected. The difference between the observed NSS and the expected NSS (given a student’s starting point) is frequently described as a “value-added” score. It is the increment of growth that is different from what was expected. As with observed growth, the sign of this quantity is important. If it is positive, then the student has exceeded expectations in growth. If it is zero, then the student has met the expectations in growth. When the quantity is negative, then the student has failed to meet the expectations for growth.
Figure 7 illustrates the relationship among these metrics (Welch and Dunbar, 2014). Two students were assessed in the fall of third grade, and the observed reading score for both students was 200. For these two students and all other students with an NSS of 200 in the fall of third grade, the Iowa Growth Model says that their expected NSS in fall of fourth grade is 221. One of the two students obtained an NSS of 205 in fourth grade, 16 points short of the expected NSS of 221, and failed to meet the growth expectation. The other student obtained an NSS of 235 in fourth grade, a 14-point gain over the expected NSS of 221. This student exceeded the growth expectation.
Figure 7: Growth Example for Two Students Between Grades 3 and 4
Data Requirements and Properties of Measures
The Iowa Growth Model supports multiple approaches to the measurement and evaluation of growth. The fundamental data requirement is a test score on the same scale at two points in time. The NSS is a meaningful metric because it is designed to place students on a developmental continuum in the domain of interest, and the scale spans the continuum of

44 Iowa Assessments Research and Development Guide
learning. In addition, the typical magnitude of growth from one grade to the next provides a frame of reference for comparisons of the amount of growth observed in groups of students.
Relationship to Other Growth Models
The term growth model is used in many achievement contexts, and its meaning is often ambiguous. Ostensibly different growth models may support similar or very different interpretations depending on the statistical foundation of the model and the metrics used to report its results. The results of the Iowa Growth Model have been compared to two “conditional growth” models using two large (state-level) cohorts of students between grade 5 and grade 6 and again between grade 6 and grade 7.
The first conditional growth model is based on the Student Growth Percentile (SGP) metric that describes the rank order of students in growth relative to peers with similar past test scores (Betebenner, 2009). The SGP metric relies on quantile regression and conditioning on prior achievement to describe the rank order of the current achievement of students. The second conditional growth model is based on the Percentile Rank of Residuals (PRR) metric, which is a ranking of simple differences between observed scores and scores predicted from a linear regression of the current test score on the past score in the same subject area (Castellano, 2011).
Table 13 summarizes the means, standard deviations, and sample sizes for the students in grades 5, 6, and 7 in the student cohorts used in the analysis. The mean NSSs in these cohorts represent average achievement in the neighborhood of the 55th to 60th percentile nationally, and the SDs are representative of the variability in the national probability sample of the 2010–2011 norming of the Iowa Assessments.
Table 13: Means, Standard Deviations (SD), and Sample Sizes (N) for Growth Metric Comparative Study
Grade Mathematics Reading
Mean NSS SD N Mean NSS SD N Grade 5 222 24.6 23,452 225 28.6 23,511 Grade 6 232 28.3 27,024 231 32.0 27,046 Grade 7 250 30.6 24,024 245 34.2 27,046
The correlations across grades for the Mathematics and Reading assessments are provided in Table 14. These values are typical of correlations in matched cohorts on assessments that measure a well-defined general achievement construct. They are in the neighborhood of values obtained for test-retest reliability and provide strong support for the quantile and linear regressions needed to obtain SGPs and PRRs as indicators of growth.
Table 14: Correlations Between Years in Mathematics and Reading
Grade Mathematics Reading
Grade 5 Grade 6 Grade 7 Grade 5 Grade 6 Grade 7
Grade 5 1.00 – – 1.00 – – Grade 6 .84 1.00 – .79 1.00 – Grade 7 .81 .85 1.00 .77 .80 1.00
Comparisons between the results from the Iowa Growth Model and the SGP and PRR

Validity 45
approaches are provided in Table 15 in terms of correlations between growth indicators. These correlations describe the consistency with which the Iowa Growth Model ranks student growth as compared with the SGP and PRR metrics. In both Mathematics and Reading, these results show that the Iowa Growth Model produces measures of student growth that are virtually identical to those of the other growth metrics.
Table 15: Correlations Between Iowa Growth Model, SGP, and PRR Metrics
Iowa Growth Model
Mathematics Reading
Student Growth Percentile 0.98 0.97 Percentile Rank of Residuals 0.99 0.97
Concurrent Validity Concurrent validity coefficients are presented in the form of correlations between scores on the Iowa Assessments Form E and (1) scores on Cognitive Abilities Test (CogAT) Form 7 (Table 16) and (2) scores on the Iowa Tests of Basic Skills (ITBS®) and Iowa Tests of Educational Development® (ITED®) Form A (Table 17).
Form E/CogAT Correlations
It is clear from these tables that the highest correlation (with the exception of the Mathematics tests) is provided by the CogAT Composite score or the score from the Verbal Battery. The lowest correlations, indicating the least overlap between achievement and the cognitive skills measured, tend to involve the skills tests in the Iowa Assessments (for example, Computation and certain tests in the primary levels and grades) and the CogAT Form 7 Nonverbal Battery. One interpretation of the lower correlations in Table 16 is that they represent evidence of discriminant validity.
Average correlations with the Iowa Assessments Levels 5/6–17/18 Complete Composite and CogAT Form 7 are 0.77 for the Verbal Battery, 0.71 for the Quantitative Battery, 0.64 for the Nonverbal Battery, and 0.80 for the CogAT Form 7 Composite. Clearly, the relationship is substantial in all cases; however, the correlations are not so high as to suggest that the achievement and ability measures lack discriminant validity.

46 Iowa Assessments Research and Development Guide
Table 16: Iowa Assessments Form E and CogAT Form 7 Correlations
Level (Grade)
N CogAT R V CW WE ET WA Li M CP MT CT SS SC CC
5/6 (1) 1,527 Verbal .42 .48 – .53 .60 .47 .53 .58 – – – – – .64 Quantitative .41 .36 – .46 .52 .42 .44 .56 – – – – – .59 Nonverbal .40 .35 – .46 .51 .42 .45 .55 – – – – – .58 Composite .47 .44 – .54 .61 .50 .53 .64 – – – – – .68
7 (1) 1,557 Verbal .47 .43 – .59 .63 .47 .52 .59 – – – – – – Quantitative .44 .30 – .50 .54 .42 .43 .56 – – – – – – Nonverbal .43 .32 – .50 .53 .44 .42 .54 – – – – – – Composite .51 .40 – .61 .64 .50 .52 .63 – – – – – –
8 (2) 3,057 Verbal .56 .54 – .58 .62 .54 .54 .63 .48 .64 .68 .54 .50 .69 Quantitative .49 .48 – .53 .55 .51 .44 .60 .52 .62 .63 .38 .39 .60 Nonverbal .52 .48 – .54 .57 .54 .48 .59 .50 .61 .64 .45 .46 .63 Composite .58 .56 – .61 .65 .60 .55 .68 .55 .70 .72 .52 .50 .72
9 (3) 2,096 Verbal .73 .73 .66 .69 .80 .65 .52 .68 .42 .67 .80 .70 .67 .81 Quantitative .56 .56 .60 .57 .66 .54 .42 .67 .51 .70 .73 .56 .54 .72 Nonverbal .55 .53 .51 .53 .60 .51 .43 .63 .45 .64 .66 .56 .53 .66 Composite .69 .68 .66 .67 .77 .63 .51 .74 .51 .75 .81 .68 .65 .81
10 (4) 2,814 Verbal .77 .76 .69 .71 .81 – – .73 .51 .72 .82 .74 .73 .83 Quantitative .64 .61 .63 .62 .69 – – .75 .59 .77 .76 .64 .65 .75 Nonverbal .59 .56 .56 .58 .63 – – .68 .48 .67 .68 .60 .61 .69 Composite .75 .72 .70 .71 .79 – – .81 .58 .80 .84 .74 .74 .84
11 (5) 2,826 Verbal .78 .77 .71 .74 .82 – – .73 .50 .72 .82 .75 .76 .84 Quantitative .63 .60 .65 .64 .70 – – .76 .61 .78 .77 .62 .62 .75 Nonverbal .58 .53 .56 .58 .63 – – .68 .49 .68 .69 .58 .60 .69 Composite .75 .72 .74 .74 .80 – – .81 .59 .81 .85 .73 .74 .85
12 (6) 2,444 Verbal .78 .79 .67 .74 .82 – – .71 .49 .69 .80 .73 .73 .82 Quantitative .60 .59 .63 .63 .68 – – .77 .64 .78 .76 .58 .62 .74 Nonverbal .53 .52 .54 .56 .60 – – .64 .46 .63 .64 .48 .52 .62 Composite .73 .73 .70 .73 .80 – – .79 .56 .78 .83 .66 .68 .82
13 (7) 1,864 Verbal .76 .74 .64 .69 .78 – – .66 .41 .63 .77 .67 .67 .78 Quantitative .61 .52 .62 .61 .67 – – .77 .59 .78 .76 .56 .59 .74 Nonverbal .51 .46 .52 .52 .57 – – .64 .46 .63 .64 .48 .52 .62 Composite .73 .67 .68 .70 .78 – – .79 .56 .78 .83 .66 .68 .82
14 (8) 1,895 Verbal .76 .77 .66 .70 .79 – – .69 .50 .68 .78 .71 .70 .80 Quantitative .62 .56 .64 .63 .68 – – .79 .63 .79 .78 .57 .61 .75 Nonverbal .58 .52 .55 .55 .61 – – .68 .53 .68 .68 .53 .59 .67 Composite .75 .71 .70 .72 .79 – – .82 .63 .82 .85 .69 .72 .85
15 (9) 1,940 Verbal .72 .75 – .66 .78 – – .63 .51 .66 .77 .66 .66 .79 Quantitative .56 .53 – .56 .62 – – .67 .65 .74 .73 .53 .56 .71 Nonverbal .47 .46 – .51 .55 – – .58 .52 .62 .63 .47 .51 .62 Composite .68 .69 – .68 .76 – – .74 .64 .78 .82 .65 .68 .82
16 (10) 2,002 Verbal .71 .68 – .68 .76 – – .63 .47 .63 .74 .63 .63 .75 Quantitative .58 .5 – .60 .67 – – .69 .63 .74 .75 .56 .58 .74 Nonverbal .54 .50 – .55 .59 – – .62 .53 .65 .67 .52 .56 .66 Composite .70 .66 – .70 .77 – – .73 .62 .77 .82 .65 .67 .82
17/18 (11) 2,188 Verbal .65 .69 – .64 .70 – – .59 .47 .60 .70 .64 .64 .72 Quantitative .55 .51 – .58 .60 – – .65 .62 .70 .70 57 .57 .68 Nonverbal .49 .47 – .50 .53 – – .57 .49 .58 .60 .48 .52 .59 Composite .65 .64 – .66 .70 – – .69 .61 .72 .77 .65 .67 .77
Iowa Assessments Form E and ITBS/ITED Form A Correlations
As part of the National Comparison Study, some students were administered both Form E of the Iowa Assessments and Form A of the ITBS or ITED. These data were used to link NSSs on the two forms and to examine the strength of the relationship between forms. Studies of

Validity 47
internal structure discussed earlier and detailed in Chen, Welch, and Dunbar (2013) suggest a certain degree of comparability in underlying achievement constructs. The concurrent validity coefficients from the matched Form E and Form A data are reported in Table 17. In English language arts and mathematics, the coefficients are generally in the .75 to .85 range except at grades 1 and 2, where they tend to be slightly lower. Students taking alternate forms of the Iowa Assessments are rank ordered in a highly similar fashion, suggesting that when administrative conditions are monitored appropriately, the Iowa Assessments produce scores that are dependable in the sense that they are minimally affected by factors beyond the control of test administrators.
Table 17: Iowa Assessments Form E and ITBS/ITED Form A Correlations
Test Level (Grade) N R L M SS SC V SP CP PC MC WA Li
Level 7 (Grade 1) 1,738 .86 .77 .79 .63 .60 .83 – – – .70 .72 .68
Level 8 (Grade 2) 1,068 .81 .82 .84 .61 .66 .78 – – – .70 .75 .66
Level 9 (Grade 3) 965 .84 .79 .83 .79 .74 .83 .78 .75 .72 .77 .72 .58
Level 10 (Grade 4) 2,072 .82 .79 .84 .76 .76 .84 .83 .76 .77 .75 – –
Level 11 (Grade 5) 2,084 .82 .81 .84 .79 .78 .83 .82 .79 .80 .76 – –
Level 12 (Grade 6) 1,163 .83 .81 .85 .80 .75 .84 .84 .77 .78 .75 – –
Level 13 (Grade 7) 1,041 .80 .84 .86 .79 .78 .83 .84 .81 .81 .73 – –
Level 14 (Grade 8) 1,184 .84 .84 .89 .80 .74 .86 .86 .81 .84 .76 – –
Level 15 (Grade 9) 784 .72 .77 .75 .76 .70 .78 – – – .61 – –
Level 16 (Grade 10) 583 .76 .84 .78 .75 .78 .85 – – – .61 – –
Level 17/18 (Grade 11) 704 .58 .61 .51 .62 .55 .77 – – – .62 – –
Note: Tests with blank cells are not given in the levels in which the blank cells appear.
Other Validity Considerations Universal Design
The principles of universal design for assessments provide guidelines for the test development process intended to ensure that no test takers are unduly disadvantaged owing to a special need, incomplete language mastery, or membership in any demographic group. Universal design in the development of assessment materials involves aspects of presentation in both paper-based and computer-based modes of administration to enhance accessibility and clarity for all examinees. Universal design principles are not intended to make any test easier for a given subgroup but only to remove the effects of construct-irrelevant variance on test scores. Ease of navigation of test materials; clarity of typeface, graphics, and page layout; and respect for the diversity of the test-taking population in the nature of the materials presented are some examples of universal design principles for assessments (Johnstone, Thompson, Bottsford-Miller, and Thurlow, 2008).
48 Iowa Assessments Research and Development Guide
An independent, comprehensive universal design review of page layouts, color schemes, and other factors in the design and presentation of materials for the Iowa Assessments was conducted by the National Center of Educational Outcomes (NCEO) at the University of Minnesota. A review panel consisting of experts in fields such as special education, English language learning, assessment of students with special needs, and education in urban areas produced a report that helped guide final decisions in the publication of the Iowa Assessments. This review was conducted prior to the National Comparison Study and the development of norms and score conversions from the 2010–2011 national probability sample.
Color Blindness
Informational graphics for the final publication of the Iowa Assessments were subject to a thorough composition check to ensure coherency and effective color contrast for students with a color vision deficiency. Art was processed through a color-blindness simulator that emulates red-blind, green-blind, and blue-blind conditions (protanopia, deuteranopia, and tritanopia, respectively). If required, color was adjusted and then resubmitted to the simulator for validation.
Graphics were validated as acceptable for color-blind students using Vischeck (http://www.vischeck.com). Vischeck is an online or downloadable color-blindness simulator that renders images as they would appear to individuals with protanopia, deuteranopia, or tritanopia. Using these simulations as a guide, any art requiring modification was revised by choosing patterns and/or color contrast that were acceptable for individuals with a color vision deficiency. All revised art and graphics were retested using Vischeck to ensure that color contrast was sufficient for the simulated conditions.
Text Complexity and Readability
The best way to determine the difficulty of a large-scale assessment is to examine item and test data that indicate the average levels of performance obtained by the examinees for whom the assessment is intended. The difficulty data for items, skill domains, and tests in the Iowa Assessments are reported in Content Classifications Guide for Levels 5/6–14 and Levels 15–17/18. Of the various factors that influence difficulty, text complexity, sometimes called readability, is the focus of much attention.
The readability of written materials is measured in several ways. An expert may judge the grade level of a reading passage based on perception of its complexity. The most common method of quantifying these judgments is to use one of an ever-expanding array of text complexity or readability algorithms (see Nelson, Perfetti, Liben, and Liben, 2012, for a review and comparison of text complexity measures). These measures use word frequency, word and sentence length, and other features of text (for example, unusual letter patterns, subordination, sentence cohesion, and so forth) and usually produce a single measure of text complexity or readability for each block of text analyzed. Nelson et al. (2012) found “impressively high” (p. 3) correlations between all the measures they studied and student performance on the standardized tests from which they drew text for the analysis. This finding suggests that test assembly practices that use item difficulty data from field testing to gauge the appropriateness of assessment materials for a given grade level simultaneously monitor text complexity such that it is appropriate for the range of reading levels in the student population.

Validity 49
The virtue of text complexity formulas is objectivity. Their shortcoming is failure to account for qualitative factors that influence how easily a reader comprehends written material. Such factors may include the organization and cohesiveness (some approaches include these elements) of a selection, cognitive complexity of the concepts presented, amount of knowledge a reader is expected to bring to the selection, clarity of new information, or interest level of the material to its audience. These other factors are likely to influence student performance on assessments, so empirical measures of item and test difficulty remain an important aspect of any evaluation of text complexity or readability.
Review of Materials for the Iowa Assessments. Consistent with the recommendations of the Common Core State Standards, three different dimensions are used to describe the text complexity of the Iowa Assessments in the areas of reading, language arts, social studies, and science. These dimensions are qualitative, quantitative, and reader/task oriented in nature; Table 18 on the next page summarizes the type of information available to help evaluate each dimension. All three dimensions are equally important in the assembly of operational forms; they are used to provide a range of text complexity within a form and across forms to help ensure that the forms are as comparable as possible.
All text-based materials are reviewed by testing specialists and by asking content experts to evaluate the four different aspects of the qualitative dimension, including level of meaning or purpose, structure, language conventionality, and clarity. Each test form is assembled to include a balance of the range of these dimensions. For example, Form E was assembled to include a range of text types of increasing complexity and sophistication as the test level increased. The quantitative dimensions are evaluated through a combination of text-based indices (for example, Lexiles and traditional readability indices) and national passage-based statistics that address the relative difficulty of these materials for examinees in the intended grade. In addition, all passages were reviewed as they were developed and selected for accessibility, appropriateness of test complexity, and interest level.

50 Iowa Assessments Research and Development Guide
Table 18: Text Complexity Considerations
Dimension Considerations for Iowa Assessments
Qualitative Dimension
Test Reading Written Expression
Social Studies
Science
Levels of Meaning or Purpose
Includes a variety of literary and informational texts from simple meaning to multiple meanings
Includes a variety of literary and informational texts from explicitly stated to implicitly stated
Structure Includes a variety of texts from simple to highly complex
Includes a variety of texts from simple to highly complex
Graphics and figures range from simple to complex.
Graphics and figures range from simple to complex.
Language Conventionality and Clarity
Texts rely on a range of language conventionality and clarity from literal to figurative. Texts are balanced to represent this range within each assembled form.
Knowledge Demands
No assumptions about readers’ life experiences
No assumptions about readers’ life experiences
Background content knowledge assumed
Background content knowledge assumed
Quantitative Dimension
• Lexile scores for all text-based stimuli aligned to grade-level ranges established by MetaMetrics
• Traditional readability indices for all text-based stimuli based on word length, frequency, and complexity
• Item-level and form-level difficulty indices collected from a nationally representative sample of students in grades K–12
Reader and Task Considerations
• Student difficulty levels collected on nationally representative samples of students in relevant grades
• Professional judgments from educators on the appropriateness of the passages and stimuli included in the assembled forms
Use of Assessments to Evaluate Instruction
To raise the question of evaluating curriculum and instruction is to confront one of the most difficult problems in assessment. Assessment programs do not exist in a vacuum; there are many audiences for assessment data and many stakeholders in the results. Districts and states may consider using the Iowa Assessments as part of their evaluation of instruction. Assessment information provides a partial view of effective teaching. The word “partial” deserves special emphasis because the validity of using tests to evaluate teachers and programs hinges on it (Dunbar, 2008).

Validity 51
Large-scale assessments are concerned with broad domains and core content. They rely on domain sampling and on coverage appropriate for many schools, not just those that use, for example, a particular intervention program or teaching approach. Effective use of the Iowa Assessments requires recognition of this aspect of their design and purpose, and valid interpretations of their results are enhanced by a balanced approach to a district- or state-level assessment program. Important outcomes of instructional programs and efforts of teachers should be considered broadly in the process of evaluation, and multiple sources of information should be brought to bear on evaluation designs (e.g., Cunningham, 2014; Koretz and Hamilton, 2006; Phillips and Camara, 2006; Braun, Chudowsky, and Koenig, 2010).

52 Iowa Assessments Research and Development Guide

Scaling, Norms, and Equating 53
Part 5 Scaling, Norms, and Equating
In Brief Defining the frame of reference to describe and report educational development is the fundamental challenge in educational measurement. Some educators are most interested in determining the developmental level of students, seeking to describe achievement as a point on a continuum that spans the years of schooling. Student growth and setting goals for future performance are their primary interests. Others are concerned with understanding the strengths and weaknesses of individual students across the entire school curriculum, seeking information that can be used to design instructional programs and address areas of concern. Still others want to know whether students satisfy certain standards of performance and proficiency in various achievement domains. Each of these educators may share a common purpose for assessment, but each would require different frames of reference for reports of results, ones that convey precisely the kind of information that supports the intended uses of test scores.
This part of the guide describes procedures used for scaling, norming, and equating the Iowa Assessments. Scaling methods define longitudinal score scales for measuring growth in achievement. Norming methods estimate national performance and long-term trends in achievement and provide a basis for measuring strengths and weaknesses of individuals and groups. Equating methods establish comparability of scores on parallel forms of the tests. Together these techniques produce trustworthy scores that satisfy the demands of a variety of users and of professional test standards (AERA, APA, and NCME, 2014).
Comparability of Developmental Scores Aacross Levels The foundation of any developmental scale of educational achievement is the definition of grade-to-grade overlap in the achievement domain of interest. Students vary considerably within any given grade in the kinds of cognitive tasks they can perform. For example, some students in the third grade can solve problems in mathematics that are difficult for the average student in the sixth grade. Conversely, some students in sixth grade read no better than the average student in third grade. Grade-to-grade overlap in the distributions of cognitive skills is thus basic to any developmental scale that purports to measure growth in achievement over time. Such overlap is sometimes described in terms of the ratio of variability within grade to variability between grades. As this ratio increases, the amount of grade-to-grade overlap in the achievement domain increases.
The problems of longitudinal comparability of tests and vertical scaling of test scores have existed since the first use of achievement test batteries in measuring educational progress, and they remain a challenge today. The equivalence of scores from the various levels of a developmental achievement test series is of special concern in assigning levels appropriate for individualized assessment applications, such as adaptive testing, or an assessment with a

54 Iowa Assessments Research and Development Guide
multilevel design, such as the Iowa Assessments. For example, it is important that a standard score of 200 earned on Level 10 be comparable to the 200 earned on any other level.
Each test in Levels 5/6 through17/18 of the Iowa Assessments is a single continuous test representing a range of educational development from kindergarten through grade 12, consistent with the definition of the learning continuum in each achievement domain. Each test in the original forms was organized as multiple, overlapping levels. During the 1970s, the assessments were extended downward to kindergarten by the addition of Levels 5/6–8 of the Primary Battery. Beginning in 1992, the Iowa Tests of Basic Skills (ITBS), Levels 5/6–14, were jointly standardized with the Iowa Tests of Educational Development (ITED), Levels 15–17/18. A common developmental scale was needed to relate the scores from each level to the other levels. The vertical scaling process established the relationships among the raw score scales for the various levels and related the raw score scales to a common developmental scale. The scaling test method, also known as Hieronymus scaling, was used to build the developmental scale for Levels 5/6–8 and Levels 9–17/18. Hieronymus scaling is described thoroughly in Petersen, Kolen, and Hoover (1989).
The developmental scale for the Iowa Assessments maintains the properties of the scale created to link the ITBS and the ITED but has been modified slightly over the years to reflect minor changes in the amount of grade-to-grade overlap observed in the early elementary grades, particularly for tests in English language arts. Properties of the scale and its development, interpretation, and use are described in this part of the guide in the section “The Iowa Growth Model.”
Origin and Evolution of the Iowa Growth Scale
The developmental scales for the previous editions of the Iowa Assessments steadily evolved over the years of their use. The growth models and procedures used to derive the developmental scales for the ITBS Multilevel Battery (Forms 1 through 6) using Hieronymus scaling are described in the 1974 Manual for Administrators, Supervisors, and Counselors. The downward extension of the growth model to include Levels 7 and 8 is outlined in the 1975 Manual for Administrators for the Primary Battery. The further downward extension to Levels 5 and 6 in 1978 is described in the 1982 Manual for School Administrators. Over the history of these editions of the tests, the scale was adjusted periodically. This was done to accommodate new levels of the Iowa Assessments or changes in the ratio of within- to between-grade variability observed in national standardization studies and large-scale testing programs that used the Iowa Assessments.
In the 1963 and 1970 national standardization programs, minor adjustments were made in the model at the upper and lower extremes of the grade distributions, mainly as a result of changes in extrapolation procedures. During the 1970s, it became apparent that differential changes in achievement were taking place from grade to grade and from test to test. Achievement by students in the lower grades was at the same level or slightly higher during the seven-year period. In the upper grades, however, achievement levels declined markedly in language and mathematics over the same period. Differential changes in absolute level of performance increased the amount of grade-to-grade overlap in performance and necessitated major changes in the original scale score to percentile-rank relationships. Scaling

Scaling, Norms, and Equating 55
studies involving the vertical linking of levels were based on 1970–1977 achievement test scores. The procedures and the resulting changes in the growth models are described in the 1982 Manual for School Administrators.
Between 1977 and 1984, data from state testing programs and school systems across the country suggested that differential changes in achievement across grades had continued. Most of the available evidence, however, indicated that these changes differed from changes of the previous seven-year period. In all grades and test areas, achievement appeared to be increasing (cf. Koretz, 1987). Changes in median achievement by grade for 1977–1981 and 1981–1984 are documented in the 1986 Manual for School Administrators (Hieronymus and Hoover, 1986). Changes in median achievement after 1984 are described in the 1990 Manual for School Administrators, Supplement (Hoover and Hieronymus, 1990) and later in this part of this guide.
Patterns of achievement on the tests during the time periods described and subsequent to them provided convincing evidence that another scaling study was needed to ascertain the grade-to-grade overlap for future editions of the tests. Not only had test performance changed significantly, so had school curriculum in the achievement domains measured by the tests. In addition, in 1992 the ITED was to be jointly standardized and scaled with the ITBS for the first time, so developmental links between the two assessments were needed. Collectively, these factors led to the development of the Iowa Growth Model and to the National Standard Score Scale used today with the Iowa Assessments.
The Iowa Growth Model The Iowa Growth Model and the National Standard Score (NSS) Scale of the Iowa Assessments were developed as part of a national research effort. Students participated in special test administrations for purposes of scale development based on Hieronymus scaling. The scaling tests used in these administrations were wide-range achievement tests designed to represent each content domain covered in the Iowa Assessments. There was one set of scaling tests for the primary grades (kindergarten through grade 3), one set for the middle grades (grades 3 through 9), and one set for the high school grades (grades 8 through 12). The scaling tests were designed in such a way that links could be established among the three sets of tests from the data collected. During standardization, scaling tests in each content area were spiraled within classrooms to obtain nationally representative and comparable data for each subtest.
The scaling tests provided essential information about achievement differences and similarities between groups of students in successive grades. For example, the scores show how much variability there is among sixth graders in science achievement and what proportion of sixth graders achieve at a higher level in science than the typical seventh grader and at a lower level than the typical fifth grader. The study of such relationships is essential for building the developmental score scales that are used to report results from the Iowa Assessments. These are the kinds of score scales needed to monitor year-to-year growth and to estimate students’ developmental levels in such domains as reading, written expression, and mathematics. To describe the developmental continuum or learning progression in a particular achievement domain, students in several different grade levels must answer the same questions in that

56 Iowa Assessments Research and Development Guide
domain. Because of the range of item difficulty in the scaling tests, special Directions for Administration were prepared to explain to students that they would be answering some very easy questions and other very difficult questions.
The observed score distributions on the scaling tests formed the basis for defining the grade-to-grade overlap needed to establish the common developmental achievement scale for the Iowa Assessments. From each observed score distribution, an estimated distribution of true scores was obtained for every content area using the appropriate adjustment for unreliability (Mittman, 1958; Petersen et al., 1989). Based on these estimated distributions of true scores, the percentage of students in a given grade that scored higher than the median of the other grades taking that set of scaling tests was determined. This procedure provided estimates of the ratios of within- to between-grade variability that were free of chance errors of measurement and defined the magnitude of grade-to-grade overlap on the developmental continuum in each achievement domain.
The standard score-to-percentile rank relationship for each grade and content area was obtained from the empirical results from the scaling test. Given the definition of the standard score scale and the grade-by-grade percentages of students in the national standardization in a given grade above or below the medians of other grades, within-grade percentiles on the developmental scale were determined. These percentile points were then plotted and smoothed, resulting in a set of cumulative frequency distributions of standard scores for each test in each grade that represents the growth model for the Iowa Assessments. Relationships between raw scores on each test and the corresponding standard scores were obtained through the percentile ranks on each scale in the weighted national standardization sample.
Grade-to-Grade Overlap in Student Achievement
An analysis of the data derived from Hieronymus scaling that describes grade-to-grade overlap in one achievement domain, written expression, was completed. That analysis summarized the relations among grade medians for two different forms of the Iowa Assessments in two different national research studies (1984 and 2010–2011) in terms of the percentage of students in each grade that exceeded the median of the other grades. The results are reported in Table 19. Two factors account for the differences between the 1984 and 2010–2011 distributions. First, the ratio of within- to between-grade variability in student performance generally increased; that is, grade-to-grade overlap increased. Second, in the 1984 scale, the parts of the growth model below grade 3 and above grade 8 were extrapolated from the available data for grades 3–8. In the years since, scaling test data were collected that allowed the growth model to be empirically determined below grade 3 and above grade 8.
The amount of grade-to-grade overlap in the current NSS scale tends to increase steadily from kindergarten to twelfth grade. This pattern is consistent with a model for growth in achievement in which median growth decreases across grades at the same time as variability in performance increases within grades.
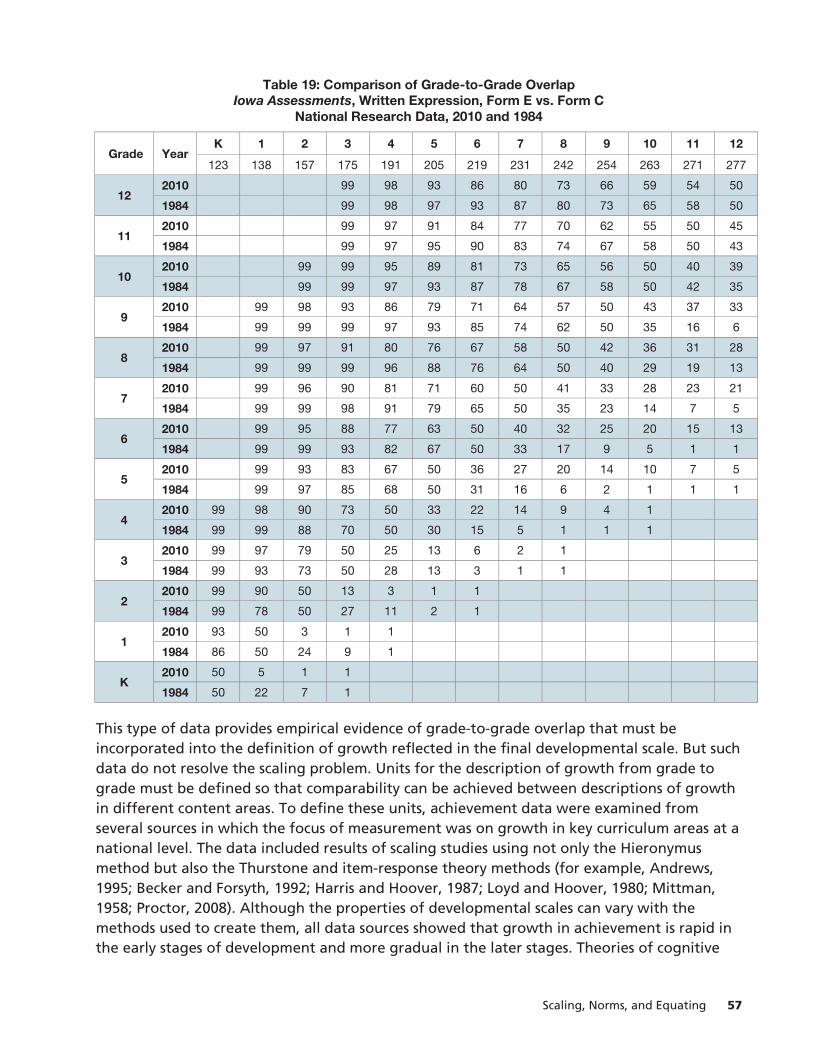
Scaling, Norms, and Equating 57
Table 19: Comparison of Grade-to-Grade Overlap Iowa Assessments, Written Expression, Form E vs. Form C
National Research Data, 2010 and 1984
Grade Year K 1 2 3 4 5 6 7 8 9 10 11 12
123 138 157 175 191 205 219 231 242 254 263 271 277
12 2010 99 98 93 86 80 73 66 59 54 50
1984 99 98 97 93 87 80 73 65 58 50
11 2010
99 97 91 84 77 70 62 55 50 45
1984 99 97 95 90 83 74 67 58 50 43
10 2010
99 99 95 89 81 73 65 56 50 40 39
1984 99 99 97 93 87 78 67 58 50 42 35
9 2010
99 98 93 86 79 71 64 57 50 43 37 33
1984 99 99 99 97 93 85 74 62 50 35 16 6
8 2010
99 97 91 80 76 67 58 50 42 36 31 28
1984 99 99 99 96 88 76 64 50 40 29 19 13
7 2010 99 96 90 81 71 60 50 41 33 28 23 21
1984 99 99 98 91 79 65 50 35 23 14 7 5
6 2010 99 95 88 77 63 50 40 32 25 20 15 13
1984 99 99 93 82 67 50 33 17 9 5 1 1
5 2010
99 93 83 67 50 36 27 20 14 10 7 5
1984 99 97 85 68 50 31 16 6 2 1 1 1
4 2010 99 98 90 73 50 33 22 14 9 4 1
1984 99 99 88 70 50 30 15 5 1 1 1
3 2010 99 97 79 50 25 13 6 2 1
1984 99 93 73 50 28 13 3 1 1
2 2010 99 90 50 13 3 1 1
1984 99 78 50 27 11 2 1
1 2010 93 50 3 1 1 1984 86 50 24 9 1
K 2010 50 5 1 1 1984 50 22 7 1
This type of data provides empirical evidence of grade-to-grade overlap that must be incorporated into the definition of growth reflected in the final developmental scale. But such data do not resolve the scaling problem. Units for the description of growth from grade to grade must be defined so that comparability can be achieved between descriptions of growth in different content areas. To define these units, achievement data were examined from several sources in which the focus of measurement was on growth in key curriculum areas at a national level. The data included results of scaling studies using not only the Hieronymus method but also the Thurstone and item-response theory methods (for example, Andrews, 1995; Becker and Forsyth, 1992; Harris and Hoover, 1987; Loyd and Hoover, 1980; Mittman, 1958; Proctor, 2008). Although the properties of developmental scales can vary with the methods used to create them, all data sources showed that growth in achievement is rapid in the early stages of development and more gradual in the later stages. Theories of cognitive

58 Iowa Assessments Research and Development Guide
development also support these general findings (Snow and Lohman, 1989). The growth model for the current edition of the Iowa Assessments was determined so that it was consistent with the patterns of growth over the history of the Iowa Assessments and with the experience of educators in measuring student growth and development.
The scale metric used for reporting Levels 5/6–17/18 results was established by assigning a score of 200 to the median performance of students in the spring of grade 4 and 250 to the median performance of students in the spring of grade 8. The table below shows the national standard scores that correspond to typical performance of grade groups on each test in Levels 5/6–17/18 in the spring of the year. The scale illustrates that average annual growth decreases as students move through the grades. For example, from grade 1 to grade 2, growth averages 18 standard-score points; from grade 7 to grade 8, growth averages 11 points; and from grade 11 to grade 12, growth averages only 5 points.
Table 20: National Standard Scores and Grade Group Performance for Spring Testing
Grade K 1 2 3 4 5 6 7 8 9 10 11 12
NSS 130 150 168 185 200 214 227 239 250 260 268 275 280
NGE K.8 1.8 2.8 3.8 4.8 5.8 6.8 7.8 8.8 9.8 10.8 11.8 12.8
The national grade-equivalent (NGE) scale for the Iowa Assessments is a monotonic transformation of the standard score scale. As with previous test forms, the NGE scale describes growth based on the typical change observed during the school year. As such, it represents a different growth model than does the standard score scale (Hoover, 1984). With NGEs, the average student ‘‘grows’’ one unit on the scale each year, by definition. As noted by Hoover, NGEs can be a readily interpretable scale for many elementary school teachers because they describe growth in terms familiar to them. NGEs become less useful during high school, when school curriculum becomes more varied and grade designations are less relevant to school curricula. Appropriate cautions always should be exercised in the interpretation and use of NGEs, however, as the metric describes only relative achievement level in a grade-indexed metric, not grade level placement in a school’s scope and sequence of instruction.
The purpose of a developmental scale in achievement testing is to permit score comparisons between different levels of a test. Such comparisons are dependable under standard conditions of test administration. In some situations, however, developmental scores (NSSs and NGEs) obtained across levels may not seem comparable. Equivalence of scores across levels in the scaling study was obtained under optimal conditions of motivation. Differences in attitude and motivation, however, may affect comparisons of results from on-level and out-of-level testing of students who differ markedly in developmental level. If students take their tests seriously, scores from different levels will be similar (except for chance errors of measurement). If students are frustrated or unmotivated because a test is too difficult, they will probably obtain scores in the ‘‘chance’’ range. But if students are challenged and motivated taking a lower level, their achievement may be measured more accurately. In this sense, appropriate assignment of test level in individualized education programs with the Iowa Assessments can have the same effect in matching student ability with item difficulty that occurs in well-designed computer adaptive testing programs.
Scaling, Norms, and Equating 59
Less precision in measurement is expected if students are assigned an inappropriate level (one that is too easy or too difficult) of the test. This results in a higher NSS or NGE on higher levels of the test than lower levels, because the standard scores and grade equivalents that correspond to ‘‘chance’’ increase from level to level. The same is true for perfect or near-perfect scores. These considerations show the importance of motivation, attitude, and assignment of test level in accurately measuring a student’s developmental level.
For more discussion of issues concerning developmental score scales, see Scaling, Norming, and Equating in the third edition of Educational Measurement (Petersen et al., 1989). Characteristics of developmental score scales, particularly as they relate to statistical procedures and assumptions used in scaling and equating, have been addressed by the continuous research program at the University of Iowa (for example, Andrews, 1995; Becker and Forsyth, 1992; Beggs and Hieronymus, 1968; Harris and Hoover, 1987; Hoover, 1984; Kolen, 1981; Loyd, 1980; Loyd and Hoover, 1980; Mittman, 1958; Plake, 1979; Proctor, 2008; Tong and Kolen, 2007).
National Trends in Achievement Test Performance The procedures used to develop national comparisons for the Iowa Assessments were described in Part 3. Similar procedures have been used since the first forms of the Iowa Assessments were published in 1956. These procedures form the basis for national comparisons available in score reports for the Iowa Assessments: student norms, building norms, skill norms, item norms, and norms for special school populations. Over the years, changes in performance have been monitored to inform users of each new edition of the assessments about the normative differences they might expect with new test forms.
In general, true changes in educational achievement take place slowly. Despite public debate about school reform and education standards, the underlying educational goals of schools are relatively stable. Lasting changes in teaching methods and materials tend to be evolutionary rather than revolutionary, and student motivation and public support of education change slowly. Data from the national research program supporting the Iowa Assessments provide important information about trends in achievement over time.
National assessments of ability and achievement are typically revised and standardized every seven to ten years when new test forms are published. The advantage of using the same norms for comparative purposes over a period of time is that scores from year to year can be based on the same metric. Gains or losses are “real”; that is, no part of the measured gains or losses can be attributed to changes in the performance of the national comparison group. The disadvantage, of course, is that the frame of reference becomes dated. How serious this effect is depends on how much student achievement has changed over the period. Differences in performance between editions, which are represented by changes in norms, were relatively minor for early editions of the assessments.
This situation changed dramatically in the late 1960s and the 1970s. Shortly after 1965, achievement declined—first in mathematics, then in language skills, and later in other curriculum areas. This downward trend in achievement in the late 1960s and early 1970s was reflected in the test norms during that period, which were “softer” than norms before and after that time (see Koretz, 1987 for a thorough description of national achievement trends

60 Iowa Assessments Research and Development Guide
during this and subsequent periods through the 1980s).
Beginning in the mid-1970s, achievement improved slowly but consistently in all curriculum areas until the early 1990s, when it reached an all-time high. From the early 1990s through 2000, no dominant trend in achievement test scores appeared. Scores increased slightly in some areas and grades and decreased slightly in others. In the context of achievement trends since the mid-1950s, achievement in the 1990s was extremely stable.
During October 2010, Forms E and A were jointly administered to a national sample of students in kindergarten through grade 12. This sample was selected to represent the norming population in terms of variability in achievement, the main requirement of an equating sample (Kolen and Brennan, 2014). A single-group, counterbalanced design was used. In each grade, students took Form E of the Iowa Assessments Complete and Form A of the ITBS or ITED Complete Battery.
Matched student records of Form E and Form A were created for each subtest and level. Frequency distributions were obtained, and raw scores were linked by the equipercentile method. The resulting equating functions were then smoothed with cubic splines. This procedure defined the raw-score to raw-score relationship between Form E and Form A for each test. Standard scores on Form E could then be determined for norming dates before 2011 by linear interpolation. In this way, trend lines could be updated, and expected relations between new and old test norms could be determined.
The differences between student performance in 2000 and 2011, expressed in percentile ranks for the main test scores, are shown in Table 21. The achievement levels in the first column are expressed in terms of 2000 national percentile ranks. The entries in the table show the corresponding 2011 percentile ranks. For example, a score on the Reading test that would have a percentile rank of 50 in grade 5 according to 2000 norms would convert to a percentile rank of 44 on the 2011 norms. In general, differences between the 2000 and 2011 norms are greatest in the elementary grades, particularly in grades 3–5, regardless of achievement domain.
Based on evidence from national studies in 2000 through 2011, including the standardization of Form E of the Iowa Assessments, the pattern of stability observed in the 1990s began to change sometime after the introduction of Forms A and B. A review of the relationship between norms based on national studies in 2000, 2005, and 2011 in the domains for Reading and Mathematics in grade 3 shows that, due to increases in Reading achievement nationally over this time period, a student in grade 3 at the 50th percentile in Reading in the year 2000 would be at the 41st percentile in 2011. As shown in Figure 8, the differences are somewhat more pronounced in the middle of the achievement distribution than at the ends, but the trend of lower NPRs in 2011 was consistent for both Reading and Mathematics in grade 3. The analysis also shows that for grades 3 through 8 the differences become smaller and less consistent at higher grade levels, particularly grades 7 and 8. Similar analyses of national samples showed that performance differences between 2000 and 2011 become virtually nonexistent in the high school grades.

Scaling, Norms, and Equating 61
Figure 8: Norms Changes in Reading

62 Iowa Assessments Research and Development Guide
Table 21: Differences Between National Percentile Ranks ITBS/ITED Forms A/B vs. Iowa Assessments Forms E/F, National Comparison Data, 2000 and 2011
Reading Corresponding 2011 NPRs
Grade Achievement Level in 2000
1 2 3 4 5 6 7 8 9 10 11
90 82 89 87 85 87 84 89 90 90 90 90
75 66 71 67 69 67 68 72 74 75 75 75
50 40 45 41 41 44 42 46 50 50 50 50
25 20 20 19 21 24 24 25 26 25 25 25
10 8 5 5 9 9 1 1 10 1 1 10 10 10
Math Corresponding 2011 NPRs
Grade Achievement Level in 2000
1 2 3 4 5 6 7 8 9 10 11
90 87 85 81 81 81 80 83 84 90 90 90
75 74 66 65 62 62 62 63 67 75 75 75
50 49 44 42 38 39 40 44 46 50 50 50
25 21 22 19 18 19 20 19 22 25 25 25
10 7 8 5 7 6 7 6 8 10 10 10
Science Corresponding 2011 NPRs
Grade Achievement Level in 2000
1 2 3 4 5 6 7 8 9 10 11
90 90 92 83 84 81 85 87 91 90 90 90
75 75 76 64 69 62 69 70 74 75 75 75
50 52 52 39 44 39 43 47 47 50 50 50
25 24 24 25 20 17 23 25 26 25 25 25
10 9 9 9 7 7 9 1 1 10 10 10 10
Continued on next page…

Scaling, Norms, and Equating 63
Table 21 (continued): Differences Between National Percentile Ranks ITBS/ITED Forms A/B vs. Iowa Assessments Forms E/F, National Comparison Data, 2000 and 2011
Social Studies
Corresponding 2011 NPRs
Grade
Achievement Level in 2000
1 2 3 4 5 6 7 8 9 10 11
90 90 92 80 86 87 85 90 92 90 90 90
75 73 79 64 74 70 71 76 79 75 75 75
50 48 56 34 47 53 50 53 57 50 50 50
25 23 28 14 20 21 27 24 31 25 25 25
10 8 10 4 8 9 12 9 14 10 10 10
Language Corresponding 2011 NPRs
Grade Achievement Level in 2000 1 2 3 4 5 6 7 8 9 10 11
90 79 88 84 86 84 86 90 90 90 90 90
75 60 73 67 73 68 75 76 76 75 75 75
50 39 47 40 47 45 51 54 53 50 50 50
25 20 23 17 24 22 25 26 29 25 25 25
10 7 8 7 11 9 1 1 12 12 10 10 10
The 2010 national comparison study of the Iowa Assessments formed the basis for national comparisons of scores on Form E and Form F of the Complete and Survey configurations. Data from the research program established benchmark performance for nationally representative samples of students in the fall and spring of the school year and were used to estimate midyear performance through interpolation.
Norms for Special School Populations As described in Part 3, the 2010–2011 national comparison study included three independent samples: a public school sample, a Catholic school sample, and a private non-Catholic school sample. Schools in the research study were further stratified by socioeconomic status. Data from these sources were used to develop special norms for the Iowa Assessments for students enrolled in Catholic/private schools as well as norms for other groups.
The method used to develop norms was the same for each special school population. Frequency distributions from each grade in the research sample were cumulated for the relevant group of students. The cumulative distributions were then plotted and smoothed.

64 Iowa Assessments Research and Development Guide
Comparability of Forms New forms of the Iowa Assessments have been introduced approximately every seven to ten years since 1955. Each time new forms are published, they are carefully equated to previous forms so that trend lines can be maintained. Procedures for equating previous forms to each other have been described in the technical manuals for those forms. The procedures used in equating Form E and Form F of the current edition are described in this part of the guide.
The comparability of scores on alternate forms of the Iowa Assessments is established through careful test development and standard methods of test equating. The tests are assembled to match tables of specifications that are sufficiently detailed to allow test developers to create equivalent forms in terms of test content. The tables of skill classifications, included in the Content Classifications Guide, show the parallelism achieved in content for each test and level. Alternate forms of tests should be similar in difficulty as well. Concurrent assembly of test forms provides some control over difficulty, but small differences between forms are typically observed during the standardization process. Equating methods are used to adjust scores for differences in difficulty not controlled during assembly of the forms. Mean sample sizes for the equating of Form F to Form E of the Iowa Assessments are given in Table 22.
Table 22: Mean Sample Sizes for Equating Form F to Form E
Test Level Core Complete
5/6 909 909
7 888 888
8 841 841
9 1036 773
10 1070 800
11 1035 775
12 1057 762
13 1006 722
14 991 709
15 1442 1230
16 1482 1257
17/18 1438 1242
Form E and Form F of the Iowa Assessments Complete and Survey configurations were equated with a single-group design (Petersen et al., 1989). In Levels 5/6 through 8, which are read aloud by classroom teachers, both test forms were administered to students within classrooms with the order of the forms counterbalanced by school to create the data required for equating forms. Frequency distributions were weighted so that the Form E and Form F cohorts had the same distribution on each subtest as did the 2011 national comparison sample. The weighted frequency distributions were used to obtain the equipercentile relationship between Form E and Form F of each subtest. This relation was smoothed with cubic splines, and standard scores were attached to Form F raw scores by interpolation.
At Levels 9 through 14, Form F subtests were randomly assigned to schools and administered

Scaling, Norms, and Equating 65
to students along with the corresponding Form E subtest in a single-group design. Frequency distributions for the two forms were linked by the equipercentile method and smoothed with cubic splines for all tests except Reading and Mathematics. In those test areas, the equipercentile relationships for Parts 1 and 2 were examined prior to selecting an equating method. Based on plots of those relationships, it was determined that a linear equating relationship was satisfactory except in the upper and lower 5 percent of the distributions, where a nonlinear smoothing technique was used to obtain the final Form F to Form E conversion. Standard scores were attached to each raw score distribution using the equating results, and the resulting raw-score to standard-score conversions were then smoothed. The raw-score to standard-score conversions for the Iowa Assessments Survey Form E and Form F were developed using the same procedures.
For all normative scores in the Iowa Assessments, methods for linking parallel forms involved the collection of empirical data designed specifically to accomplish the desired linking. These methods do not rely on mathematical models, such as item response theory or strong true-score theory, which entail assumptions about the relationship between individual items and the domain from which they are drawn or about the shape of the distribution of unobservable true scores. Instead, these methods establish direct links between the empirical distributions of raw scores as they were observed in comparable samples of examinees. The equating results, thus, empirically accommodate any influence of context or administrative sequence that could otherwise affect the behavior of scores.
Relationships of Form E and Form F to Previous Forms of the ITBS and ITED Forms 1 through 6 of the ITBS Multilevel Battery were classically parallel test forms in many ways. Pairs of forms—1 and 2, 3 and 4, 5 and 6—were assembled as equivalent forms largely because the objectives, placement, and methodology in basic skills instruction changed slowly during the lives of those forms. The content specifications of these three pairs of forms did not differ greatly. The organization of the tests in the multilevel test booklets, the number of items per level, the time limits, and even the number of items per page were identical for the first six forms.
Evolution and Change in Test Content and Organization
The first significant change in organization of the assessments occurred with Forms 7 and 8, published in 1978. Separate tests in Map Reading and Reading Graphs and Tables were replaced by a single Visual Materials test. In mathematics, separate tests in Problem Solving and Computation replaced the test consisting of problems with embedded computation. Other major changes included a reduction in the average number of items per test, shorter testing time, a revision in grade-to-grade item overlap, and major revisions in the taxonomy of skills objectives. These changes were made in large part to support criterion-referenced reporting systems being developed at the time.
With Forms G and H, published in 1985, the format changed considerably. Sixteen pages were added to the multilevel test booklet. Additional modifications were made in grade-to-grade

66 Iowa Assessments Research and Development Guide
overlap and in the number of items per test. For most purposes, however, Forms G, H, and J were considered equivalent to Forms 7 and 8 in all test areas except Language Usage. The scope of the Usage test was expanded to include appropriateness and effectiveness of expression as well as correct usage.
Forms K, L, and M, which were introduced in 1992, continued the gradual evolution of content specifications to adapt to changes in school curriculum; this evolution continued into Forms A, B, and C. The most notable change was in the flexibility of configurations to meet local assessment needs. The Survey Battery was introduced for schools that wanted general achievement information only in reading, language arts, and mathematics. Other changes in the tests in these editions occurred in how composite scores were defined.
An additional change in the overall design specifications for the tests concerned grade-to-grade overlap. Previous test forms had overlapping items that spanned three levels. Overlapping items in the ITBS and ITED Complete Battery beginning with Form K, Levels 9–14 and 15–17/18, spanned two levels. The Survey Battery and Levels 5/6–8 assessments contained no overlapping items. This pattern was continued in Forms E and F of the Iowa Assessments.
Form E and Form F of the Iowa Assessments incorporate a significant reorganization of subtests and the introduction of new composite scores to reflect shifts in curricular emphases, definitions of underlying constructs, and an interest in integrated approaches to item development. The Common Core State Standards (CCSS) provided the principal impetus for the reorganization of subtests and the definition of new composite scores consistent with construct definitions reflected in the CCSS. The reading and language domains were redefined to focus attention on comprehension and writing, and shifts occurred in the sequencing and grade placement of material in the math domain.
In addition to changes with subtests of Forms E and F, the subtests themselves were reorganized to reflect core content domains (Reading, Mathematics, Writing, Science, and Social Studies) and skills domains (Vocabulary, Conventions of Writing, and Computation).
Assessments in the Primary Grades
Another fundamental change in the assessments occurred in the 1970s with the introduction of the Primary Battery (Levels 7 and 8) with Forms 5 and 6 in 1971 and the Early Primary Battery (Levels 5 and 6) in 1977. These levels were developed to assess core skills in kindergarten through grade 3. Machine-scorable test booklets contain responses with pictures, words, phrases, and sentences designed for the age and developmental level of students in the early grades.
In Level 5/6 of the Iowa Assessments, questions in Listening, Word Analysis, Vocabulary, Language, and Mathematics are read aloud by the teacher. Students look at the responses in the test booklet as they listen. Only the Reading test in Level 5/6 requires students to read words, phrases, and sentences to answer the questions.
Because of changes in instructional emphasis, Levels 5/6 through 8 of the Iowa Assessments have been revised more extensively than other levels. Over the years, the order of the subtests changed. The four Language tests were combined into a single test with all questions read aloud by the teacher. At the same time, graphs and tables were added to Mathematics.

Scaling, Norms, and Equating 67
Scores from Form E and Form F are equivalent to those from previous forms of the ITBS and ITED in all important respects. The principal changes from previous test forms involve the numbers of items in several subtests, the number of response options, and the alignment to core content standards in English language arts and mathematics.
Assessments in the High School Grades
The Iowa Assessments Form E and Form F at the high school level are the product of more than sixty years of experience in the construction and use of assessments that measure general educational development. The first edition, with parallel Forms X-1 and Y-1, was introduced in September 1942. Subsequent revisions and entirely new forms of the assessments have been published as follows: Forms X-2 and Y-2, 1947; Forms X-3 and Y-3, 1952; Forms X-4 and Y-4, 1962; Forms X-5 and Y-5, 1970; Forms X-6 and Y-6, 1972; Forms X-7 and Y-7, 1979; Forms X-8 and Y-8, 1988; Forms K and L, 1992; Form M, 1995; Forms A and B in 2000; and Form C in 2007.
The general format of Form E and Form F, Levels 15, 16, and 17/18 of the Iowa Assessments was introduced with Forms K, L, and M of the ITED; each test area consists of four blocks of items. Level 15 includes a unique block and a block shared with Level 16, and Level 17/18 includes a block shared with Level 16 and a unique block. Thus, Form E and Form F, Levels 15 and 17/18 have no common items.

68 Iowa Assessments Research and Development Guide

Reliability 69
Part 6 Reliability
In Brief This part of the guide reports several different estimates of reliability that can help users make informed judgments about the consistency of Iowa Assessments scores. Data presented in this part of the guide address the means, standard deviations (SD), and standard errors of measurement (SEM) for raw scores (RS) and National Standard Scores (NSS). Several approaches to the assessment of reliability and sources of variance in observed scores are also presented as well as standard errors of measurement for selected scores levels, also known as conditional SEMs.
Methods of Determining, Reporting, and Using Reliability Data
A soundly planned, carefully constructed, and comprehensive large-scale assessment represents the most accurate and dependable measure of student achievement available to parents, teachers, and school officials. Many subtle, extraneous factors that contribute to unreliability and bias in human judgments have little or no effect on scores from carefully developed assessments. In addition, other factors that contribute to apparent inconsistency in student performance can be effectively minimized in the assessment situation: temporary changes in student motivation, health, and attentiveness; minor distractions inside and outside the classroom; limitations in number, scope, and comparability of the available samples of student work; and misunderstanding by students of what the teacher expects of them (Haertel, 2006). The greater effectiveness of a well-constructed achievement test in controlling these factors—compared to informal evaluations of the same achievement—is evidenced by the higher reliability of the test.
Test reliability can be quantified by a variety of statistical data, but such data reduce to two basic types of indices. The first of these indices is the reliability coefficient. In numerical value, the reliability coefficient is between 0.00 and 0.99; for carefully developed assessments, it is generally between 0.60 and 0.95. The closer the coefficient approaches the upper limit, the greater the freedom of the scores from the influence of factors that temporarily affect student performance and obscure real differences in achievement. This ready frame of reference for reliability coefficients is deceptive in its simplicity, however. It is impossible to conclude whether a value such as 0.75 represents a “high” or “low” or “satisfactory” or “unsatisfactory” reliability. Only after a coefficient has been compared to those of equally valid and equally practical alternative assessments can such a judgment be made. In practice, there is always a degree of uncertainty regarding the terms “equally valid” and “equally practical,” so the reliability coefficient is rarely free of ambiguity. Nonetheless, comparisons of reliability coefficients for alternative approaches to assessment can be useful in determining the relative stability of the resulting scores.

70 Iowa Assessments Research and Development Guide
The second of the statistical indices used to describe test reliability is the standard error of measurement (SEM). This index represents a measure of the net effect of all factors leading to inconsistency in student performance and to inconsistency in the interpretation of that performance. The SEM can be understood by a hypothetical example. Suppose a group of students at the same achievement level in reading were to take the same reading test on two occasions. Despite their equal reading ability, they would not all get the same score both times. Instead, their scores would range across an interval. A very few would get much higher scores than expected given their achievement level and a few much lower; the majority would get scores quite close to their actual achievement level. Such variation in scores would be attributable to differences in motivation, attentiveness, and other situational factors. The SEM is an index of the typical range or variability of the scores observed for students regardless of their level of achievement. It tells the degree of precision in placing a student at a point on the score scale used for reporting assessment results.
There is, of course, no way to know just how much a given student’s achievement may have been under or overestimated from a single administration of a test. We may, however, make reasonable estimates of the amount by which the achievement of students in a particular reference group has been mismeasured. For about two-thirds of the examinees, the scores obtained are “correct” or accurate to within one SEM of the observed score. For 95 percent of the students, the scores are accurate to within two standard errors, and for more than 99 percent, the scores are accurate to within three standard error values.
Two methods of estimating reliability were used to obtain the summary statistics provided in the following two sections of this guide. The first method employed internal-consistency estimates using Kuder-Richardson Formula 20 (K-R 20). Reliability coefficients derived by this technique were based on data from the entire national comparison sample and are reported for both fall and spring administrations. The coefficients for Form E of the Iowa Assessments Complete and Survey are reported here. Coefficients for Form F of the Iowa Assessments Complete and Survey are available from the publisher.
The second method provided estimates of reliability based on two testing occasions. Alternate-forms reliability for Form E of the Iowa Assessments and Form A of the ITBS/ITED was estimated from the fall 2010 equating of those forms. In addition, test-retest reliability was estimated with data from the 2011–2012 comparability study of Form E in paper-based and computer-based modes of administration.
The SEM measures the net effect of all factors leading to inconsistency in student test scores and to inconsistency in score interpretation. It is reported as the typical amount by which a student’s observed score may range from one testing occasion to another. The conditional SEM (CSEM) gives similar information, but rather than gauging the typical range, it provides a range that is tailored to a specific level of achievement (Feldt and Brennan, 1989; Haertel, 2006).
The reliability data presented on the following pages are based on K-R 20. The means, standard deviations, and standard errors of measurement are shown in Table 23 in the raw score metric and the National Standard Score metric for both fall and spring administrations

Reliability 71
of the Iowa Assessments Complete. Table 24 presents similar information for Levels 7–14 of the Iowa Assessments Survey.

72
Io
wa A
ssessmen
ts Research
and
Develo
pm
ent G
uid
e
Table 23: Means, Standard Deviations (SD), Reliability Coefficients (K-R 20), and Standard Errors of Measurement (SEM) for the Weighted Sample, Grades K–12
Iowa Assessments Form E Complete
Level 5/6 Rea
din
g
Lang
uage
Voc
abul
ary
EL
A T
ota
l
Wor
d A
naly
sis
List
enin
g
Ext
end
ed E
LA
Mat
hem
atic
s
Co
mp
lete
C
om
po
site
Ext
end
ed
Co
mp
lete
C
om
po
site
R L V ET WA Li XET M CC XCC
Number of Items 34 31 27 33 27 35
Fall—Grade 1
Mean 17.8 20.1 17.6 – 26.9 17.0 – 22.6 – –
RS SD 8.1 4.8 3.6 – 4.9 4.3 – 6.2 – –
SEM 2.5 2.3 2.2 – 2.0 2.3 – 2.4 – –
Mean 139.1 137.3 138.1 138.0 138.9 138.1 138.2 138.3 138.2 138.3
SS SD 10.2 9.6 16.0 9.9 15.9 11.9 12.3 11.3 10.9 10.9
SEM 3.2 4.6 9.7 3.0 6.5 6.3 2.5 4.5 2.7 2.6
K-R 20 .903 .770 .625 .907 .836 .724 .958 .844 .939 .945
Spring—Grade K
Mean 11.6 17.4 16.0 – 24.5 14.4 – 18.4 – –
RS SD 5.8 5.8 3.6 – 5.7 4.3 – 5.8 – –
SEM 2.5 3.0 2.3 – 2.2 2.4 – 2.6 – –
Mean 131.3 130.4 131.1 130.8 131.5 130.8 130.9 130.7 130.8 130.8
SS SD 7.4 8.5 15.0 8.5 14.3 10.8 11.1 9.8 9.8 9.8
SEM 3.6 4.4 9.7 2.9 5.5 6.0 2.4 4.3 2.6 2.5
K-R 20 .810 .740 .580 .882 .853 .690 .954 .804 .929 .936
Continued on next page…

Reliab
ility 7
3
Table 23 (continued): Means, Standard Deviations (SD), Reliability Coefficients (K-R 20), and Standard Errors of Measurement (SEM) for the Weighted Sample, Grades K–12
Iowa Assessments Form E Complete
Level 7 Rea
din
g
Lang
uage
Voc
abul
ary
EL
A T
ota
l
Wor
d A
naly
sis
List
enin
g
Ext
end
ed E
LA
Mathematics
Co
re C
om
po
site
Ext
ende
d E
nglis
h La
ngua
ge A
rts
Tota
l
Cor
e C
omp
osite
w
ith E
T an
d M
Cor
e C
omp
osite
w
ith X
ET
and
M
Sci
ence
Soc
ial S
tud
ies
Co
mp
lete
Co
mp
osi
te
Com
ple
te C
omp
osite
w
ith X
ET
and
MT
Com
ple
te C
omp
osite
w
ith E
T an
d M
Com
ple
te C
omp
osite
w
ith X
ET
and
M
Mat
hem
atic
s
Com
put
atio
n
Mat
h T
ota
l
R L V ET WA Li XET M MC MT CT XET CT- XCT- SC SS CC XCC CC- XCC-
Number of Items 35 34 26 32 27 41 25 29 29
Fall—Grade 2 Mean 26.8 23.6 17.9 – 25.9 20.3 – 29.1 18.8 – – – – – 22.9 23.0 – – – –
RS SD 6.9 6.7 5.9 – 4.6 4.1 – 6.0 4.7 – – – – – 3.2 3.4 – – – –
SEM 2.1 2.3 1.9 – 2.0 2.0 – 2.4 1.9 – – – – – 1.9 1.9 – – – –
Mean 158.9 158.1 157.5 158.3 159.2 156.9 158.2 157.0 154.2 156.1 157.2 157.1 157.6 157.6 157.4 157.8 157.3 157.3 157.6 157.6
SS SD 16.3 15.1 19.0 15.1 20.4 14.8 14.0 14.8 9.9 12.8 13.4 13.4 13.8 13.8 18.3 16.3 13.0 13.0 13.2 13.2
SEM 5.0 5.3 6.22 3.3 8.9 7.1 2.9 6.0 4.0 3.8 2.5 2.4 3.1 3.0 11.0 9.3 2.9 2.9 3.2 3.2
K-R 20 .906 .879 .893 .953 .810 .768 .957 .836 .835 .911 .965 .968 .949 .952 .641 .676 .948 .950 .941 .943
Spring—Grade 1
Mean 23.8 20.0 15.7 – 24.3 18.6 – 26.1 16.8 – – – – – 21.5 21.5 – – – –
RS SD 7.6 5.9 6.2 – 4.8 4.3 – 5.7 5.0 – – – – – 3.4 3.7 – – – –
SEM 2.3 2.6 2.1 – 2.2 2.2 – 2.7 2.1 – – – – – 2.1 2.1 – – – –
Mean 152.2 149.9 150.9 150.8 152.2 150.4 151.0 150.3 150.1 150.2 150.5 150.6 150.6 150.6 149.8 151.1 150.5 150.6 150.5 150.6
SS SD 14.3 11.3 18.0 11.3 18.4 13.5 12.6 13.6 9.3 11.2 12.2 12.2 12.7 12.7 16.8 15.2 11.8 11.8 12.3 12.3
SEM 4.4 5.0 6.1 3.1 8.4 6.7 2.7 4.9 3.9 3.5 2.3 2.2 2.9 2.8 10.2 8.6 2.8 2.7 3.0 2.9
K-R 20 .904 .808 .884 .927 .794 .750 .953 .867 .829 .901 .963 .966 .948 .951 .630 .679 .946 .947 .941 .942
Continued on next page…

74
Io
wa A
ssessmen
ts Research
and
Develo
pm
ent G
uid
e
Table 23 (continued): Means, Standard Deviations (SD), Reliability Coefficients (K-R 20), and Standard Errors of Measurement (SEM) for the Weighted Sample, Grades K–12
Iowa Assessments Form E Complete
Level 8 Rea
din
g
Lang
uage
Voc
abul
ary
EL
A T
ota
l
Wor
d A
naly
sis
List
enin
g
Ext
end
ed E
LA
Mathematics
Co
re C
om
po
site
Ext
ende
d E
nglis
h La
ngua
ge A
rts
Tota
l
Cor
e C
omp
osite
w
ith E
T an
d M
Cor
e C
omp
osite
w
ith X
ET
and
M
Sci
ence
Soc
ial S
tud
ies
Co
mp
lete
Co
mp
osi
te
Com
ple
te C
omp
osite
w
ith X
ET
and
MT
Com
ple
te C
omp
osite
w
ith E
T an
d M
Com
ple
te C
omp
osite
w
ith X
ET
and
M
Mat
hem
atic
s
Com
put
atio
n
Mat
h T
ota
l
R L V ET WA Li XET M MC MT CT XET CT- XCT- SC SS CC XCC CC- XCC-
Number of Items 38 42 26 33 27 46 27 29 29
Fall—Grade 3
Mean 29.1 32.0 17.8 – 26.6 20.1 – 34.5 21.2 – – – – – 21.3 22.1 – – – –
RS SD 6.8 7.5 4.6 – 4.8 4.1 – 7.0 3.7 – – – – – 3.9 4.1 – – – –
SEM 2.3 2.4 2.0 – 2.0 2.0 – 2.5 2.0 – – – – – 2.1 2.0 – – – –
Mean 177.5 177.0 175.4 176.9 177.6 174.6 176.6 175.3 172.3 174.3 175.6 175.5 176.1 176.0 177.0 176.6 176.0 175.9 176.3 176.2
SS SD 21.4 19.5 20.6 20.1 25.4 17.3 17.1 18.4 13.9 16.0 16.7 16.7 17.4 17.4 22.5 19.4 17.1 17.1 17.1 17.1
SEM 7.1 6.4 9.0 4.2 10.4 8.5 3.6 6.0 5.3 4.4 3.1 2.8 3.7 3.5 12.0 9.6 3.3 3.2 3.6 3.5
K-R 20 .890 .893 .808 .955 .833 .761 .956 .892 .857 .925 .967 .971 .955 .959 .714 .757 .963 .965 .957 .958
Spring—Grade 2
Mean 27.0 29.2 16.3 – 25.4 19.2 – 32.0 20.3 – – – – – 20.0 20.6 – – – –
RS SD 7.1 7.9 4.6 – 5.1 4.3 – 7.0 3.8 – – – – – 4.0 4.1 – – – –
SEM 2.4 2.7 2.1 – 2.1 2.2 – 2.7 2.1 – – – – – 2.2 2.2 – – – –
Mean 170.7 169.8 168.6 169.9 171.0 168.2 169.8 168.6 168.3 168.5 169.2 169.1 169.2 169.2 169.7 169.5 169.3 169.3 169.4 169.3
SS SD 19.6 17.2 19.8 17.2 23.7 16.3 16.1 16.9 13.1 14.7 15.3 15.3 15.9 15.9 21.2 17.8 15.0 15.0 15.2 15.2
SEM 6.7 5.8 9.1 4.0 9.8 8.3 3.4 5.9 5.4 4.3 2.9 2.7 3.5 3.4 11.5 9.3 3.2 3.1 3.4 3.4
K-R 20 .883 .886 .791 .947 .828 .745 .955 .879 .834 .914 .964 .968 .950 .954 .708 .727 .955 .957 .949 .951
Continued on next page…

Reliab
ility 7
5
Table 23 (continued): Means, Standard Deviations (SD), Reliability Coefficients (K-R 20), and Standard Errors of Measurement (SEM) for the Weighted Sample, Grades K–12
Iowa Assessments Form E Complete
Level 9 Grade 3 R
ead
ing
Writ
ten
Exp
ress
ion
Conventions of Writing
Voc
abul
ary
EL
A T
ota
l
Wor
d A
naly
sis
List
enin
g
Ext
end
ed E
LA
Sp
ellin
g
Cap
italiz
atio
n
Pun
ctua
tion
Con
vent
ions
of
Writ
ing
Tota
l
R WE SP CP PC CW V ET WA Li XET
Number of Items 41 35 24 20 20 29 33 28
Fall
Mean 23.3 19.1 12.8 9.9 8.8 – 16.2 – 21.0 16.2 –
RS SD 8.6 7.7 5.0 4.7 4.1 – 6.9 – 5.2 3.7 –
SEM 2.7 2.6 2.1 1.9 2.0 – 2.3 – 2.5 2.3 –
Mean 177.5 176.8 175.4 175.1 177.5 174.2 175.4 176.3 177.6 174.6 176.2
SS SD 21.4 23.9 17.9 23.2 23.6 19.5 20.6 20.1 25.4 17.3 17.1
SEM 6.8 7.8 7.7 9.4 11.2 5.4 6.9 3.8 12.2 10.8 3.7
K-R 20 .900 .887 .816 .836 .775 .922 .888 .965 .771 .613 .953
Spring
Mean 27.0 22.4 15.2 11.8 10.5 – 19.3 – 22.8 18.1 –
RS SD 8.5 8.0 5.0 5.1 4.4 – 6.8 – 5.4 3.8 –
SEM 2.6 2.4 2.0 1.8 1.9 – 2.2 – 2.4 2.2 –
Mean 187.8 188.7 185.8 187.2 188.3 185.2 185.0 187.2 187.2 184.2 186.7
SS SD 24.5 28.2 20.4 29.2 27.4 22.7 21.6 21.7 28.6 19.2 19.0
SEM 7.5 8.6 8.1 10.3 11.8 5.8 6.8 4.1 12.7 10.8 3.9
K-R 20 .906 .907 .840 .875 .813 .934 .900 .965 .804 .683 .958
Continued on next page…

76
Io
wa A
ssessmen
ts Research
and
Develo
pm
ent G
uid
e
Table 23 (continued): Means, Standard Deviations (SD), Reliability Coefficients (K-R 20), and Standard Errors of Measurement (SEM) for the Weighted Sample, Grades K–12
Iowa Assessments Form E Complete
Level 9 Grade 3
Mathematics
Co
re C
om
po
site
Co
re C
om
po
site
w
ith
XE
T
Cor
e C
omp
osite
w
ith E
T an
d M
Co
re C
om
po
site
w
ith
XE
T a
nd M
Sci
ence
Soc
ial S
tud
ies
Co
mp
lete
Co
mp
osi
te
Com
ple
te C
omp
osite
w
ith X
ET
and
MT
Com
ple
te C
omp
osite
w
ith E
T an
d M
Com
ple
te C
omp
osite
w
ith X
ET
and
M
Mat
hem
atic
s
Com
put
atio
n
Mat
h T
ota
l
M MC MT CT XCT CT- XCT- SC SS CC XCC CC- XCC-
Number of Items 50 25 30 30
Fall
Mean 25.6 12.0 – – – – – 15.6 18.1 – – – –
RS SD 8.3 5.5 – – – – – 6.0 6.1 – – – –
SEM 3.1 2.2 – – – – – 2.4 2.4 – – – –
Mean 175.3 172.3 174.3 175.3 175.3 175.8 175.8 177.0 176.6 175.8 175.8 176.1 176.1
SS SD 18.4 13.9 16.0 16.7 16.7 17.4 17.4 22.5 19.4 17.1 17.1 17.1 17.1
SEM 6.8 5.5 4.9 3.1 3.1 3.9 3.9 8.8 7.5 2.8 2.8 3.2 3.2
K-R 20 .861 .846 .906 .966 .966 .950 .950 .846 .850 .972 .973 .964 .964
Spring
Mean 30.2 17.0 – – – – – 18.2 20.8 – – – –
RS SD 8.8 5.8 – – – – – 6.0 5.8 – – – –
SEM 3.0 1.9 – – – – – 2.3 2.2 – – – –
Mean 185.9 185.4 185.7 186.4 186.2 186.5 186.3 187.4 186.8 186.7 186.5 186.7 186.6
SS SD 20.5 16.7 17.7 19.1 19.1 19.9 19.9 25.2 21.7 19.9 19.9 20.0 20.0
SEM 7.0 5.5 5.0 3.2 3.2 4.0 4.0 9.5 8.3 3.0 3.0 3.4 3.4
K-R 20 .884 .891 .920 .971 .972 .959 .960 .858 .853 .977 .977 .971 .971
Continued on next page…

Reliab
ility 7
7
Table 23 (continued): Means, Standard Deviations (SD), Reliability Coefficients (K-R 20), and Standard Errors of Measurement (SEM) for the Weighted Sample, Grades K–12
Iowa Assessments Form E Complete
Level 10 Grade 4 R
ead
ing
Writ
ten
Exp
ress
ion
Conventions of Writing
Voc
abul
ary
EL
A T
ota
l
Mathematics
Co
re C
om
po
site
Cor
e C
omp
osite
w
ith E
T an
d M
Sci
ence
Soc
ial S
tud
ies
Co
mp
lete
Co
mp
osi
te
Com
ple
te C
omp
osite
w
ith E
T an
d M
Sp
ellin
g
Cap
italiz
atio
n
Pun
ctua
tion
Con
vent
ions
of
Writ
ing
Tota
l
Mat
hem
atic
s
Com
put
atio
n
Mat
h T
ota
l
R WE SP CP PC CW V ET M MC MT CT CT- SC SS CC CC-
Number of Items 42 38 27 22 22 34 55 27 34 34
Fall
Mean 25.9 22.0 15.2 11.6 10.2 – 19.9 – 30.7 15.4 – – – 19.0 19.4 – –
RS SD 8.8 8.4 5.8 5.0 4.5 – 7.9 – 9.3 5.5 – – – 6.4 6.6 – –
SEM 2.7 2.6 2.2 2.0 2.0 – 2.5 – 3.2 2.2 – – – 2.5 2.5 – –
Mean 193.8 195.1 192.2 194.0 195.4 191.9 191.1 193.5 191.8 188.8 190.8 192.1 192.6 193.8 192.6 192.5 192.8
SS SD 25.9 30.5 22.2 31.4 30.0 24.9 22.5 22.8 21.8 17.4 18.9 20.4 21.2 26.6 23.3 21.4 21.3
SEM 8.0 9.5 8.5 12.8 13.4 6.7 7.1 4.4 7.6 7.0 5.6 3.6 4.4 10.5 9.0 3.3 3.7
K-R 20 .904 .903 .855 .834 .800 .927 .900 .962 .878 .840 .913 .970 .957 .844 .852 .976 .969
Spring
Mean 28.3 24.2 17.6 12.8 11.5 – 22.8 – 34.6 18.6 – – – 21.2 21.9 – –
RS SD 8.7 8.5 5.7 5.3 5.0 – 7.7 – 9.5 5.7 – – – 6.5 6.7 – –
SEM 2.6 2.5 2.1 2.0 2.0 – 2.4 – 3.1 2.1 – – – 2.5 2.4 – –
Mean 202.6 204.9 202.5 204.0 204.9 201.8 199.9 202.8 201.6 200.7 201.3 202.0 202.2 203.5 202.6 202.4 202.5
SS SD 28.7 34.6 25.3 36.2 34.4 28.4 23.4 24.4 24.0 20.5 21.1 22.9 23.7 29.2 26.4 23.9 23.9
SEM 8.6 10.1 9.2 13.6 13.6 7.0 7.2 4.7 7.9 7.5 5.9 3.8 4.6 11.1 9.5 3.5 3.9
K-R 20 .911 .914 .867 .859 .843 .938 .905 .963 .891 .866 .922 .973 .962 .857 .870 .978 .973
Continued on next page…

78
Io
wa A
ssessmen
ts Research
and
Develo
pm
ent G
uid
e
Table 23 (continued): Means, Standard Deviations (SD), Reliability Coefficients (K-R 20), and Standard Errors of Measurement (SEM) for the Weighted Sample, Grades K–12
Iowa Assessments Form E Complete
Level 11 Grade 5 R
ead
ing
Writ
ten
Exp
ress
ion
Conventions of Writing
Voc
abul
ary
EL
A T
ota
l
Mathematics
Co
re C
om
po
site
Cor
e C
omp
osite
w
ith E
T an
d M
Sci
ence
Soc
ial S
tud
ies
Co
mp
lete
Co
mp
osi
te
Com
ple
te C
omp
osite
w
ith E
T an
d M
Sp
ellin
g
Cap
italiz
atio
n
Pun
ctua
tion
Con
vent
ions
of
Writ
ing
Tota
l
Mat
hem
atic
s
Com
put
atio
n
Mat
h T
ota
l
R WE SP CP PC CW V ET M MC MT CT CT- SC SS CC CC-
Number of Items 43 40 30 24 24 37 60 29 37 37
Fall
Mean 26.7 24.7 17.6 12.2 11.3 – 22.3 – 34.6 16.9 – – – 21.1 20.4 – –
RS SD 9.1 8.9 6.4 5.1 4.8 – 8.2 – 10.1 6.0 – – – 6.7 7.6 – –
SEM 2.7 2.6 2.3 2.1 2.2 – 2.6 – 3.4 2.3 – – – 2.6 2.7 – –
Mean 207.0 209.8 207.7 209.0 210.3 206.9 205.1 207.6 206.7 204.2 205.9 206.8 207.2 208.5 207.2 207.1 207.4
SS SD 29.9 36.4 26.8 37.9 36.6 30.5 24.0 25.4 25.6 21.4 22.3 24.2 25.4 30.6 28.2 25.2 25.1
SEM 9.0 10.8 9.9 15.6 16.4 8.2 7.6 5.0 8.6 8.0 6.3 4.0 5.0 11.9 9.9 3.7 4.2
K-R 20 .909 .912 .864 .830 .799 .928 .900 .961 .888 .861 .920 .972 .962 .848 .877 .978 .972
Spring
Mean 29.0 26.5 19.5 13.5 12.5 – 25.1 – 38.0 19.6 – – – 23.1 22.9 – –
RS SD 9.1 9.0 6.3 5.3 5.2 – 8.3 – 10.5 6.2 – – – 6.9 7.9 – –
SEM 2.6 2.5 2.2 2.1 2.1 – 2.4 – 3.3 2.2 – – – 2.5 2.6 – –
Mean 215.5 218.9 216.9 218.5 219.3 216.1 214.0 216.5 215.8 215.3 215.6 216.0 216.1 217.9 217.0 216.5 216.6
SS SD 32.2 40.1 29.3 41.0 40.0 33.3 25.5 27.3 27.9 24.7 24.8 26.3 27.2 33.3 31.2 27.5 27.7
SEM 9.2 11.3 10.4 15.8 16.1 8.2 7.5 5.2 8.6 8.5 6.4 4.1 5.0 12.2 10.2 3.8 4.3
K-R 20 .918 .921 .874 .851 .838 .939 .913 .964 .904 .881 .933 .975 .966 .866 .894 .981 .976
Continued on next page…
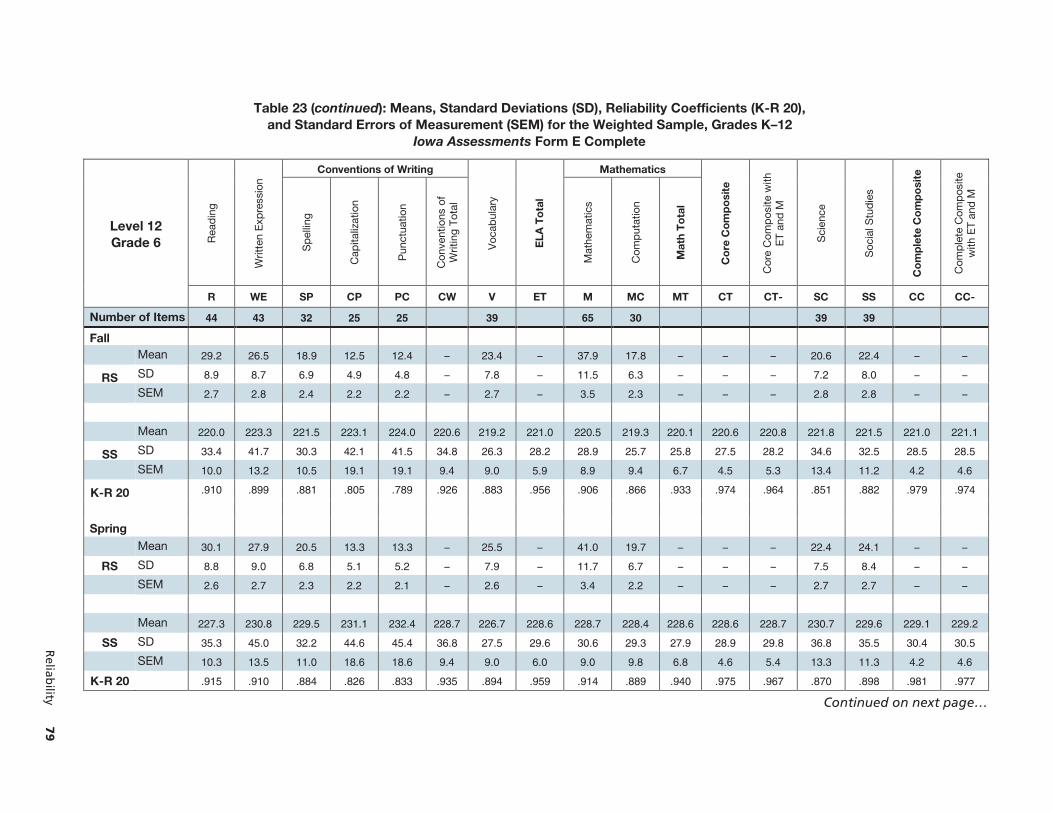
Reliab
ility 7
9
Table 23 (continued): Means, Standard Deviations (SD), Reliability Coefficients (K-R 20), and Standard Errors of Measurement (SEM) for the Weighted Sample, Grades K–12
Iowa Assessments Form E Complete
Level 12 Grade 6 R
ead
ing
Writ
ten
Exp
ress
ion
Conventions of Writing
Voc
abul
ary
EL
A T
ota
l
Mathematics
Co
re C
om
po
site
Cor
e C
omp
osite
with
E
T an
d M
Sci
ence
Soc
ial S
tud
ies
Co
mp
lete
Co
mp
osi
te
Com
ple
te C
omp
osite
w
ith E
T an
d M
Sp
ellin
g
Cap
italiz
atio
n
Pun
ctua
tion
Con
vent
ions
of
Writ
ing
Tota
l
Mat
hem
atic
s
Com
put
atio
n
Mat
h T
ota
l
R WE SP CP PC CW V ET M MC MT CT CT- SC SS CC CC-
Number of Items 44 43 32 25 25 39 65 30 39 39
Fall
Mean 29.2 26.5 18.9 12.5 12.4 – 23.4 – 37.9 17.8 – – – 20.6 22.4 – –
RS SD 8.9 8.7 6.9 4.9 4.8 – 7.8 – 11.5 6.3 – – – 7.2 8.0 – –
SEM 2.7 2.8 2.4 2.2 2.2 – 2.7 – 3.5 2.3 – – – 2.8 2.8 – –
Mean 220.0 223.3 221.5 223.1 224.0 220.6 219.2 221.0 220.5 219.3 220.1 220.6 220.8 221.8 221.5 221.0 221.1
SS SD 33.4 41.7 30.3 42.1 41.5 34.8 26.3 28.2 28.9 25.7 25.8 27.5 28.2 34.6 32.5 28.5 28.5
SEM 10.0 13.2 10.5 19.1 19.1 9.4 9.0 5.9 8.9 9.4 6.7 4.5 5.3 13.4 11.2 4.2 4.6
K-R 20 .910 .899 .881 .805 .789 .926 .883 .956 .906 .866 .933 .974 .964 .851 .882 .979 .974
Spring
Mean 30.1 27.9 20.5 13.3 13.3 – 25.5 – 41.0 19.7 – – – 22.4 24.1 – –
RS SD 8.8 9.0 6.8 5.1 5.2 – 7.9 – 11.7 6.7 – – – 7.5 8.4 – –
SEM 2.6 2.7 2.3 2.2 2.1 – 2.6 – 3.4 2.2 – – – 2.7 2.7 – –
Mean 227.3 230.8 229.5 231.1 232.4 228.7 226.7 228.6 228.7 228.4 228.6 228.6 228.7 230.7 229.6 229.1 229.2
SS SD 35.3 45.0 32.2 44.6 45.4 36.8 27.5 29.6 30.6 29.3 27.9 28.9 29.8 36.8 35.5 30.4 30.5
SEM 10.3 13.5 11.0 18.6 18.6 9.4 9.0 6.0 9.0 9.8 6.8 4.6 5.4 13.3 11.3 4.2 4.6
K-R 20 .915 .910 .884 .826 .833 .935 .894 .959 .914 .889 .940 .975 .967 .870 .898 .981 .977
Continued on next page…

80
Io
wa A
ssessmen
ts Research
and
Develo
pm
ent G
uid
e
Table 23 (continued): Means, Standard Deviations (SD), Reliability Coefficients (K-R 20), and Standard Errors of Measurement (SEM) for the Weighted Sample, Grades K–12
Iowa Assessments Form E Complete
Level 13 Grade 7 R
ead
ing
Writ
ten
Exp
ress
ion
Conventions of Writing
Voc
abul
ary
EL
A T
ota
l
Mathematics
Co
re C
om
po
site
Cor
e C
omp
osite
w
ith E
T an
d M
Sci
ence
Soc
ial S
tud
ies
Co
mp
lete
Co
mp
osi
te
Com
ple
te C
omp
osite
w
ith E
T an
d M
Sp
ellin
g
Cap
italiz
atio
n
Pun
ctua
tion
Con
vent
ions
of
Writ
ing
Tota
l
Mat
hem
atic
s
Com
put
atio
n
Mat
h T
ota
l
R WE SP CP PC CW V ET M MC MT CT CT- SC SS CC CC-
Number of Items 45 45 34 27 27 41 70 31 41 41
Fall
Mean 29.2 26.7 19.2 13.5 12.4 – 22.3 – 39.7 16.7 – – – 22.5 23.3 – –
RS SD 9.2 9.0 7.1 5.3 5.4 – 7.9 – 13.7 6.9 – – – 8.3 8.4 – –
SEM 2.8 2.9 2.5 2.3 2.3 – 2.8 – 3.6 2.4 – – – 2.8 2.9 – –
Mean 231.3 234.7 233.5 235.4 236.8 232.9 231.2 232.7 232.8 231.8 232.5 232.6 232.8 233.9 233.2 232.9 233.0
SS SD 36.3 46.3 32.8 45.9 47.0 38.2 28.2 30.4 31.7 30.1 28.5 29.9 30.8 37.8 36.4 31.4 31.8
SEM 10.9 14.9 11.6 19.8 20.0 10.0 10.1 6.5 8.4 10.7 6.6 4.7 5.3 13.0 12.4 4.3 4.6
K-R 20 .910 .897 .875 .814 .818 .931 .871 .954 .930 .874 .946 .976 .970 .882 .885 .981 .979
Spring
Mean 30.8 27.9 20.6 14.2 13.2 – 24.3 – 42.6 18.8 – – – 24.1 24.9 – –
RS SD 9.3 9.2 7.1 5.6 5.7 – 8.1 – 14.3 7.4 – – – 8.5 8.7 – –
SEM 2.7 2.8 2.5 2.3 2.3 – 2.8 – 3.5 2.3 – – – 2.8 2.8 – –
Mean 238.4 241.6 240.9 242.5 243.6 239.9 238.1 239.7 240.4 240.6 240.5 240.1 240.0 241.7 240.7 240.4 240.4
SS SD 38.6 48.8 34.0 48.1 49.2 40.0 29.0 32.1 33.9 33.5 30.9 31.8 32.9 39.9 39.0 33.2 33.6
SEM 11.1 15.0 11.8 19.4 19.6 9.9 9.9 6.6 8.4 10.6 6.6 4.7 5.3 12.9 12.5 4.3 4.7
K-R 20 .917 .906 .880 .838 .841 .939 .885 .958 .939 .899 .954 .978 .974 .895 .898 .983 .981
Continued on next page…

Reliab
ility 8
1
Table 23 (continued): Means, Standard Deviations (SD), Reliability Coefficients (K-R 20), and Standard Errors of Measurement (SEM) for the Weighted Sample, Grades K–12
Iowa Assessments Form E Complete
Level 14 Grade 8 R
ead
ing
Writ
ten
Exp
ress
ion
Conventions of Writing
Voc
abul
ary
EL
A T
ota
l
Mathematics
Co
re C
om
po
site
Cor
e C
omp
osite
w
ith E
T an
d M
Sci
ence
Soc
ial S
tud
ies
Co
mp
lete
Co
mp
osi
te
Com
ple
te C
omp
osite
w
ith E
T an
d M
Sp
ellin
g
Cap
italiz
atio
n
Pun
ctua
tion
Con
vent
ions
of
Writ
ing
Tota
l
Mat
hem
atic
s
Com
put
atio
n
Mat
h T
ota
l
R WE SP CP PC CW V ET M MC MT CT CT- SC SS CC CC-
Number of Items 46 48 35 29 29 42 75 32 43 43
Fall
Mean 29.8 28.3 19.0 15.3 13.9 – 22.8 – 42.9 18.3 – – – 23.0 24.8 – –
RS SD 9.6 10.3 7.3 5.8 6.2 – 8.4 – 14.3 7.0 – – – 7.9 9.0 – –
SEM 2.8 3.0 2.6 2.4 2.4 – 2.8 – 3.7 2.4 – – – 2.9 2.8 – –
Mean 242.3 245.2 244.4 246.0 247.2 243.4 241.9 243.4 244.2 243.9 244.1 243.8 243.8 245.0 244.2 244.0 244.1
SS SD 39.5 50.2 34.5 49.0 50.0 41.0 29.7 32.8 34.5 34.1 31.6 32.6 33.5 40.6 39.8 33.9 34.4
SEM 11.6 14.5 12.4 20.2 19.0 10.0 9.9 6.6 8.9 11.7 7.1 4.8 5.5 14.9 12.5 4.6 4.9
K-R 20 .913 .917 .870 .830 .856 .940 .889 .960 .934 .882 .950 .978 .973 .865 .901 .982 .980
Spring
Mean 31.2 29.5 20.5 16.1 14.5 – 24.7 – 45.4 19.6 – – – 24.3 26.0 – –
RS SD 9.7 10.5 7.3 5.9 6.4 – 8.8 – 14.7 7.4 – – – 8.1 9.4 – –
SEM 2.7 2.9 2.6 2.3 2.3 – 2.8 – 3.6 2.3 – – – 2.9 2.8 – –
Mean 248.9 251.5 251.2 251.7 252.4 249.2 248.7 249.8 250.7 251.3 250.9 250.3 250.2 251.5 250.6 250.6 250.5
SS SD 41.4 52.6 35.6 50.5 51.6 42.6 30.9 34.1 36.1 36.8 33.2 33.6 34.5 42.4 42.1 35.2 35.6
SEM 11.7 14.6 12.5 19.9 18.7 9.9 9.7 6.6 8.9 11.7 7.1 4.9 5.5 15.0 12.5 4.6 4.9
K-R 20 .920 .923 .876 .845 .868 .946 .902 .962 .939 .899 .954 .979 .974 .875 .912 .983 .981
Continued on next page…

82
Io
wa A
ssessmen
ts Research
and
Develo
pm
ent G
uid
e
Table 23 (continued): Means, Standard Deviations (SD), Reliability Coefficients (K-R 20), and Standard Errors of Measurement (SEM) for the Weighted Sample, Grades K–12
Iowa Assessments Form E Complete
Level 15 Grade 9 R
ead
ing
Writ
ten
Exp
ress
ion
Voc
abul
ary
EL
A T
ota
l
Mathematics
Co
re C
om
po
site
Cor
e C
omp
osite
w
ith E
T an
d M
Sci
ence
Soc
ial S
tud
ies
Co
mp
lete
Co
mp
osi
te
Com
ple
te C
omp
osite
w
ith E
T an
d M
Mat
hem
atic
s
Com
put
atio
n
Mat
h T
ota
l
R WE V ET M MC MT CT CT- SC SS CC CC-
Number of Items 40 54 40 40 30 48 50
Fall
Mean 22.1 27.8 19.3 – 16.2 13.2 – – – 20.5 19.2 – –
RS SD 9.1 11.5 9.2 – 7.9 5.8 – – – 8.8 8.7 – –
SEM 2.7 3.2 2.8 – 2.7 2.4 – – – 3.1 3.2 – –
Mean 252.4 254.7 251.8 253.5 254.0 254.4 254.1 253.8 253.7 254.3 253.6 253.8 253.8
SS SD 42.4 43.0 31.4 34.7 36.6 37.5 33.8 34.0 34.8 42.6 42.7 35.5 36.0
SEM 12.9 12.1 9.3 7.5 12.6 15.5 9.9 6.2 7.3 15.3 15.7 5.5 6.1
K-R 20 .913 .921 .908 .953 .882 .828 .915 .967 .955 .871 .866 .976 .971
Spring
Mean 23.4 29.1 21.2 – 17.5 14.1 – – – 21.7 20.6 – –
RS SD 9.4 11.6 9.6 – 8.4 6.2 – – – 9.2 9.4 – –
SEM 2.7 3.2 2.7 – 2.7 2.4 – – – 3.1 3.2 – –
Mean 258.8 260.2 258.2 259.4 259.9 259.6 259.8 259.6 259.7 260.4 259.6 259.7 259.8
SS SD 44.4 43.3 32.7 35.8 38.0 39.0 34.9 34.5 35.6 43.5 43.7 36.5 36.8
SEM 12.5 12.0 9.3 7.5 12.2 15.0 9.5 6.1 7.1 14.9 14.8 5.4 5.9
K-R 20 .920 .923 .920 .956 .897 .852 .925 .969 .960 .883 .886 .978 .974
Continued on next page…

Reliab
ility 8
3
Table 23 (continued): Means, Standard Deviations (SD), Reliability Coefficients (K-R 20), and Standard Errors of Measurement (SEM) for the Weighted Sample, Grades K–12
Iowa Assessments Form E Complete
Level 16 Grade 10 R
ead
ing
Writ
ten
Exp
ress
ion
Voc
abul
ary
EL
A T
ota
l
Mathematics
Co
re C
om
po
site
Cor
e C
omp
osite
w
ith E
T an
d M
Sci
ence
Soc
ial S
tud
ies
Co
mp
lete
Co
mp
osi
te
Com
ple
te C
omp
osite
w
ith E
T an
d M
Mat
hem
atic
s
Com
put
atio
n
Mat
h T
ota
l
R WE V ET M MC MT CT CT- SC SS CC CC-
Number of Items 40 54 40 40 30 48 50
Fall
Mean 21.8 27.9 18.7 – 16.4 12.7 – – – 21.2 20.4 – –
RS SD 9.7 11.2 9.2 – 7.9 5.9 – – – 9.4 9.4 – –
SEM 2.7 3.3 2.7 – 2.7 2.4 – – – 3.1 3.2 – –
Mean 261.7 263.0 260.6 262.2 262.6 262.7 262.6 262.4 262.4 262.9 262.1 262.4 262.4
SS SD 44.9 44.0 33.0 36.0 38.5 39.3 35.4 35.1 36.0 44.0 44.2 36.9 37.0
SEM 13.5 12.9 9.3 8.0 13.3 16.0 10.4 6.5 7.8 14.5 14.7 5.6 6.2
K-R 20 .920 .914 .910 .951 .881 .834 .914 .965 .954 .891 .889 .977 .972
Spring
Mean 22.8 29.1 20.2 – 17.4 13.4 – – – 22.2 21.4 – –
RS SD 9.9 11.4 9.6 – 8.3 6.2 – – – 9.9 10.1 – –
SEM 2.7 3.3 2.7 – 2.7 2.4 – – – 3.1 3.1 – –
Mean 266.5 267.7 265.9 267.0 267.3 266.9 267.2 267.1 267.2 267.5 266.9 267.1 267.2
SS SD 46.2 45.1 34.1 36.8 39.5 40.5 36.5 36.0 36.6 45.3 45.5 37.7 37.6
SEM 13.1 12.8 9.3 7.9 13.0 15.5 10.1 6.4 7.6 14.2 14.2 5.4 6.1
K-R 20 .925 .919 .920 .954 .892 .853 .923 .968 .957 .902 .903 .979 .974
Continued on next page…
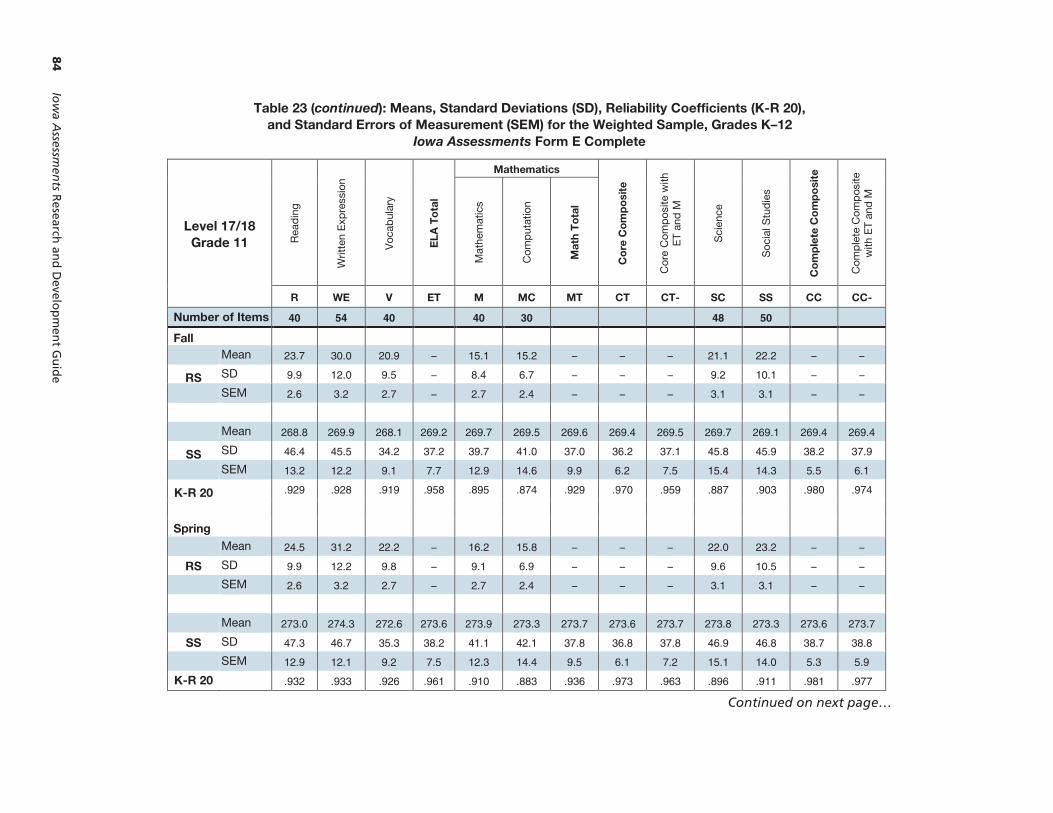
84
Io
wa A
ssessmen
ts Research
and
Develo
pm
ent G
uid
e
Table 23 (continued): Means, Standard Deviations (SD), Reliability Coefficients (K-R 20), and Standard Errors of Measurement (SEM) for the Weighted Sample, Grades K–12
Iowa Assessments Form E Complete
Level 17/18 Grade 11 R
ead
ing
Writ
ten
Exp
ress
ion
Voc
abul
ary
EL
A T
ota
l
Mathematics
Co
re C
om
po
site
Cor
e C
omp
osite
with
E
T an
d M
Sci
ence
Soc
ial S
tud
ies
Co
mp
lete
Co
mp
osi
te
Com
ple
te C
omp
osite
w
ith E
T an
d M
Mat
hem
atic
s
Com
put
atio
n
Mat
h T
ota
l
R WE V ET M MC MT CT CT- SC SS CC CC-
Number of Items 40 54 40 40 30 48 50
Fall
Mean 23.7 30.0 20.9 – 15.1 15.2 – – – 21.1 22.2 – –
RS SD 9.9 12.0 9.5 – 8.4 6.7 – – – 9.2 10.1 – –
SEM 2.6 3.2 2.7 – 2.7 2.4 – – – 3.1 3.1 – –
Mean 268.8 269.9 268.1 269.2 269.7 269.5 269.6 269.4 269.5 269.7 269.1 269.4 269.4
SS SD 46.4 45.5 34.2 37.2 39.7 41.0 37.0 36.2 37.1 45.8 45.9 38.2 37.9
SEM 13.2 12.2 9.1 7.7 12.9 14.6 9.9 6.2 7.5 15.4 14.3 5.5 6.1
K-R 20 .929 .928 .919 .958 .895 .874 .929 .970 .959 .887 .903 .980 .974
Spring
Mean 24.5 31.2 22.2 – 16.2 15.8 – – – 22.0 23.2 – –
RS SD 9.9 12.2 9.8 – 9.1 6.9 – – – 9.6 10.5 – –
SEM 2.6 3.2 2.7 – 2.7 2.4 – – – 3.1 3.1 – –
Mean 273.0 274.3 272.6 273.6 273.9 273.3 273.7 273.6 273.7 273.8 273.3 273.6 273.7
SS SD 47.3 46.7 35.3 38.2 41.1 42.1 37.8 36.8 37.8 46.9 46.8 38.7 38.8
SEM 12.9 12.1 9.2 7.5 12.3 14.4 9.5 6.1 7.2 15.1 14.0 5.3 5.9
K-R 20
.932 .933 .926 .961 .910 .883 .936 .973 .963 .896 .911 .981 .977
Continued on next page…

Reliab
ility 8
5
Table 23 (continued): Means, Standard Deviations (SD), Reliability Coefficients (K-R 20), and Standard Errors of Measurement (SEM) for the Weighted Sample, Grades K–12
Iowa Assessments Form E Complete
Level 17/18 Grade 12 R
ead
ing
Writ
ten
Exp
ress
ion
Voc
abul
ary
EL
A T
ota
l
Mathematics
Co
re C
om
po
site
Cor
e C
omp
osite
w
ith E
T an
d M
Sci
ence
Soc
ial S
tud
ies
Co
mp
lete
Co
mp
osi
te
Com
ple
te C
omp
osite
w
ith E
T an
d M
Mat
hem
atic
s
Com
put
atio
n
Mat
h T
ota
l
R WE V ET M MC MT CT CT- SC SS CC CC-
Number of Items 40 54 40 40 30 48 50
Fall
Mean 25.0 31.6 22.5 – 16.5 16.0 – – – 22.3 23.7 – –
RS SD 9.9 12.2 9.8 – 9.3 7.0 – – – 9.7 10.7 – –
SEM 2.6 3.2 2.6 – 2.7 2.4 – – – 3.1 3.1 – –
Mean 274.6 276.1 273.9 275.2 275.6 275.1 275.4 275.3 275.4 274.9 275.1 275.2 275.3
SS SD 47.3 46.8 35.3 38.2 41.4 42.5 38.1 37.1 37.8 47.1 47.0 39.0 39.2
SEM 12.8 12.1 9.2 7.5 12.1 14.3 9.4 6.0 7.1 15.0 13.7 5.3 5.8
K-R 20 .932 .933 .927 .961 .914 .887 .939 .974 .964 .898 .915 .982 .978
Spring
Mean 25.6 32.5 23.6 – 17.3 16.6 – – – 23.1 24.7 – –
RS SD 9.9 12.4 9.9 – 9.7 7.2 – – – 10.0 11.2 – –
SEM 2.6 3.1 2.6 – 2.7 2.3 – – – 3.1 3.1 – –
Mean 278.2 279.6 277.6 278.8 278.8 278.7 278.8 178.8 278.8 278.3 279.1 278.8 278.8
SS SD 48.1 47.7 36.2 38.8 42.3 43.4 38.7 37.8 38.2 47.7 47.9 39.4 39.5
SEM 12.5 12.0 9.3 7.4 11.8 14.1 9.2 5.9 7.0 14.8 13.3 5.2 5.7
K-R 20 .934 .937 .932 .963 .922 .894 .944 .976 .967 .904 .923 .983 .979

86 Iowa Assessments Research and Development Guide
Table 24: Means, Standard Deviations (SD), Reliability Coefficients (K-R 20), and Standard Errors of Measurement (SEM), Levels 7–14
Iowa Assessments Form E Survey
Level 7 Rea
din
g
Writ
ten
Exp
ress
ion
Mat
hem
atic
s
Level 8 Rea
din
g
Writ
ten
Exp
ress
ion
Mat
hem
atic
s
R WE M R WE M
Number of Items 28 34 29 Number of Items 30 42 32
Fall, Grade 2 Fall, Grade 3
Mean 21.6 23.6 20.8 Mean 22.2 31.3 22.4
RS SD 5.7 6.7 4.7 RS SD 5.6 8.4 5.5
SEM 1.9 2.3 2.0 SEM 2.1 2.4 2.2
Mean 158.2 158.1 157.0 Mean 176.5 177.0 175.3
SS SD 15.8 15.1 14.8 SS SD 20.1 19.5 18.4
SEM – – – SEM – – –
K-R 20 .891 .879 .811 K-R 20 .865 .920 .837
Spring, Grade 1 Spring, Grade 2
Mean 18.9 20.0 18.6 Mean 20.5 29.2 20.3
RS SD 6.4 6.6 4.5 RS SD 5.8 7.9 5.4
SEM 2.1 2.6 2.2 SEM 2.2 2.7 2.4
Mean 151.6 151.5 150.4 Mean 169.7 169.8 168.6
SS SD 13.5 13.4 13.6 SS SD 19.1 17.2 16.9
SEM – – – SEM – 5.8 –
K-R 20 .893 .808 .753 K-R 20 .857 .886 .810
Continued on next page…
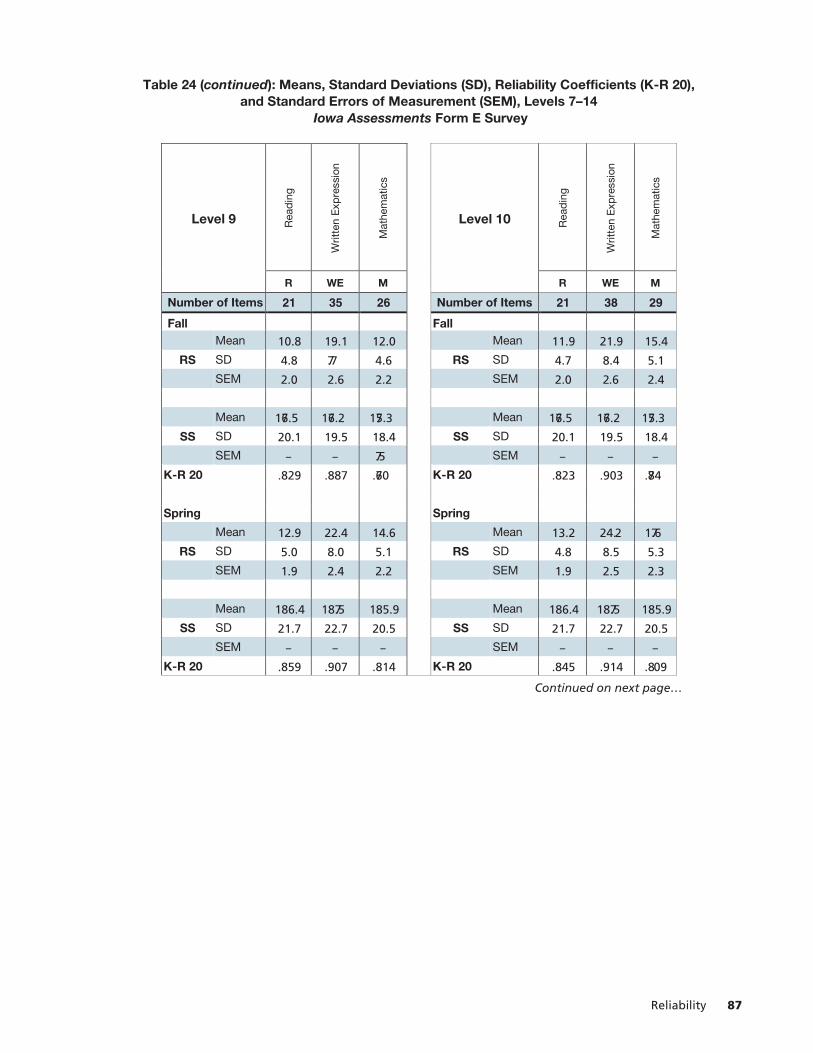
Reliability 87
Table 24 (continued): Means, Standard Deviations (SD), Reliability Coefficients (K-R 20), and Standard Errors of Measurement (SEM), Levels 7–14
Iowa Assessments Form E Survey
Level 9 Rea
din
g
Writ
ten
Exp
ress
ion
Mat
hem
atic
s
Level 10 Rea
din
g
Writ
ten
Exp
ress
ion
Mat
hem
atic
s
R WE M R WE M
Number of Items 21 35 26 Number of Items 21 38 29
Fall Fall
Mean 10.8 19.1 12.0 Mean 11.9 21.9 15.4
RS SD 4.8 7.7 4.6 RS SD 4.7 8.4 5.1
SEM 2.0 2.6 2.2 SEM 2.0 2.6 2.4
Mean 176.5 176.2 175.3 Mean 176.5 176.2 175.3
SS SD 20.1 19.5 18.4 SS SD 20.1 19.5 18.4
SEM – – 7.5 SEM – – –
K-R 20 .829 .887 .760 K-R 20 .823 .903 .784
Spring Spring
Mean 12.9 22.4 14.6 Mean 13.2 24.2 17.6
RS SD 5.0 8.0 5.1 RS SD 4.8 8.5 5.3
SEM 1.9 2.4 2.2 SEM 1.9 2.5 2.3
Mean 186.4 187.5 185.9 Mean 186.4 187.5 185.9
SS SD 21.7 22.7 20.5 SS SD 21.7 22.7 20.5
SEM – – – SEM – – –
K-R 20 .859 .907 .814 K-R 20 .845 .914 .809
Continued on next page…

88 Iowa Assessments Research and Development Guide
Table 24 (continued): Means, Standard Deviations (SD), Reliability Coefficients (K-R 20), and Standard Errors of Measurement (SEM), Levels 7–14
Iowa Assessments Form E Survey
Level 11 Rea
din
g
Writ
ten
Exp
ress
ion
Mat
hem
atic
s
Level 12 Rea
din
g
Writ
ten
Exp
ress
ion
Mat
hem
atic
s
R WE M R WE M
Number of Items 22 40 31 Number of Items 22 43 34
Fall Fall
Mean 12.6 24.7 16.4 Mean 14.0 26.5 17.5
RS SD 5.0 8.9 5.7 RS SD 4.9 8.7 6.6
SEM 2.0 2.6 2.5 SEM 1.9 2.8 2.6
Mean 176.5 176.2 175.3 Mean 176.5 176.2 175.3
SS SD 20.1 19.5 18.4 SS SD 20.1 19.5 18.4
SEM – – – SEM – – –
K-R 20 .837 .912 .808 K-R 20 .847 .899 .840
Spring Spring
Mean 13.8 26.5 18.3 Mean 14.9 27.9 19.3
RS SD 5.1 9.0 6.0 RS SD 4.9 9.0 6.9
SEM 1.9 2.5 2.4 SEM 1.8 2.7 2.6
Mean 186.4 187.5 185.9 Mean 186.4 187.5 185.9
SS SD 21.7 22.7 20.5 SS SD 21.7 22.7 20.5
SEM – – 8.1 SEM – – –
K-R 20 .858 .921 .836 K-R 20 .860 .910 .859
Continued on next page…

Reliability 89
Table 24 (continued): Means, Standard Deviations (SD), Reliability Coefficients (K-R 20), and Standard Errors of Measurement (SEM), Levels 7–14
Iowa Assessments Form E Survey
Level 13 Rea
din
g
Writ
ten
Exp
ress
ion
Mat
hem
atic
s
Level 14 Rea
din
g
Writ
ten
Exp
ress
ion
Mat
hem
atic
s
R WE M R WE M
Number of Items 23 45 36 Number of Items 23 48 39
Fall Fall
Mean 13.8 26.7 20.2 Mean 14.2 28.3 20.3
RS SD 5.1 9.0 7.4 RS SD 5.2 10.3 7.9
SEM 2.1 2.9 2.5 SEM 2.0 3.0 2.7
Mean 176.5 176.2 175.3 Mean 176.5 176.2 175.3
SS SD 20.1 19.5 18.4 SS SD 20.1 19.5 18.4
SEM – – – SEM – – –
K-R 20 .840 .897 .882 K-R 20 .846 .917 .880
Spring Spring
Mean 14.9 27.9 21.7 Mean 15.0 29.5 21.6
RS SD 5.2 9.2 7.6 RS SD 5.3 10.5 8.2
SEM 2.0 2.8 2.5 SEM 2.0 2.9 2.7
Mean 186.4 187.5 185.9 Mean 186.4 187.5 185.9
SS SD 21.7 22.7 20.5 SS SD 21.7 22.7 20.5
SEM – – – SEM – – –
K-R 20 .850 .906 .894 K-R 20 .858 .923 .890

90 Iowa Assessments Research and Development Guide
Sources of Variation in Measurement Further investigation of sources of variation that might affect scores on large-scale assessments was provided in two studies of reliability based on test administrations from multiple occasions. The first used data from the 2010 equating of Form E of the Iowa Assessments and Form A of the ITBS/ITED. The second used data from a 2011–2012 comparability study involving Levels 5/6–17/18 in kindergarten through grade 11.
As previously described, Form E of the Iowa Assessments and Form A of the ITBS/ITED were administered to a large national sample of schools that were selected to be representative with respect to variability in achievement. The matched records from this study made an analysis of relative contributions of various sources of measurement error across tests, grades, and schools possible. Results are reported for the Reading and Mathematics tests.
In addition to alternate-forms reliability coefficients, three other “within-forms” reliability coefficients were computed:
• K-R 20 reliability coefficients were calculated from the item-response records.
• Split-halves coefficients were computed by correlating raw scores from odd-numbered versus even-numbered items. Full-test reliabilities were estimated using the Spearman-Brown formula.
• Split-halves coefficients were computed by correlating raw scores from items in the separately timed Part 1 and Part 2 of the Reading and Mathematics tests. Again, full-test reliabilities were estimated using the Spearman-Brown formula.
Table 25 presents the results of the analysis of the within-forms and between-forms estimates of reliability. Differences between within-forms estimates obtained in the same testing session (K-R 20, SHOE, and SHpt1/pt2) and alternate-forms estimates obtained a week or two apart (A–F) constitute the best evidence on the effects of changes in student motivation and behavior across several days.
Although the median reliability coefficients for the same-day estimates are quite similar (and expected to be so in that K-R 20 is the theoretical average of all possible split-half coefficients), there are small differences between same-day and different-day estimates (see table on next page.)

Reliability 91
Table 25: Reliability Coefficients Based on K-R 20, Split-Halves from Odd-Even (SHOE) and Timed Parts (SHpt1/pt2), and Alternate Forms (A–F)
Iowa Assessments Form E, 2010 National Comparison Study
Grade Level Reading Mathematics
K-R 20 SHOE SHpt1/pt2 A–F K-R 20 SHOE SHpt1/pt2 A–F
3 9 .90 .90 .85 .84 .86 .88 .84 .83
4 10 .90 .91 .87 .82 .88 .89 .86 .84
5 11 .91 .91 .87 .82 .89 .90 .86 .84
6 12 .91 .92 .88 .83 .91 .91 .88 .85
7 13 .91 .91 .88 .80 .93 .93 .91 .86
8 14 .91 .92 .89 .84 .93 .94 .91 .89
9 15 .91 .92 .80 .72 .88 .89 .80 .75
10 16 .92 .93 .82 .76 .88 .89 .79 .78
11 17/18 .93 .94 .84 .58 .90 .89 .83 .51
Median .91 .92 .86 .85 .89 .89 .85 .84
Another study of sources of variation in measurement was completed during the 2011–2012 comparability study of paper-based and computer-based administrations of Iowa Assessments Form E. In this study, the same students took Form E in both administration modes. The order of testing modes was counterbalanced, and an interval of between one and two weeks separated the two administrations. Correlations between scores in different modes can be interpreted as estimates of test-retest reliability. While the mode of administration does represent an additional source of variation in these scores, high correlations constitute evidence that the combined effects of temporal changes in examinees and administrative conditions are small. These correlations are reported in Table 26. The median test-retest correlations range from .73 in Mathematics and Social Studies to .80 in Reading and Written Expression. The values are predictably lower than internal-consistency reliability estimates reported previously and somewhat lower than the alternate-forms coefficients reported in Table 25. This is probably due to the presence of a small amount of variation in scores due to the mode of administration—paper-based versus computer-based.

92 Iowa Assessments Research and Development Guide
Table 26: Estimates of Test-Retest Reliability, Iowa Assessments Form E
Level (Grade) N R WE M SS SC
5/6 (1) 1,192 0.86 0.68 0.66 – –
7 (2) 1,059 0.82 0.76 0.76 0.63 0.65
8 (2) 1,073 0.87 0.74 0.74 0.69 0.71
9 (3) 253 0.68 0.80 0.71 0.70 0.77
10 (4) 249 0.81 0.84 0.86 0.73 0.77
11 (5) 254 0.82 0.79 0.68 0.72 0.67
12 (6) 329 0.71 0.90 0.72 0.85 0.84
13 (7) 306 0.80 0.92 0.83 0.90 0.89
14 (8) 314 0.79 0.82 0.73 0.80 0.82
15 (9) 282 0.73 0.65 0.77 0.74 0.75
16 (10) 292 0.68 0.59 0.57 0.81 0.67
17/18 (11/12) 372 0.77 0.74 0.73 0.66 0.65
Average – .80 .80 .73 .73 .75 Note: Correlations include occasion and mode of administration variance.
Conditional Standard Errors of Measurement for Selected Score Levels Examinee-level errors of measurement based on a single test administration, conditional standard errors of measurement (CSEMs), were estimated using several procedures identified by previous studies to yield similar results (Feldt and Qualls, 1998; Qualls-Payne, 1992).
The results in Table 27 were obtained using a method developed by Brennan and Lee (1997) for smoothing a plot of conditional standard errors of scaled scores based on the binomial error model. In addition to this method, an approach developed by Feldt and Qualls (1998) and another based on bootstrap techniques were used at selected test levels. Because the results of all three methods agreed closely and generally matched the patterns of varying SEMs by score level found with previous editions of the ITBS and ITED, only the results of the Brennan and Lee method are provided.

Reliability 93
Table 27: Standard Errors of Measurement for Selected NSS Ranges Iowa Assessments Form E
Level 5/6
Rea
din
g
Lang
uag
e
Vo
cab
ular
y
Wo
rd A
naly
sis
List
enin
g
Mat
hem
atic
s
Rea
din
g W
ord
s
Rea
din
g
Co
mp
rehe
nsio
n
NSS Range R L V WA Li M RW RC
90–99 – 2.68 2.39 2.59 4.63 2.50 – –
100–109 3.00 5.39 3.65 4.78 6.18 4.30 – 5.67
110–119 4.75 8.91 5.21 4.13 5.48 4.97 7.61 7.53
120–129 5.28 10.77 6.94 5.14 6.11 4.33 7.23 8.53
130–139 3.43 10.77 6.92 6.91 6.74 5.17 3.85 5.95
140–149 2.25 11.24 7.54 11.19 7.56 5.29 4.97 3.71
150–159 5.94 12.22 7.23 11.97 8.00 6.06 7.67 8.00
160–169 – 12.54 6.13 10.00 10.26 6.89 – –
170–179 – 12.20 4.25 – 7.75 – – –
180–189 – 8.50 – – – – – –
Level 7
Rea
din
g
Vo
cab
ular
y
Lang
uag
e
Wo
rd A
naly
sis
List
enin
g
Mat
hem
atic
s
Co
mp
utat
ion
So
cial
Stu
die
s
Sci
ence
NSS Range R V L WA Li M MC SS SC
100–109 – 4.24 4.07 2.39 3.51 2.42 – 2.82 2.23
110–119 3.24 7.16 6.61 5.44 6.01 5.53 6.11 4.86 5.80
120–129 6.57 9.18 7.09 6.69 6.40 7.26 7.81 5.70 7.72
130–139 5.44 8.34 6.37 7.69 6.90 7.78 4.80 7.78 10.52
140–149 3.48 5.34 5.70 8.01 6.86 7.50 3.68 9.55 12.04
150–159 4.51 5.76 4.55 9.14 7.42 6.99 4.64 10.63 12.73
160–169 8.60 7.98 5.45 10.93 10.16 6.38 4.49 11.69 13.66
170–179 8.64 10.94 5.83 10.30 11.09 6.47 – 12.24 12.80
180–189 7.00 8.75 4.00 8.00 9.00 4.89 – 9.67 11.39
190–199 – – – – – – – – 8.75
Continued on next page…

94 Iowa Assessments Research and Development Guide
Table 27 (continued): Standard Errors of Measurement for Selected NSS Levels Iowa Assessments Form E
Level 8
Rea
din
g
Vo
cab
ular
y
Lang
uag
e
Wo
rd A
naly
sis
List
enin
g
Mat
hem
atic
s
Co
mp
utat
ion
So
cial
Stu
die
s
Sci
ence
NSS Range R V L WA Li M MC SS SC
100–109 – 3.86 2.40 2.00 3.50 1.87 – 3.25 2.00
110–119 3.61 6.80 4.76 5.21 6.48 4.52 4.97 5.53 4.30
120–129 7.52 9.55 7.62 7.63 7.98 7.04 8.53 7.11 6.86
130–139 7.46 10.78 8.13 8.06 6.90 7.32 8.84 6.18 7.22
140–149 5.36 10.51 6.98 7.82 7.13 6.31 4.86 6.72 8.54
150–159 4.78 9.37 5.72 8.33 8.36 6.78 5.76 9.15 11.16
160–169 6.18 9.39 4.86 10.76 8.16 7.21 8.18 10.95 12.85
170–179 8.29 10.78 7.25 13.35 9.90 7.69 10.30 12.16 14.16
180–189 11.30 10.94 9.50 15.23 12.73 8.06 12.20 11.73 15.91
190–199 12.73 11.88 9.76 17.33 12.76 8.36 9.92 12.22 16.31
200–209 11.16 10.53 8.38 15.59 10.25 7.01 – 11.11 15.02
210–219 8.50 8.25 6.40 12.00 – 4.80 – 8.25 13.05
220–229 – – – – – – – – 9.50
Continued on next page…

Reliability 95
Table 27 (continued): Standard Errors of Measurement for Selected NSS Levels Iowa Assessments Form E
Level 9
Rea
din
g
Vo
cab
ular
y
Sp
ellin
g
Cap
ital
izat
ion
Pun
ctua
tio
n
Lang
uag
e
Wo
rd A
naly
sis
List
enin
g
Mat
hem
atic
s
Co
mp
utat
ion
So
cial
Stu
die
s
Sci
ence
NSS Range R V SP CP PC L WA Li M MC SS SC
110–119 – – – – – – 4.06 5.18 – – – –
120–129 4.07 3.99 5.67 8.00 4.38 4.62 7.38 3.48 4.00 3.58
130–139 5.46 7.43 7.00 10.24 11.01 6.18 6.80 7.81 5.08 6.36 5.42 6.19
140–149 6.65 9.51 6.88 13.76 11.88 8.11 10.89 9.24 5.90 9.41 5.98 9.18
150–159 7.88 9.40 8.06 14.40 12.65 9.42 12.63 12.00 6.91 9.83 6.95 10.75
160–169 6.80 8.38 9.05 12.04 12.09 8.32 13.02 12.55 8.23 6.77 7.06 8.31
170–179 5.82 6.15 7.00 7.76 11.64 6.58 13.07 11.92 8.02 5.32 7.97 7.29
180–189 7.18 6.19 7.82 8.01 9.91 6.70 13.85 13.16 6.99 5.04 10.44 11.00
190–199 10.34 8.09 10.72 11.47 13.29 10.84 15.07 13.91 7.62 8.35 10.32 13.62
200–209 13.70 12.93 12.59 14.22 17.35 13.95 15.06 12.16 8.61 9.97 11.01 14.05
210–219 15.11 – 12.81 18.43 18.38 14.35 13.25 11.18 7.62 8.50 13.22 13.98
220–229 14.67 10.50 9.67 22.02 16.98 16.08 12.91 10.00 7.36 – – 13.89
230–239 13.51 – – – 15.56 14.21 11.14 7.00 5.95 – 10.25 14.48
240–249 11.87 – – 18.33 15.14 11.00 8.25 – 4.40 – – 12.78
250–259 8.80 – – – 11.67 – – – – – – 10.00
Continued on next page…

96 Iowa Assessments Research and Development Guide
Table 27 (continued): Standard Errors of Measurement for Selected NSS Levels Iowa Assessments Form E
Level 10
Rea
din
g
Vo
cab
ular
y
Sp
ellin
g
Cap
ital
izat
ion
Pun
ctua
tio
n
Wri
tten
E
xpre
ssio
n
Mat
hem
atic
s
Co
mp
utat
ion
So
cial
Stu
die
s
Sci
ence
NSS Range R V SP CP PC WE M MC SS SC
120–129 3.81 3.25 – – – 4.12 2.80 – – 4.25
130–139 5.73 5.88 6.75 7.14 9.18 6.35 4.52 5.75 5.70 5.86
140–149 7.19 10.48 9.15 10.96 12.77 8.89 5.24 7.63 6.99 6.57
150–159 8.28 12.97 9.32 14.59 14.35 11.49 6.68 8.25 7.12 7.78
160–169 7.97 12.60 8.21 15.50 15.59 11.26 7.51 8.29 8.60 9.89
170–179 6.92 9.10 8.08 14.19 15.30 8.64 7.74 8.92 9.05 10.97
180–189 6.96 6.39 8.36 10.39 13.12 6.75 7.85 7.37 9.03 10.67
190–199 8.10 6.16 8.24 9.73 11.98 8.31 7.96 7.01 9.26 9.86
200–209 10.77 7.00 9.86 14.75 15.13 11.70 9.21 8.25 11.38 12.12
210–219 12.66 9.15 13.08 19.78 18.48 14.17 10.28 10.82 11.94 15.25
220–229 13.90 14.27 15.99 22.13 20.12 16.54 10.27 10.82 11.62 16.32
230–239 14.60 13.37 17.20 23.15 19.78 16.33 9.44 8.75 11.79 15.12
240–249 14.58 11.00 15.81 – 18.11 15.84 8.71 – 13.54 12.58
250–259 11.87 – 12.50 22.24 16.20 15.83 7.65 – – 12.49
260–269 9.00 – – 21.74 14.42 13.67 5.55 – 10.25 9.00
270–279 – – – – 13.80 10.00 – – – –
280–289 – – – 16.67 10.67 – – – – –
Continued on next page…

Reliability 97
Table 27 (continued): Standard Errors of Measurement for Selected NSS Levels Iowa Assessments Form E
Level 11
Rea
din
g
Vo
cab
ular
y
Sp
ellin
g
Cap
ital
izat
ion
Pun
ctua
tio
n
Wri
tten
E
xpre
ssio
n
Mat
hem
atic
s
Co
mp
utat
ion
So
cial
Stu
die
s
Sci
ence
NSS Range R V SP CP PC WE M MC SS SC
120–129 – – – – – 3.48 – – – –
130–139 5.07 4.62 6.50 6.00 7.33 5.78 3.28 6.50 6.25 5.18
140–149 7.03 7.76 8.34 9.11 10.63 9.94 5.56 8.33 8.53 6.61
150–159 7.32 12.39 9.17 13.43 13.52 12.48 7.45 9.31 8.66 7.11
160–169 7.89 14.11 9.61 16.25 15.75 13.40 8.27 9.68 7.11 9.50
170–179 9.08 13.10 10.03 17.06 18.04 12.57 8.63 9.97 9.14 10.79
180–189 8.97 8.79 9.37 15.83 17.10 8.62 8.97 9.28 11.43 12.55
190–199 8.76 7.48 8.79 13.95 16.35 7.67 8.98 7.90 12.31 12.59
200–209 8.81 7.56 9.24 13.76 15.50 9.59 8.74 7.68 12.57 11.87
210–219 9.75 6.64 10.35 15.19 18.11 12.31 9.07 9.35 9.75 13.84
220–229 11.51 7.32 12.63 18.17 21.59 15.30 10.45 10.53 8.76 16.39
230–239 12.88 11.18 15.20 21.82 23.02 17.62 11.37 12.28 11.86 17.34
240–249 14.61 13.94 17.36 26.16 23.00 18.58 10.51 12.93 13.27 16.85
250–259 16.38 11.50 17.83 26.55 21.61 19.59 8.73 9.75 12.65 14.89
260–269 15.21 – 15.84 22.86 18.42 20.66 8.23 – 15.00 12.62
270–279 13.27 – – 18.18 14.73 19.04 6.52 – 14.22 11.58
280–289 10.20 – 12.00 14.07 11.21 16.29 4.67 – 11.25 9.69
290–299 – – – 12.79 12.10 – – – – –
300–309 – – – 10.33 10.00 12.20 – – – –
Continued on next page…
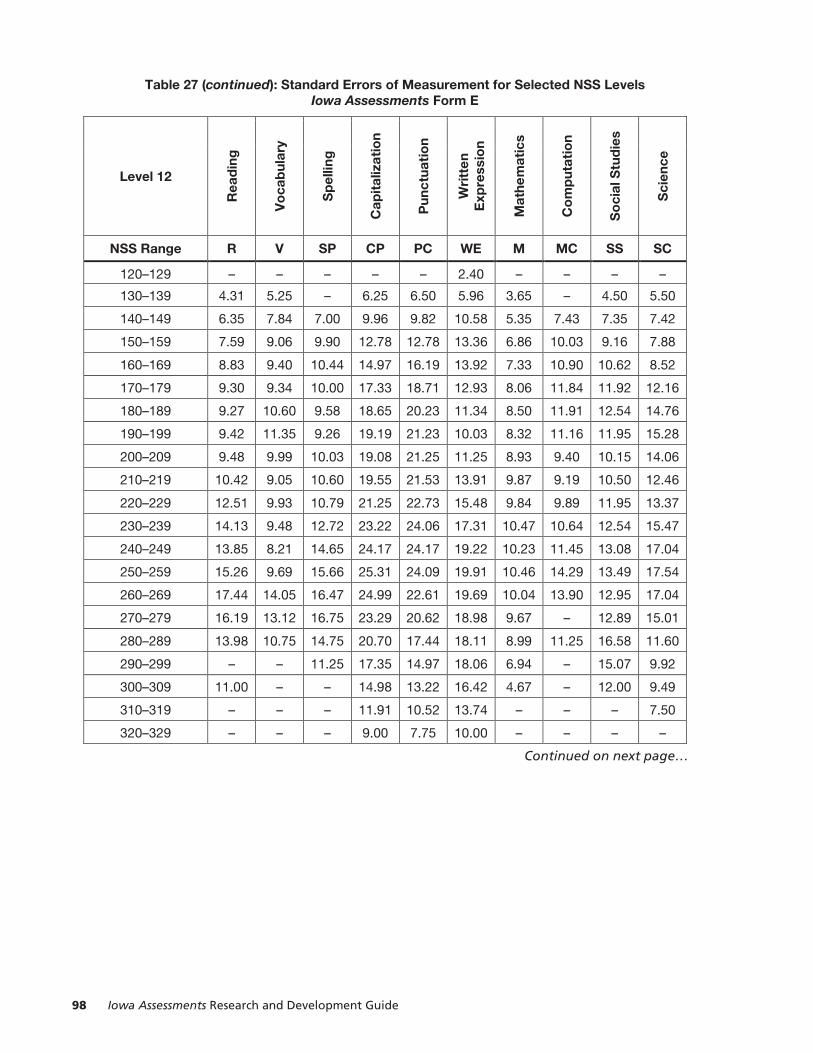
98 Iowa Assessments Research and Development Guide
Table 27 (continued): Standard Errors of Measurement for Selected NSS Levels Iowa Assessments Form E
Level 12
Rea
din
g
Vo
cab
ular
y
Sp
ellin
g
Cap
ital
izat
ion
Pun
ctua
tio
n
Wri
tten
E
xpre
ssio
n
Mat
hem
atic
s
Co
mp
utat
ion
So
cial
Stu
die
s
Sci
ence
NSS Range R V SP CP PC WE M MC SS SC
120–129 – – – – – 2.40 – – – –
130–139 4.31 5.25 – 6.25 6.50 5.96 3.65 – 4.50 5.50
140–149 6.35 7.84 7.00 9.96 9.82 10.58 5.35 7.43 7.35 7.42
150–159 7.59 9.06 9.90 12.78 12.78 13.36 6.86 10.03 9.16 7.88
160–169 8.83 9.40 10.44 14.97 16.19 13.92 7.33 10.90 10.62 8.52
170–179 9.30 9.34 10.00 17.33 18.71 12.93 8.06 11.84 11.92 12.16
180–189 9.27 10.60 9.58 18.65 20.23 11.34 8.50 11.91 12.54 14.76
190–199 9.42 11.35 9.26 19.19 21.23 10.03 8.32 11.16 11.95 15.28
200–209 9.48 9.99 10.03 19.08 21.25 11.25 8.93 9.40 10.15 14.06
210–219 10.42 9.05 10.60 19.55 21.53 13.91 9.87 9.19 10.50 12.46
220–229 12.51 9.93 10.79 21.25 22.73 15.48 9.84 9.89 11.95 13.37
230–239 14.13 9.48 12.72 23.22 24.06 17.31 10.47 10.64 12.54 15.47
240–249 13.85 8.21 14.65 24.17 24.17 19.22 10.23 11.45 13.08 17.04
250–259 15.26 9.69 15.66 25.31 24.09 19.91 10.46 14.29 13.49 17.54
260–269 17.44 14.05 16.47 24.99 22.61 19.69 10.04 13.90 12.95 17.04
270–279 16.19 13.12 16.75 23.29 20.62 18.98 9.67 – 12.89 15.01
280–289 13.98 10.75 14.75 20.70 17.44 18.11 8.99 11.25 16.58 11.60
290–299 – – 11.25 17.35 14.97 18.06 6.94 – 15.07 9.92
300–309 11.00 – – 14.98 13.22 16.42 4.67 – 12.00 9.49
310–319 – – – 11.91 10.52 13.74 – – – 7.50
320–329 – – – 9.00 7.75 10.00 – – – –
Continued on next page…

Reliability 99
Table 27 (continued): Standard Errors of Measurement for Selected NSS Levels Iowa Assessments Form E
Level 13
Rea
din
g
Vo
cab
ular
y
Sp
ellin
g
Cap
ital
izat
ion
Pun
ctua
tio
n
Wri
tten
E
xpre
ssio
n
Mat
hem
atic
s
Co
mp
utat
ion
So
cial
Stu
die
s
Sci
ence
NSS Range R V SP CP PC WE M MC SS SC
120–129 – – – – – 2.60 – – – –
130–139 4.40 4.80 – 5.50 7.00 4.63 3.17 – 5.20 –
140–149 6.18 7.12 7.75 9.01 9.98 7.80 4.85 7.50 6.98 6.19
150–159 6.89 9.22 10.03 12.23 12.76 11.77 6.61 10.29 8.70 8.31
160–169 6.90 11.39 11.16 16.53 17.25 14.24 7.77 12.78 9.31 9.22
170–179 8.84 13.46 10.32 20.11 20.91 15.73 8.69 14.22 10.27 11.06
180–189 10.41 15.03 10.57 21.76 – 15.10 9.28 14.75 11.65 12.57
190–199 11.93 15.28 11.84 23.30 22.82 13.69 9.54 14.03 13.05 13.81
200–209 11.87 13.75 12.12 23.44 23.78 12.88 9.75 13.19 12.91 12.37
210–219 11.79 12.10 12.07 22.98 23.36 12.71 9.74 11.79 12.52 11.52
220–229 11.64 11.20 11.83 22.36 22.98 14.23 9.05 10.82 12.38 12.68
230–239 12.02 10.98 12.12 22.93 22.80 16.13 8.03 10.62 12.91 13.42
240–249 12.38 9.62 13.06 23.53 23.37 19.01 8.93 10.81 13.94 15.12
250–259 12.84 8.08 14.15 24.28 23.81 20.37 9.96 10.93 14.35 15.61
260–269 14.86 9.26 14.23 23.87 23.68 21.00 10.00 10.73 13.96 16.36
270–279 15.99 11.13 14.32 23.30 22.98 21.15 8.63 11.70 13.95 17.08
280–289 17.86 12.52 13.82 20.55 21.48 20.69 7.70 13.79 13.44 15.74
290–299 16.68 10.71 13.71 17.79 18.54 19.45 8.63 – 15.59 14.33
300–309 14.91 8.00 11.98 15.04 16.63 16.98 7.98 10.50 15.43 13.10
310–319 11.60 – 9.00 12.30 14.38 15.72 5.67 – 13.73 11.27
320–329 – – – 12.06 12.23 14.97 – – 10.60 7.80
330–339 – – – 9.00 10.26 11.88 – – – –
340–349 – – – – 7.00 8.80 – – – –
Continued on next page…

100 Iowa Assessments Research and Development Guide
Table 27 (continued): Standard Errors of Measurement for Selected NSS Levels Iowa Assessments Form E
Level 14
Rea
din
g
Vo
cab
ular
y
Sp
ellin
g
Cap
ital
izat
ion
Pun
ctua
tio
n
Wri
tten
E
xpre
ssio
n
Mat
hem
atic
s
Co
mp
utat
ion
So
cial
Stu
die
s
Sci
ence
NSS Range R V SP CP PC WE M MC SS SC
130–139 4.00 – – – – 4.09 – – – –
140–149 5.82 6.42 7.25 6.24 8.11 6.95 3.79 6.50 5.69 6.19
150–159 6.69 9.64 9.75 9.81 12.52 10.94 6.42 8.90 8.87 7.73
160–169 7.32 11.89 12.25 14.51 16.06 14.19 7.88 11.32 11.13 8.47
170–179 10.68 13.97 13.30 17.59 18.98 15.95 8.77 13.35 13.04 9.67
180–189 12.76 15.14 13.98 19.60 21.83 16.27 8.84 15.05 14.25 13.40
190–199 13.73 15.61 14.14 21.13 23.06 15.79 9.65 16.06 14.68 16.16
200–209 13.30 15.55 13.51 22.14 23.68 14.54 9.70 16.87 14.70 17.91
210–219 12.42 14.42 12.69 21.65 23.24 13.27 9.30 16.99 13.37 17.44
220–229 11.75 13.00 12.56 21.80 21.27 13.12 9.13 15.13 11.85 16.01
230–239 12.13 11.85 12.82 22.37 19.79 13.45 9.68 13.40 11.71 15.33
240–249 12.14 10.91 12.67 23.28 20.26 14.05 10.64 12.34 12.63 15.07
250–259 12.28 9.20 12.90 24.41 21.45 15.79 10.50 11.94 13.69 16.29
260–269 12.48 7.67 13.61 25.71 21.80 17.11 10.00 11.16 14.68 17.32
270–279 14.06 8.41 14.66 25.18 22.04 18.99 9.64 9.86 15.31 17.70
280–289 15.10 10.32 14.55 24.09 22.16 20.60 9.42 12.22 15.52 17.86
290–299 18.60 13.13 13.95 22.05 20.57 20.73 10.31 15.36 15.09 17.63
300–309 17.41 11.41 13.34 19.54 18.78 19.57 9.71 14.19 14.66 16.87
310–319 15.38 8.80 13.44 17.02 17.59 18.53 9.57 11.50 15.39 14.79
320–329 12.00 – 11.70 14.51 15.56 17.66 8.09 – 13.42 12.30
330–339 – – 9.00 13.91 14.17 17.03 5.18 – – 10.73
340–349 – – – 11.94 12.79 14.77 – – 9.20 7.08
350–359 – – – 9.25 8.75 12.36 – – – –
360–369 – – – – – 9.20 – – – –
Continued on next page…
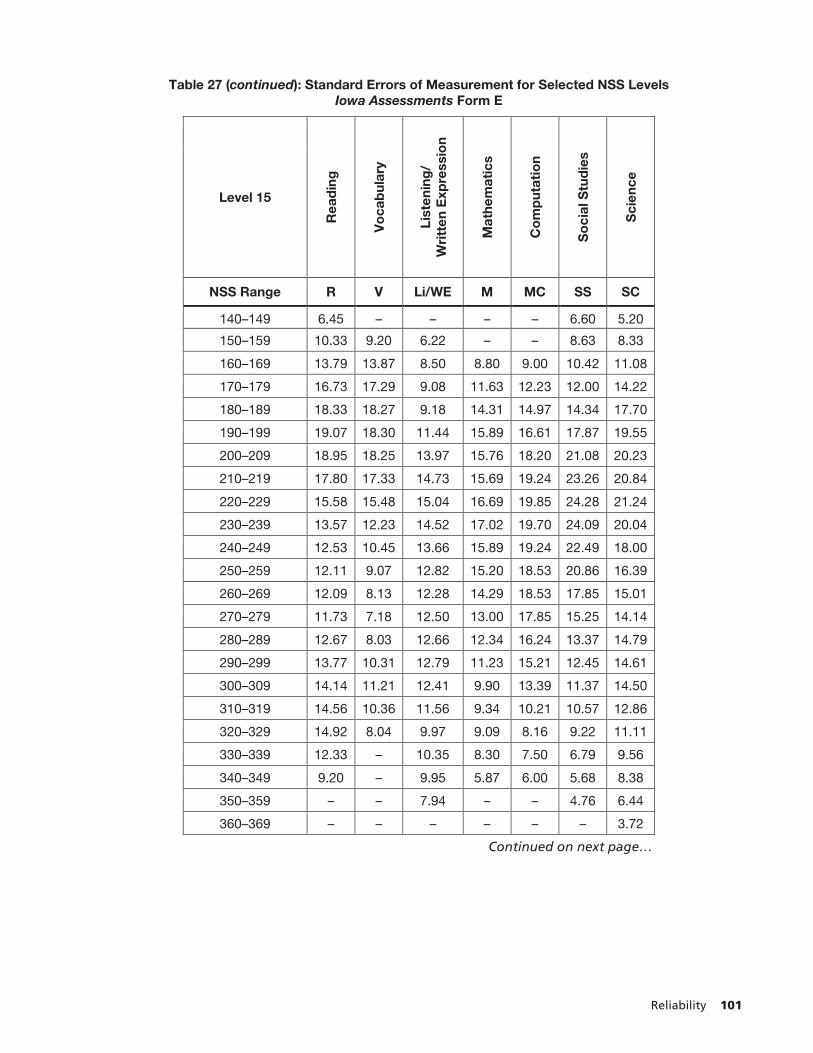
Reliability 101
Table 27 (continued): Standard Errors of Measurement for Selected NSS Levels Iowa Assessments Form E
Level 15
Rea
din
g
Vo
cab
ular
y
List
enin
g/
Wri
tten
Exp
ress
ion
Mat
hem
atic
s
Co
mp
utat
ion
So
cial
Stu
die
s
Sci
ence
NSS Range R V Li/WE M MC SS SC
140–149 6.45 – – – – 6.60 5.20
150–159 10.33 9.20 6.22 – – 8.63 8.33
160–169 13.79 13.87 8.50 8.80 9.00 10.42 11.08
170–179 16.73 17.29 9.08 11.63 12.23 12.00 14.22
180–189 18.33 18.27 9.18 14.31 14.97 14.34 17.70
190–199 19.07 18.30 11.44 15.89 16.61 17.87 19.55
200–209 18.95 18.25 13.97 15.76 18.20 21.08 20.23
210–219 17.80 17.33 14.73 15.69 19.24 23.26 20.84
220–229 15.58 15.48 15.04 16.69 19.85 24.28 21.24
230–239 13.57 12.23 14.52 17.02 19.70 24.09 20.04
240–249 12.53 10.45 13.66 15.89 19.24 22.49 18.00
250–259 12.11 9.07 12.82 15.20 18.53 20.86 16.39
260–269 12.09 8.13 12.28 14.29 18.53 17.85 15.01
270–279 11.73 7.18 12.50 13.00 17.85 15.25 14.14
280–289 12.67 8.03 12.66 12.34 16.24 13.37 14.79
290–299 13.77 10.31 12.79 11.23 15.21 12.45 14.61
300–309 14.14 11.21 12.41 9.90 13.39 11.37 14.50
310–319 14.56 10.36 11.56 9.34 10.21 10.57 12.86
320–329 14.92 8.04 9.97 9.09 8.16 9.22 11.11
330–339 12.33 – 10.35 8.30 7.50 6.79 9.56
340–349 9.20 – 9.95 5.87 6.00 5.68 8.38
350–359 – – 7.94 – – 4.76 6.44
360–369 – – – – – – 3.72
Continued on next page…

102 Iowa Assessments Research and Development Guide
Table 27 (continued): Standard Errors of Measurement for Selected NSS Levels Iowa Assessments Form E
Level 16
Rea
din
g
Vo
cab
ular
y
List
enin
g/
Wri
tten
Exp
ress
ion
Mat
hem
atic
s
Co
mp
utat
ion
So
cial
Stu
die
s
Sci
ence
NSS Range R V Li/WE M MC SS SC
140–149 5.40 – – – – 4.80 –
150–159 8.54 9.60 6.20 – – 7.50 6.75
160–169 11.76 13.49 7.94 8.60 9.00 10.60 9.56
170–179 14.58 16.15 8.68 11.63 12.78 14.42 11.56
180–189 17.34 18.01 6.46 14.55 15.88 17.68 14.79
190–199 19.39 20.12 9.72 15.89 17.99 21.55 19.88
200–209 20.45 21.16 13.05 16.81 20.07 25.52 22.81
210–219 21.19 20.27 15.52 17.93 21.91 27.07 23.88
220–229 20.63 19.06 15.62 19.06 23.56 27.81 24.11
230–239 18.46 17.06 15.30 19.19 23.81 27.26 23.47
240–249 15.76 14.27 14.82 19.45 22.98 26.19 21.67
250–259 13.37 11.73 14.35 18.73 21.01 24.99 17.47
260–269 11.72 10.20 14.20 16.96 19.56 21.49 14.39
270–279 9.93 7.97 13.79 14.89 18.00 16.32 12.49
280–289 9.80 6.47 13.40 13.60 17.18 12.42 11.65
290–299 11.06 8.11 12.96 11.68 15.93 11.00 13.08
300–309 12.47 10.89 13.00 10.46 13.76 10.72 13.69
310–319 14.13 11.35 12.51 9.29 11.45 10.57 13.64
320–329 16.81 10.12 12.28 8.22 9.52 9.71 12.29
330–339 15.91 8.84 11.50 8.81 9.09 8.25 11.00
340–349 14.19 6.60 10.63 8.06 7.79 8.23 9.84
350–359 11.00 – 9.47 6.19 5.25 7.64 8.25
360–369 – – 6.44 – – 5.46 5.23
Continued on next page…

Reliability 103
Table 27 (continued): Standard Errors of Measurement for Selected NSS Levels Iowa Assessments Form E
Level 17/18
Rea
din
g
Vo
cab
ular
y
List
enin
g/
Wri
tten
Exp
ress
ion
Mat
hem
atic
s
Co
mp
utat
ion
So
cial
Stu
die
s
Sci
ence
NSS Range R V Li/WE M MC SS SC
140–149 4.20 – – – – – –
150–159 7.71 8.60 5.35 – – 6.53 5.80
160–169 12.69 12.10 7.89 10.40 8.91 9.33 7.85
170–179 16.12 14.70 8.82 14.66 13.37 11.03 11.00
180–189 17.93 17.55 9.52 18.08 16.73 14.19 14.15
190–199 20.78 19.44 10.95 20.42 19.38 18.40 19.13
200–209 22.16 20.08 14.05 21.98 21.17 21.82 22.39
210–219 22.38 19.86 15.93 22.87 21.99 23.64 24.65
220–229 22.13 19.06 16.27 – 22.17 24.67 25.01
230–239 20.77 17.77 15.36 22.21 21.70 24.86 25.67
240–249 17.13 15.01 14.17 19.61 20.35 23.73 24.70
250–259 13.17 12.12 13.55 16.00 18.65 21.57 20.63
260–269 9.87 9.81 13.12 14.23 17.54 18.74 16.64
270–279 8.77 8.37 12.37 16.19 16.25 15.12 13.59
280–289 10.13 7.68 11.79 17.41 14.31 12.63 14.00
290–299 11.54 7.29 11.62 16.56 12.66 12.01 14.85
300–309 13.68 9.14 12.04 13.00 12.12 11.80 14.80
310–319 16.15 13.31 12.90 8.07 12.41 11.92 14.74
320–329 19.85 13.74 12.52 6.86 12.11 10.91 13.91
330–339 – 12.56 11.53 6.72 12.26 9.75 13.08
340–349 17.45 10.00 10.41 8.76 10.84 8.18 10.67
350–359 13.80 – 10.01 7.68 8.25 7.46 7.69
360–369 – – 7.00 6.20 – 6.43 6.33
370+ – – – – – – 4.56

104 Iowa Assessments Research and Development Guide

Item and Test Analysis 105
Part 7 Item and Test Analysis
In Brief This part provides a summary of the difficulty indices for all items and tests and the grades for which they are appropriate. Further, this part provides distributions of item-total correlations (item discrimination indices), a summary of ceiling and floor effects for the test, and information on completion rates as suggested by Schmeiser and Welch (2006).
Difficulty of the Assessments Teachers often remark that large-scale assessments, particularly when those assessments are used for accountability, are too difficult. To some extent, this perception is a reflection of the fact that items in well-designed large-scale assessments span a range of difficulty at any given grade level. No single assessment can be perfectly suited in difficulty for all students in a heterogeneous grade group. Individualized testing can be considered to help avoid extreme cases of an assessment not being well matched to the achievement level of certain students. In other situations, it is important to realize that an assessment aligned to important and often rigorous content standards, not to mention an assessment intended to provide information about the strengths and weaknesses of a large group of students, must include a range of difficulty in individual items.
To obtain a high reliability of scores observed within a group, an assessment must use nearly the entire range of possible scores; the raw scores on the test should range from near zero to the highest possible score so that the items provide information about the range of examinees for which the test is intended. The best way to ensure such a continuum is to conduct one or more preliminary tryouts of items that will determine objectively the difficulty and discriminating power of the items. A few items included in the final test should be so easy that at least 90 percent of students answer them correctly. These allow the assessment to identify the least-able students. Similarly, a few very difficult items should be included to challenge the most-able students. The remainder of the items, however, should cover a broad range of medium difficulty and should discriminate well at all levels of ability. An assessment constructed in this manner results in the widest possible range of scores and yields the highest reliability per unit of testing time.
The twelve levels of the Iowa Assessments were assembled to provide reliable and valid coverage of subject matter that spans the continuum of learning from kindergarten to grade 12. Item content classifications, cognitive level descriptors, and difficulty indices for three times of the school year (fall, midyear, and spring) are provided in the Content Classifications Guide, Levels 5/6–14 and Levels 15–17/18 for Iowa Assessments Form E and Form F. Each table within these guides provides content classifications and item-level descriptors. The content descriptors are cross-referenced to the Score Interpretation Guide and to various standards-based reports, including Common Core reports. The remaining columns of these tables show

106 Iowa Assessments Research and Development Guide
the item number, the average percent correct for the total test, major achievement domain groupings, and individual items. All percent correct values are based on the weighted sample from the national comparison study.
For example, there are 55 items for the Level 10 Mathematics test. The mean percent correct in grade 4 is 56 percent for fall testing, 59 percent for midyear, and 63 percent for spring. The items measuring Algebraic Patterns and Connections average 61, 64, and 67 percent correct in the fall, midyear, and spring, respectively, whereas those in the Measurement strand are more difficult, having an average percent correct of 45, 49, and 53 respectively at the three times of the year (see Kapoor, 2014).
In Levels 9 through 17/18 of the Iowa Assessments, most items are administered in two consecutive grades. In Reading at the high school level, for example, item 19 appears in Levels 15 and 16, and the national percent correct is provided for both grades 9 and 10. In grade 9, the percentage of students answering this item correctly is 43, 48, and 52 for fall, midyear, and spring, respectively. In grade 10, the percent correct is 57, 58, and 60, respectively. The differences between the percent correct at grade 9 and grade 10 reflect the amount of growth measured by this item over the grade span, and the consistent increase in the percent correct—from 43 percent to 60 percent—shows that this item is sensitive to a progression of learning across the two grades.
The distributions of item difficulty are shown in Table 28. The results are based on an analysis of the weighted sample from the 2010 fall national comparison study of Form E. These distributions also illustrate the variability in item difficulty needed to provide reliable measurement throughout the ability range of students at any given grade level. As stated previously, It is extremely important in test development to include both relatively easy and relatively difficult items at each level of the assessment. Not only are such items needed for motivational reasons, but they are critical for a test to have enough ceiling for the most capable students and enough floor for the least capable ones. Nearly all tests and all levels have some items with proportions correct above .8 as well as some with proportions correct below .3.

Item and Test Analysis 107
Table 28: Distribution of Item Difficulties Iowa Assessments Form E, Fall 2010
National Comparison Study
Level 5/6 Grade K
Spring Data
English Language Arts
Mat
hem
atic
s
Rea
din
g
Lan
gu
age
Vo
cab
ula
ry
Wo
rd
An
alys
is
Lis
ten
ing
R L V WA Li M
Proportion Correct
>=.90 – – 1 3 – –
.80–.89 – 2 3 12 – 2
.70–.79 – 6 3 7 4 5
.60–.69 1 6 6 5 7 7
.50–.59 2 5 6 4 6 6
.40–.49 6 7 4 1 5 6
.30–.39 14 4 1 – 3 3
.20–.29 8 1 3 1 2 3
.10–.19 3 – – – – 3
< .10 – – – – – –
Average .34 .56 .59 .74 .53 .53
Level 5/6 Grade 1 Fall Data
English Language Arts
Mat
hem
atic
s
Rea
din
g
Lan
gu
age
Vo
cab
ula
ry
Wo
rd
An
alys
is
Lis
ten
ing
R L V WA Li M
Proportion Correct
>=.90 – 1 2 10 – 1
.80–.89 – 7 5 14 4 8
.70–.79 3 6 5 4 8 7
.60–.69 6 4 6 3 6 6
.50–.59 11 5 3 1 3 5
.40–.49 11 7 3 1 3 3
.30–.39 3 – 2 – 2 4
.20–.29 – 1 1 – 1 1
.10–.19 – – – – – –
< .10 – – – – – –
Average .53 .65 .65 .82 .63 .65
Continued on next page…

108 Iowa Assessments Research and Development Guide
Table 28 (continued): Distribution of Item Difficulties Iowa Assessments Form E, Fall 2010 National Comparison Study
Level 7 Grade 2 Fall Data
English Language Arts Mathematics
Sci
ence
So
cial
Stu
die
s
Rea
din
g
Lan
gu
age
Vo
cab
ula
ry
Wo
rd
An
alys
is
Lis
ten
ing
Mat
hem
atic
s
Co
mp
utat
ion
R L V WA Li M MC SC SS
Proportion Correct
>=.90 3 1 2 9 2 9 2 9 9
.80–.89 15 11 5 9 12 7 7 8 9
.70–.79 7 5 6 7 7 9 8 7 2
.60–.69 7 8 7 6 3 5 5 1 5
.50–.59 1 6 3 1 1 4 3 1 2
.40–.49 1 2 2 – 1 2 – 2 2
.30–.39 1 1 – – 1 3 – 1 –
.20–.29 – – 1 – – 2 – – –
.10–.19 – – – – – – – – –
< .10 – – – – – – – – –
Average .77 .69 .69 .81 .75 .71 .75 .79 .79
Level 8 Grade 2 Fall Data
English Language Arts Mathematics
Sci
ence
So
cial
Stu
die
s
Rea
din
g
Lan
gu
age
Vo
cab
ula
ry
Wo
rd
An
alys
is
Lis
ten
ing
Mat
hem
atic
s
Co
mp
utat
ion
R L V WA Li M MC SC SS
Proportion Correct
>=.90 – – – – – – – – –
.80–.89 1 – 3 10 2 4 – 3 5
.70–.79 8 3 3 8 3 16 1 9 3
.60–.69 10 13 3 11 8 6 12 5 11
.50–.59 11 17 3 – 9 6 9 3 3
.40–.49 5 7 5 2 4 6 3 3 3
.30–.39 2 1 7 1 1 2 1 3 2
.20–.29 – – 2 – – 2 1 3 1
.10–.19 1 1 – 1 – 4 – – 1
< .10 – – – – – – – – –
Average .58 .56 .52 .69 .60 .59 .57 .60 .61
Continued on next page…

Item and Test Analysis 109
Table 28 (continued): Distribution of Item Difficulties Iowa Assessments Form E, Fall 2010 National Comparison Study
Level 8 Grade 3 Fall Data
English Language Arts Mathematics
Sci
ence
So
cial
Stu
die
s
Rea
din
g
Lan
gu
age
Vo
cab
ula
ry
Wo
rd
An
alys
is
Lis
ten
ing
Mat
hem
atic
s
Co
mp
utat
ion
R L V WA Li M MC SC SS
Proportion Correct
>=.90 6 3 6 13 4 10 – 6 6
.80–.89 12 15 1 5 6 15 15 8 11
.70–.79 11 15 5 10 10 6 10 5 4
.60–.69 4 7 3 2 5 6 – 1 3
.50–.59 4 1 8 2 2 4 2 4 2
.40–.49 – – 2 – – 1 – 5 1
.30–.39 1 1 1 – – 4 – – 2
.20–.29 – – – 1 – – – – –
.10–.19 – – – – – – – – –
< .10 – – – – – – – – –
Average .76 .76 .68 .81 .77 .75 .79 .74 .76
Level 9 Grade 3 Fall Data
English Language Arts
Mathematics
Sci
ence
So
cial
Stu
die
s
Rea
din
g
Wri
tten
Exp
ress
ion Conventions of
Writing
Vo
cab
ula
ry
Wo
rd A
nal
ysis
Lis
ten
ing
Sp
ellin
g
Cap
ital
izat
ion
Pu
nct
uat
ion
Mat
hem
atic
s
Co
mp
utat
ion
R WE SP CP PC V WA Li M MC SC SS
Proportion Correct
>=.90 – – – – – – 2 3 – – – –
.80–.89 5 – 1 – – 1 4 3 3 – 2 2
.70–.79 5 2 4 1 1 3 5 4 7 1 3 8
.60–.69 8 10 3 4 2 5 10 2 10 5 6 6
.50–.59 8 14 6 4 4 12 9 6 7 5 6 8
.40–.49 8 5 6 7 6 5 – 3 7 5 4 3
.30–.39 5 – 2 3 3 1 1 3 6 7 4 2
.20–.29 2 4 2 – 2 2 1 3 7 1 5 1
.10–.19 – – – 1 2 – 1 1 3 1 – –
< .10 – – – – – – – – – – – –
Average .57 .54 .53 .49 .44 .56 .64 .58 .51 .48 .52 .60
Continued on next page…

110 Iowa Assessments Research and Development Guide
Table 28 (continued): Distribution of Item Difficulties Iowa Assessments Form E, Fall 2010 National Comparison Study
Level 10 Grade 4 Fall Data
English Language Arts Mathematics
Sci
ence
So
cial
Stu
die
s
Rea
din
g
Wri
tten
Exp
ress
ion Conventions of Writing
Vo
cab
ula
ry
Sp
ellin
g
Cap
ital
izat
ion
Pu
nct
uat
ion
Mat
hem
atic
s
Co
mp
utat
ion
R WE SP CP PC V M MC SC SS
Proportion Correct
>=.90 – – – – – – – – – –
.80–.89 7 1 3 – – 2 4 2 2 3
.70–.79 5 8 4 2 3 4 10 7 6 6
.60–.69 13 14 4 6 5 8 12 4 6 6
.50–.59 10 3 5 5 1 11 8 4 8 5
.40–.49 3 7 7 6 4 8 10 4 4 9
.30–.39 3 4 3 1 2 1 6 5 7 4
.20–.29 1 1 1 2 7 – 5 1 1 1
.10–.19 – – – – – – – – – –
< .10 – – – – – – – – – –
Average .62 .58 .56 .53 .46 .59 .56 .57 .56 .57
Level 11 Grade 5 Fall Data
English Language Arts Mathematics
Sci
ence
So
cial
Stu
die
s
Rea
din
g
Wri
tten
Exp
ress
ion Conventions of Writing
Vo
cab
ula
ry
Sp
ellin
g
Cap
ital
izat
ion
Pu
nct
uat
ion
Mat
hem
atic
s
Co
mp
utat
ion
R WE SP CP PC V M MC SC SS
Proportion Correct
>=.90 2 – – – – – – – – –
.80–.89 2 2 3 – 1 1 7 2 6 3
.70–.79 11 10 4 3 – 9 11 6 4 3
.60–.69 12 13 9 6 4 13 12 7 10 7
.50–.59 8 8 6 5 4 6 10 7 5 8
.40–.49 4 4 5 3 7 6 13 3 6 10
.30–.39 3 2 3 4 6 2 2 1 3 6
.20–.29 1 1 – 2 1 – 5 2 2 –
.10–.19 – – – 1 1 – – 1 1 –
< .10 – – – – – – – – – –
Average .62 .62 .59 .51 .47 .60 .58 .58 .57 .55
Continued on next page…

Item and Test Analysis 111
Table 28 (continued): Distribution of Item Difficulties Iowa Assessments Form E, Fall 2010 National Comparison Study
Level 12 Grade 6 Fall Data
English Language Arts Mathematics
Sci
ence
So
cial
Stu
die
s
Rea
din
g
Wri
tten
Exp
ress
ion Conventions of Writing
Sp
ellin
g
Cap
ital
izat
ion
Pu
nct
uat
ion
Vo
cab
ula
ry
Mat
hem
atic
s
Co
mp
utat
ion
R WE SP CP PC V M MC SC SS
Proportion Correct
>=.90 2 – 1 – – 1 – – – 1
.80–.89 5 4 1 1 – 3 5 2 2 1
.70–.79 17 10 7 4 3 8 11 8 4 3
.60–.69 6 12 8 4 5 8 16 5 7 11
.50–.59 5 10 5 2 4 9 15 6 8 13
.40–.49 6 4 5 5 6 7 9 7 8 9
.30–.39 3 1 4 6 4 3 8 2 7 1
.20–.29 – 2 1 2 2 – 1 – 3 –
.10–.19 – – – 1 1 – – – – –
< .10 – – – – – – – – – –
Average .67 .62 .59 .50 .49 .60 .58 .59 .53 .57
Level 13 Grade 7 Fall Data
English Language Arts Mathematics
Sci
ence
So
cial
Stu
die
s
Rea
din
g
Wri
tten
Exp
ress
ion Conventions of Writing
Vo
cab
ula
ry
Sp
ellin
g
Cap
ital
izat
ion
Pu
nct
uat
ion
Mat
hem
atic
s
Co
mp
utat
ion
R WE SP CP PC V M MC SC SS
Proportion Correct
>=.90 2 – – – – – – – – –
.80–.89 7 2 3 1 – 3 2 – 1 –
.70–.79 8 11 6 3 1 3 15 4 2 3
.60–.69 12 11 2 3 3 9 19 6 15 14
.50–.59 9 10 12 5 6 12 13 8 9 15
.40–.49 4 6 5 9 6 9 7 9 9 4
.30–.39 3 4 6 3 7 3 9 4 5 5
.20–.29 – 1 – 3 4 2 5 – – –
.10–.19 – – – – – – – – – –
< .10 – – – – – – – – – –
Average .65 .59 .57 .50 .46 .54 .57 .54 .55 .57
Continued on next page…
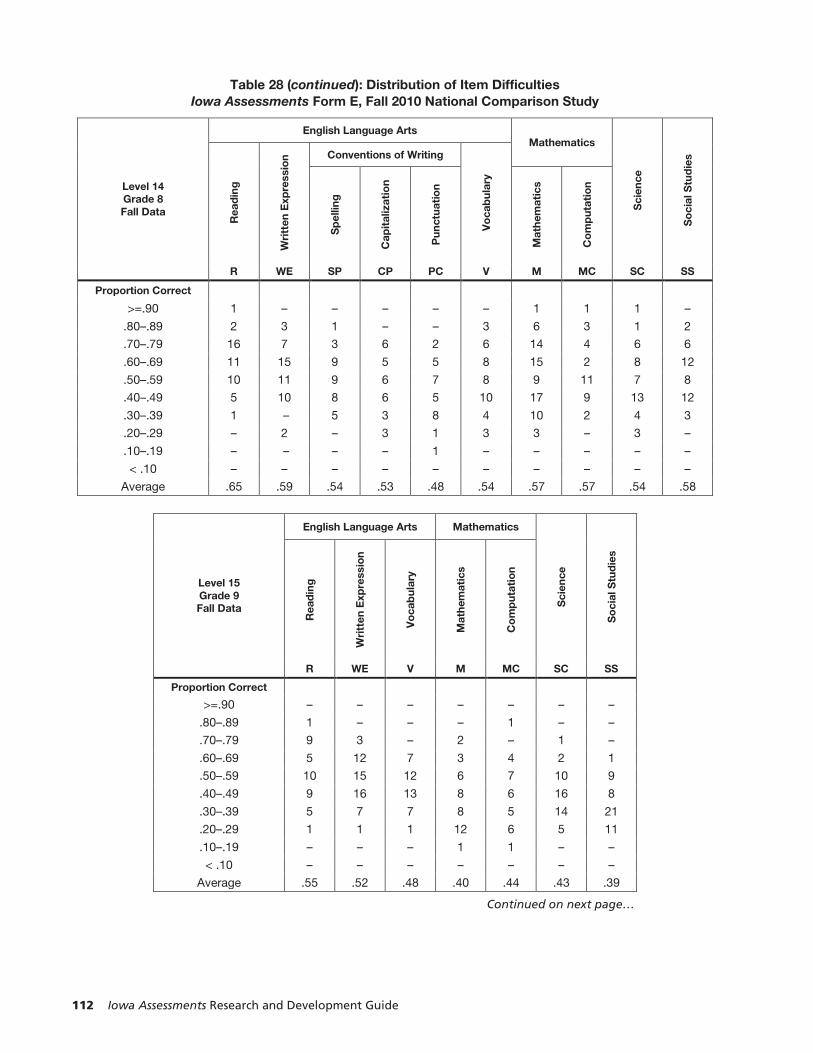
112 Iowa Assessments Research and Development Guide
Table 28 (continued): Distribution of Item Difficulties Iowa Assessments Form E, Fall 2010 National Comparison Study
Level 14 Grade 8 Fall Data
English Language Arts Mathematics
Sci
ence
So
cial
Stu
die
s
Rea
din
g
Wri
tten
Exp
ress
ion Conventions of Writing
Vo
cab
ula
ry
Sp
ellin
g
Cap
ital
izat
ion
Pu
nct
uat
ion
Mat
hem
atic
s
Co
mp
utat
ion
R WE SP CP PC V M MC SC SS
Proportion Correct
>=.90 1 – – – – – 1 1 1 –
.80–.89 2 3 1 – – 3 6 3 1 2
.70–.79 16 7 3 6 2 6 14 4 6 6
.60–.69 11 15 9 5 5 8 15 2 8 12
.50–.59 10 11 9 6 7 8 9 11 7 8
.40–.49 5 10 8 6 5 10 17 9 13 12
.30–.39 1 – 5 3 8 4 10 2 4 3
.20–.29 – 2 – 3 1 3 3 – 3 –
.10–.19 – – – – 1 – – – – –
< .10 – – – – – – – – – –
Average .65 .59 .54 .53 .48 .54 .57 .57 .54 .58
Level 15 Grade 9 Fall Data
English Language Arts Mathematics
Sci
ence
So
cial
Stu
die
s
Rea
din
g
Wri
tten
Exp
ress
ion
Vo
cab
ula
ry
Mat
hem
atic
s
Co
mp
utat
ion
R WE V M MC SC SS
Proportion Correct
>=.90 – – – – – – –
.80–.89 1 – – – 1 – –
.70–.79 9 3 – 2 – 1 –
.60–.69 5 12 7 3 4 2 1
.50–.59 10 15 12 6 7 10 9
.40–.49 9 16 13 8 6 16 8
.30–.39 5 7 7 8 5 14 21
.20–.29 1 1 1 12 6 5 11
.10–.19 – – – 1 1 – –
< .10 – – – – – – –
Average .55 .52 .48 .40 .44 .43 .39
Continued on next page…
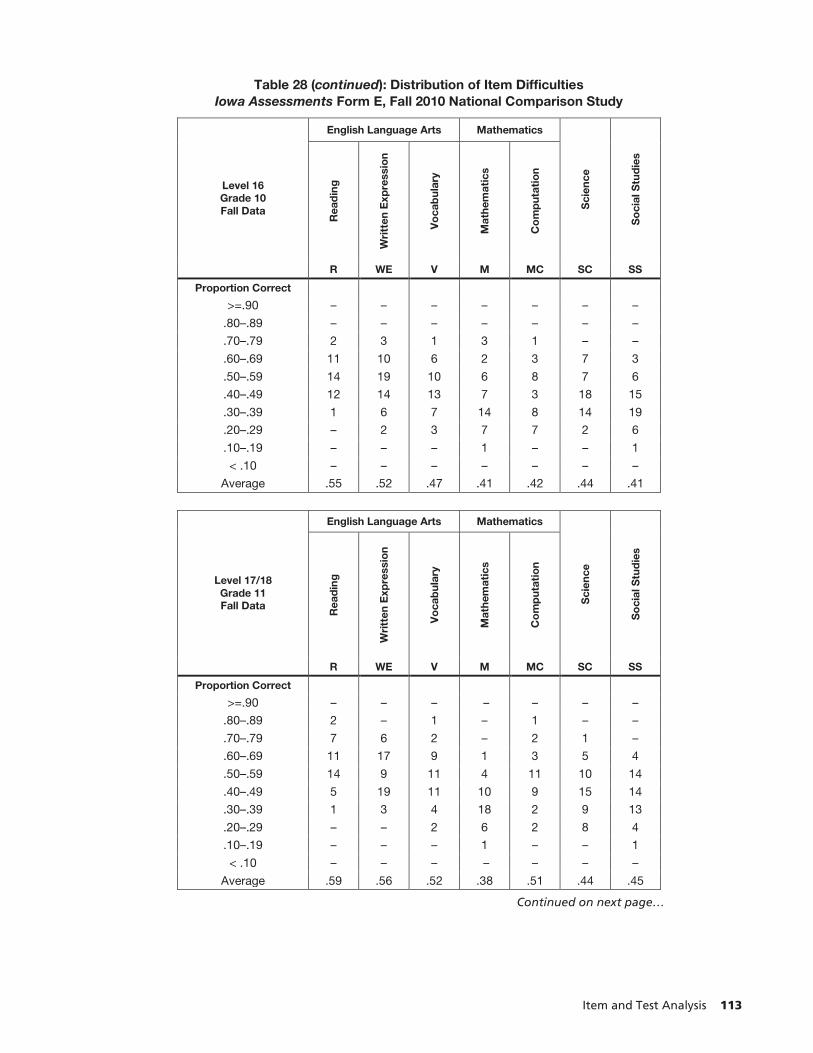
Item and Test Analysis 113
Table 28 (continued): Distribution of Item Difficulties Iowa Assessments Form E, Fall 2010 National Comparison Study
Level 16 Grade 10 Fall Data
English Language Arts Mathematics
Sci
ence
So
cial
Stu
die
s
Rea
din
g
Wri
tten
Exp
ress
ion
Vo
cab
ula
ry
Mat
hem
atic
s
Co
mp
utat
ion
R WE V M MC SC SS
Proportion Correct
>=.90 – – – – – – –
.80–.89 – – – – – – –
.70–.79 2 3 1 3 1 – –
.60–.69 11 10 6 2 3 7 3
.50–.59 14 19 10 6 8 7 6
.40–.49 12 14 13 7 3 18 15
.30–.39 1 6 7 14 8 14 19
.20–.29 – 2 3 7 7 2 6
.10–.19 – – – 1 – – 1
< .10 – – – – – – –
Average .55 .52 .47 .41 .42 .44 .41
Level 17/18 Grade 11 Fall Data
English Language Arts Mathematics
Sci
ence
So
cial
Stu
die
s
Rea
din
g
Wri
tten
Exp
ress
ion
Vo
cab
ula
ry
Mat
hem
atic
s
Co
mp
utat
ion
R WE V M MC SC SS
Proportion Correct
>=.90 – – – – – – –
.80–.89 2 – 1 – 1 – –
.70–.79 7 6 2 – 2 1 –
.60–.69 11 17 9 1 3 5 4
.50–.59 14 9 11 4 11 10 14
.40–.49 5 19 11 10 9 15 14
.30–.39 1 3 4 18 2 9 13
.20–.29 – – 2 6 2 8 4
.10–.19 – – – 1 – – 1
< .10 – – – – – – –
Average .59 .56 .52 .38 .51 .44 .45
Continued on next page…

114 Iowa Assessments Research and Development Guide
Table 28 (continued): Distribution of Item Difficulties Iowa Assessments Form E, Fall 2010 National Comparison Study
Level 17/18 Grade 12 Fall Data
English Language Arts Mathematics
Sci
ence
So
cial
Stu
die
s
Rea
din
g
Wri
tten
Exp
ress
ion
Vo
cab
ula
ry
Mat
hem
atic
s
Co
mp
utat
ion
R WE V M MC SC SS
Proportion Correct
>=.90 – – – – – – –
.80–.89 2 – 2 – 1 – –
.70–.79 9 10 1 – 2 1 1
.60–.69 12 15 14 1 4 6 7
.50–.59 14 20 12 7 11 10 15
.40–.49 2 8 5 12 8 19 15
.30–.39 1 1 6 18 4 11 11
.20–.29 – – – 2 – 1 –
.10–.19 – – – – – – 1
< .10 – – – – – – –
Average .63 .59 .56 .41 .53 .46 .47
A summary of the Form E difficulty indices for all tests and grades is presented in Table 29. The difficulty indices reported for each grade are item proportions (p-values) correct. These data are from the 2010–2011 fall and spring national comparison study. The mean item proportions correct are shown in bold; the 10th, 50th (median), and 90th percentiles of the distributions are given as well. Comparable data for Form F and for the Iowa Assessments Survey are available from the publisher.
Appropriateness of test difficulty can best be ascertained by examining relationships between raw scores, standard scores, and percentile ranks in the tables in the Norms and Score Conversions. For example, the norms tables indicate that 38 of 40 items on Level 15 of the Reading test must be answered correctly to score at the 99th percentile in the fall of grade 9, and 40 items must be answered correctly to score at the 99th percentile in the spring. Similarly, the number of items needed to score at the median in fall, midyear, and spring in grade 9 are 22, 23, and 24 out of 40 respectively. This test thus appears to be appropriate in item difficulty for the grade in which it is typically administered.
It should be noted that these difficulty characteristics are for a cross section of attendance centers in the nation. The distributions of item difficulty vary markedly among attendance centers, both within and between school systems. When the same levels of the assessments are administered to all students in a given grade in some schools, the tests are too difficult; in other schools, they may be too easy. When tests are too difficult, students’ scores may be determined largely by “chance.” When tests are too easy and scores approach the maximum possible, a student’s true achievement level may be underestimated.

Item and Test Analysis 115
Both content and difficulty should be considered when assigning specific levels of the assessment to individual students. The tasks reflected by the test questions and the content standards and domains covered should be relevant to the student’s needs and level of development and should be in line with the purpose of the local assessment program. At the same time, the level of difficulty of the items should be such that the test is challenging, but success is attainable.
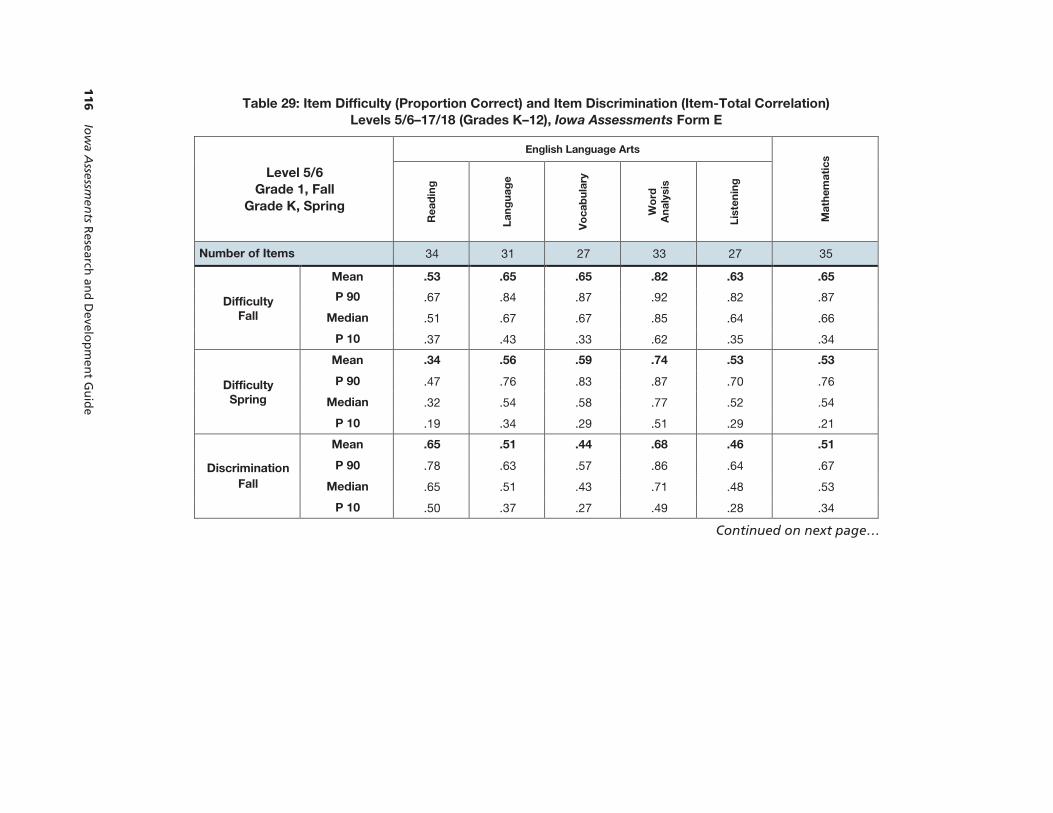
11
6
Iow
a Assessm
ents R
esearch an
d D
evelop
men
t Gu
ide
Table 29: Item Difficulty (Proportion Correct) and Item Discrimination (Item-Total Correlation) Levels 5/6–17/18 (Grades K–12), Iowa Assessments Form E
Level 5/6 Grade 1, Fall
Grade K, Spring
English Language Arts
Mat
hem
atic
s
Rea
din
g
Lan
gu
age
Vo
cab
ula
ry
Wo
rd
An
alys
is
Lis
ten
ing
Number of Items 34 31 27 33 27 35
Difficulty Fall
Mean .53 .65 .65 .82 .63 .65
P 90 .67 .84 .87 .92 .82 .87
Median .51 .67 .67 .85 .64 .66
P 10 .37 .43 .33 .62 .35 .34
Difficulty Spring
Mean .34 .56 .59 .74 .53 .53
P 90 .47 .76 .83 .87 .70 .76
Median .32 .54 .58 .77 .52 .54
P 10 .19 .34 .29 .51 .29 .21
Discrimination Fall
Mean .65 .51 .44 .68 .46 .51
P 90 .78 .63 .57 .86 .64 .67
Median .65 .51 .43 .71 .48 .53
P 10 .50 .37 .27 .49 .28 .34
Continued on next page…
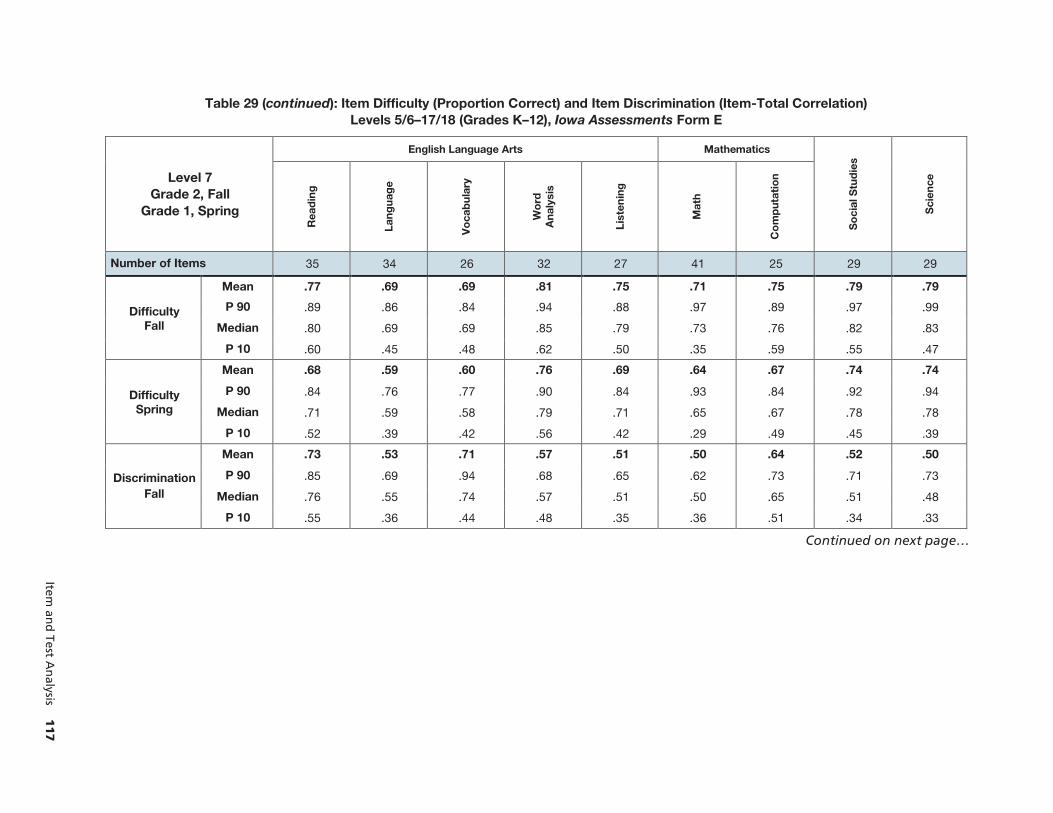
Item an
d Test A
nalysis
11
7
Table 29 (continued): Item Difficulty (Proportion Correct) and Item Discrimination (Item-Total Correlation) Levels 5/6–17/18 (Grades K–12), Iowa Assessments Form E
Level 7 Grade 2, Fall
Grade 1, Spring
English Language Arts Mathematics
So
cial
Stu
die
s
Sci
ence
Rea
din
g
Lan
gu
age
Vo
cab
ula
ry
Wo
rd
An
alys
is
Lis
ten
ing
Mat
h
Co
mp
utat
ion
Number of Items 35 34 26 32 27 41 25 29 29
Difficulty Fall
Mean .77 .69 .69 .81 .75 .71 .75 .79 .79
P 90 .89 .86 .84 .94 .88 .97 .89 .97 .99
Median .80 .69 .69 .85 .79 .73 .76 .82 .83
P 10 .60 .45 .48 .62 .50 .35 .59 .55 .47
Difficulty Spring
Mean .68 .59 .60 .76 .69 .64 .67 .74 .74
P 90 .84 .76 .77 .90 .84 .93 .84 .92 .94
Median .71 .59 .58 .79 .71 .65 .67 .78 .78
P 10 .52 .39 .42 .56 .42 .29 .49 .45 .39
Discrimination Fall
Mean .73 .53 .71 .57 .51 .50 .64 .52 .50
P 90 .85 .69 .94 .68 .65 .62 .73 .71 .73
Median .76 .55 .74 .57 .51 .50 .65 .51 .48
P 10 .55 .36 .44 .48 .35 .36 .51 .34 .33
Continued on next page…

11
8
Iow
a Assessm
ents R
esearch an
d D
evelop
men
t Gu
ide
Table 29 (continued): Item Difficulty (Proportion Correct) and Item Discrimination (Item-Total Correlation) Levels 5/6–17/18 (Grades K–12), Iowa Assessments Form E
Level 8 Grade 3, Fall
Grade 2, Spring
English Language Arts Mathematics
So
cial
Stu
die
s
Sci
ence
Rea
din
g
Lan
gu
age
Vo
cab
ula
ry
Wo
rd
An
alys
is
Lis
ten
ing
Mat
h
Co
mp
utat
ion
Number of Items 38 42 26 33 27 46 27 29 29
Difficulty Fall
Mean .76 .76 .68 .81 .77 .75 .79 .76 .74
P 90 .92 .87 .94 .94 .92 .93 .87 .95 .95
Median .78 .77 .64 .82 .78 .81 .81 .81 .78
P 10 .59 .62 .45 .59 .61 .41 .66 .47 .44
Difficulty Spring
Mean .71 .70 .63 .77 .71 .70 .75 .71 .69
P 90 .87 .82 .90 .91 .86 .89 .87 .90 .88
Median .71 .71 .56 .80 .69 .77 .77 .76 .74
P 10 .52 .55 .40 .54 .55 .35 .58 .42 .38
Discrimination Fall
Mean .67 .57 .59 .59 .52 .55 .74 .54 .49
P 90 .93 .71 .80 .73 .63 .69 .87 .68 .65
Median .66 .59 .60 .59 .55 .57 .75 .53 .51
P 10 .41 .39 .37 .47 .35 .36 .60 .38 .28
Continued on next page…

Item an
d Test A
nalysis
11
9
Table 29 (continued): Item Difficulty (Proportion Correct) and Item Discrimination (Item-Total Correlation) Levels 5/6–17/18 (Grades K–12), Iowa Assessments Form E
Level 9 Grade 3
English Language Arts Mathematics
So
cial
Stu
die
s
Sci
ence
Rea
din
g
Wri
tten
E
xpre
ssio
n
Conventions of Writing
Vo
cab
ula
ry
Wo
rd A
nal
ysis
Lis
ten
ing
Mat
h
Co
mp
utat
ion
Sp
ellin
g
Cap
ital
izat
ion
Pu
nct
uat
ion
Number of Items 41 35 24 20 20 29 33 28 50 25 30 30
Difficulty Fall
Mean .57 .54 .53 .49 .44 .56 .64 .58 .51 .48 .60 .52
P 90 .77 .68 .73 .66 .68 .70 .85 .86 .75 .67 .75 .76
Median .52 .56 .53 .47 .43 .57 .63 .55 .51 .46 .63 .50
P 10 .38 .29 .29 .32 .19 .37 .41 .28 .25 .29 .39 .26
Difficulty Spring
Mean .66 .64 .63 .59 .52 .66 .69 .65 .60 .68 .69 .61
P 90 .83 .76 .84 .77 .73 .79 .86 .93 .83 .86 .84 .83
Median .64 .65 .64 .57 .55 .68 .69 .62 .61 .67 .70 .62
P 10 .46 .39 .36 .42 .24 .47 .46 .30 .33 .45 .49 .31
Discrimination Fall
Mean .58 .60 .63 .63 .54 .63 .46 .41 .46 .58 .57 .52
P 90 .72 .73 .78 .75 .70 .74 .59 .56 .64 .68 .70 .68
Median .62 .62 .64 .67 .57 .64 .46 .44 .50 .61 .58 .56
P 10 .43 .40 .48 .46 .34 .52 .35 .22 .21 .42 .44 .30
Continued on next page…

12
0
Iow
a Assessm
ents R
esearch an
d D
evelop
men
t Gu
ide
Table 29 (continued): Item Difficulty (Proportion Correct) and Item Discrimination (Item-Total Correlation) Levels 5/6–17/18 (Grades K–12), Iowa Assessments Form E
Level 10 Grade 4
English Language Arts Mathematics
So
cial
Stu
die
s
Sci
ence
Rea
din
g
Wri
tten
E
xpre
ssio
n
Conventions of Writing
Vo
cab
ula
ry
Mat
h
Co
mp
utat
ion
Sp
ellin
g
Cap
ital
izat
ion
Pu
nct
uat
ion
Number of Items 42 38 27 22 22 34 55 27 34 34
Difficulty Fall
Mean .62 .58 .56 .53 .46 .59 .56 .57 .57 .56
P 90 .82 .74 .79 .68 .70 .75 .78 .77 .77 .78
Median .63 .61 .53 .55 .43 .56 .55 .58 .57 .53
P 10 .39 .35 .32 .31 .25 .44 .30 .33 .36 .33
Difficulty Spring
Mean .67 .64 .65 .58 .53 .67 .63 .69 .64 .63
P 90 .84 .78 .85 .73 .78 .81 .84 .84 .82 .84
Median .68 .69 .66 .61 .51 .66 .65 .70 .63 .61
P 10 .43 .42 .41 .35 .29 .53 .38 .52 .43 .38
Discrimination Fall
Mean .60 .60 .60 .60 .56 .62 .49 .58 .54 .54
P 90 .75 .78 .73 .73 .70 .72 .70 .69 .69 .74
Median .62 .63 .60 .65 .59 .64 .49 .63 .54 .53
P 10 .40 .39 .48 .49 .39 .50 .29 .40 .38 .36
Continued on next page…

Item an
d Test A
nalysis
12
1
Table 29 (continued): Item Difficulty (Proportion Correct) and Item Discrimination (Item-Total Correlation) Levels 5/6–17/18 (Grades K–12), Iowa Assessments Form E
Level 11 Grade 5
English Language Arts Mathematics
So
cial
Stu
die
s
Sci
ence
Rea
din
g
Wri
tten
E
xpre
ssio
n
Conventions of Writing
Vo
cab
ula
ry
Mat
h
Co
mp
utat
ion
Sp
ellin
g
Cap
ital
izat
ion
Pu
nct
uat
ion
Number of Items 43 40 30 24 24 37 60 29 37 37
Difficulty Fall
Mean .62 .62 .59 .51 .47 .60 .58 .58 .55 .57
P 90 .79 .78 .79 .70 .68 .74 .80 .78 .72 .82
Median .62 .65 .60 .52 .47 .61 .57 .60 .53 .60
P 10 .41 .44 .36 .27 .25 .43 .30 .26 .37 .29
Difficulty Spring
Mean .67 .66 .65 .56 .52 .68 .63 .68 .62 .62
P 90 .84 .82 .82 .75 .73 .80 .85 .86 .81 .87
Median .68 .71 .65 .58 .54 .70 .64 .69 .58 .65
P 10 .45 .49 .43 .31 .26 .51 .40 .44 .45 .32
Discrimination Fall
Mean .59 .62 .59 .58 .54 .61 .47 .59 .55 .53
P 90 .72 .78 .72 .72 .65 .74 .66 .69 .69 .67
Median .60 .62 .60 .60 .55 .62 .48 .61 .56 .54
P 10 .43 .49 .48 .39 .37 .49 .28 .40 .45 .36
Continued on next page…

12
2
Iow
a Assessm
ents R
esearch an
d D
evelop
men
t Gu
ide
Table 29 (continued): Item Difficulty (Proportion Correct) and Item Discrimination (Item-Total Correlation) Levels 5/6–17/18 (Grades K–12), Iowa Assessments Form E
Level 12 Grade 6
English Language Arts Mathematics
So
cial
Stu
die
s
Sci
ence
Rea
din
g
Wri
tten
E
xpre
ssio
n
Conventions of Writing
Vo
cab
ula
ry
Mat
h
Co
mp
utat
ion
Sp
ellin
g
Cap
ital
izat
ion
Pu
nct
uat
ion
Number of Items 44 43 32 25 25 39 65 30 39 39
Difficulty Fall
Mean .67 .62 .59 .50 .49 .60 .58 .59 .57 .53
P 90 .87 .78 .78 .73 .71 .78 .77 .76 .72 .77
Median .71 .63 .62 .43 .48 .58 .59 .58 .56 .52
P 10 .41 .45 .34 .28 .25 .40 .35 .40 .44 .32
Difficulty Spring
Mean .70 .65 .64 .53 .53 .65 .63 .66 .62 .57
P 90 .89 .81 .81 .75 .74 .83 .83 .78 .77 .81
Median .74 .66 .67 .48 .49 .62 .64 .66 .61 .57
P 10 .46 .48 .41 .32 .28 .46 .42 .48 .46 .39
Discrimination Fall
Mean .62 .58 .61 .55 .51 .55 .50 .59 .55 .50
P 90 .74 .74 .70 .69 .65 .67 .67 .71 .67 .65
Median .62 .59 .61 .55 .54 .56 .50 .59 .55 .50
P 10 .52 .42 .52 .42 .35 .41 .34 .47 .42 .35
Continued on next page…

Item an
d Test A
nalysis
12
3
Table 29 (continued): Item Difficulty (Proportion Correct) and Item Discrimination (Item-Total Correlation) Levels 5/6–17/18 (Grades K–12), Iowa Assessments Form E
Level 13 Grade 7
English Language Arts Mathematics
So
cial
Stu
die
s
Sci
ence
Rea
din
g
Wri
tten
E
xpre
ssio
n
Conventions of Writing
Vo
cab
ula
ry
Mat
h
Co
mp
utat
ion
Sp
ellin
g
Cap
ital
izat
ion
Pu
nct
uat
ion
Number of Items 45 45 34 27 27 41 70 31 41 41
Difficulty Fall
Mean .65 .59 .57 .50 .46 .54 .57 .54 .57 .55
P 90 .83 .77 .77 .72 .67 .72 .73 .70 .69 .68
Median .66 .61 .55 .47 .47 .54 .60 .52 .58 .56
P 10 .47 .35 .36 .28 .25 .37 .32 .36 .39 .36
Difficulty Spring
Mean .68 .62 .61 .53 .49 .59 .61 .61 .61 .59
P 90 .85 .79 .81 .74 .69 .78 .75 .75 .74 .72
Median .69 .63 .60 .50 .49 .58 .65 .60 .62 .61
P 10 .50 .39 .40 .30 .29 .40 .38 .46 .44 .38
Discrimination Fall
Mean .60 .56 .58 .53 .54 .52 .53 .59 .55 .54
P 90 .72 .72 .65 .63 .69 .66 .68 .68 .67 .71
Median .61 .58 .60 .54 .54 .51 .54 .60 .55 .54
P 10 .47 .41 .46 .44 .37 .39 .38 .49 .44 .36
Continued on next page…

12
4
Iow
a Assessm
ents R
esearch an
d D
evelop
men
t Gu
ide
Table 29 (continued): Item Difficulty (Proportion Correct) and Item Discrimination (Item-Total Correlation) Levels 5/6–17/18 (Grades K–12), Iowa Assessments Form E
Level 14 Grade 8
English Language Arts Mathematics
So
cial
Stu
die
s
Sci
ence
Rea
din
g
Wri
tten
E
xpre
ssio
n
Conventions of Writing
Vo
cab
ula
ry
Mat
h
Co
mp
utat
ion
Sp
ellin
g
Cap
ital
izat
ion
Pu
nct
uat
ion
Number of Items 46 48 35 29 29 42 75 32 43 43
Difficulty Fall
Mean .65 .59 .54 .53 .48 .54 .57 .57 .58 .54
P 90 .78 .76 .72 .71 .65 .74 .79 .80 .75 .77
Median .67 .60 .52 .51 .48 .52 .58 .52 .56 .51
P 10 .48 .43 .37 .29 .30 .34 .32 .41 .41 .35
Difficulty Spring
Mean .68 .61 .59 .56 .50 .59 .61 .61 .61 .57
P 90 .80 .79 .75 .73 .67 .77 .83 .83 .78 .78
Median .71 .62 .56 .55 .52 .59 .62 .55 .60 .52
P 10 .51 .44 .41 .30 .31 .38 .36 .47 .43 .39
Discrimination Fall
Mean .60 .59 .55 .54 .57 .55 .55 .60 .57 .50
P 90 .72 .74 .68 .68 .73 .69 .70 .72 .72 .67
Median .61 .61 .56 .56 .60 .57 .58 .60 .58 .52
P 10 .43 .45 .46 .44 .38 .43 .38 .47 .41 .25
Continued on next page…

Item an
d Test A
nalysis
12
5
Table 29 (continued): Item Difficulty (Proportion Correct) and Item Discrimination (Item-Total Correlation) Levels 5/6–17/18 (Grades K–12), Iowa Assessments Form E
Level 15 Grade 9
English Language Arts Mathematics
So
cial
Stu
die
s
Sci
ence
Rea
din
g
Wri
tten
E
xpre
ssio
n
Vo
cab
ula
ry
Mat
h
Co
mp
utat
ion
Number of Items 40 54 40 40 30 50 48
Difficulty Fall
Mean .55 .52 .48 .40 .44 .39 .43
P 90 .72 .66 .61 .60 .64 .54 .54
Median .55 .51 .47 .35 .44 .38 .43
P 10 .38 .36 .33 .24 .22 .26 .29
Difficulty Spring
Mean .58 .54 .53 .44 .47 .41 .45
P 90 .74 .68 .65 .66 .65 .55 .58
Median .57 .54 .52 .38 .49 .40 .44
P 10 .42 .37 .35 .24 .24 .28 .31
Discrimination Fall
Mean .62 .56 .59 .55 .52 .46 .48
P 90 .74 .71 .69 .74 .66 .66 .63
Median .64 .56 .61 .53 .54 .47 .48
P 10 .47 .39 .48 .36 .36 .25 .36
Continued on next page…

12
6
Iow
a Assessm
ents R
esearch an
d D
evelop
men
t Gu
ide
Table 29 (continued): Item Difficulty (Proportion Correct) and Item Discrimination (Item-Total Correlation) Levels 5/6–17/18 (Grades K–12), Iowa Assessments Form E
Level 16 Grade 10
English Language Arts Mathematics
So
cial
Stu
die
s
Sci
ence
Rea
din
g
Wri
tten
E
xpre
ssio
n
Vo
cab
ula
ry
Mat
h
Co
mp
utat
ion
Number of Items 40 54 40 40 30 50 48
Difficulty Fall
Mean .55 .52 .47 .41 .42 .41 .44
P 90 .66 .68 .60 .60 .61 .55 .61
Median .53 .51 .46 .36 .38 .39 .42
P 10 .44 .35 .32 .23 .23 .27 .31
Difficulty Spring
Mean .57 .54 .51 .43 .45 .43 .46
P 90 .66 .69 .63 .61 .63 .56 .64
Median .55 .56 .51 .39 .42 .41 .43
P 10 .49 .39 .36 .27 .25 .30 .34
Discrimination Fall
Mean .63 .54 .60 .54 .54 .50 .52
P 90 .75 .69 .73 .68 .65 .64 .68
Median .64 .55 .63 .54 .54 .52 .54
P 10 .48 .35 .47 .40 .41 .36 .29
Continued on next page…
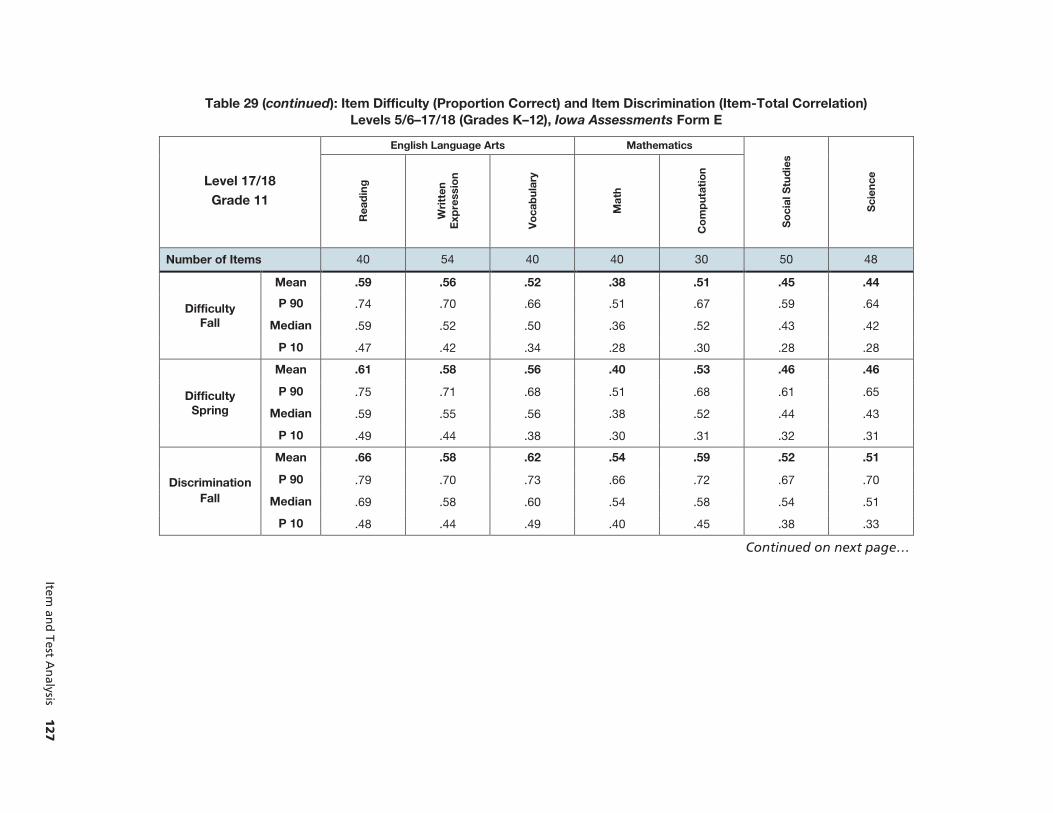
Item an
d Test A
nalysis
12
7
Table 29 (continued): Item Difficulty (Proportion Correct) and Item Discrimination (Item-Total Correlation) Levels 5/6–17/18 (Grades K–12), Iowa Assessments Form E
Level 17/18 Grade 11
English Language Arts Mathematics
So
cial
Stu
die
s
Sci
ence
Rea
din
g
Wri
tten
E
xpre
ssio
n
Vo
cab
ula
ry
Mat
h
Co
mp
utat
ion
Number of Items 40 54 40 40 30 50 48
Difficulty Fall
Mean .59 .56 .52 .38 .51 .45 .44
P 90 .74 .70 .66 .51 .67 .59 .64
Median .59 .52 .50 .36 .52 .43 .42
P 10 .47 .42 .34 .28 .30 .28 .28
Difficulty Spring
Mean .61 .58 .56 .40 .53 .46 .46
P 90 .75 .71 .68 .51 .68 .61 .65
Median .59 .55 .56 .38 .52 .44 .43
P 10 .49 .44 .38 .30 .31 .32 .31
Discrimination Fall
Mean .66 .58 .62 .54 .59 .52 .51
P 90 .79 .70 .73 .66 .72 .67 .70
Median .69 .58 .60 .54 .58 .54 .51
P 10 .48 .44 .49 .40 .45 .38 .33
Continued on next page…

12
8
Iow
a Assessm
ents R
esearch an
d D
evelop
men
t Gu
ide
Table 29 (continued): Item Difficulty (Proportion Correct) and Item Discrimination (Item-Total Correlation) Levels 5/6–17/18 (Grades K–12), Iowa Assessments Form E
Level 17/18 Grade 12
English Language Arts Mathematics
So
cial
Stu
die
s
Sci
ence
Rea
din
g
Wri
tten
E
xpre
ssio
n
Vo
cab
ula
ry
Mat
h
Co
mp
utat
ion
Number of Items 40 54 40 40 30 50 48
Difficulty Fall
Mean .63 .59 .56 .41 .53 .47 .46
P 90 .75 .72 .68 .53 .68 .61 .65
Median .61 .57 .56 .39 .54 .46 .43
P 10 .52 .45 .38 .31 .33 .32 .32
Difficulty Spring
Mean .64 .60 .59 .43 .55 .49 .48
P 90 .77 .74 .72 .55 .69 .63 .67
Median .62 .57 .59 .42 .55 .48 .45
P 10 .52 .46 .39 .32 .35 .34 .33
Discrimination Fall
Mean .67 .59 .64 .55 .60 .53 .50
P 90 .78 .72 .75 .66 .72 .68 .70
Median .68 .60 .64 .55 .59 .56 .49
P 10 .51
.46 .53 .42 .48 .39 .31

Item and Test Analysis 129
Item Discrimination As discussed previously, item discrimination indices (item-test correlations) are routinely examined during field testing and are one of several criteria used for item selection. Developmental discrimination (changes in an item’s difficulty across grades) is inferred from field-test and national research data that show items administered at adjacent grade levels have increasing p-values from grade to grade.
A well-constructed assessment strives for items with strong correlations with total scores on the other items included in the test. Summary statistics from the distributions of item-total biserial correlations (item discrimination indices) are also reported in Table 29 for the 2010 fall national comparison study sample. The means (in bold) and the 10th, 50th, and 90th percentiles of the distributions of biserial correlations are included. As would be expected, discrimination indices vary considerably from grade to grade, test to test, and even from one skill domain to another. In general, discrimination indices tend to be higher for tests that are relatively homogeneous in content and lower for tests that include complex stimuli or for skill domains within tests that require complex cognitive processes classified at higher cognitive levels.
Ceiling and Floor Effects In schools where all students in a given grade are tested with the same test level, it is important that each test level accurately measure students of all ability levels. For exceptionally able students or students who are challenged in skills development, individualized testing or out-of-level testing with appropriate levels can be used to match test content and item difficulty to student ability levels.
Students at the extremes of the score distributions are of special concern. To measure high-ability students accurately, an assessment must have enough ceiling to allow such students to demonstrate their skills. If it is too easy, a considerable proportion of these students will obtain perfect or near-perfect scores, and such scores may have deflated percentile ranks. If an assessment is too difficult for low-ability students, many will obtain chance scores, and such scores may have inflated percentile ranks.
A summary of ceiling and floor effects for kindergarten through grade 11 for fall and spring is shown in Table 30. On the top line of the table for each grade is the number of items in each test (k). Under “Ceiling,” the percentile rank of a perfect score is listed for each test as well as the percentile rank of a score one less than perfect (k – 1). Test developers strive to make the percentile ranks of perfect and near-perfect scores 99.
A “chance” score is frequently defined as the number of items in the test divided by the average number of responses per item. The percentile ranks of these “chance” estimates are listed under “Floor” in Table 30. Of course, not all students who score at this level do so by chance. However, when a substantial proportion of students in a group score at this level, it is an indication the test may be too difficult and that individualized testing should be considered.

13
0
Iow
a Assessm
ents R
esearch an
d D
evelop
men
t Gu
ide
Table 30: Ceiling and Floor Effects, Grades K–11 Iowa Assessments Form E
Level 5/6 Fall Grade 1
Spring Grade K
English Language Arts
Mat
hem
atic
s
Rea
din
g
Lan
gu
age
Vo
cab
ula
ry
Wo
rd
An
alys
is
Lis
ten
ing
Number of Items (k) 34 31 27 33 27 35
CEILING
PR of k* Fall 97.8 99.9 99.9 98.8 99.9 99.9
Spring 99.9 99.9 99.9 99.9 99.9 99.9
PR of k – 1* Fall 94.8 99.9 99.9 90.7 99.9 99.9
Spring 98.6 99.9 98.6 97.1 99.9 99.9
FLOOR
PR of k/n* Fall 17.9 0.3 1.2 0.4 3.2 6.4
Spring 56.5 1.7 2.9 2.5 10.1 13.2
* Percentile rank of k (perfect raw score), k – 1 (one less than perfect raw score), and k/n (chance-level raw score)
Continued on next page…

Item an
d Test A
nalysis
13
1
Table 30 (continued): Ceiling and Floor Effects, Grades K–11 Iowa Assessments Form E
Level 7 Fall Grade 2
Spring Grade 1
English Language Arts Mathematics
So
cial
S
tud
ies
Sci
ence
Rea
din
g
Lan
gu
age
Vo
cab
ula
ry
Wo
rd
An
alys
is
Lis
ten
ing
Mat
h
Co
mp
utat
ion
Number of Items (k) 35 34 26 32 27 41 25 29 29
CEILING
PR of k* Fall 96.0 94.3 97.7 95.1 99.9 99.9 96.3 99.9 98.7
Spring 98.0 99.9 98.9 98.5 99.9 99.9 98.8 99.9 99.9
PR of k – 1* Fall 92.0 91.7 91.9 86.0 96.4 98.1 89.4 94.8 96.9
Spring 95.2 99.9 95.8 93.7 99.1 99.9 95.4 99.0 99.1
FLOOR
PR of k/n* Fall 2.9 3.5 4.1 0.1 0.3 0.1 1.6 0.1 0.1
Spring 6.7 7.5 6.9 0.3 1.4 0.7 3.4 0.1 0.1
* Percentile rank of k (perfect raw score), k – 1 (one less than perfect raw score), and k/n (chance-level raw score)
Continued on next page…

13
2
Iow
a Assessm
ents R
esearch an
d D
evelop
men
t Gu
ide
Table 30 (continued): Ceiling and Floor Effects, Grades K–11 Iowa Assessments Form E
Level 8 Fall Grade 3
Spring Grade 2
English Language Arts Mathematics
So
cial
S
tud
ies
Sci
ence
Rea
din
g
Lan
gu
age
Vo
cab
ula
ry
Wo
rd
An
alys
is
Lis
ten
ing
Mat
h
Co
mp
utat
ion
Number of Items (k) 38 42 26 33 27 46 27 29 29
CEILING
PR of k* Fall 97.5 93.9 99.6 98.7 99.9 98.8 99.9 99.9 99.9
Spring 99.9 99.7 99.9 99.9 99.9 99.9 99.9 99.9 99.9
PR of k – 1* Fall 94.8 90.3 96.8 90.8 95.7 96.4 96.3 95.3 98.2
Spring 97.9 98.0 98.2 95.7 98.5 99.6 98.5 99.9 99.9
FLOOR
PR of k/n* Fall 1.1 2.6 1.3 2.6 0.7 0.1 0.1 0.3 0.1
Spring 2.2 4.2 1.9 0.1 1.9 0.1 0.1 1.0 1.1
* Percentile rank of k (perfect raw score), k – 1 (one less than perfect raw score), and k/n (chance-level raw score)
Continued on next page…
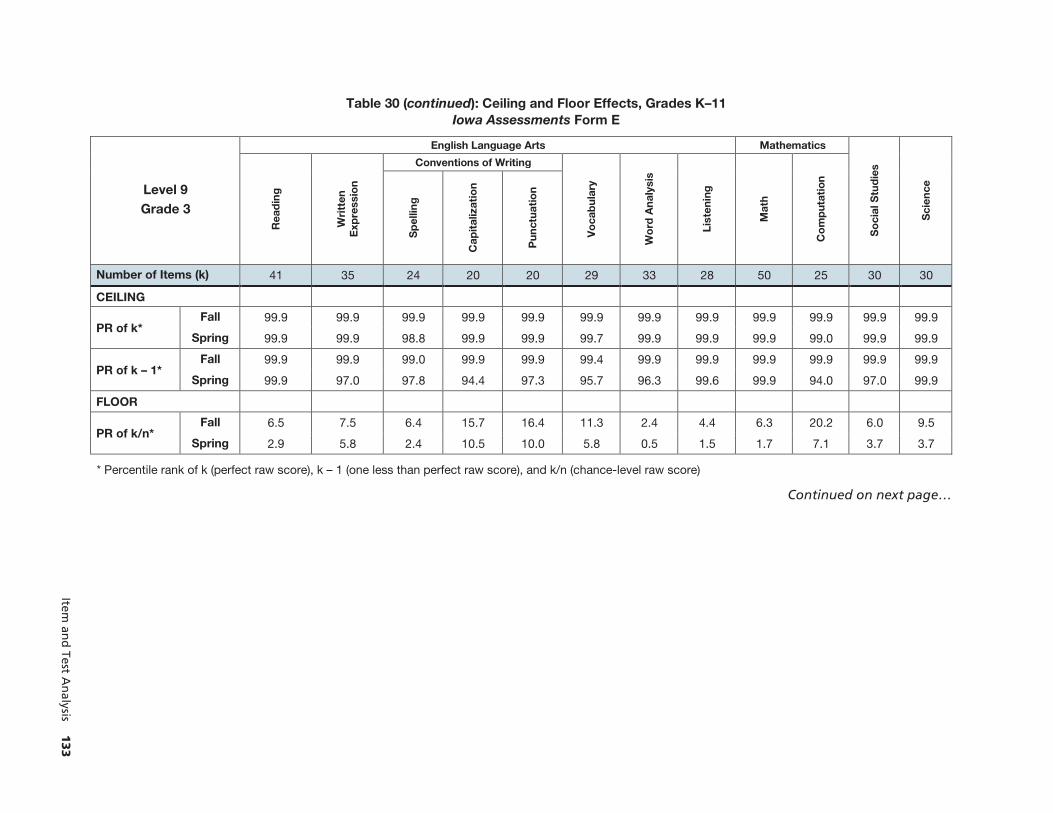
Item an
d Test A
nalysis
13
3
Table 30 (continued): Ceiling and Floor Effects, Grades K–11 Iowa Assessments Form E
Level 9 Grade 3
English Language Arts Mathematics
So
cial
Stu
die
s
Sci
ence
Rea
din
g
Wri
tten
E
xpre
ssio
n
Conventions of Writing
Vo
cab
ula
ry
Wo
rd A
nal
ysis
Lis
ten
ing
Mat
h
Co
mp
utat
ion
Sp
ellin
g
Cap
ital
izat
ion
Pu
nct
uat
ion
Number of Items (k) 41 35 24 20 20 29 33 28 50 25 30 30
CEILING
PR of k* Fall 99.9 99.9 99.9 99.9 99.9 99.9 99.9 99.9 99.9 99.9 99.9 99.9
Spring 99.9 99.9 98.8 99.9 99.9 99.7 99.9 99.9 99.9 99.0 99.9 99.9
PR of k – 1* Fall 99.9 99.9 99.0 99.9 99.9 99.4 99.9 99.9 99.9 99.9 99.9 99.9
Spring 99.9 97.0 97.8 94.4 97.3 95.7 96.3 99.6 99.9 94.0 97.0 99.9
FLOOR
PR of k/n* Fall 6.5 7.5 6.4 15.7 16.4 11.3 2.4 4.4 6.3 20.2 6.0 9.5
Spring 2.9 5.8 2.4 10.5 10.0 5.8 0.5 1.5 1.7 7.1 3.7 3.7
* Percentile rank of k (perfect raw score), k – 1 (one less than perfect raw score), and k/n (chance-level raw score)
Continued on next page…
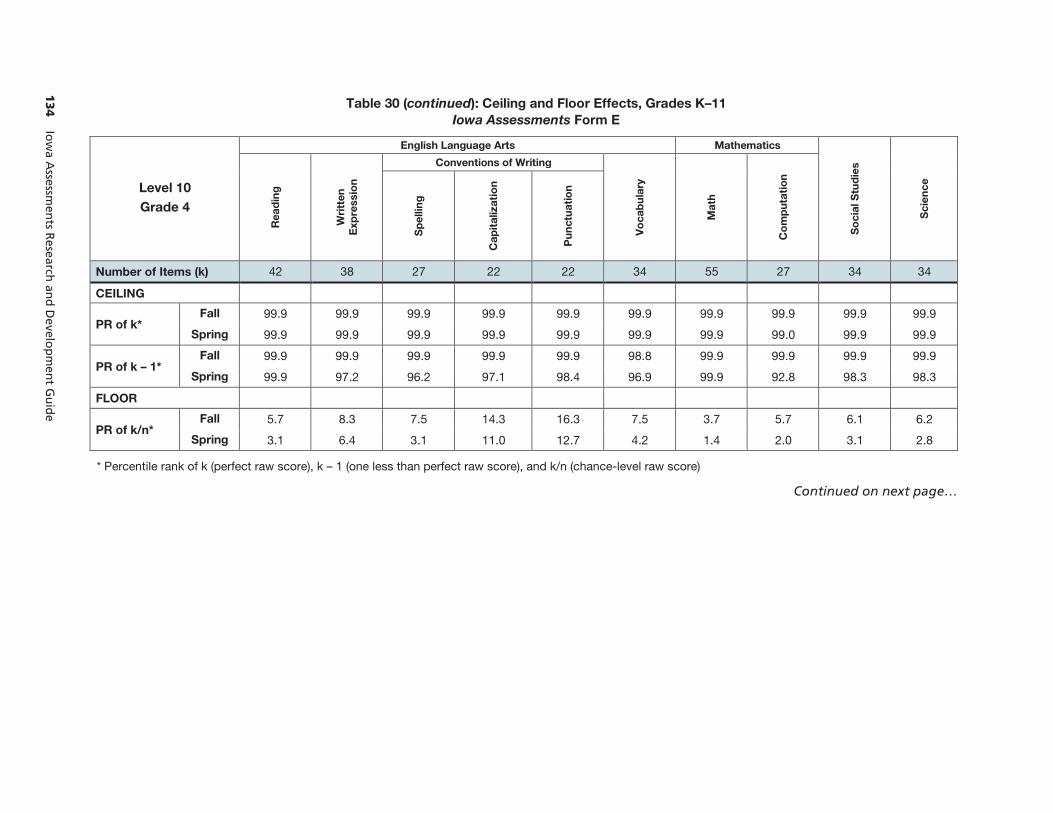
13
4
Iow
a Assessm
ents R
esearch an
d D
evelop
men
t Gu
ide
Table 30 (continued): Ceiling and Floor Effects, Grades K–11 Iowa Assessments Form E
Level 10 Grade 4
English Language Arts Mathematics
So
cial
Stu
die
s
Sci
ence
Rea
din
g
Wri
tten
E
xpre
ssio
n
Conventions of Writing
Vo
cab
ula
ry
Mat
h
Co
mp
utat
ion
Sp
ellin
g
Cap
ital
izat
ion
Pu
nct
uat
ion
Number of Items (k) 42 38 27 22 22 34 55 27 34 34
CEILING
PR of k* Fall 99.9 99.9 99.9 99.9 99.9 99.9 99.9 99.9 99.9 99.9
Spring 99.9 99.9 99.9 99.9 99.9 99.9 99.9 99.0 99.9 99.9
PR of k – 1* Fall 99.9 99.9 99.9 99.9 99.9 98.8 99.9 99.9 99.9 99.9
Spring 99.9 97.2 96.2 97.1 98.4 96.9 99.9 92.8 98.3 98.3
FLOOR
PR of k/n* Fall 5.7 8.3 7.5 14.3 16.3 7.5 3.7 5.7 6.1 6.2
Spring 3.1 6.4 3.1 11.0 12.7 4.2 1.4 2.0 3.1 2.8
* Percentile rank of k (perfect raw score), k – 1 (one less than perfect raw score), and k/n (chance-level raw score)
Continued on next page…

Item an
d Test A
nalysis
13
5
Table 30 (continued): Ceiling and Floor Effects, Grades K–11 Iowa Assessments Form E
Level 11 Grade 5
English Language Arts Mathematics
So
cial
Stu
die
s
Sci
ence
Rea
din
g
Wri
tten
E
xpre
ssio
n
Conventions of Writing
Vo
cab
ula
ry
Mat
h
Co
mp
utat
ion
Sp
ellin
g
Cap
ital
izat
ion
Pu
nct
uat
ion
Number of Items (k) 43 40 30 24 24 37 60 29 37 37
CEILING
PR of k* Fall 99.9 99.9 99.9 99.9 99.9 99.9 99.9 99.9 99.9 99.9
Spring 99.9 99.9 99.9 99.9 99.9 99.9 99.9 99.9 99.9 99.9
PR of k – 1* Fall 99.9 99.9 99.9 99.9 99.9 98.4 99.9 99.9 99.9 99.9
Spring 98.3 98.3 96.9 98.0 98.1 95.0 99.9 94.8 98.2 98.3
FLOOR
PR of k/n* Fall 5.4 4.7 3.3 11.0 11.5 6.6 1.7 7.2 8.4 4.8
Spring 3.4 3.7 0.8 8.4 8.9 3.9 0.4 3.9 5.5 2.4
* Percentile rank of k (perfect raw score), k – 1 (one less than perfect raw score), and k/n (chance-level raw score)
Continued on next page…

13
6
Iow
a Assessm
ents R
esearch an
d D
evelop
men
t Gu
ide
Table 30 (continued): Ceiling and Floor Effects, Grades K–11 Iowa Assessments Form E
Level 12 Grade 6
English Language Arts Mathematics
So
cial
Stu
die
s
Sci
ence
Rea
din
g
Wri
tten
E
xpre
ssio
n
Conventions of Writing
Vo
cab
ular
y
Mat
h
Co
mp
utat
ion
Sp
ellin
g
Cap
ital
izat
ion
Pun
ctua
tio
n
Number of Items (k) 44 43 32 25 25 39 65 30 39 39
CEILING
PR of k* Fall 99.9 99.9 99.9 99.9 99.9 99.9 99.9 99.9 99.9 99.9
Spring 99.9 99.9 99.9 99.9 99.9 99.9 99.9 99.9 99.9 99.9
PR of k – 1* Fall 99.9 99.9 99.6 99.9 99.9 99.9 99.9 99.9 99.9 99.9
Spring 98.2 99.0 97.1 99.9 98.2 97.9 99.9 95.5 99.0 99.9
FLOOR
PR of k/n* Fall 2.9 5.0 5.0 13.0 11.2 5.2 3.0 6.0 6.1 5.2
Spring 1.6 4.2 2.9 11.0 9.6 3.1 1.3 4.1 4.0 3.7
* Percentile rank of k (perfect raw score), k – 1 (one less than perfect raw score), and k/n (chance-level raw score)
Continued on next page…

Item an
d Test A
nalysis
13
7
Table 30 (continued): Ceiling and Floor Effects, Grades K–11 Iowa Assessments Form E
Level 13 Grade 7
English Language Arts Mathematics
So
cial
Stu
die
s
Sci
ence
Rea
din
g
Wri
tten
E
xpre
ssio
n
Conventions of Writing
Vo
cab
ular
y
Mat
h
Co
mp
utat
ion
Sp
ellin
g
Cap
ital
izat
ion
Pun
ctua
tio
n
Number of Items (k) 45 45 34 27 27 41 70 31 41 41
CEILING
PR of k* Fall 99.9 99.9 99.9 99.9 99.9 99.9 99.9 99.9 99.9 99.9
Spring 99.9 99.9 99.9 99.9 99.9 99.9 99.9 99.9 99.9 99.9
PR of k – 1* Fall 99.9 99.9 99.9 99.9 99.9 99.9 99.9 99.9 99.9 99.9
Spring 98.5 99.9 98.2 99.1 99.3 99.1 99.8 96.7 99.9 99.7
FLOOR
PR of k/n* Fall 4.2 5.9 4.4 9.7 14.5 5.8 4.5 9.4 7.4 8.6
Spring 3.5 5.2 2.3 8.6 12.8 4.5 2.7 7.3 5.9 6.9
* Percentile rank of k (perfect raw score), k – 1 (one less than perfect raw score), and k/n (chance-level raw score)
Continued on next page…

13
8
Iow
a Assessm
ents R
esearch an
d D
evelop
men
t Gu
ide
Table 30 (continued): Ceiling and Floor Effects, Grades K–11 Iowa Assessments Form E
Level 14 Grade 8
English Language Arts Mathematics
So
cial
Stu
die
s
Sci
ence
Rea
din
g
Wri
tten
E
xpre
ssio
n
Conventions of Writing
Vo
cab
ular
y
Mat
h
Co
mp
utat
ion
Sp
ellin
g
Cap
ital
izat
ion
Pun
ctua
tio
n
Number of Items (k) 46 48 35 29 29 42 75 32 43 43
CEILING
PR of k* Fall 99.9 99.9 99.9 99.9 99.9 99.9 99.9 99.9 99.9 99.9
Spring 99.9 99.9 99.9 99.9 99.9 99.9 99.9 99.9 99.9 99.9
PR of k – 1* Fall 99.9 99.9 99.9 99.9 99.9 99.9 99.9 99.6 99.9 99.9
Spring 97.8 99.9 99.6 99.9 99.9 99.3 99.9 96.9 99.9 99.9
FLOOR
PR of k/n* Fall 3.8 6.0 3.8 10.3 18.2 6.6 4.3 5.1 6.5 5.2
Spring 3.1 5.2 2.4 8.9 16.6 5.2 2.8 3.8 5.4 4.25
* Percentile rank of k (perfect raw score), k – 1 (one less than perfect raw score), and k/n (chance-level raw score)
Continued on next page…

Item an
d Test A
nalysis
13
9
Table 30 (continued): Ceiling and Floor Effects, Grades K–11 Iowa Assessments Form E
Level 15 Grade 9
English Language Arts Mathematics
So
cial
Stu
die
s
Sci
ence
Rea
din
g
Wri
tten
Exp
ress
ion
Vo
cab
ular
y
Mat
h
Co
mp
utat
ion
Number of Items (k) 46 48 42 75 32 43 43
CEILING
PR of k* Fall 99.9 99.9 99.9 99.9 99.9 99.9 99.9
Spring 99.9 99.9 99.9 99.9 99.9 99.9 99.9
PR of k – 1* Fall 99.9 99.9 99.9 99.9 99.9 99.9 99.9
Spring 99.9 99.9 99.9 99.9 99.9 99.9 99.9
FLOOR
PR of k/n* Fall 4.2 3.1 4.8 5.0 4.4 7.3 9.1
Spring 3.1 2.2 4.2 3.8 3.1 5.4 7.0
* Percentile rank of k (perfect raw score), k – 1 (one less than perfect raw score), and k/n (chance-level raw score)
Continued on next page…

14
0
Iow
a Assessm
ents R
esearch an
d D
evelop
men
t Gu
ide
Table 30 (continued): Ceiling and Floor Effects, Grades K–11 Iowa Assessments Form E
Level 16 Grade 10
English Language Arts Mathematics
So
cial
Stu
die
s
Sci
ence
Rea
din
g
Wri
tten
Exp
ress
ion
Vo
cab
ular
y
Mat
h
Co
mp
utat
ion
Number of Items (k) 46 48 42 75 32 43 43
CEILING
PR of k* Fall 99.9 99.9 99.9 99.9 99.9 99.9 99.9
Spring 99.9 99.9 99.9 99.9 99.9 99.9 99.9
PR of k – 1* Fall 99.9 99.9 99.9 99.9 99.9 99.9 99.9
Spring 99.9 99.9 99.9 99.9 99.9 99.9 99.9
FLOOR
PR of k/n* Fall 3.4 2.4 5.4 4.3 2.9 5.9 4.2
Spring 3.1 2.2 4.4 2.9 3.3 5.8 4.1
* Percentile rank of k (perfect raw score), k – 1 (one less than perfect raw score), and k/n (chance-level raw score)
Continued on next page…

Item an
d Test A
nalysis
14
1
Table 30 (continued): Ceiling and Floor Effects, Grades K–11 Iowa Assessments Form E
Level 17/18 Grade 11
English Language Arts Mathematics
So
cial
Stu
die
s
Sci
ence
Rea
din
g
Wri
tten
Exp
ress
ion
Vo
cab
ular
y
Mat
h
Co
mp
utat
ion
Number of Items (k) 46 48 42 75 32 43 43
CEILING
PR of k* Fall 99.9 99.9 99.9 99.9 99.9 99.9 99.9
Spring 99.9 99.9 99.9 99.9 99.9 99.9 99.9
PR of k – 1* Fall 99.9 99.9 99.9 99.9 99.9 99.9 99.9
Spring 99.9 99.9 99.9 99.9 99.9 99.9 99.9
FLOOR
PR of k/n* Fall 2.1 2.0 3.3 5.2 3.0 4.3 3.4
Spring 2.4 2.1 2.9 3.9 2.1 4.1 3.2
* Percentile rank of k (perfect raw score), k – 1 (one less than perfect raw score), and k/n (chance-level raw score)
Continued on next page…

142 Iowa Assessments Research and Development Guide
Completion Rates By no means is there universal agreement on the issue of time-to-completion in evaluating the extent to which a student may have mastered an achievement domain or may have automatized the specific skills measured by an assessment. Some might believe that a student who tends to be quicker at achieving a given level of performance shows greater mastery, while others would contend that the level of performance achieved regardless of the time expended is the more meaningful criterion. Student time is a precious commodity in the school day, and in assessment situations, it needs to be used effectively to produce valid and reliable information about student achievement. Recommended time limits are one way test developers try to indicate the anticipated distribution of student time required for individual tests in the Iowa Assessments. Overly generous time limits can mean that a considerable portion of time devoted to testing in a school day is wasted, whereas time limits that are too short mean an element of speed unrelated to the construct affects students’ scores. The goal of recommended time limits is to balance these extremes.
Two indices of completion rates for the Iowa Assessments, based on data from the 2010 fall national comparison study, were computed. The first is the percentage of students completing the test. Because something a bit less than 100 percent completion is generally considered indicative of all but the slowest few examinees completing the assessment within the recommended time limit, that figure is typically reported. The percentage of students completing 75 percent of the test is also reported. Note that completion data are not reported for Levels 5/6 through 8. These levels of the Iowa Assessments are teacher- or proctor-led administrations, so the completion rates are virtually 100 percent for all individual assessments.
The data from the national comparison study indicate that most of the individual tests in the Iowa Assessments are essentially “power” tests, meaning that they are completed within the recommended time limits by the vast majority of examinees nationally. The only exception is the Computation test, in which time limits are intentionally designed to help teachers identify students who lack fluency in their understanding and application of basic math facts and computational procedures. It should be noted that two completion rates are reported for the Reading and Mathematics assessments in Levels 9–14. As discussed in Part 4, these sections of the Iowa Assessments are divided into two separately timed parts in Form E and Form F. This structure results in higher completion rates than were observed in previous editions of the ITBS and ITED.
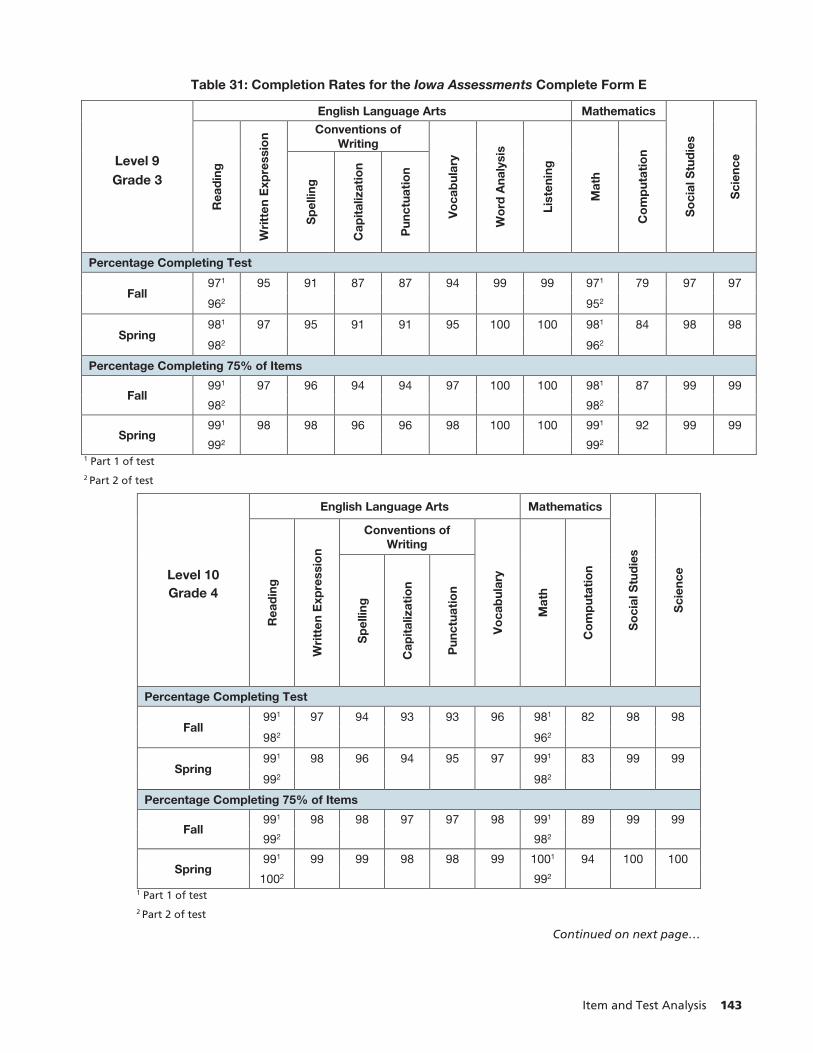
Item and Test Analysis 143
Table 31: Completion Rates for the Iowa Assessments Complete Form E
Level 9 Grade 3
English Language Arts Mathematics
So
cial
Stu
die
s
Sci
ence
Rea
din
g
Wri
tten
Exp
ress
ion
Conventions of Writing
Vo
cab
ular
y
Wo
rd A
naly
sis
List
enin
g
Mat
h
Co
mp
utat
ion
Sp
ellin
g
Cap
ital
izat
ion
Pun
ctua
tio
n
Percentage Completing Test
Fall 971 95 91 87 87 94 99 99 971 79 97 97
962 952
Spring 981 97 95 91 91 95 100 100 981 84 98 98
982 962
Percentage Completing 75% of Items
Fall 991 97 96 94 94 97 100 100 981 87 99 99
982 982
Spring 991 98 98 96 96 98 100 100 991 92 99 99
992 992 1 Part 1 of test 2 Part 2 of test
Level 10 Grade 4
English Language Arts Mathematics
So
cial
Stu
die
s
Sci
ence
Rea
din
g
Wri
tten
Exp
ress
ion
Conventions of Writing
Vo
cab
ular
y
Mat
h
Co
mp
utat
ion
Sp
ellin
g
Cap
ital
izat
ion
Pun
ctua
tio
n
Percentage Completing Test
Fall 991 97 94 93 93 96 981 82 98 98
982 962
Spring 991 98 96 94 95 97 991 83 99 99
992 982
Percentage Completing 75% of Items
Fall 991 98 98 97 97 98 991 89 99 99
992 982
Spring 991 99 99 98 98 99 1001 94 100 100
1002 992 1 Part 1 of test 2 Part 2 of test
Continued on next page…

144 Iowa Assessments Research and Development Guide
Table 31 (continued): Completion Rates for the Iowa Assessments Complete Form E
Level 11 Grade 5
English Language Arts Mathematics
So
cial
Stu
die
s
Sci
ence
Rea
din
g
Wri
tten
Exp
ress
ion
Conventions of Writing
Vo
cab
ular
y
Mat
h
Co
mp
utat
ion
Sp
ellin
g
Cap
ital
izat
ion
Pun
ctua
tio
n
Percentage Completing Test
Fall 991 98 96 96 95 97 981 84 98 98
982 982
Spring 991 99 97 95 95 96 981 87 99 99
992 982
Percentage Completing 75% of Items
Fall 1001 99 99 99 98 99 1001 91 99 99
992 992
Spring 1001 99 99 98 98 99 1001 93 99 99
992 992 1 Part 1 of test 2 Part 2 of test
Level 12 Grade 6
English Language Arts Mathematics
So
cial
Stu
die
s
Sci
ence
Rea
din
g
Wri
tten
Exp
ress
ion
Conventions of Writing
Vo
cab
ular
y
Mat
h
Co
mp
utat
ion
Sp
ellin
g
Cap
ital
izat
ion
Pun
ctua
tio
n
Percentage Completing Test
Fall 991 98 98 97 97 98 991 84 99 98
992 962
Spring 991 99 98 96 97 98 991 87 99 99
992 972
Percentage Completing 75% of Items
Fall 991 99 99 99 99 99 1001 93 100 99
1002 992
Spring 1001 99 99 99 99 99 1001 94 100 100
1002 992 1 Part 1 of test 2 Part 2 of test
Continued on next page…

Item and Test Analysis 145
Table 31 (continued): Completion Rates for the Iowa Assessments Complete Form E
Level 13 Grade 7
English Language Arts Mathematics
So
cial
Stu
die
s
Sci
ence
Rea
din
g
Wri
tten
Exp
ress
ion
Conventions of Writing
Vo
cab
ular
y
Mat
h
Co
mp
utat
ion
Sp
ellin
g
Cap
ital
izat
ion
Pun
ctua
tio
n
Percentage Completing Test
Fall 991 99 98 97 96 98 981 85 99 98
992 972
Spring 1001 98 98 98 97 99 981 88 99 99
992 982
Percentage Completing 75% of Items
Fall 1001 99 99 99 99 99 991 94 99 100
1002 992
Spring 1001 99 99 99 99 99 991 95 100 100
1002 992 1 Part 1 of test 2 Part 2 of test
Level 14 Grade 8
English Language Arts Mathematics
So
cial
Stu
die
s
Sci
ence
Rea
din
g
Wri
tten
Exp
ress
ion
Conventions of Writing
Vo
cab
ular
y
Mat
h
Co
mp
utat
ion
Sp
ellin
g
Cap
ital
izat
ion
Pun
ctua
tio
n
Percentage Completing Test
Fall 1001 99 99 98 97 99 991 95 99 99
992 982
Spring 1001 99 99 99 98 99 981 95 100 99
1002 982
Percentage Completing 75% of Items
Fall 1001 99 100 99 99 100 1001 97 100 100
1002 992
Spring 1001 99 100 99 99 100 1001 98 100 100
1002 992 1 Part 1 of test 2 Part 2 of test
Continued on next page…

146 Iowa Assessments Research and Development Guide
Table 31 (continued): Completion Rates for the Iowa Assessments Complete Form E
Level 15 Grade 9
English Language Arts Mathematics
So
cial
Stu
die
s
Sci
ence
Rea
din
g
Wri
tten
E
xpre
ssio
n
Vo
cab
ular
y
Mat
h
Co
mp
utat
ion
Percentage Completing Test
Fall 96 98 98 97 89 97 97
Spring 97 98 99 97 93 98 98
Percentage Completing 75% of Items
Fall 99 99 100 99 96 99 99
Spring 99 99 100 99 98 99 99
Level 16 Grade 10
English Language Arts Mathematics
So
cial
Stu
die
s
Sci
ence
Rea
din
g
Wri
tten
E
xpre
ssio
n
Vo
cab
ular
y
Mat
h
Co
mp
utat
ion
Percentage Completing Test
Fall 98 98 99 98 92 98 98
Spring 97 99 99 98 93 99 98
Percentage Completing 75% of Items
Fall 99 100 99 99 97 100 99
Spring 99 99 100 99 97 100 99
Continued on next page…

Item and Test Analysis 147
Table 31 (continued): Completion Rates for the Iowa Assessments Complete Form E
Level 17/18 Grades 11/12
English Language Arts Mathematics
So
cial
Stu
die
s
Sci
ence
Rea
din
g
Wri
tten
E
xpre
ssio
n
Vo
cab
ular
y
Mat
h
Co
mp
utat
ion
Percentage Completing Test
Fall 98 99 99 97 96 99 98
Spring 98 99 99 98 97 99 99
Percentage Completing 75% of Items
Fall 99 100 100 99 99 100 100
Spring 99 99 100 99 99 100 100

148 Iowa Assessments Research and Development Guide

Group Differences in Item and Test Performance 149
art 8P Group Differences in Item and Test Performan
In Brief Among the most important results from the periodic use of achievement tests administered under standard conditions are findings that can be used to understand the process of social change through education. The data on national trends in achievement reported in Part 5 represent one example of how aggregate data from achievement tests reflect the social dynamics of education. In addition, national data on student achievement have shown the value of disaggregated results. During the 1980s, for example, the National Assessment of Educational Progress (NAEP) often reported fairly stable levels of achievement. However, dramatic gains were demonstrated by the national samples of African American and Hispanic students (Linn and Dunbar, 1990). Although the social reasons for changes in group differences in achievement are not always clear, carefully developed tests can provide a broad view of the influence of school on such differences.
Various approaches to understanding group differences in test scores are a regular part of research and test development efforts for the Iowa Assessments. To ensure that assessment materials are appropriate and fair for different groups, careful test development procedures are followed. Sensitivity reviews by content and fairness committees and extensive statistical analysis of the items and tests are conducted. The precision of measurement for important groups in the national comparison study is evaluated when examining the measurement characteristics of the tests. Differences between groups in average performance and in the variability of performance are also of interest, and these are examined for changes over time. In addition to descriptions of group differences in test performance, analyses of differential item functioning are undertaken with results from the national item tryout as well as with results from the national comparison study.
Standard Errors of Measurement for Groups The precision of test scores for members of various demographic groups is a great concern, especially when test scores are used for purposes of selection or placement, such as with college admissions tests and other kinds of subject-matter tests. Although large-scale, standardized achievement tests such as the Iowa Assessments were not designed to be used in this way, there is still an interest in the precision with which the tests place an individual on the developmental continuum in each content domain. Standard errors of measurement were presented for this purpose in Part 6. Table 32 and Table 33 report standard errors of measurement estimated separately for Whites, Blacks or African Americans, Hispanics, boys, and girls based on data from the 2010 national comparison study.
Group Differences in Item and Test Performance Part 8

15
0
Iow
a Assessm
ents R
esearch an
d D
evelop
men
t Gu
ide
Table 32: Standard Errors of Measurement in the Standard Score Scale Metric by Group Iowa Assessments Complete Form E 2010 National Comparison Study
Level Ethnicity
English Language Arts Mathematics
Sci
ence
So
cial
Stu
die
s
Rea
din
g
Lang
uag
e
Wri
tten
E
xpre
ssio
n
Conventions of Writing
Vo
cab
ular
y
Wo
rd A
naly
sis
List
enin
g
Sp
ellin
g
Cap
ital
izat
ion
Pun
ctua
tio
n
Mat
h
Co
mp
utat
ion
R L WE SP CP PC V WA Li M MC SC SS
5/6
White 7.95 4.70 – – – – 3.45 4.10 4.00 5.00 – – –
Black 7.90 4.70 – – – – 3.30 4.80 4.30 5.20 – – –
Hispanic 7.90 4.70 – – – – 3.40 4.70 3.90 5.10 – – –
7
White 6.00 5.65 – – – – 5.05 4.50 3.80 5.70 4.20 3.25 3.40
Black 6.60 5.70 – – – – 5.40 4.70 4.30 5.70 4.90 3.30 3.50
Hispanic 7.00 6.00 – – – – 5.80 4.90 4.60 5.70 4.80 3.50 3.80
8
White 6.55 7.95 – – – – 4.65 4.80 4.05 6.85 4.30 3.95 4.75
Black 7.60 8.10 – – – – 4.70 5.30 4.60 6.90 4.00 4.20 4.00
Hispanic 7.60 8.00 – – – – 4.50 5.50 4.30 7.20 5.10 4.40 4.50
9
White 8.40 – 7.50 4.85 4.45 3.90 6.45 5.60 3.70 7.10 4.70 5.35 6.10
Black 8.20 – 7.50 5.50 4.70 3.70 6.20 5.20 3.40 7.20 4.80 4.90 5.80
Hispanic 8.00 – 7.00 5.10 4.70 3.90 6.00 5.10 3.60 7.60 5.10 5.40 5.80
10
White 8.00 – 7.60 5.50 5.00 4.50 7.50 – – 8.70 5.40 6.10 6.50
Black 8.10 – 7.80 5.80 4.90 3.90 7.00 – – 8.00 5.40 6.00 5.90
Hispanic 8.30 – 7.90 5.70 5.10 4.30 7.60 – – 8.60 5.50 5.90 6.10
11
White 8.75 – 9.10 6.40 5.05 4.75 8.20 – – 9.75 6.30 6.55 7.55
Black 7.60 – 8.20 6.00 4.90 4.60 7.30 – – 8.70 5.80 6.00 6.70
Hispanic 8.10 – 8.60 6.40 4.70 4.60 8.00 – – 9.30 5.90 6.50 7.20
12
White 9.00 – 9.10 6.90 4.90 4.80 7.95 – – 11.55 6.30 7.00 8.00
Black 8.50 – 8.50 7.00 4.50 4.30 7.30 – – 11.10 6.30 6.50 7.20
Hispanic 8.10 – 8.60 6.70 4.40 4.20 7.10 – – 10.60 6.00 6.00 7.00
Continued on next page…

Gro
up
Differen
ces in Item
and
Test Perform
ance
15
1
Table 32 (continued): Standard Errors of Measurement in the Standard Score Scale Metric by Group Iowa Assessments Complete Form E 2010 National Comparison Study
Level Ethnicity
English Language Arts Mathematics
Sci
ence
So
cial
Stu
die
s
Rea
din
g
Lang
uag
e
Wri
tten
E
xpre
ssio
n
Conventions of Writing
Vo
cab
ular
y
Wo
rd A
naly
sis
List
enin
g
Sp
ellin
g
Cap
ital
izat
ion
Pun
ctua
tio
n
Mat
h
Co
mp
utat
ion
R L WE SP CP PC V WA Li M MC SC SS
13
White 8.85 – 9.35 7.10 5.30 5.70 8.40 – – 13.10 7.00 8.05 8.70
Black 8.60 – 8.40 6.90 4.80 4.80 6.80 – – 11.60 6.40 6.90 7.70
Hispanic 8.80 – 8.60 7.50 5.10 5.20 7.30 – – 12.60 6.90 7.70 8.00
14
White 9.90 – 10.60 7.15 5.95 6.25 9.05 – – 14.15 7.20 8.25 9.65
Black 8.70 – 9.90 6.90 5.30 5.60 7.40 – – 13.10 6.50 7.10 8.10
Hispanic 8.60 – 10.00 7.10 5.10 5.90 7.90 – – 13.20 6.70 6.80 8.40

15
2
Iow
a Assessm
ents R
esearch an
d D
evelop
men
t Gu
ide
Table 33: Standard Errors of Measurement in the Standard Score Scale Metric by Level and Gender Iowa Assessments Complete Form E 2010 National Comparison Study
Level Gender
English Language Arts Mathematics
Sci
ence
So
cial
Stu
die
s
Rea
din
g
Lang
uag
e
Wri
tten
E
xpre
ssio
n
Conventions of Writing
Vo
cab
ular
y
Wo
rd A
naly
sis
List
enin
g
Sp
ellin
g
Cap
ital
izat
ion
Pun
ctua
tio
n
Mat
h
Co
mp
utat
ion
R L WE SP CP PC V WA Li M MC SC SS
5/6 Male 7.90 4.90 – – – – 3.60 4.50 4.10 5.30 – – –
Female 8.00 5.00 – – – – 3.50 4.70 4.20 5.30 – – –
7 Male 6.70 6.00 – – – – 5.80 4.60 4.30 5.80 4.80 3.40 3.60
Female 7.30 6.20 – – – – 5.90 5.00 4.40 6.20 4.80 3.60 4.00
8 Male 6.70 7.40 – – – – 4.60 4.80 4.30 6.70 4.20 4.00 4.20
Female 7.10 7.60 – – – – 4.70 4.90 4.40 6.80 4.10 4.00 4.20
9 Male 8.80 – 7.90 5.00 4.90 4.20 6.80 5.10 3.50 7.60 4.90 5.30 5.90
Female 8.50 – 7.90 5.20 4.70 3.90 6.80 5.30 3.70 8.10 5.10 5.50 6.30
10 Male 8.90 – 8.30 5.60 5.10 4.50 7.80 – – 9.00 5.40 6.20 6.50
Female 9.00 – 8.30 5.80 5.00 4.30 8.00 – – 9.60 5.60 6.60 7.00
11 Male 8.50 – 8.70 6.20 5.00 4.80 8.20 – – 9.40 5.80 6.30 7.30
Female 9.10 – 9.20 6.60 5.10 4.80 8.50 – – 10.20 6.30 6.90 7.90
12 Male 8.80 – 8.70 6.70 4.90 4.70 7.60 – – 11.00 6.10 6.80 7.60
Female 9.30 – 9.30 7.10 5.00 4.70 7.90 – – 12.00 6.50 7.40 8.50
13 Male 8.90 – 8.80 6.90 5.40 5.40 7.80 – – 12.60 6.70 7.70 8.00
Female 9.20 – 9.20 7.30 5.40 5.40 8.20 – – 13.60 7.00 8.40 8.90
14 Male 9.60 – 10.20 7.10 5.60 6.10 8.40 – – 13.50 7.00 7.40 8.70
Female 9.70 – 10.30 7.40 6.00 6.10 8.60 – – 14.70 7.00 8.10 9.40

Group Differences in Item and Test Performance 153
Review Procedures to Ensure Test Fairness To help ensure fairness in a test is a critically important goal of test development. The work of ensuring fairness begins with the design of the assessment and continues through every stage of the process. To ensure that assessment materials are appropriate and fair for different groups, careful test development procedures are followed. Sensitivity reviews by content and fairness committees and extensive statistical analysis of the items and tests are conducted (Schmeiser and Welch, 2006; Camilli, 2006).
In developing materials for all forms of the Iowa Assessments, attention is paid to writing questions in contexts accessible to students with a variety of backgrounds and interests. While all attempts are made to write questions that are interesting to all students, it is not possible. Nevertheless, a goal of all test development in Iowa Testing Programs is to assemble test materials that reflect the diversity of the test-taking population in the United States. Reviewers are given information about the purposes of the tests, the content areas, and cognitive classifications. They are asked to look for possible racial-ethnic, regional, cultural, or gender biases in the way the item was written or in the information required to answer the question. The reviewers rate items as “probably fair,” “possibly unfair,” or “probably unfair” and comment on the balance of the items and make recommendations for change. Based on these reviews, items identified by the reviewers as problematic are either revised to eliminate objectionable features or eliminated from consideration for the final forms.
Differential Item Functioning (DIF)
Differential Item Functioning (DIF) identifies items that function differently for two groups of examinees with the same total test score. In many cases, one group will be more likely to answer an item correctly on average than another group. These differences might be due to differing levels of knowledge and skills between the groups. For example, if members of one group tend to take more advanced classes or attend higher performing schools than members of another group, then the performance of the two groups might differ on some items. DIF analyses take these group differences into account and help identify items that might unfairly favor one group over another. The items that are identified as potentially unfair by DIF are then presented for additional review.
The statistical analyses of items for DIF were based on variants of the Mantel-Haenszel procedure (Dorans and Holland, 1993). The analysis of items in the final editions of Form E was conducted with data from the 2010 national comparison study sample. Specific item-level comparisons of performance were made for groups of males and females, Blacks and Whites, and Hispanics and Whites.
The sampling approach for DIF analysis, which was developed by Coffman and Hoover, is described in Witt, Ankenmann, and Dunbar (1996). For each subtest area and level, samples of students from comparison groups were matched by school building. Specifically, the building-matched sample for each grade level was formed by including, for each school, all students in whichever group constituted the minority for that school and an equal number of randomly selected majority students from the same school. This method of sampling attempts to control for response differences between focal and reference groups that are related to the influence

154 Iowa Assessments Research and Development Guide
of school curriculum and environment. A more complete description of the DIF procedures and results is provided in Rankin, LaFond, Welch, and Dunbar (2013).
The number of items identified as favoring a given group according to the classification scheme used by the Educational Testing Service (ETS) for the National Assessment of Educational Progress (NAEP) is shown in Table 34. ETS used the Mantel-Haenszel procedure, which is the statistic described by Holland and Thayer (1988), known as MH D-DIF.1 Based on these DIF statistics, items are classified into one of three categories and assigned values of A, B, or C (see Figure 9). Items classified into category A contain negligible DIF, items in category B exhibit slight or moderate DIF, and items in category C have moderate to large values of DIF (Dorans and Holland, 1993).
A total of 3,028 test items were included in the DIF study that investigated male/female, Black/White, and Hispanic/White comparisons. The overall percentages of items flagged for DIF in Form E were small and generally balanced across comparison groups. This is the goal of careful attention to content relevance and sensitivity during test development.
Figure 9: DIF Classification Categories
DIF Category Definition
A (negligible) Absolute value of the MH D-DIF is not significantly different from zero or is less than 1.
B (slight to moderate)
Absolute value of the MH D-DIF is significantly different from zero but not from 1 and is at least 1, OR absolute value of the MH D-DIF is significantly different from 1 but is less than 1.5. Values that favor the reference group are classified as “BR” and the focal group as “BF.”
C (moderate to large) Absolute value of the MH D-DIF is significantly different from 1 and is at least 1.5. Values that favor the reference group are classified as “BR” and the focal group as “BF.”
Conclusion
Fairness is a critical consideration during the test development process that Iowa Testing Programs has made and continues to make an integral part of the test development process. The Iowa Assessments are designed to accurately and fairly assess the knowledge and skills of the students who take them in the content areas covered by the tests. The procedures described in this part of the guide reflect an ongoing commitment to ensuring fairness in the development and use of results from the Iowa Assessments.
1 This statistic is expressed as the differences between the focal and reference groups after conditioning on total test score. This
statistic is reported on the delta scale, which is a normalized transformation of item difficulty (proportion correct) with a mean of 13 and a standard deviation of 4. Negative MH D-DIF statistics favor the reference group, and positive values favor the focal group. The classification logic used for flagging items is based on a combination of absolute differences and significance testing. Items that are not statistically different based on the MH D-DIF (p > 0.05) are considered to have similar performance between the two studied groups; these items are considered to be functioning appropriately. For items where the statistical test indicates significant differences (p < 0.05), the effect size is used to determine the direction and severity of the DIF.

Gro
up
Differen
ces in Item
and
Test Perform
ance
15
5
Table 34: Number of Items Identified in Category C in National DIF Study, Levels 5/6–14 Iowa Assessments Complete Form E 2010 National Comparison Study
Test Number of
Items
Gender Group
Favors Females
Favors Males
Favors Blacks
Favors Whites
Favors Hispanics
Favors Whites
Reading 368 0 0 1 2 0 1
Language 107 0 0 0 1 0 1
Written Expression 249 0 0 0 0 3 0
Spelling 182 2 2 0 0 0 0
Capitalization 147 0 0 0 0 0 0
Punctuation 147 0 0 0 0 0 0
Vocabulary 301 3 3 2 2 0 1
Word Analysis 131 0 0 0 0 0 0
Listening 109 0 0 1 1 0 0
Mathematics 497 1 0 2 3 2 1
Computation 226 1 0 0 0 0 1
Social Studies 282 1 0 0 0 1 0
Science 282 0 1 0 0 0 1
Total 3,028 8 6 6 9 6 6
Percent 0.26 0.20 0.20 0.30 0.20 0.20

156 Iowa Assessments Research and Development Guide

Works Cited 157
Works Cited
Allen, J., and Sconing, J. (2005). Using ACT assessment scores to set benchmarks for college readiness. ACT Research Report Series 2005‒3. Iowa City, IA: ACT. Retrieved from http://www.act.org/ research/researchers/reports/04index.html
American Educational Research Association, American Psychological Association, and National Council on Measurement in Education (2014). Standards for educational and psychological testing. Washington, DC: American Educational Research Association.
Andrews, K. M. (1995). The effects of scaling design and scaling method on the primary score scale associated with a multi-level achievement test. Unpublished doctoral dissertation, The University of Iowa, Iowa City.
Ansley, T. N., and Forsyth, R. A. (1983). Relationship of elementary and secondary school achievement test scores to college performance. Educational and Psychological Measurement, 43: 1103‒1112. doi: 10.1177/001316448304300419.
Becker, D. F., and Forsyth, R. A. (1992). An empirical investigation of Thurstone and IRT methods of scaling achievement tests. Journal of Educational Measurement, 29: 341–354. doi: 10.1111/j.1745‒3984.1992. tb00382.x.
Beggs, D. L., and Hieronymus, A. N. (1968). Uniformity of growth in the basic skills throughout the school year and during the summer. Journal of Educational Measurement, 5: 91–97. doi: 10.1111/j.1745-3984.1968.tb00609.x.
Betebenner, D. (2009). Norm- and criterion- referenced student growth. Educational Measurement: Issues and Practice, 28(4): 42‒51. doi: 10.1111/j.1745‒3992.2009.00161.x.
Betebenner, D. (2010). SGP: Student growth percentile and percentile growth projection/trajectory functions. R Package version 0.0-6.
Braun, H., Chudowsky, N., and Koenig, J. A. (2010). Getting value out of value-added: Report of a workshop. Washington, DC: National Academies Press.
Brennan, R. L., and Lee, W. (1999). Conditional scale-score standard errors of measurement under binomial and compound binomial assumptions. Educational and Psychological Measurement, 59: 5‒24. doi: 10.1177/0013164499591001.
Camara, W. E. (2013). Defining and measuring college and career readiness: A validation framework. Educational Measurement: Issues and Practice, 32(4): 16‒27. doi: 10.1111/emip.12016.
Camilli, G. (2006) Test fairness. In R. L. Brennan (Ed.), Educational Measurement (4th ed., pp. 221–256). Westport, CT: American Council on Education/Praeger.
Castellano, K. E. (2011). Unpacking student growth percentiles: Statistical properties of regression-based approaches with implications for student and school classifications. Unpublished doctoral dissertation, The University of Iowa, Iowa City. Retrieved from http://ir.uiowa.edu/etd/931/
Castellano, K. E., and Ho, A. D. (2013). A practitioner’s guide to growth models. Washington, DC: Council of Chief State School Officers. Retrieved from http://www.ccsso.org/Resources/Publications/A Practitioners Guide to Growth Models.html.
Chall, J. (1996). Learning to read: The great debate (3rd ed.). New York: McGraw-Hill.

158 Iowa Assessments Research and Development Guide
Cronbach, L. J. (1971). Test validation. In R. L. Thorndike (Ed.), Educational Measurement (2nd ed., pp. 443‒507). Washington, DC: American Council on Education.
Cunningham, P. L. (2014). The effects of value-added modeling decisions on estimates of teacher effectiveness. Unpublished doctoral dissertation, The University of Iowa, Iowa City. Retrieved from http://ir.uiowa.edu/etd/1445
Cunningham, P. L., Welch, C. J., and Dunbar, S. B. (2013). Value-added analysis of teacher effectiveness. Paper presented at the annual meeting of the American Educational Research Association, San Francisco.
Dorans, N. J., and Holland, P. W. (1993). DIF detection and description: Mantel-Haenszel and standardization. In P. W. Holland and H. Wainer (Eds.), Differential Item Functioning (pp. 35–66). Hillsdale, NJ: Erlbaum.
Dunbar, S. B. (2008). Enhanced assessment for school accountability and student achievement. In K. E. Ryan and L. A. Shepard (Eds.), The Future of Test-Based Educational Accountability (pp. 263–274). New York: Routledge.
Feldt, L. S. (1997). Can validity rise when reliability declines? Applied Measurement in Education, 10: 377–387. doi: 10.1207/s15324818ame1004_5.
Feldt, L. S., and Brennan, R. L. (1989). Reliability. In R. L. Linn (Ed.), Educational Measurement (3rd ed., pp. 105–146). New York: American Council on Education/ Macmillan Series on Higher Education.
Feldt, L. S., and Qualls, A. L. (1998). Approximating scale score standard error of measurement from the raw score standard error. Applied Measurement in Education, 11(2): 159–177. doi: 10.1207/s15324818ame1102_3.
Fina, A. (2014). Growth and college readiness of Iowa students: A longitudinal study linking growth to
college outcomes. Unpublished doctoral dissertation, The University of Iowa, Iowa City. Retrieved from http://ir.uiowa.edu/etd/1455
Fina, A., Welch, C. J., Dunbar, S. B., and Ansley, T. N. (2015). College readiness with the Iowa Assessments. Iowa City, IA: Iowa Testing Programs. Retrieved from https://itp.education.uiowa.edu/ia/WhitePapers.aspx
Furgol, K., Fina, A., and Welch, C. J. (2011). Establishing validity evidence to assess college readiness through a vertical scale. Iowa City, IA: Iowa Testing Programs. Retrieved from https://itp.education.uiowa.edu/ia/LinkToResearch.aspx
Haertel, E. (2006). Reliability. In R. L. Brennan (Ed.), Educational Measurement (4th ed., pp. 65‒110). Westport, CT: American Council on Education/Praeger.
Harris, D. J., and Hoover, H. D. (1987). An application of the three-parameter IRT model to vertical equating. Applied Psychological Measurement, 2: 151–159. doi: 10.1177/014662168701100203.
Hieronymus, A. N., and Hoover, H. D. (1986). Manual for school administrators, Levels 5–14, Iowa Tests of Basic Skills Forms G/H. Chicago: Riverside Publishing.
Holland, P. W., and Thayer, D. T. (1988). Differential item performance and the Mantel-Haenszel procedure. In H. Wainer and H. I. Braun (Eds.), Test Validity (pp. 129–145). Hillsdale, NJ: Lawrence Erlbaum Associates, Inc.
Hoover, H. D. (1984). The most appropriate scores for measuring educational development in the elementary schools: GEs. Educational Measurement: Issues and Practice, 3: 8–14. doi: 10.1111/j.1745-3992.1984.tb00768.x.
Hoover, H. D., Dunbar, S. B., and Frisbie, D. A. (2003). The Iowa Tests: Guide to research and development. Chicago: Riverside Publishing.
Works Cited 159
Hoover, H. D., and Hieronymus, A. N. (1990). Manual for school administrators supplement, Levels 5–14, Iowa Tests of Basic Skills Form J. Chicago: Riverside Publishing.
Johnstone, C. J., Thompson, S. J., Bottsford-Miller, N. A., and Thurlow, M. L. (2008). Universal design and multimethod approaches to item review. Educational Measurement: Issues and Practice, 27(1): 25‒36. doi: 10.1111/j.1745-3992.2008.00112.x
Kane, M. T. (2006). Validation. In R. L. Brennan (Ed.), Educational Measurement (4th ed., pp. 17–64). Westport, CT: American Council on Education/Praeger.
Kapoor, S. (2014). Growth sensitivity and standardized assessments: New evidence on the relationship. Unpublished doctoral dissertation, The University of Iowa, Iowa City. Retrieved from http://ir.uiowa.edu/etd/1472
Kolen, M. J. (1981). Comparison of traditional and item response theory methods for equating tests. Journal of Educational Measurement, 18: 1–11. doi: 10.1111/j.1745-3984.1981.tb00838.x.
Kolen, M. J., and Brennan, R. L. (2014). Test equating, scaling and linking. New York: Springer.
Koretz, D. M. (1987). Educational achievement: Explanations and implications of recent trends. Washington DC: The Congress of the U.S., Congressional Budget Office.
Koretz, D. M. (2008). Measuring up: What educational testing really tells us. Cambridge, MA: Harvard University Press.
Koretz, D. M., and Hamilton, L. S. (2006). Testing for accountability. In R. L. Brennan (Ed.), Educational Measurement (4th ed., pp. 531–578). Westport, CT: American Council on Education/Praeger.
Linn, R. L., Baker, E. L., and Dunbar, S. B. (1991). Complex performance-based assessments: Expectations and validation
criteria. Educational Researcher, 20: 15–21. doi: 10.3102/0013189X020008015.
Linn, R. L., and Dunbar, S. B. (1990). The nation’s report card goes home: Good news and bad about trends in achievement. Phi Delta Kappan, 72(2), 127–133.
Loyd, B. H. (1980). Functional level testing and reliability: An empirical study. Unpublished doctoral dissertation, The University of Iowa, Iowa City.
Loyd, B. H., Forsyth, R. A., and Hoover, H. D. (1980). Relationship of elementary and secondary school achievement test scores to later academic success. Educational and Psychological Measurement, 40: 1117–1124. doi:10.1177/001316448004000441.
Loyd, B. H., and Hoover, H. D. (1980). Vertical equating using the Rasch Model. Journal of Educational Measurement, 17: 179–193. doi: 10.1111/j.1745-3984.1980.tb00825.x.
Messick, S. (1989). Validity. In R. L. Linn (Ed.), Educational Measurement (3rd ed., pp. 13–103). New York: American Council on Education/Macmillan Series on Higher Education.
Mittman, A. (1958). An empirical study of methods of scaling achievement tests at the elementary grade level. Unpublished doctoral dissertation, The University of Iowa, Iowa City.
National Catholic Education Association/Ganley (2010). Catholic schools in America (38th ed.). Sun City West, AZ: Fisher Publishing.
National Center for Education Statistics. (2010). Common core of data public elementary/secondary school universe survey data: School year 2008–09 (v.1b)[Data set]. Retrieved from http://nces.ed.gov/ccd/Data/zip/sc081b_sas.zip
Nelson, J., Perfetti, C., Liben, D., and Liben, M. (2012). Measures of test difficulty: Testing their predictive value for grade

160 Iowa Assessments Research and Development Guide
levels and student performance. Washington, DC: Council of Chief State School Officers. Retrieved from http://www.ccsso.org/Resources/Digital_Resources/The_Common_Core_State_Standards_Supporting_Districts_and_Teachers_with_Text_Complexity.html
Patz, R. J. (2007). Vertical scaling in standards-based educational assessment and accountability systems. Washington, DC: Council of Chief State School Officers. Retrieved from http://www.ccsso.org/Resources/Publications/Vertical_Scaling_in_Standards-Based_Educational_Assessment_and_Accountability_Systems.html
Petersen, N. S., Kolen, M. J., and Hoover, H. D. (1989). Scaling, norming, and equating. In R. L. Linn (Ed.), Educational Measurement (3rd ed., pp. 221–262). Washington, DC: American Council on Education.
Phillips, S. E., and Camara, W. E. (2006). Legal and Ethical Issues. In R. L. Brennan (Ed.), Educational Measurement (4th ed., pp. 733–755). Westport, CT: American Council on Education/Praeger.
Plake, B. S. (1979). The interpretation of norm-based scores from individualized testing using the Iowa Test of Basic Skills. Psychology in the Schools, 16: 8–13. doi: I: 10.1002/1520-6807(197901)16:1<8::aid-pits2310160103>3.0.co;2-6.
Proctor, T. (2008). An investigation of the effects of varying the domain definition of science and method of scaling on a vertical scale. Unpublished doctoral dissertation, The University of Iowa, Iowa City.
Qualls, A. L., and Ansley, T. N. (1995). The predictive relationship of achievement test scores to academic success. Educational and Psychological Measurement, 55: 485–498. doi: 10.1177/0013164495055003016.
Qualls-Payne, A. L. (1992). A comparison of score level estimates of the standard error of measurement. Journal of
Educational Measurement, 29: 213–225. doi: 10.1111/j.1745-3984.1992.tb00374.x
Rankin, A. D., LaFond, L., Welch, C. J., and Dunbar, S. B. (2013). Fairness report for the Iowa Assessments. Iowa City, IA: Iowa Testing Programs. Retrieved from https://itp.education.uiowa.edu/ia/Research.aspx
Reardon, S. and Raudenbush, S. (2009). Assumptions of value-added models for estimating school effects. Education Finance and Policy, 4: 492–519.
Rosemeier, R. A. (1962). An investigation of discrepancies in percentile ranks between a grade eight administration of ITBS and a grade nine administration of ITED. Iowa City, IA: Iowa Testing Programs.
Scannell, D. P. (1958). Differential prediction of academic success from achievement test scores. Unpublished doctoral dissertation, The University of Iowa, Iowa City.
Schmeiser, C. B., and Welch, C. J. (2006). Test Development. In R. L. Brennan (Ed.), Educational Measurement (4th ed., pp. 307–353). Westport, CT: American Council on Education/Praeger.
Snow, R. E., and Lohman, D. F. (1989). Implications of cognitive psychology for educational measurement. In R. L. Linn (Ed.) Educational Measurement (3rd ed., pp. 263–331). Washington, DC: American Council on Education.
Tong, Y., and Kolen, M. J. (2007). Comparisons of methodologies and results in vertical scaling for educational achievement tests. Applied Measurement in Education, 20: 227–253. doi: 10.1080/08957340701301207.
Tudor, J. (2015). Developing a national frame of reference on student achievement by weighing student records from a state assessment. Unpublished doctoral dissertation, The University of Iowa, Iowa City.
Wang, M., Chen, K., and Welch, C. J. (2012). Evaluating college readiness for English language learners and Hispanic and

Works Cited 161
Asian students. Paper presented at the annual meeting of the American Educational Research Association, Vancouver. Retrieved from https://itp.education.uiowa.edu/ia/LinkToResearch.aspx
Welch, C. J., and Dunbar, S. B. (2011). K–12 assessments and college readiness: Necessary validity evidence for educators, teachers and parents. Paper presented at the annual meeting of the American Educational Research Association, New Orleans. Retrieved from https://itp.education.uiowa.edu/ia/LinkToResearch.aspx
Welch, C. J., and Dunbar, S. B. (2014a). Comparative evaluation of online and paper and pencil forms of the Iowa Assessments. Iowa City, IA: Iowa Testing Programs. Retrieved from https://itp.education.uiowa.edu/ia/LinkToResearch.aspx
Welch, C. J., and Dunbar, S. B. (2014b). Measuring growth with the Iowa Assessments. Iowa Testing Programs Black and Gold Paper 01‒14. Iowa City, IA: Iowa Testing Programs. Retrieved from https://itp.education.uiowa.edu/ia/WhitePapers.aspx
Witt, E. A., Ankenmann, R. D., and Dunbar, S. B. (1996). The sensitivity of the Mantel-Haenszel statistic to variations in sampling procedure in DIF analysis. Paper presented at the annual meeting of the National Council on Measurement in Education, New York City.
Wood, S. W., and Ansley, T. N. (2008). An investigation of the validity of standardized achievement tests for predicting high school and first-year college GPA and college entrance examination scores. Paper presented at the annual meeting of the National Council on Measurement in Education, New York City.

162 Iowa Assessments Research and Development Guide

Index 163
Index
ACT relationship between Iowa Assessments
scores and ACT composite scores ....... 35 subject-area test score correlations ....... 35
Assessment framework ................................ 4 item design and development ................. 4 National Assessment of Educational
Progress (NAEP) .................................... 4
Ceiling and floor effects .......................... 129
Cognitive level difficulty descriptors ......... 33
Color blindness .......................................... 48
Common Core State Standards (CCSS) consistency with ..................................... 33 design of Iowa Assessments ................... 24 distribution of skills objectives .............. 32 organization of Iowa Assessments ........ 66
Comparability developmental scores across levels ........ 53 form comparability ................................ 64 longitudinal comparability .................... 53 Iowa Growth Model ............................... 55 vertical scaling ........................................ 53
Completion rates ..................................... 142 indices of completion ........................... 142
Concurrent validity .................................... 45 Form E and ITBS/ITED Form A
correlations ......................................... 46 Form E/CogAT correlations .................... 45 other considerations .............................. 47
Configurations tests by level ............................................. 5
Content Classifications Guide .................. 105
Design for data collection ......................... 13
Developmental scale .................................. 53
Differential Item Functioning (DIF) ......... 153 analysis of items ................................... 153 classification categories ....................... 154
Directions for Administration ................... 10 by configuration ..................................... 10
Distribution of domains and skills ............. 32
Distribution of item difficulties .............. 107
Domain specifications ............................... 24
Educational Testing Service (ETS) ........... 154
English language learners (ELLs) Fall 2010 National Comparison Study ... 16
Expected growth ....................................... 42
Fairness .................................................... 153 analysis of items .................................. 153 DIF classification categories ................ 154 differential item functioning (DIF) ..... 153 review procedures ............................... 153
Fall 2010 National Comparison Study ...... 13 English language learners (ELLs) ........... 16 Individual Accommodation Plan (IAP) .. 16 Individualized Education Program
(IEP) ..................................................... 16 participation of students in special
groups................................................. 16 percentage of Catholic school students by
diocese size and geographic region .. 15 percentage of private (non-Catholic)
school students by geographic region ................................................. 16
percentage of public school students by district enrollment ............................. 15
percentage of public school students by geographic region.............................. 14
percentage of public school students by Title I status ........................................ 14
percentage of students by type of school ....................................... 13, 14
racial-ethnic representation .................. 18 Section 504 Plan .................................... 16
Fall National Comparison Sample............. 12 Catholic school sample .......................... 12 data collection design ........................... 13 private (non-Catholic) school sample .... 13 public school sample ............................. 12 stratification variables ........................... 12 weighting samples ................................. 13
Forms review ............................................. 27
Ganley’s Catholic Schools in America ....... 12

164 Iowa Assessments Research and Development Guide
Getting more help ....................................... 1
Grade and test levels ................................... 6
Growth scale origin and evolution of .......................... 54
HMH–Riverside Customer Service ............... 1
Implement Response to Intervention (RTI) purposes of the Iowa Assessments .......... 4
Individual Accommodation Plan (IAP) Fall 2010 National Comparison Study ... 16
Individualized Education Program (IEP) Fall 2010 National Comparison Study ... 16
Internal structure of the Iowa Assessments ............................................ 33
Iowa Assessments college readiness .................................... 35 configurations .......................................... 5 configurations .......................................... 5 difficulty of ........................................... 105 grade and test levels ................................ 6 internal structure ................................... 33 mode of responding ................................ 9 nature of the questions ........................... 9 online test adminstration ...................... 10 relationships of forms ............................ 65 test description ........................................ 5 test lengths and times.............................. 6 test name ................................................. 5
Iowa Growth Model .................................. 55 grade-to-grade overlap in student
achievement ....................................... 56
Iowa Testing Programs (ITP) ........................ 3
Item difficulty .......................................... 105 appropriateness of ............................... 114 item discrimination .............................. 116
Item discrimination ................................. 129
Item tryout ................................................. 26
Item writing ............................................... 25
Mode of responding.................................... 9
National Assessment of Educational Progress (NAEP) ............................ 149, 154
National Catholic Educational Association (NCEA) .................................................... 12
National Center for Education Statistics (NCES) Common Core of Data (CCD) ..... 12
National Comparative Information ...........11
National Comparison Study about ......................................................11 Catholic school sample ...........................12 data collection design ............................13 principles and conditions .......................11 private (non-Catholic) school sample ....13 procedures for selecting sample ............12 public school sample ..............................12 stratification variables ............................12 weighting samples .................................13
National grade-equivalent (NGE) scale .....58
National Standardization Program National Comparison Study ...................11
Nature of the questions .............................. 9
Norms special school populations .....................63
Online test administration ........................10
Operational forms construction ................26
Predictive validity and college readiness ..35 correlations between ACT and Iowa
Assessments .........................................35 interpretation and utility of readiness
information .........................................37 tracking readiness ..................................36
pretesting materials ...................................10
Purposes of the Iowa Assessments ............. 3
Quality Education Data (QED) data file ....13
Reliability ...................................................69 conditional standard errors of
measurement for selected score levels ..........................................92
data .........................................................70 determining, reporting, and using data 69 equating Form E to Form A ...................90 estimating methods ...............................70 methods of .............................................69 paper-based and computer-based test
administration.....................................91 sources of variation in measurement ....90 types of indices .......................................69 within-forms reliability ..........................90
Riverside Scoring Service ...........................13
Section 504 Plan Fall 2010 National Comparison Study ....16

Index 165
Spring 2011 National Comparison Study .. 19 selection procedures .............................. 19 study purposes ....................................... 19
Standard errors of measurement for groups ............................................. 149
Test descriptions ........................................ 27 configurations .......................................... 5 Level 5/6 .................................................. 27 Levels 7 and 8 ......................................... 28 Levels 9−14 ............................................. 30 Levels 15−17/18....................................... 31
Test development procedures ................... 24 data review ............................................. 26 external review....................................... 26 forms review ........................................... 27 internal review, stage one ..................... 26 internal review, stage two ..................... 26 item tryout ............................................. 26 item writing ............................................ 25 operational forms construction ............. 26 test specifications ................................... 25
Test lengths and times ................................. 6 Level 5/6 .................................................... 6 Levels 7 and 8 Complete and Core tests .. 7 Levels 7 and 8 Survey tests ....................... 7 Level 9 optional Word Analysis and
Listening tests ....................................... 8 Levels 9–14 Complete and Core tests ...... 7 Levels 9–14 Survey tests ........................... 8 Levels 15–17/18 ......................................... 9
Test levels by age and grade ..................................... 6
Test name ..................................................... 5
Test results monitoring growth .... 3, 38, 39, 41, 45, 58 using ......................................................... 3
Testing materials pretesting materials ............................... 10
Text complexity and readability ................ 48 considerations .................................. 50, 57 review of materials ................................ 49
Universal design ......................................... 47
University of Iowa, The Iowa Testing Programs (ITP) .................... 3
Use of Assessments to Evaluate Instruction .............................................. 50
Validity assessment validity ................................ 22 cognitive level difficulty descriptors ..... 33 color blindness ....................................... 48 concurrent validity ................................. 45 concurrent validity, Form E and ITBS/ITED
Form A ................................................ 46 concurrent validity, Form E/CogAT ....... 45 criteria for evaluating assessments ....... 21 data review ............................................ 26 distribution of domains and skills ......... 32 domain specifications ............................ 24 evaluate instruction ............................... 50 external review ...................................... 26 forms review .......................................... 27 framework and statistical foundation of
growth metrics ................................... 39 growth model ........................................ 38 in the assessment of growth ................. 38 in the assessment of growth, data
requirements, and properties of measure .............................................. 43
in the assessment of growth, expected growth ................................................ 42
in the assessment of growth, metrics ... 42 in the assessment of growth, relationship
to other growth models .................... 44 in the assessment of growth, statistical
foundation ......................................... 41 instructional decisions ........................... 22 internal review, stage one .................... 26 internal review, stage two .................... 26 internal structure ................................... 33 item tryout ............................................. 26 item writing ........................................... 25 measurement of growth, examples of . 40 operational forms construction ............ 26 other considerations .............................. 47 predictive validity and college
readiness ............................................. 35 questions in selection and evaluation
of tests ................................................ 24 statistical data ........................................ 23 test descriptions ..................................... 27 test descriptions, Level 5/6 .................... 27 test descriptions, Levels 7 and 8 ............ 28 test descriptions, Levels 9−14 ................ 30 test descriptions, Levels 15−17/18 ......... 31 test development procedures ............... 24 test specifications .................................. 25

166 Iowa Assessments Research and Development Guide
tests in the local school .......................... 23 text complexity and readability ............. 48 text complexity and readability,
considerations ............................... 50, 57 text complexity and readability, review of
materials ............................................. 49 universal design ..................................... 47 validity of the tests .................................. 4
Validity and growth .................................. 38
data requirements and properties of measures .............................................43
expected growth ....................................42 framework ..............................................39 growth metrics .......................................42 growth model .........................................38 relationships to other growth models ...44 statistical foundation .............................41 validity evidence, examples of ...............40
Weighting samples ....................................13


AssessmentsIowa
TM