Embed Size (px)
Citation preview

1

2
3
EXECUTIVE SUMMARY
Global economic activity and trade picked up substantially within the
advanced economies towards the second half of 2013 raising hopes of a much
stronger 2014. These hopes were premised largely on waning skepticism over
the two major threats to global economic recovery at the time: the possible
breakup of the Euro-zone and the reverberating effects of the US falling off the
“fiscal cliff”. Although these two headwinds were summarily overcome early in
2014, the revival in global economic conditions remained largely unconvincing
for the rest of the year. In the major high income areas, growth in private
spending was at best tepid, as these economies began to slowly adjust to the
“hangovers” of massive balance sheet adjustments in the previous year.
Beyond the anticipated decline in oil prices, we believe the major challenge
facing the global economy in 2015 will be the task of minimizing the volatility
expected to ensue from broadly dissimilar fiscal and monetary regimes across
the advanced economies. With the Bank of Japan possibly pursuing
Quantitative Easing, the European Central Bank maintaining its aggressive
balance sheet expansion, and the US tightening stance, we see larger scale
volatility compared to 2014.
The market is moving in the direction of a possible US rate hike...
As the US economy continues its recovery, much stronger than before, the Fed is
widely expected to begin raising interest rate in mid 2015. Our analysis of seven
(7) previous US rate tightening cycles shows that rise in rate often creates
volatility and slows the pace of gains in emerging markets. Some of the impacts
of a tightening environment already occurred in 2013. While many emerging
markets now appear to be better off, having raised rates and reduced current
account deficits, some are still exposed to rate hike due to domestic economic
conditions. The last time the US Fed hinted on Quantitative Easing tapering,
global financial markets went into panic mode with emerging markets bearing
the brunt of portfolio reversals, resulting in sharp depreciations in exchange
rates. Although we expect many emerging markets to take measures to reduce
their vulnerabilities to such externalities in 2015, having learnt their lessons the
hard way, we still see a sizeable chunk of capital outflows from very volatile
frontier economies particularly those with relatively lower risk adjusted real
returns.
Are oil prices assuming a new normal?
Given the long backwardation history of oil price trading dynamics, current and
anticipated supply-demand scenarios, there is no reason to expect oil prices to
rebound sharply in the short to medium term. We see oil prices remaining

4
volatile especially in the first half of 2015 as the market digests the actions and
inactions of oil producers. Notably, the outlook for oil prices in the medium to
long term remains bleak against the background of the significant traction that
alternative energy sources as well unconventional oil production has gained in
the last decade.
Nigerian economy and financial markets may be challenged in 2015
The Nigerian economy is set to face one of the most difficult times in history as
global crude oil prices, a key anchor for fiscal strength and macroeconomic
stability, continue on a downward trajectory in 2015. The financial markets are
likely to be more challenging relative to 2014 as we expect 4 major factors to
shape the markets in 2015: 1) Post-election scenarios 2) Aggressive tightening by
the CBN, 3) Variability in foreign portfolio flows, and 4) the downward trajectory
of crude oil prices. These factors are largely expected to dictate movements in
both equity and fixed income markets albeit in different degrees during the
year. This report contains a detailed review of the market in 2014 with
projections for 2015, including expectations across different sectors; inherent
opportunities as well as strategies for navigating the market at a time like this

5
CONTENTS
Executive Summary 3
Abbreviations 7
Global Economic Review and Outlook 11
Global Economy: Quite a distance to recovery 12
United States: Turning off the stimulus tap 13
Other Advanced Economies 14
Emerging and Frontier Markets 15
Global Macro Themes for 2015 17
The BRICS 19
Africa Update and Outlook 21
South Africa: Slowly turning the corner? 22
Ghana: Growing but groaning 26
Kenya: Brighter medium term prospects 29
Oil Price Dynamics and Nigeria’s 2015 Outlook 35
Domestic Macro Trends and Outlook for 2015 43
Monetary Policy 44
Real GDP 48
Inflation Rate 50
Exchange Rate Dynamics 51
Fiscal Plan 55
Politics and 2015 Elections 59
Capital Markets Review and Outlook 61
Fixed Income Market 62
Equities Market 67
Sector Reviews and Recommendations 76
Banking Sector 77
Insurance Sector 82
Consumer Goods Sector 91
Industrial Goods Sector 97
Oil and Gas Sector 101
List of Figures and Tables 107

6

7

8
Analyst(s)
Kayode Tinuoye
Team Lead, Research
Office: +234-1-280 7334 Ext: 18334
Kayode Omosebi
Analyst
Office: +234-1-2808425 Ext: 19425
Securities Trading
+234-1-280-8919
Asset Management
+234-1-2807822
Trusteeship
+234-1-27157491
Investment Banking
Project Finance
Mergers & Acquisitions
Capital Markets

9

10
Section 1
Global Economic Review and Outlook

Global Economic Review and Outlook
11
2014: The Year That Was…
Global Economy: Quite a Distance to Recovery
A strong pick-up in global activity and trade within the advanced economies
towards the second half of 2013 raised hopes of a much stronger 2014. These
hopes were premised largely on waning skepticisms over the two major threats
to global economic recovery at the time: the possible breakup of the Euro-zone
and the reverberating effects of the US falling off the “fiscal cliff”.
Although these two headwinds were summarily overcome early in 2014, the
revival in global economic conditions remained largely unconvincing. In the
three major high income areas, US, Euro Zone and Japan, the growth in private
spending was at best tepid, as these economies began to slowly adjust to the
“hangovers” of massive balance sheet adjustments in the previous year. In the
Euro-zone and the US, a significant easing following sustained fiscal
consolidation drove expectations of a recovery in demand and business
confidence.
Emerging economic data as early as April 2014 however suggested that all may
not be rosy for the global economy. In its World Economic Outlook for April,
2014, the IMF noted the improvement in global economic outlook but
maintained that output gaps largely existed especially in the advanced
economies. It was therefore of necessity that the broadly accommodative
monetary policies be sustained, even as fiscal consolidation needed to stay
within the threshold that ensured that downsides risks to global growth were
largely contained.
Monetary Policy Divergence Fuels Market Volatility
One noticeable theme in the global economy for the year was that for the first
time in a long while, the US Fed pursued broadly dissimilar monetary policy to
the ECB, a development which in our view contributed to the appreciation of
the dollar against most currencies in 2014. The search for yield continued in key
emerging markets with the attendant pressures on exchange rates especially for
countries with more open economies and weak external trade positions.
Beyond the anticipated declines in oil prices, we believe the major challenge
facing the global economy in 2015 will be the task of minimizing the volatility
expected to ensue from broadly dissimilar fiscal and monetary policy regimes
across the advanced economies. With the BOJ possibly pursuing QE, and the
ECB maintaining its aggressive balance sheet expansion, we see a larger scale
of volatility compared to 2014. That said the strong growth prospects of the US
economy should provide some comfort.
In the three major high
income areas, US, Euro Zone
and Japan, the growth in
private spending was tepid,
as these economies began
to slowly adjust to the
“hangovers” of massive
balance sheet adjustments in
2013.
The US fed policy decisions
diverged significantly from
the ECB’s, leading to strong
gains in the dollar

Global Economic Review and Outlook
12
-4%
-2%
0%
2%
4%
6%
8%
2000 2002 2004 2006 2008 2010 2012 2014f 2016f
Advanced economies seem to have turned the corner but
lingering output gaps leave much ground to gain in 2015
y/y GDP growth in global and advanced economies
Advanced Economies
Emerging Economies
Global Real GDP Growth (2014-2015)
%,q/q
Q1 Q2 Q3 Q4
Advanced Economies 0.7 1.3 2.2 1.8
United States -2.1 4.6 3.5 2
Euro Area 0.9 0.1 0.5 0.8
Japan 6.0 -7.1 2.4 2.6
Emerging Economies 3.3 3.9 4.1 4
Latin America 0.2 -0.8 0.9 1.3
Emerging Europe 1.9 -0.1 -0.3 -3
Russia 0.3 1 -2 -6
Asia/Pacific 5.2 5.2 7 6.9
China 6.1 8.2 7.8 7.5
World 1.6 2.2 2.9 2.6
United States: Turning off the stimulus Tap
Economic fundamentals continue to support interest rate hike
A disappointing Q1’14 saw the US economy contract by 2.1% q/q ( Vs. a growth
of 2.6% q/q in Q4’13) as adverse weather effects and inventory overhang
constituted a drag on the economy. We believe the decline in Q1, which was
the first quarterly drop since 2009, re-enforced the vulnerability of the US
economy, and effectively places a steeper hurdle on the growth path of the
economy in the near term. The economy rebounded in Q2 with a strong 4.6%
q/q but growth slowed to 3.3% in Q3’14 (annualized 3.5%) driven by an
acceleration in private consumption spending.
Motivated by some cheery trends in economic data, the US effectively ended
its QE programme in October 2014 after a gradual cutback in debt purchase,
beginning January 2014. As a result, a huge chunk of emerging market portfolio
inflows was curtailed. Although most economic fundamentals continue to point
to the recovery of the US economy, the FED has chosen to delay interest rate
hike. We believe this is a precautionary stance taken to shield interest rate
sensitive sectors such as housing and the financial markets. While the labor
market improved significantly in Q1-Q4 ‘14, signs of a re-emergence of labor
market pressures resurfaced in Q4’14.
FED’s forward guidance points to the possibility of rates remaining at zero (0%)
through mid 2015. Nonetheless, we expect the FED to begin to raise interest rate
early in Q3 ‘15 as a sustained acceleration in private spending is expected to
spur growth while inflation remains at a comfortable sub-2% range.
Source: IMF, United Capital Research Source: IMF, United Capital Research
We believe the decline in Q1
‘14, which was the first
quarterly drop since 2009, re-
enforced the vulnerability of
the US economy.
FED’s forward guidance
points to the possibility of
rates remaining at zero (0%)
through mid 2015. economy,
and effectively places a
steeper hurdle on the growth
path of the economy in the
near term
Fig. 1

Global Economic Review and Outlook
13
2.3
1.6
2.5
0.1
2.7
1.8
4.5
3.5
-2.1
4.6
3.5
2.5
3.2
-3
-2
-1
0
1
2
3
4
5
Q1'12 Q2
'12
Q3
'12
Q4
'12
Q1
'13
Q2
'13
Q3
'13
Q4
'13
Q1
'14
Q2
'14
Q3
'14
Q4
'14 F
2015F
US GDP growth to steady at 2.5% range in 2015 Fig. 2
Other Advanced Economies
Expect some volatility, but cheaper oil will support growth
We continue to expect growth to strengthen further in advanced economies in
2015 albeit at varying momentum across countries. While the US is likely to
record the strongest rebound due to robust private spending, growth in the Euro
Zone will continue to be weighed down by the legacy of socio-political crisis.
Although the recession in Europe can be placed against the backdrop of
balance sheet deleveraging, the recent crisis within the region continues to
suggest that further large capital outflow is not in any way impossible. This trend,
in our view, will be further exacerbated by the accommodative monetary
policy of the ECB expected to be sustained going into 2015.
While the big economies are expected to bounce back to positive growth
territory in 2015, the peripheral economies will continue to experience high
unemployment rates (more than 20% in some cases), with the attendant risk of
social unrest. The possibilities of flare-ups in political risks concerning the
capitalization of the ECB and the chance of further debt write-down particularly
in Greece could cause the region’s financial markets to be volatile in 2015. In
the midst of all these, the outlook for the Euro is positive. As at October 2014, the
IMF projected average growth rates of 0.8% and 1.3% for the region in 2014 and
2015 respectively. We believe this is achievable as the ECB’s recently unveiled
US q/q GDP Growth, 2012-2015(%)
Source: Bloomberg, United Capital Research
While the big economies are
expected to bounce back to
positive growth territory in
2015, the peripheral
economies will continue to
experience high
unemployment rates

Global Economic Review and Outlook
14
-3.0%
-2.0%
-1.0%
0.0%
1.0%
2.0%
3.0%
4.0%
Canada France Germany Italy Japan Spain United
Kingdom
United
States
Euro
Area
Growth expected to be strongest in the US in 2015
Historical and Forecast GDP Growth for Advanced Economies (y/y, % )
2013
2014
2015
set of stimulus packages, which are likely to be stepped up in 2015, will continue
to support both growth and the regional currency.
In line with market expectations, growth should remain stable in Japan in 2015.
After the disruptions in the pattern of growth in Q1’14, occasioned by hike in
consumption tax, we saw a mild recovery in Q3, largely attributable to
improvement in labor market conditions. We think lower oil prices will support
growth just as the BOJ’s decision to extend and expand quantitative easing
should provide strong support for the economy. Elsewhere, growth in Canada,
Norway, and the UK are expected to be solid. The key drivers here will be
improving credit and financial market conditions as well as healthy balance
sheets.
Emerging and Frontier Markets
Attractive Prospects constrained by commodity price pressures
Emerging-market assets were under pressure in 2014 evidenced by the strength
of the US economy, which should sooner rather than later lead to higher interest
rates, and hence significant portfolio reversals. Softness in key commodity
prices, particularly oil, is adding another dimension of risk to commodity-rich
emerging market economies. In spite of the headwinds, occasioned by waning
capital flows, EMs and FMs continue to offer exciting opportunities to investors, in
our opinion. The major attractions for EM and FM’s assets in 2015 will be
continued high rates of economic growth that these regions enjoy and the
likelihood that they could be sustained due to demographic benefits as well as
In spite of the headwinds,
occasioned by waning capital
flows, EMs and FMs continue to
offer exciting opportunities to
investors, in our opinion.
The IMFs’ recently unveiled set
of stimuli which is likely to be
stepped up in 2015 should
propel the Euro Area economy
Source: IMF, United Capital Research
Fig. 3

Global Economic Review and Outlook
15
prospects of exploiting vast natural resources. Across EM’s and FM’s, equity
market performance would be negatively impacted by falling oil prices and
weakening growth trends.
Importantly, in light of recent events, challenges still exist for emerging markets.
Socio-political instability in a number of regions as well as the prospects of
tightening season in the US with attendant currency weaknesses in these
economies might restrain FPIs. In fact, as early as Q1’15, we see investors
beginning to adjust to the possibility of higher US treasury yields, in anticipation
of a mid-2015 lift-off of monetary policy. However, it is critical to note that the
expected tightening in the US is on the back of improvement in economic
performance, and should ordinarily bode well for emerging and frontier
markets, via increased exports, production and trade. In addition, while the US
may be approaching a tightening phase, policy in Japan should remain very
accommodative. Recovery in advanced economies poses prospects of higher
export demand and investment flows, though weaker commodity prices will
moderate growth.
Within frontier markets, measures of economic and market reforms in a number
of key markets, among them; Vietnam, Egypt, Pakistan and Nigeria, offer the
prospects of both a stable growth and improving profitability for the corporate
sector. Concerns however exist, notably conflict in Ukraine, Iraq and Northern
Nigeria, as well as the outbreak of the Ebola virus in West Africa. Nonetheless,
we believe that many of these markets possess strong potential for long-term
growth.
60
70
80
90
100
110
120
0.8
0.9
1.0
1.1
1.2
MSCI Frontier Brent Crude
Oil price decline might pressure Frontier equities
Fig. 4
Source: Bloomberg, United Capital Research
The expected tightening in the
US is on the back of
improvement in economic
performance, should ordinarily
bode well for emerging and
frontier economies.
Within frontier markets,
measures of economic and
market reform in a number of
key markets offer the
prospects of both stable
growth and improving
profitability for corporates

Global Economic Review and Outlook
16
Saudi Arabia to open its stock market to foreign investors in H1’15
As the only G-20 member closed to foreign investors, Saudi Arabia’s decision to
open up its stock market has the potential to deepen financial markets in the
region. The Saudi Arabian stock market, known as the Tadawul is the Middle
East largest and most liquid market. The 167 companies currently listed on the
Tadawul have a combined market capitalization of US$531bn. The possible
effect of this is increased exposure by foreign investors to the Gulf co-operation
council region which may mean less exposure to competing frontier/emerging
region markets in 2015 and beyond. Overall, we believe that these changes to
equity market regulations in Saudi Arabia could have major ramifications, given
the size of the market.
Global Macro Themes for 2015
The market is moving in the direction of a possible US rate hike...
As stated earlier, as the US economy continues its recovery, the US fed is widely
expected to begin raising interest rate in mid 2015. Our analysis of seven (7)
previous US rate tightening cycles shows that rise in rate often creates volatility
and slows the pace of gains in the emerging markets. Some of the impacts of a
tightening environment already occurred in 2013. While many EMs now appear
to be better off, having raised rates and reduced current account deficits,
some are still exposed to rate hike due to domestic economic conditions. The
last time the US Fed hinted on QE tapering, global financial markets went into
0.8
1.0
1.2
1.4
Jan-14 Feb-14 Mar-14 Apr-14 May-14 Jun-14 Jul-14 Aug-14 Sep-14 Oct-14 Nov-14
MSCI Advanced MSCI Emerging MSCI Frontier
Frontier equities outperformed others in 2014
Fig. 5
MSCI Equity Indices for Advanced and Emerging Economies, 2014(%)
Source: Bloomberg, United Capital Research
Recovery in advanced
economies poses prospects of
higher export demand and
investment flows, though
weaker commodity prices will
moderate growth.
Our analysis of seven (7)
previous US rate tightening
cycles shows that rise in rate
often creates volatility and
slows the pace of gains in the
emerging markets

Global Economic Review and Outlook
17
0
0.4
0.8
1.2
1.6
400
800
1200
1600 MSCI Emerging MSCI Frontier ECB Rate
panic mode. The EMs and FMs bore the brunt of portfolio reversals, resulting in
sharp depreciations in exchange rates. Although we expect many EMs to take
measures to reduce their vulnerabilities to such externalities in 2015, having
learnt their lesions the hard way, we still see a sizeable chunk of capital outflows
from very volatile emerging and frontier economies particularly those with
relatively lower risk adjusted real returns.
... but expansionary policies by BOJ and ECB will cushion the effect
In 2014, the ECB began a new asset purchase program. At its October 2 press
conference, ECB President indicated that the new program would consist of
asset-backed securities and covered bonds, and would lead to a sizable
increase in the ECB’s balance sheet. The program is scheduled to last for at
least two years with the potential to add €1trn into the Euro-zone economy.
Given these indications, there is a high probability of QE in the Euro-Zone in 2015
even as the ECB scrambles to deal with low inflation. This therefore provides
cushion to the effect of tightening and interest rate hike in the US, as QE by the
BoJ and ECB will sustain some level of funds flow into EMs and FMs. On another
note, the possible effect of the ECB’s QE could be Euro-zone banks lending
more to EMs and FMs to earn higher yields. However, it is important to note the
expected liquidity from the Euro-zone may not find easy outlets in Europe, in our
view, as bonds in the region are expensive. The German and French 2-yr note
yields dropped below zero in October 2014.
Meanwhile, the pressure for Japan to continue its asset purchase program
remains intense, especially after the sharp contraction in Q2’14 GDP and weak
production data for Q3’14. In our view, the Bank of Japan (BOJ) will be forced
to expand its balance sheet in 2015 at the same pace that it did in 2014. This
would be the equivalent of increasing the balance sheet by another 15% of the
GDP.
Expansionary regime in the Euro-zone will bode well for the EMs and FMs
There is a high probability of
QE in the Euro-Zone in 2015
even as the ECB scrambles to
deal with low inflation
The Bank of Japan (BOJ) will
be forced to expand its
balance sheet in 2015 at the
same pace that it did in 2014
Source: Bloomberg, United Capital Research
Fig. 6
Global Economic Review and Outlook
18
The BRICS
Geo-political and country specific risks pose major challenges
The outlook for oil prices is at the core of expectations around the economic
performances of the BRICs countries in 2015. The downward trend in global oil
prices, coupled with high inflation and currency pressures present challenges to
the Brazilian economy. Also, as global demand falls, prices of Brazil’s export
commodities (mostly iron ore and petroleum) are expected to fall, further
slowing down the economy.
China also faces demographic pressures relating to an aging working-class
population. For Russia, a major producer of oil, the increased production of
shale as an alternative energy source will continue to pressure the economy
with continued weakness in the domestic currency despite the country’s robust
foreign reserves. This is coming at a time when Russia faces sanctions from
Europe and the US, limiting Russian firms’ access to western debt markets.
Russia’s retaliation of imposing high import tariffs on Western goods has further
pushed up domestic prices, leading to higher level of inflation.
We expect the low investors’ confidence in the economy to continue to
pressure Russian stocks, further weakening the Russian Ruble. Given Putin’s
stance, which shows that he is not willing to give in to the sanctions imposed by
the West, we expect to see more sanctions on Russia, leading to higher rate of
inflation, and weakened currency, hence a slow-down in growth in 2015.
India’s successful transition in May 2014 portends better prospects for the
country’s business environment going into 2015. We already saw a 5.7% GDP
growth in Q2 ‘14 (versus 4.6% in Q1’14). We expect to see some level of
increased spending in 2015, which should translate to economic growth in India,
as long as the government continues with policies that support these
investments.
South Africa’s economy continues to face internal challenges as the GDP
contracted by 0.6% to 1% in Q1’14 from 1.6% in Q2’14. Amidst labor strikes, high
interest rate, currency pressures, rising inflation and slowing demand, we expect
further pressure on growth in the nearer term.
Source: Bloomberg, United Capital Research
The outlook for oil prices is at
the core of expectations
around the economic
performances of the BRICs
countries in 2015

Global Economic Review and Outlook
19
-10.0%
-5.0%
0.0%
5.0%
10.0%
15.0%
20.0%
2000 2001 2002 2003 2004 2005 2006 2007 2008 2009 2010 2011 2012 2013 2014f 2015f 2016f
BRAZIL RUSSIA INDIA CHINA SOUTH AFRICA
Amidst decreasing global demand, declining oil price,weak currencies, high imflation and
sanctions on Russia, BRICS economies may continue their gradual decline in 2015
Real GDP Growth for BRICS Economies
Source: Bloomberg, United Capital Research
Fig. 7

South Africa
20
Section 2
Africa Update and Outlook
South Africa, Ghana, Kenya

South Africa
21
-8
-6
-4
-2
0
2
4
6
Q1 '09 Q3 '09 Q1 '10 Q3 '10 Q1 '11 Q3 '11 Q1 '12 Q3 '12 Q1 '13 Q3 '13 Q1 '14 Q3 '14
In spite of the recent pressure on output, long term outlook points
to a positive trend
q/q Real Growth Trend for SA (%)
South Africa: Slowly turning the corner?
For most part of 2014, labour market unrest and global macroeconomic
headwinds led to a slowdown in the South African economy. The economy
almost slid into a recession in H1’14 as the protracted strike in the mining sector
constrained industrial activities, culminating in a marginal 0.6% growth in GDP for
Q2’14 (Vs. -0.6% in Q1’14 and 3.2% in Q2’ 13). The mining and quarrying sector
witnessed a 9.4% decline in q/q output due to prolonged industrial actions
which stifled platinum production. Agriculture grew by 4.9% while transport,
storage and communication expanded by 4.0%. However, the economy
showed some signs of rebound in Q3 with a GDP growth of 1.4% albeit below
consensus estimate of 1.5%. Q3’ 14 growth was driven largely by acceleration in
the services and agricultural sectors. Growth in the mining sector rebounded to
positive territory though manufacturing output continued to fall.
With a rebased GDP (from 2005 base year to 2010), South Africa’s economy is
now 4.4% bigger than earlier estimated in 2013 with an increase in the share of
services sector and a reduction in the share of manufacturing.
Growth may continue to be challenged in 2015. We nonetheless expect a
modest recovery provided disruptions to industrial activities can be avoided.
Also, the expected alleviation of infrastructural constraints as the new power
generating capacity comes on stream should further support growth. This should
provide some scope for a rebound in export though the weaknesses in the Euro
zone which serves as the destination for most of South African exports will offset
any gains that weakening of the Rand might imply for export. The expected
normalization in monetary policy in the US also portends some downside risks for
the South African economy in 2015.
Source: National Accounts, United Capital Research
The weakness in the Euro
Zone still portends
downside risk for the South
African economy in 2015…
Manufacturing output
continued to fall as effects of
prolonged industrial actions
lingered on the economy’s
growth path…
With the manufacturing sector in negative
territory, a strong rebound in mining is
needed for a sustainable recovery of the
broader economy
Source: National Accounts, United Capital
Research
Fig. 8

South Africa
22
7
9
11
13
Jan-12 Jun-12 Nov-12 Apr-13 Sep-13 Feb-14 Jul-14 Dec-14
Tougher Days Ahead for the Rand
USD/ZAR, 2011-2014
Exchange Rate: Economic Uncertainties Drive Rand Volatility
Intermittent emerging market sell-offs pressured the Rand significantly in 2014.
The currency lost 10.5% y/y Vs. USD as portfolio reversals heightened against the
backdrop of a cut back in US QE. Although the volatility in portfolio capital
flows into high yielding emerging markets was a key drag on the Rand in 2014,
the currency was further weakened by concerns around the strength of the
domestic economy. The exchange rate broke the ZAR11 resistance on two
occasions in 2014: February and October.
The pass-through on the price level was quite notable, as inflation rate also
broke the Reserve Bank’s target range of 3-6%. We see more pressure on the
Rand in 2015 largely on account of anticipated tightening in the US. However,
the modest growth outlook for the South African economy should support the
currency and provide cushion to shocks from portfolio reversals.
Interest Rate: The SARB Dilemma
In spite of the weak growth of the South African economy, SARB was compelled
to shelve accommodative monetary policy measures for the most part of 2014.
In a bid to control spiraling inflation, the SARB raised interest rate twice by a total
of 75bps to 5.75% as at November 2014. We think interest rates are likely to be
further increased in 2015, as we see inflation tracking above the SARB’s target.
Unless oil prices fall throughout 2015, which is very much unlikely, the expected
weakness in the Rand will continue to fuel imported inflation. This should
necessitate tighter policy measures geared towards maintaining a positive real
interest rate especially in light of the expected tightening in the US.
Source: Bloomberg, United Capital Research
Portfolio reversals from emerging
markets pressured the Rand
significantly in 2015
We see more pressure on the
Rand in 2015 largely due to
expected tightening in the US
If Oil prices continue to decline
for a large part of 2015, the SARB
may delay tightening as inflation
pressure may be somewhat
muted.
Fig. 9

South Africa
23
3
4
5
6
7
Feb-11 Jun-11 Oct-11 Feb-12 Jun-12 Oct-12 Feb-13 Jun-13 Oct-13 Feb-14 Jun-14 Oct-14
I Inflation remains untamed despite successive rate hikes
S.A Inflation Rates Vs. Policy Rate (%)
Inflation Rate Policy Rate
5
7
9
11
13
15
17
19
21
Mar-12 Jul-12 Nov-12 Mar-13 Jul-13 Nov-13 Mar-14 Jul-14 Nov-14
Widening Valuation Gaps Relative to Emerging Market Peers
JSE Valuations Vs EMs (P/E(x))
JSE P/E
MSCI P/E
Equities Market: Stretched valuation cum macro headwinds
SA equities closed the year positive with a y/y appreciation of 7.6% in the
benchmark JSE All Share Index. Consumer goods stocks, especially food retailers
were the main outperformers while resource stocks closed the year in the
negative. Industrial and Basic materials sectors declined by 17.8% and 16.1%
respectively while financials, Consumer Services and Consumer goods sectors
returned 22.0%, 27.8% and 11.6% respectively.
The bullish run of the JSE in 2014 contrasted sharply with the backdrop of weak
macroeconomic fundamentals. Valuations now look stretched as the JSE
attained record highs especially in Q1 and Q2’14, necessitating a significant sell-
off especially in Q3-Q4 ‘14. Historically, the SA equity market has benefited from
healthy liquidity levels relative to other African bourses. We expect some more
correction in the market going into 2015, particularly if underlying macro
fundamentals do not improve significantly.
Source: SARB, Bloomberg, United Capital Research
Research
Source: Bloomberg, United Capital Research
We expect further correction is
SA equities in 2015 particularly if
the underlying macroeconomic
fundamentals do not improve
Declining EM funds flows and
attendant currency pressure
were key themes that
dominated the SA fixed income
space in 2014
Fig. 10
Fig. 11

South Africa
24
7.2
7.6
8.0
8.4
8.8
9.2
Nov-13 Jan-14 Mar-14 May-14 Jul-14 Sep-14 Nov-14
Yields tapered considerably after the bearish run early in the year
SA 10yr bond yields (%)
Fixed Income: Fairly priced, Waiting on Funds Flow
Declining EM fund flows and attendant currency pressures were key factors that
shaped the SA fixed income market in 2014. Early in the year, expectations of
increasing Rand weaknesses led foreign investors to sell off on local currency
debt resulting in negative returns in the SA bond market. However, the
corporate bond segment remained quite strong given lower liquidity feeds. For
the most part of 2014, the market traded mostly sideways in spite of S&P‘s
downgrade of SA’s foreign credit rating to BBB- (one notch above sub-
investment grade). South Africa issued 3 bonds in 2014 raising a total of
US$2.2bn.
Looking ahead, we think progress on fiscal consolidation will bear on SA‘s credit
rating in the foreseeable future. With already huge current account deficit, a
further deterioration in fiscal health could feed through bond yields in 2015.
With an already huge current
account deficit, a further
deterioration in fiscal health
could feed through bond
yields in 2015
Source: Bloomberg, United Capital Research
Fig. 12

Ghana
25
11.2%
19.1%
14.1%
15.9%
9.4% 9.9%
6.7%
9.5% 9.0%
10.8%
4.4%
6.4% 6.5% 5.3% 5.1% 5.5% 5.1%
0%
5%
10%
15%
20%
25% 2
01
1 Q
1
201
1 Q
2
201
1 Q
3
201
1 Q
4
201
2 Q
1
201
2 Q
2
201
2 Q
3
201
2 Q
4
201
3 Q
1
201
3 Q
2
201
3 Q
3
201
3 Q
4
201
4 Q
1
201
4 Q
2
201
4 Q
3
2014
Q4
e
2015e
Macro Headwinds Threaten GDP Outlook
Ghana y/y Real GDP Growth
Fig. 13
Ghana: Growing but groaning
The slowdown in Ghana’s economic growth, which commenced in Q3 2013,
persisted in 2014. GDP growth in Q3’14 came in at 5.1% (vs. 5.3% in Q2’14, 4.4%
in Q3’ 13 and 10.8% in Q2’13). Macroeconomic instability continues to weigh on
the real economy. The sluggish growth in GDP had earlier led to an official
revision in the country’s growth expectation to 6.9% for 2014 (Vs. 7.3% in 2013).
The country’s significant current account deficit (13.2% of GDP), driven by a
wide trade deficit of US$2.2bn and high government spending continue
portend downside risks to economic growth. However, we expect the current
account deficit to ease to 9.0% in 2015 (BoG target is 8.8%) Q4’ 14 data suggests
trade deficit have narrowed to US$495mn.
In terms of managing the level of fiscal deficits, our expectations remain slightly
bleak in the medium to long term, for 2 major reasons: 1) fiscal revenues appear
to be inert on the back of weak economic growth as well as the constraints
limiting oil production, 2) Large capital outlays needed to propel the oil and gas
sector will continue to put pressure on the current account. In 2015, we expect
growth to be anchored by agriculture largely due to higher price for cocoa, the
rehabilitation farms over the last few years, as well the distribution of fertilizers
and pesticides.
Having ramped up oil production capacity modestly, Ghana is expected to
produce around 120,000 b/d in 2015 but a significant growth in output is not
expected until 2017 when the Jubilee field, expected to double output, begins
operation. However, modest oil revenue despite falling prices is expected to
reduce fiscal deficits appreciably in 2015, giving further support to growth. Most
importantly, striking a sustainable deal with IMF will be critical to Ghana’s
macroeconomic progress and restoration of investor confidence in 2015.
Source: BOG, United Capital Research
We expect the current
account deficit to ease to
9.0% in 2015 (BoG’s target is
8.8%) as recent data suggests
trade deficit have narrowed to
US$495mn
Striking a sustainable deal with
IMF is key to Ghana’s progress
and restoration of investor
confidence in 2015.

Ghana
26
0.0
0.5
1.0
1.5
2.0
2.5
3.0
3.5
4.0
4.5
Dec-13 Feb-14 Apr-14 Jun-14 Aug-14 Oct-14 Dec-14
Currency remains under pressure
USD/Ghana Cedi
Exchange Rate: Dollar Inflows should cushion pressure on the Cedi
Developments in the Ghanaian foreign exchange markets indicate a generally
weaker domestic currency in 2014 relative to 2013. For the first ten months of the
year, the cedi cumulatively depreciated by 31.2% against the USD in the
interbank market, compared to 7.4% in the corresponding period of previous
year. However, the currency appreciated sharply against the USD in Q3,
moderating the significant losses recorded earlier in the year. November 2014
MPC meeting showed that the country’s gross foreign reserve rose to US$6.6bn,
implying barely 3 months of import cover.
The successful issuance of a US$ 1bn Eurobond and the signing of a US$ 1.7bn
cocoa finance facility supported the Cedi during the year. We expect the
currency to depreciate further in 2015 driven by domestic macro-economic
concerns which will lead to portfolio reversals, though we see some support
from policy measures by the BoG. Also, the news flow on a potential deal with
the IMF that may be finalized in 2015 should further support the Cedi.
Fixed Income: Yields likely to remain high, reflecting domestic macro-
economic and global concerns
The country’s fixed income market is concentrated at the short end of the yield
curve and limited in terms of depth and volume when compared to Nigeria and
other frontier markets. Although the introduction of foreign participation in less
than 3-year maturities boosted foreign transactions in the market, yields remain
higher than most frontier markets in 2014.
Source: Bloomberg, United Capital Research
Developments in the
Ghanaian Foreign Exchange
market in 2014 indicate a
weaker domestic currency
relative to 2013
We expect some pressure
on the currency in 2015
driven by domestic macro-
economic concerns which
will lead to substantial
portfolio reversals
The Cedi is expected to
depreciate in 2015, and FX
shortages will complicate a
market exit in the
foreseeable future
Fig. 14
Ghana
27
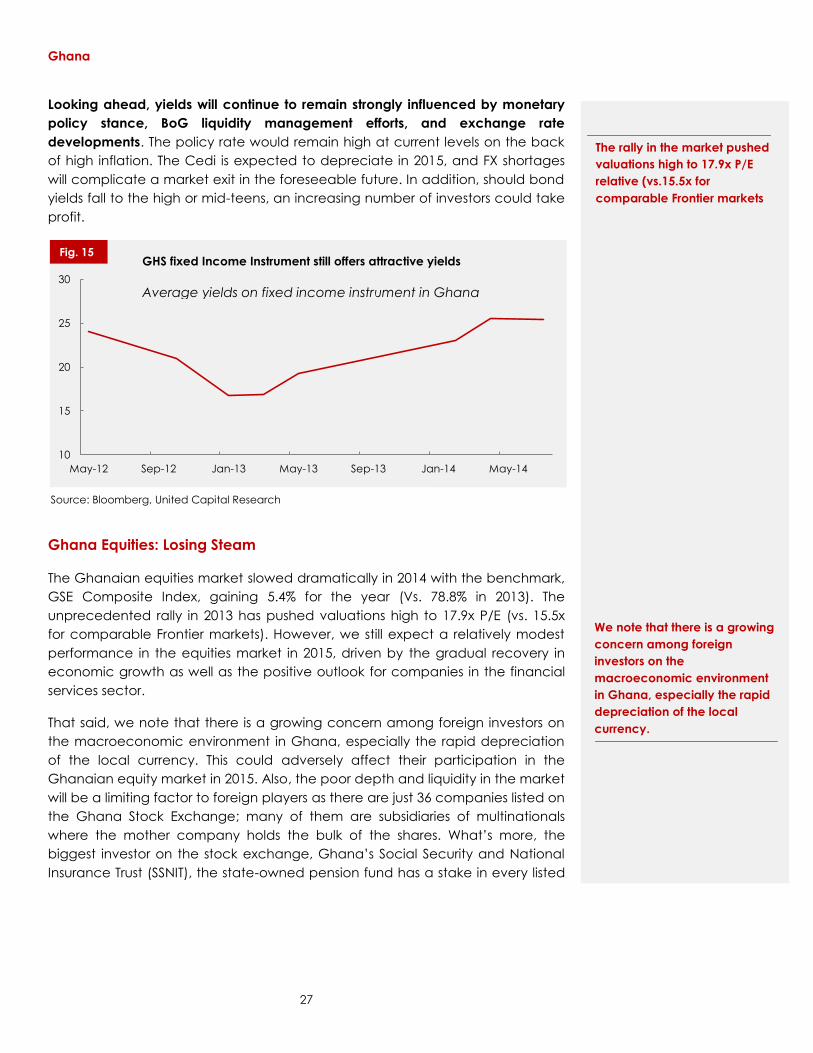
Looking ahead, yields will continue to remain strongly influenced by monetary
policy stance, BoG liquidity management efforts, and exchange rate
developments. The policy rate would remain high at current levels on the back
of high inflation. The Cedi is expected to depreciate in 2015, and FX shortages
will complicate a market exit in the foreseeable future. In addition, should bond
yields fall to the high or mid-teens, an increasing number of investors could take
profit.
Ghana Equities: Losing Steam
The Ghanaian equities market slowed dramatically in 2014 with the benchmark,
GSE Composite Index, gaining 5.4% for the year (Vs. 78.8% in 2013). The
unprecedented rally in 2013 has pushed valuations high to 17.9x P/E (vs. 15.5x
for comparable Frontier markets). However, we still expect a relatively modest
performance in the equities market in 2015, driven by the gradual recovery in
economic growth as well as the positive outlook for companies in the financial
services sector.
That said, we note that there is a growing concern among foreign investors on
the macroeconomic environment in Ghana, especially the rapid depreciation
of the local currency. This could adversely affect their participation in the
Ghanaian equity market in 2015. Also, the poor depth and liquidity in the market
will be a limiting factor to foreign players as there are just 36 companies listed on
the Ghana Stock Exchange; many of them are subsidiaries of multinationals
where the mother company holds the bulk of the shares. What’s more, the
biggest investor on the stock exchange, Ghana’s Social Security and National
Insurance Trust (SSNIT), the state-owned pension fund has a stake in every listed
10
15
20
25
30
May-12 Sep-12 Jan-13 May-13 Sep-13 Jan-14 May-14
Fig. 15 GHS fixed Income Instrument still offers attractive yields
Average yields on fixed income instrument in Ghana
Ex
Public Debt as a % of GDP
Source: Bloomberg, United Capital Research
The rally in the market pushed
valuations high to 17.9x P/E
relative (vs.15.5x for
comparable Frontier markets
We note that there is a growing
concern among foreign
investors on the
macroeconomic environment
in Ghana, especially the rapid
depreciation of the local
currency.

Ghana
28
0
500
1,000
1,500
2,000
2,500
3,000
Jan-11 Jul-11 Jan-12 Jul-12 Jan-13 Jul-13 Jan-14 Jul-14
Ghana Composite Stock Market Index
company and is inactive. The market may ride on this relative illiquidity to deliver
modest returns in 2015.
Kenya: Brighter medium term prospects
Kenya towed the line of Nigeria, rebasing its GDP in September 2014 by
changing its base calculation year to 2009 from 2001. This sent the East African
nation into the continent’s top 10 economies, becoming the fourth largest
economy in Sub-Saharan Africa after Nigeria, South Africa and Angola. Its GDP
post-rebasing increased to US$55.2bn in 2013 from US$44.1bn – a 25.3% jump
surpassing the government’s prediction of 20.6%; GDP per capita now stands at
US$1,245 from US$999. Agriculture, Manufacturing and the real estate sector
accounted for most of the change in the level of GDP, contributing 19.9%, 11.4%
and 5.9% respectively. The new GDP showed a growth rate of 5.7% in 2013
versus a flat growth of 4.7% under the old series.
We expect annual growth in 2014 to be tepid following the poor raining season
in H1 (GDP expanded by 5.8% in H1’14 GDP Vs. 7.1% in H1’2013). In the medium
term, the rebasing exercise is expected to provide the much needed boost to
the Kenyan economy even as the government attempts to spur economic
growth in light of the challenges facing the tourism industry. Manufacturing,
construction and services will continue to be the main drivers of growth.
Agriculture, which remains the backbone of the economy and the main
employer, is growing at a steadier pace of around 4.1%. We expect increased
Post-rebasing, Kenya’s fiscal
ratio looks better as deficit as
a % of GDP now stands at
6.0% (Vs 7.4% before
rebasing).
Kenyan Bureau of Statistics, United Capital Research
Fig. 16

Kenya
29
6.5 7.5 8.0
11.8
8.0
6.7 5.7
4.1 4.6 3.7 4.0
4.8 6.0 6.2
5.6
3.4 4.4
5.8 5.7 6.0 6.6
0
2
4
6
8
10
12
14
201
0 Q
1
201
0 Q
2
201
0 Q
3
201
0 Q
4
201
1 Q
1
201
1 Q
2
201
1 Q
3
201
1 Q
4
201
2 Q
1
201
2 Q
2
201
2 Q
3
201
2 Q
4
201
3 Q
1
201
3 Q
2
201
3 Q
3
201
3 Q
4
201
4 Q
1
201
4 Q
2
201
4 Q
3e
201
4 Q
4e
2015F
Growth path signals modest recovery
Kenya Real GDP growth ( y/y, %)
Q4'13 Q1'14 Q2'14 Q3'14
Agric. 3.2 5.7 4.5 6.2
Mining (15.8) 4.1 6.9 2.8
Manufacturing 1.3 7.9 8.4 4.5
Construction (2.8) 9.0 18.8 11.0
Services 2.1 2.3 1.8 1.7
pace of growth from the Services sector on the back of modest recovery in
tourism as well as technological-based financial inclusion.
Looking ahead, one of the biggest challenges for the Kenyan economy will be
its large fiscal deficit. Post-rebasing however, Kenya’s fiscal ratio looks better as
its deficit as a % of GDP now stands at 6.0% (Vs 7.4% before rebasing). We
expect the fiscal deficit to narrow to 5.0% levels in 2015, as recent measures
introduced by the government to reduce wage burden begin to gain traction.
However, capital spending still falls below target which might hamper growth,
as capacity constraints and corruption will continue to be major hindrances to
public investment.
Exchange Rate: KES weakens though performs better than peers
Kenyan’s shilling has been less vulnerable to external shocks compared to its
peers; KES dipped by 4.7% in 2014 to KES90.6/US$– a modest performance when
compared with the Naira, Cedi and Rand. Corporate demand has been the
major driver on the exchange rate pressure driven by growth momentum and
improved economic activity, as credit to private sector grew at an annualized
rate of 26.7% as of October 2014. Although we expect the KES to weaken in
2015, we do not see a significant decline and expect the local currency to
hover around KES 90-93 levels.
Furthermore, the country’s reserve recorded considerable accretion reaching a
record high of US$7.3 in September, 2014 representing c.4.7 months of import
cover, driven by Eurobond issuance proceeds. In spite of expected portfolio
reversal in 2015, we think the KES will hold steady relative to peer currencies, as
Kenyan Bureau of Statistics, United Capital Research
Sectoral Growth in Real GDP for Kenya
(%)
Although we expect the KES
to weaken in 2015, we do not
see a significant decline and
expect the local currency to
hover around KES 90-93
levels.
Kenyan Bureau of Statistics, United Capital Research Kenyan Bureau of Statistics, United Capital Research
Fig. 17

Kenya
30
84
85
86
87
88
89
90
Sept'13 Nov'13 Jan'14 Mar'14 May'14 Jul'14 Sept'14
The Kenyan Shilling was pressured in 2014 as increased importation
fuelled significant dollar demand
0
5
10
15
20
Jan
-12
Feb
-12
Ma
r-12
Ap
r-12
Ma
y-1
2
Jun
-12
Jul-12
Au
g-1
2
Se
p-1
2
Oc
t-12
No
v-1
2
De
c-1
2
Jan
-13
Feb
-13
Ma
r-13
Ap
r-13
Ma
y-1
3
Jun
-13
Jul-13
Au
g-1
3
Se
p-1
3
Oc
t-13
Inflation has been well tamed amidst broadly accommodative Policy
Rates
MPR and Headline Inflation in Kenya (y/y, %)
Inflation Policy Rate
foreign participation in Kenya’s domestic fixed income market stands at just
7.0%.
Inflation: Still in check with a benign outlook.
Inflation rate in Kenya stood within the central bank’s target corridor of 5.0% ±
250bps for most part of 2014. After temporarily breaching the upper limit of the
band in July and August, y/y CPI growth fell to 6.43% in the month of October
2014 from 6.6% in September largely due to VAT base effects and lower
electricity and fuel price pressures (in the middle of September 2014, the Energy
Regulatory Commission (ERC) announced a drop in the price of Super Petrol,
kerosene and diesel). We think the central bank will be lose on monetary policy
in H1’15 with inflation in single digits though underlying fundamentals of a huge
current account deficit will spur some weakness in KES, putting mild pressure on
inflation. Core inflation should however remain within the 5%-6% range.
In spite of expected portfolio
reversal in 2015, we think the
KES will hold steady relative to
peer currencies, as foreign
participation in Kenya’s
domestic fixed income
market stands at just 7.0%.
Inflation rate in Kenya stood
within the central bank’s
target corridor of 5.0% ±
250bps for most part of 2014.
The government has indicated
that it would seek to reduce
domestic borrowing in 2015 to
around KES101.7bn from
KES190.0bn; focusing more on
external borrowing following its
successful Eurobond issuance
Kenyan Bureau of Statistics, United Capital Research
Fig. 18
Fig. 19
Kenyan Bureau of Statistics, United Capital Research

Kenya
31
4
6
8
10
12
14
3M 6M 1YR 2YR 5YR 10YR
A combination of lower expected domestic borrowing and benign
inflation expectations should keep yields lower in 2015
Kenya Sovereign Yield Curve (%)
Fixed Income market: Yields likely to sit lower in 2015
In terms of outstanding issuance, Kenya is the fifth-largest bond market in Africa
with a total size of US$10.3bn as at October 2014. Banks held 52.5% of the total
debt holdings, followed by institutional investors (25.7%) and insurance
companies (10.2%). It has been widely speculated that Kenyan bonds may be
included in the GBI-EM index, given the foreign interest they have generated
and their critical size. We think the inclusion will eventually happen at some
point, but not in the foreseeable future. The liquidity of KES bonds is still too low
at this stage and even the outstanding size would need to increase. Kenya
raised US$2bn Eurobond in 2014, the largest African Eurobond debut so far. The
government has indicated that it would seek to reduce domestic borrowing in
2015 to around KES101.7bn from KES190.0bn; focusing more on external
borrowing following its successful Eurobond issuance. This is likely to expose
Kenya more to foreign exchange risk given the sensitivity of the KES. Overall, we
think the yield environment will be somewhat lower in 2015 as positive
inflationary expectations would necessitate sustained accommodative policy
stance.
Equities: On a bullish run
The Kenyan equities market maintained a bullish run in 2014. The market
returned 4.5%, 5.3%, 8.7% and -0.34% in Q1, Q2, Q3, and Q4 respectively,
culminating in a y/y return of 19.20%. Share price rallies in heavily weighted
stocks such as Safaricom, Kenya Commercial Bank (KCB) and Equity Bank
pushed the benchmark index north. The market also experienced increased
trading activity as investors remained bullish. The strong trading activity was
underscored by a stable currency, a generally stable macro-economic
environment and positive H1 and Q3’14 results released by listed companies.
The government has indicated
that it would seek to reduce
domestic borrowing in 2015 to
around KES101.7bn from
KES190.0bn; focusing more on
external borrowing following its
successful Eurobond issuance
Kenyan Bureau of Statistics, United Capital Research The strong trading activity was
underscored by a stable
currency, a generally stable
macro-economic environment
and positive H1 and Q3’14
results released by listed
companies
Fig. 20

Kenya
32
Given the relatively higher level of domestic participation (60% of transaction
volumes), we expect headwinds from the global financial space to have a
limited effect on the Kenyan equities market in 2015. We are positive on the
outlook of the market in 2015 expected to be buoyed by strong earnings
performance. We expect the revolution in the country’s mobile payments
industry to bode well for the banks who should continue to drive the market.
The Nairobi Stock Exchange Limited after a successful IPO (which was
oversubscribed in excess of 600%) launched a new bond trading system. The
new system will enable online trading of treasury and corporate bonds, foreign
currency bonds and improve the speed of settlement. We expect this to further
deepen the market and boost the NSE’s revenue in 2015.
80
100
120
140
160
180
Jan-13 Apr-13 Jul-13 Oct-13 Jan-14 Apr-14 Jul-14 Oct-14
Source: Bloomberg, United Capital Research
Nairobi Stock Exchange on a steady bullish ride since 2013
Movement in NSE All Share Index
Given the relatively higher
level of domestic participation
(60% of transaction volumes),
we expect headwinds from the
global financial space to have
a limited effect on the Kenyan
equities market in 2015.
Fig. 21

33
6
8
10
12
14
16
Jul-13 Sep-13 Nov-13 Jan-14 Mar-14 May-14 Jul-14 Sep-14 Nov-14
SA Kenya Ghana Nigeria
Fig. 26
0.5
1.0
1.5
2.0
2.5
Jan-13 Apr-13 Jul-13 Oct-13 Jan-14 Apr-14 Jul-14 Oct-14
Kenya Ghana SA Nigeria
-24.1%
-0.1%
-25.3%
-2.7%
-5.4%
-5.2%
-34.6%
-12.1%
-40% -30% -20% -10% 0%
RAND
KES
CEDI
NAIRA
2014 2013
0
4
8
12
16
20
Jan-13 Apr-13 Jul-13 Oct-13 Jan-14 Apr-14 Jul-14 Oct-14
Kenya Ghana SA Nigeria
Fig. 23
21.0%
13.0%
5.8%
8.5%
0%
5%
10%
15%
20%
25%
GHANA NIGERIA SOUTH AFRICA KENYA
Fig. 25
8.6%
6.9%
5.6%
1.9%
0%
2%
4%
6%
8%
10%
KENYA GHANA NIGERIA SOUTH AFRICA
10 –Year Bond Yields Equity Market Indices (Rebased to 100)
Local Currency Returns: 2013, 2014 Inflation Rates: 2013-2014
Monetary Policy Rates 5-year Average Real GDP Growth
Fig. 22
Fig. 24
Fig. 27
Source: Bloomberg, United Capital Research
Key Macro Variables for Select African Markets
34
Section 3
Oil Price Dynamics and Nigeria 2015 Outlook

Oil Price Dynamics and Nigeria 2015 Outlook
35
80
82
84
86
88
90
92
94
2010
Q1
2010
Q3
2011
Q1
2011
Q3
2012
Q1
2012
Q3
2013
Q1
2013
Q3
2014
Q1
2014
Q3
Quarterly Trends in Global Oil Demand and Supply
Demand Supply
95
100
105
110
2010
Q1
2010
Q3
2011
Q1
2011
Q3
2012
Q1
2012
Q3
2013
Q1
2013
Q3
2014
Q1
2014
Q3
Non OPEC output has outpaced OPEC
production since 2013
OPEC and Non-OPEC share of oil production ( rebased
to 2010)
OPEC NON OPEC
Fig. 29
The Tragedy of Oil Price Slump
Tumbling oil prices was the dominant theme across the globe in the second half
of 2014. Stemming from huge supply-demand disequilibrium, Brent crude
tanked 54.2% in 2014 after reaching a year peak of $113.41d/p in June on the
heels of ISIS offensive in Iraq. Broadly, the imbalances in global oil demand and
supply in the year could be attributed to two factors: 1) the energy sufficiency
strides of the US demonstrated in the significant ramp-up of capacity in shale oil
production 2) the stickiness of Saudi Arabia’s crude oil supply in the face of
sizeable excess capacity. Perhaps, it could be argued that the moderating
force of shale oil production in a year that saw little progress in the crisis within
the oil rich Middle East, political upheavals and production stoppages in Iran
and Libya, was necessary to fill an important gap in a market with very strong
attributes of an oligopoly.
Supply glut aside, demand moderated considerably in 2014
According to the IEA, global oil demand has weakened since mid-2014. This
compounded the impact of a much stronger dollar compared to the trends
seen in 2013, as well as unconventional supply especially from the US. Beside the
usual seasonal factors behind demand patterns, the sluggish growth of the
global economy in 2014 also led to a slowdown in energy demand. While
demand appeared to have bottomed out during the year, having touched a 5-
year annual low, the slower-than expected recovery in Europe did little to push
deliveries especially in H2’ 2014. We posit that a mild recovery in global
economic growth in 2015 should give comfort to oil demand especially from the
OECD though the seemingly weakening of the non-OECD demand led by
marked declines in gasoline and diesel demand in both China and India is
expected to trim global oil demand. Looking farther ahead however, we think
oil demand is gradually approaching a plateau and could well be seen as a
major pressure source for hydrocarbon prices in the next decade.
Stemming from significant
supply-demand disequilibrium,
Brent crude tanked 48.3% in
2014
We posit that a mild recovery
in global economic growth in
2015 should give comfort to oil
demand especially from the
OECD
Source: EIA, United Capital Research Source: OPEC, United Capital Research
Fig. 28

Oil Price Dynamics and Nigeria 2015 Outlook
36
Oil Supply War: US Vs Saudi Arabia; and the winner is...
Conspiracy theories and the quest to hold firmly to market share were at the
heart of postulations around the downward trajectory of oil prices in 2014. Saudi
Arabia, the biggest producer in OPEC, with 32.0% and c.90.1% of the Cartel’s
production volumes and excess capacity respectively, held firmly to its volumes
despite pressure from other members to cut output in order to support price.
Saudi’s motivation to defend market share in the face of declining prices did
not come as a surprise given the country’s relatively strong fiscal position as well
as its disproportionate market share in OPEC. With c. $740.4bn in excess reserves,
we estimate that Saudi still has significant cushion to accommodate oil prices as
low as $30p/b.
In its last meeting in 2014, OPEC chose to stay action as members looked to
Saudi to cut output with Gulf members having reached a consensus prior to the
meeting. The Cartel’s second option which was to convince members to stick to
production quota was also not pushed through. We note that OPEC members
have historically overshot their quota largely due to fiscal pressures arising from
deficit budgets, slow growth and high cost of alternative energy sources as well
as the need to defend fragile market shares. We think it will be more
challenging for OPEC to rein in excess production from members in 2015, as a
handful of fringe producers with huge dependence on oil had already
experienced currency devaluation, placing further pressure on their fiscal
buffers. What’s more, Saudi’s quest to hold on to market share is seen as both
politically and economically motivated, with an overweight on the former. This
could well be sustained as long as crisis in the Middle East, and Russia cum Iran
tensions persist.
Complicating the supply side dynamics was the remarkable growth witnessed in
US Shale oil production. Having increased output volumes by 1 million barrels in
2014, the US now holds largest share of global crude oil production. In fact,
“tight” oil production from shale has grown 6-fold in 5 years. The Fed has made
note of the fact that drilling activity in Shale production districts is expected to
increase steadily for the next two years, even with much lower oil prices. We
believe that the rapid growth of shale production will continue to create excess
oil. Imports from West Africa have already been edged out and we expect
further reduction from other markets in 2015.
From the foregoing, we are inclined to think that the market will have to
patiently wait for the convergence of oil prices with the production cost of most
of US shale wells. In our view, this is the only point at which oil prices can find a
support in 2015.
With c. $740.4bn in excess
reserves, we estimate that
Saudi still has significant
cushion to accommodate oil
prices as low as $30p/b.
We think it will be more
challenging for OPEC to rein in
excess production from
members in 2015.
Saudi’s quest to hold on to
market share is seen to be
both politically and
economically motivated, with
an overweight on the former

Oil Price Dynamics and Nigeria 2015 Outlook
37
0
2
4
6
8
10
2000 2002 2004 2006 2008 2010 2012 2014 2016
US non-conventional oil production has increased
5-folds in the last 6 years and could yield the same
volume as crude oil as early as 2017
US Oil Production Volumes (mn b/pd)
Total Oil Production Tight Oil Crude Oil
Fig. 30
-1.5
-1.0
-0.5
0.0
0.5
1.0
1.5
2.0
-100
-50
0
50
100
1Q
2001
2Q
2002
3Q
2003
4Q
2004
1Q
2006
2Q
2007
3Q
2008
4Q
2009
1Q
2011
2Q
2012
3Q
2013
Saudi's output variations account for 37% of the
changes in crude oil prices
WTI and Saudi's production
Saudi Production Change WTI Price Change
Fig. 31
Are oil prices assuming a new normal?
Given the long backwardation history of oil price trading dynamics as well as
current market trends, there is no reason to expect oil prices to gain some
respite in the short to medium term. We see oil prices remaining volatile
especially in the first half of 2015 as market digests the actions and inactions of
oil producers. Our bull case scenario would be a $35-$40p/b in H1 and an
average of $55-$60p/b for 2015.
Notably, the outlook for oil prices in the medium to long term remains bleak
against the background of the significant traction that alternative energy
sources as well unconventional oil production has gained in the last decade.
Beside the US, several other countries, notably Canada, Argentina Australia e.t.c
are also on the path of shifting reliance to shale and other unconventional
resources for the majority of their oil and gas production. Argentina, with
declining production from conventional gas fields, is investing heavily in its tight
and shale gas resources; Australia with large shale gas and methane resources
looks to steadily transit away from gas production even as significant leasing
and exploration for shale gas and oil are underway in Algeria, China, Poland,
Columbia and Mexico.
Although the economic viability of producing these shale gas and shale oil rests
significantly on favourable oil prices, we think scale advantages of rapid
production build-up will improve cost effectiveness, combining with the
efficiency of the extraction of technology to render demand fairly inelastic. The
possibility that we could see some fiscal interventions in the form of price
subsidies by the US, the largest producers of shale is also a huge concern. On
Source: EIA, United Capital Research Source: EIA, United Capital Research
We see oil prices remaining
volatile especially in the first
half of 2015 as market digests
the actions and inactions of oil
producers
Oil Price Dynamics and Nigeria 2015 Outlook
38
the geo-political scene however, no respite is in site as far as conflicts in the oil
producing region is concerned, with 2015 looking even more likely to be as
volatile as 2014 given recent development in the region. That said, the risk of
oversupply looks more likely to outweigh the downsides from geopolitical
tensions, in our view.
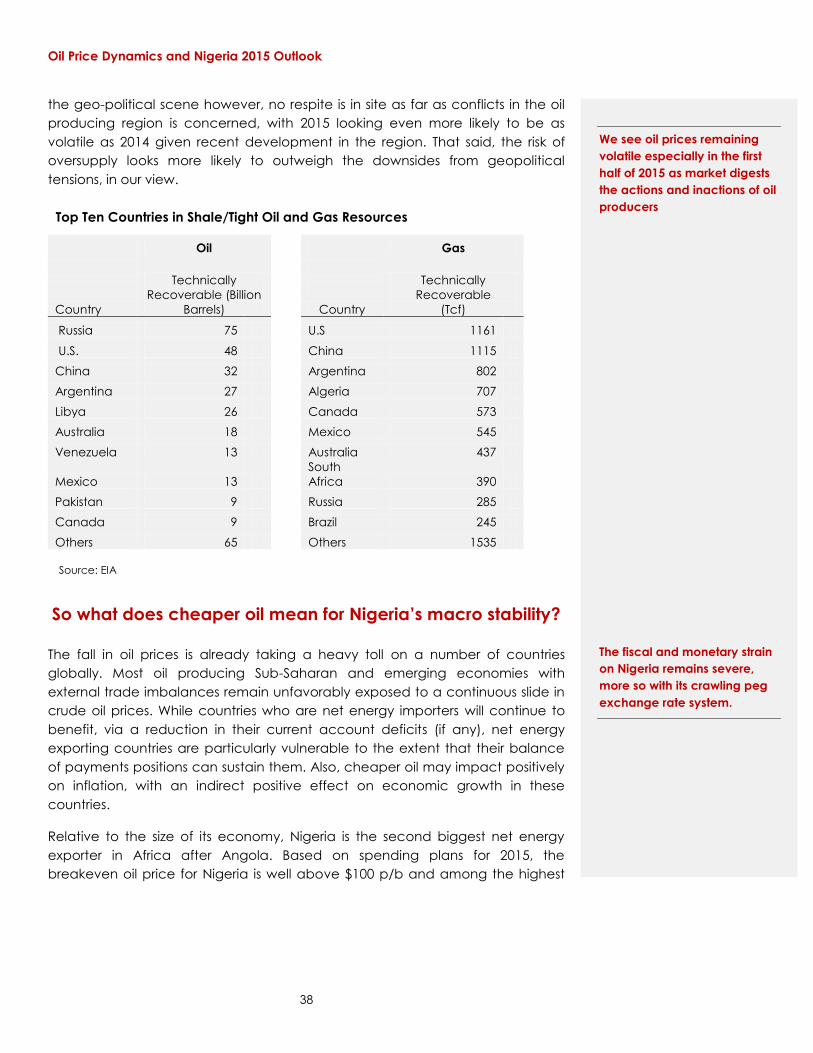
Oil
Gas
Technically
Recoverable (Billion
Barrels)
Technically
Recoverable
(Tcf)
Country
Country
Russia 75
U.S 1161
U.S. 48
China 1115
China 32
Argentina 802
Argentina 27
Algeria 707
Libya 26
Canada 573
Australia 18
Mexico 545
Venezuela 13
Australia 437
Mexico 13
South
Africa 390
Pakistan 9
Russia 285
Canada 9
Brazil 245
Others 65
Others 1535
The fall in oil prices is already taking a heavy toll on a number of countries
globally. Most oil producing Sub-Saharan and emerging economies with
external trade imbalances remain unfavorably exposed to a continuous slide in
crude oil prices. While countries who are net energy importers will continue to
benefit, via a reduction in their current account deficits (if any), net energy
exporting countries are particularly vulnerable to the extent that their balance
of payments positions can sustain them. Also, cheaper oil may impact positively
on inflation, with an indirect positive effect on economic growth in these
countries.
Relative to the size of its economy, Nigeria is the second biggest net energy
exporter in Africa after Angola. Based on spending plans for 2015, the
breakeven oil price for Nigeria is well above $100 p/b and among the highest
Top Ten Countries in Shale/Tight Oil and Gas Resources
Source: EIA
So what does cheaper oil mean for Nigeria’s macro stability?
We see oil prices remaining
volatile especially in the first
half of 2015 as market digests
the actions and inactions of oil
producers
The fiscal and monetary strain
on Nigeria remains severe,
more so with its crawling peg
exchange rate system.

Oil Price Dynamics and Nigeria 2015 Outlook
39
184.0
130.7 130.5 122.7 117.5
106.0 100.6 98.0
79.7 77.3
60.0 54.0
0
20
40
60
80
100
120
140
160
180
200
Lib
ya
Ira
n
Alg
eria
Nig
eria
Ve
ne
zue
la
Sa
ud
i
Ira
q
An
go
la
Ec
ua
do
r
UA
E
Qa
tar
Ku
wa
it
OPEC Countries still require oil prices in excess of $100p/b to balance
their budgets
Break even Oil Prices Average
within the OPEC, after Algeria and Iran. This implies that the fiscal strain on
Nigeria remains severe, more so with its crawling peg exchange rate system.
As shown in figure 33 below, Nigeria falls within the quadrant of vulnerable
countries that could be severely impacted by a continuous decline in oil prices.
In fact, the country’s current account surplus, estimated at 4% of GDP could be
completely wiped out if oil prices continue to fall.
In order to correctly gauge the vulnerabilities of different countries to current oil
price shocks, we have separated the “winners” (net oil importers) from the
“losers” (net oil exporters). Oil importers are expected to save on their energy
costs while oil exporters will lose revenue. However, the final impact will depend
on the relative sizes of their economies (measured by GDP) as well as the share
of export receipts in the general government revenues of these countries. We
have assumed that fiscal buffers (i.e. external reserves) would be held constant
as most countries would lean towards a more flexible exchange rate regime in
view of current market dynamics.
We found that relative to other OPEC countries (all of whom are net exporters),
Nigeria’s vulnerability is quite low when the size of its GDP is considered. We
attribute this to the relatively strong growth in non-oil GDP witnessed over the
last decade especially the growing contribution of the services sector. However,
when placed against the backdrop of total government revenue, Nigeria’s
vulnerability rises significantly. This didn’t come as a surprise to us given the
Source: IMF, National Finance Ministries
Relative to other OPEC
countries (all of whom are net
exporters), Nigeria’s
vulnerability is quite low when
the size of its GDP is
considered
When placed against the
backdrop of total government
revenue, Nigeria’s vulnerability
rises significantly
Fig. 32

Oil Price Dynamics and Nigeria 2015 Outlook
40
-50%
-40%
-30%
-20%
-10%
0%
10%
20%
30%
40%
50%
-60% -40% -20% 0% 20% 40% 60%
Net Energy Exports/GDP
Highly Vulnerable
Net Energy Exports/GDP
Highly Vulnerable
skeweness of government revenue to oil receipts. Perhaps, what is more
instructive to note is that among the Non-OPEC members, US remains one of the
least exposed largely due to the strengths and diversities of her economy, while
Saudi Arabia is modestly vulnerable, a development we can link to the recent
pressure on its fiscal expenditure. Russia on the order hand could leverage on its
massive external reserves position despite its low current account surplus (2013
est. 1.6% of GDP). The import of all these is that US and Russia are less likely to
succumb to pressure to support prices in 2015 while we might see some “ground
shifting” from Saudi Arabia when the going gets tougher sometime in the
second half of 2015, by our estimate.
Neutral
Not Vulnerable Nigeria
OPEC Members
Neutral
Vulnerable
From a balance of payments perspective, most OPEC members, including Saudi Arabia are
vulnerable to continuous declines in oil prices
Cu
rren
t Ac
co
un
t/GD
P
Source: WTO, IMF, United Capital Research
Kuwait
Saudi
Fig. 33

Oil Price Dynamics and Nigeria 2015 Outlook
41
Austerity Measures: How far can they go?
In 2014, the Nigerian government introduced some austerity measures to
cushion the effect of declining oil prices on the economy. These include cut in
subsidy provisions for petrol and kerosene from N971.1bn and N250.0bn to
N458.6bn and N156.0bn respectively, introduction of surcharges on luxury goods
and a freeze on foreign travel by civil servants and government officials. We
think these measures are insufficient in light of the expected fiscal strain that a
persistent decline in oil prices portend for the Nigerian economy. We expect the
Naira to continue to be under pressure. This suggests that monetary policy
would be tighter than ever in 2015.

Domestic Macro Trends and Outlook for 2015
42
Section 4
Domestic Macro Trends and Outlook for 2015

Domestic Macro Trends and Outlook for 2015
43
0
5
10
15
20
25
2005 2006 2007 2008 2009 2010 2011 2012 2013
Monetary Policy Rates Broadly Accommodative
Select Policy Rates : Annual Averages, %
FED
ECB
Canada
SA
Brazil
India
Monetary Policy
Across the globe, central banks’ monetary policies were broadly and overly
aggressive in 2014. In a debt-ridden post crisis world, central banks continued to
expand the size of their balance sheets while adjusting short term interest rates
to zero or near zero in some cases. The multi-step unwinding of the US monetary
policy was effectively concluded with interest rates closing at zero levels at the
end of the year. As we stated earlier, the divergence in monetary policies
between the ECB and the Fed engendered a significant bout of volatility of in
asset prices and yields especially in the advanced economies with spillovers to
most emerging markets.
Nigeria: Caught in the web of emerging market portfolio reversals
In the past year, the Nigerian financial markets saw fair share of portfolio
reversals largely due to moderating impact of funds flow to emerging markets.
The US tapering of quantitative easing that effectively began in Q1, 2014
impacted liquidity in the Nigerian fixed income space, distorting valuations
across naira denominated assets. While we note that the expansionary policy
stance of the Euro-Area somewhat moderated the negative impact of these
tapering, we believe Nigeria’s ability to maintain a positive real rate
environment in 2014 remained key to retaining a healthy dose of FPIs in the
economy. Also, we think the clarity of timing and length of these monetary
adjustments especially from the Fed was critical to ensuring that market
expectations were closely linked to valuations at each point in time, helping to
minimize volatility in domestic market rates.
Source: Bloomberg, United Capital Research
The multi-step unwinding of the
US monetary policy was
effectively concluded with
interest rates closing at zero
levels at the end of the year
The US tapering of quantitative
easing that effectively began
in Q1, 2014 impacted liquidity
in the Nigerian fixed income
space, distorting valuations
across naira denominated
assets
Fig. 34

Domestic Macro Trends and Outlook for 2015
44
13
0
2
4
6
8
10
12
14
Ma
r-07
Jul-0
7
No
v-0
7
Ma
r-08
Jul-0
8
No
v-0
8
Ma
r-09
Jul-0
9
No
v-0
9
Ma
r-10
Jul-1
0
No
v-1
0
Ma
r-11
Jul-1
1
No
v-1
1
Ma
r-12
Jul-1
2
No
v-1
2
Ma
r-13
Jul-1
3
No
v-1
3
Ma
r-14
Jul-1
4
No
v-1
4
CBN kept the benchmark unchanged for the most part of 2014,
resorting to administrative changes for monetary policy adjustments
Nigeria Monetary Policy Rate (MPR, %)
Domestic Monetary Conditions
Interest Rates and Money Supply: Eye on liquidity
The Nigerian monetary authority maintained a fairly tight interest rate policy in
2014 as the benchmark rate, MPR, was kept at 12% for most part of the year. The
need to keep inflation in check given the anticipated elevated spend in the
run-up to the 2015 elections was prominent in the policy discussions at the
various MPC meetings held during the year. Also, elevated system liquidity led to
a record increase in the Cash Reserve Ratio (CRR) for public sector funds from
50% to 75% at the January 2014 MPC meeting followed by an increase in the
private sector CRR from 12% to 15% in its March meeting.
The combined impacts of these aggressive policies signaled the CBN’s intention
to rein in excess liquidity in the system and curb speculative and non-core
banking activities of Nigerian banks. The suspension of the former CBN
Governor, Lamido Sanusi Lamido however “surprised” the market, leading to
considerable volatility in money market rates.
There were however two noticeable trends in the movement of monetary
aggregates (narrow and broad money) in 2014: 1) a sharp reversal in the
downward growth trend of money supply and credit growth compared to the
trend in 2013; 2) Increasing 12-month rolling correlation between money supply
and credit growth (see figure 36). We see this trend as evidencing the
effectiveness of monetary expansion in stimulating credit growth. That said, we
note the transmission could have been a lot stronger with lesser pressure on
banks’ balance sheets and a relatively more de-risked lending environment.
The combined impacts of
these aggressive policies
signaled the CBN’s intention to
rein in excess liquidity in the
system and curb speculative
and non-core banking
activities of Nigerian banks
Source: CBN, United Capital Research A much stronger transmission
mechanism could have been
achieved with lesser pressure
on banks’ balance sheet and
a more de-risked lending
environment
Fig. 35

Domestic Macro Trends and Outlook for 2015
45
0.0
0.2
0.4
0.6
0.8
1.0
1.2
-10%
-5%
0%
5%
10%
15%
20%
Jan-13 Mar-13 May-13 Jul-13 Sep-13 Nov-13 Jan-14 Mar-14 May-14 Jul-14 Sep-14
Broad Money Supply and Credit Growth show intandem movements,
resuming an upward trend in 2014
Money Supply Growth
Credit Growth
12-month rolling correlation
4.0
6.0
8.0
10.0
12.0
14.0
0.00
0.50
1.00
1.50
2.00
2.50
3.00
3.50
Jan-13 Mar-13 May-13 Jul-13 Sep-13 Nov-13 Jan-14 Mar-14 May-14 Jul-14 Sep-14 Nov-14
OMO Auctions tapered significantly in 2014 relative to 2013
CBN OMO Activities , 2013 Vs. 2014
Offer Subscription Rate
The various administrative measures employed by the CBN in 2014 meant that
there were lower volumes of OMO auctions relative to 2013. However, a more
elevated system liquidity reflected in a substantial gap between offerings and
subscription levels in H2’14 in spite of relatively flat rates at the auctions
especially towards H2. (See figure 37).
A much stronger transmission
mechanism could have been
achieved with lesser pressure
on banks’ balance sheet and
a more de-risked lending
environment
Source: CBN, United Capital Research
Source: CBN, United Capital Research
Fig. 36
Fig. 37

Domestic Macro Trends and Outlook for 2015
46
Outlook for Monetary Policy in 2015
Tighter still but waiting on crude oil prices
The Nigerian benchmark interest rate (MPR) closed the year at 13% with a
symmetric corridor of +-200ps as the MPC voted for a hawkish rate environment
in its last meeting of the year following persistent downward pressure on crude
oil prices. To a large extent, the trajectory of crude oil prices will shape the
monetary policy environment in 2015.
We expect a tighter interest rate regime in 2015 for 3 major reasons: 1) There are
greater downsides to inflation in the medium term given the recent devaluation
of the Naira and Nigeria’s precarious balance of payments position 2) Oil prices
are likely to fall through H1 2015 with attendant pressures on the domestic
currency; 3) A reversal to a tighter interest rate environment especially in US by
H2’ 15 will further compound the pressure on the Naira, raising the possibility of
further tightening.
It is also worth noting that the proposed fiscal spending cuts in the 2015 budget
could moderate structurally induced inflation, effectively shifting the monetary
policy anchor to exchange rate even as the recent devaluation feeds through
domestic price level as early as Q1 ‘15. We are inclined to believe that the CBN
will be even more aggressive if oil price do not find a floor early enough in 2015
and we look to see more administrative measures, increased OMO auctions as
well as more direct liquidity controls in H1 relative to 2014 levels.
The Nigerian benchmark
interest rate (MPR) closed the
year at 13% with a symmetric
corridor of +-200ps as the MPC
voted for a hawkish rate
environment in its last meeting
of the year

Domestic Macro Trends and Outlook for 2015
47
0
4,000
8,000
12,000
16,000
US
Ch
ina
Jap
an
Ge
rma
ny
Fra
nc
e
UK
Bra
zil
Ru
ssia
Ita
ly
Ind
ia
Ca
na
da
Au
stra
lia
Sp
ain
Ko
rea
Me
xic
o
Ind
on
esi
a
Ne
the
rla
nd
s
Turk
ey
Sa
ud
i Ara
bia
Sw
itze
rla
nd
Arg
en
tin
a
Sw
ed
en
Nig
eria
Po
lan
d
No
rwa
y
Be
lgiu
m
Ch
ina
Au
stria
UA
E
Tha
ilan
d
Co
lom
bia
Ira
n
So
uth
Afr
ica
De
nm
ark
Ma
laysi
a
Sin
ga
po
re
Isra
el
Ch
ile
Ho
ng
Ko
ng
Ph
ilip
pin
es
Eg
yp
t
Nig
eria
(O
ld)
Fin
lan
d
Gre
ec
e
Pa
kis
tan
Ire
lan
d
Ka
zakh
sta
n
Ira
q
Ve
ne
zue
la
Po
rtu
ga
l
Post-rebasing, Nigeria's GDP jumped 19 places to 23rd highest in the world
Top 50 Economies Globally: nominal GDP (US$ million)
Real GDP
Structurally clearer, fundamentally weakening
The rebasing of the GDP dominated discussion around Nigeria’s economy early
in 2014. With support from the IMF, World Bank and AfDB, Nigeria’s GDP was
rebased in April 2014 as the base year for the computation of GDP was
changed from 1990 to 2010. This effectively increased the size of the economy
by 89.2% to N80.2trn ($US 509.9billion) in nominal terms. A further breakdown of
the numbers showed that the services sector is not only the biggest contributor
to the GDP (with, 35.8% Vs. 20.0% in the old series), it also contributed the most
to the jump in the base year GDP numbers. We attribute this to the various
reforms that have been instituted in the Telecomms, Real Estate, Finance and
Insurance sectors over the last decade. We note that the marked difference in
the sectoral contributions to GDP post the rebasing exercise underscores the
diversification of the Nigerian economy, giving a clearer picture on the structure
of the economy, distribution and performance necessary for more effective
policy decision making.
Notably, the rebased GDP numbers have thrown up the headroom for
significant fiscal adjustments within the next couple of years. More than ever
before, it is now imperative to grow the financial sector and widen the tax net.
Although the exercise triggered “improvements” in fiscal ratios such as total
debt to GDP and fiscal deficit to GDP, it also revealed weakness and leakages
in Nigeria’s tax collection system while also highlighting the need to deepen the
financial system as indicators such as market capitalization to GDP, Credit to
GDP, M2 to GDP are now extremely poor by emerging market standards.
Source: IMF, United Capital Research
A breakdown of the numbers
showed that the services
sector is not only the biggest
contributor to the GDP (with,
35.8% versus 20.0% in the old
series), it also contributed the
most to the jump in the base
year GDP numbers
Fig. 38

Domestic Macro Trends and Outlook for 2015
48
4.5%
5.4% 5.2%
6.8% 6.2%
6.5% 6.2%
0.0%
1.0%
2.0%
3.0%
4.0%
5.0%
6.0%
7.0%
8.0%
2013Q1 2013Q2 2013Q3 2013Q4 2014Q1 2014Q2 2014Q3
2014 Real GDP Growth Tracks Higher than 2013
levels
-20.0%
-10.0%
0.0%
10.0%
20.0%
30.0%
2013Q1 2013Q2 2013Q3 2013Q4 2014Q1 2014Q2 2014Q3
Volatile growth trends from Manufacturing even as
Oil and Gas slips back into negative territory
Nigeria GDP Sectoral Growth Trends
Agriculture Manufacturing Oil and Gas Services
Fig. 40
Real GDP: Now anchored on buoyant services sector
On rebased GDP numbers, the Nigerian economy recorded quarterly growth
rates much higher than 2013 trend. Real GDP grew by 6.23% in Q3 ’14 (Vs. 5.4%
for Q3 ’13). The non-oil sector continued on its strong growth trajectory buoyed
largely by the services sector growing from 6.8% in Q2 to 7.6% in Q3 ’14 though
slowed y/y relative to Q3’ 13 (10.5%). This was largely on account of a tepid
growth from the Real Estate sector which expanded by 5.9% as at Q3, ’14
relative to Q3 ’13 (13.3%). Finance and Insurance (7.9% of the services GDP) also
slowed with a growth rate of 8.6% relative to Q3 ’13 (9.43%). The Oil and Gas
sector slipped back into negative growth territory that has been characteristic
on the sector in for the past 3 years on of account declining production due to
continued crude oil theft.
Outlook
Growth is likely to slow to below 5.0% in 2015
Tighter fiscal and monetary policies are the key downside risks we see to real
GDP growth in 2015. We do not expect a drastic reversal in government
revenue mix in the short to medium term, largely due to current heavy reliance
on oil. What’s more, government’s recurrent expenditure has historically
remained sticky, making a scale back in capital spend more likely in a bid to
prevent a ballooning of fiscal deficit. With additional currency weakness on the
horizon, the need to maintain a tight monetary policy stance will keep interest
rates high, thereby shaving 75-100bps off real GDP by our estimates. We expect
the services sector to continue to drive growth as we look to see appreciable
progress in reforms to key sectors namely agriculture and power.
Source: NBS, United Capital Research
The Oil and Gas sector slipped
back into negative growth
territory that has been
characteristic on the sector in
for the past 3 years on account
declining production due to
continued crude oil theft.
Tighter fiscal and monetary
policies are the key downside
risks to GDP growth in 2015
Fig. 39
Source: NBS, CBN, United Capital Research

Domestic Macro Trends and Outlook for 2015
49
0
2
4
6
8
10
12
13,000
13,500
14,000
14,500
15,000
15,500
16,000
16,500
17,000
Core Inflation held steady despite modest increase in
Money Supply
Money Supply(Nbn) Vs. Core Inflation
Money Supply (M2) Core Inflation
Fig. 42
5.0
5.5
6.0
6.5
7.0
7.5
8.0
8.5
9.0
9.5
10.0
Headline Inflation stood firmly within CBN's
target range in 2014
Inflation Rate
Single digit out of the radar
In line with our expectation, headline inflation remained firmly in single digits in
2014, averaging 8.1% (Vs. 8.5% in 2013). The broad declines in global commodity
prices and relatively favourable harvest seasons helped ease pressure non-core
inflation in the year as food inflation averaged 9.5% y/y (Vs. 9.7% in 2013).
Although the conflict prone areas of the North East continued to experience
significant disruptions to farming activities, favourable main harvests was
witnessed across much of the rest of the country leading to increased inventory,
and declining staple food prices. Notably, the aggressive tightening stance of
the CBN moderated the impact of election related spend even as exchange
rate stability in the first half of the year provided cushion to domestic prices
The downside risks to inflation in 2015 include the escalations in insurgency in the
northern part of the country especially in a post election scenario given the
recent spread in the geographical reach of the Boko Haram insurgents. The
current and expected pressure on the Naira given the declines in oil prices is
another risk factor that is yet to fully crystallize, in our view. We expect to see the
full impact of the recent devaluation of the Naira from Q1‘15, even as a
possible further adjustment of the currency in the near term portends greater
downside risks to inflation in 2015. We forecast and average inflation rate of
10.5% in 2015 as we expect core inflation to average 9.5%, and food inflation
11.5%
Target Range
Source: NBS, CBN, United Capital Research
In line with our expectation,
headline inflation remained
firmly in single digit in 2014,
averaging 8.1% (Vs. 8.5% in
2013).
Fig. 41
Source: NBS, CBN, United Capital Research

Domestic Macro Trends and Outlook for 2015
50
Exchange Rate Dynamics
Battling for the “Soul” of the Naira
The Naira came under severe pressure in 2014, as the N/USD weakened by
12.6% (Vs. -2.6% in 2013) with -11.5% of the depreciation recorded in Q4’ 14
when the Naira was devalued in the Official market. Early in the year, much of
the bearish trends in the Naira were driven by reduced foreign portfolio inflows
(FPIs) as the Fed decided to cut back its bond buying programme effective Q1
2014. This was evident in a huge spike in official forex demand–supply gap
which had shot up to a 2-year high as early as January leading to 1.6%
depreciation in the currency, the highest monthly change pre-devaluation.
Domestic macroeconomic uncertainties heightened by the suspension of the
former CBN governor in February 2014 raised concerns about the fate of the
Naira. This led to sharp outflows in FPI (m-o-m, -43.3% in February). Consequently,
the Naira depreciated by 1.4% in February. However, a rebound in FPI inflows in
April especially in the equity segment lent some respite to the Naira, with an
appreciation of 2.7%, the highest monthly gain in 2014. The last quarter saw a
market-induced devaluation which coincided with tamer foreign inflows and
significant net outflows from debt and equity securities as uncertainties around
the 2015 elections heightened.
Hawkish Stance Moderates Naira Volatility
The aggressive tightening policy of the CBN as well as the various control
measures employed by the Apex bank to ease supply bottlenecks across the
various segments of the market provided minimal support for the currency in the
-2.0%
-1.0%
0.0%
1.0%
2.0%
3.0%
-80.0%
-40.0%
0.0%
40.0%
80.0%
120.0%
160.0%
Jan-14 Feb-14 Mar-14 Apr-14 May-14 Jun-14 Jul-14 Aug-14 Sep-14 Oct-14
FPI Changes tracks closely in line with Naira Returns
Changes in FPIs Vs. Naira Returns
FPI Changes Naira Returns
Source:, CBN, United Capital Research
Much of the bearish trends in
the Naira were driven by
reduced foreign portfolio
inflows (FPIs) as the Fed
decided to cut back its bond
buying programme effective
Q1 2014
The aggressive tightening
policy of the CBN as well as
the various control measures
employed by the Apex bank
to ease supply bottlenecks
across the various segments of
the market provided some
support for the currency
Fig. 43

Domestic Macro Trends and Outlook for 2015
51
140
145
150
155
160
165
170
175
180
185
Dec-13 Feb-14 Apr-14 Jun-14 Aug-14 Oct-14
Administrative measures failed to substantially
close arbitrage gaps
NGN/USD Rates in 2014
Official Interbank BDC
0
1,000
2,000
3,000
4,000
5,000
6,000
7,000
8,000
Jan-13 May-13 Sep-13 Jan-14 May-14 Sep-14
In spite of CBN's strong defense of the Naira,
demand outweighed supply by 30% in 2014 Total FX Demand Versu Total FX supply ( $US, millions)
Demand Supply
Fig. 45
face of slow accretion to external reserves, especially in Q2. Notably, the
revision in the minimum capital base for the operation of the BDC to N35mn,
from N10mn as well as the prohibition of the ownership of multiple BDCs, helped
restrict forex dealers from round tripping the Naira, with the intent to close the
arbitrage gaps in the market. However, the decision of the CBN to
simultaneously reduce weekly sales to BDCs to $US15,000 from $US15,000
created some pressure in that segment of the market, thus widening the gap
between the parallel and official rates. CBN’s late intervention in the interbank
market also supported the Naira to a large extent in 2014 even as the removal
open positions for banks in Q4 ’14 created additional support to the currency.
The Imperative of Devaluation
The CBN’s resolve to continue to defend the Naira was tested in the face of the
sharp declines external reserves as oil prices began to tank in beginning H2’14.
The reserves, which reached a 2 year low in October 2014, with an import cover
of 7.3 months based on latest available data.
One of the strongest cases for a drastic exchange rate adjustment was the
precarious state of the country’s external trade position. By Q2 ’14, current
account surprise had weakened to 1.1% of GDP (Vs. 3.6% in 2013), largely on
account of higher import bills from crude oil trade as well as increased
repatriation of profits and dividends in light of macro-economic uncertainties.
Compounding the situation was heightened speculative demand for the dollar
induced by high system liquidity. A key demand management policy
Source: FMDQ, CBN, United Capital Research
One of the strongest cases for
a drastic exchange rate
adjustment was the precarious
state of the country’s external
trade position
Aggressive tightening cum
administrative measures failed
to close arbitrage gaps in H1’
14
Fig. 44
Source: CBN, United Capital Research

Domestic Macro Trends and Outlook for 2015
52
0
20
40
60
80
100
120
20,000
25,000
30,000
35,000
40,000
45,000
50,000
Jan
-13
Feb
-13
Ma
r-13
Ap
r-13
Ma
y-1
3
Jun
-13
Jul-13
Au
g-1
3
Se
p-1
3
Oc
t-13
No
v-1
3
De
c-1
3
Jan
-14
Feb
-14
Ma
r-14
Ap
r-14
Ma
y-1
4
Jun
-14
Jul-14
Au
g-1
4
Se
p-1
4
Oc
t-14
Falling Oil Prices exerting significant pressure on the naira
Average Monthly External Reserves and Brent Crude Price
External Reserves Brent
introduced by the CBN was the restriction of certain import items from being
funded at the rDAS window, a move that was intended to effectively cut
demand by more than half at the official window. Despite these restrictive
measures, demand for the greenback continued unabated as total dollar
demand was 1.3x total supply in Q3, reaching a high of 1.6x in September.
Having breached the existing target band to forex sales at the Official window
due to unabated demand, the Committee members in its last meeting for the
year, resorted to a drastic downward adjustment to the midpoint of the Official
window of the foreign exchange market from N155/US$ to N158/US$ and
widened the band around the midpoint of the exchange rate from +/-3 to +/-5
per cent.
Outlook for the Naira in 2015:
Is further devaluation on the Cards?
The key question on the minds of investors and market participants is whether
another round of devaluation might be witnessed in 2015 if the pressure on oil
prices does not abate. We estimate that from the onset of the decline in oil
prices, a 1% drop in Brent crude prices has led to 0.24% decline in gross external
reserves. Using an average monthly imports value of US$4.9bn (the mean
imports value per annum), we estimate that oil prices would need to fall to
Source: FMDQ, CBN, United Capital Research
The key question on the minds
of investors and market
participants is whether another
round of devaluation might be
witnessed in 2015 if the
pressure on oil prices does not
abate
We estimate that oil prices
would need to fall to between
$20-$25p/bd for import cover
to touch 4-4.5 months levels
compared to the
internationally accepted
standard of 3 months
Fig. 46

Domestic Macro Trends and Outlook for 2015
53
between $20-$25p/bd for import cover to touch 4-4.5 months levels compared
to the internationally accepted standard of 3 months. This brings to the fore the
robustness of Nigeria’s external reserves in containing pressure on the domestic
currency.
While the strength of the external reserves remains appreciable, the same
cannot be said about Nigeria’s trade position. Given Nigeria’s high oil import bill
placed against the backdrop of a fast depreciating Naira, the current meager
current account surplus will be wiped out in no distant time. Our view is re-
enforced by the expected increase in portfolio reversals especially as yields in
key emerging markets move in the direction of market expectation of Fed
tightening by H1’ 2015. What’s more, funds flow from Sovereign Wealth Funds
from key OPEC countries will taper as oil prices continue to recede, leading to
tighter liquidity as resultant higher rate environment in key advanced
economies becomes more attractive to yield hungry investors.
We believe that oil prices are not likely to touch levels seen at the height of the
global financial crisis (2007-2008), given the current strong performance posted
by the advanced economies compared to the era of global financial crisis.
Based on the foregoing, any further adjustment in the exchange rate in 2015
(which is likely to be lower than the 8% devaluation in 2014) will not entirely be
due to consideration of the depletion in external reserves but rather on the
shaky state of Nigeria’s trade position.
We believe that oil prices are
not likely to touch levels seen
at the height of the global
financial crisis (2007-2008),
given the current strong
performance posted by the
advanced economies
compared to the era of global
financial crisis

Domestic Macro Trends and Outlook for 2015
54
412
634
943
2,616 4,605
0
1,000
2,000
3,000
4,000
5,000
Statutory
Transfer
Capital
Expenditure
Debt Service Recurrent
Expenditure
Total
Expenditure*
Capex accounts for 9% of entire budget Outlay
Breakdown of expenditure plans for 2015 (N'bn)
Fiscal Plan 2015: Budgeting in the midst of Uncertainty
The 2015 budget is predicated on a spending plan of N4.4trn (Vs. N4.7trn in
2014), with an estimated revenue of N3.6trn (Vs N3.7trn in 2014), implying a
budget deficit of N756bn, equivalent to 0.8% 2015E GDP. The benchmark crude
oil price was set at US$65p/b, after multiple revisions on the back of the
continued downward trend in global oil prices as well as bearish outlook for the
commodity in the short to medium term. We reiterate that alternative approach
could have been a scenario based budgeting that allows the fiscal authority to
assume different benchmark prices given the uncertainty around crude oil
prices. We think some level of flexibility should have been built into the budget
to prevent recourse to the legislative arm in the event that the volatility in oil
prices heightens in 2015. Importantly, we do not think the benchmark of
$65p/bd is the bear case scenario for oil prices in 2015.
We think that the oil production benchmark is overly optimistic given the
leakages that have characterized oil production in recent times. Data from
OPEC shows that average crude oil production in 2014) stood at 1.93m bpd,
23.7% lower than the budgeted volumes in the 2014 budget. However, having
widened the band around the official exchange rate, the exchange rate
assumption of $165p/b clearly lies within the range of possible values for the
N/USD at the Official market in 2015. However, the possibility of further
devaluation before the end of the year constitutes a downside to this
assumption
2015 2014 Change
Total Federally Collectible
Revenue (N'trn) 6.90 7.50 -8.00%
Estimated Revenue 3.60 3.73 -3.49%
Total Expenditure 4.40 4.70 -6.48%
Oil Production (mbpd) 2.28 2.39 -4.60%
Benchmark Oil Price (p/b) 65.00 77.50 -16.13%
GDP growth rate 5.50% 6.75% -18.52%
Exchange Rate(N/USD) 165 160 -3.03%
Non oil Revenue(N'bn) 1.68 2.51 -33.20%
Fiscal Deficit (N'bn) 755 970 -22.16%
Fiscal Deficit (% of GDP) 0.79% 1.90% -58.42%
Domestic Borrowing (N'bn) 570.0 571.2 -0.21%
Source: Federal Ministry of Finance, United Capital Research
We think some level of
flexibility should have been
built into the budget to prevent
recourse to the legislative arm
in the event that the volatility in
oil prices heightens in 2015
Source: Federal Ministry of Finance, United Capital Research
Fig. 47

Domestic Macro Trends and Outlook for 2015
55
1,000
1,500
2,000
2,500
3,000
Budgeted Production volumes have historically been below target
due to persistent leakages
Nigeria Crude Oil Actual Volumes Vs. Budget
Actual Daily Oil Production (mbpd) Budgeted Production
Non-Oil Revenue: A realistic transition?
The 2015 budget is predicated on an historic shift to the non-oil sector as a
significant revenue source. This was largely anticipated given the expected
strain on petro-dollar inflows in 2015. Notably, the non-oil revenue to total
revenue is budgeted to increase to 46.7% in 2015 (Vs. 33.0% in the 2014 budget
estimates).
We note that the recent rebasing of the GDP has not only given a clearer
picture to the structure of the economy, it currently gives the fiscal authority
enough elbow room to transit from an oil dependent revenue base to a more
diversified structure, taking into consideration the increasing growth profile, post
rebasing, of previously under-estimated services sector . Historically, the strong
growth in the non-oil sector has not translated into significant non-oil revenue
accretion for the government, even if we back out the large informal sector not
integrated into the mainstream economy.
While we welcome the renewed focus on non-oil revenue streams, we estimate
that the expected revenue from these sources despite the various luxury
charges introduced will be insufficient to cover the shortfall oil revenue if we
hold the benchmark oil price constant for the entire fiscal year. More so, non-oil
revenue has been constrained by the government’s fiscal policy that has
recently tilted more in favour of import substitution, with the attendant declines
in non-oil receipts. On another note, the challenges across the non-oil revenue
Source: OPEC (Monthly Oil Market Reports), Federal Ministry of Finance, United Capital Research
The 2015 budget is predicated
on an historic shift to the non-
oil sector as a significant
revenue source
We estimate that the expected
revenue from these sources
despite the various luxury
charges introduced will be
insufficient to cover the shortfall
oil revenue
Fig. 48

Domestic Macro Trends and Outlook for 2015
56
28.7% 38.6% 40.2%
32.6% 35.2% 30.2% 32.6% 46.70%
71.3% 61.4% 59.8%
67.4% 64.8% 69.8% 67.4% 53.3%
0%
20%
40%
60%
80%
100%
2008 2009 2010 2011 2012 2013 2014* 2015e
Non Oil Revenue Targeted at 46.7% of total revenue Non -Oil Vs. Oil Revenue Split
Non Oil Oil Revenue
generating sectors have been further exacerbated by the recurring incidences
of smuggling across the borders.
Plugging the Deficits: How Plausible is a reduction in domestic borrowing?
The proposed budget is based on a deficit of N755.0bn (0.79% of GDP (Vs. 1.9%
in 2014 o) with domestic borrowing plan of N570.0bn expected to finance 75.5%
of total deficit. While the recourse to domestic borrowing as a means of
financing budget deficits can easily be regarded as the norm in Nigeria’s
budgeting cycles, we were surprised to see a reduced borrowing plan relative
to 2014 levels. Given that we expect government revenue to come in lower
than estimated in 2015, we anticipate a higher level of domestic borrowing
compared to 2014. We think the required traction in non-oil revenue growth
may be delayed beyond 2015 as the economy adjusts to a new fiscal regime,
making a reduction in borrowing unlikely. Also, we expect borrowing to be at a
much higher cost, given the uncertainties around Nigeria’s fiscal revenue
stream. The government’s recent efforts at diversifying borrowing sources to
offshore funding may also be challenged given the expected increase in
sovereign risk premiums on oil producing countries with relatively weak or
precarious balance of payments position such as Nigeria’s. These expectations
are partly reflected in the 32.4% increase in estimated debt service expense
despite a 0.21% decline in expected domestic borrowing.
Source: CBN, United Capital Research * Budgeted estimates; e= expected
The government’s recent efforts
at diversifying borrowing
sources to offshore funding may
also be challenged given the
expected increase in sovereign
risk
Fig. 49
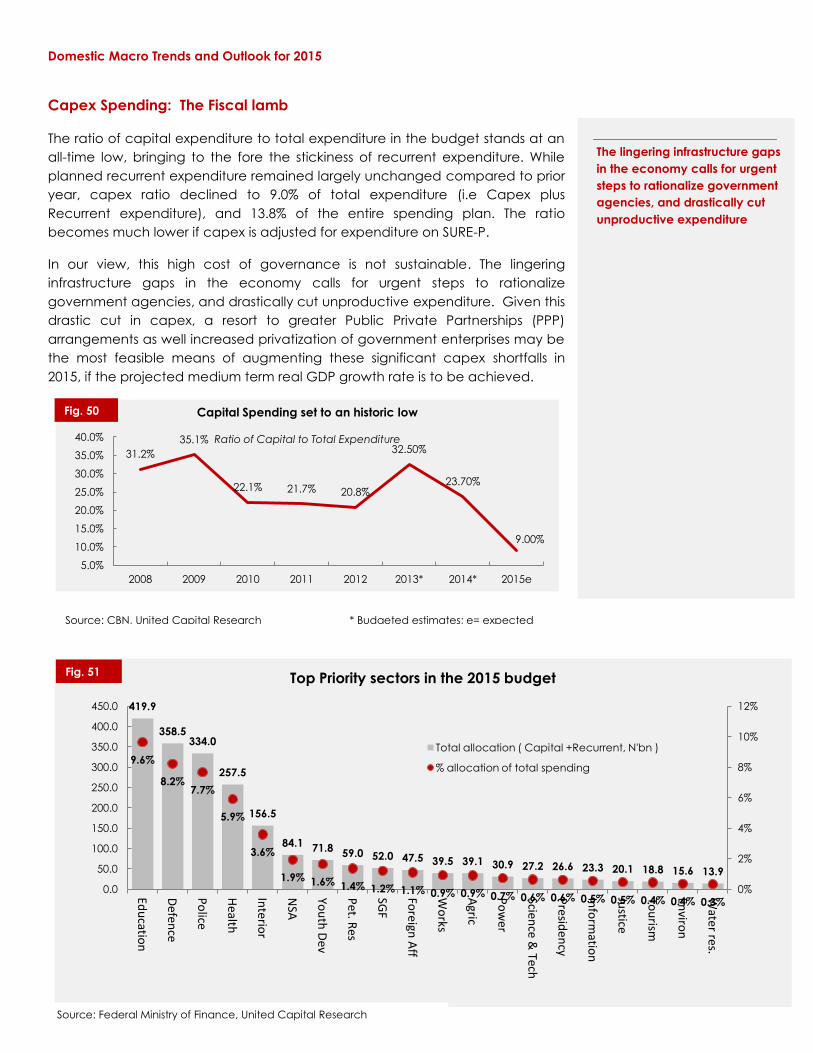
Domestic Macro Trends and Outlook for 2015
57
419.9
358.5 334.0
257.5
156.5
84.1 71.8 59.0 52.0 47.5 39.5 39.1 30.9 27.2 26.6 23.3 20.1 18.8 15.6 13.9
9.6%
8.2% 7.7%
5.9%
3.6%
1.9% 1.6% 1.4% 1.2% 1.1% 0.9% 0.9% 0.7% 0.6% 0.6% 0.5% 0.5% 0.4% 0.4% 0.3% 0%
2%
4%
6%
8%
10%
12%
0.0
50.0
100.0
150.0
200.0
250.0
300.0
350.0
400.0
450.0
Edu
cation
Defen
ce
Po
lice
Health
Interio
r
NSA
You
th D
ev
Pet. R
es
SGF
Foreign
Aff
Wo
rks
Agric
Po
wer
Science &
Tech
Presid
ency
Info
rmatio
n
Justice
Tou
rism
Enviro
n
Water res.
Top Priority sectors in the 2015 budget
Total allocation ( Capital +Recurrent, N'bn )
% allocation of total spending
31.2%
35.1%
22.1% 21.7% 20.8%
32.50%
23.70%
9.00%
5.0%
10.0%
15.0%
20.0%
25.0%
30.0%
35.0%
40.0%
2008 2009 2010 2011 2012 2013* 2014* 2015e
Capital Spending set to an historic low
Ratio of Capital to Total Expenditure
Capex Spending: The Fiscal lamb
The ratio of capital expenditure to total expenditure in the budget stands at an
all-time low, bringing to the fore the stickiness of recurrent expenditure. While
planned recurrent expenditure remained largely unchanged compared to prior
year, capex ratio declined to 9.0% of total expenditure (i.e Capex plus
Recurrent expenditure), and 13.8% of the entire spending plan. The ratio
becomes much lower if capex is adjusted for expenditure on SURE-P.
In our view, this high cost of governance is not sustainable. The lingering
infrastructure gaps in the economy calls for urgent steps to rationalize
government agencies, and drastically cut unproductive expenditure. Given this
drastic cut in capex, a resort to greater Public Private Partnerships (PPP)
arrangements as well increased privatization of government enterprises may be
the most feasible means of augmenting these significant capex shortfalls in
2015, if the projected medium term real GDP growth rate is to be achieved.
Source: CBN, United Capital Research * Budgeted estimates; e= expected
Source: Federal Ministry of Finance, United Capital Research
The lingering infrastructure gaps
in the economy calls for urgent
steps to rationalize government
agencies, and drastically cut
unproductive expenditure
Fig. 50
Fig. 51
Domestic Macro Trends and Outlook for 2015
58
Politics and 2015 Elections
Bracing up for a fierce contest
The political tunes of 2014 were dictated by a strong quest for power shift away
from the dominance of the ruling political party, PDP. From defections of
elected public office holders to the opposition’s surprise loss of key political
strong holds during the year, the 2015 elections stage is currently being set up
for a fiery contest. We believe it is all the more critical now for Nigeria to scale
this hurdle given the vast negative global predictions that have trailed the 2015
polls as well as the seemingly unrelenting trend of insurgency in the last 5 years.
In major emerging markets, it is now commonplace for politics and election
dynamics to form a central theme informing direct investment decisions and
even portfolio flows. Across our 2015 outlook, we emphasized the impacts that
exogenous capital flows have had and will continue to have on the Nigerian
financial markets going into 2015. We believe a successful conduct of the 2015
elections is crucial in this regard. Historically, Nigeria has enjoyed the strongest
growth in FDI inflows in election years but that growth has slowed down
significantly since the peak of 2011. In fact in the last two years: 2012 and 2013,
FDI flows declined by 20.1% and 21.3% respectively. Clearly, the nexus between
political stability and foreign investment and investor confidence cannot be
waved aside.
Defining themes for 2015 Elections: the Odds not totally in favour of PDP
On paper, the ruling party seems to have lost appreciable ground since the last
elections in 2011. With the opposition getting stronger and about to field a
personality that is arguably the strongest opposition in current day political
permutations, the elections may well be decided at the polls against an a-priori
expectation of a landslide victory characteristic of Nigerian polls in the past. This
is on the assumption that voting patterns are similar to 2011elections.
That the opposition will win more votes compared to 2011 is probably not in
doubt given the series of defections that we have seen post 2011 elections.
However, the probability that the opposition’s additional votes in 2015 elections
would be sufficient to cover the c.8.2 million votes gap in 2011 elections is at
best up in the air.
The Northern and South Western strongholds of the opposition party will be
critical to the outcome of the polls. However, wherever the pendulum swings,
we expect to see a slim margin of victory by the eventual winner. We think this
could throw up some post election resistance, and a possibility of legal tussle
that could heat up the polity. A key risk is the possibility of a run-off should
The lingering infrastructure gaps
in the economy calls for urgent
steps to rationalize government
agencies, and drastically cut
unproductive expenditure
The Northern and South Western
strongholds of the opposition
party will be critical to the
outcome of the polls

Domestic Macro Trends and Outlook for 2015
59
61.20%
32.20%
6.60%
2003
PDP ANPP Others
69.82%
18.72%
11.46%
2007
PDP ANPP Others
58.90% 31.98%
9.12%
2011
PDP CPC Others
President Jonathan fail to secure at least 25% of the votes in two-thirds of the
states.
History of Nigeria’s Presidential Election Results
Source: INEC, United Capital Research
Fig. 52

Capital Markets Review and Outlook
60
Section 5
Capital Markets Review and Outlook

61
80
85
90
95
100
105
110
115
120
125
Jan-14 Feb-14 Mar-14 Apr-14 May-14 Jun-14 Jul-14 Aug-14 Sep-14 Oct-14 Nov-14 Dec-14
Performance of long term maturities diverge on heigtened uncertainties
Nigerian Bonds Index Performance for Different Maturities ( rebased to 100)
3-5yr >5 yr 3 yr
THE FIXED INCOME MARKET
FPI volatility, domestic liquidity shaped yields in 2014
To a considerable extent, the Nigerian fixed income market mirrored sentiments
that impacted emerging markets fund flow in 2014. With the US Fed’s tapering
in full gear, foreign portfolio inflows into the fixed income market receded
sharply in Q1 pressuring yields to the upside. However, the stability witnessed in
the N/USD as well as the sustained single digit inflation level ensured sizeable
amounts of FPI flow into naira fixed income assets.
On account of market expectations of higher yields during the year which was
premised partly on the anticipation of a continuous cut back in US QE after an
initial US$10bn reduction in January, the yield curve sustained its inverted slope
in Q1, with higher rates in short dated maturities. The gradual re-pricing of the
curve was however noticeable after a series of CBN liquidity mop-up exercises
which, combined with a shift in investors’ horizon to shorter term maturities
against the backdrop of political uncertainties, eventually pressured long end
yields.
Summarily, a higher level of domestic liquidity pressured fixed income yields for
most part of 2014; but increased paper issuances as well as balance sheet
sterilization via frequent CRR adjustments by the CBN created a floor for yields
during the year after temporary concerns arising from the suspension of the
erstwhile CBN Governor. While the termination of US Fed QE tapering early in Q4
pressured yields to the upside, elevated system liquidity stemming from AMCON
maturities served as liquidity boost to the market.
The stability witnessed in the
N/USD as well as the sustained
single digit inflation level
ensured sizeable amounts of
FPIs flow into naira fixed income
assets
Increased paper issuances as
well as balance sheet
sterilization via frequent CRR
adjustments by the CBN created
a floor for yields during the year
Source: FMDQ, United Capital Research
Fig. 53
Capital Markets Review and Outlook

62
8.0%
10.0%
12.0%
14.0%
16.0%
1M 2M 3M 6M 9M 1Y 3Y 5Y 7Y 10Y 20Y
Yields rose 282 bps in 2014
Nigeria Sovereign Yield Curves: 2013 Vs. 2014
2014 2013
Q1 Q2 Q3 Q4
3M 13.2% 11.0% 11.0% 14.0%
6M 13.9% 11.0% 11.0% 14.5%
9M 14.4% 11.2% 11.2% 14.5%
1Y 15.0% 11.2% 11.6% 14.7%
3Y 13.9% 11.4% 12.0% 15.3%
5Y 13.8% 11.4% 12.1% 15.4%
7Y 13.9% 12.0% 12.3% 15.4%
10Y 13.9% 12.2% 12.4% 15.1%
20Y 13.7% 12.2% 12.4% 15.0%
Average 14.0% 11.5% 11.8% 14.9%
80
85
90
95
100
105
110
115
120
Jan-14 Mar-14 May-14 Jul-14 Sep-14 Nov-14
On local currency basis, Nigerian bonds outperfomed in 2014
FGN Bonds Vs. Emerging Markets Bonds ( rebased, 100)
Emerging Markets Bond Index* FGN bond Index
Nigerian fixed Income: Increasingly Attractive
On local currency basis, the Nigerian bonds market offered one of the most
attractive returns in the Frontier/emerging market space in 2014. The inclusion of
the Nigeria March 2024 bond in the GBI-EM Global Diversified Index in August
2014 provided additional momentum to Nigerian bonds in the year, with an
estimated additional inflow of around US$200m.
As a result of the increase in monthly inflows to pension funds, and less
participation by banks in the long end of the curve, pension funds investment in
fixed income securities increased significantly compared to 2013. As of Q3 ’14,
PFAs investment in FGN bonds as a portion of total stock of FGN securities stood
at 78.8% (Vs. 74.2% for Q3 ’13). Also, bond holdings as a percentage of total
Investment had reached 47.4% (Vs. 44.2% for Q3 ’13) by October.
Quarterly Trends in Yields
Source: FMDQ, United Capital Research
Source: FMDQ, Bloomberg, United Capital Research * JP Morgan Government Bond
Index Emerging Market Global
On local currency basis, the
Nigerian bonds market offered
one of the most attractive
returns in the Frontier/emerging
market space in 2014
Source: Bloomberg, United Capital Research
Fig. 54
Fig. 55
Capital Markets Review and Outlook

63
0.00
20.00
40.00
60.00
80.00
100.00
120.00
Jan
-14
Feb
-14
Ma
r-14
Ap
r-14
Ma
y-1
4
Jun
-14
Jul-14
Au
g-1
4
Se
p-1
4
Oc
t-14
No
v-1
4
De
c-1
4
Primary Market Issuance Volumes of FGN
bonds in 2014
0
100
200
300
400
500
600
Jan
-13
Feb
-13
Ma
r-13
Ap
r-13
Ma
y-1
3
Jun
-13
Jul-13
Au
g-1
3
Se
p-1
3
Oc
t-13
No
v-1
3
De
c-1
3
Jan
-14
Feb
-14
Ma
r-14
Ap
r-14
Ma
y-1
4
Jun
-14
Jul-14
Au
g-1
4
Se
p-1
4
Oc
t-14
Volatile FPI flows in bonds and money market
instruments
Capital Importation into Bonds and Equities (US'm)
Bonds Money Markets Instruments
Primary Market Offerings: Sustained Robust Demand
The N970.0bn deficit built into the 2014 budget was financed partly with a total
of c.950bn worth of bond issuances in 2014 (Vs. N900.0bn in 2013). A significant
portion of the bond auction was concentrated in Q2, with generally reduced
marginal rates. We note that a higher level of domestic liquidity helped to
moderate the yield impact of volatile FPI inflows in 2014 as increased
participation by PFAs and inflows from AMCON maturities combined to ease
liquidity in the face of regulatory-induced reduction in fixed income holdings of
banks.
We note that in spite of the variations in system liquidity levels, there was very
little difference in the level of demand in the primary segment of the market
relative to 2013. While subscription rates average 2.1x in 2013, average
subscription level stood at 2.2x in 2014. Notably, oversubscriptions were
concentrated more in the longer tenured instruments in 2013 compared to 2014
suggesting that investors preferably took a shorter term view of the expected
socio political environment in 2015. We expect this trend to change in 2015 as
political uncertainties wane after the elections. More importantly, we believe
the yield curve is still up for further reprising especially if further exchange rate
adjustment materializes.
There were much slower activities in the State and corporate segments as
concerns over election related spending capped regulatory approvals for sub-
national bonds issuances while relatively high rate environments limited
corporate bond issuances.
Source: FMDQ , CBN, United Capital Research
A significant portion of the bond
auction was concentrated in
Q2, with generally reduced
marginal rates
We believe the yield curve is still
up for further reprising
especially if further exchange
rate adjustment materializes.
Source: CBN, United Capital Research
Fig. 56 Fig. 57
Capital Markets Review and Outlook

64
9.3%
-3.2% -5.3%
0.0%
-2.1% -4.4%
-8.4%
-4.6%
-9.6%
-4.4%
-7.2% -6.7% -6.1%
-9.2%
-15.0%
-10.0%
-5.0%
0.0%
5.0%
10.0%
15.0%
FGN Bond Returns in 2014 ( Price changes only)
-
40,000
80,000
120,000
160,000
200,000
Jan-14 Mar-14 May-14 Jul-14 Sep-14 Nov-14
Fixed income Trading picked in Q4 on account
of bearish trends in equities
Nigeria Fixed Income Average Daily Traded Volumes
(N'bn)
FGN Bonds T-Bills
Secondary Market Trading: Vastly Improving
The FMDQ OTC trading platforms continued to enhance liquidity with robust
trading activities in 2014 compared to 2013. By Q4 2014, market turnover of
bonds and treasury bills had shot up significantly from c.1700 deals and
N314.1bn per week at the beginning of the year to c.3800 deals and N755.1bn
per week. Rates sensitivity of long term maturities was pronounced as only the
4.00 23-April-2015 showed a price appreciation of 9.3% yielding a total return of
13.3%, while the biggest price decline of -9.2% was recorded in the 10.00 23-Jul-
2030 instrument with a total return of 0.8%. (see chart 59)
Yield Outlook and Fixed Income Strategy for 2015
In summary, there were 3 major factors that shaped the Nigerian fixed income
market in 2014: 1) Aggressive tightening by the CBN, 2) Heightened volatility in
FPI inflows, and 3) the downward trajectory of crude oil prices. We expect these
factors to continue to dictate yield movements in 2015 albeit in different
degrees during the year. With respect to the first factor, more or sustained
tightening is on the cards in 2015 for reasons we have highlighted earlier in this
report. Although we do not see significant adjustments to monetary aggregates
on account of policy pronouncements early in the year, we believe market
expectations will still drive rates upward in Q1’ 15. In the last 2 years, the impact
of interest rate movements have been less pronounced the further out you go
along the yield curve. This implies that short-dated maturities tend to be more
elastic to rate changes. While this appears to be a normal trend, we believe
Source: FMDQ United Capital Research
Returns were computed as at Dec 23, 2014 Source: FMDQ, United Capital Research
The biggest price decline of -
9.2% was recorded in the 10.00
23-Jul-2030 instrument with a
total return of 0.8%.
Although we do not see
significant adjustments to
monetary aggregates on
account of policy
pronouncements early in the
year, we believe market
expectations will still drive rates
upward in Q1’ 15
Fig. 58 Fig. 59
Capital Markets Review and Outlook
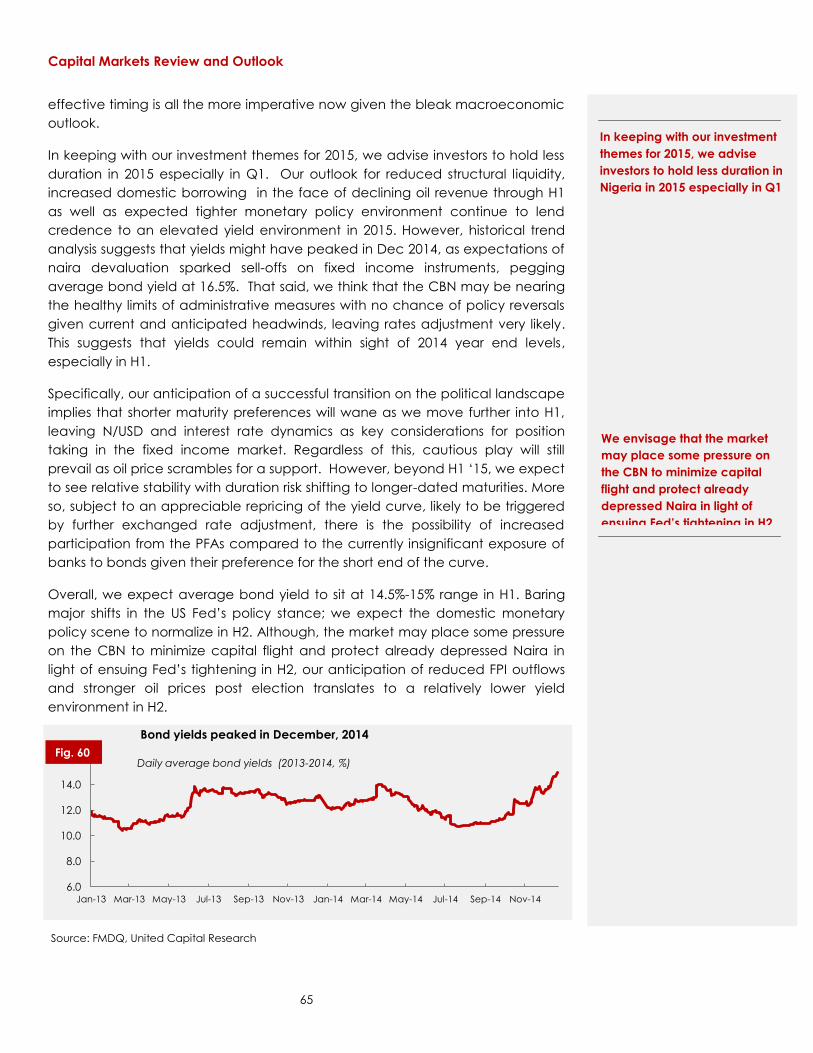
65
6.0
8.0
10.0
12.0
14.0
16.0
Jan-13 Mar-13 May-13 Jul-13 Sep-13 Nov-13 Jan-14 Mar-14 May-14 Jul-14 Sep-14 Nov-14
Bond yields peaked in December, 2014
Daily average bond yields (2013-2014, %)
effective timing is all the more imperative now given the bleak macroeconomic
outlook.
In keeping with our investment themes for 2015, we advise investors to hold less
duration in 2015 especially in Q1. Our outlook for reduced structural liquidity,
increased domestic borrowing in the face of declining oil revenue through H1
as well as expected tighter monetary policy environment continue to lend
credence to an elevated yield environment in 2015. However, historical trend
analysis suggests that yields might have peaked in Dec 2014, as expectations of
naira devaluation sparked sell-offs on fixed income instruments, pegging
average bond yield at 16.5%. That said, we think that the CBN may be nearing
the healthy limits of administrative measures with no chance of policy reversals
given current and anticipated headwinds, leaving rates adjustment very likely.
This suggests that yields could remain within sight of 2014 year end levels,
especially in H1.
Specifically, our anticipation of a successful transition on the political landscape
implies that shorter maturity preferences will wane as we move further into H1,
leaving N/USD and interest rate dynamics as key considerations for position
taking in the fixed income market. Regardless of this, cautious play will still
prevail as oil price scrambles for a support. However, beyond H1 ‘15, we expect
to see relative stability with duration risk shifting to longer-dated maturities. More
so, subject to an appreciable repricing of the yield curve, likely to be triggered
by further exchanged rate adjustment, there is the possibility of increased
participation from the PFAs compared to the currently insignificant exposure of
banks to bonds given their preference for the short end of the curve.
Overall, we expect average bond yield to sit at 14.5%-15% range in H1. Baring
major shifts in the US Fed’s policy stance; we expect the domestic monetary
policy scene to normalize in H2. Although, the market may place some pressure
on the CBN to minimize capital flight and protect already depressed Naira in
light of ensuing Fed’s tightening in H2, our anticipation of reduced FPI outflows
and stronger oil prices post election translates to a relatively lower yield
environment in H2.
Source: FMDQ, United Capital Research
In keeping with our investment
themes for 2015, we advise
investors to hold less duration in
Nigeria in 2015 especially in Q1
We envisage that the market
may place some pressure on
the CBN to minimize capital
flight and protect already
depressed Naira in light of
ensuing Fed’s tightening in H2
Fig. 60
Capital Markets Review and Outlook

66
25,000
30,000
35,000
40,000
45,000
Jan-14 Feb-14 Mar-14 Apr-14 May-14 Jun-14 Jul-14 Aug-14 Sep-14 Oct-14 Nov-14 Dec-14
QE
Tapering
and the
Increase in
CRR Suspension of
the ex-CBN
Governor
GDP Rebasing
by the NBS
New CBN Governor
resumes
Ebola
Outbreak
Oil Price
Shock
Further Tightening by the
CBN, Naira Devaluation and
OPEC "no cut" decision
EQUITIES MARKET
An eventful 2014
The local bourse recorded the worst performance post market resurgence in
2012. Coming from a bullish close to 2013 (47.2% return), the equities market in
2014 was shaped by events ranging from the increase in CRR of banks;
suspension of the ex-CBN governor; weak earnings by companies; Oil price fall;
further tightening by the CBN; Naira devaluation; as well as fiscal challenges.
These headwinds dragged the NSE to close the year with a negative return of
-16.1%.
The market kicked off 2014 on a positive note on the back of robust macro-
economic fundamentals. However, CRR adjustments, QE Tapering by the Fed
and the suspension of the ex-CBN Governor shoved the positive in the market in
Q1’14, resulting in 5.3% loss in the period. Outflow of portfolio capital was largely
responsible coupled with market-distorting activities. Consequently, the All Share
Index return was negative all through the period with -1.8%, -2.5% and -2.0%
returns in January, February and March respectively. The bearish mood
witnessed in the 1st quarter rolled in the start of the 2nd quarter with a -0.7% return
Trajectory of the ASI in 2014
Equities close the year with
worst performance post market
2012 market resurgence
The market kicked off 2014 on a
positive note on the back of
robust macro- economic
fundamentals
Fig. 61
Capital Markets Review and Outlook

67
-1.8% -2.5% -2.1% -0.7%
7.8%
2.4%
-0.9% -1.3% -0.8%
-8.9% -8.0%
0.3%
-12%
-8%
-4%
0%
4%
8%
12%
Jan Feb Mar Apr May Jun Jul Aug Sep Oct Nov Dec
Monthly Returns on the NSE
-5.3%
9.6%
-3.0%
-15.9% -20%
-10%
0%
10%
20%
Q1'14 Q2'14 Q3'14 Q4'14
Quaterly Returns on the NSE
0%
20%
40%
60%
80%
100%
Jan-14 Feb-14 Mar-14 Apr-14 May-14 Jun-14 Jul-14 Aug-14 Sep-14 Oct-14 Nov-14
Foreign Vs. Domestic Participation on the NSE
Foreign % Domestic %
in April. This however was short-lived as the GDP rebasing exercise which
positioned Nigeria as the largest economy in Africa triggered a market rebound
even as the appointment of the new CBN governor, Godwin Emefiele, who
upon assumption committed to defending the local currency and achieve
price stability, gave investors a breather. In the same period, volume and value
of transactions increased by 69.3% and 213% to 6.7bn shares and N11.9bn
respectively.
Market however reversed its bullish run in Q3’14 on the back of weak sentiments
stemming from the weak H1’14 results by companies, Ebola outbreak, Oil price
shock and steep depreciation in the Naira, this led to a 3% and 15.9% decline in
the equities market in Q3’14 and Q4’14 respectively.
Foreign Players still dominate
Activities in the local bourse were largely dominated by foreign investors in 2014.
The disposition towards the equities market by foreign investors was due to the
attractiveness of the exchange when compared with other frontier markets.
Foreign participation from January to November was 58.5% as against domestic
participation of 41.5%.
The appointment of the new
CBN Governor who committed
to defending the Naira gave
investors some breather
NSE, United Capital Research NSE, United Capital Research
NSE, United Capital Research
Foreign players accounted for
58.5% of trades from January to
November, 2014
Fig. 62 Fig.
63
Fig. 64

68
392.2%
374.0%
92.5%
40.7%
39.8%
35.3%
33.5%
0% 100% 200% 300% 400% 500%
Premier Breweries
Ikeja Hotels
Beta Glass
I.H.S
Fidson
Golden Guine
Union Dicon
Small cap stocks outperformed the Market in 2014
YTD Returns of select small cap stocks in 2014
Small cap stocks defy the bearish sentiment
Small cap stocks were the best performers in 2014 with a 32.8% growth, followed
by the mid-cap stocks which were up by 23.5%. However, the large cap stocks
were down by 21.4% which shows the negative market sentiment can be largely
attributed to sell-offs in the market’s heavyweights.
Shares of small cap stocks, especially in the consumer names were the top
gainers in 2014; Small cap stocks are rarely patronized by foreign and
institutional investors for lack of liquidity, hence they were less susceptible to
capital flight and global investor sentiment. Eight (8) out of the top 10 gainers for
2014 were small cap stocks with market capitalization of less than N25.0bn.
The gains in small cap stocks can be largely attributed to strategic position
taking by investors as some of these stocks portend values especially the
Insurance and Consumer goods names. We still expect to see long-term
bargain hunting and strategic buying in these stocks in 2015 following
disappointing performance of the large cap counters.
New Listings: Relatively flat
Following the twin stellar performance of the equities market in 2012 and 2013,
the market saw two major listings in 2014 by Seplat and Caverton in April and
May respectively.
The dual listing of Seplat Petroleum Development Company Plc (Seplat) on the
NSE and the London Stock Exchange (LSE) in April 2014 marked the first IPO on
the NSE since the market crash in 2008. Seplat listed its shares on the main board
NSE, United Capital Research
The impressive performance of
small cap stocks can be
attributed to strategic
positioning in attractive names
We still expect to see long-term
bargain hunting and strategic
buying in select small cap
stocks in 2015
Fig. 65

69
-40%
-20%
0%
20%
40%
Dec-13 Feb-14 Apr-14 Jun-14 Aug-14 Oct-14
Nigerian Equities: Market Valuations Vs Peers Nigeria
Ghana
South Africa
Egypt
Kenya
Frontier Market
EMEs
Developed
Market
at N576.0 (£2.10) per share, making it the first upstream oil and gas company
listed on the NSE. Following this, Caverton Offshore Support Group (Caverton)
listed its 3.35bn shares at N9.30 per share, adding N32bn to the total market
capitalization of the exchange.
Company Listing
Seplat Petroleum Development Company Main Board
Caverton Offshore Support Group Main Board
Omoluabi Savings & Loans Plc ASEM
Vetiva Griffin 30 (VG30) ETF
Stanbic IBTC ETF 30 ETF
Overall, the market for new listings remained relatively unimpressive in 2014 with
only five (5) new equity listings; two (2) on the main board, one (1) on the ASEM,
and two (2) ETFs. The present market sentiment which is expected to be
sustained in H1’15 does not support any market listing or IPO in 2015. Though we
expect to see capital raising exercise by listed companies, a public offer is not
expected.
Valuations: Still attractive among peers
The equities market closed the year as the 2nd worst performer among its peers
with -16.1% y/y return. Negative sentiments and macro headwinds have
depressed valuations to a 3-year low. The market closed the year with a P.E
ratio of 10.95x compared to 14.5x and 14.8x among its African peers and global
market average respectively. We see value in select stocks and find them
attractive at current prices especially for domestic investors with long-term
horizon and zero currency risk.
NSE, United Capital Research
Bloomberg, United Capital Research
Fig. 66
Capital Markets Review and Outlook
The market for new listings
remained relatively unchanged in
2014 with only five (5) new equity
listings; two (2) on the main
board, one (1) on the ASEM

70
17.1 16.87
15.12 15.03 15.03
12.68
10.95
S/Africa Dev. Mkt Egypt Kenya Frontier Mkt EMEs Nigeria
Nigerian market: Too cheap to ignore
P/E Ratios of Select markets
Strides of the NSE in 2014
The NSE signed a capital markets agreement with the LSE Group (LSEG)
to strengthen cooperation and promote mutual development between
the two exchanges. The agreement also supports African companies
seeking dual listings on the Lagos and London bourses.
The NSE completed a study to assess market readiness, the infrastructure
requirements, and sequencing for the launch of risk management
products in the Nigerian capital market.
The NSE unveiled a new set of minimum operating standards for all three
(3) classes of market intermediaries in an effort to develop sustainability
and augment protection for investors and stakeholders. The deadline for
complying with the standards was December 31, 2014. The Exchange
has since announced the Minimum Standards Implementation Plan,
which kicks off with inspections of all market intermediaries in April 2015.
The NSE launched direct market access (DMA) as a first step to the
implementation of sponsored access under the West African Capital
Markets Integration (WACMI) program, thereby giving global investors
more control over final execution of their orders, as well as the ability to
exploit price and liquidity opportunities.
NSE, United Capital Research
Fig. 67
Capital Markets Review and Outlook

71
7.9%
65.6% 74.7%
-16.3%
-4.5%
-50%
-10%
30%
70%
1999 2001 2003 2005 2007 2009 2011 2013 2015F
The NSE was admitted to full membership in the World Federation of
Exchanges.
The NSE, in partnership with the Convention on Business Integrity (CBI),
launched the Corporate Governance Rating System (CGRS). The CGRS
is designed to rate companies listed on the Exchange based on their
corporate governance practices, thereby improving the overall
perception of and trust in Nigeria's capital market.
The Exchange launched an on-line whistle blowing portal, X-Whistle, for
the secure and effective submission of tips and referrals regarding
violations of the rules, regulations and laws of the Nigerian capital
market by listed companies and market intermediaries.
NSE Moves to achieve Emerging market status
The NSE in 2014 took remarkable moves to deepen the market, enhance global
visibility and improve the market. The NSE’s focus from 2011 to 2013 has been on
revamping corporate governance, improving human capacity, cleansing and
restructuring the market, improving technology, product development and
advocacy for changes to policy. The management of the NSE has recently
shifted gear in 2014 with focus on driving innovation centered on increasing
global visibility for the capital market; developing a larger footprint on the
African continent and targeting emerging market status.
Equities in election years: Can history repeat itself?
The market will not be all doom
and gloom in 2015
NSE, United Capital Research
Equities Market returns 1999 – 2015F Fig. 68
Capital Markets Review and Outlook

72
A trend analysis of the market direction during election in the last 15 years
revealed stellar performance by the market in 2003 and 2007, and a negative
performance in 2011. We think the impressive performance of the market in
2003 and 2007 can be traced to the relatively higher predictability of election
results in those years as the ruling party (PDP) still had a firm grip on the political
landscape with no strong opposition on a national level. However, the tide
changed from 2011 election on the back of a more robust opposition, ethnic
interest and heightened security challenges. This tide has gotten deeper as we
roll into the 2015 general elections. We therefore expect a weak sentiment in
the market for H1’15 and a better outlook for H2’15. The equities market will not
be all doom and gloom in 2015.
Expected market Returns in 2015: a closer look at our Crystal Ball
The equities market in 2015 will be shaped by key global and domestic factors,
ranging from;
Interest rate hike in the US and UK.
Falling oil prices
Exchange rate instability and possibility of further devaluation of the
Naira
Effect of falling oil prices on government finance, expenditure and
consumption and the ripple effect on company’s earnings
Effect of the CBN;s tightening stance on banks’ performance and
earnings
Pass-through effects of devaluation of cost of imports and inflation
Bearish sentiment
Attractive pricing and dividend yield
Given the dominance of foreign investors in the equities market, the impact of a
capital flight from frontier and emerging markets on the back of interest rate
hike in the US and UK will have a significant impact on the market. The
benchmark rate which have been at a low of 0.25% since 2009 coupled with
liquidity boost from Quantitative easing drove capital flows into emerging and
frontier markets. A hike in interest rate by the US Fed coupled with impressive
numbers in the US which could lead to a better performing US equities market
would lead to capital flight and also reduce inflow into Nigerian equities. The UK
which has considerable interest in the Nigerian equities market, is also expected
to raise its interest rates from 0.5% to 0.75% in Q3’15 according to the British
Chambers of Commerce. We expect this rate hike to also spur fund reversals to
the UK.
A trend analysis of the market
direction during election in the
last 15 years revealed stellar
performance by the market in
2003 and 2007, and a negative
performance in 2011
Capital Markets Review and Outlook

73
0
20
40
60
80
100
120
140
160
0
10,000
20,000
30,000
40,000
50,000
60,000
70,000
Oc
t-03
Ap
r-04
Oc
t-04
Ap
r-05
Oc
t-05
Ap
r-06
Oc
t-06
Ap
r-07
Oc
t-07
Ap
r-08
Oc
t-08
Ap
r-09
Oc
t-09
Ap
r-10
Oc
t-10
Ap
r-11
Oc
t-11
Ap
r-12
Oc
t-12
Ap
r-13
Oc
t-13
Ap
r-14
Oc
t-14
10- year movement in ASI and Brent Crude
NGSE ASI Brent Crude
The possibility of a further devaluation in the Naira and bleak outlook for
exchange rate will weigh heavily on foreign investors’ interest in the equities
market, limiting foreign inflows.
We have anchored our forecast of the performance of the Nigerian stock
market in 2015 on the trajectory of oil prices and by extension, the Naira. Given
that we are yet to see considerable traction in domestic participation on the
bourse, we believe foreign portfolio flows will continue to dictate the direction
of the market.
In the last 10 years, 2014 had been the year with the strongest correlation
readings between Brent crude and Nigerian All Share Index after a series of
distortions occasioned by major reforms in the Nigerian banking industry. (See
chart 69 below). It is easy for us to see the likelihood of a repeat performance of
the co-movement of the ASI and global oil price in 2015, but we have also
adjusted our forecasts to reflect political uncertainties that drove equity prices in
2014. Our base case expectation for oil prices remains $55-60 p/b on average in
2015.
We have also modeled the reactionary impact of exchange rate on FPI, as well
as the expectation of a tighter monetary policy environment which will
Banking
reforms
We have anchored our forecast of
the performance of the Nigerian
stock market in 2015 on the
trajectory of oil prices and by
extension, the Naira
Bloomberg, United Capital Research
Fig. 69
Capital Markets Review and Outlook
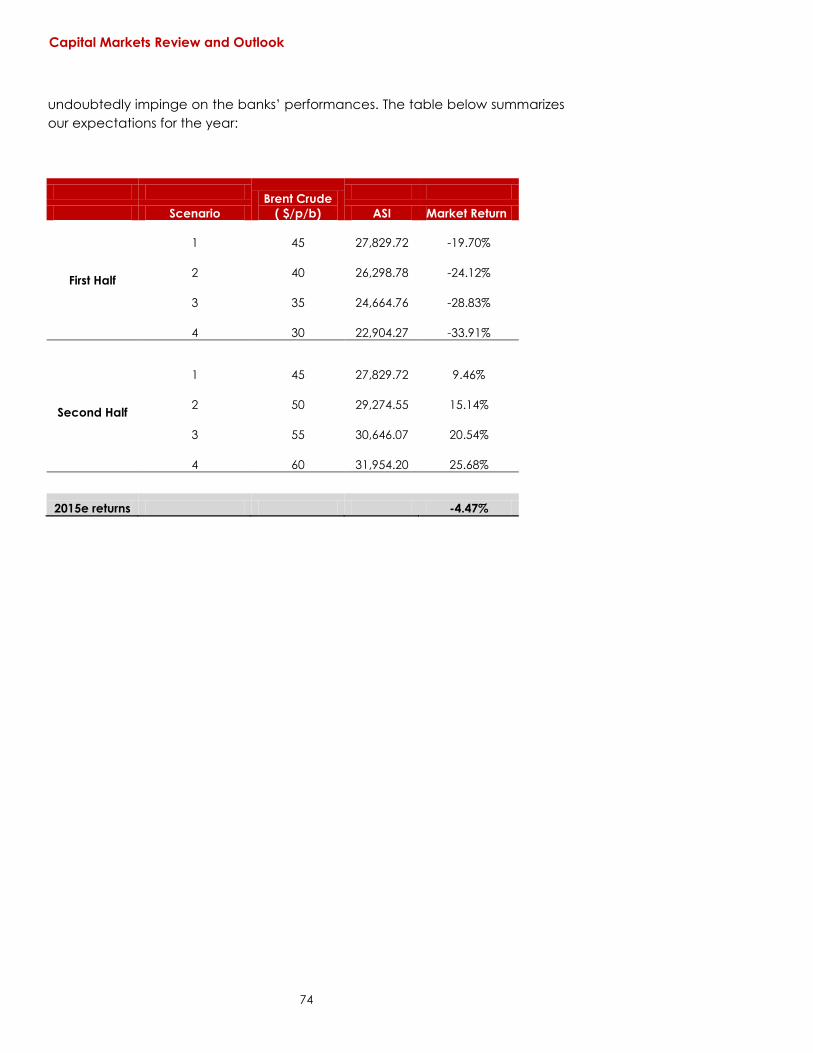
74
undoubtedly impinge on the banks’ performances. The table below summarizes
our expectations for the year:
Brent Crude
( $/p/b)
Scenario ASI Market Return
First Half
1 45
27,829.72 -19.70%
2 40
26,298.78 -24.12%
3 35
24,664.76 -28.83%
4 30
22,904.27 -33.91%
Second Half
1 45
27,829.72 9.46%
2 50
29,274.55 15.14%
3 55
30,646.07 20.54%
4 60
31,954.20 25.68%
2015e returns -4.47%
Capital Markets Review and Outlook

75
Section 6
Sector Reviews and Recommendations

Banking Sector
76
12.13%
1.95%
8.56%
1.25%
-4.24% -4.20%
5.59% 4.50%
6.50%
-6%
-4%
-2%
0%
2%
4%
6%
8%
10%
12%
14%
Q1 2013 Q2 2013 Q3 2103 Q4 2013 Q1 2014 Q2 2014 Q3 2104 FY 2014e 2015
Deposit growth remains weak
Nigerian banks' quarterly deposit growth, 2013-2014
BANKING SECTOR
Nigerian banks: Little progress in a year of many changes
Nigerian banks have had to operate under a fast changing regulatory
environment within the last two years, with 2014 marking a strategic shift in
supervision landscape. The attendant pressure on the lenders’ earnings
generating capacity significantly shaped sentiments around banking counters
during the year, leading to heightened returns volatility relative to 2013. The
year started with the guidelines by the banks to comply with the full Basel II
approach. This incited a flurry of capital raising exercises and dented the
prospects of dividend payment by the banks. The numerous policy
pronouncements during the year was capped with the bold tightening move
by the CBN via the hike in Cash Reserve Ratio (CRR) on private sector deposit to
20% and an 100bps increase in MPR to 13% in the last quarter of the year.
Although short term earnings visibility appears distorted for Nigerian lenders, we
continue to expect that the resilience of the sector in the face of numerous
opportunities in the economy will lead to modest growth in deposits and risk
assets in the medium to long term.
Navigating the rough patch of rate hikes
As at H1’14, Nigerian banks had already adjusted to the CRR hike in the
public/private sector deposit, especially the tier 2 banks which showed more
resilience. Banks aggressively drove their retail deposit strategy which helped in
stabilizing Net Interest Margin (NIMs), though cost of funds inched up by 20bps
to 4% in this period. However, we expect that the 500bps hike in CRR on private
Banks’ Financials, United Capital Research
Although short term earnings
visibility appears distorted for
Nigerian lenders, we continue to
believe in the resilience of the
sector
Banks that have grown non-
interest income contribution to
total earnings will be less
impacted by the hike in CRR
Fig. 70

Banking Sector
77
sector deposit to 20.0% will put the banks in a tough operating environment in
2015 having sterilized an additional N450.0bn of banks’ deposit liabilities which
implies a cumulative debit of c.N4.3trn with the CBN. This in our opinion will
hamper the income generating capacity of the banks and also dip liquidity
ratio to about 36%-38% level, further affecting banks’ capacity to create risk
assets. We expect an 8.1% decline in bank’s gross earnings going into H1’15.
Loan Growth should moderate to 10% in 2015
We have cut our 2015 loan growth forecast for our coverage banks from 15% to
10% (versus 12.8% as at Q3’ ’14), to reflect the recent rate hike and the possibility
of further tightening in 2015. We however expect the current capital injections
from Eurobond and Rights Issues to continue to drive loan growth across our
coverage banks as lending opportunities continue to unfold post 2015 elections.
We expect loan growth in FY’14 to remain largely flat at Q3’14 levels even as we
expect to see a rise in cost of funds across the board though with less impact in
the Tier 1 names due to economies of scale and access to less expensive
deposit. The rise in Cost of funds and the idle cash with the CBN will continue to
pressure NIMs in 2015.
2015 Earnings on a Quandary
Higher liquidity constraint and lower loan growth will pressure earnings of the
banks as assets reduce. The impact is expected to be most felt by the Tier 1
names due to the volume of deposit to be sterilized but a few of them with
sufficient liquidity cushion should be less impacted. Also, banks that have shown
20% 22%
18% 17%
15%
29%
18% 18% 17.30% 16.20%
0%
5%
10%
15%
20%
25%
30%
35%
Q4 2012 Q1 2013 Q2 2013 Q3 2103 Q4 2013 Q1 2014 Q2 2014 Q3 2104 FY 2014e 2015
Earnings remain pressured on higher funding costs
Nigerian banks' annualised ROEs, 2013-2015e
Banks’ Financials, United Capital Research
We have cut our 2015 loan
growth forecast for our
coverage banks from 15% to
10% (versus 12.8% as at Q3’ ’14),
The 500bps hike in CRR on
private sector deposit to 20%
will put the banks in a tough
operating environment in 2015
Fig. 71

Banking Sector
78
0.98%
5.45% 5.56%
8.78%
4.12%
2.26%
6.01% 6.00%
9.80%
0%
2%
4%
6%
8%
10%
12%
Q1 2013 Q2 2013 Q3 2103 Q4 2013 Q1 2014 Q2 2014 Q3 2104 FY 2014e 2015
Loan growth to remain muted at FY '14
Nigerian banks' quarterly loan growth, 2013-2014
strong growth in non-interest income contribution to total earnings will be less hit
by the hike in CRR. We have therefore revised our coverage banks’ gross
earnings growth forecast for FY’15 to 12% driven by a weak loan growth, higher
cost of funds and strain on margins. We also cut our dividend payout
expectations across our coverage as we expect the banks will retain more
earnings to manage liquidity in the face of the tight monetary stance.
Oil Price Declines: Measured impact on currency obligations
Nigerian banks’ total exposure to the oil and gas sector has averaged 23.1% in
the last four years (Vs. 13.2% between 2007 and 2011). With a high oil price
regime and rising indigenous participation in IOCs’ divestment activities,
Nigerian banks have shown increasing appetite for financing oil and gas
projects especially those in the upstream segment. In the last two years,
exposures have peaked to 24.0% of industry risk asset portfolio. We think the
recent declines in oil prices have taken a huge bite off banks’ ability to grow
loan books in 2015, as most oil and gas projects especially upstream, which
often accounts for more than half of banks’ total oil and gas exposure, become
unprofitable at sub-$70p/b oil prices.
On another note, existing significant FCY asset liability mismatch will necessitate
restructuring and repricing which could come at an additional cost to the banks
with a negative impact on margins. A quick look at our coverage names (see
chart 73 below) reveals that FBN, Fidelity, FCMB, Stanbic, Skye Bank and
Guaranty have net FCY funding gaps that are quite significant relative to their
shareholders funds. This also exposes their NIMs to further currency devaluation
within the year.
Banks’ Financials, United Capital Research
Banks’ Financials, United Capital Research
We also cut dividend payout as
we expect the banks will retain
more earnings to manage
liquidity in the face of the tight
monetary stance
Nigerian banks’ total exposure
to the oil and gas sector has
averaged 23.1% in the last four
years (Vs. 13.2% between 2007
and 2011).
Banks’ Financials, United Capital Research
Fig. 72

Banking Sector
79
53.4% 47.5% 30.8%
50.4% 45.9% 46.0% 52.1% 57.8% 55.7% 45.2% 52.7%
46.6% 52.5% 69.2%
49.6% 54.1% 54.0% 47.9% 42.2% 44.3% 54.8% 47.3%
0%
20%
40%
60%
80%
100%
FirstBank Zenith UBA GTBank Access Diamond Skye Fidelity FCMB Sterling Stanbic
Nigerian banks have significant net FCY funding liabilities
FCY Exposures (Assets Vs. liabilities)
FCY loans FCY Deposits
-51.7% -46.0%
-39.8% -39.5% -32.8% -32.5% -31.3%
-24.1% -21.3%
-11.7% -6.8%
1.6%
14.7%
26.5%
-60%
-40%
-20%
0%
20%
40%
YTD Performances of Nigerian banking stocks, 2014
Also, the persistent fall in oil prices which is expected to be sustained in H1’15
may result in reluctance by foreign banks to extend credit lines to Nigerian
banks; Credit lines by foreign banks to Nigerian banks have always been
strongly correlated with oil prices. Banks will therefore be faced with the
challenge of managing short term foreign currency obligations.
Market Performance and Outlook
The sector ended the year with only two stocks trading higher relative to their
respective closing prices in 2013, as persistent regulatory guidelines and policies
instigated negative sentiment towards the banks. The banking sector returned -
33.3% in 2014 with the biggest loss in ACCESS (-31.3%) while STANBIC (26.5%), ETI
(14.7%) and STERLNBANK (1.6%) were the only three stocks to close the year
positive. We anticipate more policies will be instituted to regulate operations,
whilst we also envisage the relaxation of some to offset the expected
restrictions. As such our expectations for the sector in 2015 are tempered,
though we estimate that downside risks are overpriced, creating significant long
term opportunities at current prices.
The sector ended the year with
only two stocks trading higher
relative to their respective
closing prices in 2013
Fig. 73
Fig. 74
Banks’ Financials, United Capital Research

Banking Sector
80
0.6
0.8
1.0
1.2
Jan-14 Mar-14 May-14 Jul-14 Sep-14 Nov-14
Sector Performance Vs ASI
Banking Index NSE ASI
Sector Coverage Names: BANKING
Name Mkt Cap (NGN) Liquidty
Price*
ACCESS 6.75 154,459.7 136,083,754.1 1.05 1.67 6.4 4.0 0.59 0.58 17.6 17.4 9.92 47% BUY
GUARANTY 26.07 767,270.8 508,974,884.8 2.97 2.42 8.8 10.8 2.27 2.24 26.9 26.4 30.29 16% HOLD
FBN 9.00 293,688.8 286,421,448.5 1.93 1.82 4.7 4.9 0.60 0.60 14.4 15.7 13.59 51% BUY
ZENITH 19.00 596,533.4 426,801,533.5 2.96 2.41 6.4 7.9 1.14 1.07 19.2 18.2 26.70 41% BUY
ETI 18.0 406,135.7 144,575,187.4 1.82 2.50 9.9 7.2 1.12 1.10 19.4 15.3 23.11 28% BUY
SKYE 2.80 37,014.1 22,137,868.0 1.08 0.90 2.6 3.1 0.32 0.32 13.0 11.7 3.90 39% BUY
FCMB 2.66 52,675.2 47,965,661.8 0.88 0.77 3.0 3.5 0.35 0.34 11.8 12.5 3.07 15% HOLD
DIAMOND 5.42 78,455.8 78,667,870.0 1.98 1.49 2.7 3.6 0.51 0.51 17.2 17.5 6.24 15% HOLD
FIDELITY 1.69 48,967.4 22,222,530.6 0.27 0.39 6.2 4.4 0.29 0.29 4.8 7.9 2.11 25% BUY
STERLING 2.42 52,254.6 33,527,880.3 0.48 0.44 5.1 5.5 0.80 0.78 18.1 15.5 1.91 -21% SELL
STANBIC 28.0 280,000.0 62,245,340.6 3.00 2.69 9.3 10.4 2.65 2.61 21.0 26.7 24.10 -14% SELL
* Prices as at Dec 31, 2014
Million Trailing 2014e
Daily Val.
Traded Trailing
Upside/
Downside Rating
EPS
Target
Price2014e2014e Current 2014e Current
P/BVP/E (x) ROE (%)
Recommendations
Fig. 75
NSE, United Capital Research
Banks’ Financials, United Capital Research

Insurance Sector
81
414.8
87.6 76.3 56.5
10.9 34.3 30.1 21.7
0%
3%
6%
9%
0
90
180
270
360
450
Namibia Morocco Tunisia Angola Nigeria Algeria Kenya Egypt
Nigeria's Insurance Penetration one of the lowest globally
Insurance pentration and density in select African Counties
Density (LHS) Pentration (RHS)
INSURANCE SECTOR
The Untapped Gold Mine
Nigeria remains a huge potential market for insurance business in Africa. The
under penetration story is glaringly a strong investment case for the country’s
largely undeveloped risk market. By sheer demographic advantages and
current economic size, Nigeria can undoubtedly be described as holding the
biggest potential in insurance business in Africa.
In spite of lingering challenges, the Nigerian Insurance Industry has witnessed
appreciable progress in the last decade most of which was regulation driven as
market participants are yet to fully exploit the inherent potential in the industry,
in our view, however, opportunities still abound in this space. Our core
investment case for the sector is that growth will continue to be driven by
Nigeria’s attractive demographics, government reforms and increase in
business activities in the country. We continue to believe this sector portends a
wide array of opportunities given the very low insurance penetration rate
compared to other countries.
Industry Growth: Riding on Reform Initiatives
In the face of challenges facing the industry, past and current reforms by
NAICOM have given hope, as the sector begins a bumpy ride to a positive
change. Various initiatives by NAICOM and hunger for increased market share
by insurance companies pegged the industry gross premium at N105.5bn in
Q3’14, implying c.6% increase from N99.6bn posted in Q3’13. In the same vein,
PAT rose by c.40% to N14.7bn from N10.5bn recorded in corresponding period of
previous year just as return on equity (ROE) and return on asset (ROA) surged,
SwissRe, United Capital Research
Various initiatives by NAICOM
and hunger for market share by
insurance companies pegged
the industry gross premium at
N105.5bn in Q3’14
By sheer demographic
advantages and current
economic size, Nigeria can be
undoubtedly described as
holding the biggest potential in
insurance business in Africa.
Fig. 76

Insurance Sector
82
albeit marginally by 1.6% and 0.7% y/y respectively. According to NAICOM, an
annual growth of 17% in gross premium earned was recorded between 2009
and 2013 even as the industry regulator expects this to double within 3–5 years.
Much as we believe the industry has huge potential for growth, we are not
overly optimistic in the short term, given that the sector was unable to achieve
the target of N1trn set by NAICOM between 2008 and 2012 (achieved N234bn)
in its Market Development and Restructuring Initiative (MDRI) project. Also, our
discussions with industry players revealed that the N6trn objective by 2020
appears bullish and unrealistic. Notwithstanding, we expect the sector’s growth
trajectory to expand in the coming years, a position governed by the various
actions of the players to expand their balance sheet size through mergers and
acquisitions and rights issue. This will avail them the opportunity to underwrite
“big ticket” transactions as insurers cannot expose more than 5% of their net
assets (shareholders’ fund) to such transactions as required by the guideline on
Oil and Gas insurance by NAICOM. This said, the recent risk-based supervision
by NAICOM which was developed to ensure that insurance companies only
underwrite insurance contracts which their assets can support will make
insurance companies to further expand their balance sheet.
Weak Demand for Insurance: Public Apathy or Public Poverty?
Fundamentally, the demand for Insurance as an economic product thrives on
the purchasing power of the consumer. While opportunities for premium
expansion on the corporate side rests significantly on domestic economic size,
life insurance products and to a sizeable extent, general insurance is
strategically linked to an individual’s living standards. In our view, the perception
of insurance by Nigerians is distorted by their economic power.
A panel review of per capita incomes stacked against insurance premiums
across emerging markets suggests that there is a strong positive correlation
between per capita income and gross premium incomes across countries (see
chart 77)
Based on the foregoing, we argue that there is little evidence to support the
notion that there is public apathy towards insurance services; rather we believe
the low standard of living and longstanding income inequality remain key drags
for the industry.
We argue that there is little
evidence to support the notion
that there is public apathy
towards insurance services
According to NAICOM, an
annual growth of 17% in gross
premium earned was recorded
between 2009 and 2013 even as
the industry regulator expects
this to double within 3–5 years

Insurance Sector
83
United Kingdom
France Germany
Italy
Netherlands
Brazil
Spain
India
South Africa
Russia Mexico
Indonesia
Argentina Turkey
Morocco
Nigeria
Egypt
Kenya
Algeria
Angola
Namibia Tunisia Mauritius
R² = 0.7123
-
10,000
20,000
30,000
40,000
50,000
60,000
- 50,000 100,000 150,000 200,000 250,000 300,000 350,000
Per capita income shows high correlation with Insurance Penetration
Gross Premium Income and Per capital income of select countries
The “Rising” Middle Class: Can they come to the rescue?
Anecdotal evidence suggests that there is a bourgeoning middle class in
Nigeria and indeed, the broader emerging market space, with the potential to
foster economic growth across different sectors and push the weak demand for
insurance products. By nature, the middle class is seen as a predominantly
young active population with upward mobility in income, consumption, and
purchasing power. We note that there has been a consistent upward trajectory
in real per capita income (PCI) in Nigeria. Although statistics on income
distribution is limited, the upward swing in income per head can be a lagging
indicator of middle income growth. That said, it is pertinent to find a nexus
between middle income expansion and demand for insurance services in
Nigeria. Nigeria’s geographical advantage of fewer records of natural disasters
coupled with her citizens’ subconscious mindset of optimism makes a case for
close linkage between PCI and GPI difficult to accept, at least from a time
series perspective.
We believe the expansion in middle class creates opportunities for highly
innovative insurers to take advantage of changing lifestyle, consumption
patterns and social dynamics of a new generation of spenders. We believe that
to capture a substantial share of this insurable market, innovation and
Nigeria
Premium (US$m)
PCI ($)
IMF, Swiss Re, United Capital Research
We believe the expansion in
middle class creates
opportunities for highly
innovative insurers
Fig. 77

Insurance Sector
84
adaptability will be very critical. However, Nigerian insurers are offering too little
in this regard.
NAICOM: Pushing the frontiers of market expansion…
National Insurance Commission (NAICOM) which was established in 1997 with
the responsibility of regulating and supervising Insurance business in Nigeria has
made some remarkable contributions to shaping the Insurance industry.
However, the regulator’s intent to solidify the sector’s configuration has led to
new regulatory measures such as recapitalization regulation, and premium
expansion programs via the Market Development and Restructuring Initiatives
(MDRI) and the “No Premium No Cover” policy as well as the adoption of IFRS
reporting style and guidelines on Micro and takaful Insurance.
In 2014, the Regulator continued the enforcement of the No Premium No Cover
policy which commenced in 2013, stating that no valid Insurance contract can
exist without the receipt of an Insurance premium. Prior to enforcement of this
premium, Insurers were holding a large chunk of receivables in their balance
sheet, increasing the credit risk of Insurers and of their capacity to meet
obligation coupled with inability to invest these premium and generate income.
The enforcement of this policy has helped boost profitability of Insurers and the
confidence of the public. It has also helped in managing cash flows, thereby
improving balance sheet quality. We estimate that the enforcement of this
policy boosted insurers’ premium generation by 10-15% in 2014.
…but bargaining power is still in the hands of the brokers
About 90% of corporate business for Insurance companies is generated by
brokers/agents, and with over 2400 brokers/agents servicing 48 Insurers and 2 re-
insurers, it is not surprising to see the brokers/agents having a strong bargaining
power. Given the nature of Insurance in Nigeria, where demand for Insurance is
driven marginally by corporate entities relative to private individuals, the
brokers/agents hold a strong force in the Industry. This unhealthy dominance
leads to late remittance and sometimes non-remittance of premium.
Consolidation, M&A’s expected in the Short to medium term
The rich fundamentals of the Nigerian industry continue to endear it to foreign
investors who are looking for exposure to Nigeria’s massive growth markets and
a profitable haven for investible funds in Africa and other emerging economies.
The capital requirement of entry into the Insurance business (N2bn, N3bn, N5bn
and N10bn for life, non-life, composite and re-insurance respectively) makes it
easy for foreign players to gain entry into the Industry though NAICOM’s current
We estimate that the
enforcement of the No Premium
No Cover policy boosted
insurers’ premium generation by
10-12% in 2014.
The rich fundamentals of the
Nigerian industry continue to
endear it to foreign investors
who are looking for exposure to
Nigeria’s massive growth
markets
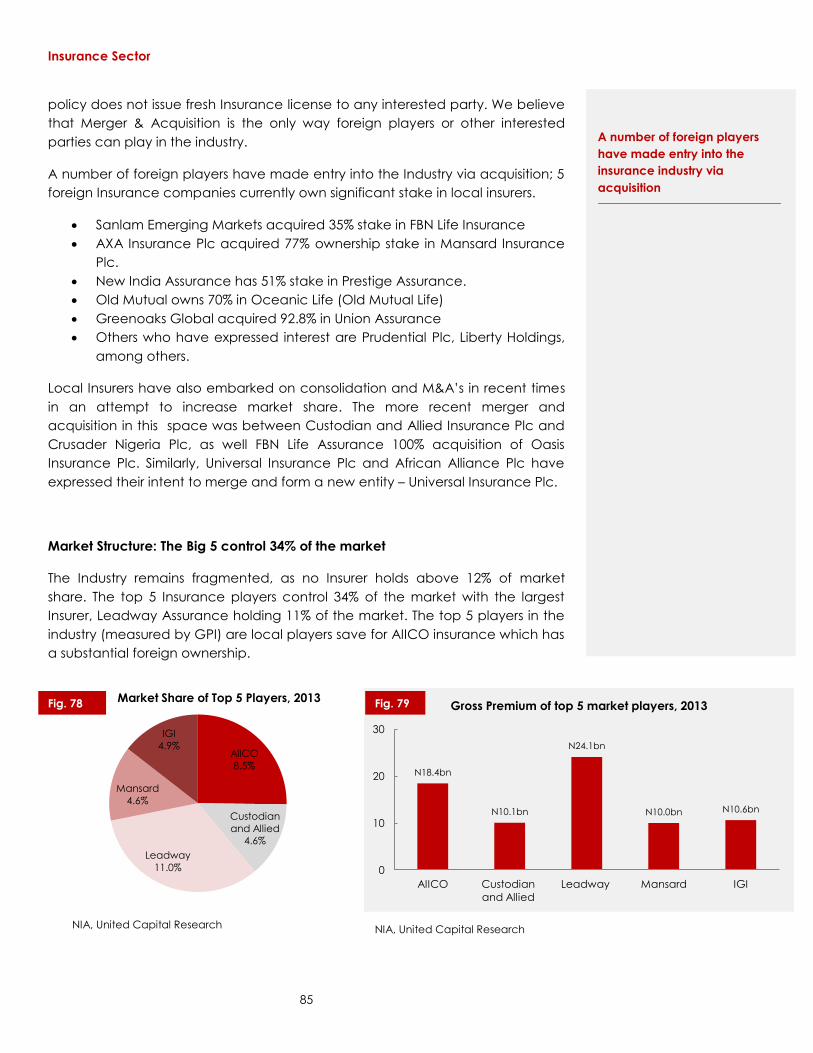
Insurance Sector
85
AIICO
8.5%
Custodian
and Allied
4.6%
Leadway
11.0%
Mansard
4.6%
IGI
4.9%
Market Share of Top 5 Players, 2013
N18.4bn
N10.1bn
N24.1bn
N10.0bn N10.6bn
0
10
20
30
AIICO Custodian
and Allied
Leadway Mansard IGI
Gross Premium of top 5 market players, 2013
policy does not issue fresh Insurance license to any interested party. We believe
that Merger & Acquisition is the only way foreign players or other interested
parties can play in the industry.
A number of foreign players have made entry into the Industry via acquisition; 5
foreign Insurance companies currently own significant stake in local insurers.
Sanlam Emerging Markets acquired 35% stake in FBN Life Insurance
AXA Insurance Plc acquired 77% ownership stake in Mansard Insurance
Plc.
New India Assurance has 51% stake in Prestige Assurance.
Old Mutual owns 70% in Oceanic Life (Old Mutual Life)
Greenoaks Global acquired 92.8% in Union Assurance
Others who have expressed interest are Prudential Plc, Liberty Holdings,
among others.
Local Insurers have also embarked on consolidation and M&A’s in recent times
in an attempt to increase market share. The more recent merger and
acquisition in this space was between Custodian and Allied Insurance Plc and
Crusader Nigeria Plc, as well FBN Life Assurance 100% acquisition of Oasis
Insurance Plc. Similarly, Universal Insurance Plc and African Alliance Plc have
expressed their intent to merge and form a new entity – Universal Insurance Plc.
Market Structure: The Big 5 control 34% of the market
The Industry remains fragmented, as no Insurer holds above 12% of market
share. The top 5 Insurance players control 34% of the market with the largest
Insurer, Leadway Assurance holding 11% of the market. The top 5 players in the
industry (measured by GPI) are local players save for AIICO insurance which has
a substantial foreign ownership.
NIA, United Capital Research NIA, United Capital Research
A number of foreign players
have made entry into the
insurance industry via
acquisition
Fig. 78 Fig. 79

Insurance Sector
86
Motor Insurance to remain a major driver of premium income
We believe that for a long time to come, motor insurance will continue to
account for the biggest share of premium income in the industry. The
compulsory third party insurance enforced by the NAICOM and government
enforcement agencies will continually support premium generation by Insurers.
Also, the increase in the volume of comprehensive insurance policies by
corporate and individuals have been significant in recent years. Looking ahead,
the consumer lease financing and the automotive policy by the federal
government portends opportunities for growth in the Motor insurance segment.
We however note that the market still expects significant improvement in claims
settlements.
Gross Premium Income of Insurers By Class of Business
N'000
Class of Business 2006 2007 2008 2009 2010
Fire 9,817 10,383 15,618 16,536 19,293
as % of total premiums 11.90% 10.30% 10.40% 9.20% 10.40%
Motor 17,108 25,220 38,118 45,215 42,039
as % of total premiums 20.80% 25.10% 25.41% 25.27% 22.63%
General accident 11,945 16,191 22,536 23,912 28,592
as % of total premiums 14.50% 16.10% 14.99% 13.36% 15.39%
Marine and Aviation 7,841 11,256 17,231 16,728 20,097
as % of total premiums 9.50% 11.20% 11.64% 9.35% 10.82%
Workmen's compensation 924 984 720 1,704 903
as % of total premiums 1.10% 1.00% 0.47% 0.95% 0.49%
Oil and Gas 14,907 12,981 17,403 31,577 26,092
as % of total premiums 18.10% 12.90% 11.58% 17.65% 14.05%
Miscellaneous 5,393 7,822 9,137 8,982 8,945
as % of total premiums 6.60% 7.80% 6.07% 5.02% 4.82%
Others 1,612 - - - -
as % of total premiums 2.00% - - - -
Life 12,743 15,783 29,328 34,292 39,761
as % of total premiums 15.50% 15.70% 19.54% 19.17% 21.41%
Total 82,289 100,620 150,090 179,941 185,730
NIA, United Capital Research

Insurance Sector
87
Industry Outlook: 2014 and beyond
Opportunities abound in the Insurance Industry
Our outlook for the industry is positive in the medium to long term. We believe
there are opportunities yet untapped for growth as penetration rate is expected
to inch higher in the next 4 years. Should penetration rate meet the average
emerging market rate of 2.7% in 2019, gross premiums should rise to a high of
N2.9trn (US$17.6bn) over this period. In our view, the possible drivers of this
growth are:
Credit Facilities: The recent influx of consumer and retail credit and the
prospect for more growth in that space given the growing number of
working and middle class Nigerians as well as the drive by banks and
other finance institutions to penetrate this space, will help support the
Insurance sector. Typically insurance products accompany some
consumer loans such as mortgage and car loan.
Nigeria’s Attractive Demography: The high rate of urbanization and the
rising middle class portends prospects for the Insurance Industry. This
effect of this will be high demand for Insurable products like car, home,
personal items, as well as Life Insurance.
Regulation and Enforcement: NAICOM’ efforts at boosting confidence in
the sector and supporting growth via regulatory policies will continue to
shape the sector. The regulator has also shown its drive to grow the
insurance sector by enacting new laws and ensuring stricter
enforcement of existing ones. We expect to see more policies and
support from NAICOM in the future to support sector growth.
Innovative Solutions and Micro Insurance: Given the poor penetration of
insurance products relative to the population, we expect insurers to
come up with increasingly novel ways to grab a share of the vastly
untapped market. We expect insurers to leverage on technology in their
bid to increase insurance penetration and make the insurance
experience more convenient for the customer. Examples of such
innovative solutions include MTN 'Y'ello cover' in collaboration with
Mansard Insurance, Airtel's 'Padi 4 Life' in collaboration with FBN Life
Assurance as well as the development of mobile insurance apps for
quick and convenient insurance transactions
Should penetration rate meet
the average emerging market
rate of 2.7% in 2019, gross
premiums should high N2.9trn
(US$17.6bn) over this period

Insurance Sector
88
Insurance co. OPEX Margin Net Margin Underwriting Margin Claims Ratio Expense ratio Reinsurance Rate Return on Invst. Assets Investment Assets/Total Assets Current Ratio Net working Capital Ratio
AIICO 47.7% 4.1% 15.0% 37.2% 47.7% 21.8% 9.4% 65.5% 1188.8% 336.6%
ARM Life 131.9% -109.3% -46.0% 141.8% 131.9% 15.3% 11.9% 52.6% 136.0% 71.6%
CHI 63.5% -7.7 41.2% 25.3% 63.5% 38.1% 7.0% 41.9% 167.0% 102.6%
Continental Reinsurance 43.0% 13.1% 12.6% 46.9% 43.0% 11.2% 11.8% 54.8% 200.4% 50.0%
Cornerstone 48.9% 32.0% 32.2% 43.1% 48.9% 41.9% 9.1% 58.1% 164.4% 51.4%
Custodian 26.8% 42.8% 127.7% 53.8% 26.8% 55.2% 17.6% 50.1% 144.2% 64.7%
Equity 70.6% -13.6% 50.7% 29.7% 70.6% 21.4% 7.2% 24.5% 156.3% 55.0%
FBN Life 46.4% 11.8% 23.5% 16.9% 46.4% 5.8% 11.6% 94.0% 299.9% 116.3%
Guinea 74.0% 4.1% 101.5% 33.2% 74.0% 9.5% 0.0% 38.2% 296.0% 249.3%
KBL 46.7% 7.3% 17.7% 30.9% 46.7% 20.0% 5.4% 54.7% 251.8% 198.5%
Lasaco 54.0% 7.6% 38.9% 52.1% 54.0% 32.4% 8.6% 42.6% 149.1% 48.0%
Law Union 63.9% 16.4% 56.1% 25.2% 63.9% 21.6% 9.0% 42.4% 169.2% 67.8%
Leadway 19.2% 21.4% 40.0% 48.3% 19.2% 42.8% 5.4% 64.0% 114.6% 28.2%
Linkage 65.3% 26.1% 11.5% 40.7% 65.3% 25.6% 9.0% 87.6% 936.4% 111.9%
Mansard 97.6% 27.8% 32.5% 46.8% 97.6% 39.8% 1.8% 57.6% 184.3% 45.3%
Mutual Benefits 92.0% 8.3% 37.7% 41.8% 92.0% 12.4% 6.9% 51.8% 96.4% 15.0%
NEM 52.3% 5.3% 24.7% 41.4% 52.3% 4.7% 10.6% 64.6% 151.2% 77.3%
Niger 64.6% 6.5% 49.3% 38.6% 64.6% 9.3% 7.5% 25.3% 59.8% 30.5%
Oasis 7.4% -6.9% 60.9% 13.1% 7.4% 17.8% 10.1% 44.7% 305.2% 111.6%
Prestige 43.1% -5.2% -5.9% 65.6% 43.1% 63.0% 4.4% 38.8% 165.2% 55.1%
Regency 42.5% 18.6% 54.1% 27.9% 42.5% 26.9% 7.4% 55.2% 255.6% 142.3%
Royal Exchange 52.6% 15.3% 17.1% 47.3% 52.6% 27.1% 7.4% 26.5% 123.3% 23.9%
STACO 75.5% 9.1% 43.1% 59.8% 75.5% 13.5% 6.1% 29.7% 80.6% 46.1%
Standard Alliance 67.5% -28.5% 32.5% 34.6% 67.5% 18.1% 10.3% 37.0% 195.9% 11.2%
STI 36.5% 8.1% 43.7% 40.7% 36.5% 42.1% 8.6% 34.0% 137.5% 42.6%
UBAMET 57.7% 24.6% -16.4% 62.6% 57.7% 9.8% 12.0% 92.3% 216.8% 54.9%
WAPIC 96.3% -7.8% -4.0% 80.1% 96.3% 28.8% 11.3% 60.3% 330.6% 132.8%
Sector Performance and Returns Expectations
The sector returned 17.6% in 2014 (Vs. 40.5% in 2013) despite generally bearish
sentiments in the Nigerian equities market in the year. The sector’s performance
was boosted by the contribution by it’s the most capitalized stocks, Custody
Insurance and MANSARD as they returned 74.0% and 30.6% respectively. Their
performances were however not unconnected to the business combinations
they witnessed during the year. Notwithstanding the sector’s positive return
performance in 2014, c.67% (20 out of 30 listed companies) of insurance
counters still closed the year at their nominal values reflecting investors’ weak
appetite for insurance counters regardless of the impressive fundamentals of a
few of them. However, we are of the opinion that even if the upside potential
from insurance stocks look unattractive relative to other sectors from absolute
stance, low volatility of returns remains a valid investment case.
Company filings, United Capital Research
Operating statistics of Select Insurance Companies

Insurance Sector
89
74.0%
30.6%
-17.1% -16.7% -13.3% -10.7% -7.4% -5.7% -3.6%
-40%
-20%
0%
20%
40%
60%
80%
CUSTODYINS MANSARD CONTINSURE PRESTIGE NEM CORNERST INTENEGINS ROYALEX AIICO
Return performance of selected insurance stocks in 2014
0.6
0.8
1.0
1.2
Jan-14 Mar-14 May-14 Jul-14 Sep-14 Nov-14
Nigeria Insurance Sector Vs. NSE ASI
Insurance Index NSE ASI
Sector Coverage Names: INSURANCE
Name Mkt Cap (NGN) Liquidty
Price
MANSARD 3.05 30,500.0 27,435,435.6 0.14 0.17 22.0 18.2 2.04 1.97 10.2% 10.8% 2.43 -20% SELL
CUSTODIAN 3.62 21,762.9 12,723,845.9 0.78 0.82 4.6 4.4 1.01 0.93 19.9% 21.2% 5.21 44% BUY
Continental Re 0.99 10,269.0 8,672,983.4 0.17 0.20 5.8 4.9 0.67 0.64 11.8% 13.0% 1.30 22% BUY
* Prices as at Dec 31, 2014
RatingCurrent 2014e Current 2014e
EPS P/E (x) P/BV ROE (%)
Upside/
Downside
Target
Price2014eMillion
Daily Val.
Traded Trailing 2014e Trailing
Source: NBS, United Capital Research
Source: NBS, United Capital Research
Recommendations
Fig. 80
Fig. 81
Source: NBS, United Capital Research

90
0
5,000
10,000
15,000
20,000
25,000
0
5,000
10,000
15,000
20,000
Q2
2010
Q3
2010
Q4
2010
Q1
2011
Q2
2011
Q3
2011
Q4
2011
Q1
2012
Q2
2012
Q3
2012
Q4
2012
Q1
2013
Q2
2013
Q3
2013
Q4
2013
Q1
2014
Consumer Spending in Nigeria; pressured in 2014
Quarterly Aggregate Consumption Expenditure in Nigeria,
2010-2014
Consumer spend( N'bn) Disposable Income
North East
6%
North
Central
13%
North
West
12%
South East
14% South
South
18%
South
West
37%
Geographic Distribution of consumption
spending in Nigeria
CONSUMER GOODS SECTOR
Attractive demographics clogged by operating challenges
The consumer goods sector in Nigeria has been thriving on the back of the
country’s huge mass market and macroeconomic stability. But consumption
expenditure has been slowing. According to the NBS, average household
income spent on food consumption is estimated at 64.7% of the total
expenditure. However, recent pressure on the consumer wallet continues to
reflect in dwindling consumer spend in Nigeria as aggregate consumption
expenditure declined by 0.3% and 11.0% in Q3 ’13 and Q1 ’14 respectively even
as the major consumer names continue to face distribution challenges arising
from security threats in Northern Nigeria, including obstacles along export
routes.
Food and Beverage Sector: Keeping pace with rising demand
The consumption pattern of Nigerians has been historically skewed towards
food compared to non-food item as c.36.0% of Nigeria’s GDP is driven by food
consumption expenditure. Having recorded population-induced growth over
the last 10years, players are now ramping up CAPEX in order to shore up
capacity on the back of growing demand and market. We estimate that the
flour milling subsector in particular has shored up capacity considerably from
22,000MT/day in 2012 to about 25,000MT/day presently. The sugar refining
capacity have also increased significantly from 2.170MMTp/a to 2.920MMTp/a.
Source: NBS, United Capital Research Source: Euro monitor, United Capital Research
Consumption expenditure has
slowed significantly since 2013
Players in the Food and Beverage
sector are ramping up capacity
to meet increasing demand
Fig. 82 Fig. 83
Consumer Goods Sector

91
0.0%
4.0%
8.0%
12.0%
16.0%
2007 2008 2009 2010 2011 2012 2013 2014e 2015f
Strong Growth in Food and Beverage Sector
Food and Beverage Sector Revenue Growth 2007-2015f
Food and Beverage Sector: Cost and Profitability Metrics
2007 2008 2009 2010 2011 2012 2013 2014e 2015f
Cost to Sales 74.7% 76.0% 72.6% 75.0% 77.1% 76.5% 75.4% 74.4% 74.1%
OPEX Margin 10.1% 8.6% 9.4% 10.3% 10.2% 11.0% 11.8% 11.4% 11.2%
EBIT Margin 12.5% 12.5% 14.7% 12.5% 10.5% 10.7% 11.3% 12.6% 13.1%
EBITDA Margin 11.2% 14.3% 14.2% 14.4% 10.9% 11.7% 10.7% 11.3% 12.8%
Net Margin 8.9% 8.5% 9.2% 7.3% 6.5% 7.1% 7.4% 7.6% 8.6%
ROE 25.7% 26.3% 27.4% 22.7% 19.0% 21.0% 22.4% 22.9% 25.4%
ROA 12.2% 11.6% 12.1% 9.5% 7.8% 8.4% 8.7% 8.7% 9.8%
Leverage 2.1x 2.3x 2.4x 2.4x 2.5x 2.5x 2.6x 2.6x 2.6x
Asset Turnover 1.4x 1.4x 1.3x 1.3x 1.2x 1.2x 1.2x 1.1x 1.1x
Companies’ Financials, United Capital Research
Nestle and other players have hinted on plans to invest heavily in boosting its
capacity, Nestle plans to invest N100bn over the next 10yrs to expand capacity
to meet the growing demand for its product in the region.
Elevated Cost Structure remains a serious challenge
The volatile prices of agricultural inputs especially wheat prices remains a serious
challenge for players in this space. Wheat prices globally are usually very
volatile and highly susceptible to internal price movements. These inputs
account for the bulk of flour millers’ revenue (c.90% of turnover). Although
cocoa is locally sourced, prices vary in line with international movement. Players
however enter into some form of futures contract of up to 3 months with
suppliers to hedge against price volatility. However, the recent devaluation of
the Naira coupled with raise in the MPR to 13% will continue to affect
companies in this sector especially those who largely import their raw materials.
Also, cost of borrowing due to interest rate hike and tight liquidity will pose a
major challenge to profitability.
Source: NBS, United Capital Research
The volatile prices of agricultural
inputs especially wheat prices
remains a serious challenge for
players in this sector. Fig. 84
Consumer Goods Sector
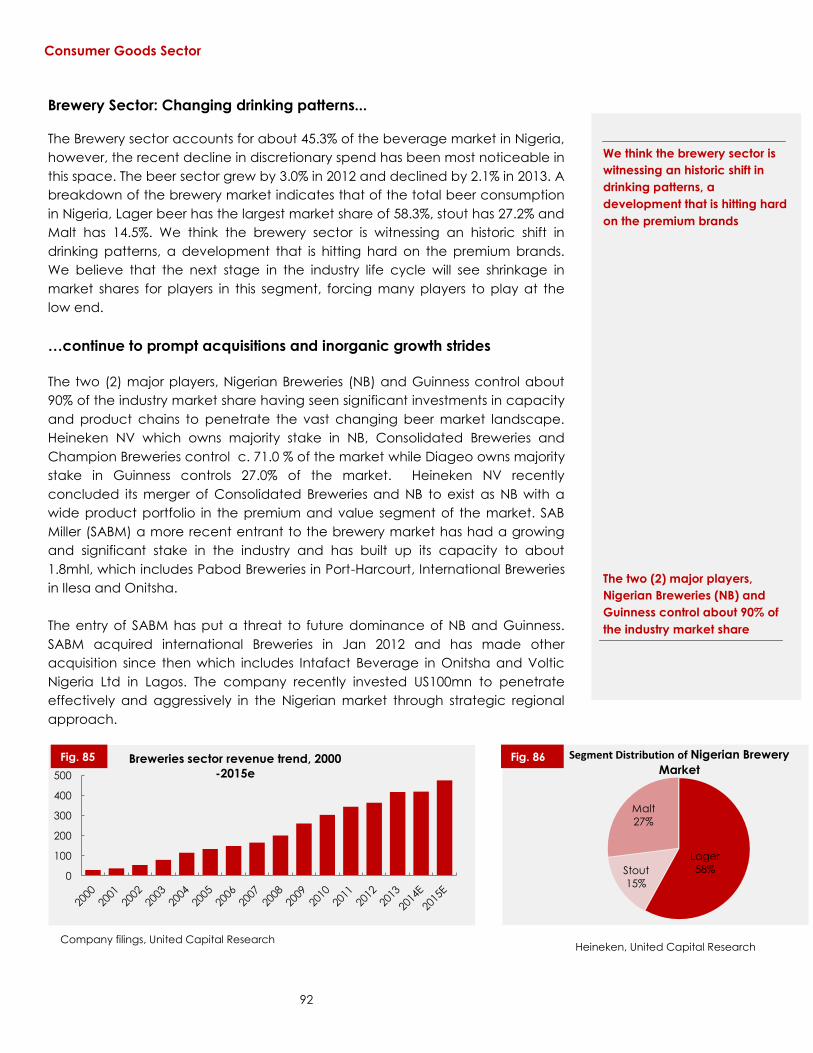
92
Lager
58% Stout
15%
Malt
27%
Segment Distribution of Nigerian Brewery
Market
0
100
200
300
400
500
Breweries sector revenue trend, 2000
-2015e
Brewery Sector: Changing drinking patterns...
The Brewery sector accounts for about 45.3% of the beverage market in Nigeria,
however, the recent decline in discretionary spend has been most noticeable in
this space. The beer sector grew by 3.0% in 2012 and declined by 2.1% in 2013. A
breakdown of the brewery market indicates that of the total beer consumption
in Nigeria, Lager beer has the largest market share of 58.3%, stout has 27.2% and
Malt has 14.5%. We think the brewery sector is witnessing an historic shift in
drinking patterns, a development that is hitting hard on the premium brands.
We believe that the next stage in the industry life cycle will see shrinkage in
market shares for players in this segment, forcing many players to play at the
low end.
…continue to prompt acquisitions and inorganic growth strides
The two (2) major players, Nigerian Breweries (NB) and Guinness control about
90% of the industry market share having seen significant investments in capacity
and product chains to penetrate the vast changing beer market landscape.
Heineken NV which owns majority stake in NB, Consolidated Breweries and
Champion Breweries control c. 71.0 % of the market while Diageo owns majority
stake in Guinness controls 27.0% of the market. Heineken NV recently
concluded its merger of Consolidated Breweries and NB to exist as NB with a
wide product portfolio in the premium and value segment of the market. SAB
Miller (SABM) a more recent entrant to the brewery market has had a growing
and significant stake in the industry and has built up its capacity to about
1.8mhl, which includes Pabod Breweries in Port-Harcourt, International Breweries
in Ilesa and Onitsha.
The entry of SABM has put a threat to future dominance of NB and Guinness.
SABM acquired international Breweries in Jan 2012 and has made other
acquisition since then which includes Intafact Beverage in Onitsha and Voltic
Nigeria Ltd in Lagos. The company recently invested US100mn to penetrate
effectively and aggressively in the Nigerian market through strategic regional
approach.
Company filings, United Capital Research Heineken, United Capital Research
We think the brewery sector is
witnessing an historic shift in
drinking patterns, a
development that is hitting hard
on the premium brands
The two (2) major players,
Nigerian Breweries (NB) and
Guinness control about 90% of
the industry market share
Fig. 85 Fig. 86
Consumer Goods Sector

93
FMCG sector: Striving hard to push sales
The FMCG players, many of whom are net manufacturers, continue to feel the
pinch of tighter credit flows and high operating costs in an era of cautious bank
lending and lingering infrastructural bottlenecks. Given the ongoing distribution
challenges, exercabated by volatile security situation, the route to market for
these players have been rather tortuous. This has been further complicated by
wholesalers’ difficulties in obtaining credits to fund working capital position,
reflecting in pressured liquidity positions for key players.
NESTLE has particularly done well in the face of rising competition from imported
substitutes with largely volume driven growth buoyed by efficient supply chain
management. Also, its highly domesticated input sources have stabilized cost of
production and margins offsetting the impact of increased promotional spend.
PZ on the other hand has struggled to hold on to market share in the face of stiff
competition. Management has frequently attributed the recent weak earnings
performance to security challenges in the North, but we believe wider industry
headwinds from heightened domestic and external competitive pressures are
largely responsible for its continued underperformance especially in the HPC
segment.
Global Brand Subsidiaries Installed Capacity (mhl)
Heineken NV
Nigerian Breweries 15.4
Consolidated Breweries 3.7
Champion Breweries 0.5
Diageo Guinness Nigeria Plc 5.5
SABMILER
International Breweries 1.8
Pabd Breweries Ltd
N/A Intafact Beverages Ltd.
Voltic Nigeria Ltd.
Global Brewers in Nigeria
Heineken, United Capital Research
The FMCG players, many of
whom are net manufacturers,
continue to feel the pinch of
tighter credit flows and high
operating costs
Given the ongoing distribution
challenges, exercabated by
volatile security situation, the
route to market for FMCG
players have been rather
tortuous
Consumer Goods Sector

94
131.7%
33.49%
-1.5% -5.7% -15.69%
-28.8% -32.2% -33.5% -35.7% -45.7% -49.25% -50.44% -55.6%
-100%
-50%
0%
50%
100%
150%
Returns Performances of Selected consumers, YTD 2014
Sector Outlook for 2015 and Beyond
The expectation of a decline in consumer spending in 2015 largely on the back
of recent devaluation of the Naira, as well as lingering security threats remain
key downside risks to the sector in 2015. We estimate that aggregate consumer
spend for 2014 at 65.1% of national disposable income down from 70.1% as at
Q1, 2014, suggesting increased deleveraging by the Nigerian consumer. We
expect to see a shift to necessity as a result as spending and credit conditions
tighten. We would therefore look to pitch our tent with the defensive names in
the sector. That said, we believe new product offerings, product innovation and
capacity expansion will drive the sector’s revenue this year. While we do not
expect a quick recovery in consumer spend in 2015 due to lingering macro
headwinds as well as overall decline in government spending, we continue to
believe Nigeria will remain an increasingly attractive frontier consumer market in
the medium to long term on account of positive developments in
demographics, rapid urbanization and robust growth outlook.
Market Analysis and Returns Expectation
The sector under-performed the market in 2014, returning -17.9% compared to
the market return of -16.1%. The poor performance of the sector was largely
driven by losses of large cap stocks like FLOURMILL (-50.4%), PZ (-35.7%),
UNILEVER (-33.5%), GUINNESS (-28.7%) and NESTLE (-15.7%). The poor sentiment
was swept across all stocks in the sector save for 7UP and UNIONDICON which
appreciated 131.6% and 33.5% y/y respectively.
We estimate that aggregate
consumer spend for 2014 at
65.1% of national disposable
income down from 70.1% as at
Q1, 2014
NSE, United Capital Research
Fig. 87
Consumer Goods Sector
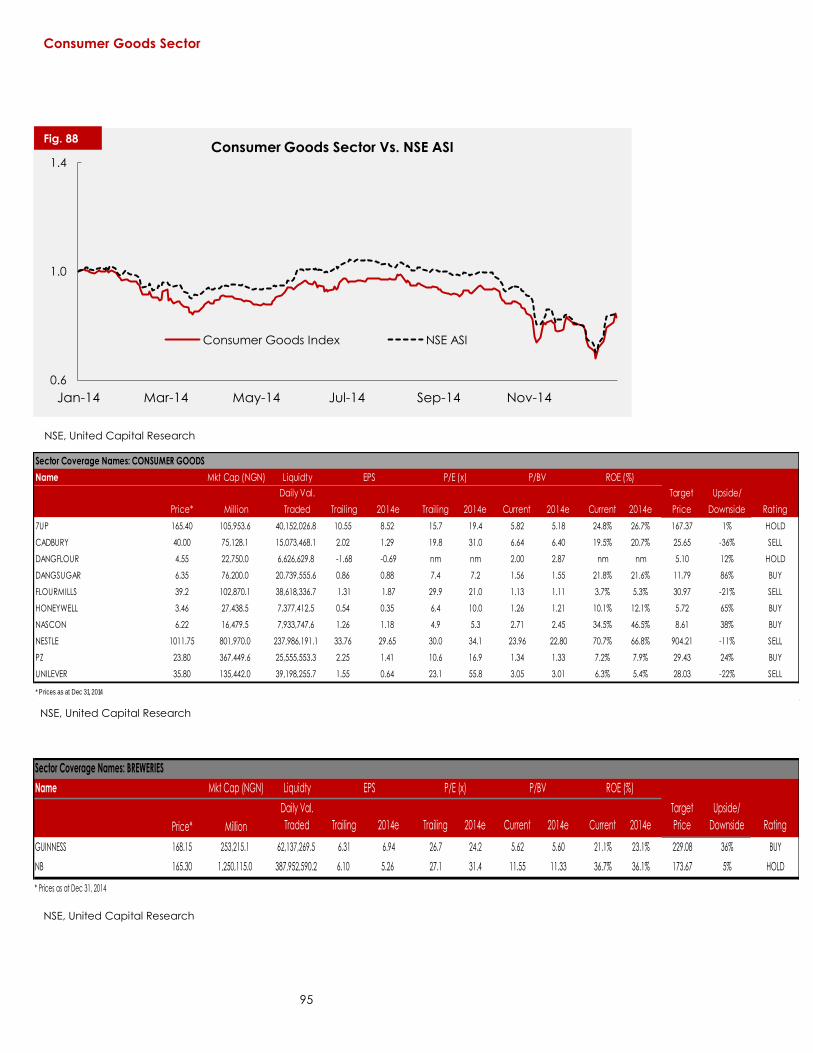
95
0.6
1.0
1.4
Jan-14 Mar-14 May-14 Jul-14 Sep-14 Nov-14
Consumer Goods Sector Vs. NSE ASI
Consumer Goods Index NSE ASI
Sector Coverage Names: CONSUMER GOODS
Name Mkt Cap (NGN) Liquidty
Price*
7UP 165.40 105,953.6 40,152,026.8 10.55 8.52 15.7 19.4 5.82 5.18 24.8% 26.7% 167.37 1% HOLD
CADBURY 40.00 75,128.1 15,073,468.1 2.02 1.29 19.8 31.0 6.64 6.40 19.5% 20.7% 25.65 -36% SELL
DANGFLOUR 4.55 22,750.0 6,626,629.8 -1.68 -0.69 nm nm 2.00 2.87 nm nm 5.10 12% HOLD
DANGSUGAR 6.35 76,200.0 20,739,555.6 0.86 0.88 7.4 7.2 1.56 1.55 21.8% 21.6% 11.79 86% BUY
FLOURMILLS 39.2 102,870.1 38,618,336.7 1.31 1.87 29.9 21.0 1.13 1.11 3.7% 5.3% 30.97 -21% SELL
HONEYWELL 3.46 27,438.5 7,377,412.5 0.54 0.35 6.4 10.0 1.26 1.21 10.1% 12.1% 5.72 65% BUY
NASCON 6.22 16,479.5 7,933,747.6 1.26 1.18 4.9 5.3 2.71 2.45 34.5% 46.5% 8.61 38% BUY
NESTLE 1011.75 801,970.0 237,986,191.1 33.76 29.65 30.0 34.1 23.96 22.80 70.7% 66.8% 904.21 -11% SELL
PZ 23.80 367,449.6 25,555,553.3 2.25 1.41 10.6 16.9 1.34 1.33 7.2% 7.9% 29.43 24% BUY
UNILEVER 35.80 135,442.0 39,198,255.7 1.55 0.64 23.1 55.8 3.05 3.01 6.3% 5.4% 28.03 -22% SELL
* Prices as at Dec 31, 2014
RatingCurrent 2014e Current 2014e
EPS P/E (x) P/BV ROE (%)
Upside/
Downside
Target
Price2014eMillion
Daily Val.
Traded Trailing 2014e Trailing
INDUSTRIAL GOODS S
NSE, United Capital Research
Sector Coverage Names: BREWERIES
Name Mkt Cap (NGN) Liquidty
Price*
GUINNESS 168.15 253,215.1 62,137,269.5 6.31 6.94 26.7 24.2 5.62 5.60 21.1% 23.1% 229.08 36% BUY
NB 165.30 1,250,115.0 387,952,590.2 6.10 5.26 27.1 31.4 11.55 11.33 36.7% 36.1% 173.67 5% HOLD
* Prices as at Dec 31, 2014
RatingCurrent 2014e Current 2014e
EPS P/E (x) P/BV ROE (%)
Upside/
Downside
Target
Price2014eMillion
Daily Val.
Traded Trailing 2014e Trailing
NSE, United Capital Research
Fig. 88
NSE, United Capital Research
Consumer Goods Sector

96
CEMENT SECTOR
A fast changing competitive landscape
The dynamics of the Nigerian cement industry is rapidly changing. We have
observed that in the last 2 years, attention has shifted from capacity and
distribution linkages to pricing and quality. The demand drivers for the sector
however remain unchanged - individual home owners given the long delays in
large scale infrastructural projects. The history of strong domestic demand versus
capacity constraints is now giving way for efficiency and strong market power
with players seeking to leverage on scale to improve efficiency. The cement
market grew by 1.3% to 16.2MT in Q3’14, largely driven by a growing building
and construction market as well as a robust economy. Furthermore, total
installed capacity increased by 9MMTp/a while capacity utilization stood at 85%
as companies in this sector have geared towards gas supply and other
alternative power measures. Dangote Cement maintained its dominance of the
Nigerian cement market in 2014, though its ambitious pan African expansion
plans were slower than earlier anticipated.
Lafarge Consolidation: Standing up to the giant
In a bid to measure up to the competitive pressures from Dangote, Lafarge
worldwide concluded the consolidation of its Nigerian and South African
operations into one entity in 2014. The combined entity known as Lafarge Africa,
now has a market capitalization of N486bn (US$3 billion) and will be listed on the
Nigerian Stock Exchange, becoming the 6th largest company by market
capitalization. The transaction involved the transfer of Lafarge S.A.'s interests in
Lafarge South Africa Holdings (LSAH), UniCem, Ashaka Cement and Atlas
Cement to Lafarge WAPCO. Consequently, the enlarged entity Lafarge Africa
now owns 100.0% of LSAH, 58.6% of Ashaka Cement, 100.0% of Atlas Cement
and an indirect holding of 35.0% in UniCem. Lafarge Africa now has a
combined capacity of c.12MMTp/a in Nigeria and South Africa and with a
5.5MMTp/a capacity expansion already underway in UniCem and Ashaka
Cement.
LAFARGE WAPCO LAFARGE AFRICA
Subsidiary Wapco Wapco, Ashakacem, Unicem, Lafarge SA,
Installed Capacity 4.5MMT 12MMT
Market Presence South-West South-West,North-East, South Africa
Company Disclosures, United Capital Research
In the last 2 years, attention has
shifted from capacity and
distribution linkages to pricing
and quality
Lafarge Worldwide consolidated
its Nigerian and South African
operations into one entity in
2014
Industrial Goods Sector
97
Two Dominant players still face fierce competition
The consolidation of the shares and businesses of Lafarge group in South Africa
and Nigeria into one entity, Lafarge Africa Plc, has led to a more intense
competition in the cement industry. While Dangote Cement controls 64% of the
market, Lafarge Africa currently controls 33% of the market. The Intense
competition among these two manufacturers is leading to stable and lower
prices amid increased capacity by the firms as they position to meet
burgeoning demand. The competition has gotten fierce with price as one of the
weapons most commonly deployed. The biggest player in the industry, Dangote
Cement Plc, announced on November 2, 2014 that it had pegged the price of
its 32.5 cement grade at N1,000 per 50kg bag, while it noted that the higher 42.5
grade would sell for N1,150 per bag. The new prices, exclusive of the VAT,
represent about 40% discount on the prevailing market prices of the product,
which was selling for N1, 700 across the country, irrespective of the grade.
New cement standard: Raising the bar on quality
The Standard Organization of Nigeria (SON) following allegations of poor
cement quality and the increased incidence of building collapse, proposed the
adoption of a new cement standard 42.5 grade, hence limiting the previously
used 32.5 grade to plastering. Based on the new standard, only the 42.5 grade
can be used for block making, thus necessitating a major shift to production of
the new and better quality grade. A direct implication of the new standard on
cement producers is the increase in cost of producing 42.5 grade as the
cement mix requires a higher and purer amount of clinker thus impacting
negatively on raw material and power costs. Dangote Cement had recently
launched its 42.5R cement grade, though Lafarge Wapco was the first producer
of the 42.5 grade (CEM II 42.5N) but failed to take first mover advantage
through proper advertisement and product visibility.
Gas Supply Challenges: Energy efficiency still at risk
Cement producers struggled with inadequate gas supply in 2014, which was
exacerbated by the increased demand for gas by the recently privatized
power generating companies. This disruption affected cement production with
local producers having to resort to more expensive sources of fuel - Low Pour
Fuel Oil (LPFO). With the increased demand for gas putting a strain on the
existing system and the expected addition of new capacities, the gas situation
may get worse in 2015. However, some players are already opting for other fuels
like coal which is cheaper than LPFO. For example, Dangote Cement is
planning to switch to coal, even as the company disclosed that significant
The intense competition among
players is expected to lead to
stable and lower prices
With the increased demand for
gas putting a strain on the
existing system and the
expected addition of new
capacities, the gas situation
may get worse in 2015
Industrial Goods Sector

98
progress has been made in completing the coal mill with order already placed
for the import of coal consignments. Although coal is more expensive than gas
at the moment, the price of gas is expected to converge to the price of coal
based on the planned increases in gas price, as conveyed in the Gas Master
Plan.
Market Performance and outlook
The Industrial goods sector closed the year with a negative return of -10.4%
despite the year-end rally witnessed in this space. BERGER and ASHAKACEM
were the only stocks that closed in the green with a return of 12.5% and 4.3%
respectively. The sector’s heavyweights, DANGCEM and WAPCO, closed the
year with a negative return of -8.7% and -28.1% respectively, driven by poor
earnings growth on the back of high production cost.
We see medium to long term potential upside in this sector, especially within the
cement space as we recognize the strength of the underlying market
opportunity. Therefore we will be bullish on companies with strong, and in some
instances, spare production capacity, which we think will remain a long term
strategic advantage for players. More importantly, we will favour companies
with stable sources of gas supply to power operations.
Notably, our expectation of reduced government spending will cap volume
uptake for players in 2015. What’s more, the fall in discretionary income will
reduce demand from individual home owners who remain the key drivers of
demand, with further pressure on revenue growth of cement producers. The
lingering gas supply constraints has exposed players to the vagaries of
exchange rate as the major input, clinker, which requires over 90.0% of total
production energy requirements, has been the hardest hit. By and large, we
expect a modest slow down in earnings for players in the cement sector, largely
due to elevated and erratic energy costs as well as reduction in volumes.
Current valuations however still portend long term opportunities, on our
estimates.
We see medium to long term
potential upside in this sector,
especially within the cement
space as we recognize the
strength of the underlying
market opportunity
On our estimates, current
valuations portend significant
long term opportunities
Industrial Goods Sector
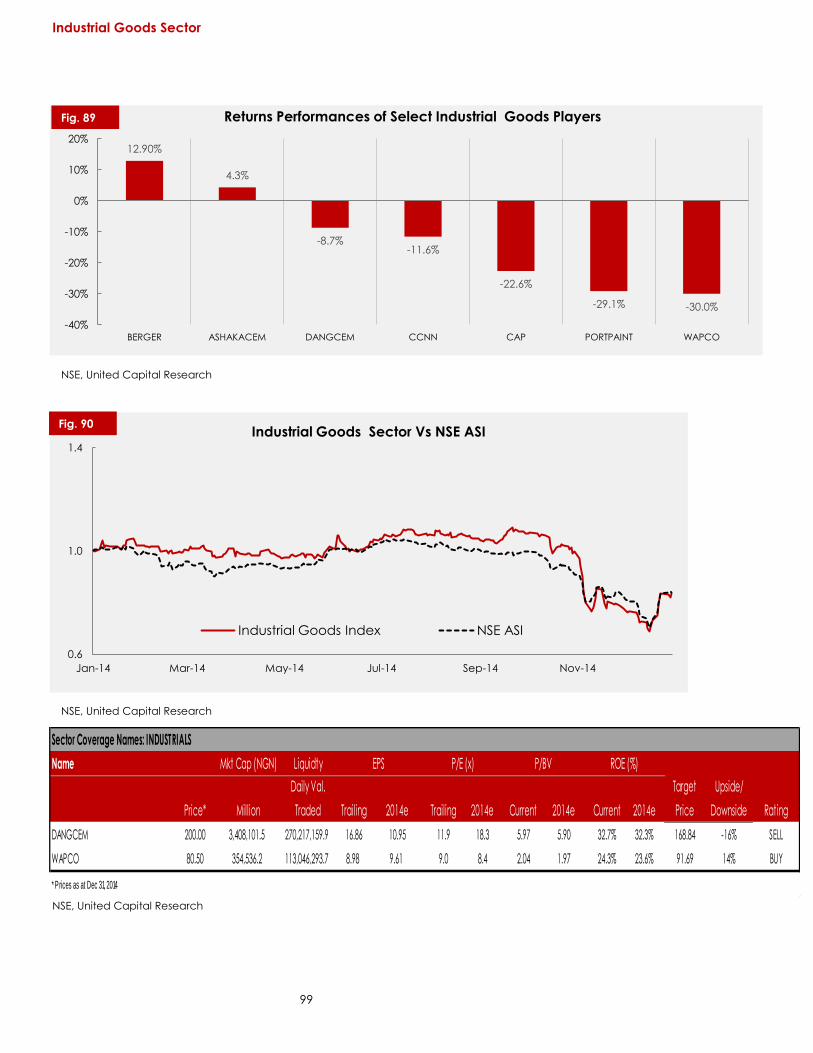
99
0.6
1.0
1.4
Jan-14 Mar-14 May-14 Jul-14 Sep-14 Nov-14
Industrial Goods Sector Vs NSE ASI
Industrial Goods Index NSE ASI
Sector Coverage Names: INDUSTRIALS
Name Mkt Cap (NGN) Liquidty
Price*
DANGCEM 200.00 3,408,101.5 270,217,159.9 16.86 10.95 11.9 18.3 5.97 5.90 32.7% 32.3% 168.84 -16% SELL
WAPCO 80.50 354,536.2 113,046,293.7 8.98 9.61 9.0 8.4 2.04 1.97 24.3% 23.6% 91.69 14% BUY
* Prices as at Dec 31, 2014
Million
Daily Val.
Traded Trailing 2014e Trailing
EPS P/E (x) P/BV ROE (%)
Upside/
Downside
Target
Price2014e RatingCurrent 2014e Current 2014e
12.90%
4.3%
-8.7% -11.6%
-22.6%
-29.1% -30.0%
-40%
-30%
-20%
-10%
0%
10%
20%
BERGER ASHAKACEM DANGCEM CCNN CAP PORTPAINT WAPCO
Returns Performances of Select Industrial Goods Players
NSE, United Capital Research
NSE, United Capital Research
NSE, United Capital Research
Fig. 89
Fig. 90
Industrial Goods Sector

100
298 266
174 157 150
102 98 93
48 44 37
0
100
200
300
400
Ve
ne
zue
la
Sa
ud
i Ara
bia
Ca
na
da
Iran
Iraq
Ku
wa
it
UA
E
Ru
ssia
Libya
USA
Nig
eria
Nigeria has the 2nd Largest crude oil deposit in Africa
World’s 2013 oil reserves (Bn bbls)
OIL AND GAS SECTOR
Nigerian Hydrocarbon: robust reserves, little exploration
According to BP statistical review 2014, Nigeria had about 37.2bn barrels of
proven crude oil reserves as of end of 2013 – the 2nd largest deposit in Africa,
after Libya. Proven oil reserves estimates have however been inactive over the
past few years with exploration activities at their lowest levels. The long delay in
the passage of the PIB, oil theft and pipeline vandalism continue to play a major
role in the low exploration of hydrocarbon, especially in the onshore.
.
Production leakages and theft: Here to stay?
According to the Nigerian Extractive Industries Transparency Initiative (NEITI),
Nigeria lost over 136mn barrels of crude oil estimated at US$10.9bn through
pilfering and sabotage from 2009 to 2011, while 10mn barrels valued at
US$94mn were also lost to pipeline vandalism in the downstream sector within
the same period.
Oil theft, pipeline vandalism and other security challenge led to significant
volatility in oil production and heightened exploration risks in 2014, with
production volume falling below the long term average of 2m bp/d. We believe
that operational risks will continue to grow in Nigeria’s oil and gas sector over
the next few years as long as these bottlenecks are not effectively removed. In
addition, the low level of transparency in oil revenue, local tensions and
NSE, United Capital Research
Exploration activities have been
at their lowest levels in the last
few years
We believe that operational
risks will continue to grow in
Nigeria’s oil and gas sector over
the next few years
Fig. 91
Oil and Gas Sector

101
1
2
3
Jan-09 Jul-09 Jan-10 Jul-10 Jan-11 Jul-11 Jan-12 Jul-12 Jan-13 Jul-13 Jan-14 Jul-14
Nigeria Oil Production trend 2009 – 2014 (Mn bbls)
negative environmental impacts of oil exploration will remain key risks to
investment in the sector, constituting a clog on the realization of the country’s
aspiration to increase production to 4mnbp/d by 2020
World Energy in 2014: The Great Shale Revolution
One of the most astonishing transformations in the history of the global
economy has taken place almost overnight in the oil industry. From an output
low of 5mnbp/d in 2008, the least since 1946, US oil production skyrocketed to
8.864mnbp/d in September 2014, the most in nearly 30 years. This incredible 77%
surge in only 6years was generated by the recent technology development of
hydraulic fracturing in natural gas production from shale formation in the US.
This development has influenced not only energy dependence in the US but
also global energy prices. The US has vast reserves of shale formation, which
often extend our conventional natural oil and gas basins, but are generally
deeper and more difficult to exploit. The implication of the vast improvement in
US shale production is a drop in import from Nigeria. According to US
Department of Energy, Nigeria did not export any barrel of crude to US refiners
in July 2014, ending over 4 decades of exports.
BP, United Capital Research
Nigeria did not import any
barrel of crude to US refiners in
July 2014, ending over 4
decades of exports.
Fig. 92
Oil and Gas Sector

102
3.0
4.5
6.0
7.5
9.0
10.5
2010 2011 2012 2013 2014
US crude oil production has witnessed significant growth in the last 4
years US Oil Production 2010 – 2014 (Mn bbls)
Delayed PIB meets increased propensity to divest
The delay in the passage of the PIB has continued to stall huge investment in the
oil industry, placing a cap on industry capacity and reserves. In 2014, Shell
Petroleum Development Company (SPDC) had to put on hold investment
decisions on two key offshore oil and gas projects estimated at US$30bn
pending the passage of the PIB. Major Oil and Gas projects affected by the PIB
include the Trans-Sahara gas pipeline project, the Olokola Liquefied Natural Gas
(OKLNG) project, Brass LNG project and Russian Gazprom US$25bn gas project,
and the US$12bn Bonga South West Aparo development.
A number of IOCs divested their upstream assets in response to the high level of
oil theft, pipeline vandalism, operational and security challenges in the Niger
Delta as well as elevated cost of doing business in Nigeria. Chevron sold some
of its oil blocks in shallow waters while SPDC, Total and ConocoPhillips have
earlier sold their Interests. Given that IOCs account for more than 70% of
Nigerian daily crude production, these divestments continued to command
interest from different stakeholders in the Nigerian Oil and Gas industry.
The divestment programme by the IOCs has significantly changed the Oil & Gas
industry dynamics in Nigeria, providing opportunities for smaller players. The
demand from smaller players for divested onshore blocks is likely to remain high
as new divestments may prove attractive plays for Nigerian companies to gain
access to viable oil discoveries located onshore, in swamp land or in shallow
waters, and achieve material increases in scale. We expect the IOCs to
continue with the process of divesting oil blocks in 2015, albeit at a slower pace
than 2014, particularly those located onshore and in shallow waters. In an effort
The delayed passage of the PIB
has capped industry capacity
and reserves
The divestment programme by
the IOCs has significantly
changed the Oil & Gas industry
dynamics in Nigeria, providing
opportunities for smaller players
BP, United Capital Research
Fig. 93

103
to rationalise portfolios and achieve economies of scale, most of the large
international oil companies have shifted their operational focus gradually to
larger discoveries, often taking them further offshore and in deeper water
ranges where they still possess technological and capital advantages over
domestic oil companies.
Stalled Privatization of Refineries: Posing a Challenge for Growth
Nigeria’s grossly inadequate refining capacity continued to stifle growth in the
oil and gas industry in 2014. The Bureau of Public Enterprises (BPE) and the
Ministry of Petroleum Resources had earlier indicated plans to sell the existing
four (4) refineries, with a combined capacity of 445,000bp/d, with an average
capacity utilization of 31% once the PIB is passed. While a number of private
Company Disclosures, United Capital Research
Oil and Gas Sector

104
firms have indicated interest to build and operate their own refineries, the
uncertainty regarding the deregulation of the downstream sector and delayed
passage of the PIB have put a halt to these plans except for the US$9bn
Dangote Refinery/Petro-chemical/Fertilizer complex which aims to start with an
initial refining capacity of 400,000bp/d.
Sector Outlook for 2015 and Beyond
According to the OPEC, global demand for crude in 2015 is expected to fall to
the lowest level in more than a decade and far below current output. OPEC
forecast demand for the group’s oil will drop to 28.9mnbp/d in 2015, down
280,000bp/d from its previous expectation and over 1mnbp/d less than it is
currently producing. Poor outlook for crude oil demand driven by weaker
outlook for growth in Europe and Asia will continue to pressure oil price demand
in the face of higher supply growth from shale and other non-OPEC sources. The
expectation of a continuous decline in oil price will pressure counters of players
largely exposed to the upstream segment of the industry while downstream
players are likely to benefit from a possible deregulation of the sector. That said,
we believe the passage of the PIB and a visible progress around the gas master
plan will constitute significant lifelines for the sector in 2015. With the largest
holding of proven natural gas reserves in Africa, we believe that the gas
segment has the potential to drive Nigeria’s energy sector through the gas to
power framework in the medium to long term, provided infrastructural rigidities
and poor domestic pricing inhibiting the monetization of the sector can be
effectively addressed.
Market Performance and Returns Expectations
Thanks to a bullish run in FO and MOBIL of 133.2% and 33.2% respectively, the Oil
and Gas sector was able to defy the general bearish market sentiment closing
the year with a positive return of 7.5%. However stocks in the basket like
CONOIL, ETERNA, OANDO, TOTAL, JAPAULOIL and MRS still closed in the
negative, shedding 43.9%, 33.9%, 33.6%, 16.2%, 7.4% and 2.3% respectively
We think the current price of stocks in this space offer opportunity for bargain
hunting, as we are constrained to take a position that most counters have
bottomed out. However, valuation suggest that FO is over-valued, though we
do not rule out a possibility of further rally, a decision justified by its year high
price of N259.94 prior to the start of the general market bearish sentiments.
Hence, it is not unlikely it exceeds this year high in 2015. In sum, we expect the
According to the OPEC, global
demand for crude in 2015 is
expected to fall to the lowest
level in more than a decade
and far below current output
Poor outlook for crude oil
demand driven by weaker
outlook for growth in Europe and
Asia will continue to pressure oil
price demand in the face of
higher supply growth from shale
and other non-OPEC sources
Oil and Gas Sector
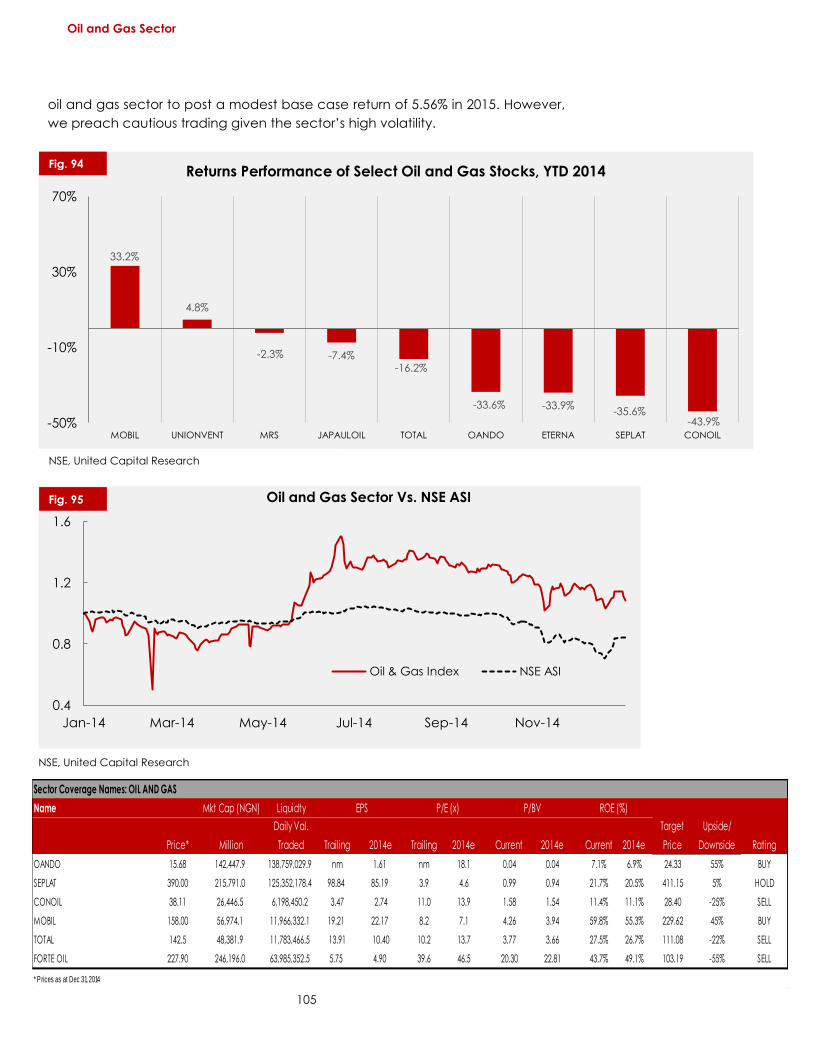
105
0.4
0.8
1.2
1.6
Jan-14 Mar-14 May-14 Jul-14 Sep-14 Nov-14
Oil and Gas Sector Vs. NSE ASI
Oil & Gas Index NSE ASI
Sector Coverage Names: OIL AND GAS
Name Mkt Cap (NGN) Liquidty
Price*
OANDO 15.68 142,447.9 138,759,029.9 nm 1.61 nm 18.1 0.04 0.04 7.1% 6.9% 24.33 55% BUY
SEPLAT 390.00 215,791.0 125,352,178.4 98.84 85.19 3.9 4.6 0.99 0.94 21.7% 20.5% 411.15 5% HOLD
CONOIL 38.11 26,446.5 6,198,450.2 3.47 2.74 11.0 13.9 1.58 1.54 11.4% 11.1% 28.40 -25% SELL
MOBIL 158.00 56,974.1 11,966,332.1 19.21 22.17 8.2 7.1 4.26 3.94 59.8% 55.3% 229.62 45% BUY
TOTAL 142.5 48,381.9 11,783,466.5 13.91 10.40 10.2 13.7 3.77 3.66 27.5% 26.7% 111.08 -22% SELL
FORTE OIL 227.90 246,196.0 63,985,352.5 5.75 4.90 39.6 46.5 20.30 22.81 43.7% 49.1% 103.19 -55% SELL
* Prices as at Dec 31, 2014
RatingCurrent 2014e Current 2014e
EPS P/E (x) P/BV ROE (%)
Upside/
Downside
Target
Price2014eMillion
Daily Val.
Traded Trailing 2014e Trailing
33.2%
4.8%
-2.3% -7.4% -16.2%
-33.6% -33.9% -35.6%
-43.9% -50%
-10%
30%
70%
MOBIL UNIONVENT MRS JAPAULOIL TOTAL OANDO ETERNA SEPLAT CONOIL
Returns Performance of Select Oil and Gas Stocks, YTD 2014
oil and gas sector to post a modest base case return of 5.56% in 2015. However,
we preach cautious trading given the sector’s high volatility.
NSE, United Capital Research
Fig. 94
Fig. 95
NSE, United Capital Research
Oil and Gas Sector

106
LIST OF FIGURES AND TABLE
Figure Title
1 y/y GDP growth in global and advanced economies
2 US GDP growth
3 Historical and Forecast GDP Growth for Advanced Economies
4 Oil Price
5 MSCI Equity Indices for Advanced and Emerging Economies 2014 (%)
6 Expansionary Regime in the Euro zone
7 Real GDP Growth for BRICS Economies
8 q/q Real Growth Trend for SA (%)
9 USD/ZAR, 2011-2014
10 SA Inflation Rates Vs. Policy Rate (%)
11 JSE Valuations Vs. Ems [P/E (x)]
12 SA 10yr bond yields
13 Ghana y/y Real GDP Growth
14 Ghana Cedi/USD
15 Average Yields on fixed income instruments in Ghana
16 Ghana Composite Stock Market Index
17 Kenya Real GDP Growth (y/y, %)
18 Kenyan Shilling
19 MPR and Headline Inflation in Kenya (y/y, %)
20 Kenyan Sovereign Yield Curve
21 Movement in NSE All Share Index
22 Local Currency Returns 2013, 2014
23 Inflation Rates: 2013-2014
24 5-year Real GDP Growth
25 Monetary Policy Rates
26 10-year Bond Yields
27 Equity Market Indices (Rebased to 100)
28 Quarterly Trends in Global Oil Demand and Supply
29 OPEC and on- share of oil production (rebased to 2010)
30 US Oil Production Volumes (m b/pd)
31 WTI and SAUDI's Production
32 Break-even Oil Prices
33 Vulnerability of OPEC members to Oil Prices
34 Select Policy Rates: Annual Averages , %
35 Nigeria Monetary Policy Rate (MPR, %)
36 Broad Money Supply and Credit Growth
37 CBN OMO Activities, 2013 Vs. 2014
38 Top 50 Economies Globally: Nominal GDP (US$ million)
39 Real GDP Growth Rate
40 Nigeria GDP Sectoral Growth Trends
41 Headline Inflation
42 Money Supply (N’bn) Vs. Core Inflation
43 Changes in FPIs Vs. Naira Returns
44 N/USD Rates in 2014
45 Total FX Demand versus total FX supply
46 Average month External Reserves and Brent Crude Price
47 Breakdown of expenditure plans for 2015 (N'bn)
48 Nigeria Crude Oil Actual Volumes Vs. Budget
49 Non-Oil Vs. Oil Revenue Split
50 35.1% Ratio of capital to Total Expenditure
107
51 Top Priority sectors in the 2015 budget
52 Nigerian Bonds Index Performance for Different Maturities ( rebased to 100)
53 FGN Bonds Vs. Emerging Markets Bonds ( rebased, 100)
54 Nigeria Sovereign Yield Curves: 2013 Vs. 2014
55 Primary Market Issuance Volumes of FGN bonds in 2014
56 Capital Importation into Bonds and Equities (US'm)
57 Nigeria Fixed Income Average Daily Traded Volumes (N'bn)
58 FGN Bond Returns in 2014 ( Price changes only
59 Daily average bond yields (2013-2014, %)
60 Equities Market, An Eventful 2014
61 Equities Market
62 Equities Market
63 Equities Market
64 Equities Market
65 Global Equities Markets
66 Global Equities Markets
67 Nigerian banks' quarterly loan growth, 2013-2014
68 Nigerian banks' annualized ROEs, 2013-2015e
69 Nigerian banks' quarterly loan growth, 2013-2014
70 FCY Exposures (Deposits Vs. liabilities)
71 YTD Performances of Nigerian banking stocks, 2014
72 YTD Performances of Nigerian banking stocks, 2014
73 Insurance penetration and density in select African Counties
74 Gross Premium Income and Per capital income of select countries
75 Market Share of Top 5 Players, 2013
76 Gross Premium of top 5 market players, 2013
77 Return performance of selected insurance stocks in 2014
78 Nigeria Insurance Sector Vs. ASI
79 Quarterly Aggregate Consumption Expenditure in Nigeria, 2010-2014
80 Geographic Distribution of consumption spending in Nigeria
81 Food and Beverage Sector Revenue Growth 2007-2015f
82 Breweries sector revenue trends, 2000-2015e
83 Segment Distribution of Nigerian Brewery Market
84 Returns Performances of Selected consumers, YTD 2014
85 Consumer Goods Sector Vs. NSE
86 Returns Performances of Select Industrial Goods Players
87 Industrial Goods Sector Vs ASI
88 World’s 2013 oil reserves (Bn bbls)
89 Nigeria Oil Production trend 2009 – 2014 (Mn bbls)
90 US Oil Production 2010 – 2014 (Mn bbls)
91 Returns Performance of Select Oil and Gas Stocks, YTD 2014
92 Oil and Sector Vs. ASI

108
INVESTMENT RATINGS AND CRITERIA
United Capital Research adopts a 3-tier recommendation system for assets under our coverage:
Buy, Hold and Sell. These generic ratings are defined below;
Buy: Based on our valuation and subjective view (if any), the total return upside on the stock’s
current price is greater than our estimated cost of equity.
Hold: Based on our valuation and subjective view (if any), the total return upside on the stock’s
current price is less than the cost of equity, however, the expected total return on the stock is
greater than or equal to the Standing Deposit Facility rate of the Central Bank of Nigeria (which is
currently MPR – 200bps; i.e 11%). We consider this as the minimum return that may deserve our
holding of a risk asset, like equity.
Sell: Based on our valuation and subjective view (if any), the total return upside on the stock’s
current price is less than the Standing Deposit Facility rate of the Central Bank of Nigeria (which is
currently MPR – 200bps; i.e. 11%). We consider this as the minimum return that may deserve our
holding of a risk asset, like equity, especially as we consider the average 4.5% total transaction cost
for an average retail investor.
NR*: Please note that in addition to our three rating heads, we indicate stocks that we do not rate
with NR; meaning Not-Rated. We may not rate a stock due to investment banking relationships,
other sources of conflict of interests and other reasons which may from time to time prevent us from
issuing a rating on the shares (or other instruments) of a company.
Please note that we sometimes give concessional rating on stocks, which may be informed by
technical factors and market sentiments.
Current Stock Rating Dispersion and Relationship
Conflict of Interest: It is the policy of United Capital Plc and all its subsidiaries/affiliates (thereafter
collectively referred to as “UCP”) that research analysts may not be involved in activities that
suggest that they are representing the interests of UCP in a way likely to appear to be inconsistent
with providing independent investment research. In addition, research analysts’ reporting lines are
structured so as to avoid any conflict of interests. Precisely, research analysts are not subject to the
supervision or control of anyone in UCP’s Investment Banking or Sales and Trading departments.
However, such sales and trading departments may trade, as principal, on the basis of the research
analyst’s published research. Therefore, the proprietary interests of those Sales and Trading
departments may conflict with your interests as clients. Overall, the Group protects clients from
probable conflicts of interest that may arise in the course of its business relationships.

109
Analyst Certification
The research analysts who prepared this report certify as follows:
1. That all of the views expressed in this report articulate the research analyst(s) independent
views/opinions regarding the companies, securities, industries or markets discussed in this report.
2. That the research analyst(s) compensation or remuneration is in no way connected (either directly
or indirectly) to the specific recommendations, estimates or opinions expressed in this report.
Other Disclosures
United Capital Plc or any of its affiliates (thereafter collectively referred to as “UCP”) may have
financial or beneficial interest in securities or related investments discussed in this report, potentially
giving rise to a conflict of interest which could affect the objectivity of this report. Material interests
which UCP may have in companies or securities discussed in this report are disclosed:
UCP may own shares of the company/subject covered in this research report.
UCP does or may seek to do business with the company/subject of this research report
may be or may seek to be a market maker for the company which is the subject of this research
report
UCP or any of its officers may be or may seek to be a director in the company(ies) covered in this
research report
UCP may be likely recipient of financial or other material benefits from the
company/subject of this research report.
Company Disclosure
Dangote Cement Plc h
Dangote Flour Plc h
Dangote Sugar Plc h
Diamond Bank Plc h
FirstBank Holdings Nigeria Plc h
Guaranty Trust Bank Plc h
Guinness Nigeria Plc h
PZ Nigeria Plc h
Disclosure keys
a. The analyst holds personal positions (directly or indirectly) in one or more of the stocks covered in
this report
b. The analyst(s) responsible for this report (whose name(s) appear(s) on the front page of this report is
a Board member, Officer or Director of the Company or has influence on the company’s operating
decision directly or through proxy arrangements
c. UCP is a market maker in the publicly traded equities of the Company
d. UCP has been lead arranger or co-lead arranger over the past 12 months of any offer of securities
of the Company
e. UCP beneficially own 1% or more of the equity securities of the Company
f. UCP holds a major interest in the debt of the Company

110
g. UCP has received compensation for investment banking activities from the Company within the last
12 months
h. UCP intends to seek, or anticipates compensation for investment banking services from the
Company in the next 6 months
i. The content of this research report has been communicated with the Company, following
which this research report has been materially amended before its distribution
j. The Company is a client of UCP
k. The Company owns more than 5% of the issued share capital of UCP
Disclaimer
United Capital Plc Research (UCP) notes are prepared with due care and diligence based on
publicly available information as well as analysts’ knowledge and opinion on the markets and
companies covered; albeit UCP neither guarantees its accuracy nor completeness as the sole
investment guidance for the readership. Therefore, neither UCP nor any of its associate or subsidiary
companies and employees thereof can be held responsible for any loss suffered from the reliance
on this report as it is not an offer to buy or sell securities herein discussed. Please note this report is a
proprietary work of UCP and should not be reproduced (in any form) without the prior written
consent of UCP Management. UCP is registered with the Securities and Exchange Commission and
its subsidiary, United Capital Securities Limited is a dealing member of the Nigerian Stock Exchange.
For enquiries, contact United Capital Plc, 12th Floor, UBA House, 57 Marina, Lagos. ©United Capital
Plc 2014.*

111