Embed Size (px)
Citation preview

Meat and Livestock Review & Outlook 2011/12
Meat and Livestock Review & Outlook 2011/12
Meat and Livestock
Review & Outlook 2014/15

SUMMARY ................................................................................................................. 4
INTRODUCTION ........................................................................................................ 4
1.1 Consumer prices ............................................................................................... 4
1.2 Global food price developments ........................................................................ 5
1.3 Exchange rates ................................................................................................. 5
1.4 Agricultural price indices ................................................................................... 6
1.5 Environmental conditions .................................................................................. 8
CATTLE AND BEEF .................................................................................................. 8
2.1 Herd size ........................................................................................................... 8
2.2 Calf Registrations .............................................................................................. 9
2.3 Age analysis .................................................................................................... 10
2.4 Cattle Disposals .............................................................................................. 11
2.5 Cattle supply outlook ....................................................................................... 12
2.6 Carcase weights .............................................................................................. 13
2.7 Carcase classification ...................................................................................... 14
2.8 Output ............................................................................................................. 15
2.9 Imports ............................................................................................................ 16
2.10 Consumption ................................................................................................. 16
2.11 Exports .......................................................................................................... 17
2.12 Outlook for Exports ........................................................................................ 19
2.13 Global outlook ............................................................................................... 20
2.14 Cattle Prices .................................................................................................. 22
3. Live Animals ....................................................................................................... 26
3.1 Live Cattle Exports .......................................................................................... 26
Review ............................................................................................................... 26
Live cattle outlook............................................................................................... 28
3.2 Live sheep Exports .......................................................................................... 28
3.3 Live Pig Exports .............................................................................................. 29
4. PIGS AND PIGMEAT ........................................................................................... 30
4.1 Pig Herd Size .................................................................................................. 30
4.2 Pig Disposals................................................................................................... 31
4.3 Output ............................................................................................................. 32
4.4 Imports ............................................................................................................ 32
4.5 Consumption ................................................................................................... 32
4.6 Exports ............................................................................................................ 33
4.7 Pig Prices ........................................................................................................ 35
5. SHEEP AND SHEEPMEAT ................................................................................. 37
5.1 Flock size ........................................................................................................ 37
5.2 Sheep Disposals ............................................................................................. 37
5.3 Output ............................................................................................................. 39
5.4 Imports ............................................................................................................ 40
6.5 Consumption ................................................................................................... 41
5.6 Exports ............................................................................................................ 41
5.7 Outlook ............................................................................................................ 42
5.8 Lamb Prices .................................................................................................... 44
6. POULTRY ............................................................................................................ 46
6.1 Poultry Disposals ............................................................................................. 46
6.2 Consumption ................................................................................................... 47
6.3 Trade ............................................................................................................... 47
6.4 Outlook ............................................................................................................ 48
6.5 Prices .............................................................................................................. 48

4
SUMMARY
Increase in value of meat and livestock exports
Despite the difficult market environment for some meats in 2014, most notably beef and
pigmeat, the value of meat and livestock exports grew by 3% to over €3.6 billion. This
equates to 33% of total food and drink exports. The value of overall beef exports showed
little change at €2.27 billion. The volume of beef available for export stood at around
524,000 tonnes while average prices fell by around 11%. The opening of the US market for
Irish beef represents a significant opportunity for the sector. With the US cattle herd
contracting, the market seems set to remain tightly supplied for some time. This is leading to
situation where US steer prices are currently 25% higher than European prices compared to
the historical position of being 15% - 20% lower. These developments present a window of
opportunity for Irish beef to build a premium position in the market.
There were increased pigmeat volumes which were partly offset by a drop of around 4% in
average prices, which left the value of Irish pigmeat exports some 2% higher in 2014 at an
estimated €560m.
Lower sheepmeat export volumes were recorded due to reduced supply coupled with a
decline in imports. This left the value of Irish sheepmeat exports marginally higher in 2014
at €218m. However overall producer prices were some 4% higher in 2014 compared to
2013.
For the year it is estimated that the value of Irish poultry exports increased by 29% to reach
€310m, helped by stronger processed poultry exports.
Higher live cattle exports were offset by reduced shipments of both pigs and sheep in 2014.
For the year the value of Irish livestock exports was unchanged at an estimated €245m.
The prospects for the meat & livestock sector in 2015 are mixed with lower finished cattle
availability expected to help the beef trade while the prospects for sheep remain positive.
However, the pigmeat sector seems set to remain challenging given the absence of the
Russian market for exporters and a well-supplied global market.
INTRODUCTION
1.1 Consumer prices
Weakening in consumer prices
Price inflation across the eurozone was relatively static throughout 2014 with European
Union annual inflation on average down 0.5 percent. Mixed trends throughout the year were

5
evident across Europe with Germany and the Netherlands showing modest inflation over the
period while the UK, Ireland and to a lesser extent France recorded some price deflation as
the year progressed. This represents the lowest level of price inflation since 2009. Food
price developments across the Eurozone have remained stable. This contrasts with 2013
when food price inflation was running at more than twice overall inflation in the eurozone
economy. The outlook for food price inflation across the eurozone remains difficult to predict.
The forecasts of relatively modest economic growth in 2015 and the lingering effects of
austerity are likely to result in little change in consumer confidence levels. Given this
backdrop any price inflation across the eurozone is likely to be modest.
1.2 Global food price developments
Rise in global food price index for meat
Global agricultural commodity prices as measured by the FAO Food Price Index showed a
decline of 4% in 2014. This follows similar modest declines in 2012 and 2013. However, the
overall index remains 55% higher than the 2000 – 2010 average, reflecting the growing
demand for food in developing regions. During 2014 the decline was driven largely by
cereals, dairy, oils and sugar. Meat was the only category to report higher prices, with a rise
of 8% recorded.
Looking at December prices compared to a year earlier, dairy prices were 34% lower, oils
18% and cereals 5%. This more than offset a jump of 10% in meat prices. The overall index
for December was 9% below year earlier levels. The FAO Food Price Index fell by 4% in
2014. However, the index continues to run 55% ahead of the average level recorded during
the 2000-2010 period.
The global outlook for agricultural commodities remains positive over the medium term,
albeit with significant volatility likely to persist. Volatility seems set to remain for dairy and
cereals in 2015 and the latest FAO/OECD agricultural outlook for the period to 2023
suggests that meat and dairy will see further upward trends over the medium to longer term.
This will present a solid backdrop for Irish food and drink exports over the period.
1.3 Exchange rates
Mixed trends in Euro exchange rates
With more than 40% of food and drink exports destined for the sterling area and a further
29% going to markets, which predominantly trade in US dollars any change in exchange

6
rates has the potential to impact on competitiveness. The Euro was stable relative to the US
dollar in 2014 but weakened by 5% relative to sterling. In December 2014, the euro was 10%
weaker against the US dollar and 6% weaker with Sterling. These developments are helping
to boost the competitiveness of Irish exports. Mixed trends were evident with other major
currencies such as the Australian dollar and the Chinese yuan as the euro strengthened
against both on an annual basis but weakening as the year progressed. The euro
strengthened by almost 20% against the Russian rouble during 2014, reflecting the ongoing
uncertainty in the region. This combined with trade suspensions had a significant negative
impact on trade from Ireland. The anticipated economic developments in these regions over
the next 12 – 24 months would suggest the potential for a further weakening in the euro.
This should help to maintain competitiveness of exports, although it will also have the impact
of pushing up import prices for inputs and raw materials.
Figure 1.3: % change in euro exchange rates for key currencies 2014 v 2013
Source: Central Bank of Ireland
1.4 Agricultural price indices
Decline in input prices
Figure 1.4.1 shows the change in annual agricultural input price indexes from December
2013 to December 2014. The agricultural input price index decreased 4.5% over the year
20
9
7
0.3
-1.3
0
-5 -5
0
5
10
15
20
RussianRouble
Brazilian Real AustralianDollar
ChineeseYuan
New ZealandDollar
US dollar Sterling

7
with largest decreases seen for fertiliser, energy and feed input costs. This follows on from
an 8% rise seen in input prices over the previous two years.
Figure 1.4.1: Change in input price index 2014 v 2013
Source: CSO
Similarly agricultural output prices as shown in Figure 1.4.2 showed some decrease, down
1.8% for animals. This was largely driven by a decline in cattle output price index but offset
somewhat by a rise in the sheep output price index.
Figure 1.4.2: Change in animal output price index 2014 v 2013
Source: CSO
-4.5%
-6.4%
-2.7% -3.6%
0.1%
2.2%
0.5% 1.5%
-9.0%
-7.0%
-5.0%
-3.0%
-1.0%
1.0%
3.0%
-9.3%
-4.4%
2.6%
-2.1%
-15.0%
-10.0%
-5.0%
0.0%
5.0%
Cattle Pigs Sheep Poultry

8
1.5 Environmental conditions
Further improvement in grazing conditions in 2014
According to the Met Eireann annual report annual rainfall totals for most weather stations
were near or above their Long-Term Average (LTA). Temperatures showed some increase
with warmest annual conditions in seven years recorded for most stations and annual mean
temperatures were all on or above their LTA. The national annual mean temperature was
10.6°C, with the highest annual maximum temperature of 28.8°C recorded on July 25th with
the lowest temperature of the year, -6.9°C recorded on December 29th. Nearly all stations
reported above average sunshine totals with the sunniest conditions (compared to LTA)
reported in the Southwest in June. Improved weather conditions contributed to an increase
in overall grass growth. Figures from the Teagasc Pasture Base system point towards an
average increase in grazed grass dry matter production of 11% in 2014 compared to 2013.
This was driven by an increase in growth particularly in the first half of the year. Similarly
there was a significant growth in average silage dry matter production last year compared to
2013 levels.
CATTLE AND BEEF
2.1 Herd size
Non-dairy cow numbers continue to decline
Total cattle numbers in Ireland increased marginally last year with cow numbers showing a
rise on the back of higher dairy cow numbers. Suckler cow numbers have been steadily
declining, down 2% compared to 2013 levels and down 6% compared to 2004 levels.
Preliminary estimates for 2015 indicate some further pressure on suckler cow numbers,
however this is likely to be offset somewhat by an increase in dairy cow numbers. Overall
cow numbers are likely to show a modest increase.

9
Table 2.1. Bovine numbers June Livestock Survey* 2014
‘000 head** 2010 2011 2012 2013 2014
Total Cattle 6,607 6,493 6,754 6,903 6,926
Total cattle: male 2,145 2,033 2,190 2,262 2,219
Total cattle: female 4,462 4,460 4,564 4,641 4,707
Cows 2,229 2,240 2,290 2,314 2,355
Dairy 1,071 1,117 1,141 1,163 1,226
Other 1,158 1,123 1,149 1,150 1,129
Bulls 52 42 36 41 41
≥ 2 years old 932 838 733 768 884
Male 506 426 361 388 456
Female 426 412 372 380 428
1 – 2 years old 1,632 1,528 1,660 1,811 1,767
Male 760 673 770 873 821
Female 872 855 890 938 947
< 1 year old 1,762 1,846 2,036 1,969 1,878
Male 827 892 1,023 959 902
Female 935 954 1,013 1,009 977
Source: CSO June Livestock survey
*figures subject to review and may change
**Note figures may vary due to rounding
2.2 Calf Registrations
Decline in calf registration in 2014
Having fallen by 4.4% in 2013, provisional data for 2014 shows a recovery of almost 2%, or
39,000 head, in overall calf registrations. This increase was driven by further expansion in
the dairy herd, with calf births to dairy dams rising by 3.7%. At the same time, calf births by
suckler dams fell by about 0.5%, which represents a good stabilisation following a decline in
2013.

10
Figure 2.2. : Calf Registrations 2012 to 2014 (million head)
Source: DAFM AIM Database
2.3 Age analysis
Decline in availability of finishers
Focusing on the age analysis of the national herd, on December 1st 2014 provisional data
from the AIM database has shown a decline in beef bred cattle over 12 months of age
particularly male cattle. Cattle aged between 12 and 18 months have seen on average a 7%
decrease in numbers for both male and female. Looking at cattle under two years old there
has been an 11% decline in male cattle numbers but this has been offset somewhat by a 5%
rise in female numbers. This suggests an increase in replacement heifers.
Figure 2.3: Change in cattle numbers by age, December 1st 2014 v December 1st 2013
Source: DAFM AIMS Database
1.086 1.113 1.155
1.117 0.994 0.990
2012 2013 2014 (prov)
Dairy Suckler
17,339
-34,710
-18,513
-29,859
-4,732 -6,778
14,727
-14,069
-20,261
1,004
-2,042 -4,852
-35,000
-25,000
-15,000
-5,000
5,000
15,000
25,000
35,000
0-6 06-12 12-18 18-24 24-30 30-36
Males Females

11
2.4 Cattle Disposals Export meat plant supplies up 10%
Cattle throughput at meat export plants increased by around 10% to reach 1.64 million head
in 2014. Prime cattle supplies were over 12% higher at 1.23 million head. The greatest rise
in cattle supplies in 2014 was seen in the second quarter of the year. Overall for the first half
of the year, throughput of prime cattle was over 16% or 85,000 head higher, with supplies up
by around 10% for the second half of the year.
In terms of the different categories of cattle, steer supplies increased by 16% to 612,000
head. The majority of this increase was due a drop of 55,000 head in live exports in 2012.
Supplies of heifers were 15% higher at 430,000 head while young bull throughput increased
by 2% or 3,000 head to 188,000 head.
Figure 2.4.1: Irish export meat plant supplies, 2014 vs. 2013 (‘000 head)
Source: Department of Agriculture, Food and the Marine
*Note figures may vary due to rounding
Figure 2.4.2 shows the proportion of throughput in 2014 and highlights that steers made up
37% of production. Heifers made up 26% of the supply followed by cows which made up
22%. Young bulls and other comprised of 11% and 3% respectively.
153
84
56
0 3 9
-10
10
30
50
70
90
110
130
150
Total Cattle Steers Heifers Cows Young Bulls Other

12
Figure 2.4.2: Percentage Proportion of Throughput 2014
Source: DAFM
2.5 Cattle supply outlook Decline in cattle supplies anticipated
A decline in finished cattle supplies is anticipated in 2015. An increase of over 48,000 head
in live cattle exports in 2013 combined with a drop of more than 100,000 head in calf
registrations point to a significant tightening in finished cattle supplies. As alluded to above,
age analysis of the national herd has also indicated a decline in cattle numbers, particularly
in the 12-24 month age bracket. Overall between males and females there was over 67,000
less cattle on December 1st 2014 in the 12-24 months age bracket compared to December
2013. The majority of this decline was for male cattle with this decline offset somewhat by an
increase in dairy heifers which points to further expansion in the dairy breeding herd due to
the upcoming quota removal.
Supply will be dictated by live exports, grazing conditions and producer decisions and overall
supplies for the year are likely to be between 120,000 and 150,000 head lower than 2014
figures. Looking at each category, the largest decline is likely to be for heifers with a 12%
decline anticipated suggesting a focus on breeding particularly in the dairy sector. Young
bulls are likely to see around an 11% decline with steers falling by around 9% while a
modest ease in cull cow numbers is likely.
Steers, 37%
Heifers, 26%
Cows, 22%
Young Bulls, 12%
Other, 3%

13
Table 2.5: Cattle Supplies 2011 to 2015 (f*)
2011 2012 2013 2014 2015 (f*)
Total Cattle 1,570 1,401 1,499 1,644 1,500 - 1,530
Steers 578 468 530 612 540 - 570
Heifers 415 354 377 430 370 - 390
Cows 337 330 368 367 355 - 370
Young Bulls 185 209 187 188 160 - 175
Others 55 40 37 47 38 - 42
Source DAFM /Bord Bia
*Note forecast figures
Note figures are rounded
2.6 Carcase weights Increase in carcase weights
Carcase weights for all categories increased in 2014 due largely to good grazing conditions
throughout the year. On average, carcase weights for prime cattle recovered by under 2%
following a decline in 2013.
Figure 2.6.1: Monthly carcase weights 2014
Source: DAFM
Looking at individual categories, steers increased by 3kg on 2013 while carcase weights for
young bulls were 2% higher. Cow carcase weights were up by 13kg while heifer carcase
weights jumped by 5kg.
280295310325340355370385400415430445460475
Jan-14 Feb-14 Mar-14 Apr-14 May-14 Jun-14 Jul-14 Aug-14 Sep-14 Oct-14 Nov-14 Dec-14
YOUNG BULLS BULLS STEERS COWS HEIFERS

14
Table 2.6.1: Average carcase weights at export meat plants (kg)
2012 2013 2014 (%Ch)
Steers 365 349 352 +0.9
Heifers 306 304 309 +1.6
Cows 311 302 315 +4.3
Young bulls 372 357 364 -+2.0
Source: DAFM
2.7 Carcase classification Improved conformation and fat across most categories
The conformation results show improved conformation for Heifers, Young Bulls and Cows in
2014. Heifers showed the most improved conformation with 14.9% in E and U grades
compared to 13.2 % in 2013. This has increased year on year since 2010 where it stood at
just over 7%. Looking at R and O grades there were small increases for heifers in these
grades. In contrast steer conformation results showed somewhat smaller percentages
grading E and U and higher percentages in O and P grades compared to 2013 while the
proportion of R grade steers remained stable.
Figure 2.7.1: Percentage change in prime cattle conformation 2014 v 2013
Source: DAFM annual reports
Higher fat scores were evident across all categories of animal in 2014, with higher
percentages in fat scores 3, 4 and 5. This may be due to the better grazing conditions
-0.2
-1.9
0.0
0.8 1.2
0.0
1.7 1.3
-2.3
-0.9
0.0
4.0
0.2
-3.0
-1.4
-3.0
-2.0
-1.0
0.0
1.0
2.0
3.0
4.0
E U R O PConformation
Steer Heifer Young bull

15
evident throughout 2014 in contrast with the poorer early season conditions in 2013 and
hence cattle were finished in better conformation and fat classes.
Figure 2.7.2: Percentage change in prime cattle fat score 2014 v 2013
Source: DAFM annual reports
2.8 Output Rise in net production
An increase in carcase weights of over 2% coupled with a 10% rise in throughput and better
grazing conditions led to a significant rise in beef output in 2014. Net production increased in
the region of 13% to reach 583,000 tonnes. This represents an 18% rise since 2012. In
comparison with average net production over the last ten years, this represents a 7% rise.
Net production for the year ahead is anticipated to decline and be back by around 10%.
Looking further ahead in the medium term higher calf registrations in 2014 and assuming
stability in live exports and environmental conditions would point to some recovery in supply.
-0.9
-4.4
1.9
3.4
-0.1
1
-0.9
-3.2
-2
5.4
-2.2 -3
4.6
0.4 0
-5
-3
-1
1
3
5
7
1 2 3 4 5Fat Scores
Steer Heifer Young bulls
16
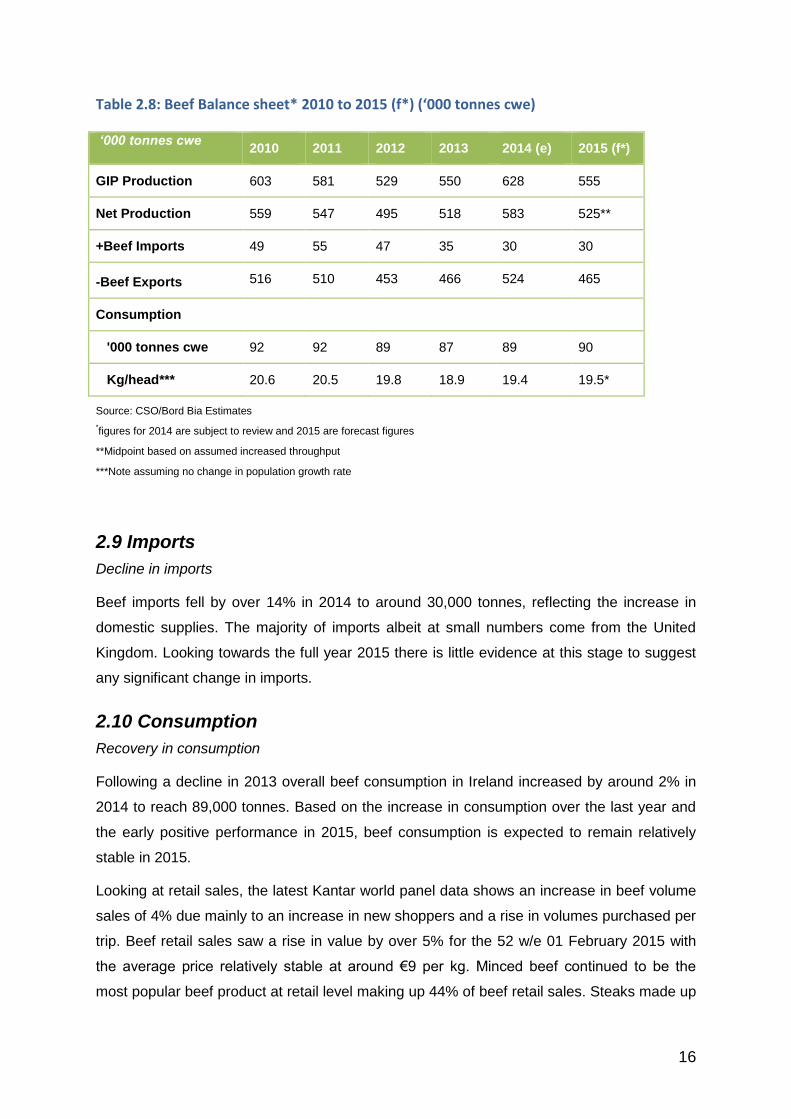
Table 2.8: Beef Balance sheet* 2010 to 2015 (f*) (‘000 tonnes cwe)
‘000 tonnes cwe 2010 2011 2012 2013 2014 (e) 2015 (f*)
GIP Production 603 581 529 550 628 555
Net Production 559 547 495 518 583 525**
+Beef Imports 49 55 47 35 30 30
-Beef Exports 516 510 453 466 524 465
Consumption
'000 tonnes cwe 92 92 89 87 89 90
Kg/head*** 20.6 20.5 19.8 18.9 19.4 19.5*
Source: CSO/Bord Bia Estimates
*figures for 2014 are subject to review and 2015 are forecast figures
**Midpoint based on assumed increased throughput
***Note assuming no change in population growth rate
2.9 Imports
Decline in imports
Beef imports fell by over 14% in 2014 to around 30,000 tonnes, reflecting the increase in
domestic supplies. The majority of imports albeit at small numbers come from the United
Kingdom. Looking towards the full year 2015 there is little evidence at this stage to suggest
any significant change in imports.
2.10 Consumption
Recovery in consumption
Following a decline in 2013 overall beef consumption in Ireland increased by around 2% in
2014 to reach 89,000 tonnes. Based on the increase in consumption over the last year and
the early positive performance in 2015, beef consumption is expected to remain relatively
stable in 2015.
Looking at retail sales, the latest Kantar world panel data shows an increase in beef volume
sales of 4% due mainly to an increase in new shoppers and a rise in volumes purchased per
trip. Beef retail sales saw a rise in value by over 5% for the 52 w/e 01 February 2015 with
the average price relatively stable at around €9 per kg. Minced beef continued to be the
most popular beef product at retail level making up 44% of beef retail sales. Steaks made up

17
23% of retail sales however this has shown some decline with increases in burgers and
value added beef. Beef joints and stewing beef continue to account for 15% and 11%
respectively of retail volumes.
Figure 2.10: Proportion of retail beef volume sales by product
Source: Kantar World Panel 52 w/e 01 Feb 2015
2.11 Exports
Rise in exports on the back of increased production
Ireland continues to be a net exporter of beef exporting 90% of its production. Increased net
production led to a rise in exports of 12% totalling 524,000 tonnes. This combined with a
drop of around 11% in average export prices led to the value of Irish beef exports
showing little change at €2.27 billion (€2.06bn when offals are excluded).
The retail market across Europe remains highly value driven and with beef still at a relatively
high price point versus pork and poultry, consumers are buying into the beef category less
frequently. Similarly, at foodservice level, demand has been sluggish and consumers are
choosing cheaper and often lower meat-content options.
Steaks, 23%
Mince, 44% Burgers, 4%
Joints, 15%
Stewing, 11% Value Added , 3%

18
Figure 2.11.1 Distribution of Irish beef exports, ‘000 tonnes
Source: Bord Bia estimates
Growth in exports to Continental EU market
Volumes of Irish beef destined for the United Kingdom increased by around 10% in 2014 to
stand at an estimated 271,000 tonnes. This equates to over 50% of total exports. In value
terms, trade was worth just over €1 billion. UK beef consumption is estimated to have
increased by around 4% in 2014, which boosted volumes. However, prices for imported beef
remained competitive.
Exports to Continental European markets grew by 13% in volume terms to stand at an
estimated 238,000 tonnes in 2014. Higher exports were recorded to most markets,
particularly Italy, France and Germany. Trade was valued at around €1.15 billion, a rise of
almost 2% on 2013 levels. Consumer demand remained subdued in many markets with
Italian consumption reportedly 5% lower and French consumption down by 3%. This slower
demand impacted on price levels.
0
50
100
150
200
250
300
UK Cont. EU Intl Mkts
247 211
8
271 238
15
2013 2014 (f)

19
Figure 2.11.2: Distribution of Irish beef export volumes (%)
Source: Bord Bia estimates
Exports of Irish beef to International markets were more than 80% higher in 2014 at around
15,000 tonnes while offal exports also increased in volume terms. The overall trade was
valued at €115 million. Shipments to Russia were progressing strongly prior to import
suspensions being imposed over the summer months. Strong volumes were also exported to
markets such as Hong Kong, Switzerland and the Philippines.
2.12 Outlook for Exports
Stable demand for beef anticipated
The prospects for the EU beef market in 2015 point to some tentative improvement as lower
supplies combined with a more stable demand for beef are anticipated. However, much will
depend on consumer spending levels with many key countries reporting lower retail sales
over recent months.
Looking at likely beef output across the EU-15 region, latest forecasts suggest a drop of
around 1% in production levels. Output is likely to increase in France, Spain, Netherlands,
and Belgium. However, this will be offset by lower production in Germany, Italy, the UK and
Ireland. In terms of EU export volumes much will depend on the trade situation with Russia.
The current import restrictions are due to remain in place until August 2015. This would
impact negatively on export volumes as Russia had accounted for up to 25% of EU exports
over recent years.
53 45
2
52 45
3
0
10
20
30
40
50
60
UK Cont. EU Intl Mkts
2013 2014 (f)
20
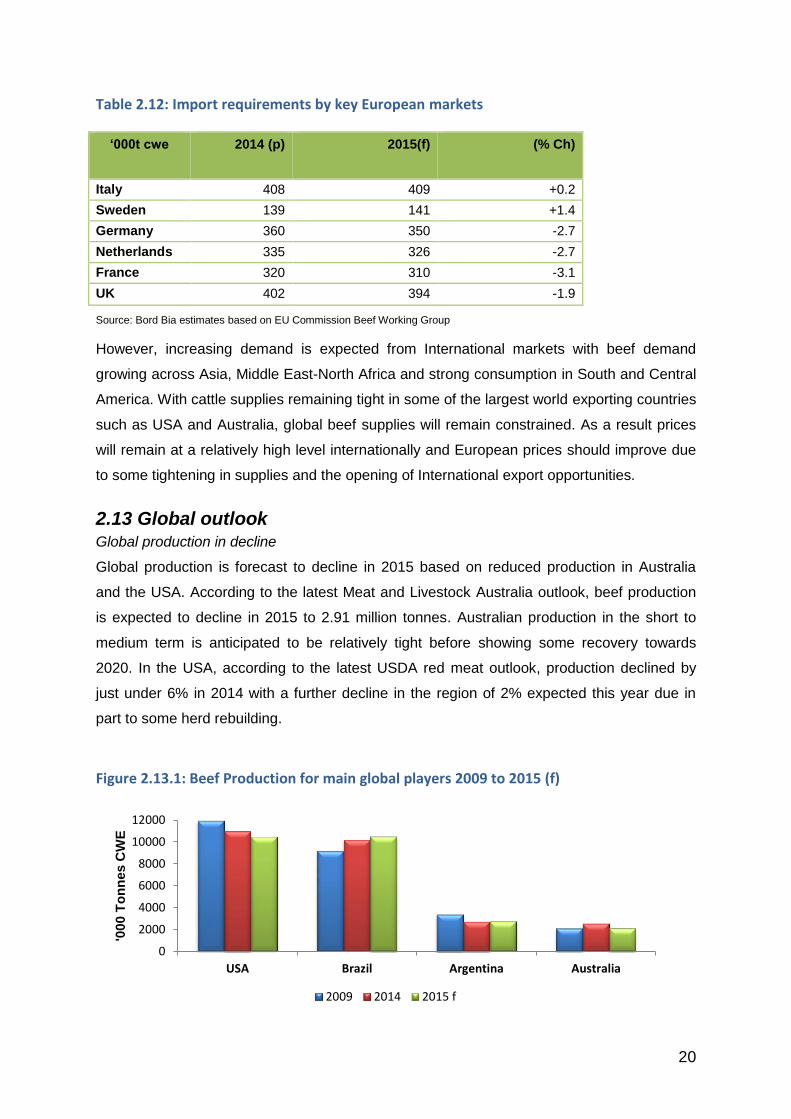
Table 2.12: Import requirements by key European markets
‘000t cwe 2014 (p)
2015(f) (% Ch)
Italy 408 409 +0.2
Sweden 139 141 +1.4
Germany 360 350 -2.7
Netherlands 335 326 -2.7
France 320 310 -3.1
UK 402 394 -1.9
Source: Bord Bia estimates based on EU Commission Beef Working Group
However, increasing demand is expected from International markets with beef demand
growing across Asia, Middle East-North Africa and strong consumption in South and Central
America. With cattle supplies remaining tight in some of the largest world exporting countries
such as USA and Australia, global beef supplies will remain constrained. As a result prices
will remain at a relatively high level internationally and European prices should improve due
to some tightening in supplies and the opening of International export opportunities.
2.13 Global outlook Global production in decline
Global production is forecast to decline in 2015 based on reduced production in Australia
and the USA. According to the latest Meat and Livestock Australia outlook, beef production
is expected to decline in 2015 to 2.91 million tonnes. Australian production in the short to
medium term is anticipated to be relatively tight before showing some recovery towards
2020. In the USA, according to the latest USDA red meat outlook, production declined by
just under 6% in 2014 with a further decline in the region of 2% expected this year due in
part to some herd rebuilding.
Figure 2.13.1: Beef Production for main global players 2009 to 2015 (f)
0
2000
4000
6000
8000
10000
12000
USA Brazil Argentina Australia
'000 T
on
nes C
WE
2009 2014 2015 f

21
Global exports are set to decline in 2015 due largely to reduced volumes from Australia.
However this will be offset somewhat by some increase in Brazilian beef exports. Exports
from Brazil are forecast to increase by 190,000 tonnes, This is due in part to the on-going
Russian ban on beef products which has increased demand for South American product.
This equates to an expected rise in Brazilian exports by almost 7% with a more modest rise
of just under 1% expected for exports from Uruguay. Exports from Argentina are also
expected to rise by under 5% albeit at smaller volumes due to reduced availability.
Figure 2.13.2: Beef exports for main global players 2013 to 2015 (f)
Source: GIRA/Bord Bia
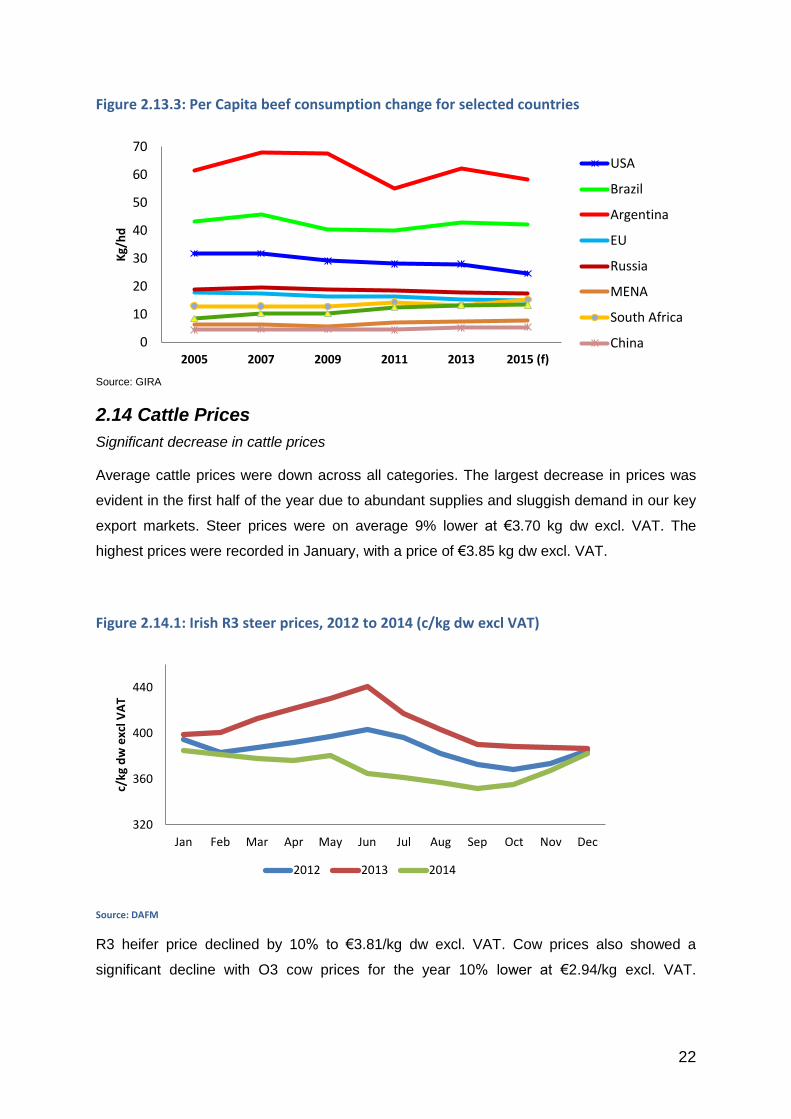
Focusing on key trends in global trade, figure 2.13.3 below gives per capita beef
consumption for some the main global beef traders. The Middle East and North Africa
(MENA) and Asian markets have shown the highest growth rates in per capita beef
consumption over the last ten years with further growth anticipated for the coming year.
China and Korea in particular are expected to show further increases this year which points
to a ten year rise in consumption of 23% and 57% respectively. Similarly MENA is expected
to show a ten year rise in excess of 20%.
0 500 1000 1500 2000 2500
Brazil
India
Australia
USA
'000 tonnes CWE
2015 2014 2013
22
Figure 2.13.3: Per Capita beef consumption change for selected countries
Source: GIRA
2.14 Cattle Prices
Significant decrease in cattle prices
Average cattle prices were down across all categories. The largest decrease in prices was
evident in the first half of the year due to abundant supplies and sluggish demand in our key
export markets. Steer prices were on average 9% lower at €3.70 kg dw excl. VAT. The
highest prices were recorded in January, with a price of €3.85 kg dw excl. VAT.
Figure 2.14.1: Irish R3 steer prices, 2012 to 2014 (c/kg dw excl VAT)
Source: DAFM
R3 heifer price declined by 10% to €3.81/kg dw excl. VAT. Cow prices also showed a
significant decline with O3 cow prices for the year 10% lower at €2.94/kg excl. VAT.
0
10
20
30
40
50
60
70
2005 2007 2009 2011 2013 2015 (f)
Kg/
hd
USA
Brazil
Argentina
EU
Russia
MENA
South Africa
China
320
360
400
440
Jan Feb Mar Apr May Jun Jul Aug Sep Oct Nov Dec
c/kg
dw
exc
l VA
T
2012 2013 2014

23
However O3 cow prices showed some significant recovery in the last two months of 2014
with the highest price recorded in December of €3.12/kg excl VAT.
Irish cattle prices were in line with the EU average for most of the year. Overall for the year,
R3 steer prices stood at 99% of the EU average.
Figure 2.14.2: Irish R3 steers as % of EU-15 weighted R3 male cattle prices, 2006 to date
Source: Bord Bia based on EU Commission
Rise in international cattle prices
Figure 2.14.3 shows the average annual male cattle price for selected countries. Male cattle
prices in Europe declined by an average of 4% on 2013 levels. On an international level
Australian prices showed a modest decline due mainly to record levels of production over
the last two years. In contrast the US reported a 25% rise in average steer price due to a
significant scarcity in supply. Brazilian steer prices also recorded an increase, up 13% on
2013 levels reflecting increased global demand as a result of the Russian ban. Comparing
overall average male prices for these selected countries versus prices five years ago, 2014
prices were on average 43% higher and compared to ten years ago prices were 67% higher.
89
92
99
90 92
98
101
104
99
80
85
90
95
100
105
2006 2007 2008 2009 2010 2011 2012 2013 2014

24
Figure 2.14.3: Average annual male cattle prices for selected countries 2004 to 2014
Source: European Commission/Bord Bia
The movement in exchange rates and the reduction in EU cattle prices have led to a
significant reversal in relative prices between EU and global cattle prices. For the full year
2014, Brazilian steer prices increased on the previous year figure to 65% of the EU male
cattle price. Similarly Uruguay prices showed an increase and were 68% of the EU average
male price. The US male price went from being 83% of the EU average price in 2013 to
109% of the EU average in 2014. In contrast Australian prices showed some decrease and
were around 59% of the EU average. The prospects for 2015 suggest some recovery in EU
prices which may reduce the gap with US prices.
Figure 2.14.4: EU 15 R3 Male as % of selected countries prices, 2014
Source: European commission/Bord Bia
50
100
150
200
250
300
350
400
450
2004 2005 2006 2007 2008 2009 2010 2011 2012 2013 2014
c/kg
DW
Brazil Steer Australia Steer Ire steer
UK steer US Steer EU 15 Young Bull
153 155 164
92 86
0
20
40
60
80
100
120
140
160
180
Brazil Uruguay Australia USA UK

25
Beef Supply Chain
Source: Bord Bia estimates
Export Meat Plants
552,000
Exports
524,000t
Consumption
89,000t
Local Abattoirs
31,000
Total Production
583,000t
Beef Imports
30,000t
Total Beef Availability
613,000t
Key beef market drivers for 2015
Modest decline in EU beef production.
Stabilisation in EU consumer demand anticipated.
Positive global demand for beef due to tight supplies.
Drop of around 8% in Irish cattle supplies
26
3. Live Animals
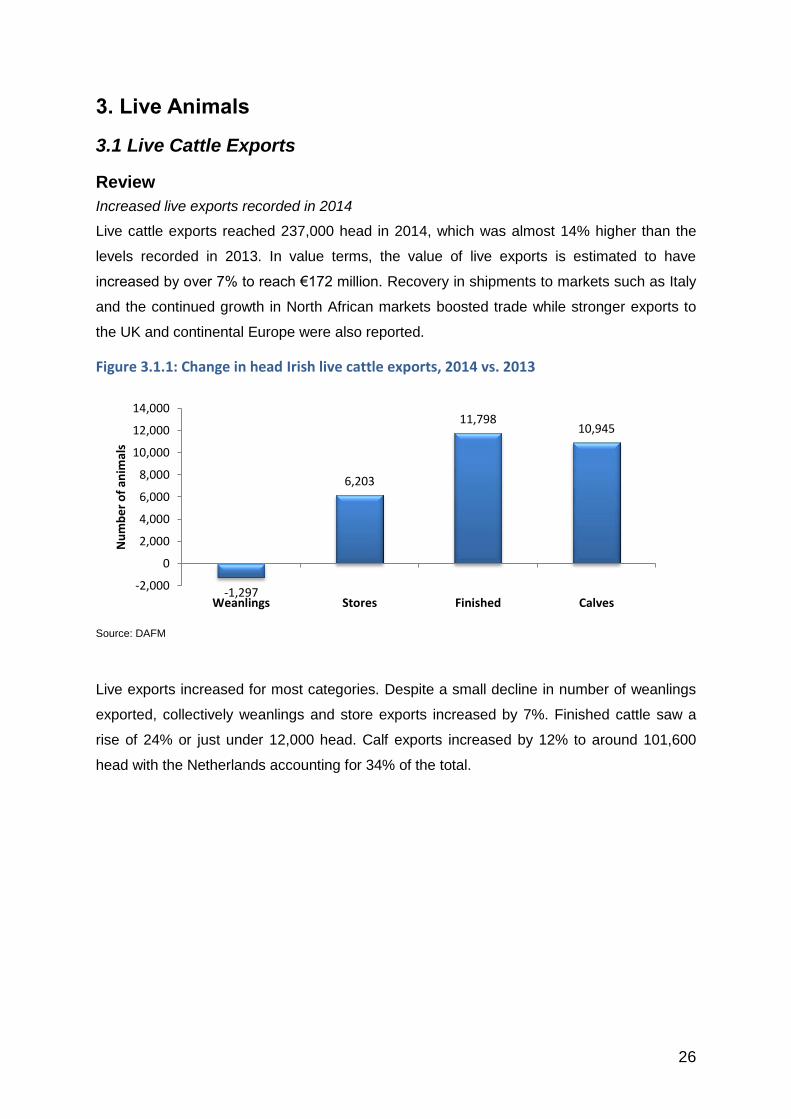
3.1 Live Cattle Exports
Review
Increased live exports recorded in 2014
Live cattle exports reached 237,000 head in 2014, which was almost 14% higher than the
levels recorded in 2013. In value terms, the value of live exports is estimated to have
increased by over 7% to reach €172 million. Recovery in shipments to markets such as Italy
and the continued growth in North African markets boosted trade while stronger exports to
the UK and continental Europe were also reported.
Figure 3.1.1: Change in head Irish live cattle exports, 2014 vs. 2013
Source: DAFM
Live exports increased for most categories. Despite a small decline in number of weanlings
exported, collectively weanlings and store exports increased by 7%. Finished cattle saw a
rise of 24% or just under 12,000 head. Calf exports increased by 12% to around 101,600
head with the Netherlands accounting for 34% of the total.
-1,297
6,203
11,798 10,945
-2,000
0
2,000
4,000
6,000
8,000
10,000
12,000
14,000
Weanlings Stores Finished Calves
Nu
mb
er
of
anim
als
27
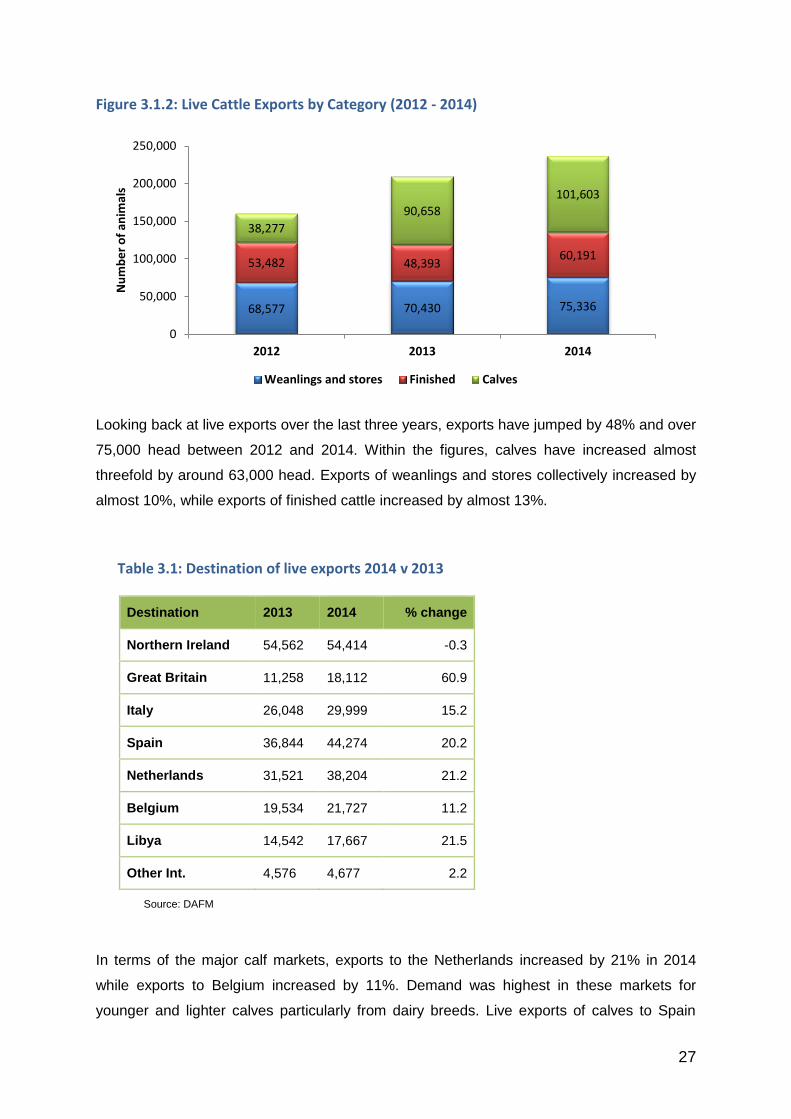
Figure 3.1.2: Live Cattle Exports by Category (2012 - 2014)
Looking back at live exports over the last three years, exports have jumped by 48% and over
75,000 head between 2012 and 2014. Within the figures, calves have increased almost
threefold by around 63,000 head. Exports of weanlings and stores collectively increased by
almost 10%, while exports of finished cattle increased by almost 13%.
Table 3.1: Destination of live exports 2014 v 2013
Destination 2013 2014 % change
Northern Ireland 54,562 54,414 -0.3
Great Britain 11,258 18,112 60.9
Italy 26,048 29,999 15.2
Spain 36,844 44,274 20.2
Netherlands 31,521 38,204 21.2
Belgium 19,534 21,727 11.2
Libya 14,542 17,667 21.5
Other Int. 4,576 4,677 2.2
Source: DAFM
In terms of the major calf markets, exports to the Netherlands increased by 21% in 2014
while exports to Belgium increased by 11%. Demand was highest in these markets for
younger and lighter calves particularly from dairy breeds. Live exports of calves to Spain
68,577 70,430 75,336
53,482 48,393 60,191
38,277
90,658
101,603
0
50,000
100,000
150,000
200,000
250,000
2012 2013 2014
Nu
mb
er
of
anim
als
Weanlings and stores Finished Calves

28
increased by 22% or by almost 7,000 head with demand best for heavier calves particularly
for those from beef breeds.
Irish exports to Italy and Spain recovered on year previous levels. Feed prices have eased
significantly, thereby reducing feed costs for the intensive feedlot sector. However, for most
of the year prices of weanlings in France, the main supplying country have been quite
competitive, which restricts Ireland’s potential to significantly increase market share.
There was a further increase in live exports to non-EU markets. A 17% increase was
recorded due largely to further growth in shipments to Libya and Tunisia while Morocco also
took a number of consignments. The main categories going to these markets were
weanlings and stores.
Exports to Northern Ireland were largely unchanged while exports to Britain increased by
61%. This was driven by an 11% increase in live exports of adult cattle with strong numbers
exported for breeding purposes. Adult and finished cattle comprised approximately 71% of
live exports to the UK.
Live cattle outlook
Further growth in live exports anticipated
The outlook for live cattle exports in 2015 appears broadly positive. Demand for calves for
veal production is likely to be strong. Milk replacer, one of the main production costs, has
fallen significantly in price and the demand for veal is steady in most markets. In the early
spring, some additional calves may be held on farms to use up surplus milk until EU quotas
end on the 1st of April. The Dutch veal sector has a preference for younger calves aged 3-5
weeks. Exports of older, stronger calves tend to focus on the Spanish market.
Demand for Irish and EU livestock from markets in North Africa and the Middle East is
expected to strengthen in 2015. A number of walk-on, walk-off vessels have recently been
inspected by the Department of Agriculture, Food and the Marine and are at an advanced
stage in the approval process. Irish exports are expected to focus especially on the Libyan
market. However, Turkey also looks likely to open their borders to EU animals. This factor
had a significant impact during 2011 and 2012 when Turkish demand caused EU prices to
rise considerably.
3.2 Live sheep Exports Decline in live sheep exports
There was a significant decline in live sheep exports in 2014 with shipments down by 32% to
around 47,000 head. This was largely due to the decline in live sheep exports to Libya which
accounted for more than 21,000 head of the 2013 figure. The main export destinations for
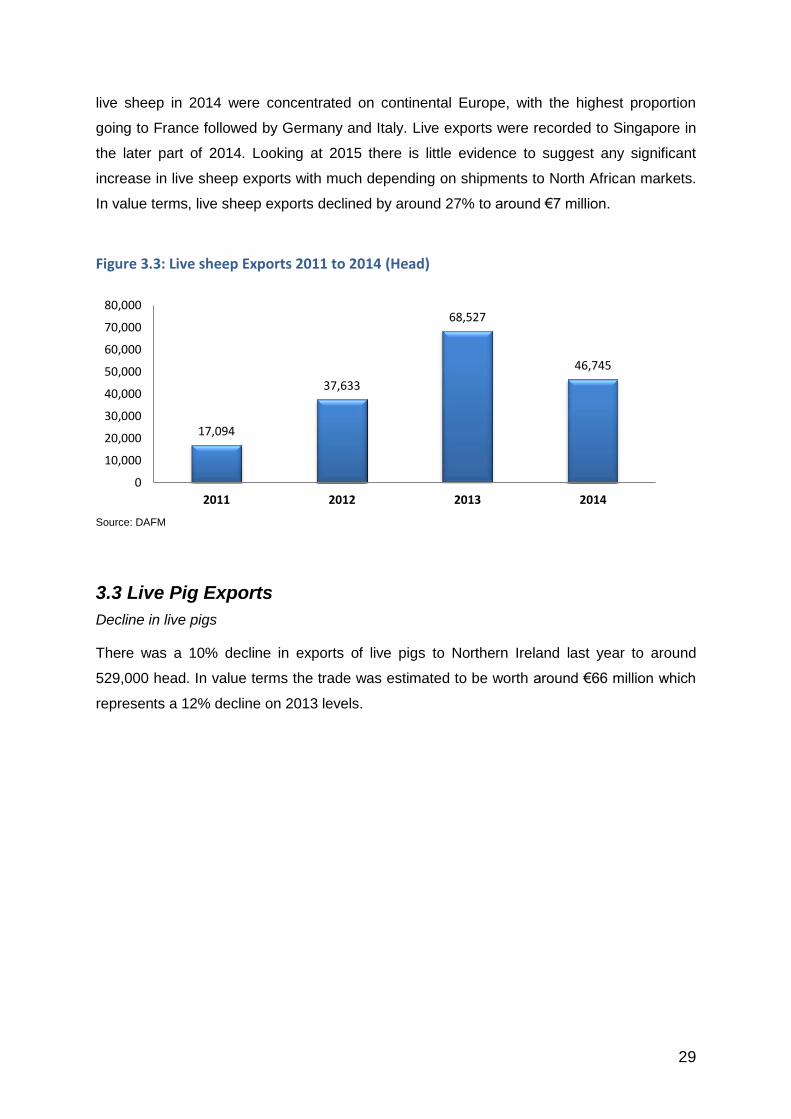
29
live sheep in 2014 were concentrated on continental Europe, with the highest proportion
going to France followed by Germany and Italy. Live exports were recorded to Singapore in
the later part of 2014. Looking at 2015 there is little evidence to suggest any significant
increase in live sheep exports with much depending on shipments to North African markets.
In value terms, live sheep exports declined by around 27% to around €7 million.
Figure 3.3: Live sheep Exports 2011 to 2014 (Head)
Source: DAFM
3.3 Live Pig Exports
Decline in live pigs
There was a 10% decline in exports of live pigs to Northern Ireland last year to around
529,000 head. In value terms the trade was estimated to be worth around €66 million which
represents a 12% decline on 2013 levels.
17,094
37,633
68,527
46,745
0
10,000
20,000
30,000
40,000
50,000
60,000
70,000
80,000
2011 2012 2013 2014

30
4. PIGS AND PIGMEAT
4.1 Pig Herd Size
Overall herd size stabilizes
Irish pig numbers showed a marginal increase in the June 2014 livestock survey. This is
largely due to a rise in the number of breeding pigs of more than 2%. This indicates some
stabilization in the pig herd following declines over the previous two years. There was some
increase in number of gilts which points towards some further increases in output. According
to the latest DAFM pig census, the average size of active pig herd stands at 845 pigs with
the largest proportion of pig population located in counties Cork followed by Cavan and
Tipperary.
Table 4.1: Pig numbers, 2010 to 2014 June Livestock survey* (‘000 head)
000 head** 2010 2011 2012 2013 2014
Total Pigs 1,516 1,549 1,571 1,552 1,555
Breeding Pigs 161 156 146 148 151
Gilts in pig 19 19 20 19 20
Sows in pig 94 91 85 84 83
Other sows 32 30 25 28 32
Gilts not yet served 14 15 15 15 16
Boars 2 1 1 1 1
Fattening Pigs 1,355 1,393 1,425 1,405 1,404
≥ 80 kg 253 250 246 252 259
50kg ≥ ≤ 80kg 294 296 316 304 307
20kg ≥ ≤ 50kg 414 426 419 400 396
<20kg 394 421 444 449 441
Source: CSO June Livestock survey
*figures subject to review and may change
**Note figures may vary due to rounding
The EU pig breeding herd increased by 1% to reach 7.9 million head for the first time in
nearly a decade in 2014. Germany, Spain, Denmark and Netherlands account for around
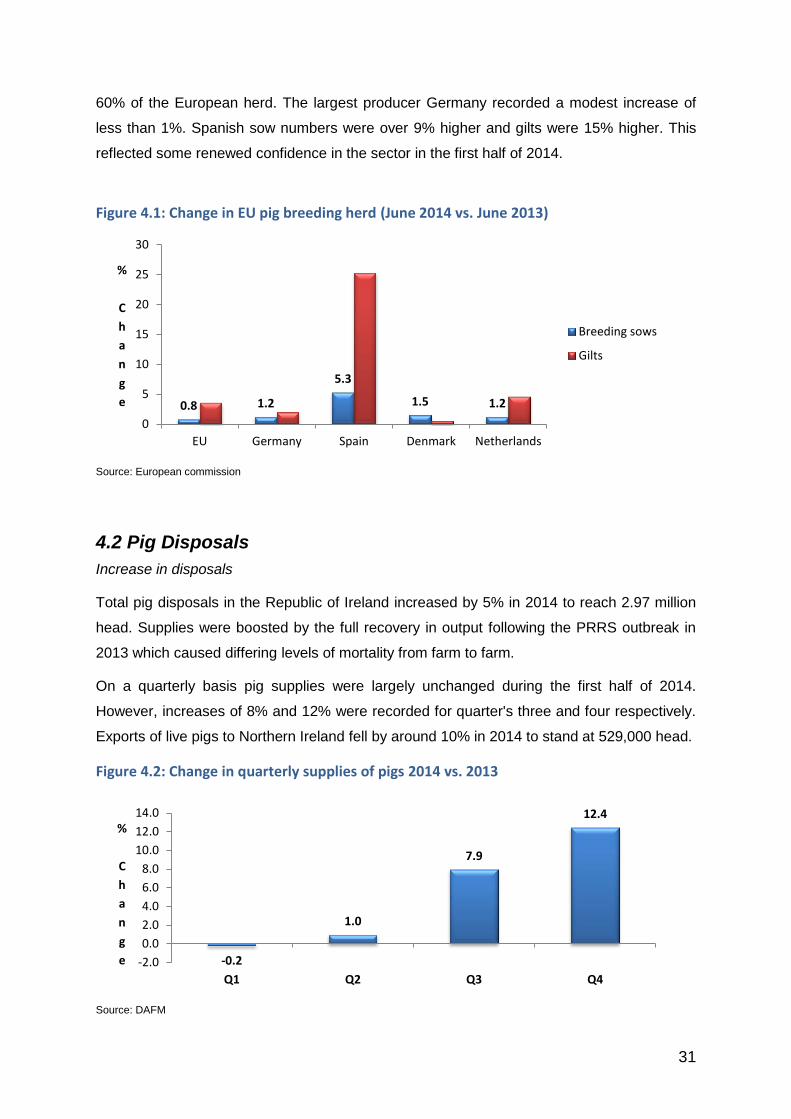
31
60% of the European herd. The largest producer Germany recorded a modest increase of
less than 1%. Spanish sow numbers were over 9% higher and gilts were 15% higher. This
reflected some renewed confidence in the sector in the first half of 2014.
Figure 4.1: Change in EU pig breeding herd (June 2014 vs. June 2013)
Source: European commission
4.2 Pig Disposals
Increase in disposals
Total pig disposals in the Republic of Ireland increased by 5% in 2014 to reach 2.97 million
head. Supplies were boosted by the full recovery in output following the PRRS outbreak in
2013 which caused differing levels of mortality from farm to farm.
On a quarterly basis pig supplies were largely unchanged during the first half of 2014.
However, increases of 8% and 12% were recorded for quarter's three and four respectively.
Exports of live pigs to Northern Ireland fell by around 10% in 2014 to stand at 529,000 head.
Figure 4.2: Change in quarterly supplies of pigs 2014 vs. 2013
Source: DAFM
0.8 1.2
5.3
1.5 1.2
0
5
10
15
20
25
30
EU Germany Spain Denmark Netherlands
%
C
h
a
n
g
e
Breeding sows
Gilts
-0.2
1.0
7.9
12.4
-2.0
0.0
2.0
4.0
6.0
8.0
10.0
12.0
14.0
Q1 Q2 Q3 Q4
%
C
h
a
n
g
e

32
4.3 Output Rise in pigmeat output
Higher pig supplies coupled with the drop in live exports to Northern Ireland and some
increase in carcase weights resulted in Irish pigmeat output increasing by around 6%.
Net production reached around 254,000 tonnes, which was up by 15,000 tonnes on the
previous year. The latest carcase weights for 2014 to a 2% increase with average carcase
weight reaching 80.5 kg. Increased breeding pig numbers point towards an increase in
supplies during 2015.
4.4 Imports Small increase in imports
There was a marginal rise in pigmeat imports in 2014 with the majority of these imports
coming from the UK and mainland Europe overall for the year. Total pigmeat imports are
estimates to have reached 101,000 tonnes.
Table 4.4: Pigmeat Balance sheet 2010 to 2015* (‘000 tonnes cwe)
‘000 tonnes cwe 2010 2011 2012 2013 2014 (e) 2015 (f *)
GIP Production 269 288 281 285 296 307
Net Production 215 235 242 239 254 265**
Pigmeat Imports 72 77 81 99 101 99
Pigmeat Exports 150 181 197 193 207 214
Consumption
'000 Tonnes 137 131 126 145 148 150
Kg/head*** 31.6 32.6 27.5 31.6 32.1 32.4
Source: CSO/Bord Bia Estimates
*figures for 2014 are subject to review and 2015 are forecast figures
**Midpoint based on assumed increased throughput
***Note assuming no change in population growth rate
4.5 Consumption Contrasting pigmeat consumption
There was a decline in retail pork sales in Ireland in 2015 due largely to a decline in volume
purchased per buyer coupled with reduced frequency of purchase. In contrast retail sales of
bacon showed a rise of 7% while sausage volumes jumped by 6%.
Figures for the early months of 2015 suggest that pork sales remain under pressure while
bacon and sausages continue to grow.
Bacon sales comprise around 40% of total retail pigmeat sales and are dominated by the
sales of bacon joints and rashers. Pork retail sales make up around 25% of pigmeat retail

33
sales and are comprised mainly of pork chops and joints which make up 42% and 27% of
the total. Sausages make up 22% while sliced meats make up 13% of retail pigmeat sales.
Figure 4.5: Proportion of retail pigmeat sales in volume terms
Source: Kantar World Panel 52 w/e 01 Feb 2015
4.6 Exports
Exports up across all regions
There was an increase in overall exports by around 7% in 2014, reaching 207,000 tonnes.
Increased volumes were partly offset by a 4% reduction in average price which left the value
of Irish pigmeat exports 3% higher at around €570 million.
Focussing on markets, Irish pigmeat shipments to the United Kingdom performed well with
volumes 8% higher at 84,000 tonnes. The value of this trade is estimated at €330 million,
which is broadly similar to a year earlier.
Figure 4.6.1: Distribution of pigmeat exports (% of volume)
Source: Bord Bia Estimates
Pork, 25%
Sausages, 22%
Bacon, 40%
Sliced fresh meats, 13%
40
23
37
41
20
39
0
5
10
15
20
25
30
35
40
45
UK Other EU Int. Markets
2013 2014
34
Exports to the Continental EU markets showed a rise in 2014 driven mainly by a strong
increase in shipments to Denmark, which more than offset lower exports to Germany with
some rises also shown in exports to Sweden and France. For the year, exports to the
Continent are estimated to have reached 43,000 tonnes and were worth an estimated €95m.
Exports of Irish pigmeat to International markets performed strongly despite the issues with
supplying Russia. Outside of the UK, China remains the second most important market in
volume terms, with exports growing by 17%, reflecting the ongoing increase in demand.
As a result of the Russian market being effectively closed to Irish exporters from the end of
January, product that would usually be directed towards this market has been redirected to
different locations such as South Korea and the Philippines. Between these two markets,
exports for the year increased fivefold to over 16,000 tonnes.
A strong recovery in Japanese demand especially for belly was also evident, with exports
running 3 times higher at over 12,000 tonnes. The Australian market which reopened for
uncooked pigmeat product in March 2013 continues to show good potential.
For the year exports of Irish pigmeat to markets outside of the EU are estimated to have
grown by 9% to around 80,000 tonnes. This trade was valued at an estimated €140m.
Outlook for 2015
The prospects for the pigmeat sector in 2015 are difficult to call as increased output, the
ongoing absence of the Russian market for many exporters and the ongoing effect of the
porcine epidemic diarrhea virus point to a mixed market environment for the early part of the
year. However, demand in key Asian territories should be boosted by tight supplies.
Forecasts for the EU points towards a marginal rise in pig supplies reflecting the expansion
of 1% in the sow herd in June 2014. The European Commission is expecting some further
recovery in pigmeat consumption across the region in 2015 with a rise of 1% forecast.
The latest Rabobank quarterly report suggests that US producers are likely to have to
combat PEDv again this winter. However with the US breeding herd rising and carcase
weights increasing, the USDA predicts that output will rise by 5% to 10.9 million tonnes in
2015. The main beneficiary from the Russian import ban is Brazil. To illustrate the
dependence on Brazil for Russian importers, in September 2014, shipments from Brazil to
Russia represented 75% of total imports.
In China, sow numbers are at their lowest level since January 2009. This reflects producers
exiting the industry due to losses being incurred combined with hog productivity improving.
On the back of this development, Chinese imports are expected to grow strongly into 2015.

35
According to the USDA, Chinese imports during 2015 are expected to increase by around
24% to 1 million tonnes.
4.7 Pig Prices
Drop in average pig price in 2014
The average Irish Grade E pig price stood at €1.59/kg in 2014, which was almost 5% behind
2013 levels. Prices during the early part of 2014 were subdued reflecting slow demand from
the Christmas period. Despite the Russian ban on Irish pigmeat exports, prices improved
from quarter one onwards and peaked during the month of July. Irish prices peaked in July
at €1.72/kg.
Figure 4.7.1: Irish Grade ‘E’ Pig Prices, 2012 to 2014 (c/kg dw excl. VAT)
Source: DAFM
Irish prices were 101% of average EU prices in 2014, an improvement of 6% on 2013.
Figure 4.7.2 compares Irish, EU and UK average prices with the UK showing the highest
average price. Further strengthening in sterling against the euro contributed to this
differential.
Figure 4.7.2: Ireland Grade ‘E’ pig price v UK and EU prices, 2014
Source: European Commisison
100110120130140150160170180
Jan Feb Mar Apr May Jun Jul Aug Sep Oct Nov Dec
2012 2013 2014
130
140
150
160
170
180
190
200
Jan Feb Mar Apr May Jun Jul Aug Sep Oct Nov Dec
Ce
nts
/ kg
DW
Ireland EU United Kingdom

36
Pigmeat Supply Chain
Source: Bord Bia Estimates
Export Meat Plants
247,000t
Exports
207,000t
Consumption
148,000t
Local Abattoirs
7,000t
Total Production
254,000t
Pigmeat Imports
101,000t
Total Pigmeat Availability
355,000t
Key pigmeat market drivers for 2015
Further increase in Irish supplies.
Modest increase in EU pigmeat production.
Global output to grow by more than 1% on back of lower feed costs and increase in demand.
Russian restrictions to persist.
37
5. SHEEP AND SHEEPMEAT
5.1 Flock size
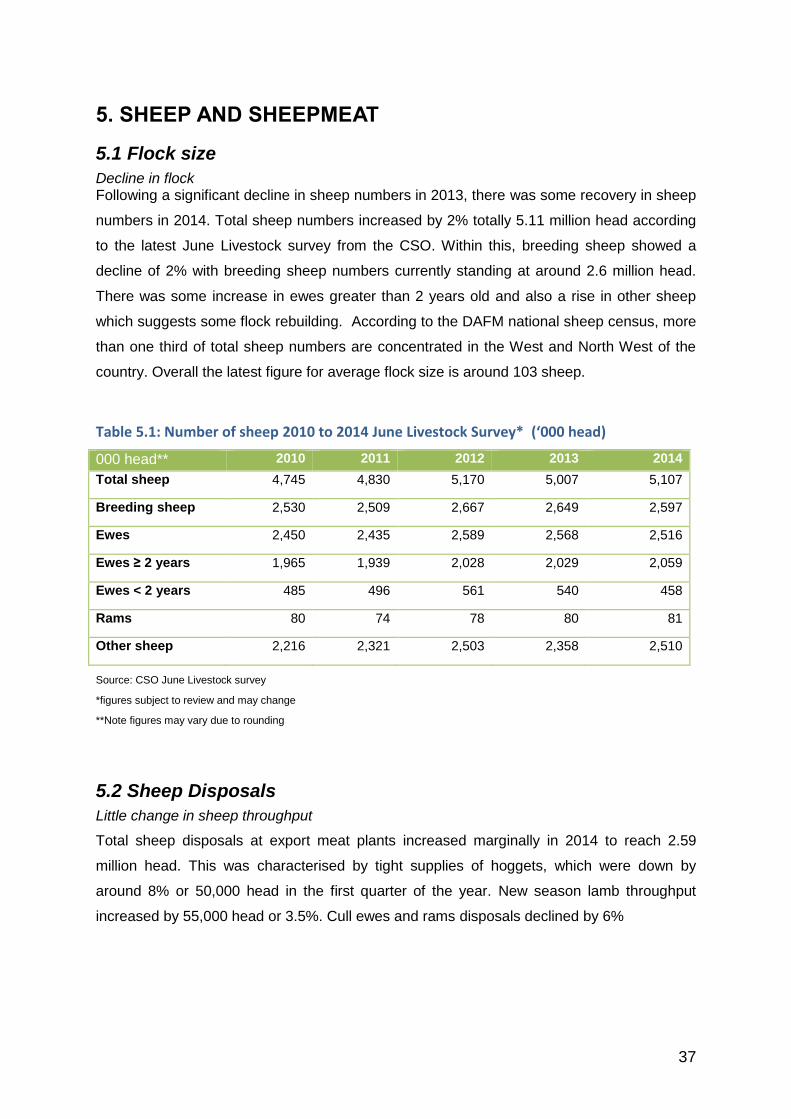
Decline in flock Following a significant decline in sheep numbers in 2013, there was some recovery in sheep
numbers in 2014. Total sheep numbers increased by 2% totally 5.11 million head according
to the latest June Livestock survey from the CSO. Within this, breeding sheep showed a
decline of 2% with breeding sheep numbers currently standing at around 2.6 million head.
There was some increase in ewes greater than 2 years old and also a rise in other sheep
which suggests some flock rebuilding. According to the DAFM national sheep census, more
than one third of total sheep numbers are concentrated in the West and North West of the
country. Overall the latest figure for average flock size is around 103 sheep.
Table 5.1: Number of sheep 2010 to 2014 June Livestock Survey* (‘000 head)
000 head** 2010 2011 2012 2013 2014
Total sheep 4,745 4,830 5,170 5,007 5,107
Breeding sheep 2,530 2,509 2,667 2,649 2,597
Ewes 2,450 2,435 2,589 2,568 2,516
Ewes ≥ 2 years 1,965 1,939 2,028 2,029 2,059
Ewes < 2 years 485 496 561 540 458
Rams 80 74 78 80 81
Other sheep 2,216 2,321 2,503 2,358 2,510
Source: CSO June Livestock survey
*figures subject to review and may change
**Note figures may vary due to rounding
5.2 Sheep Disposals
Little change in sheep throughput
Total sheep disposals at export meat plants increased marginally in 2014 to reach 2.59
million head. This was characterised by tight supplies of hoggets, which were down by
around 8% or 50,000 head in the first quarter of the year. New season lamb throughput
increased by 55,000 head or 3.5%. Cull ewes and rams disposals declined by 6%

38
Figure 5.2.1: Distribution of sheep disposals, 2014
Source: DAFM
Table 5.2: Irish Sheep Supplies, 2014 vs 2014 (‘000 head)
2013 2014 % Ch
Total sheep 2,616 2,599 -0.7%
Hoggets 643 593 -8%
Lambs 1,598 1,653 +4%
Ewes and rams 375 353 -6%
Source: DAFM/Bord Bia
*Note figures are rounded
Despite tight supplies in the early part of the year supplies of lambs and hoggets recovered
to show a marginal increase in 2014 to reach 2.25 million head. This was due to excellent
lambing conditions with increased levels of prolificacy and optimum grazing conditions
particularly during the Spring and Summer months. Higher demand in summer and late
autumn also contributed to earlier marketings.
Quarterly disposal figures are given in figure 5.2.2 which highlight that the largest decline in
supply was in quarter one, which was 12% lower than a year earlier. The last quarter of
2014 showed a drop of 6% in supplies.
Lambs , 64%
Hoggets, 23%
Ewes and rams, 13%

39
Figure 5.2.2: Percentage change in quarterly hogget/lamb supplies 2014 vs 2013
Source: DAFM
Looking at 2015, any significant change in supplies is unlikely. Higher lamb disposals also in
2014 point to tight hogget supplies this spring. Looking beyond the early part of the year,
availability will depend on lambing and grazing conditions. However the increased price
positivity and demand in 2014 is likely to boost producer confidence and ultimately new
season supplies.
5.3 Output Little change in production
For the full year 2014, net production totalled around 58,000 tonnes (cwe), which was
marginally ahead of the previous year. This represents an 8% increase in net production
since 2012.
Increased throughput and some rise in carcase weights helped edge net production
upwards. Excellent grazing conditions throughout the year resulted in an increase in carcase
weights by 0.18kg or just less than 1%. This recovery followed a 3% decline in carcase
weights in 2013. Some further increase in net production is anticipated for 2015.
-12.3
15.5
5.1
-5.9
-15.0
-10.0
-5.0
0.0
5.0
10.0
15.0
20.0
Q1 Q2 Q3 Q4

40
Figure 5.3: Average lamb carcase weights 2009 to 2014 (e)
Source: DAFM
Table 5.3: Sheepmeat Balance sheet* 2010 to 2015 (f*) (‘000 tonnes cwe)
2010 2011 2012 2013 2014(e) 2015(f*)
GIP Production 44.0 39.0 45.2 50.0 51.7 52.0
Net Production 47.8 48.1 53.7 57.5 58.0 59.5
+ Sheepmeat Imports 3.5 3.5 4.0 5.0 4.0 3.9
- Sheepmeat Exports 35.5 36.5 41.5 47.5 46.5 47.5
Consumption
- '000 Tonnes cwe 15.8 15.1 16.2 15.0 15.5 15.9
- Kg/head** 3.5 3.4 3.5 3.3 3.4 3.4
Source: CSO/Bord Bia Estimates
*figures are subject to review and 2015 are forecast figures
**Midpoint based on assumed increased throughput
***Note assuming no change in population growth rate
5.4 Imports
Decline in lamb imports
Sheepmeat imports into Ireland declined by over 20% in 2014 to around 4,000 tonnes. Over
90% of imports come from the UK. For the full year it is estimated that total imports will show
little change in 2015.
19
19.2
19.4
19.6
19.8
20
20.2
20.4
2009 2010 2011 2012 2013 2014 (e)
Kg
DW

41
6.5 Consumption
Recovery in consumption
Lamb consumption on the Irish market showed an increase of 3% in 2014 to reach an
estimated 15,500 tonnes in 2014. As shown by figure 5.5 below lamb joints comprise of the
majority of products purchased at retail level at 44% of sales with a rise of 2% recorded.
Lamb chops made up around 34% of retail sales with lamb mince comprising a 12% share.
Figure 5.5: Proportion of retail lamb volume sales by product
Source: Kantar World Panel 52 w/e 01 Feb 2015
5.6 Exports UK and France remain main destinations
Overall exports declined by around 2% in 2014 totally 46,500 tonnes based on reduced
throughput coupled with some rise in domestic consumption. In value terms this amounts to
around €218 million up marginally on the previous year’s value. The UK and France continue
to be the core markets for Irish sheepmeat accounting for 60% of total export volumes.
However, they continue to lose ground as their value share of exports has fallen from 63% to
just below 55% in the last two years. Exports to France eased slightly to 19,000 tonnes and
were valued at €90 million. Shipments to the United Kingdom stood at around 11,000
tonnes.
Key growth markets are Germany, Belgium, Sweden, Denmark and Switzerland. While
Switzerland commands pole position for the highest €/tonne price return, Denmark which
has registered 23% volume growth in the last year earned a 60% premium above the
average global export price.
Chops, 34%
Steaks, 3%
Joints, 44%
Mince/Casserole, 12%
Burger, 1% Stewing, 4% Value Added , 2%

42
While Belgian sheepmeat imports have fallen by a third since 2009, due to a 75% reduction
in New Zealand exports, Ireland has grown its exports threefold. In 2014, Ireland exported
an estimated €19 million worth of sheepmeat into Belgium. Irish lamb exports to Sweden
performed well with volumes estimated to have reached 3,500 tonnes in 2014. Ireland
overtook New Zealand to become Sweden’s largest sheep meat supplier in 2013 accounting
for almost 30% of imports. In Denmark Ireland has become the number one imported
supplier accounting for almost one in every four tonnes of sheepmeat, equivalent to 1,100
tonnes. Exports in 2014 are projected to have been valued at €9million, a 36% increase on
2013 levels.
5.7 Outlook Further decline in EU sheepmeat production
The global sheepmeat market continues to become more polarised between the traditional
markets of Europe where production is in decline and demand remains subdued and the
accelerated growth in sheep meat imports in emerging economies where domestic supplies
are unable to match demand. Growing demand from the Far East and a shrinking supply
base in Europe and Oceanic regions has resulted in a significant increase in world
sheepmeat prices.
These developments are leading to a narrowing of the price differential between NZ and
European lamb. Given the attractiveness of the Irish lamb proposition, European
retail/foodservice buyers are making the switch over to Irish lamb. Reduced price volatility is
also evident in Europe as demonstrated by the fact that during the transition from hogget to
new season lamb prices remained above the €5/kg mark throughout the months of June and
it wasn’t until early July when the main volumes of UK lamb came onto the market that
prices realigned downwards.

43
Figure 5.7.1: Distribution of Irish sheepmeat volumes 2014 (%)
Source: Bord Bia estimates
Some further decline in EU sheep supplies is anticipated for 2015. This reflects the declining
breeding flock across a number of key producing countries such as Spain where production
is set to decline by a further 9% in 2015. However, this is set to be offset somewhat by a
modest rise in production in France and the UK.
The EU will continue to remain a net importer of sheepmeat. It is hoped that a modest
reduction in output, a strong live trade and a forecast drop in New Zealand output will help
price levels.
The distribution of New Zealand lamb exports is set to continue to lean towards Asia with
China accounting for 40% of shipments during the first 10 months of 2014, compared to 32%
to the EU. With global demand likely to remain firm, lower New Zealand and Australia
supplies due to drought are expected to help maintain global sheep prices.
Figure 5.7.2: Distribution of New Zealand sheepmeat export volumes (%)
Source: GTIS
0
5
10
15
20
25
30
35
40
45
France UK Other EU Int. Markets
2013 2014
0
5
10
15
20
25
30
35
40
45
50
EU China Other Asia MENA Nth. America Other
2010 2014

44
At a time when global sheepmeat demand is growing, particularly in the Middle East and
China and NZ supplies are back, global sheep prices are expected to remain strong.
5.8 Lamb Prices
Rise in lamb prices
On average, Irish lamb prices were around 4% higher in 2014 at €4.74 /kg dw excl. VAT.
The highest prices were recorded in April with the lowest prices evident in the third quarter of
the year particularly during September and October. Tight supplies particularly in the first
half of the year coupled with strong demand drove this increase in prices. Looking towards
the rest of this year, prices will depend largely on the level of supply after lambing coupled
with demand developments.
Figure 5.8: Irish Lamb Prices, 2012 to 2014 c/kg dw excl. VAT)
Source: DAFM
300
350
400
450
500
550
600
Jan Feb Mar Apr May Jun Jul Aug Sep Oct Nov Dec
2012 2013 2014

45
Sheepmeat Supply Chain
Source: Bord Bia Estimates
Export Meat Plants
52,000
Exports
46,500t
Consumption
15,500t
Local Abattoirs
6,000
Total Production
58,000t
Sheepmeat Imports
4,000t
Total Sheepmeat Availability
62,000t
Key sheepmeat market drivers for 2015
Relatively tight Irish sheep supplies.
Stable domestic demand.
Continued decline in Production.
Reduced availability of New Zealand lamb.
Stable consumer demand across Europe
46
6. POULTRY
6.1 Poultry Disposals Decline in disposals
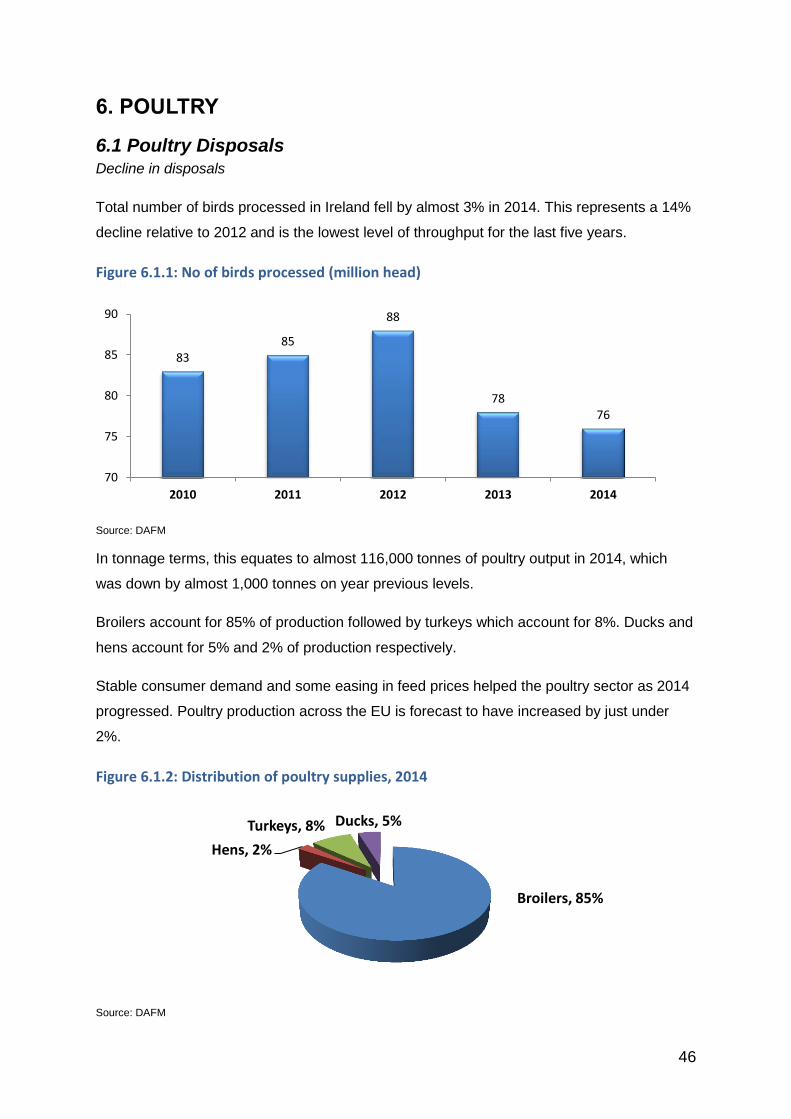
Total number of birds processed in Ireland fell by almost 3% in 2014. This represents a 14%
decline relative to 2012 and is the lowest level of throughput for the last five years.
Figure 6.1.1: No of birds processed (million head)
Source: DAFM
In tonnage terms, this equates to almost 116,000 tonnes of poultry output in 2014, which
was down by almost 1,000 tonnes on year previous levels.
Broilers account for 85% of production followed by turkeys which account for 8%. Ducks and
hens account for 5% and 2% of production respectively.
Stable consumer demand and some easing in feed prices helped the poultry sector as 2014
progressed. Poultry production across the EU is forecast to have increased by just under
2%.
Figure 6.1.2: Distribution of poultry supplies, 2014
Source: DAFM
83 85
88
78 76
70
75
80
85
90
2010 2011 2012 2013 2014
Broilers, 85%
Hens, 2%
Turkeys, 8% Ducks, 5%

47
6.2 Consumption Increased consumption
Retail sales of poultry increased by 10% to reach 42,000 tonnes for the 52 week ending
period, the 1st February 2015. Most of this increase was due to the volume purchased per
buyer increasing, which jumped by 7% combined with an extra 2% from buyers now
shopping in the category. Frequency of purchase was also up followed by an increase in
total households purchasing poultry.
The majority of retail poultry sales are made of whole chickens, followed by chicken fillets
and chicken wings/legs. The remainder is made up of valued added chicken, turkey and
duck.
6.3 Trade Rise in Irish exports
For the year it is estimated that the value of Irish poultry exports increased by 29% to reach
€310m, helped by stronger processed poultry exports. The value of trade to the United
Kingdom jumped by 20% in 2014, driven by increased shipments of processed poultry.
Around three quarters of Irish exports are destined for the UK market. A high portion of
shipments are redirected to International markets through agents for product like chicken
feet in particular. For the year trade was valued at an estimated €255m or some 82% of the
total.
Exports to other European markets performed well in value terms led by France and the
Netherlands. Trade was valued at €49m. Trade to international markets eased in 2014 to
just under €12 million with most product destined for Africa. Other markets showing strong
growth included South Africa and Germany, albeit from a considerably lower base.
Irish imports of poultry increased by over 10% for the full year 2014. Some of this produce is
processed here and re-exported as final product. Therefore in terms of exports, Irish exports
increased by 20% to 122,000 tonnes for the full year 2014.
On an international level, imports into the EU were around 4% higher driven by stronger
shipments from Brazil and Thailand. EU exports increased by a similar amount, driven by
stronger trade to Africa and Asia.

48
6.4 Outlook Further growth anticipated
Strong fundamentals have supported poultry demand in almost all regions of the world in
2014 and this is expected to continue in 2015. Worldwide supply of chicken is relatively tight,
while competing global meat prices are increasing due to low supply. Some further growth is
anticipated in EU poultry production for 2015 while global output is forecast to rise by 2.6%
with all major producers expected to grow led by China, Brazil, the United States and
Russia.
A challenge to the poultry industry is the new avian influenza strain (H5N8) detected in
Europe that is similar to strains reported to be circulating in Asia earlier in 2014. Germany,
the Netherlands, Italy, the UK, Bulagria, Hungary and the United States have confirmed
finding the H5N8 flu on poultry farms. Similarly Canada, Nigeria and a number of Asian and
Middle East countries have also confirmed cases of this virus. This flu is highly pathogenic
for domesticated poultry, causing significant mortality in chickens and turkeys. The virus can
also infect wild birds, which show few signs of illness.
6.5 Prices Ease in EU broiler prices
The EU broiler price for 2014 ended was around 2% lower at €1.91 per kg. Prices eased in
response to lower demand, low competing pork prices and price competition at retail level.
However, UK broiler prices recorded a 7% rise in 2014.
Figure 6.5: Average annual average EU and UK broiler price
Source: European commission
120.00
140.00
160.00
180.00
200.00
2004 2005 2006 2007 2008 2009 2010 2011 2012 2013 2014
Ce
nts
/ k
g
UK EU Avg
Key poultry market drivers for 2015
Modest rise in EU poultry production.
EU trade to be marginally higher
Stable consumer demand across Europe

49
For statistical appendices click here