Embed Size (px)
Citation preview

Underwritten by
2014 AFP Payments Fraud and Control SurveyReport of Survey Results
l l l l l l l l l l l l l l l l l l l l l l l l l l l l l l l l l l l l l l l l l l l l l l l l l l l l l l l l l l l l l l l l l l l l l l l l l l l l l l l l l l l l l l l l l l l l l l l l l l l l l l l l l l l l l
Association for Financial Professionals4520 East-West Highway, Suite 750Bethesda, MD 20814Phone 301.907.2862 Fax 301.907.2864 www.AFPonline.org
2014 AFP Payments Fraud and Control SurveyReport of Survey Results
April 2014
Underwritten by
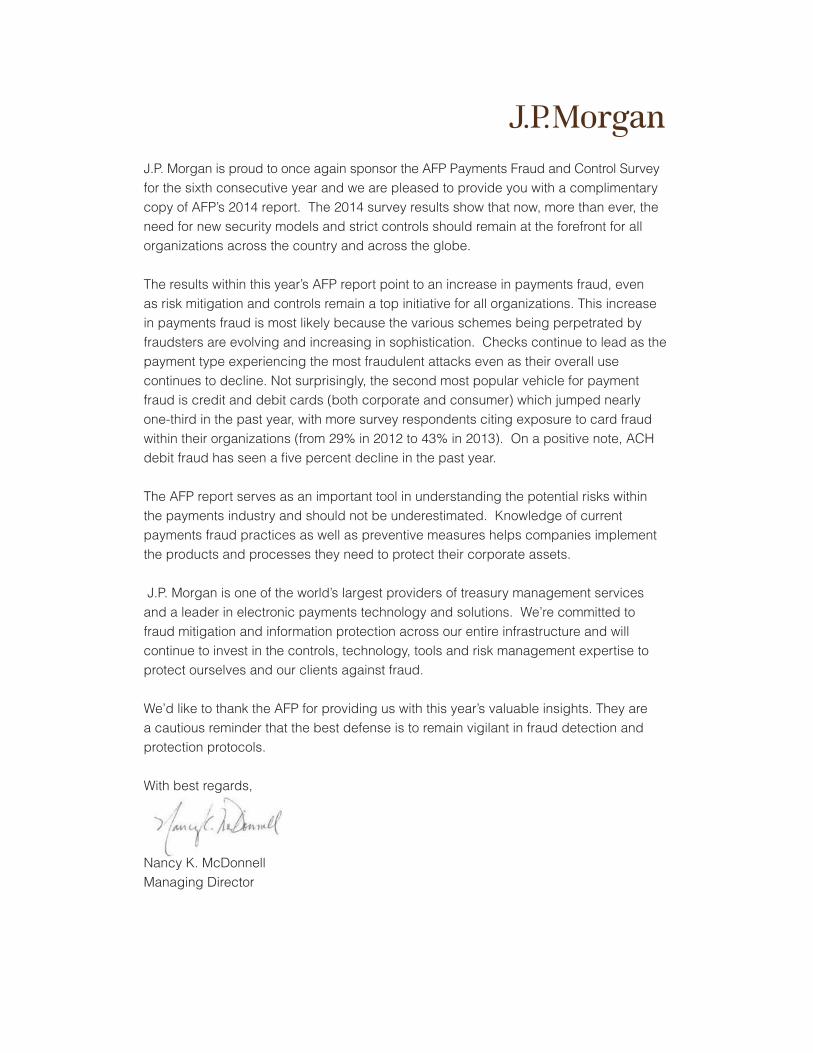
J.P. Morgan is proud to once again sponsor the AFP Payments Fraud and Control Survey for the sixth consecutive year and we are pleased to provide you with a complimentary copy of AFP’s 2014 report. The 2014 survey results show that now, more than ever, the need for new security models and strict controls should remain at the forefront for all organizations across the country and across the globe. The results within this year’s AFP report point to an increase in payments fraud, even as risk mitigation and controls remain a top initiative for all organizations. This increase in payments fraud is most likely because the various schemes being perpetrated by fraudsters are evolving and increasing in sophistication. Checks continue to lead as the payment type experiencing the most fraudulent attacks even as their overall use continues to decline. Not surprisingly, the second most popular vehicle for payment fraud is credit and debit cards (both corporate and consumer) which jumped nearly one-third in the past year, with more survey respondents citing exposure to card fraud within their organizations (from 29% in 2012 to 43% in 2013). On a positive note, ACH debit fraud has seen a five percent decline in the past year.
The AFP report serves as an important tool in understanding the potential risks within the payments industry and should not be underestimated. Knowledge of current payments fraud practices as well as preventive measures helps companies implement the products and processes they need to protect their corporate assets.
J.P. Morgan is one of the world’s largest providers of treasury management services and a leader in electronic payments technology and solutions. We’re committed to fraud mitigation and information protection across our entire infrastructure and will continue to invest in the controls, technology, tools and risk management expertise to protect ourselves and our clients against fraud.
We’d like to thank the AFP for providing us with this year’s valuable insights. They are a cautious reminder that the best defense is to remain vigilant in fraud detection and protection protocols.
With best regards,
Nancy K. McDonnellManaging Director
www.AFPonline.org ©2014 Association for Financial Professionals, Inc. All Rights Reserved 1
2014 AFP Payments Fraud and Control Survey
IntroductionBusinesses in the U.S. continue to be vulnerable to fraud, which most often originates outside of organizations. In addition to financial losses incurred as a consequence of fraud, companies face a greater threat of their financial, client-related and other “secure” information and data being compromised. One has only to look at the recent high-profile security breaches during the holiday months in 2013 when several large retailers across the U.S. experienced thefts of payments information and customer data. In light of such events, companies have to stay on their toes as they guard themselves and their consumers from similar threats.
Financial professionals are tasked with anticipating possible fraud attempts on their organizations, a task that is increasingly challenging as criminals use techniques that are continually more sophisticated and constantly evolving. To help address that challenge, the Association for Financial Professionals® (AFP) has conducted an annual survey each year since 2005 to examine the nature and frequency of fraudulent attacks on business-to-business payments and the industry tools used to control payments fraud. Continuing that effort, AFP conducted its annual Payments Fraud and Control Survey in January 2014 to review the payments fraud experiences of organizations during 2013. Results of that survey are reflected in this report, the 2014 AFP Payments Fraud and Control Survey.
This year’s report reveals that a majority of organizations continued to be impacted by payments fraud in 2013 and are on heightened alert as a result of the recent security breaches at major retailers. Survey results highlight the importance for organizations to take appropriate measures to minimize their exposure to fraud attacks. As in previous studies, this year’s report again reviews the relationship of key organizational characteristics—size (as measured by annual revenues) as well as the number of payment accounts organizations maintain. Also included is data on the forthcoming shift of liability from card issuers to merchants on investment in card acceptance fraud prevention solutions, as well as the effectiveness of EMV chip cards in reducing fraud.
AFP thanks J.P. Morgan for its long-time and continued underwriting support of payments fraud-related survey research at AFP, including this year’s report. Both questionnaire design and the final report, along with its content and conclusions, are the sole responsibility of the AFP Research Department. Information on survey methodology can be found at the end of this report.

HIG
HLI
GH
TS
Of S
urve
y R
esul
tsof organizations were exposed to actual or attempted payments fraud in 2013. 60%
of financial professionals that experienced payments fraud in 2013 report the number of fraud incidents increased from 2012.
27%
of financial professionals from organizations that experienced payments fraud report a decrease in fraud incidents in 2013 compared to 2012.
16%
of survey respondents report that checks were the primary target for fraud attacks at their companies.
82%
of survey respondents from organizations exposed to fraud attacks, report credit/debit cards were targeted.
43%
$23,100The typical financial loss incurred by companies due to payments fraud in 2013 was
www.AFPonline.org ©2014 Association for Financial Professionals, Inc. All Rights Reserved 3
2014 AFP Payments Fraud and Control Survey
Fraud Overview • Sixty percent of organizations were exposed to actual or attempted payments
fraud in 2013, a share similar to the 61 percent that reported fraud in 2012 and eight percentage points lower than the incidence of such fraud in 2011. - Sixty-six percent of organizations with annual revenues of at least $1 billion
were victims of payments fraud in 2013; half of organizations with annual revenues of less than $1 billion suffered payments fraud last year.
• Twenty-seven percent of survey respondents whose organizations were impacted by payments fraud report that the number of fraud incidents increased in 2013 compared to 2012, while 16 percent indicate a decrease and 57 percent report no change.
• Checks continue to be the dominant payment form targeted by fraudsters, with 82 percent of survey respondents indicating that checks were targeted at their companies. Overall, the percentage of organizations affected by payments fraud via other payment methods were: - Credit/debit cards including corporate and consumer cards (cited by 43 percent
of financial professionals, a significant increase from 29 percent in 2012) - ACH debit fraud (22 percent of financial professionals, a decline from 27 percent in 2012)- Wire transfers (14 percent, up from 11 percent)- ACH credits (9 percent, up from 8 percent)
• Seventy percent of companies exposed to actual or attempted fraud in 2013 experienced no financial loss as a result. • Eighty percent of companies that experienced attempted or actual payments fraud
did so as a result of fraud originating from outside the organization.
Payment Accounts and Access Controls• Forty-six percent of financial professionals agree there is a benefit in consolidating
the number of bank accounts associated with payments into a Shared Service Center (SSC) or Payments Factory.
• With the forthcoming shift in credit/debit card liability from issuers to merchants, 22 percent of organizations that do accept credit/debit cards from their custom-ers anticipate a significant impact from their investment in card acceptance fraud prevention methods/solutions; 50 percent expect there to be “some” impact.
• The most popular approaches being used to guard against fraud attacks are conducting daily reconciliations (cited by 74 percent of survey respondents) and reviewing and strengthening internal procedures (73 percent).
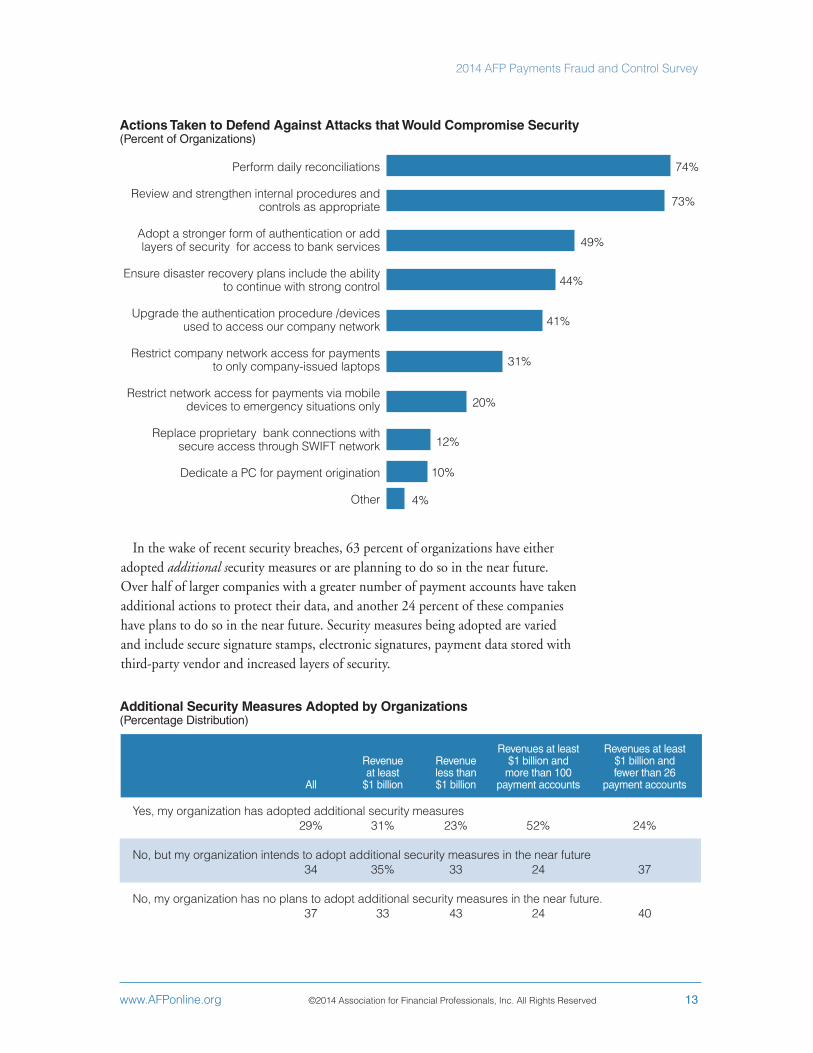
• As a consequence of the recent security breaches at major U.S. retailers, 63 percent of organizations have either adopted additional security measures or
are planning to do so in the near future.
Highlights of Survey ResultsThe key findings of the 2014 AFP Payments Fraud and Control Survey include:
4 ©2014 Association for Financial Professionals, Inc. All Rights Reserved www.AFPonline.org
2014 AFP Payments Fraud and Control Survey
Check, ACH and Card Payments Fraud and Trends• The most prevalent check fraud method is “counterfeiting by altering the MICR
line on the check” (cited by 62 percent of survey respondents). • “Positive pay” (81 percent) and “daily reconciliations and other internal processes”
(78 percent) are the approaches used most often to guard against check fraud.• Seventeen percent of organizations that were victims of at least one attempt of
check fraud during 2013 suffered a financial loss from that fraud. • Nineteen percent of organizations that were exposed to at least one ACH fraud
attempt in 2013 suffered a financial loss as a result. • The primary reason for financial loss from ACH fraud is lack of use of debit
blocks or ACH debit filters (cited by 50 percent of respondents). • Corporate/commercial card fraud was most often perpetrated by an unknown
external party (57 percent). • Most survey respondents expect the switch to EMV chip cards will result in
either a major reduction (cited by 20 percent of respondents) or some reduction (72 percent) in fraud.
• A majority of respondents (69 percent) believe that if EMV chip cards are successful in reducing card acceptance fraud, fraud activity will migrate to other
payment methods.

www.AFPonline.org ©2014 Association for Financial Professionals, Inc. All Rights Reserved 5
2014 AFP Payments Fraud and Control Survey
Payments Fraud OverviewPayments and payment methods are often targets of fraud. Fraudsters use a variety of techniques to tamper with an organization’s security controls in order to obtain funds. Protecting against payments fraud is often a cat-and-mouse game, especially as technology continues its rapid evolution. But technology can also be used to protect payments. In addition, various fraud-fighting tools seem to be having some success, as the level of payments fraud experienced by organizations declined slightly since the previous survey.
Sixty percent of financial professionals report that their organizations were targets of payments fraud in 2013. While this is a very slight decline from the prior year, it is a 13-percentage point decline from 2009 when the share of organizations experienc-ing payments fraud peaked, and is only five percentage points greater than the figures reported in AFP’s initial payments fraud survey (covering 2004 fraud activity).
All Revenues Revenues Revenues at least Revenues at least at least less than $1 billion and $1 billion and $1 billion $1 billion more than 100 fewer than 26 payment accounts payment accounts
Percent of Organizations Subject to Attempted or Actual Payments Fraud in 2013
60%66%
50% 53%
71%
Large organizations with annual revenues of at least $1 billion are more likely to have been subject to actual and/or attempted payments fraud than are smaller ones. Sixty-six percent of organizations with annual revenues of at least $1 billion were victims of payments fraud in 2013 compared to half of organizations with annual revenues less than $1 billion.
80%
60%
40%
20%
0%2004 2005 2006 2007 2008 2009 2010 2011 2012 2013
55%
68%72% 71% 71% 73% 71%
68%61% 60%
Percent of Organizations Subject to Attempted and/or Actual Payments Fraud

6 ©2014 Association for Financial Professionals, Inc. All Rights Reserved www.AFPonline.org
2014 AFP Payments Fraud and Control Survey
Although the use of checks by organizations has declined, they continue to be the biggest target for those committing payments fraud. Eighty-two percent of organizations that experienced attempted or actual fraud in 2013 were victims of check fraud. This is a decrease from 87 percent in 2012 and could be attributed to the decline in check use.
The second most popular vehicle for payments fraud is credit/debit cards, including corporate cards and consumer cards. Forty-three percent of financial professionals whose organizations were exposed to payments fraud in 2013 indicate that the fraud attempts were on credit/debit cards. This is a significant increase from the 29 percent reporting such fraud in 2012. ACH debit fraud is cited by 22 percent of financial professionals, a decline from 27 percent in the prior year.
Trends in the prevalence of payments fraud at companies in 2013 compared to 2012 were unchanged. Twenty-seven percent of survey respondents whose organizations expe-rienced payments fraud report that the number of incidents of fraud attempts increased in 2013 as compared to 2012. Sixteen percent indicate the number of instances declined, while the majority (57 percent) reports the incidents of payments fraud at their organiza-tions remained unchanged from 2012.
Change in Prevalence of Payments Fraud in 2013 Compared to 2012(Percentage Distribution of Organizations Subject to Attempted or Actual Fraud)
More
About the same
Less
27%
57%
16%
Revenues at least Revenues at least Revenue Revenue $1 billion and $1 billion and All All at least less than more than 100 fewer than 26 (2013) (2012) $1 billion $1 billion payment accounts payment accounts
Checks 82% 87% 86% 72% 91% 87%
Credit/debit cards 43 29 42 36 43 40
ACH debits 22 27 25 13 48 19
Wire transfers 14 11 12 14 13 9
ACH credits 9 8 9 3 22 6
Percent of Organizations Subject to Attempted or Actual Payments Fraud in 2013

www.AFPonline.org ©2014 Association for Financial Professionals, Inc. All Rights Reserved 7
2014 AFP Payments Fraud and Control Survey
Financial professionals from smaller-sized companies (those with annual revenues of less than $1 billion) report a 31 percent increase in fraud incidence in 2013 compared to 2012; survey respondents from larger organizations report a 23 percent increase in the incidence of fraud during the same time frame. A vast majority of financial professionals from larger-sized organizations report that the instances of fraud are relatively unchanged from 2012.
Financial Loss from Fraud AttemptsIn most instances, actual or attempted payments fraud has resulted in relatively small
financial losses. For 39 percent of organizations, the potential loss from fraud is esti-mated at less than $25,000; for 37 percent of organizations the potential loss is between $25,000 and $249,999. The potential loss is $250,000 or more for 17 percent of organizations.
Large organizations with over 100 payment accounts are more likely than other com-panies to experience potential loss in the highest ranges. Twenty-nine percent of financial professionals from these companies indicate the potential loss was greater than $250,000.
Revenues at least Revenues at least Revenue Revenue $1 billion and $1 billion and at least less than more than 100 fewer than 26 All $1 billion $1 billion payment accounts payment accounts
Zero 6% 5% 6% 5% 4%
Up to $24,999 39 29 52 19 37
$25,000-$49,999 12 14 10 5 16
$50,000-$99,999 13 16 11 19 12
$100,000-$249,999 12 14 11 24 15
$250,000 and above 17 22 10 29 16
Potential Financial Loss from Attempted or Actual Payments Fraud in 2013(Percentage Distribution of Organizations Subject to Attempted or Actual Payments Fraud)

8 ©2014 Association for Financial Professionals, Inc. All Rights Reserved www.AFPonline.org
2014 AFP Payments Fraud and Control Survey
Most organizations that were subject to at least one payments fraud attempt did not suffer actual financial losses resulting from the fraud. Seventy percent of or-ganizations that were subject to at least one payments fraud attempt in 2013 did not incur actual losses from the attempt. Sixteen percent realized a financial loss of less than $25,000 while five percent of survey respondents report a loss in excess of $25,000. Again, larger organizations with a greater number of payment accounts are more likely to have experienced direct financial losses and for 11 percent of them, losses exceeded $250,000.
Actual Direct Financial Loss from Payments Fraud in 2013(Percentage Distribution of Organizations Subject to Attempted or Actual Payments Fraud)
Revenues at least Revenues at least Revenue Revenue $1 billion and $1 billion and at least less than more than 100 fewer than 26 All $1 billion $1 billion payment accounts payment accounts
Zero 70% 72% 70% 53% 75%
Up to $24,999 16 13 22 11 15
$25,000-$49,999 3 2 4 – 3
$50,000-$99,999 4 6 – 16 2
$100,000-$249,999 2 3 1 11 2
$250,000 and above 5 5 4 11 3

www.AFPonline.org ©2014 Association for Financial Professionals, Inc. All Rights Reserved 9
2014 AFP Payments Fraud and Control Survey
As in previous years, checks are the payment method that accounted for the greatest financial loss as a result of fraud in 2013. Yet, the percentage of organizations that suffered financial loss as a result of such fraud declined from 69 percent in 2012 to 57 percent in 2013. Fraudulent use of corporate cards was responsible for 23 percent of actual financial loss, an increase from the 10 percent reported in 2012. Larger organizations with more than 100 payment accounts experienced losses due to fraud from a greater mix of payment methods. Over half of financial professionals at these organizations report the greatest financial loss was a result of fraud from payment methods other than checks.
Payment Method Responsible for Largest Dollar Amount of Fraud Loss(Percentage Distribution of Organizations that Suffered Financial Loss from Payments Fraud in 2013)
Revenues at least Revenues at least Revenue Revenue $1 billion and $1 billion and at least less than more than 100 fewer than 26 All $1 billion $1 billion payment accounts payment accounts
Checks 57% 53% 55% 42% 61%
Corporate cards 23 29 23 25 33
ACH debits 10 12 5 25 –
Wire transfers 9 3 18 – 6
ACH credits 1 3 – 8 –
Payment Method Responsible for Largest Dollar Amount of Fraud Loss(Percentage Distribution of Organizations that Suffered Financial Loss from Payments Fraud in 2013)
Checks
Corporate cards
ACH debits
Wire transfers
ACH credits
0% 10% 20% 30% 40% 50% 60% 70% 80%
57%
23%
10%
9%
1%

10 ©2014 Association for Financial Professionals, Inc. All Rights Reserved www.AFPonline.org
2014 AFP Payments Fraud and Control Survey
For most organizations that were subject to attempted or actual payments fraud in 2013, the cost to manage, defend and/or “clean up” from the events was relatively low. About two in five organizations did not incur any expenses as a result of fraud. Slightly less than half (47 percent) spent less than $25,000 to defend against or clean up the fraud. Larger organizations, particu-larly those with a greater number of payment accounts, are more likely to have spent larger amounts on cleaning up and defending against fraud.
Costs to Manage, Defend and Clean Up Payments Fraud in 2013(Percentage Distribution of Organizations Subject of Attempted or Actual Payments Fraud)
Revenues at least Revenues at least Revenue Revenue $1 billion and $1 billion and at least less than more than 100 fewer than 26 All $1 billion $1 billion payment accounts payment accounts
Zero 42% 37% 48% 24% 40%
Up to $24,999 47 48 48 48 51
$25,000-$49,999 5 8 – 14 8
$50,000-$99,999 2 2 1 5 –
$100,000-$249,999 3 3 2 – 2
$250,000 and above 2 3 – 10 –
Sources of Attempted/Actual Payments Fraud in 2013(Percent of Organizations Subject of Attempted or Actual Payments Fraud)
Outside individual
Organized crime ring
Internal party
Third party or outsourcer
Account takeover
Lost or stolen laptop
Comprised mobile device
Other
0% 10% 20% 30% 40% 50% 60% 70% 80%
5%
1%
3%
7%
8%
11%
20%
80%
The majority of payments fraud originates from outside an organization. Eighty percent of organizations that experienced attempted or actual payments fraud in 2013 did so as a result of actions by an outside individual. For 20 percent of companies, payments fraud originated from an organized crime ring and 11 percent were subject to fraud from an internal party.

www.AFPonline.org ©2014 Association for Financial Professionals, Inc. All Rights Reserved 11
2014 AFP Payments Fraud and Control Survey
Payment Accounts and Access ControlsShared Service Centers and Payments Factory As organizations grow, internal processes and procedures tend to become decentralized, especially if expansion is the result of acquisitions. This is particularly true in the case of payment transactions. It is not unusual for organizations with many subsidiaries to have different procedures as well as different payment systems, multiple bank accounts and several bank relationships. Organizations can increase efficiency and maximize costs by centralizing these processes into Payments Factories.
A Payments Factory can be a stand-alone entity within an organization or part of a larger Shared Service Center (SCC). While Payments Factories are focused on consolidating payment transactions, Shared Service Centers usually have a much broader scope and handle related treasury tasks such as purchase approvals, payments accounting, bank reconciliations, straight-through processing (STP), etc.
Nearly half of financial professionals (46 percent) agree there is a benefit in consolidating the number of bank accounts associated with payments into a SSC or Payments Factory; 27 percent do not see an upside in doing so. The remaining of survey respondents are not sure if there is an advantage. More than half of financial professionals from larger organizations (56 percent), particularly those companies with a greater number of payment accounts, agree that it is beneficial to consolidate bank accounts associated with payments into an SCC and/or Payments Factory while 21 percent do not hold this view.
Shift in Liability from Issuers to Merchants EMV stands for Europay, MasterCard and Visa and is a global, interoperable standard for
integrated chips in cards, “chip cards.” The EMV standard was created to enhance security in authenticating credit and debit card transactions. While there currently is no specific requirement for merchants in the U.S. to implement EMV-capable point of sale (POS) devices, liability for fraudulent transactions will shift from the card issuer to the merchant for such transactions not made on fully capable EMV POS devices. The deadline for this “liability shift” is October 2015 for American Express, Discover, MasterCard and Visa for POS transactions. There is an extended deadline of October 2017 for Automated Fuel Dispenser (AFD) terminals. For ATM transactions the timelines are October 2016 for MasterCard and October 2017 for Visa Cards. The shift in liability will most likely speed up the voluntary adop-tion of EMV in the U.S. (Further discussion regarding EMV chip cards can be found on page 20.)
The biggest hurdle for many organizations in converting to use of EMV chip technol-ogy is the need to invest in new EMV-capable terminals. It is a significant investment, and will have the greatest impact on retailers with many POS locations. While liability remains with the card issuer it is almost impossible to build a business case for such investments. However, a shift in liability for fraudulent transactions on non-EMV capable terminals will most likely help spur EMV adoption in the U.S. as it has in other parts of the world. For organizations with a high volume of low-value transactions (such as fast-food establish-ments), a shift in liability may still not be enough to justify the investment as they don’t feel fraud is impacting their business to the same extent as do other organizations. This may partly explain the varied responses.

12 ©2014 Association for Financial Professionals, Inc. All Rights Reserved www.AFPonline.org
2014 AFP Payments Fraud and Control Survey
Twenty-two percent of organizations that currently accept credit/debit cards from their customers anticipate a significant impact from their investment in card acceptance fraud prevention methods/solutions with the forthcoming shift in liability from card issuers to merchants scheduled for October 2015. Half expects there to be “some” impact.
Securing CredentialsRecent incidences of high-profile security breaches at major retailers across the
nation that compromised customers’ personal data have put organizations on alert. Companies can adopt various measures to defend against such attacks on their own corporate accounts as well as secured customer data.
One effective way to mitigate corporate account takeover is by conducting daily reconciliations of transaction activity. Nearly three out of four organizations do so. Reconciling also involves constant following up on questionable activity either inter-nally or with the company’s bank.
Reviewing and strengthening internal procedures is an approach used by 73 percent of companies. This involves, for example, setting time parameters internally and coordinating with a company’s bank to make sure there is ample time to act on any questionable items.
There are other ways to defend against attacks on a company’s security. Nearly half of organizations are adopting a stronger method of authentication. This can be as simple as making sure administrator login credentials are not the same as day-to-day login credentials. In other words, the information is segregated. More than two out of five companies are working on ensuring that disaster recovery plans include the ability to maintain in-office compliance when enacting disaster recovery. An almost equal percentage of organizations are upgrading the authentication procedures/devices used to access their companies’ networks. Other tactics organizations are using to defend against attacks that could compromise their security include restricting company net-work access to payments via both company-issued laptops as well as mobile devices.
Impact of Liability Shift from Card Issuers to Merchants (Percentage Distribution of Organizations that Accept Credit/Debit Cards from Customers)
Revenues at least Revenues at least Revenue Revenue $1 billion and $1 billion and at least less than more than 100 fewer than 26 All $1 billion $1 billion payment accounts payment accounts
Significant Impact (5) 9% 8% 10% 4% 8%
(4) 13 15 11 14 12
Somewhat of an Impact (3) 50 52 48 64 47
(2) 17 17 18 14 21
No Impact (1) 11 8 13 4 12
www.AFPonline.org ©2014 Association for Financial Professionals, Inc. All Rights Reserved 13
2014 AFP Payments Fraud and Control Survey
Additional Security Measures Adopted by Organizations (Percentage Distribution)
Revenues at least Revenues at least Revenue Revenue $1 billion and $1 billion and at least less than more than 100 fewer than 26 All $1 billion $1 billion payment accounts payment accounts
Yes, my organization has adopted additional security measures 29% 31% 23% 52% 24%
No, but my organization intends to adopt additional security measures in the near future 34 35% 33 24 37
No, my organization has no plans to adopt additional security measures in the near future. 37 33 43 24 40
Actions Taken to Defend Against Attacks that Would Compromise Security (Percent of Organizations)
Perform daily reconciliations
Review and strengthen internal procedures and controls as appropriate
Adopt a stronger form of authentication or add layers of security for access to bank services
Ensure disaster recovery plans include the ability to continue with strong control
Upgrade the authentication procedure /devices used to access our company network
Restrict company network access for payments to only company-issued laptops
Restrict network access for payments via mobile devices to emergency situations only
Replace proprietary bank connections with secure access through SWIFT network
Dedicate a PC for payment origination
Other
74%
73%
49%
44%
41%
31%
20%
12%
10%
4%
In the wake of recent security breaches, 63 percent of organizations have either adopted additional security measures or are planning to do so in the near future. Over half of larger companies with a greater number of payment accounts have taken additional actions to protect their data, and another 24 percent of these companies have plans to do so in the near future. Security measures being adopted are varied and include secure signature stamps, electronic signatures, payment data stored with third-party vendor and increased layers of security.

14 ©2014 Association for Financial Professionals, Inc. All Rights Reserved www.AFPonline.org
2014 AFP Payments Fraud and Control Survey
Check FraudAs earlier reported, checks are the payment method most likely to be subject to fraudulent activity. Forty-two percent of organizations experienced between one and five incidents of check fraud in 2013 while 15 percent were subject to between six and ten incidents. Twenty-seven percent of organizations were exposed to at least 20 check fraud incidents in 2013, a slight increase from the 22 percent in 2012. Larger companies are more likely to have experienced check fraud more frequently than smaller organizations.
A majority of survey respondents (59 percent) report that the number of check fraud attempts at their companies was unchanged from 2012 while 28 percent report an increase. A larger share of financial professionals from smaller-sized companies indicate there was a greater increase in check fraud attempts compared with their counterparts at larger organizations (33 percent vs. 25 percent).
Times Organization Experienced Attempted or Actual Check Fraud in 2013(Percentage Distribution of Organizations that Suffered at Least One Attempt of Check Fraud in 2013)
Revenues at least Revenues at least Revenue Revenue $1 billion and $1 billion and at least less than more than 100 fewer than 26 All $1 billion $1 billion payment accounts payment accounts
1-5 times 42% 35% 58% 40% 35%
6-10 times 15 15 15 15 14
11-15 times 11 7 14 5 10
16-20 times 4 6 1 5 5
20 or more times 27 37 11 35 37

www.AFPonline.org ©2014 Association for Financial Professionals, Inc. All Rights Reserved 15
2014 AFP Payments Fraud and Control Survey
The most prevalent check fraud method in 2013 was counterfeiting by altering the MICR line on a check. This type of activity occurred at 62 percent of all organizations that suffered at least one check fraud attempt in 2013. That share includes 80 percent of organizations with annual revenues of at least $1 billion and more than 100 payment accounts. Another widely cited check fraud technique involved the alteration of the payee name on issued checks (cited by 52 percent of survey respondents from companies that had at least one check fraud attempt). Other notable check fraud methods included alteration of the dollar amount on issued checks (37 percent) and counterfeited check with a name drawn on a fake or another organization’s account information (31 percent).
Methods of Check Fraud (Percent Distribution of Organizations that Suffered at Least One Attempt of Check Fraud in 2013)
Revenues at least Revenues at least Revenue Revenue $1 billion and $1 billion and at least less than more than 100 fewer than 26 All $1 billion $1 billion payment accounts payment accounts
Counterfeit checks with the organizations’ MICR line data 62% 66% 61% 80% 57%
Payee name alteration on checks issued 52 56 42 40 59
Dollar amount alteration on checks issued 37 41 28 45 40
Counterfeit check with the name drawn on fake or another company’s account information 31 37 24 45 38
Loss, theft or counterfeit of employee pay checks 16 17 11 15 19
Loss of theft of check stock 5 3 6 10 2

16 ©2014 Association for Financial Professionals, Inc. All Rights Reserved www.AFPonline.org
2014 AFP Payments Fraud and Control Survey
The method most often used at organizations to guard against check fraud is positive pay. This approach is used by 81 percent of organizations. Other popular methods of guarding against check fraud include “daily reconciliation and other in-ternal processes” and “segregation of accounts.” Companies with annual revenues of less than $1 billion are more likely to focus their efforts on daily reconciliation and less on positive pay than are larger-sized organizations.
Revenues at least Revenues at least Revenue Revenue $1 billion and $1 billion and at least less than more than 100 fewer than 26 All $1 billion $1 billion payment accounts payment accounts
Positive Pay 81% 85% 75% 86% 86%
Daily reconciliation and other internal processes 78 76 82 64 81
Segregation of accounts 68 71 63 68 78
Payee positive pay 56 68 40 68 63
“Post no checks” restriction of depository accounts 46 52 37 55 54
Reverse positive pay 20 24 14 32 25
Non-bank fraud control services 7 5 10 5 5
Fraud Control Procedures Used to Guard against Check Fraud(Percent Distribution of Organizations that Suffered at Least One Attempt of Check Fraud in 2013)

www.AFPonline.org ©2014 Association for Financial Professionals, Inc. All Rights Reserved 17
2014 AFP Payments Fraud and Control Survey
Although check fraud was the most prevalent type of fraud experienced by organiza-tions in 2013, a large majority of companies did not suffer a financial loss as a result of such fraud. Only 17 percent of companies exposed to at least one check fraud attempt in 2013 incurred a financial loss as a consequence. The share rose to 23 percent among large companies with more than 100 payment accounts.
Organizations incurred financial loss from check fraud for a number of reasons. Among them:
• Check was cashed by check-cashing service (cited by 38 percent of survey respondents) • Account reconciliation or positive pay view was not timely (28 percent)• Internal fraud (21 percent)• Did not use positive pay, reverse positive pay or payee positive pay (17 percent)• Client-initiated check return was untimely (10 percent)• Did not use “post no checks” services on electronic payment account (10 percent)
Suffered Loss as a Result of Check Fraud(Percentage Distribution of Organizations that Suffered from at Least One Attempt of Check Fraud in 2013)
Yes 17%
No 83%
Reasons for Financial Loss Due to Check Fraud(Percent Distribution of Organizations that Suffered at Least One Attempt of Check Fraud in 2013)
Revenues at least Revenues at least Revenue Revenue $1 billion and $1 billion and at least less than more than 100 fewer than 26 All $1 billion $1 billion payment accounts payment accounts
Check was cashed by check-cashing service 38% 44% 36% 40% 40%
Account reconciliation or positive pay review not timely 28 31 27 40 30
Internal fraud 21 19 27 20 10
Did not use positive pay, reverse positive pay or payee positive pay 17 6 27 20 –
Client initiated check return not timely 10 6 18 – 10
Did not use “post no checks” services on electronic payment account 10 6 18 20 –

18 ©2014 Association for Financial Professionals, Inc. All Rights Reserved www.AFPonline.org
2014 AFP Payments Fraud and Control Survey
ACH FraudACH fraud impacts a relatively small number of organizations and even among those, such fraud occurs infrequently. Sixty-two percent of financial professionals from organizations that were subject to ACH fraud in 2013 report between one and five such instances. Larger companies with more than 100 payment accounts were almost three times more likely to have been exposed to ACH fraud at least 16 times than were similar-sized companies with fewer payment accounts
A majority of financial professionals (60 percent) report that the number of ACH fraud attempts at their organizations in 2013 was relatively unchanged from 2012. Still, more than one-third (36 percent) indicate an increase in the instances of ACH fraud. Smaller companies experienced a greater increase in ACH fraud attempts last year than did larger organizations.
Nineteen percent of organizations that were exposed to at least one ACH fraud attempt in 2013 suffered a financial loss as a consequence. The share increases considerably to 55 percent among larger organizations with more than 100 accounts.
The most likely reasons why organizations were victims of ACH fraud include: • Did not use ACH debit blocks or ACH debit filters (cited by 50 percent of survey respondents)• Account reconciliation was not timely (38 percent)• ACH return not timely (38 percent)• Not using ACH positive pay (38 percent)• Internal fraud (13 percent)
Reasons for Financial Loss from ACH Fraud(Percent of Organizations that Suffered at Least One Attempt of ACH Fraud in 2013)
All
Did not use ACH debit blocks or ACH debit filters 50%
Account reconciliation not timely 38
ACH return not timely 38
Did not use ACH positive pay 38
Internal fraud 13
Other 25
Attempted or Actual ACH Fraud in 2013(Percentage Distribution of Organizations that Suffered at Least One Attempt of ACH Fraud in 2013)
Revenues at least Revenues at least Revenue Revenue $1 billion and $1 billion and at least less than more than 100 fewer than 26 All $1 billion $1 billion payment accounts payment accounts
1-5 times 62% 58% 83% 27% 75%
6-15 times 17 21 – 36 13
16 or more times 21 21 17 36 13
www.AFPonline.org ©2014 Association for Financial Professionals, Inc. All Rights Reserved 19
2014 AFP Payments Fraud and Control Survey
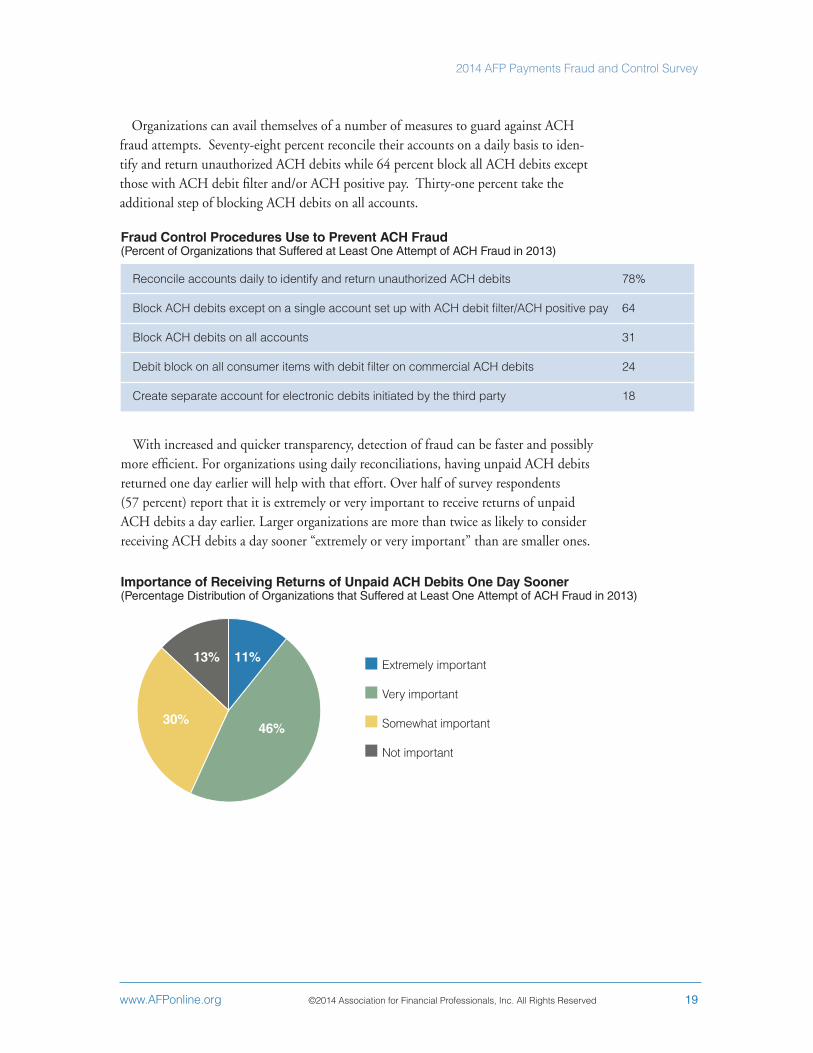
Fraud Control Procedures Use to Prevent ACH Fraud(Percent of Organizations that Suffered at Least One Attempt of ACH Fraud in 2013)
Reconcile accounts daily to identify and return unauthorized ACH debits 78%
Block ACH debits except on a single account set up with ACH debit filter/ACH positive pay 64
Block ACH debits on all accounts 31
Debit block on all consumer items with debit filter on commercial ACH debits 24
Create separate account for electronic debits initiated by the third party 18
Importance of Receiving Returns of Unpaid ACH Debits One Day Sooner(Percentage Distribution of Organizations that Suffered at Least One Attempt of ACH Fraud in 2013)
Extremely important
Very important
Somewhat important
Not important
30%46%
13% 11%
Organizations can avail themselves of a number of measures to guard against ACH fraud attempts. Seventy-eight percent reconcile their accounts on a daily basis to iden-tify and return unauthorized ACH debits while 64 percent block all ACH debits except those with ACH debit filter and/or ACH positive pay. Thirty-one percent take the additional step of blocking ACH debits on all accounts.
With increased and quicker transparency, detection of fraud can be faster and possibly more efficient. For organizations using daily reconciliations, having unpaid ACH debits returned one day earlier will help with that effort. Over half of survey respondents (57 percent) report that it is extremely or very important to receive returns of unpaid ACH debits a day earlier. Larger organizations are more than twice as likely to consider receiving ACH debits a day sooner “extremely or very important” than are smaller ones.

20 ©2014 Association for Financial Professionals, Inc. All Rights Reserved www.AFPonline.org
2014 AFP Payments Fraud and Control Survey
Corporate/Commercial Card PaymentsAs organizations continue to increase their use of corporate/commercial cards for business-to-business payments (B2B), these payments, too, are becoming targets for fraud. Specifically, the most widely used B2B cards in 2013 were purchasing cards (used by 78 percent of organizations) followed by travel & entertainment (T&E) cards (51 percent) and ghost or virtual cards (37 percent). Forty-five percent of organizations that experienced fraud from cards in 2013 suffered fraud associated with their own commercial cards.
Corporate/Commercial Cards Used for B2B Payments(Percent of Organizations)
Purchasing Cards 78%
T&E cards 51
Ghost or virtual cards 37
“One card” combining several uses above 26
Fleet cards 25
Airline travel cards 7
When an organization’s own cards are used to perpetrate fraud, such fraud often results in financial losses to the company. Thirty-one percent of organizations that were subject to corporate/commercial card fraud during 2013 suffered financial loss as a consequence. Other parties that suffered financial loss as a result of corporate/commercial card fraud include the bank or financial institution that issued the card (44 percent) and the card processor (19 percent).
Parties That Suffered Loss from Fraud on Corporate/Commercial Cards(Percent of Organizations that Suffered at Least One Card Fraud Attempt in 2013)
Parties That Suffered Loss from Fraud on Corporate/Commercial Cards(Percent of Organizations that Suffered from at Least One Card Fraud Attempt in 2013)
44%
31%19% 19%
14%
0%10%20%30%40%50%60%70%80%
FinancialInstitution or
Bank thatissued the Card
Myorganization
Card processor NoOrganization
Suffered a Loss
Merchant
60%
50%
40%
30%
20%
10%
0%Financial institution or bank
that issuedthe card
Myorganization
Cardprocessor
Noorganization
suffered a loss
Merchant
44%
31%
19% 19%14%
www.AFPonline.org ©2014 Association for Financial Professionals, Inc. All Rights Reserved 21
2014 AFP Payments Fraud and Control Survey
For 57 percent of organizations that were subject to fraud via their own corporate/commercial cards, the fraud was perpetrated by an unknown external party. For 14 percent of such companies, the fraud was committed by a known third party such as a vendor, professional services provider or business trading partner.
Despite the prevalence of corporate/commercial card fraud committed by external parties, a significant amount of such fraud is actually committed by an organization’s own employees. In 2013, 40 percent of organizations were subject to fraud by their own employees using the organization’s corporate/commercial cards. In fact, over 70 percent of organizations incur losses associated with commercial/corporate cards as a result of employee theft.
EMV Chip CardsAs mentioned previously, EMV stands for Europay, MasterCard and Visa and is a
global interoperable standard for integrated chips in credit and debit cards. EMV chip card transactions with PIN authorization improve security against fraud as compared with transactions with magnetic strip cards that rely on the holder’s signature. While EMV has been adopted in many parts of the world for a number of years, its accep-tance in the U.S. has been lagging. As fraud tends to migrate to the weakest link this could be one reason for the higher percentage of attempted or actual fraud on cards, 29 percent in 2012 and 43 percent in 2013.
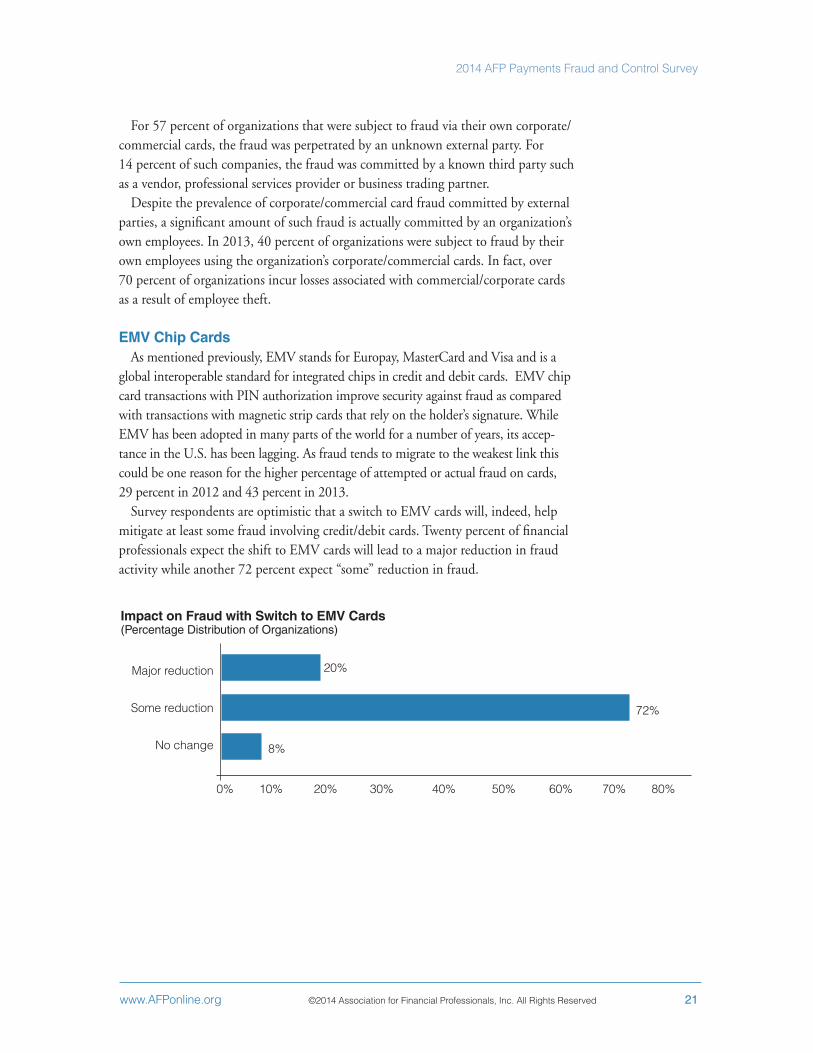
Survey respondents are optimistic that a switch to EMV cards will, indeed, help mitigate at least some fraud involving credit/debit cards. Twenty percent of financial professionals expect the shift to EMV cards will lead to a major reduction in fraud activity while another 72 percent expect “some” reduction in fraud.
Impact on Fraud with Switch to EMV Cards(Percentage Distribution of Organizations)
Major reduction
Some reduction
No change
0% 10% 20% 30% 40% 50% 60% 70% 80%
20%
72%
8%
22 ©2014 Association for Financial Professionals, Inc. All Rights Reserved www.AFPonline.org
2014 AFP Payments Fraud and Control Survey
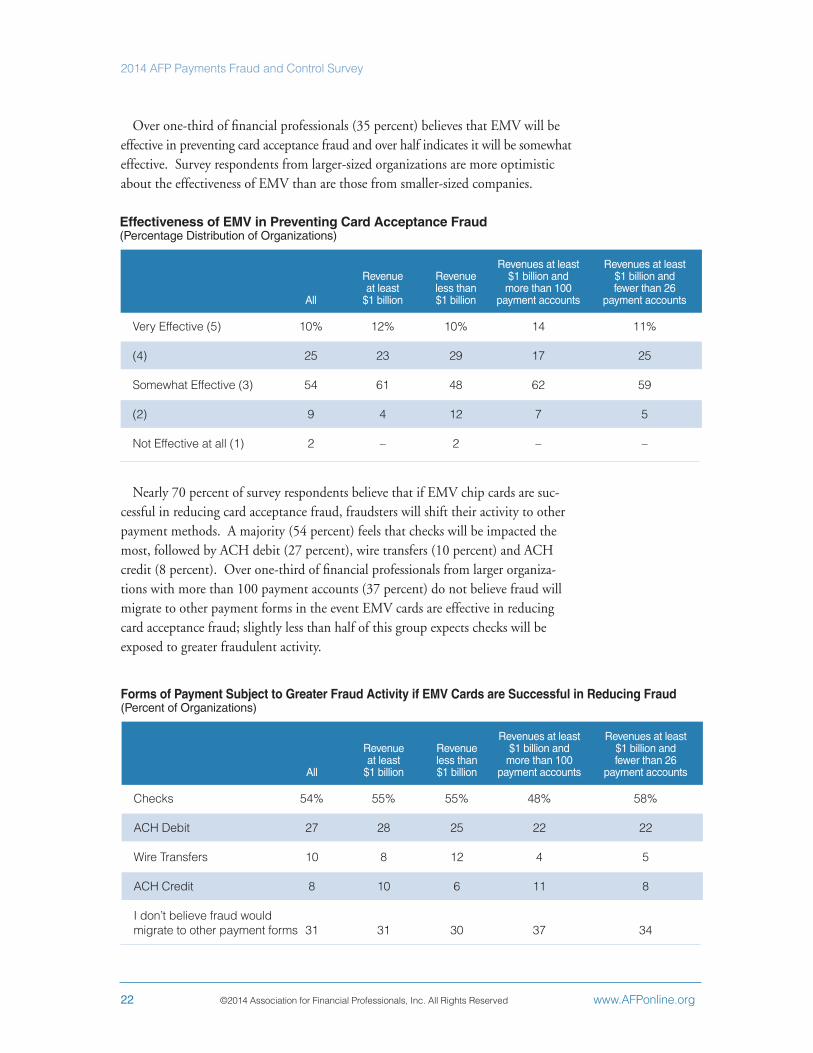
Over one-third of financial professionals (35 percent) believes that EMV will be effective in preventing card acceptance fraud and over half indicates it will be somewhat effective. Survey respondents from larger-sized organizations are more optimistic about the effectiveness of EMV than are those from smaller-sized companies.
Effectiveness of EMV in Preventing Card Acceptance Fraud(Percentage Distribution of Organizations)
Revenues at least Revenues at least Revenue Revenue $1 billion and $1 billion and at least less than more than 100 fewer than 26 All $1 billion $1 billion payment accounts payment accounts
Very Effective (5) 10% 12% 10% 14 11%
(4) 25 23 29 17 25
Somewhat Effective (3) 54 61 48 62 59
(2) 9 4 12 7 5
Not Effective at all (1) 2 – 2 – –
Nearly 70 percent of survey respondents believe that if EMV chip cards are suc-cessful in reducing card acceptance fraud, fraudsters will shift their activity to other payment methods. A majority (54 percent) feels that checks will be impacted the most, followed by ACH debit (27 percent), wire transfers (10 percent) and ACH credit (8 percent). Over one-third of financial professionals from larger organiza-tions with more than 100 payment accounts (37 percent) do not believe fraud will migrate to other payment forms in the event EMV cards are effective in reducing card acceptance fraud; slightly less than half of this group expects checks will be exposed to greater fraudulent activity.
Forms of Payment Subject to Greater Fraud Activity if EMV Cards are Successful in Reducing Fraud(Percent of Organizations)
Revenues at least Revenues at least Revenue Revenue $1 billion and $1 billion and at least less than more than 100 fewer than 26 All $1 billion $1 billion payment accounts payment accounts
Checks 54% 55% 55% 48% 58%
ACH Debit 27 28 25 22 22
Wire Transfers 10 8 12 4 5
ACH Credit 8 10 6 11 8
I don’t believe fraud would migrate to other payment forms 31 31 30 37 34
www.AFPonline.org ©2014 Association for Financial Professionals, Inc. All Rights Reserved 23
2014 AFP Payments Fraud and Control Survey
ConclusionEven as the U.S. economy gradually stabilizes, organizations continue to operate in a volatile business environment which is continuously impacted by extraneous factors. Among those factors is the ongoing danger of payments fraud. Financial professionals are faced with a challenging task in controlling their organizations’ exposure to fraud. Most realize it is necessary to stay ahead of the curve and ensure they have the resources, tools and controls in place that will be effective in minimizing the risk of fraud.
Checks continue to be the most popular payment vehicle used by those committing fraud, with credit/debit cards also frequent targets. Trends in the prevalence of payments fraud in 2013 were very similar to those seen in 2012. Financial losses incurred were relatively less for most organizations in 2013, but larger organizations with a greater number of payment accounts were more likely to experience losses of larger amounts. Those committing payment fraud were most likely to be individuals outside of organizations and in some cases even the work of an organized crime ring.
Although check fraud is the most common with 82 percent of organizations having been subject to attempted or actual such fraud in 2013, the frequency has declined from 87 percent in 2012. As the use of checks continues to decline, fraud is likely migrating to the next most vulnerable payment method, cards. Indeed, there has been a dramatic increase in card fraud; 29 percent of organizations in 2012 experienced card fraud compared to 43 percent in 2013.
Card fraud could also be on the rise due to the lack of EMV chip card adoption in the U.S. Financial professionals are optimistic about the potential effectiveness of EMV chip cards and other recently introduced controls in mitigating fraud. However, the continuing incidences of criminal breaches of major organizations’ customer data have many companies on high alert. Some have taken steps to counter any potential threats they might face. Such attacks are widespread, sometimes originating outside the U.S. and therefore very challenging to restrain.
Financial professionals are well aware that the fraud landscape is constantly evolv-ing. So, many questions and challenges remain. In 2014, will we see stricter legisla-tion requiring organizations to adopt certain measures to mitigate fraud? Will government agencies use intelligence to obstruct fraud activity committed by criminals both from within and outside the U.S.? Will organizations dedicate more resources to monitoring fraud? It is evident that those committing fraud are continuously adopting unique methods with far-reaching effects. The challenge for organizations and the financial professionals who work for them will be to stay ahead of the game.
24 ©2014 Association for Financial Professionals, Inc. All Rights Reserved www.AFPonline.org
2014 AFP Payments Fraud and Control Survey
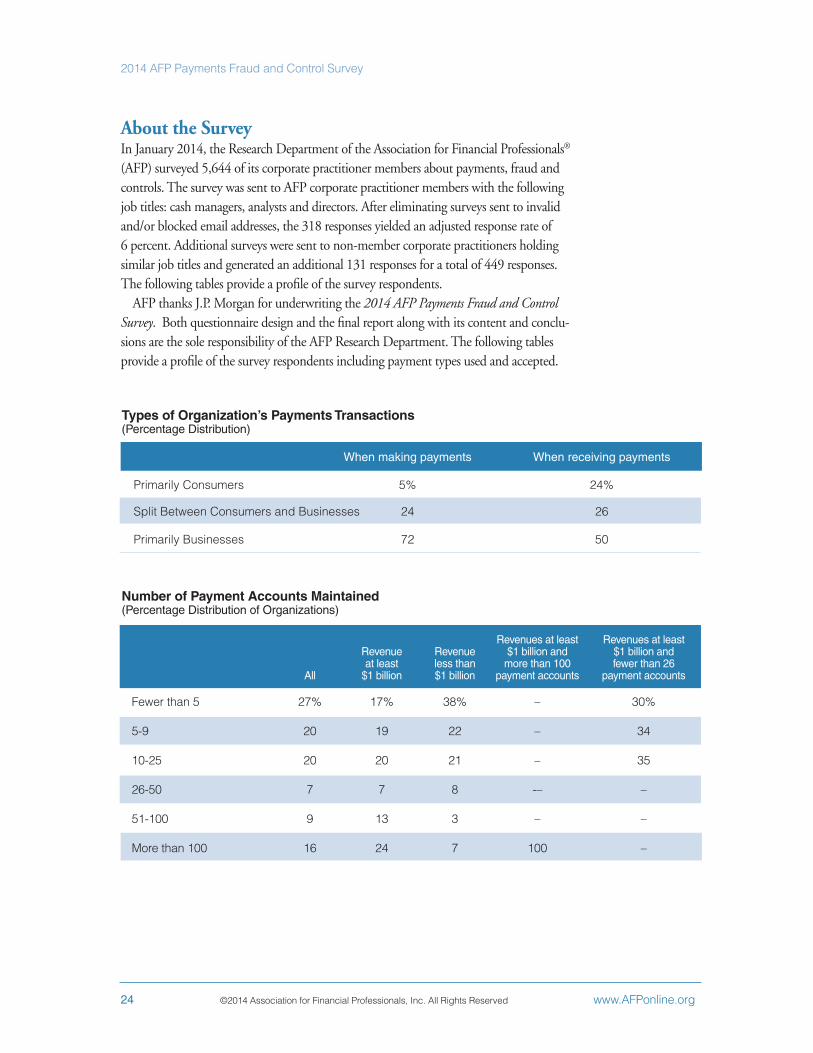
About the SurveyIn January 2014, the Research Department of the Association for Financial Professionals® (AFP) surveyed 5,644 of its corporate practitioner members about payments, fraud and controls. The survey was sent to AFP corporate practitioner members with the following job titles: cash managers, analysts and directors. After eliminating surveys sent to invalid and/or blocked email addresses, the 318 responses yielded an adjusted response rate of 6 percent. Additional surveys were sent to non-member corporate practitioners holding similar job titles and generated an additional 131 responses for a total of 449 responses. The following tables provide a profile of the survey respondents.
AFP thanks J.P. Morgan for underwriting the 2014 AFP Payments Fraud and Control Survey. Both questionnaire design and the final report along with its content and conclu-sions are the sole responsibility of the AFP Research Department. The following tables provide a profile of the survey respondents including payment types used and accepted.
Types of Organization’s Payments Transactions (Percentage Distribution)
When making payments When receiving payments
Primarily Consumers 5% 24%
Split Between Consumers and Businesses 24 26
Primarily Businesses 72 50
Number of Payment Accounts Maintained (Percentage Distribution of Organizations)
Revenues at least Revenues at least Revenue Revenue $1 billion and $1 billion and at least less than more than 100 fewer than 26 All $1 billion $1 billion payment accounts payment accounts
Fewer than 5 27% 17% 38% – 30%
5-9 20 19 22 – 34
10-25 20 20 21 – 35
26-50 7 7 8 -– –
51-100 9 13 3 – –
More than 100 16 24 7 100 –

www.AFPonline.org ©2014 Association for Financial Professionals, Inc. All Rights Reserved 25
2014 AFP Payments Fraud and Control Survey
Annual Revenues (Percentage Distribution)
Under $50 million 9%
$50-99.9 million 5
$100-249.9 million 8
$250-$499.9 million 11
$500-999.9 million 16
$1-4.9 billion 30
$5-9.9 billion 11
$10 billion-$20 billion 5
Over $20 billion 5
Industry Classification(Percentage Distribution)
Banking/Financial Services 7%
Business Services/Consulting 6
Construction 2
Energy 10
Government 12
Health services 5
Hospitality/Travel 2
Insurance 8
Manufacturing 20
Non-Profit 5
Real estate 3
Retail 7
Software/Technology 3
Telecommunications/Media 6
Transportation 4
Ownership Type(Percentage Distribution)
Publicly owned 42%
Privately held 34
Non-profit (not-for-profit) 9
Government (or government owned entity) 15

26 ©2014 Association for Financial Professionals, Inc. All Rights Reserved www.AFPonline.org
2014 AFP Payments Fraud and Control Survey
Payments FraudTable 1: Change in Prevalence of Payments Fraud in 2013 Compared to 2012 (Percentage Distribution of Organizations Subject to Attempted or Actual Fraud)
Revenues at least Revenues at least Revenue Revenue $1 billion and $1 billion and at least less than more than 100 fewer than 26 All $1 billion $1 billion payment accounts payment accounts
More 27% 23% 31% 9% 24%
About the Same 57 61 52 73 61
Less 16 15 18 18 15
Revenues at least Revenues at least Revenue Revenue $1 billion and $1 billion and at least less than more than 100 fewer than 26 All $1 billion $1 billion payment accounts payment accounts
Outside individual 80% 81% 79% 78% 81%
Organized crime ring 20 24 16 22 23
Internal Party 11 11 9 13 11
Third-party or outsourcer 8 4 8 – 7
Account Takeover 7 6 7 9 3
Lost or stolen laptop 3 3 3 4 1
Compromised mobile device 1 – 1 – –
Other 5 4 6 4 4
Table 2: Sources of Payments Fraud for Attempted/Actual Payments Fraud in 2013(Percent of Organizations Subject to Attempted or Actual Payments Fraud)
Revenues at least Revenues at least Revenue Revenue $1 billion and $1 billion and at least less than more than 100 fewer than 26 All $1 billion $1 billion payment accounts payment accounts
Yes 46% 49% 41% 56% 45%
No 27 25 31 21 32
Not Sure 25 23 26 16 21
Other 2 3 2 7 2
Table 3: Benefit in Consolidating the Number of Bank Accounts Associated with Payments(Percentage Distribution)
Appendix: Additional Survey Data Tables
www.AFPonline.org ©2014 Association for Financial Professionals, Inc. All Rights Reserved 27
2014 AFP Payments Fraud and Control Survey
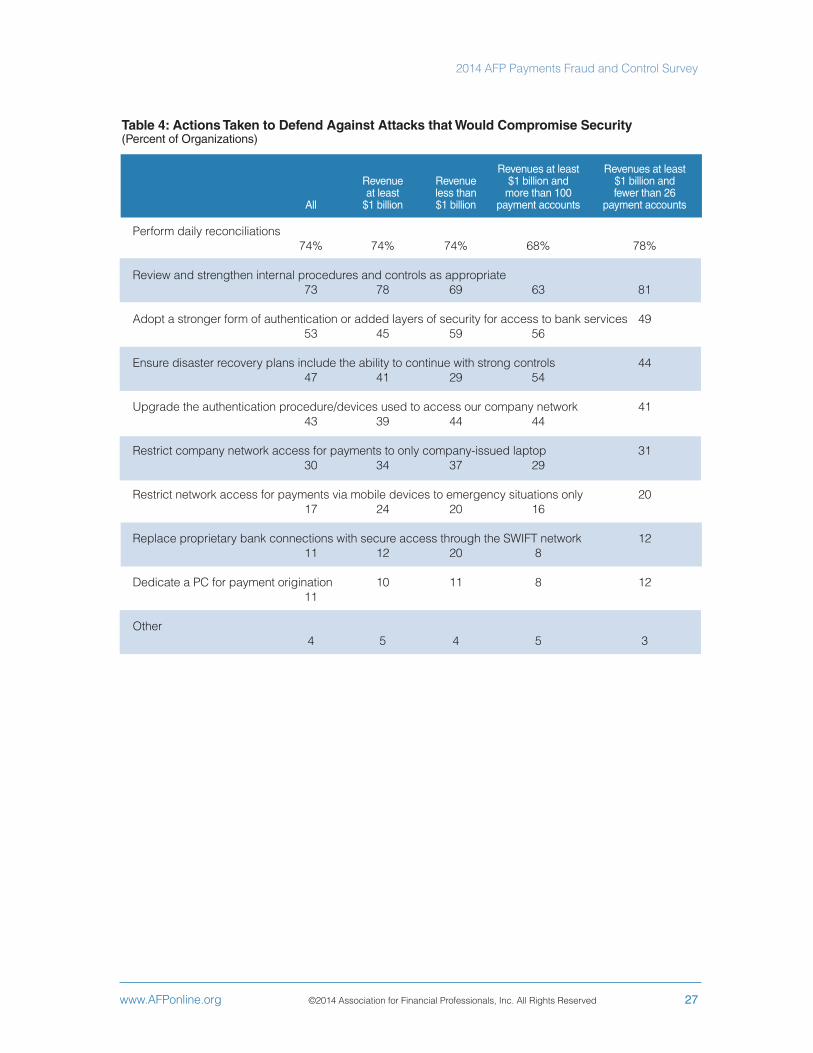
Table 4: Actions Taken to Defend Against Attacks that Would Compromise Security (Percent of Organizations)
Revenues at least Revenues at least Revenue Revenue $1 billion and $1 billion and at least less than more than 100 fewer than 26 All $1 billion $1 billion payment accounts payment accounts
Perform daily reconciliations 74% 74% 74% 68% 78%
Review and strengthen internal procedures and controls as appropriate 73 78 69 63 81
Adopt a stronger form of authentication or added layers of security for access to bank services 49 53 45 59 56
Ensure disaster recovery plans include the ability to continue with strong controls 44 47 41 29 54
Upgrade the authentication procedure/devices used to access our company network 41 43 39 44 44
Restrict company network access for payments to only company-issued laptop 31 30 34 37 29
Restrict network access for payments via mobile devices to emergency situations only 20 17 24 20 16
Replace proprietary bank connections with secure access through the SWIFT network 12 11 12 20 8
Dedicate a PC for payment origination 10 11 8 12 11
Other 4 5 4 5 3

28 ©2014 Association for Financial Professionals, Inc. All Rights Reserved www.AFPonline.org
2014 AFP Payments Fraud and Control Survey
Check FraudTable 5: Change in Check Fraud Attempts from 2012(Percentage Distribution of Organizations)
Revenues at least Revenues at least Revenue Revenue $1 billion and $1 billion and at least less than more than 100 fewer than 26 All $1 billion $1 billion payment accounts payment accounts
Increased 28% 25% 33% 20% 23%
About the same 59 60 56 55 64
Decreased 13 15 11 25 13
Table 6: Suffered Financial Loss as a Result of Check Fraud (Percentage Distribution of Organizations that Suffered at Least One Attempt of Check Fraud in 2013)
Revenues at least Revenues at least Revenue Revenue $1 billion and $1 billion and at least less than more than 100 fewer than 26 All $1 billion $1 billion payment accounts payment accounts
Yes 17% 15% 15% 23% 16%
No 83 85 85 77 84
ACH FraudTable 7: Change in ACH fraud attempts from 2012(Percentage Distribution of Organizations that Suffered at least One Attempt of ACH Fraud in 2013)
Revenues at least Revenues at least Revenue Revenue $1 billion and $1 billion and at least less than more than 100 fewer than 26 All $1 billion $1 billion payment accounts payment accounts
Increased 36% 33% 42% 27% 31%
About the Same 60 61 58 64 63
Decreased 4 6 -- 9 6
Table 8: Financial Loss from ACH Fraud in 2013(Percentage Distribution of Organizations that Suffered at least One Attempt of ACH Fraud in 2013)
Revenues at least Revenues at least Revenue Revenue $1 billion and $1 billion and at least less than more than 100 fewer than 26 All $1 billion $1 billion payment accounts payment accounts
Yes 19% 21% -- 55% --%
No 81 79 100 45 100

www.AFPonline.org ©2014 Association for Financial Professionals, Inc. All Rights Reserved 29
2014 AFP Payments Fraud and Control Survey
Corporate/Commercial Card FraudTable 9: Party Responsible for Fraud on Corporate/Commercial Cards(Percent of Organizations that Suffered at least One Attempt of Corporate/Commercial Card fraud in 2013)
Revenues at least Revenues at least Revenue Revenue $1 billion and $1 billion and at least less than more than 100 fewer than 26 All $1 billion $1 billion payment accounts payment accounts
Unknown external party 57% 45% 77% 40% 42%
Employee 40 55 15 40 75
Third party or outsourcer 14 14 15 20 8
Revenues at least Revenues at least Revenue Revenue $1 billion and $1 billion and at least less than more than 100 fewer than 26 All $1 billion $1 billion payment accounts payment accounts
Card issuing bank 44% 30% 69% 40% 23%
My organization 31 43 8 40 54
Card processor 19 22 15 40 15
No organization suffered financial loss 19 22 15 – 31
Merchant 14 9 23 20 –
Table 10: Parties That Suffered Loss from Fraud on Corporate/Commercial Cards (Percent of Organizations that Suffered at least One attempt of Corporate/Commercial Card Fraud in 2013)
Revenues at least Revenues at least Revenue Revenue $1 billion and $1 billion and at least less than more than 100 fewer than 26 All $1 billion $1 billion payment accounts payment accounts
Major Reduction 20% 18% 21% 21% 16%
Some Reduction 72 74 71 71 77
No Change 8 8 8 7 8
Table 11: Effectiveness of EMV at Preventing Fraud(Percentage Distribution of Organizations Accepting Debit/Credit Card Payments from Customers)

About the Association for Financial Professionals
Headquartered outside Washington, D.C., the Association for Financial Professionals (AFP) is the professional society that represents finance executives globally. AFP established and administers the Certified Treasury ProfessionalTM and Certified Corporate FP&A ProfessionalTM credentials, which set standards of excellence in finance. The quarterly AFP Corporate Cash IndicatorsTM serve as a bellwether of economic growth. The AFP Annual Conference is the largest networking event for corporate finance professionals in the world. AFP, Association for Financial Professionals, Certified Treasury Professional, and Certified Corporate Financial Planning & Analysis Professional are registered trademarks of the Association for Financial Professionals.© 2014 Association for Financial Professionals, Inc. All Rights Reserved.
General Inquiries [email protected]
Web Site www.AFPonline.org
Phone 301.907.2862
AFP Research
AFP Research provides financial professionals with proprietary and timely research that drives business performance. The AFP Research team is led by Managing Director, Research and Strategic Analysis, Kevin A. Roth, PhD, who is joined by a team of research analysts. AFP Research also draws on the knowledge of the Association’s members and its subject matter experts in areas that include bank relationship management, risk management, payments, and financial accounting and reporting. AFP Research also produces AFP EconWatch, a weekly economic newsletter. Study reports on a variety of topics,including AFP’s annual compensation survey, and AFP EconWatch, are available online at www.AFPonline.org/research.

Facing Headwinds with Confidence.
As your business faces the headwinds of market uncertainty, you can be confident that our treasury services products, solutions and platforms provide the financial strength and information protection you need to face these challenges. Our commitment to treasury innovation and fraud mitigation is at the forefront of everything we do, allowing you to focus on growing your enterprise. Let one of our industry professionals show you today.
Visit www.jpmorgan.com/commercialbanking for solutions and insights for your business.
© 2014 JPMorgan Chase & Co. All rights reserved. Chase, JPMorgan and JPMorgan Chase are marketing names for certain businesses of JPMorgan Chase & Co. and its subsidiaries worldwide (collectively, “JPMC”). Products and services may be provided by Commercial Banking affiliates, securities affiliates or other JPMC affiliates or entities.]. PA_14_063
Commercial Banking Treasury Services