Embed Size (px)
Citation preview

2013-2014COVER CROP SURVEY
REPORTA SYnOPSiS Of ThE infORmATiOn COllECTEd dURing ThE 2013-2014 COVER CROP SURVEY.
ABSTRACT This document summarizes information from farmers across the United States, both users and non-users of cover crops, who responded to a cover crop survey. The report assesses attitudes about cover crops, perceived benefits and challenges surrounding their use, and communications channels that can aid in supporting the adoption and success of cover crops.

ABOUT US
Conservation Technology Information Center. 2014. Report of the 2013-14 Cover Crop Survey. Joint publication of the Conservation Technology Information Center and the North Central Region Sustainable Agriculture Research and Education Program. The Sustainable Agriculture Research and Education (SARE) program’s mission is to advance—to the whole of American agriculture—innovations that improve profitability, stewardship and quality of life by investing in groundbreaking research and education. SARE is supported by the USDA’s National Institute of Food and Agriculture. SARE is run by four regional offices: North Central Region SARE, Northeast SARE, Southern SARE and Western SARE. For more information visit www.sare.org. The Conservation Technology Information Center (CTIC) is a national, public-private partnership that champions conservation agriculture and serves as a clearinghouse for information on conservation farming issues and practices, as well as a facilitator for training and workshops. For more information, visit www.ctic.org.

01
COnTEnTSTable of Figures 02Table of Photos 03Acknowledgement 04Introduction 06Method 07General Information 08Experience with Cover Crops 09Delayed Planting and Cover Crops 11Tillage Systems Vary 11Diverse Species Used 12Cover Crops in Rotation 17Seeding Cover Crops 22Terminating Cover Crops 23Yield Analysis 24Seed, Seeding and Establishment Costs 28Perceived Barriers to Adoption 30Cover Crop Benefits 32Cover Crop Challenges 35Challenges Reported by Non-Users 37Landlord Influences 38Incentive Programs 39Learning Opportunities 41The Role of Agricultural Retailers 46Comments from Farmers 48Conclusion 49
2013-2014 COVER CROP SURVEYSustainable Agriculture Research and Education (SARE)
Conservation Technology Information Center (CTIC)

02
TABlE Of figURESFigure 1. The survey gathered insight from farmers in nearly every state. 08Figure 2. Respondents who reported not using cover crops were asked different questions than cover crop users. 09Figure 3. Cover crop acreage has been increasing steadily among respondents to this survey. 10Figure 4. The number of growers planting cover crops, and the average number of cover crops acres they planted, have been on the rise since 2009. 10Figure 5. Respondents who plant cover crops employ a wide variety of tillage strategies. 12Figure 6. Winter cereals are the most popular category of cover crop among this survey’s respondents. 13Figure 7. Breakdown of cover crop regions used in this survey. Choices of cover crop species and the use of cover crops in rotations varied significantly among regions. 14Figure 8. In the Midwestern United States, winter cereals, brassicas and annual grasses are all quite popular as cover crops. 14Figure 9. Winter cereals are widely favored as cover crops in the Northeast. 15Figure 10. Southern growers strongly favor winter cereals as cover crops. 15Figure 11. Legumes are the top cover crop type only in the Western United States. 16Figure 12. Cover crops are used in a wide array of crop rotations. 17Figure 13. Midwestern growers used cover crops most often before both corn and soybeans, or following small grains. 18Figure 14. Southern growers reported using cover crops most in vegetables and specialty crop programs. 19Figure 15. In the Northeast, the period following vegetables or specialty crops saw the greatest use of cover crops. 20Figure 16. The most frequent use of cover crops in the West occurred after vegetables or specialty crops. 21Figure 17. Chart showing the number of cover crop user respondents who employ each method of planting cover crops. 22Figure 18. Nearly half of the respondents used herbicide to terminate their cover crops. 23Figure 19. Corn yields on fields that had previously been in cover crops were 5 bushels per acre higher than on fields that had not had a cover crop the previous season—an increase of 3.2%. Note that the n value of this graph reflects the removal of outliers at the top and bottom 1% of the data pool. 26Figure 20. Soybean yields increased by 2.0 bushels per acre where cover crops were used, a boost of 4.6%. Note that the n value of this graph reflects the removal of outliers at the top and bottom 1% of the data pool. 26Figure 21. In every state shown but Missouri and Iowa, cover crops helped increase corn yields as reported by respondents to this survey. 27Figure 22. The benefits of cover crops on soybean yields appeared across the Midwest and East. 27Figure 23. Median cover crop seed cost varied significantly by region. 29
03
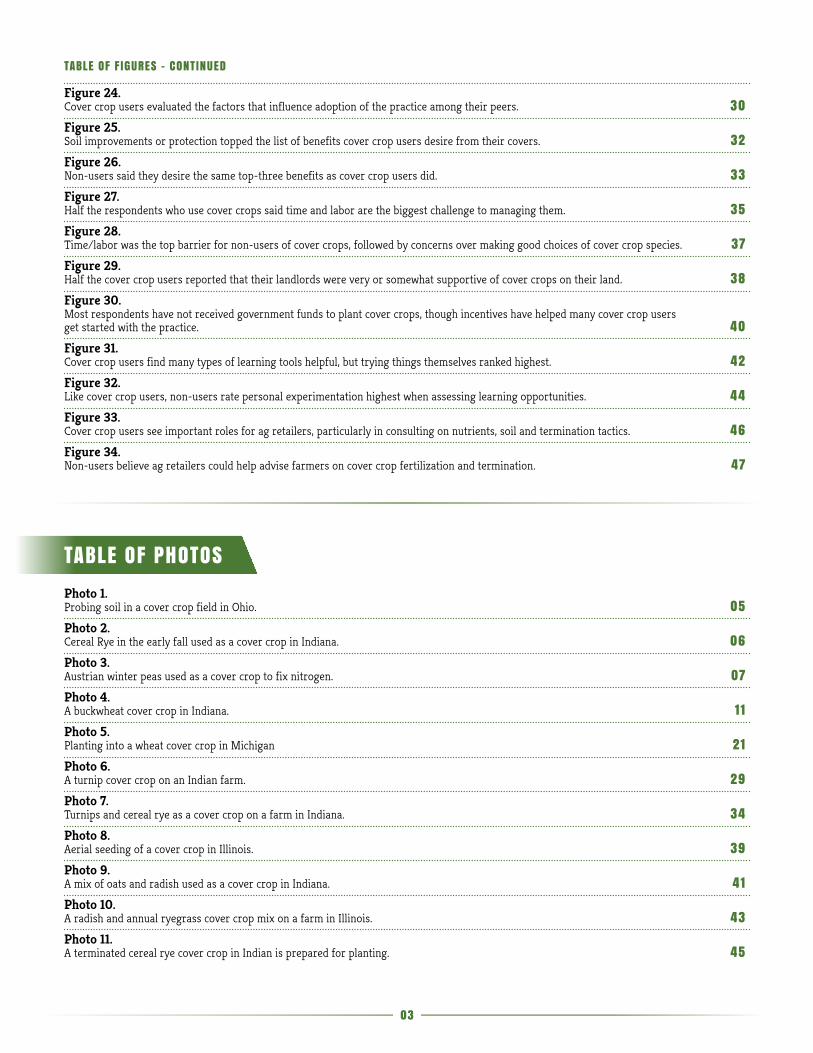
Figure 24. Cover crop users evaluated the factors that influence adoption of the practice among their peers. 30Figure 25. Soil improvements or protection topped the list of benefits cover crop users desire from their covers. 32Figure 26. Non-users said they desire the same top-three benefits as cover crop users did. 33Figure 27. Half the respondents who use cover crops said time and labor are the biggest challenge to managing them. 35Figure 28. Time/labor was the top barrier for non-users of cover crops, followed by concerns over making good choices of cover crop species. 37Figure 29. Half the cover crop users reported that their landlords were very or somewhat supportive of cover crops on their land. 38Figure 30. Most respondents have not received government funds to plant cover crops, though incentives have helped many cover crop users get started with the practice. 40Figure 31. Cover crop users find many types of learning tools helpful, but trying things themselves ranked highest. 42Figure 32. Like cover crop users, non-users rate personal experimentation highest when assessing learning opportunities. 44Figure 33. Cover crop users see important roles for ag retailers, particularly in consulting on nutrients, soil and termination tactics. 46Figure 34. Non-users believe ag retailers could help advise farmers on cover crop fertilization and termination. 47
TABlE Of PhOTOSPhoto 1. Probing soil in a cover crop field in Ohio. 05Photo 2. Cereal Rye in the early fall used as a cover crop in Indiana. 06Photo 3. Austrian winter peas used as a cover crop to fix nitrogen. 07Photo 4. A buckwheat cover crop in Indiana. 11Photo 5. Planting into a wheat cover crop in Michigan 21Photo 6. A turnip cover crop on an Indian farm. 29Photo 7. Turnips and cereal rye as a cover crop on a farm in Indiana. 34Photo 8. Aerial seeding of a cover crop in Illinois. 39Photo 9. A mix of oats and radish used as a cover crop in Indiana. 41Photo 10. A radish and annual ryegrass cover crop mix on a farm in Illinois. 43Photo 11. A terminated cereal rye cover crop in Indian is prepared for planting. 45
TABlE Of figURES – COnTinUEd

04
ACknOwlEdgEmEnTThis cover crop survey was designed and completed in the winter of 2013-2014. It encompasses information gathered about cover crops grown in the 2013 growing season. There were many dedicated people who contributed to the development of the survey and the creation of this report who deserve to be recognized for their assistance.
Dr. Rob Myers and the North Central Region SARE program were the motivation and funding source behind the creation and distribution of this survey. Without the guidance and leadership from Dr. Myers, this survey project would not be nearly what it is today. His vision, ability to mobilize and motivate partners, and skill at sharing information undoubtedly contributed to the overall success and widespread distribution of this survey as well as projects that preceded this one. Also, without funding and support from the North Central SARE program, this survey may never have happened, and certainly would not have enjoyed the outstanding attention it has received in the field.
Many people contributed to the creation of this survey. Dan Towery, Jamie Scott and Allen Dean all provided edits and advice for the development of questions. Their willingness to participate by being the first to take and evaluate the survey was instrumental to the success of the survey and helped trouble-check and streamline the online system.
Dean Baas of Michigan State University Extension, Dr. Linda Prokopy from Purdue University and J. Alan Weber with MARC-IV were also instrumental in helping to craft questions and develop a comfortable flow in the online questionnaire. The help of Mr. Weber and Dr. Prokopy in evaluating the data was also invaluable. The assistance and insight of all of these experts is greatly appreciated. Also, their input on the report and help with interpreting the data was instrumental in the creation of this report.
As also noted in the text, Dr. Wallace Tyner and graduate student Joshua Leirer of Purdue University performed hypothesis tests to provide insight on the impacts of cover crops on yields. Their commitment to data quality and confidence helped guide the development of this report from its very foundation.
Penton Farm Progress, particularly the team at Corn and Soybean Digest, was an instrumental partner in increasing the distribution of our survey to growers. Their willingness to distribute the survey to their database of readers across the U.S. enhanced our outreach and undoubtedly contributed to the larger response base this year when compared to previous surveys.
This report was written in large part by Steve Werblow of Steve Werblow Communications in Oregon. Steve’s willingness and ability to interpret the data and put complex charts and concepts into words was very valuable in enhancing the readability of this report for a very wide audience.

05
Photo 1. Probing soil in a
cover crop field in Ohio.
Data analysis was largely completed by CTIC. CTIC took on the bulk of the data crunching from the early stages of the survey to help all the survey organizers understand the data as it was coming in. CTIC’s resources and ability to analyze the information has yielded solid statistics and contributed to the overall understanding of the data.
Last, and most important, we offer a sincere thank you to all the farmers and landowners from across the U.S. who provided information for this survey. Without their willingness to contribute information on their operations and their desire to share their knowledge, this survey and the resulting reports would be meaningless. Our hope is that the information within these pages will help farmers and landowners by providing insight that will help each of them improve their own operations.
ChAd wATTSCTIC | West Lafayette, Ind.October 2014

06
inTROdUCTiOnCover crops continue to gain traction in many regions of the country. Many farmers and crop advisors recognize the benefits of planting seasonal crops to cover, protect or build the soil, and an increasing number of growers are willing to invest the money and time to manage these plantings between cash crops.
While the benefits of cover crops are increasingly well recognized, many growers focus instead on potential challenges. Understanding those challenges and learning to mitigate concerns with specific recommendations and appropriately positive messages could inspire even more farmers to try cover cropping.
In the first few months of 2014, the Sustainable Agriculture Research and Education (SARE) program and the Conservation Technology Information Center (CTIC) conducted a national survey of farmers about the use of cover crops. More than 1,900 farmers completed the survey this year.
The nationwide, online survey was a follow-up to a smaller survey the previous year conducted by CTIC and SARE at several key conservation tillage conferences in 2012 and 2013, and also through online distribution. Though the 2014 data cannot be directly compared to the 2013 results because the respondent pools and the methods of distributing and completing the survey were different, the latest findings add to our understanding of what motivates and challenges farmers considering the use of cover crops, where they get their information, and what they perceive to be the benefits and costs of cover crops.
Data from this survey is available online at www.sare.org/covercropsurvey and www.ctic.org/cover crops
Photo 2. Cereal Rye in the early fall used as a
cover crop in Indiana.

07
mEThOdInvitations to participate in the 2014 SARE/CTIC cover crop survey were distributed by email to a wide variety of prospective respondents, including: • More than 50,000 farmers from the subscriber lists of Penton
Farm Progress publications;
• Participants in CTIC activities including the 2013 Cover Crop Summit and an ag retailer meeting in Ft. Wayne, Ind.;
• Steering committees of the Indian Creek Watershed Project and the Conservation Agriculture Systems Alliance (CASA);
• Names collected from various farmer and farm advisor email lists;
• Respondents who participated in the 2012-2013 survey.
Participants answered the survey questions on Survey Monkey, a third-party online questionnaire tool. The first question in the survey asked the respondent whether or not he or she had used cover crops in the past five years. At that point, the survey branched into one set of questions for cover crop users and a different, shorter set of questions for farmers who had not yet used cover crops. (It is important to note that respondents to this survey—even those who reported not using cover crops—tend to be more interested in cover cropping than the average farmer. First, many of the respondents were recruited through their participation in conservation farming projects. Also, taking the time to complete the survey may also reflect a higher level of interest in the subject.)
Of the 2,903 people who began the survey, 1,924 completed it. Among the farmers who did not fully complete the survey, most answered at least some questions. The vast majority—97%—of respondents who provided finished surveys completed the survey between January 13 and January 31, 2014.
To help ensure accuracy and statistical significance when assessing yield and cost data, a team of researchers at Purdue University analyzed responses to several questions with both the complete data set and with the highest and lowest 1% of values removed, a process called “cutting off the tails.” This report will address that tactic in the following pages.
Photo 3. Austrian winter peas used as a
cover crop to fix nitrogen.

08
gEnERAl infORmATiOn
Nationwide Respondent Pool
The largest number of responses from farmers using cover crops were received from Minnesota, Iowa, Missouri, Illinois, Indiana and Ohio, with 56 to 157 responses each, followed by Nebraska, Kansas, Wisconsin, Michigan and Georgia, which each supplied 42 to 55 respondents.
Data was collected from nearly every state from coast to coast, with the exception of Utah, Nevada, Arizona and New Jersey.
Figure 1. The survey gathered insight from farmers in nearly every state.

09
ExPERiEnCE wiTh COVER CROPS Of the 2,903 respondents who began answering the survey questions, 75% reported growing cover crops in the past five years.
The median amount of cover cropping experience among all respondents, users and non-users, was 4 years. In all, the survey represents 14,930 person-years of experience with cover crops among the 1,808 respondents who reported having planted them in the past five years. A total of 1,790 cover crop users reported an average farm size of 818 acres, and said they planned to plant an average of 207 acres of cover crops in 2014, or 24% of their total acreage. Though that is slightly more than half of the 42% of the acreage planted to cover crops reported by respondents in the 2012-2013 SARE-CTIC Cover Crop Survey, it is substantially higher than the national average.
Among cover crop users in this survey, 377,536 acres were planted to cover crops in 2013 and 294,796 acres in 2012. By comparison, the 2012 Census of Agriculture reported 10.3 million acres of cover crops planted in 2012 on all U.S. farms.
Figure 2. Respondents who reported not using cover crops were asked different questions than cover crop users.

10
In the three years preceding the survey year of 2013, cover crop acreage had increased by an average of about 30% per year among surveyed cover crop users. When farmers were asked to project their 2014 acreage, they forecast adding about 10% more acres of cover crops. A steep adoption curve had also been observed in the 2012-2013 SARE-CTIC Cover Crop Survey.
The average number of acres of cover crops per user followed a similar growth pattern to the total acreage curve, expanding from a mean of 80 acres in 2009 to an average of 207 acres in 2014.
The 528 respondents who reported not planting cover crops in the past five years—called “non-users” throughout this report—represented 628,473 acres of farmland, an average of 1,188 acres farmed by each respondent.
Figure 3. Cover crop acreage has been increasing steadily among respondents to this survey.
Figure 4. The number of growers planting cover crops, and the average number of cover crops acres they planted, have been on the rise since 2009.

11
dElAYEd PlAnTing And COVER CROPSOf 1,813 respondents, 23% (417) reported that weather conditions prevented them from planting some cropland acres in the wet spring of 2013.
Among the 380 of those growers who provided data on the number of acres they left unplanted in 2013, weather prevented planting on an average of 180.03 acres, for a total of 86,411 acres. Asked how many of those acres were seeded to cover crops in the spring or summer of 2013, those 380 farmers reported that nearly half (48%) of their “prevented plant” acres were seeded to cover crops after the wet spring.
This indicates the use of cover crops is becoming an important strategy for situations where a commodity crop cannot be planted. Rationales for using cover crops at that time vary, but may include preventing erosion, suppressing weed growth, or tying up fertilizers that had already been applied in an effort to keep those nutrients from leaving the field.
TillAgE SYSTEmS VARYCover crops clearly fit into a wide variety of tillage systems. Of the 1,740 respondents to a question on tillage systems used on-farm, the largest number were using continuous no-till (42%) with another 13% doing rotational no-till (such as no-tilling corn following soybeans, then performing tillage after corn harvest due to the higher amount of corn residue). Only 23% of cover crop users reported using conventional tillage.
Photo 4. A buckwheat cover crop in Indiana.

12
diVERSE SPECiES USEdRespondents employed a wide variety of cover crop species in their operations. Because many cover crop users employ more than one type of cover on their farms—or even in individual fields—many respondents chose more than one answer, so percentages add up to more than 100%.
In all, 1,603 respondents provided 5,108 answers to the question, “Which of the following categories of cover crops have you used on your farm in the past year? Please check all that apply.”
Most popular were winter cereal grains—including winter wheat, cereal rye and triticale—used by 73% of the respondents. Legumes, which could include clover, winter pea, vetch and others, were employed by 55%, while an equal percentage planted brassicas such as oilseed radish, mustards, rapeseed, turnips and related plants.
Annual grasses (which could include annual ryegrass, sorghum, sudangrass, oats and similar plants) were planted by 53% of the respondents. Multi-species mixes were used by 34% of the growers responding to the question, a two-species mix by 26% and a summer annual broadleaf by 20%. Six percent reported planting “Other,” though it is important to note that many of those “other” responses were simply more specific references to categories listed above—for instance, a respondent may have written in “tillage radish” rather than selecting the “Brassicas” category, or specified “clover/cereal rye” instead of choosing “two-species mix.”
Figure 5. Respondents who plant cover crops employ a wide variety of tillage strategies.

13
SARE and CTIC analyzed species data by geographic region. Winter cereals dominated three of the four regions of the country, with greater weight in the South (73%, vs. 53% for legumes, the number-two choice) and Northeast (78%, compared to 58% for legumes). Note that growers who did not report their state were included in the national data but not in the regional analyses.
Figure 6. Winter cereals are the most popular category of cover crop among this survey’s respondents.

14
Figure 7. Breakdown of cover crop regions used in this survey. Choices of cover crop species and the use of cover crops in rotations varied significantly among regions.
Figure 8. In the Midwestern United States, winter cereals, brassicas and annual grasses are all quite popular as cover crops.
n=977

15
Figure 9. Winter cereals are widely favored as cover crops in the Northeast.
Figure 10. Southern growers strongly favor winter cereals as cover crops.

16
Figure 11. Legumes are the top cover crop type only in the Western United States.
In the Midwest, winter cereal use showed a modest margin over brassicas (66% vs. 60%). In the West, legumes were narrowly preferred over winter cereals (59% vs. 56%).
State-level data were analyzed from several Midwestern states that provided relatively large numbers of respondents, including Indiana (129 responses to this question), Iowa (117 responses), Illinois (98) and Michigan (54). In general, the distribution of cover crop species was similar to the overall regional values in the Midwest as a whole.
State-level summaries of survey data are available from CTIC. Contact Chad Watts at (765) 494-9555 or [email protected].

17
COVER CROPS in ROTATiOnFarmers integrate cover crops into their rotations in a wide variety of ways. Cover crop users could enter more than one answer to best reflect their operations; these data reflect the number of responses, not the number of respondents. Of the 2,184 responses to this question, approximately one-quarter—24%—reflect the use of covers before both corn and soybeans. A very similar proportion, 23%, documents the use of cover crops following small grains.
Thirteen percent of the responses included cover crops following corn and before soybeans; 12% were covers following soybeans, before corn. Seven percent included cover crops in a continuous corn program, while 2% were reports of cover crops in a continuous soybean program.
Cover crops were used after vegetable and/or specialty crops in 19% of the total number of responses. Another 19%—not reflected on the pie chart below—of the responses were “Other,” offering explanations ranging from tobacco to oats grown for silage.
Broken out on a regional level, cover crops were employed in 36% of the Midwestern responses before both corn and soybeans (348 of 977 Midwest responses to this question). Almost the same proportion, 34%, included cover crops in a continuous corn program.
Figure 12. Cover crops are used in a wide array of crop rotations.

18
Figure 13. Midwestern growers used cover crops most often before both corn and soybeans, or following small grains.
Midwestern growers also reported using cover crops after corn/before soybeans at a rate of 21% of the responses; 18% or the responses included cover crops after soybeans/before corn and 16% involved cover crops after vegetable and/or specialty crops.
In the South, cover crops were most widely planted after a vegetable and/or specialty crop, with 85 of the 223 responses (38%) reporting the practice. The next-most-popular practice was planting cover crops before both corn and soybeans, which was identified in 22% of the responses.
19
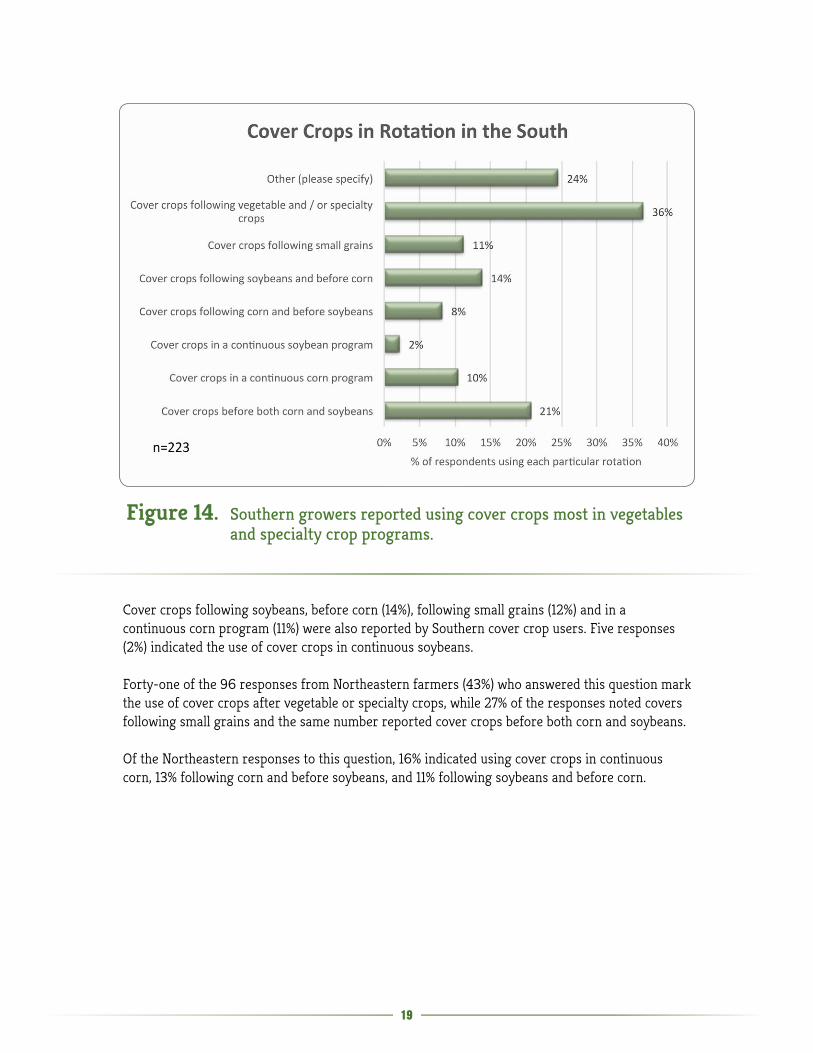
Figure 14. Southern growers reported using cover crops most in vegetables and specialty crop programs.
Cover crops following soybeans, before corn (14%), following small grains (12%) and in a continuous corn program (11%) were also reported by Southern cover crop users. Five responses (2%) indicated the use of cover crops in continuous soybeans.
Forty-one of the 96 responses from Northeastern farmers (43%) who answered this question mark the use of cover crops after vegetable or specialty crops, while 27% of the responses noted covers following small grains and the same number reported cover crops before both corn and soybeans.
Of the Northeastern responses to this question, 16% indicated using cover crops in continuous corn, 13% following corn and before soybeans, and 11% following soybeans and before corn.

20
Figure 15. In the Northeast, the period following vegetables or specialty crops saw the greatest use of cover crops.
Continuing the trend seen in the South and Northeast, 50 of the 126 responses from Western farmers, or 40%, used covers after vegetable and/or specialty crops. Twenty percent showed the use of cover crops following small grains, while 10% reported cover crops behind corn and prior to soybeans, and the same number before both corn and soybeans. Other responses included cover crops in continuous corn rotations, following soybeans and before corn, and in continuous soybeans.

21
Figure 16. The most frequent use of cover crops in the West occurred after vegetables or specialty crops.
Photo 5. Planting into a wheat cover crop in Michigan

22
SEEding COVER CROPSDrilling is the most widely employed means of seeding a cover crop, according to the 2013-2104 survey. A total of 1,730 farmers responded to the question, “In the past year, how did you plant the majority of your cover crops?” Where multiple tactics were employed, the survey asked for the method used on the majority of the respondent’s cover crops. By far, the leading answer, with 46% of the respondents, was drilling cover crop seed.
Broadcast seeding with a light incorporation was the second-favorite choice, reported by 24% of the respondents. Aerial seeding was the primary means of establishing a cover crop for 15%, followed by a broadcast pass and leaving the seed on the soil surface, a tactic reported by 12% of the respondents.
Precision seeding with a corn or soybean planter was reported just 3% of the time, and 0.5% of the respondents seeded cover crops with a liquid manure application.
Figure 17. Chart showing the number of cover crop user respondents who employ each method of planting cover crops.

23
TERminATing COVER CROPSTerminating cover crops is connected to a wide variety of variables, ranging from species of cover crop to the weather at termination, timing of cover crop kill and when the subsequent cash crop will be planted. Survey respondents were asked to identify the primary cover crop termination method they used, or if there were several, to report the one they employed on the most acres during their last cover crop cycle.
In all, 1,691 farmers responded to this question. Nearly half, or 48%, reported using a herbicide to terminate their last cover crop. Tillage was the choice for 21% of the respondents. Selecting cover crops that winter kill was the top strategy for 20%, and mowing was employed by 10%. One percent reported using a roller-crimper, and 6% replied “Other.”
Figure 18. Nearly half of the respondents used herbicide to terminate their cover crops.
n=1,691

24
YiEld AnAlYSiSCover crops have a remarkable number of benefits, from protecting the soil against erosion to building healthier soils, but one of the most carefully scrutinized results of the use of cover crops is their impact on cash crop yields—widely viewed as the quickest return on investment.
In all, 639 respondents answered the question “On land where you planted cover crops in 2012, how did your 2013 corn crop perform compared to other, similar acreage where no cover crops were used (similar soils and similar cash crop management, including varieties and planting date)?” and 583 answered the same question regarding the yield impact of cover crops in their soybeans.
With any survey, there are occasionally typing errors or other challenges to collecting accurate numbers. For example, one respondent typed in a corn yield of 1,998 bushels per acre. To address these outliers, observations from the highest and lowest 1% of the yield data were removed. Removing outliers prevents these extreme cases from skewing the results of the data analysis. A total of 100 observations were removed; 35 observations from the corn/cover crop data pool, 17 reports from the corn/no cover crop group, 36 observations from the soybeans/cover crop data and 12 from the soybean/no cover crop collection. States with small numbers of observations were not used due to the difficulties in making statistical inferences from small numbers of observations.
Dr. Wallace E. Tyner and Joshua Leirer of Purdue University performed multiple hypothesis tests to answer, “Do cover crops increase yields?”
Nationally, respondents to the corn question reported a statistically significant increase in corn yield of 4.98 bushels per acre (3.2%) from the use of cover crops, and respondents to the soybean question said cover crops improved their soybean yields by a mean (average) of 2.0 bushels per acre (4.3%).
On a state-by-state analysis of data collected from respondents in 9 Midwestern states (Illinois, Indiana, Iowa, Michigan, Minnesota, Missouri, Nebraska, Ohio and Wisconsin), Tyner and Leirer found statistically significant reports of increases ranging from 2.2% to 7.9% in corn yield and 3.1% to 8.1% in soybean yield due to cover crops. However, they note, the questions were phrased in a way that a respondent’s answer could only be used if the farmer both used and did not use cover crops on similar acreage. Another cautionary note is that the yield comparisons are based on farmer reports rather than on a controlled study.
Yield impacts reported in the 2103-2014 survey were lower than those reported in last year’s SARE-CTIC cover crop survey. In the 2012-2013 Cover Crop Survey Report, participating growers reported an average yield increase of 11.1 bushels of corn per acre (9%) and 4.9 bushels of soybeans per acre (10%).

25
There are several possible reasons for the higher yields in the earlier survey, including the impact of the 2012 drought, which may have allowed the moisture-trapping benefits of cover crops to have a particularly large effect on yields that year—especially compared to a more “normal” growing season like 2013.
Another factor may be the possibility that the respondents for the first year’s survey had more experience with cover crops than the average respondent in the 2013-2014 report, as the first year’s sample was drawn largely from groups with strong interest in cover crops and other conservation practices. Respondents to the 2013-2014 survey had an average of 8.25 years of experience with cover crops. But because data from the 2012-2013 survey was broken into just two categories of experience—less than three years of experience with cover crops (45% of respondents) and three or more years of experience with cover crops (55%)—we cannot make a valid comparison between the two surveys.
However, it was clear that yield benefits rose as farmers reported more years of experience with cover crops.
In the 2013-2014 survey, the mean difference in yield for corn among farmers with 0 to 3 years of experience in cover crops was an increase of 2.04 bushels per acre, while farmers with 4 or more years of experience in cover crops reported a mean increase of 6.76 bushels per acre.
A similar pattern was evident in soybeans. Farmers with 0 to 3 years of cover crop experience reported a mean increase of 1.09 bushels per acre, while growers with 4 or more years of experience in cover crops saw a mean increase of 2.84 bushels. It should be noted that there is an opportunity for self-selection with this question, as a producer would likely not continue to use cover crops after many years if some benefit was not observed.

26
Figure 19. Corn yields on fields that had previously been in cover crops were 5 bushels per acre higher than on fields that had not had a cover crop the previous season—an increase of 3.2%. Note that the n value of this graph reflects the removal of outliers at the top and bottom 1% of the data pool.
Figure 20. Soybean yields increased by 2 bushels per acre where cover crops were used, a boost of 4.6%. Note that the n value of this graph reflects the removal of outliers at the top and bottom 1% of the data pool.
n=449
n=502

27
Figure 21. In every state shown but Missouri and Iowa, cover crops helped increase corn yields as reported by respondents to this survey.
Figure 22. The benefits of cover crops on soybean yields appeared across the Midwest and East.
State data are available from CTIC. Email [email protected] or call (765) 494-9555.

28
SEEd, SEEding And ESTABliShmEnT COSTSThe large majority of respondents—71%, or 1,103 of 1,554 total answers to the question—seeded their own cover crops. Asked about the cost of having a contractor seed the cover crops, 27% of the respondents reported a median seeding cost of $12 per acre.
Custom planting/establishment costs ranged widely on a regional basis, from a median of $12.00 in the Midwest and South to $18.50 in the Northeast and $22.50 in the West. Removing outliers from the full pool of data yielded the national median value of $12. (The median figure is on the low end of the four regional figures because of the large sample size of Midwestern farmers).
This group of data illustrates the importance of choosing the best way to accurately represent “the average.” Average can be expressed by either a median or a mean value.
To obtain a median value, the entire pool of data is listed in ascending or descending order. The figure that is equidistant from the top and bottom of the list—exactly in the middle—is the median. A mean is calculated by adding up all the values and dividing the sum by the number of data points that were added up.
A mean can be significantly swayed by a few extremely low or extremely high values. In this case, the mean value for the amount paid to plant or establish the crop was $25.37, while the median was $12. With such a huge difference at stake, it was critical to follow the advice of Tyner and Leirer at Purdue and use the median for most accurate results.
Growers—presumably, those who don’t already pay a contractor for custom seeding—said they would be willing to pay somewhat less per acre than the actual going rate for the service. Median values for what growers would be willing to pay contractors, if necessary, were $10 per acre in the Midwest, $12 in the South, $17.50 in the Northeast and $15 in the West.
Seed cost is another major factor in the economics of cover crops. In fact, seed is a substantially more expensive input than seeding. Median seed costs, with data “tails” removed, were $25 per acre. As with the seeding/establishment costs, regional data breakdowns of seed costs showed a wide range by geography, from a median seed cost of $25 per acre in the Midwest to a median of $40 per acre in the West.

29
Figure 23. Median cover crop seed cost varied significantly by region.
Photo 6. A turnip cover crop on an Indiana farm.
Because many respondents reported using different species of cover crops, the median reflects the entire data pool rather than attempting to divide costs by individual species or variety of cover crop.

30
PERCEiVEd BARRiERS TO AdOPTiOnCover crop users were asked to rate several factors “in terms of how much they limit the adoption of cover crops in your area.” Ratings in this series of responses can help guide priorities as conservation leaders seek to reduce barriers to adoption.
The perception that cover crops are costly was the principal barrier to adopting cover crops in the survey, said by 34% of respondents to always limit adoption, 54% to somewhat limit adoption, and 12% not to limit adoption. Similar figures—32% always, 52% somewhat and 16% does not limit adoption—addressed the statement “perception that cover crops make planting [cash crops such as corn or beans] more difficult.”
Figure 24. Cover crop users evaluated the factors that influence adoption of the practice among their peers.

31
On a similar management-oriented note, concerns that cover crops are tough to terminate was said by 29% of respondents to always limit adoption, while 52% said they somewhat limit adoption and 19% said such concerns do not limit adoption. A perception that cover crops reduce yields in the following cash crops was reported by 25% of respondents to always limit adoption, by 47% to somewhat limit adoption, and 28% to pose no limits to adoption.
The availability of planting equipment and service providers still needs work, making it the fifth-highest-ranked “always limits adoption” barrier. Though 29% of the cover crop users surveyed said this factor does not limit cover crop adoption, 49% reported that it somewhat does, and 22% said it always limits adoption.
Farmers’ enthusiasm for cover crops can be tempered not only by their own concerns and capabilities, but by those of partners, farm managers and other influencers in their businesses. Asked to rate the impact of “farm management/partner views on cover crops,” 60% of the cover crop users said they somewhat limit adoption, 16% that they always limit adoption and 24% that they do not limit adoption.
Access to trusted technical advisors is clearly important. Twenty-six percent of respondents who grow cover crops said such access does not limit adoption of cover crops, but 57% said it somewhat limits adoption and 17% reported that it always limits adoption.
Information—however it is delivered—is a key factor. Rating how the amount and availability of cover crop information may limit the adoption of cover crops, 61% of respondents said “somewhat” and 15% said “always.” Just 24% said the amount and availability of cover crop information does not limit adoption of cover crops.
An almost equally important obstacle is the amount and availability of financial incentives, according to respondents—61% said those factors were somewhat limiting, 14% said they always limit adoption, and 25% report that incentive amounts and availability do not limit the adoption of cover crops.
General interest in cover cropping is a major factor challenging conservation leaders. Fifty-nine percent of respondents who use cover crops say general interest somewhat limits adoption, while 20% said it doesn’t limit adoption and 21% says it always does.
Stimulating greater interest in cover cropping and addressing concerns about the costs and challenges posed by cover crops will draw together many elements explored in this question, including access to information and contact with trusted technical advisors.

32
COVER CROP BEnEfiTSProponents of cover crops cite a wide range of benefits that can result from the practice, ranging from agronomic to economic advantages. Among cover crop users asked to identify the benefits they would most like to gain from using cover crops, the top three all revolved around soil health-related factors.
Of 1,427 cover crop users selecting the three benefits they desired most, 74% chose increased soil organic matter, 51% cited reducing soil erosion and 35% said they hoped cover crops would reduce soil compaction.
Controlling weeds appealed to 28%, while providing a nitrogen source was a hit among 23% and nitrogen scavenging was cited by 17%. Increases in yield in the following cash crop came in close behind with 16%, while economic return was cited by 12%. The hope that cover crops decrease the cost of producing the following cash crop was checked off by 5% of the respondents.
Figure 25. Soil improvements or protection topped the list of benefits cover crop users desire from their covers.

33
Ten percent (143 respondents) hoped for a fibrous rooting system and nearly the same number, 135, were aiming for deep tap roots—clearly reflecting interests in different cover crop species.
Other benefits included attracting pollinators to the farm (4%), easy winter kill (4%), the contradictory winter hardiness/survival at 2%, reducing diseases (2%) and controlling insects (1.5%). “Other” received 3% of the responses.
A sample of 530 non-users of cover crops reported similar priorities. As with the cover crop users’ answers, increasing soil organic matter, reducing soil erosion and reducing compaction were the top three choices.
Figure 26. Non-users said they desire the same top-three benefits as cover crop users did.

34
With the increased awareness among farmers and other members of the public of the challenges facing honeybees and other pollinators, SARE and CTIC included a question on the benefits of cover crops to pollinators.
Of 419 respondents who answered a question about whether they managed their farm to provide forage for honeybees—an exploration of another type of cover crop benefit—47% said they did not, 38% said they planted bee-attractive plants to provide forage, and 32% said they managed their cover crops to provide forage for pollinators. Interestingly, 2% said they managed their cover crops as traps to lure bees away from production crops.
Asked about financial incentives for enhancing pollinator conditions, just 2% reported receiving a subsidy or incentive payment for maintaining pollinator-friendly habitat.
Managing for pollinators provided a range of benefits for the sample of 419, including improved yields of crops in which pollination services were not contracted (29%), honey or honeybee products for personal use (25%), honey or honeybee products for sale (15%) and improved yields of crops for which the respondent also contracted for pollination (15%).
Photo 7. Turnips and cereal rye as a cover crop on a farm in Indiana.

35
COVER CROP ChAllEngESCover crops demand increases in investment and management, and add challenges to the already complicated business of crop production. Farmers’ perceptions of those challenges strongly impact the appeal of planting cover crops.
The survey asked users and non-users of cover crops to select the top three challenges posed by cover crops from a list of 14 options plus “other.” Of 1,415 cover crop users who answered, half—702, or 50%—selected “Time/labor required for planting and increased management.”
Figure 27. Half the respondents who use cover crops said time and labor are the biggest challenge to managing them.

36
Several highly ranked challenges can be directly addressed by educating farmers about cover crops. The challenges of establishing cover crops was the second most-selected option among cover crop users, with 43% of cover crop using respondents listing it in their top three concerns. “Selecting the right cover crop for my operation” garnered 36%, but increasing overall crop production risk was noted by only 6%.
Economics raise significant concerns among farmers who use cover crops. The cost of seed was third most oft-cited challenge, with 38% of responses. Other economic factors included the cost of planting and managing cover crops (35%), and “no measurable economic return” (16%). Yield reduction in the following cash crop was a top-three concern of just 5% of the respondents who use cover crops.
Agronomics and biology were also cited as challenges by some farmers. Concerns that cover crops sometimes use too much moisture were noted by 14%, and the prospect of cover crops becoming weeds the following year was a concern of 10% of cover crop users. Additional choices selected by small groups of users included the increased potential for insects, nitrogen immobilization and increased disease potential.
The availability of cover crop seed was noted by 16% of the respondents who used cover crops.
An increase in overall crop production risk earned 6% of the responses, and “other” was selected by 9%.

37
Figure 28. Time/labor was the top barrier for non-users of cover crops, followed by concerns over making good choices of cover crop species.
ChAllEngES REPORTEd BY nOn-USERS Among 525 non-users of cover crops, the leading response on cover crop challenges was the same as that expressed by the group that planted cover crops: time/labor was top with 46% of respondents including it on their list of top three concerns. Figuring out the right cover crop was second with 35% of non-users and “cost of planting and managing cover crops is too high for the benefits” scored third with 34% of the non-cover-crop-planting respondents.

38
lAndlORd inflUEnCESWith all the challenges, real or perceived, posed by cover crops, landlords could pose a significant obstacle if they rejected or discouraged the practice.
Fortunately, few landlords were reported to be opposed to cover crops in this survey. Nine-hundred ninety-two cover crop users reported renting land and responded to a question on landlord attitudes toward cover crops.
Of that group, 32% said their landlords were very supportive of cover crops and 28% said they were somewhat supportive. Twenty-one percent reported that their landlords had no opinion, and 13% said they didn’t know their landowners’ opinion on cover crops. Just 5% said their landlords were somewhat or very opposed to cover crops on their fields.
Figure 29. Half the cover crop users reported that their landlords were very or somewhat supportive of cover crops on their land.

39
Photo 8. Aerial seeding of a cover crop in Illinois.
inCEnTiVE PROgRAmSA significant line of questioning in the 2013-2014 survey explored motivations for adopting cover crops, including respondents’ use of conservation programs to fund the planting and management of their covers. Results from these questions could help guide program development and implementation to best inspire and encourage cover crop adoption.
One of the most surprising findings in this survey was on the question of incentive payments. Some people presume that many farmers only plant cover crops when they are paid by local, federal or state government to implement the practice. However, of 1,445 respondents who answered the question, “Have you received cost-share assistance or incentive payments in the past to plant cover crops?” 63% said they had not (ever) received assistance to plant cover crops. Just 8% said they have “only planted cover crops when receiving financial assistance.”
This is not to say that incentive payments are not helpful. In fact, they often are a way for farmers and landowners to get started with cover crops. Such incentives appear to work well at starting many farmers on cover crops, then allowing the benefits of covers to inspire growers to continue without constant funding. Illustrating that point, the survey revealed that 14% of the cover crop users who responded to this question initially received assistance but now “largely self-fund,” and 15% said they “periodically” received and used financial assistance.

40
From a communications perspective, it is worth noting that 30% of respondents reported that they are not sure whether they are eligible for USDA conservation programs, and 17% said they are not eligible. It is important to note that this question was asked of both users and non-users of cover crops, and included farmers who grow primarily horticultural crops and are not as likely to sign up for NRCS or other conservation incentive programs on smaller acreages.
Reducing cash crop insurance premiums for growers who plant cover crops is a promising incentive, according to respondents. Of 1,412 cover crop users who answered this question, 60% predicted that such a program “may increase cover crop use” and 24% suggested that “it would definitely increase cover crop use.” Just 16% predicted that lowering cash crop insurance premiums for using cover crops would not change cover crop use.
Figure 30. Most respondents have not received government funds to plant cover crops, though incentives have helped many cover crop users get started with the practice.
n=1,445

41
Photo 9. A mix of oats and radish used as a cover crop in Indiana.
lEARning OPPORTUniTiESQuestions on inspiration and motivation continued with an exploration of the most effective ways respondents felt they could learn about cover crops. A wide range of learning styles were explored; some were significantly better rated, while the diversity of answers indicates that teaching farmers about the benefits and management of cover crops can include many approaches.

42
Figure 31. Cover crop users find many types of learning tools helpful, but trying things themselves ranked highest.
Cover crop users rated “trying things out on my own and learning from successes and mistakes” the most effective learning opportunity: 59% reported trial and error to be “always effective” and 37% said it was “sometimes effective” for a positive total of 96%.
Local cover crop workshops in which local farmers and experts share their experiences rated a close second place in the overall positive responses, garnering a total of 91% effective responses. Within that 91% positive total, “always effective” rated a 38% share and “sometimes effective” accounted for 53%.
n=1,459

43
“Researching information by myself on the internet” rated a total of 86% positive responses, with 59% reporting online self-study “sometimes effective” and 27% “always effective.”
Large regional meetings hosted by “experts” (but, significantly, not mentioning farmers) tallied up 78% positive responses—22% “always” and 56% “sometimes” effective. On-farm visits from local conservation advisors added up to nearly the same number of overall positive scores—77%—with a significant majority (61%) saying such visits were “sometimes effective” and 16% saying they were “always effective.”
Talking with neighbors about their experience with cover crops received very similar results, including an overall positive share of 76%, with 61% reporting it is “sometimes effective” and 15% saying “always.” Interestingly, this answer received the highest percentage of “not at all effective” responses: 11%.
“Meeting with my seed dealer, local retailer or agronomist on my farm to discuss cover crops” logged 18% “always effective” and 54% “sometimes effective” scores, totaling 72% positive responses among users of cover crops.
Responses of 538 non-users of cover crops were also tabulated for this question. It is interesting to note that the perceived value of the various sources of insight were quite similar to those of cover crop users.
Photo 10. A radish and annual ryegrass cover crop mix on a farm in Illinois.

44
Figure 32. Like cover crop users, non-users rate personal experimentation highest when assessing learning opportunities.
“Trying things out on my own” scored 44% “always effective” and 45% “sometimes effective” among non-users; local workshops with farmers and experts rated 43% “always” and 50% “sometimes” effective. Meeting with a local seed dealer, retailer or agronomist was reported always effective by 24% and sometimes effective by 58% of respondents who did not plant cover crops, and an on-farm visit by a local conservation advisor scored almost the same, with 24% “always” and 57% “sometimes effective.”
A large, regional meeting was seen as always effective by 20% of the non-user group; 54% said a regional meeting is sometimes effective.

45
Talking over the fence with a neighbor scored 12% “always effective” and 65% “sometimes effective” among non-users.
The non-user group was much less confident in what it was learning online, with only 19% saying self-study on the internet was always effective compared to 27% of the farmers already using cover crops.
The non-user audience seems to be ripe for face-to-face contact and discussions that address questions and concerns about cover crops.
Photo 11. A terminated cereal rye cover crop in Indian is prepared for planting.

46
ThE ROlE Of AgRiCUlTURAl RETAilERSAgricultural retailers are a key source of information for many farmers on a wide array of management practices, from crop nutrient management to pest control, and are often among the most respected sources of insight on new technology for the farm. Ag retailers also often provide services such as custom seeding or application.
The 2013-2014 SARE/CTIC survey explored possible roles for ag retailers in helping growers adopt and manage cover crops. Results indicate several opportunities for retailers, particularly as advisors on seed, cover crop termination and soil analysis.
Of the 1,440 cover crop users who responded to this question, many reported significant roles for agricultural retailers in helping farmers adjust nutrient management plans to account for cover crops (57%), providing cover crop termination advice and service (56%), helping growers assess and understand soil changes resulting from cover crops (53%), advising farmers on cover crop seed to purchase (44%), providing cover crop seeding services (42%), and encouraging farmers to plant cover crops (34%).
Figure 33. Cover crop users see important roles for ag retailers, particularly in consulting on nutrients, soil and termination tactics.

47
Similar patterns emerged among the 538 non-users who responded to this question. The only real difference was that a lower percentage of respondents thought ag retailers should encourage farmers to plant cover crops. This is not surprising, as farmers already using cover crops are more likely than non-users to want to see others promoting them.
Figure 34. Non-users believe ag retailers could help advise farmers on cover crop fertilization and termination.

48
COmmEnTS fROm fARmERSRespondents were asked what they would tell a neighbor about cover crops. Many answers reflected the enthusiasm cover crop users build for the practice, including:
• “ The percentage of farms that can benefit from the use of cover crops is huge when compared to the ones that THINK they cannot benefit by their use.”
• “Better try cover crops because your soil is going backwards.”
• “ Cover crops mimic what Mother Nature was doing before man began farming, she always kept herself covered and always had some kind of live roots year round. The closer we can mimic this the better our soils will become over time.”
• “ By using cover crops we will be able to recover the rich fertile living soils we once had, and we will be able to pass it on to future generations.”
• “Good for my grandkids’ soils.”
• “There is room on every farm for cover crops.”
Other respondents emphasized key benefits of cover crops. Some of those answers include:
• “Controls wind erosion.”
• ”Cover crops improve my soil and profits.”
• “Increases the source of nitrogen for future crops and helps reduce erosion.”
Not all respondents were enthusiastic, however. One wrote, “They are not easy to get established. They work better on better soils and well drained soils. Slugs are a big issue that no one wants to talk about or admit. It has cost us yield in the following cash crop.”
Still, positive comments significantly outweighed negative ones, and some growers offered sage advice:
• “Plant corn deeper if using a green cover crop in spring.”
• “Use every source of information available, learn all you can, set goals and start small.”
• “Learning curve is steep. Start trying now.”
• “ They are not a one-time practice but a long-term system. This system has enormous benefits while the individual practices making up the system are hard to quantify in the short run.”
• “ Don’t expect immediate results. They can happen, but cover crops are best looked upon as a long-term investment.”
• “Please use cover crops. They do work, and help in ways nothing else does.”

49
All photos courtesy of CTIC
COnClUSiOnThe 2013-2014 SARE/CTIC Cover Crop Survey dramatically broadened the respondent pool from which insight could be gathered about cover crop habits and philosophy—both in numbers and in geography. Though the significant differences in samples from this study to last year’s prevent direct comparisons between the two data sets, the current survey adds to the perspective gleaned from last year’s sample.
Farmers indicated they are looking for soil benefits from cover crops—particularly increased soil organic matter. Some of these soil improvements seem to be reflected in the yield benefits cover crops provided for corn and soybean producers in 2013.
The top perceived challenges for cover crops were noted as the time required to plant and manage cover crops, terminating cover crops, and selecting the right cover crop varieties. Those impediments can be addressed through education. The survey also found that farmers not yet using cover crops have a strong perception that cover crop seed is expensive.
Survey respondents felt it was most effective to learn by experimenting on their own farms, but also saw significant value in in-depth educational opportunities such as workshops. Quite importantly, the new data underscore the importance of good, clear education in helping farmers gain confidence in cover crops, make good choices in seed and management, and overcome barriers to trying the practice. It is clear that local perspective is important, as is peer-to-peer insight.
Agricultural retailers clearly should see cover crops as an exciting business opportunity. Ag retailers’ expertise in the management of herbicides and fertilizers, as well as seed selection, are viewed by farmers in this survey as major strengths. Stocking cover crop seed and providing custom seeding and spraying service for cover crop acres appear to offer significant growth opportunities for ag retailers and cooperatives.
In all, the 2013-2014 SARE/CTIC Cover Crop Survey provides guidance to agencies, ag retailers, extension crop advisors and other information providers eager to craft key messages and develop effective approaches to supporting the adoption of cover crops—a goal that is steadily gaining ground.