Embed Size (px)
Citation preview
Z,1 Substatiort Refurbish~nent and Modernization NP 2011 CBA
2011 Substation Refurbishment and Modernization
June 2010
Prepared by:
Peter Feehan, P.Eng.

2.1 2011 Substation Refurbishment and Modernization NP 2011 CBA
i
Table of Contents
Page 1.0 Substation Refurbishment and Modernization Strategy ......................................................1 2.0 Substation Refurbishment and Modernization 2011 Projects ..............................................1
2.1 Heart’s Content Substation ......................................................................................2 2.2 Portable Substation P3 .............................................................................................6 2.3 Port aux Basques Substation ....................................................................................7 2.4 New Grand Falls Substation ...................................................................................9 2.5 Stamps Lane Substation ........................................................................................12 2.6 Items Under $50,000 ..............................................................................................13 2.7 Substation Monitoring and Operations .................................................................14

2.1 2011 Substation Refurbishment and Modernization NP 2011 CBA
1
1.0 Substation Refurbishment and Modernization Strategy Newfoundland Power’s (the “Company”) substations connect the high voltage transmission system to the low voltage distribution system. The Company’s substation maintenance program and the Substation Refurbishment and Modernization project ensure the delivery of reliable least cost electricity to customers in a safe and environmentally responsible manner. The Substation Refurbishment and Modernization project provides a structured approach for the overall refurbishment and modernization of substations and coordinates major equipment maintenance and replacement activities. Where practical the substation plan is coordinated with the maintenance cycle for major substation equipment. This coordination minimizes customer service interruptions and ensures optimum use of resources. In preparation of annual capital budgets, substations are assessed with particular consideration given to the condition of the infrastructure and equipment and the need to upgrade and modernize protection and control systems. This assessment is used to establish the priority for substation work. Much of this work requires the power transformer to be removed from service; and, therefore, the timing of the work is restricted to the availability of the portable substation and the capacity of the portable substation to meet the load requirement. In many circumstances, this requires the work to be completed in the late spring and summer when the substation load is light. In the Substation Strategic Plan filed with the Company’s 2007 Capital Budget Application, it was indicated that expenditures under the Substation Refurbishment and Modernization project were expected to average approximately $4 million per year. Expenditure is currently expected to reach this level in 2010. In 2011, the budget estimate is materially below this level due to a requirement to address government regulations concerning polychlorinated biphenyls (“PCB”).1 Such developments highlight the practical requirement for flexibility in execution of the Substation Refurbishment and Modernization project over time. The current five-year forecast for the Refurbishment and Modernization Capital Plan is shown in Appendix A. 2.0 Substation Refurbishment and Modernization 2011 Projects The 2011 Substation Refurbishment and Modernization Project includes planned refurbishment and modernization work on 4 substations and one of the Company’s portable substations. This work is estimated to cost a total of $2,753,000, which comprises approximately 90% of total 2011 project costs. Silicon carbide lightning arrestors are planned to be replaced in an additional 2 substations on a priority basis. Petro plug devices are planned to be installed in 8 substations to permit continuous draining of water from spill containment pans. Protection improvements are planned for 2 substations. These improvements are estimated to cost a total of $171,000, which comprises approximately 6% of total 2011 project costs. Finally, system monitoring and 1 A description of the work required to meet the new PCB regulations established by Environment Canada can be
found in 2.3 2011 PCB Removal Strategy.
2.1 2011 Substation Refurbishment and Modernization NP 2011 CBA
2
operations technology upgrades are planned at $150,000. This comprises approximately 5% of total 2011 project costs. The refurbishment of Portable Substation P3, with the exception of the engineering work which is being completed in 2010, is included with the 2011 Refurbishment and Modernization project. The reason for not completing the refurbishment of P3 in 2010 is that the scheduled use of the portable substation in 2010 did not allow sufficient time to complete the refurbishment. A similar project to upgrade Portable Substation P4 was scheduled for 2011 and has been re-scheduled to 2012. Delaying the refurbishment of P4 to 2012 is required since it is not possible to upgrade both portable substations in 2011 and still complete the planned substation capital and maintenance programs.
Table 1 2011 Substation Projects
(000s)Substation Budget
Heart’s Content (HCT) Portable Substation 3 (P3) Port aux Basques (PAB) New Grand Falls (NGF) Stamps Lane (SLA) Items Under $50,000 Substation Monitoring
$1,007
440 440 707 159 171 150
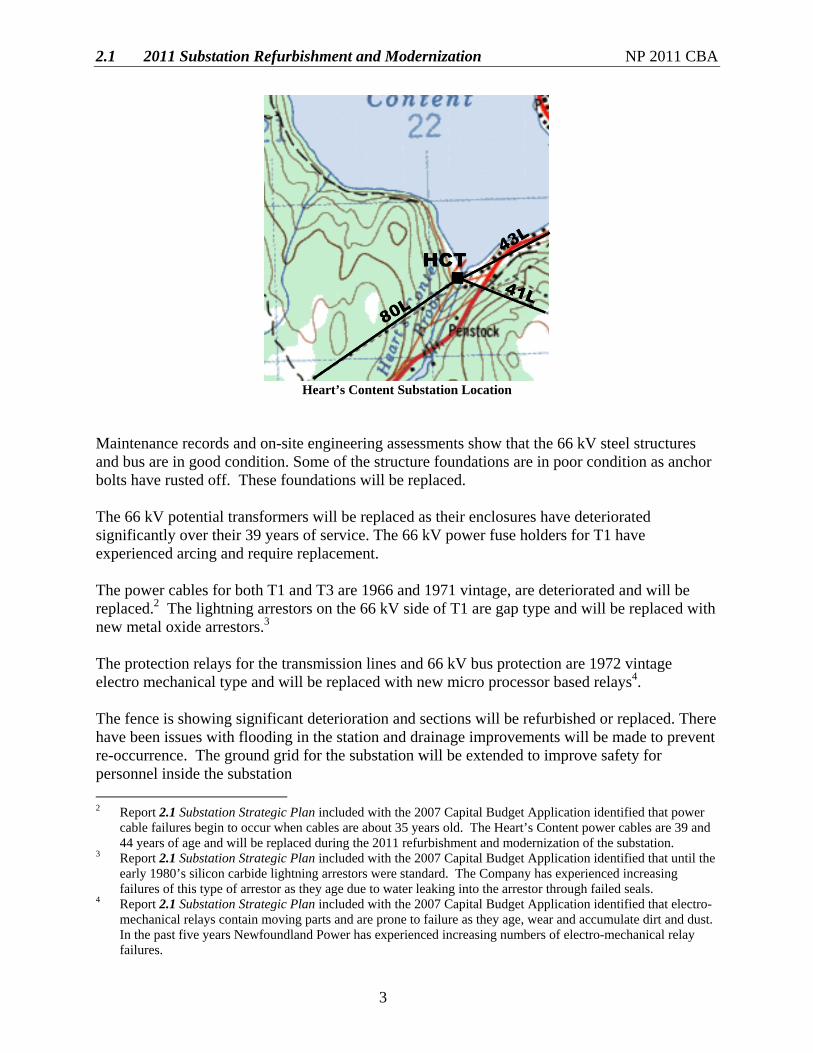
Total $3,074 The following pages outline the capital work required in each substation. 2.1 Heart’s Content Substation ($1,007,000) Heart’s Content substation was built in 1956 as a generation substation and over the years has developed into a distribution substation. The substation contains one 66 kV to 12.5 kV distribution power transformer T3 with a capacity of 2.3 MVA and one 66kV to 2.4 kV generation power transformer T1 with a capacity of 3 MVA. The substation directly serves approximately 450 customers in the Heart’s Content area through one 12.5 kV feeder. In the substation there are three 66 kV transmission lines terminated on the high voltage bus, transmission lines 41L to Carbonear substation, 43L to New Chelsea substation and 80L to Islington substation.
2.1 2011 Substation Refurbishment and Modernization NP 2011 CBA
3
Heart’s Content Substation Location
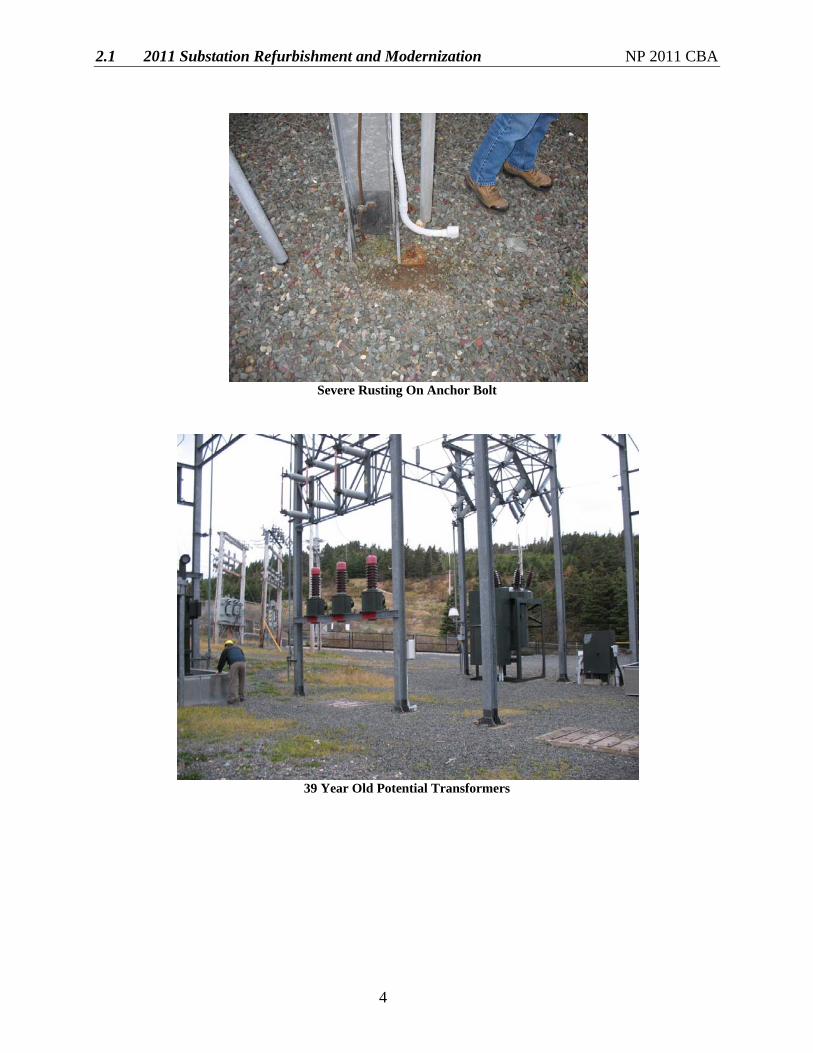
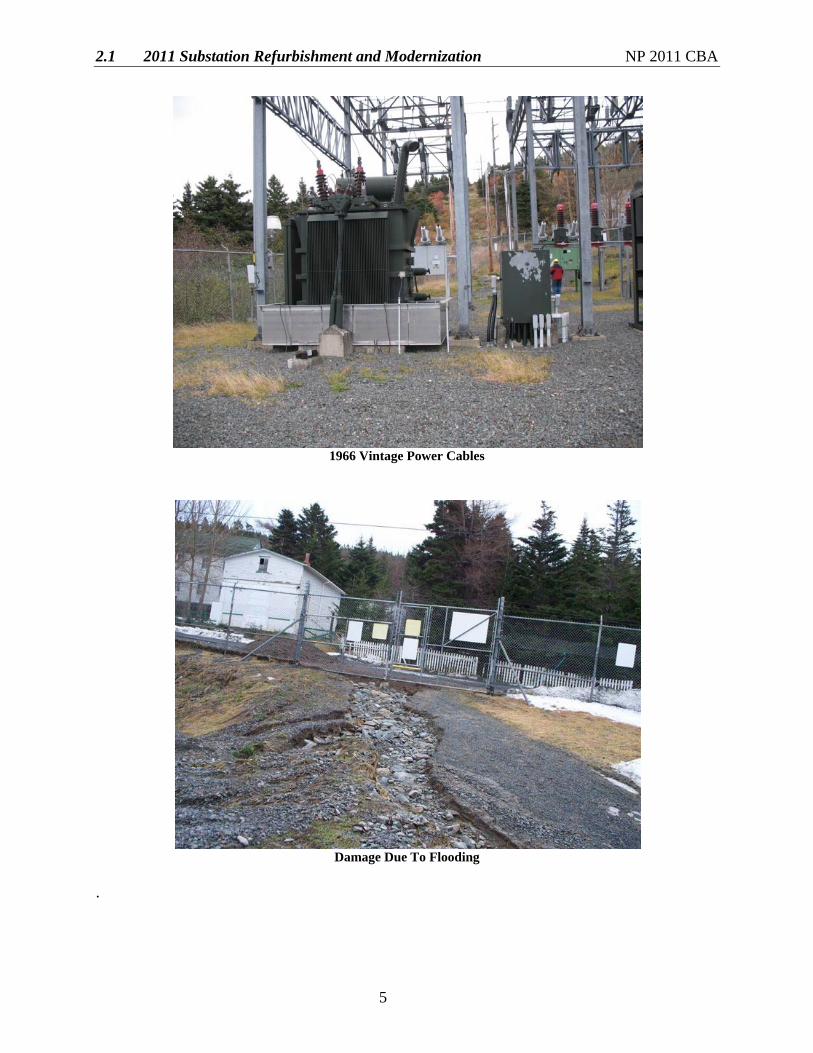
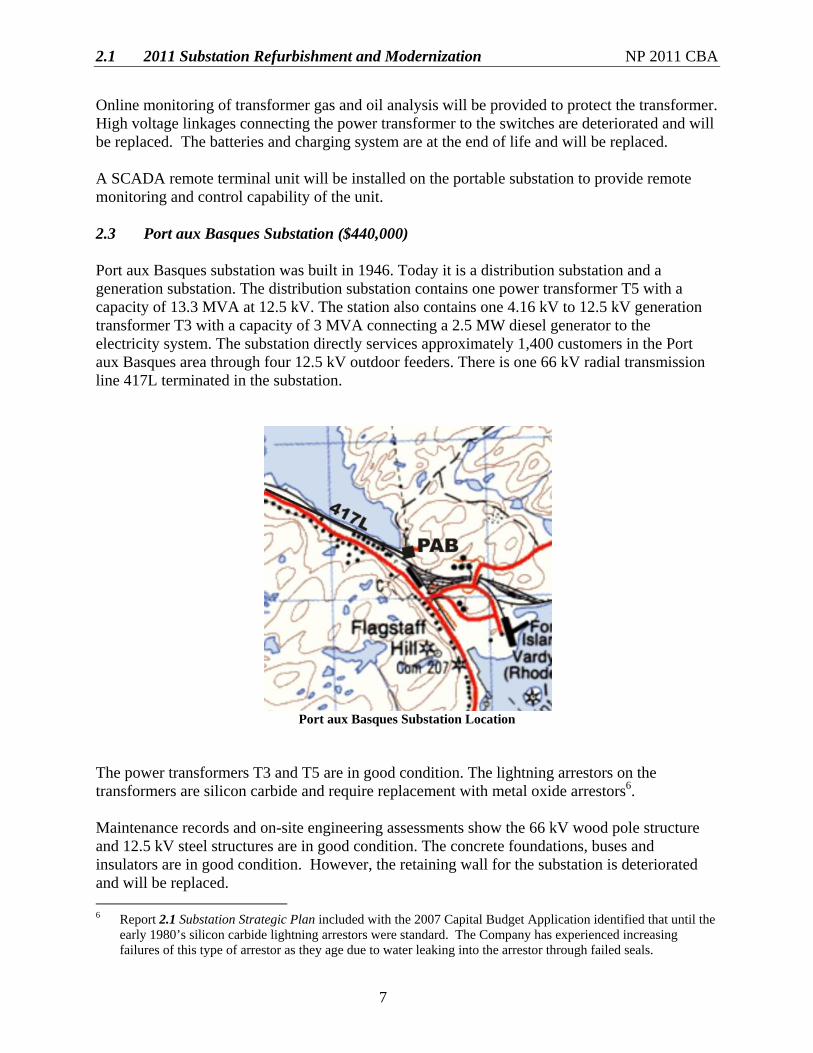
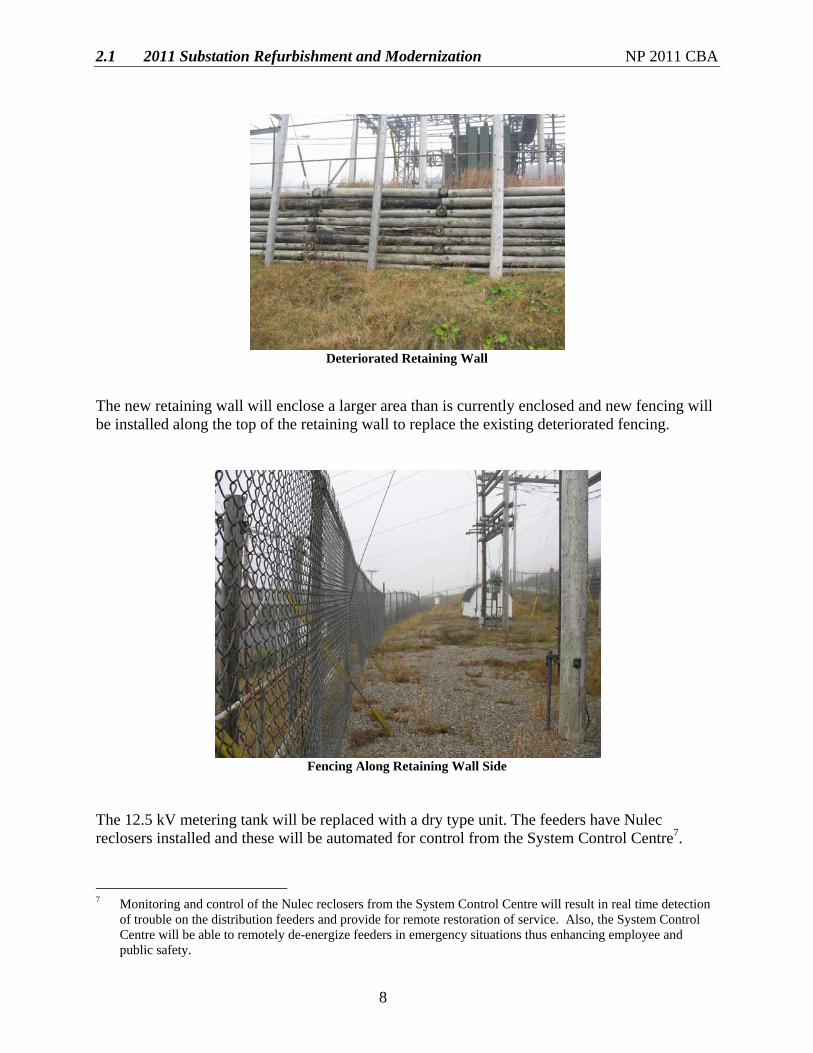
Maintenance records and on-site engineering assessments show that the 66 kV steel structures and bus are in good condition. Some of the structure foundations are in poor condition as anchor bolts have rusted off. These foundations will be replaced. The 66 kV potential transformers will be replaced as their enclosures have deteriorated significantly over their 39 years of service. The 66 kV power fuse holders for T1 have experienced arcing and require replacement. The power cables for both T1 and T3 are 1966 and 1971 vintage, are deteriorated and will be replaced.2 The lightning arrestors on the 66 kV side of T1 are gap type and will be replaced with new metal oxide arrestors.3 The protection relays for the transmission lines and 66 kV bus protection are 1972 vintage electro mechanical type and will be replaced with new micro processor based relays4. The fence is showing significant deterioration and sections will be refurbished or replaced. There have been issues with flooding in the station and drainage improvements will be made to prevent re-occurrence. The ground grid for the substation will be extended to improve safety for personnel inside the substation 2 Report 2.1 Substation Strategic Plan included with the 2007 Capital Budget Application identified that power
cable failures begin to occur when cables are about 35 years old. The Heart’s Content power cables are 39 and 44 years of age and will be replaced during the 2011 refurbishment and modernization of the substation.
3 Report 2.1 Substation Strategic Plan included with the 2007 Capital Budget Application identified that until the early 1980’s silicon carbide lightning arrestors were standard. The Company has experienced increasing failures of this type of arrestor as they age due to water leaking into the arrestor through failed seals.
4 Report 2.1 Substation Strategic Plan included with the 2007 Capital Budget Application identified that electro-mechanical relays contain moving parts and are prone to failure as they age, wear and accumulate dirt and dust. In the past five years Newfoundland Power has experienced increasing numbers of electro-mechanical relay failures.
2.1 2011 Substation Refurbishment and Modernization NP 2011 CBA
4
Severe Rusting On Anchor Bolt
39 Year Old Potential Transformers
2.1 2011 Substation Refurbishment and Modernization NP 2011 CBA
5
1966 Vintage Power Cables
Damage Due To Flooding
.

2.1 2011 Substation Refurbishment and Modernization NP 2011 CBA
6
2.2 Portable Substation P3 ($440,000) Portable substation P3 was purchased in 1977. It is used to respond to power transformer failures and for carrying out planned transformer and substation maintenance. Of the approximate 190 power transformers in service on Newfoundland Power’s system, P3 can provide backup for 68% of them.
Portable Substation P3
This is the first comprehensive refurbishment of this portable substation since its purchase over thirty years ago. Purchase of a comparable new portable substation would cost approximately $5 million. Refurbishment of portable substation P3 will ensure its continued availability for the next decade. The trailer will undergo an overhaul addressing rust damage and applying a rust inhibiting coating to the chassis. The manual hydraulic jacks on the unit have deteriorated and they will be replaced with a motorized system. A fall arrest system and work platforms will be installed in areas when employees have to work aloft. External lighting will be provided at locations around the trailer. The alarm annunciation panel has had several failures and will be replaced. The protection relays are 32 year old electro mechanical type and will be replaced with new electronic digital protection relays.5 A digital metering system for power, voltage and current will be provided. The control wiring associated with the protection and control of the portable substation is original wiring showing signs of deterioration and will be replaced. Deteriorated termination and junction boxes will be replaced. 5 Report 2.1 Substation Strategic Plan included with the 2007 Capital Budget Application identified that electro-
mechanical relays contain moving parts and are prone to failure as they age, wear and accumulate dirt and dust. In the past five years Newfoundland Power has experienced increasing numbers of electro-mechanical relay failures.
2.1 2011 Substation Refurbishment and Modernization NP 2011 CBA
7
Online monitoring of transformer gas and oil analysis will be provided to protect the transformer. High voltage linkages connecting the power transformer to the switches are deteriorated and will be replaced. The batteries and charging system are at the end of life and will be replaced. A SCADA remote terminal unit will be installed on the portable substation to provide remote monitoring and control capability of the unit. 2.3 Port aux Basques Substation ($440,000) Port aux Basques substation was built in 1946. Today it is a distribution substation and a generation substation. The distribution substation contains one power transformer T5 with a capacity of 13.3 MVA at 12.5 kV. The station also contains one 4.16 kV to 12.5 kV generation transformer T3 with a capacity of 3 MVA connecting a 2.5 MW diesel generator to the electricity system. The substation directly services approximately 1,400 customers in the Port aux Basques area through four 12.5 kV outdoor feeders. There is one 66 kV radial transmission line 417L terminated in the substation.
Port aux Basques Substation Location
The power transformers T3 and T5 are in good condition. The lightning arrestors on the transformers are silicon carbide and require replacement with metal oxide arrestors6. Maintenance records and on-site engineering assessments show the 66 kV wood pole structure and 12.5 kV steel structures are in good condition. The concrete foundations, buses and insulators are in good condition. However, the retaining wall for the substation is deteriorated and will be replaced. 6 Report 2.1 Substation Strategic Plan included with the 2007 Capital Budget Application identified that until the
early 1980’s silicon carbide lightning arrestors were standard. The Company has experienced increasing failures of this type of arrestor as they age due to water leaking into the arrestor through failed seals.
2.1 2011 Substation Refurbishment and Modernization NP 2011 CBA
8
Deteriorated Retaining Wall
The new retaining wall will enclose a larger area than is currently enclosed and new fencing will be installed along the top of the retaining wall to replace the existing deteriorated fencing.
Fencing Along Retaining Wall Side
The 12.5 kV metering tank will be replaced with a dry type unit. The feeders have Nulec reclosers installed and these will be automated for control from the System Control Centre7.
7 Monitoring and control of the Nulec reclosers from the System Control Centre will result in real time detection
of trouble on the distribution feeders and provide for remote restoration of service. Also, the System Control Centre will be able to remotely de-energize feeders in emergency situations thus enhancing employee and public safety.
2.1 2011 Substation Refurbishment and Modernization NP 2011 CBA
9
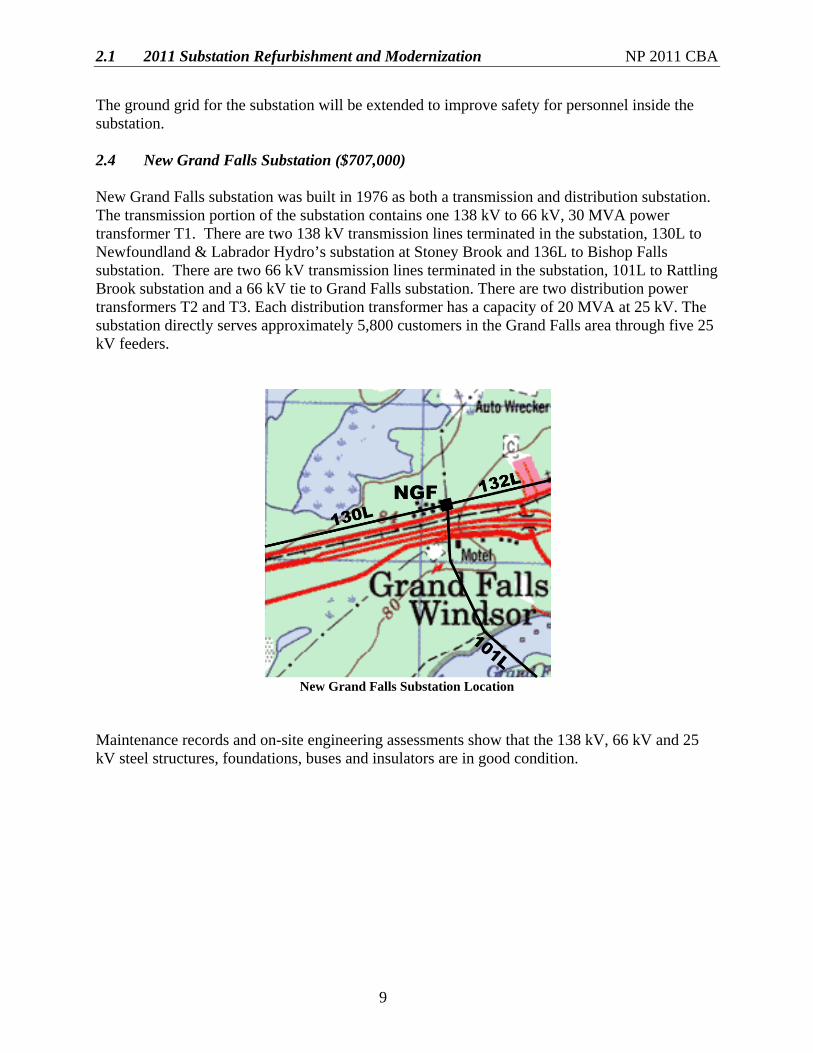
The ground grid for the substation will be extended to improve safety for personnel inside the substation. 2.4 New Grand Falls Substation ($707,000) New Grand Falls substation was built in 1976 as both a transmission and distribution substation. The transmission portion of the substation contains one 138 kV to 66 kV, 30 MVA power transformer T1. There are two 138 kV transmission lines terminated in the substation, 130L to Newfoundland & Labrador Hydro’s substation at Stoney Brook and 136L to Bishop Falls substation. There are two 66 kV transmission lines terminated in the substation, 101L to Rattling Brook substation and a 66 kV tie to Grand Falls substation. There are two distribution power transformers T2 and T3. Each distribution transformer has a capacity of 20 MVA at 25 kV. The substation directly serves approximately 5,800 customers in the Grand Falls area through five 25 kV feeders.
New Grand Falls Substation Location
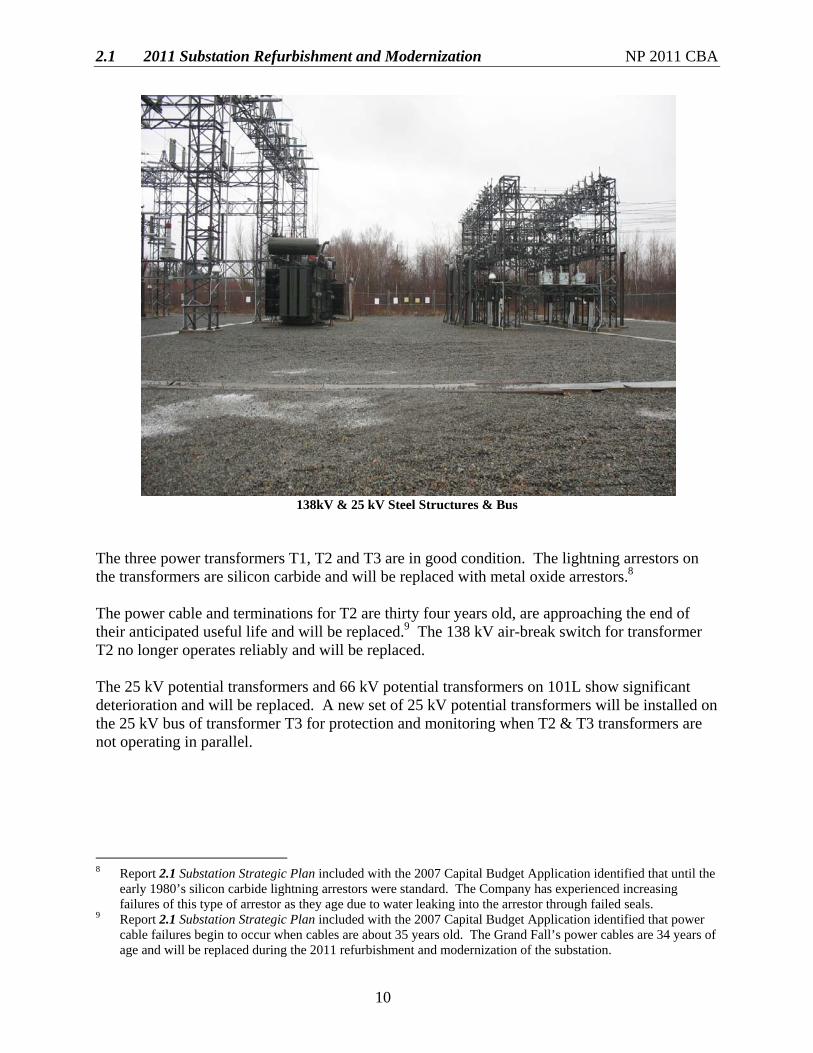
Maintenance records and on-site engineering assessments show that the 138 kV, 66 kV and 25 kV steel structures, foundations, buses and insulators are in good condition.
2.1 2011 Substation Refurbishment and Modernization NP 2011 CBA
10
138kV & 25 kV Steel Structures & Bus
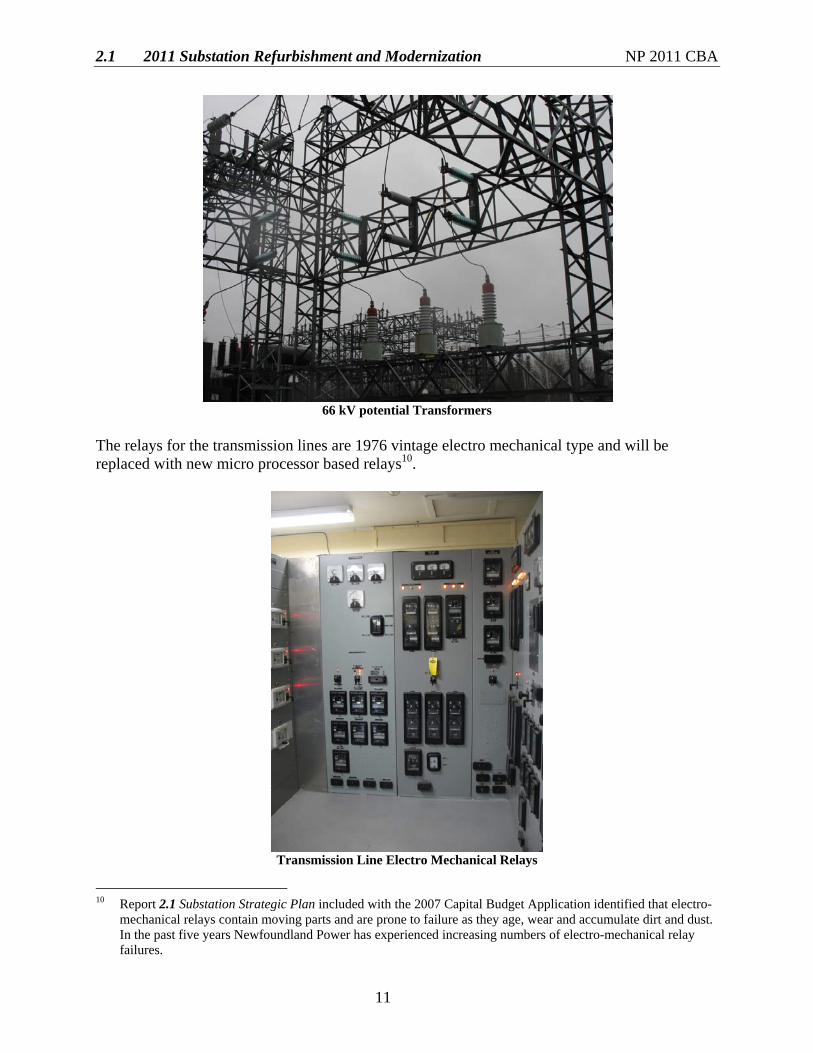
The three power transformers T1, T2 and T3 are in good condition. The lightning arrestors on the transformers are silicon carbide and will be replaced with metal oxide arrestors.8 The power cable and terminations for T2 are thirty four years old, are approaching the end of their anticipated useful life and will be replaced.9 The 138 kV air-break switch for transformer T2 no longer operates reliably and will be replaced. The 25 kV potential transformers and 66 kV potential transformers on 101L show significant deterioration and will be replaced. A new set of 25 kV potential transformers will be installed on the 25 kV bus of transformer T3 for protection and monitoring when T2 & T3 transformers are not operating in parallel.
8 Report 2.1 Substation Strategic Plan included with the 2007 Capital Budget Application identified that until the
early 1980’s silicon carbide lightning arrestors were standard. The Company has experienced increasing failures of this type of arrestor as they age due to water leaking into the arrestor through failed seals.
9 Report 2.1 Substation Strategic Plan included with the 2007 Capital Budget Application identified that power cable failures begin to occur when cables are about 35 years old. The Grand Fall’s power cables are 34 years of age and will be replaced during the 2011 refurbishment and modernization of the substation.
2.1 2011 Substation Refurbishment and Modernization NP 2011 CBA
11
66 kV potential Transformers
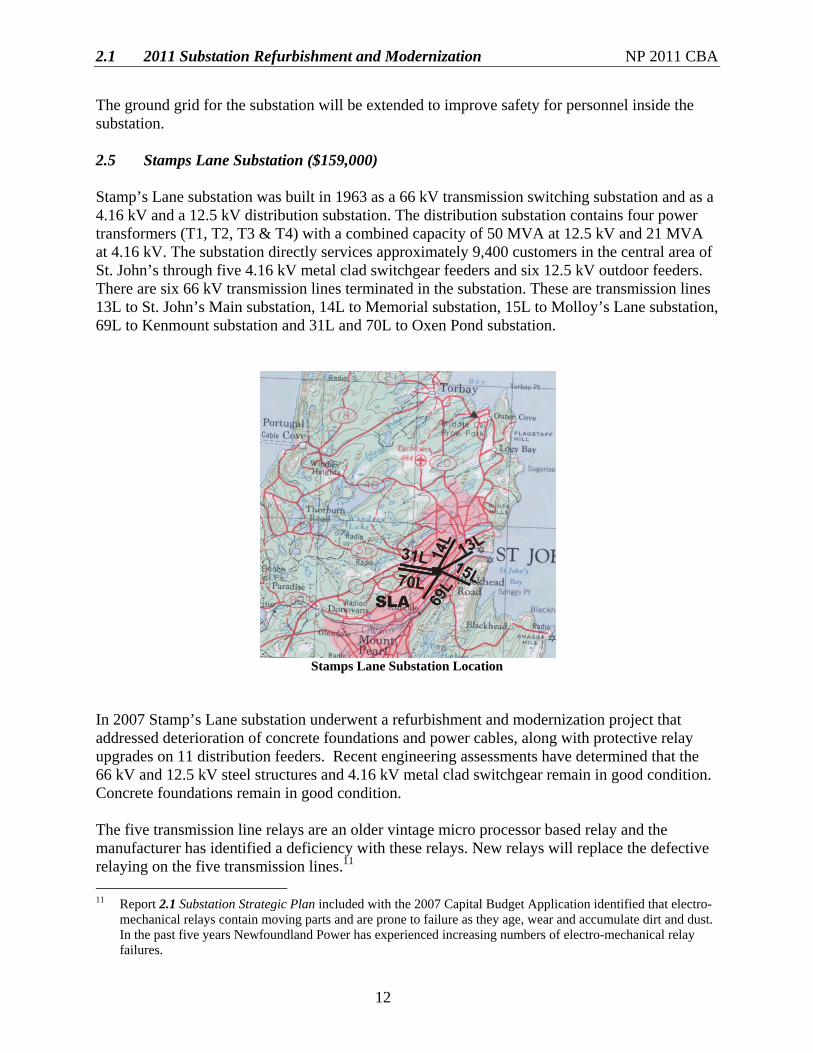
The relays for the transmission lines are 1976 vintage electro mechanical type and will be replaced with new micro processor based relays10.
Transmission Line Electro Mechanical Relays
10 Report 2.1 Substation Strategic Plan included with the 2007 Capital Budget Application identified that electro-
mechanical relays contain moving parts and are prone to failure as they age, wear and accumulate dirt and dust. In the past five years Newfoundland Power has experienced increasing numbers of electro-mechanical relay failures.
2.1 2011 Substation Refurbishment and Modernization NP 2011 CBA
12
The ground grid for the substation will be extended to improve safety for personnel inside the substation. 2.5 Stamps Lane Substation ($159,000) Stamp’s Lane substation was built in 1963 as a 66 kV transmission switching substation and as a 4.16 kV and a 12.5 kV distribution substation. The distribution substation contains four power transformers (T1, T2, T3 & T4) with a combined capacity of 50 MVA at 12.5 kV and 21 MVA at 4.16 kV. The substation directly services approximately 9,400 customers in the central area of St. John’s through five 4.16 kV metal clad switchgear feeders and six 12.5 kV outdoor feeders. There are six 66 kV transmission lines terminated in the substation. These are transmission lines 13L to St. John’s Main substation, 14L to Memorial substation, 15L to Molloy’s Lane substation, 69L to Kenmount substation and 31L and 70L to Oxen Pond substation.
Stamps Lane Substation Location
In 2007 Stamp’s Lane substation underwent a refurbishment and modernization project that addressed deterioration of concrete foundations and power cables, along with protective relay upgrades on 11 distribution feeders. Recent engineering assessments have determined that the 66 kV and 12.5 kV steel structures and 4.16 kV metal clad switchgear remain in good condition. Concrete foundations remain in good condition. The five transmission line relays are an older vintage micro processor based relay and the manufacturer has identified a deficiency with these relays. New relays will replace the defective relaying on the five transmission lines.11 11 Report 2.1 Substation Strategic Plan included with the 2007 Capital Budget Application identified that electro-
mechanical relays contain moving parts and are prone to failure as they age, wear and accumulate dirt and dust. In the past five years Newfoundland Power has experienced increasing numbers of electro-mechanical relay failures.
2.1 2011 Substation Refurbishment and Modernization NP 2011 CBA
13
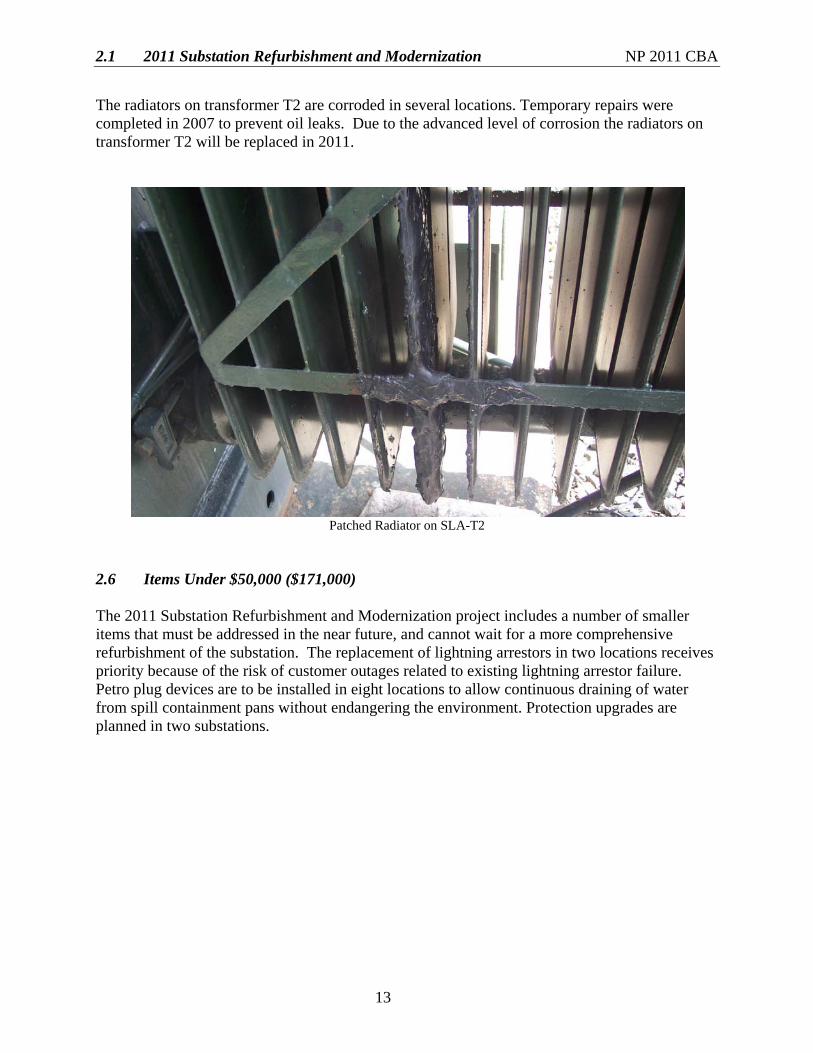
The radiators on transformer T2 are corroded in several locations. Temporary repairs were completed in 2007 to prevent oil leaks. Due to the advanced level of corrosion the radiators on transformer T2 will be replaced in 2011.
Patched Radiator on SLA-T2
2.6 Items Under $50,000 ($171,000) The 2011 Substation Refurbishment and Modernization project includes a number of smaller items that must be addressed in the near future, and cannot wait for a more comprehensive refurbishment of the substation. The replacement of lightning arrestors in two locations receives priority because of the risk of customer outages related to existing lightning arrestor failure. Petro plug devices are to be installed in eight locations to allow continuous draining of water from spill containment pans without endangering the environment. Protection upgrades are planned in two substations.

2.1 2011 Substation Refurbishment and Modernization NP 2011 CBA
14
2.7 Substation Monitoring and Operations ($150,000) Over the past decade, there has been substantial increased use of computer-based equipment in electrical system control and operations. Periodic upgrades of this equipment are necessary to ensure continued effective electrical system control and operations. In 2011, upgrades to the communications hubs that connect multiple devices in substations to the SCADA system are planned. Effective management of increased volumes of electrical system data requires the upgrading of the hubs. This requires both hardware and software upgrades. In 2011, the required work will incorporate manufacturers’ upgrades to communications and other computer-based equipment located in Company substations. These upgrades typically increase functionality of the equipment and software and remedy known deficiencies.
2.1 2011 Substation Refurbishment and Modernization NP 2011 CBA
Appendix A
Substation Refurbishment and Modernization Plan Five-Year Forecast 2011 to 2015
2.1 2011 Substation Refurbishment and Modernization NP 2011 CBA
A-1
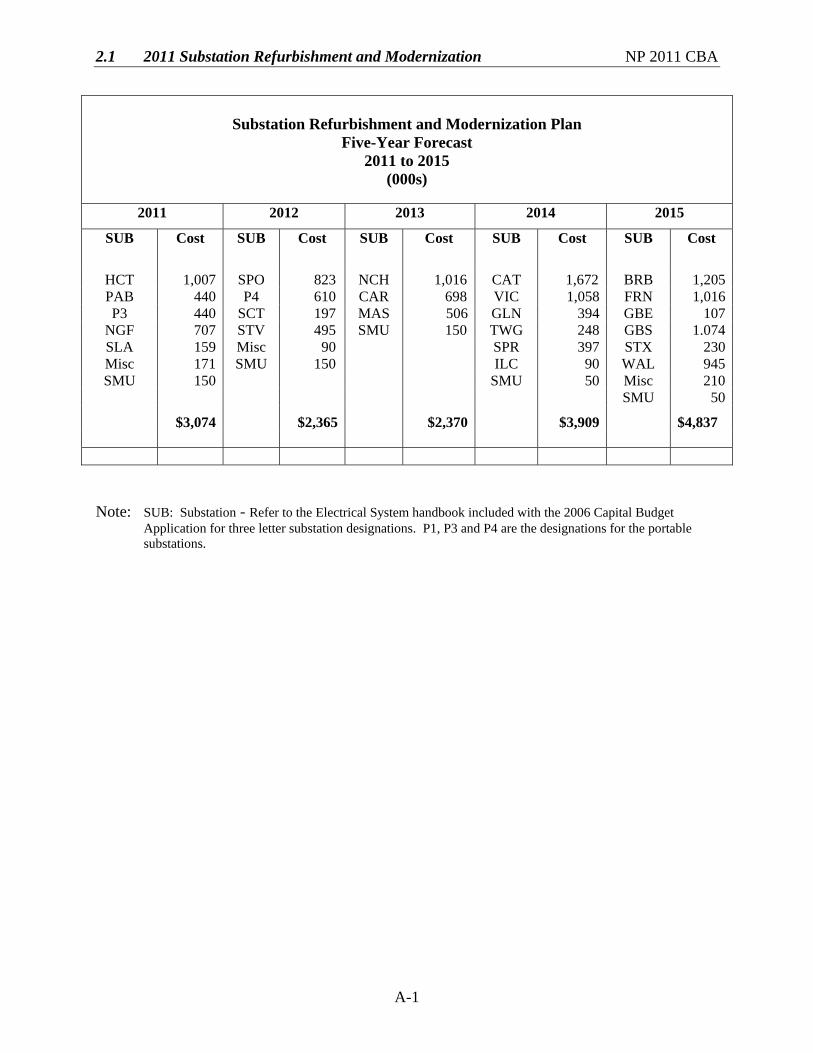
Substation Refurbishment and Modernization Plan
Five-Year Forecast 2011 to 2015
(000s)
2011 2012 2013 2014 2015
SUB Cost SUB Cost SUB Cost SUB Cost SUB Cost
HCT 1,007 SPO 823 NCH 1,016 CAT 1,672 BRB 1,205PAB 440 P4 610 CAR 698 VIC 1,058 FRN 1,016P3 440 SCT 197 MAS 506 GLN 394 GBE 107
NGF 707 STV 495 SMU 150 TWG 248 GBS 1.074SLA 159 Misc 90 SPR 397 STX 230Misc 171 SMU 150 ILC 90 WAL 945SMU 150 SMU 50 Misc 210
SMU 50 $3,074 $2,365 $2,370 $3,909 $4,837
Note: SUB: Substation - Refer to the Electrical System handbook included with the 2006 Capital Budget
Application for three letter substation designations. P1, P3 and P4 are the designations for the portable substations.
2.2. 2011 Additiorts Due to Load Growtlz NP 201 1 CBA
2011 Additions Due to Load Growth
June 2010
Prepared by:
Byron Chubbs, P.Eng. Bob Cahill, P. Tech
-- POWER A mms CoM-y
2.2 2011 Additions Due to Load Growth NP 2011 CBA
i
Table of Contents
Page 1.0 Introduction ....................................................................................................................... 1 2.0 Conception Bay South Area.............................................................................................. 1 3.0 Northeast St. John’s Area ................................................................................................. 2 4.0 Project Cost ....................................................................................................................... 2 5.0 Concluding ........................................................................................................................ 2 Attachment A: Conception Bay South Study Attachment B: Northeast St. John’s Study
2.2. 2011 Additions Due to Load Growth NP 2011 CBA
1
1.0 Introduction As load increases on an electrical system, individual components can become overloaded. The focus of Newfoundland Power’s system planning is to avoid or minimize component overloading through cost effective upgrades to the system. In the case of substation power transformers, an engineering study is completed to identify and evaluate technical alternatives in advance of the overload. These technical alternatives are fully examined, cost estimates are prepared and an economic analysis is performed to identify the least cost alternative. In urban settings load can be transferred between adjacent substations. For this reason, engineering studies of alternatives to address load growth commonly identify an area with multiple substations as the scope of the system planning study. In this case, two studies were undertaken to address the impact on the Company’s substations of load growth on the Northeast Avalon Peninsula. The scope of the studies included six substations serving customers in Conception Bay South and in the areas northeast of the city of St. John’s. A review of the peak loads experienced in the most recent winter season was used to identify actual and forecast overload conditions on power transformers in these substations. This report identifies two items to be included in the Additions Due to Load Growth Project in the 2011 Capital Budget. The first item is the replacement of a 15 MVA power transformer with a new 25 MVA transformer at Kelligrews substation, addressing transformer capacity in Conception Bay South. The second item is to install a new 25 MVA transformer for Pulpit Rock substation, addressing transformer capacity in the areas north of the city of St. John’s. These two items jointly provide the least cost expansion plan to address load growth on the Northeast Avalon Peninsula. 2.0 Conception Bay South Area An engineering study has been completed on the distribution system upgrades to meet the electrical demands in the Conception Bay South area.1 This area includes customers serviced from Kelligrews (“KEL”), Chamberlains (“CHA”) and Seal Cove (“SCV”) substations. Hardwoods (“HWD”) 25kV distribution system, which supplies the Town of Paradise, is also included in this report due to its interconnection to the CHA distribution system. The study examines 3 alternatives to determine the least cost approach to dealing with the forecast overload conditions in the Conception Bay South area. Each alternative was evaluated using a 20 year load forecast. Based on net present value calculations the least cost alternative was selected. The proposed project involves installing a new 25 MVA power transformer at KEL substation to replace the existing 15 MVA unit.
1 The engineering study titled “Additions Due to Load Growth, Conception Bay South Study” is included as
Attachment A.
2.2. 2011 Additions Due to Load Growth NP 2011 CBA
2
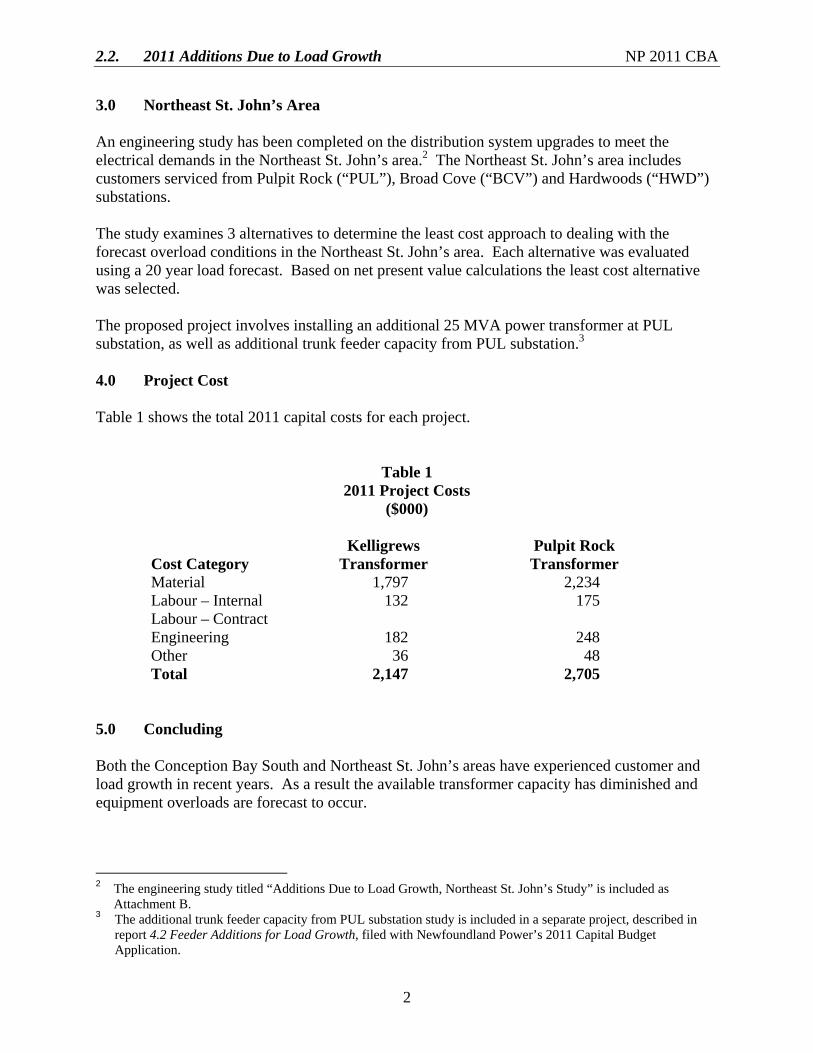
3.0 Northeast St. John’s Area An engineering study has been completed on the distribution system upgrades to meet the electrical demands in the Northeast St. John’s area.2 The Northeast St. John’s area includes customers serviced from Pulpit Rock (“PUL”), Broad Cove (“BCV”) and Hardwoods (“HWD”) substations. The study examines 3 alternatives to determine the least cost approach to dealing with the forecast overload conditions in the Northeast St. John’s area. Each alternative was evaluated using a 20 year load forecast. Based on net present value calculations the least cost alternative was selected. The proposed project involves installing an additional 25 MVA power transformer at PUL substation, as well as additional trunk feeder capacity from PUL substation.3 4.0 Project Cost Table 1 shows the total 2011 capital costs for each project.
Table 1 2011 Project Costs
($000)
Cost Category Kelligrews
Transformer Pulpit Rock Transformer
Material 1,797 2,234 Labour – Internal 132 175 Labour – Contract Engineering 182 248 Other 36 48 Total 2,147 2,705
5.0 Concluding Both the Conception Bay South and Northeast St. John’s areas have experienced customer and load growth in recent years. As a result the available transformer capacity has diminished and equipment overloads are forecast to occur.
2 The engineering study titled “Additions Due to Load Growth, Northeast St. John’s Study” is included as
Attachment B. 3 The additional trunk feeder capacity from PUL substation study is included in a separate project, described in
report 4.2 Feeder Additions for Load Growth, filed with Newfoundland Power’s 2011 Capital Budget Application.

2.2. 2011 Additions Due to Load Growth NP 2011 CBA
3
It is recommended that the projects identified as part of the least cost alternatives in the attached studies be undertaken in 2011 to address capacity issues in the Conception Bay South and Northeast St. John’s areas. The least cost alternatives proposed include installing a new 25 MVA power transformer at KEL substation to replace the existing 15 MVA unit and installing an additional 25MVA power transformer at PUL substation. The estimated cost to complete this work in 2011 is $4,852,000.

2.2 2011 Additions Due to Load Growth – Conception Bay South Study NP 2011 CBA
Attachment A
Conception Bay South Study

2.2 2011 Additions Due to Load Growth – Conception Bay South Study NP 2011 CBA
i
Table of Contents
Page 1.0 Introduction ....................................................................................................................... 1 2.0 Description of Existing System ........................................................................................ 1 2.1 KEL Substation ..................................................................................................... 1 2.2 CHA Substation ................................................................................................... 1 2.3 HWD Substation ................................................................................................... 2 2.4 SCV Substation ..................................................................................................... 2 3.0 Load Forecast .................................................................................................................... 2 4.0 Development of Alternatives ............................................................................................ 3 4.1 Alternative 1.......................................................................................................... 3 4.2 Alternative 2.......................................................................................................... 3 4.3 Alternative 3.......................................................................................................... 4 5.0 Evaluation of Alternatives ................................................................................................ 4 5.1 Cost of Alternatives .............................................................................................. 4 5.2 Economic Analysis ............................................................................................... 6 5.3 Sensitivity Analysis .............................................................................................. 6 6.0 Project Cost ....................................................................................................................... 7 7.0 Conclusion and Recommendation ................................................................................... 8 Appendix A: 2010 Substation Load Forecast – Base Case Appendix B: Alternative #1 20 Year Substation Load Forecast Appendix C: Alternative #2 20 Year Substation Load Forecast Appendix D: Alternative #3 20 Year Substation Load Forecast
2.2 2011 Additions Due to Load Growth – Conception Bay South Study NP 2011 CBA
1
1.0 Introduction The purpose of this study is to determine the distribution system alternative that best meets the electrical demands of the Town of Conception Bay South. This area includes customers serviced from Kelligrews (“KEL”), Chamberlains (“CHA”) and Seal Cove (“SCV”) substations. Hardwoods (“HWD”) 25kV distribution system, which supplies the Town of Paradise, is also included in this report due to its interconnection to the CHA distribution system. In 2009, the distribution power transformers supplying the area experienced a total peak load of 87.5 MVA compared to a total capacity of 101 MVA.1 A transformer at KEL (“KEL-T1”) is currently the closest to being overloaded, experiencing a peak of 14.5 MVA compared to a capacity of 15 MVA. The current forecast indicates that KEL-T1 will overload by 2011. Load growth on this transformer is primarily the result of an increase in residential development in the Town of Conception Bay South. This report identifies the capital project(s) required to avoid the 2011 forecast overload at KEL by determining the least cost expansion plan required to meet a 20 year load forecast. 2.0 Description of Existing System 2.1 KEL Substation KEL substation is located on Middle Bight Road in the community of Conception Bay South. The substation has one transformer, KEL-T1. This is a 15 MVA transformer used to convert the 66 kV transmission voltage to the 12.5 kV distribution voltage and supply customers through KEL substation feeders. There are two 12.5 kV feeders supplied from KEL substation. KEL-01 feeder extends from the substation north along Middle Bight Road and then west along Route 60 supplying approximately 1,872 customers in the Kelligrews area of Conception Bay South. KEL-02 extends from the substation north along Middle Bight Road and then east along Route 60 supplying approximately 1,151 customers in the Foxtrap area of Conception Bay South. 2.2 CHA Substation CHA substation is located on Fowlers Road in the community of Conception Bay South. There are two transformers located in the substation, CHA-T1 and CHA-T2. Both transformers are rated 25MVA and are used to convert 66 kV transmission voltage to 25 kV distribution voltage and supply customers through CHA substation feeders. There are three 25 kV feeders originating from CHA substation. CHA-01 feeder supplies approximately 2,266 customers in the Chamberlains and Manuals areas of Conception Bay South. CHA-02 feeder supplies approximately 1,745 customers in the Topsail area of Conception Bay South as well as Paradise. CHA-03 feeder extends south along Fowlers Road 1 A distribution power transformer converts electricity from transmission voltages (typically 66 kV) to distribution
primary voltages (typically between 4kV and 25kV).
2.2 2011 Additions Due to Load Growth – Conception Bay South Study NP 2011 CBA
2
and then along the Conception Bay South Bypass Road supplying approximately 2,113 customers in the Chamberlains, Manuals and Foxtrap areas of Conception Bay South. 2.3 HWD Substation HWD substation is located in the town of Paradise. There are three transformers located in the substation. HWD-T1 and HWD-T2 are both 20 MVA rated transformers used to convert 66kV transmission voltage to 12.5kV distribution voltage and supply customers on five distribution feeders through HWD substation.2 HWD-T3 is a 25 MVA transformer used to convert 66 kV transmission voltage to 25 kV distribution voltage and supply customers through two 25 kV feeders. HWD-07 extends along Karwood Drive onto Topsail Road and along Paradise Road to St. Thomas Line supplying approximately 2,508 customers. HWD-08 feeder extends along Karwood Drive onto Topsail Road and supplies approximately 1,685 customers in the Paradise area. 2.4 SCV Substation SCV substation is located in Seal Cove in the community of Conception Bay South. There is one power transformer located in the substation, SCV-T2. This is a 11.2 MVA rated transformer used to convert 66kV transmission voltage to 12.5kV distribution voltage and supply customers through SCV substation feeders. There are two 12.5 kV feeders originating from SCV substation. SCV-01 extends from the substation east along Route 60 supplying approximately 1,424 customers in the Seal Cove and Upper Gullies area of Conception Bay South. SCV-02 feeder extends from the substation west along Route 60 supplying 470 customers in the Seal Cove area of Conception Bay South and the community of Holyrood. 3.0 Load Forecast The following are the peak substation transformer loads recorded this past winter for each of these substations.
• KEL-T1 is rated at 15 MVA. The load on this transformer peaked at 14.5 MVA in 2009. • CHA-T1 and CHA-T2 are both rated at 25 MVA. The load on each transformer peaked
at 19.9 MVA in 2009. • HWD-T3 is rated at 25 MVA. The load on this transformer peaked at 23.9 MVA in
2009. • SCV-T2 is rated at 11.2 MVA. The load on this transformer peaked at 9.3 MVA in 2009.
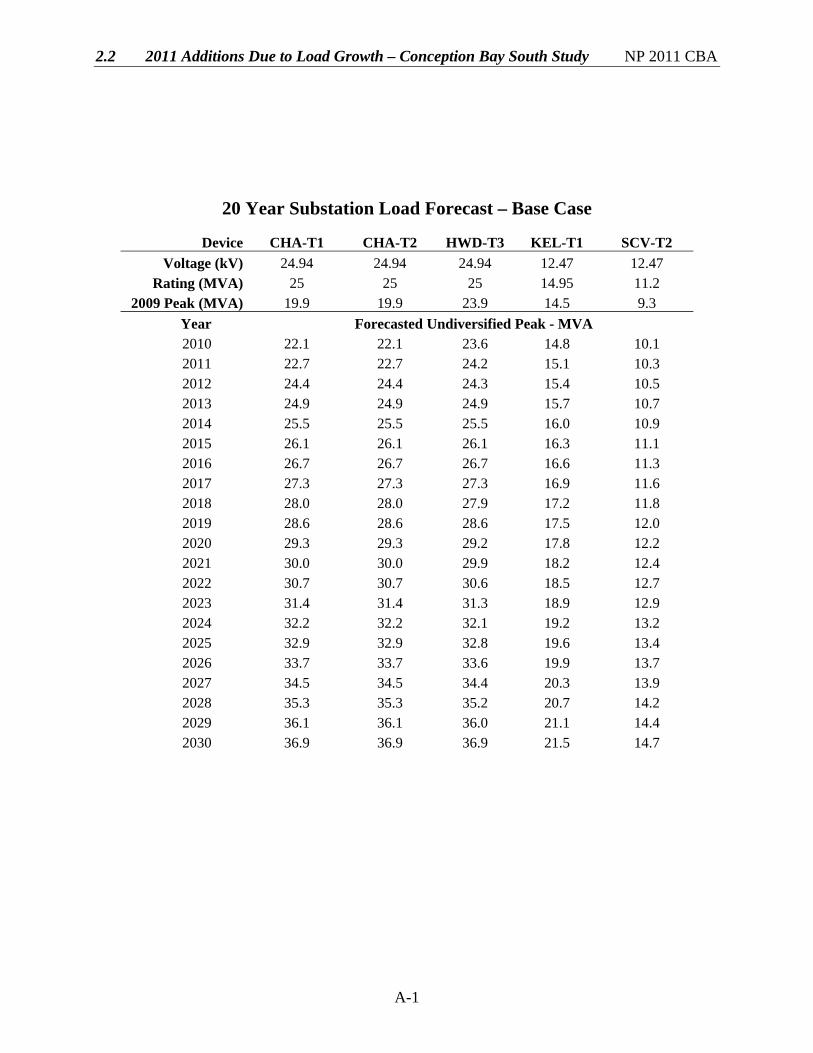
This study uses a 20 year load forecast for these power transformers. The base case 20 year substation forecast for KEL-T1, CHA-T1, CHA-T2, HWD-T3 and SCV-T2 is located in 2 The five 12.5 kV feeders originating from HWD substation do not interconnect with CHA feeders and therefore
HWD-T1 and HWD-T2 are not included in this report.
2.2 2011 Additions Due to Load Growth – Conception Bay South Study NP 2011 CBA
3
Appendix A. A high and low load growth forecast has also been created for each alternative for use in a sensitivity analysis. With the exception of the first year forecast, the sensitivities are based on increasing the load growth by a factor of 50% for the high forecast and decreasing by a factor of 50% for the low forecast. 4.0 Development of Alternatives Three alternatives have been developed to eliminate the forecast overload conditions using a set of defined technical criteria.3 These alternatives will provide sufficient capacity to meet forecast loads over the next 20 years. Each alternative contains estimates for all costs involved, including transformers, new feeders and load transfers. The results of a net present value calculation are provided for each alternative. 4.1 Alternative 1
• New 25MVA, 66/12.5kV transformer at KEL substation to replace the existing 15 MVA rated transformer (KEL-T1) in 2011.
• New 25 MVA, 66/25kV transformer at HWD substation to increase the total 25kV transformer capacity to 50 MVA in 2014.4
• New distribution feeder from KEL to complete load transfer from SCV to KEL in 2018. • New 25 MVA, 66/12.5kV transformer at CHA substation to increase the total transformer
capacity to 75 MVA in 2026.
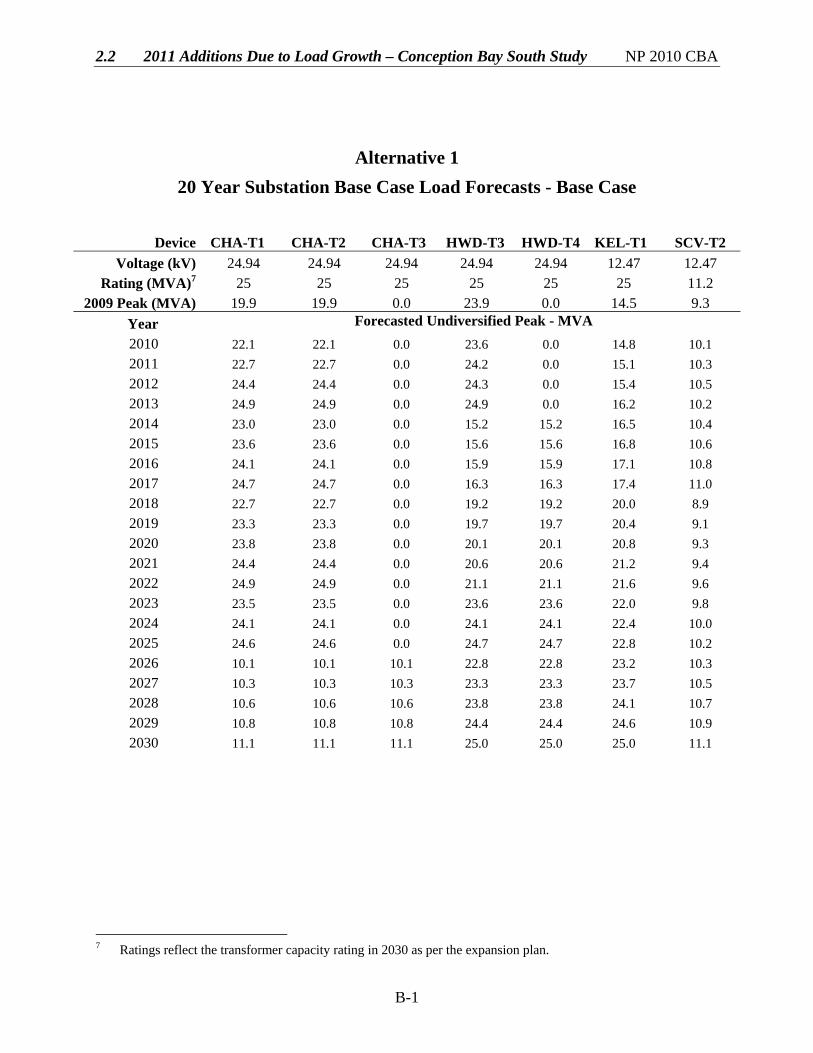
The resulting peak load forecasts for each transformer under Alternative 1 are shown in Appendix B. 4.2 Alternative 2
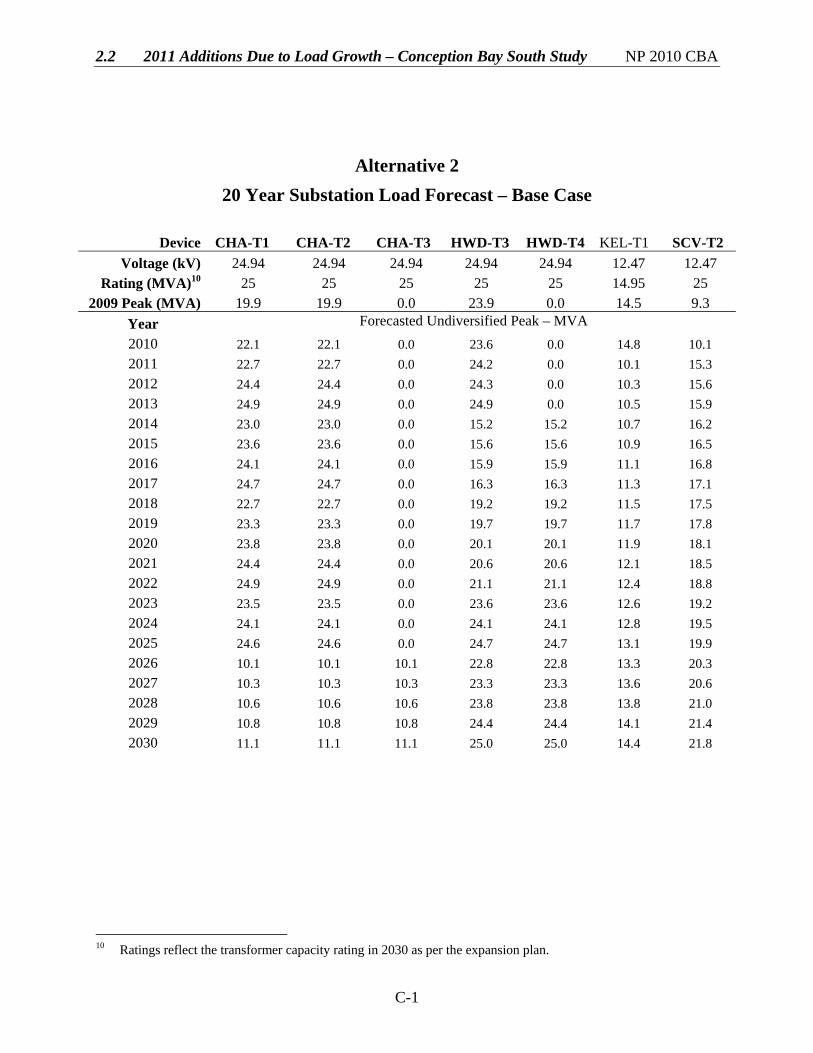
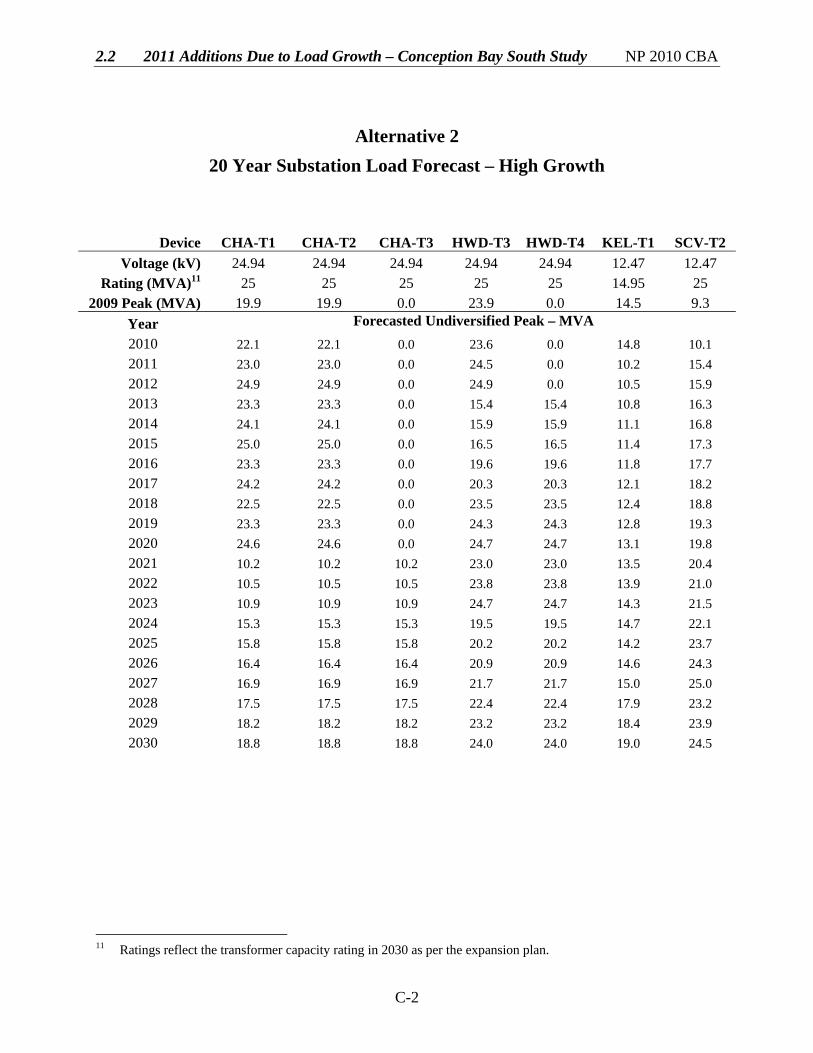
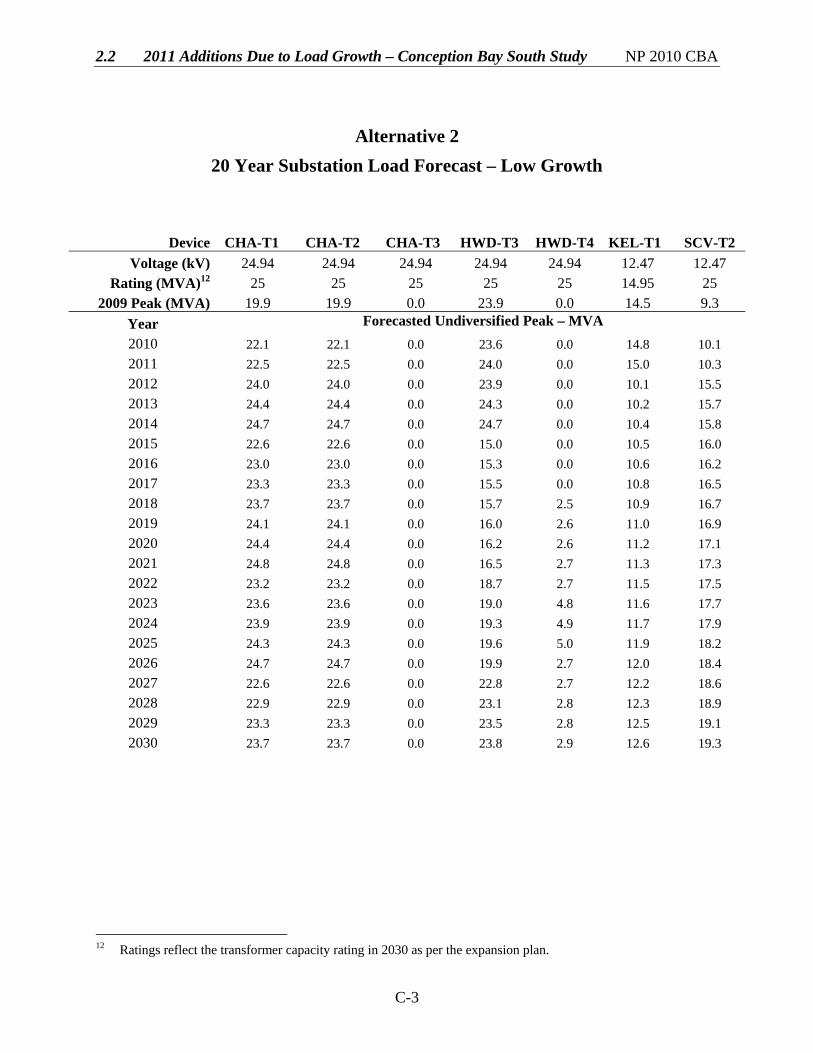
• New 25MVA power transformer at SCV substation to replace the existing 11.2 MVA rated transformer (SCV-T2) in 2011.
• New distribution feeder from SCV to complete load transfer from KEL to SCV in 2011. • New 25 MVA, 66/25kV transformer at HWD substation to increase the total 25kV
transformer capacity to 50 MVA in 2014. • New 25 MVA, 66/12.5kV transformer at CHA substation to increase the total transformer
capacity to 75 MVA in 2026.
3 The following technical criteria were applied:
• The steady state power transformer loading should not exceed the nameplate rating. • The minimum steady state feeder voltage should not fall below 116 Volts (on a 120 Volt base). • The feeder normal peak loading should be sufficient to permit cold load pickup. • The conductor loading should not exceed the ampacity rating established in the distribution planning
guidelines. 4 The new transformer to be installed in 2014 at Hardwoods substation has been identified in both the Conception
Bay South and the Northeast St. John’s engineering studies.

2.2 2011 Additions Due to Load Growth – Conception Bay South Study NP 2011 CBA
4
The resulting peak load forecasts for each transformer under Alternative 2 are shown in Appendix C.
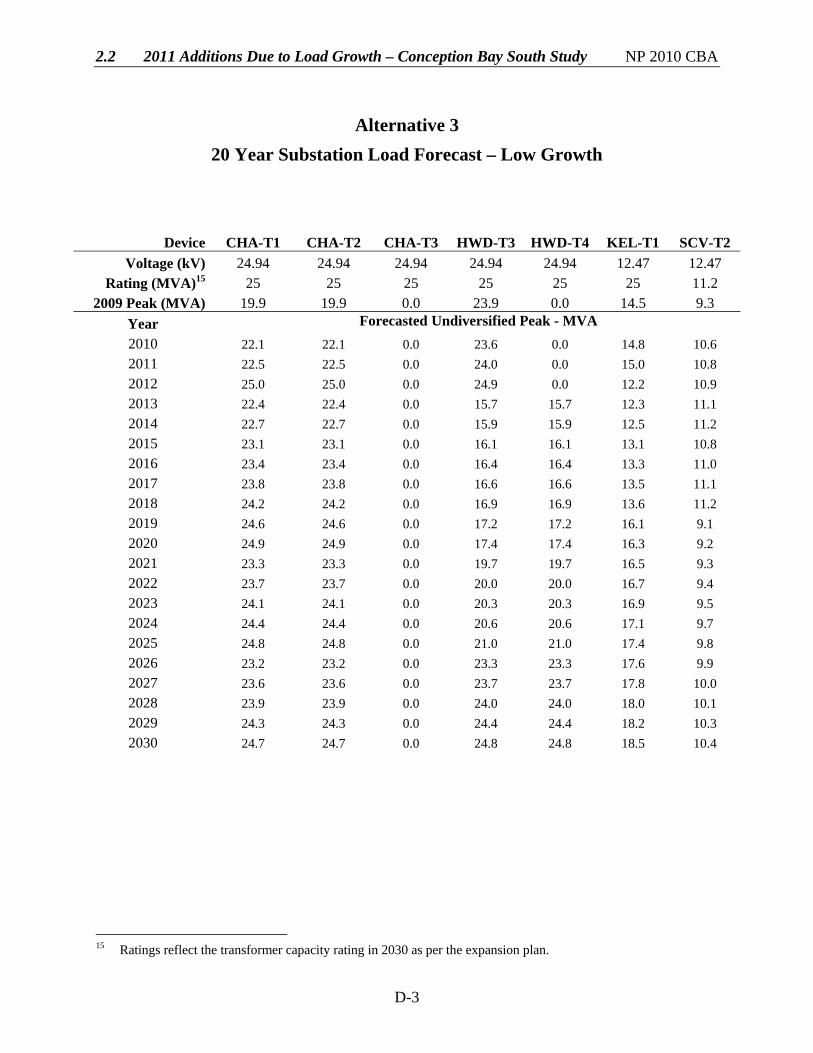
4.3 Alternative 3
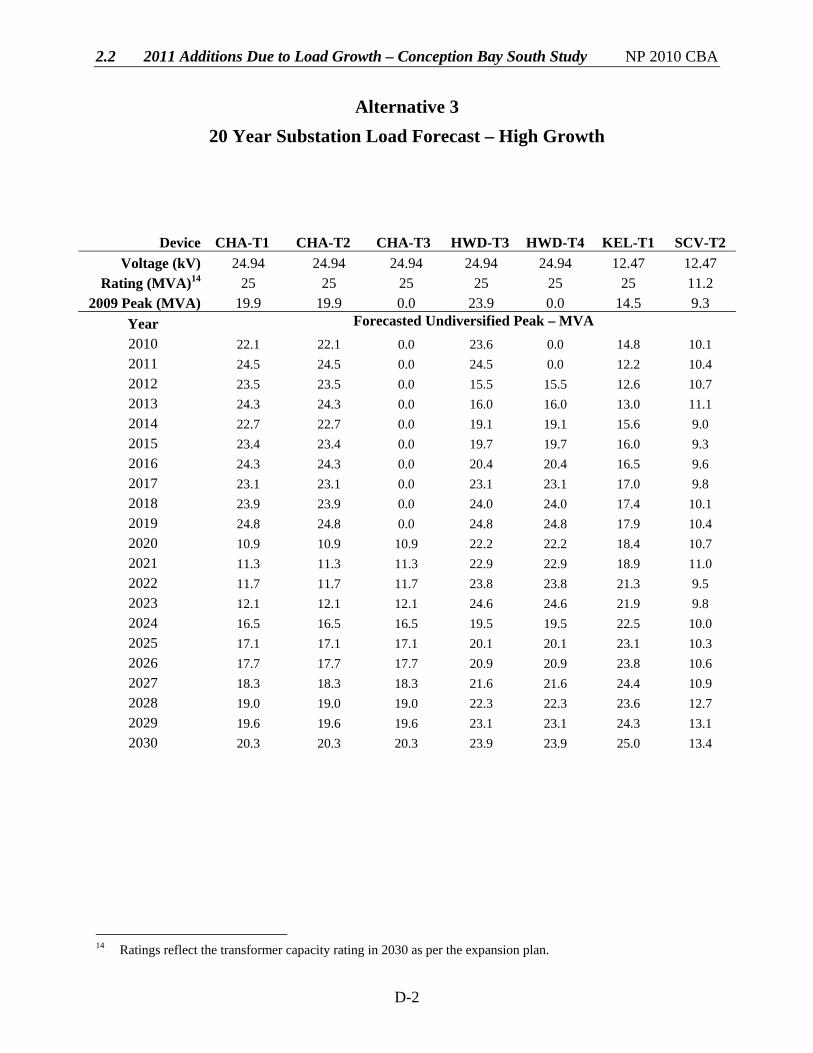
• Complete a voltage conversion of a portion of KEL-02 feeder in order to transfer 3MVA of load from KEL to the CHA 25kV system in 2011.
• New 25 MVA, 66/25kV transformer at HWD substation to increase the total 25kV transformer capacity at HWD to 50 MVA in 2012.
• New 25 MVA, 66/12.5kV transformer at KEL substation to replace the existing 15 MVA rated transformer (KEL-T1) in 2016.
• New distribution feeder from KEL to complete load transfer from SCV to KEL in 2016. • New 25 MVA, 66/12.5kV transformer at CHA to increase the total transformer capacity
to 75 MVA in 2024.
The resulting peak load forecasts for each transformer under Alternative 1 are shown in Appendix D.
5.0 Evaluation of Alternatives 5.1 Cost of Alternatives Table 1 shows the capital costs estimated for Alternative 1.
Table 1 Alternative 1 Capital Costs
Year Item Cost 2011 Purchase and install new 25 MVA transformer at KEL substation to
replace existing transformer.
$2,147,000
2014 Purchase and install new 25 MVA transformer at HWD substation.
$2,500,000
2018
Construct new KEL distribution feeder.
$234,000
2018
Complete substation modifications at KEL for new feeder.
$205,000
2026 Purchase and install new 25 MVA transformer at CHA substation.
$2,500,000
Total $7,586,000
2.2 2011 Additions Due to Load Growth – Conception Bay South Study NP 2011 CBA
5
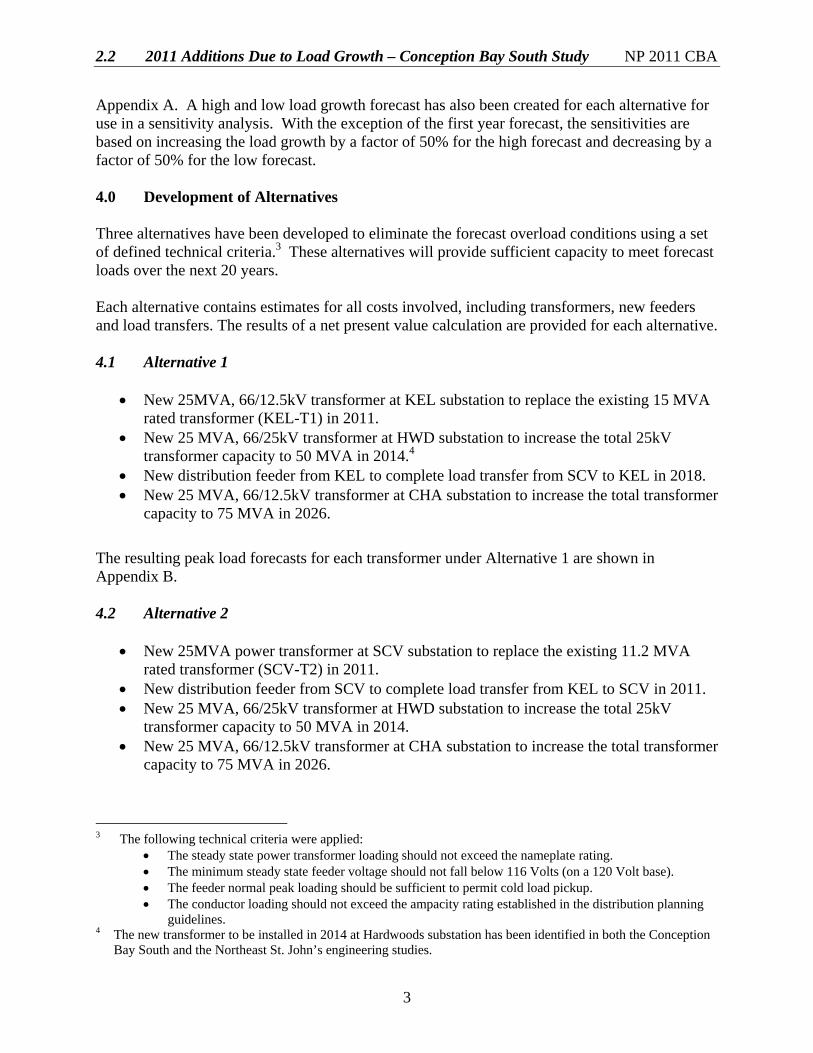
Table 2 shows the capital costs estimated for Alternative 2.
Table 2 Alternative 2 Capital Costs
Year Item Cost 2011 Purchase and install new 25 MVA transformer at SCV substation to
replace existing transformer and complete substation modifications for new feeder.
$2,705,000
2011 Construct new SCV distribution feeder.
$390,000
2014 Purchase and install new 25 MVA transformer at HWD substation.
$2,500,000
2026 Purchase and install new 25 MVA transformer at CHA substation.
$2,500,000
Total $8,095,000 Table 3 shows the capital costs estimated for Alternative 3.
Table 3 Alternative 3 Capital Costs
Year Item Cost 2011 Convert 3MVA of load from KEL-12.5kV to CHA-25kV.
$375,000
2012
Purchase and install new 25 MVA transformer at HWD substation.
$2,500,000
2016
Purchase and install new 25 MVA transformer at KEL substation to replace existing transformer and complete substation modifications for new feeder.
$2,352,000
2016
Construct new KEL distribution feeder. $234,000
2024 Purchase and install new 25 MVA transformer at CHA substation.
$2,500,00
Total $7,961,000
2.2 2011 Additions Due to Load Growth – Conception Bay South Study NP 2011 CBA
6
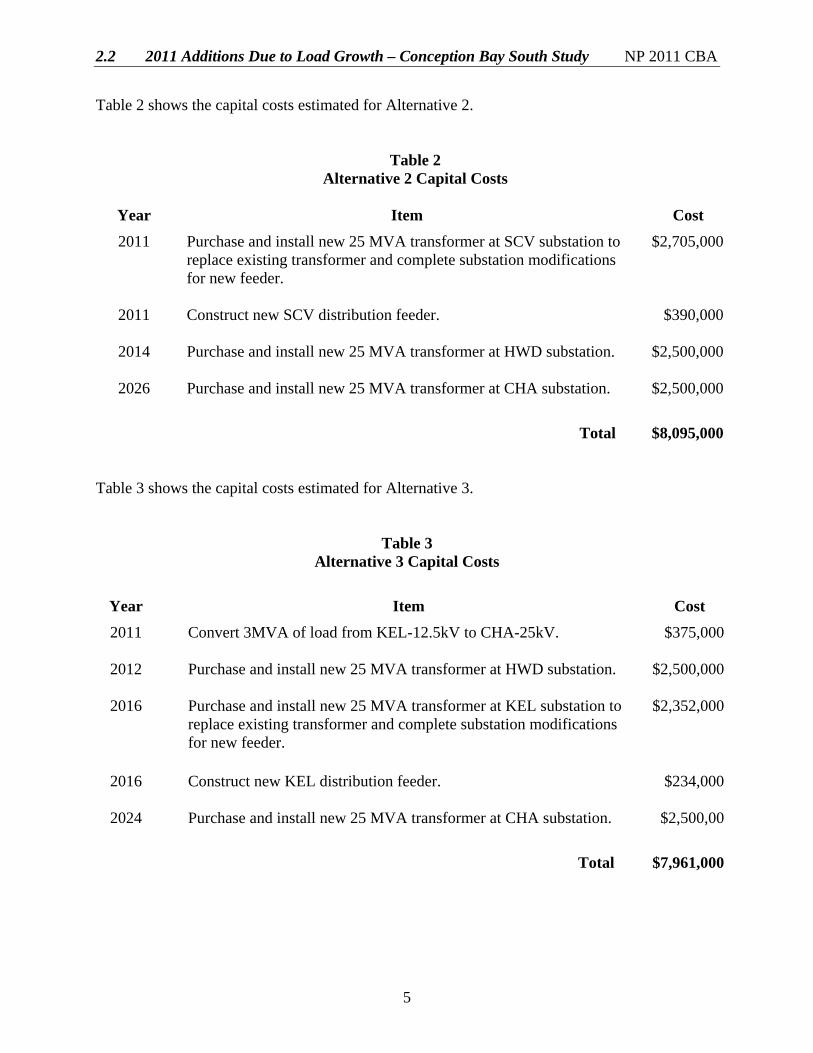
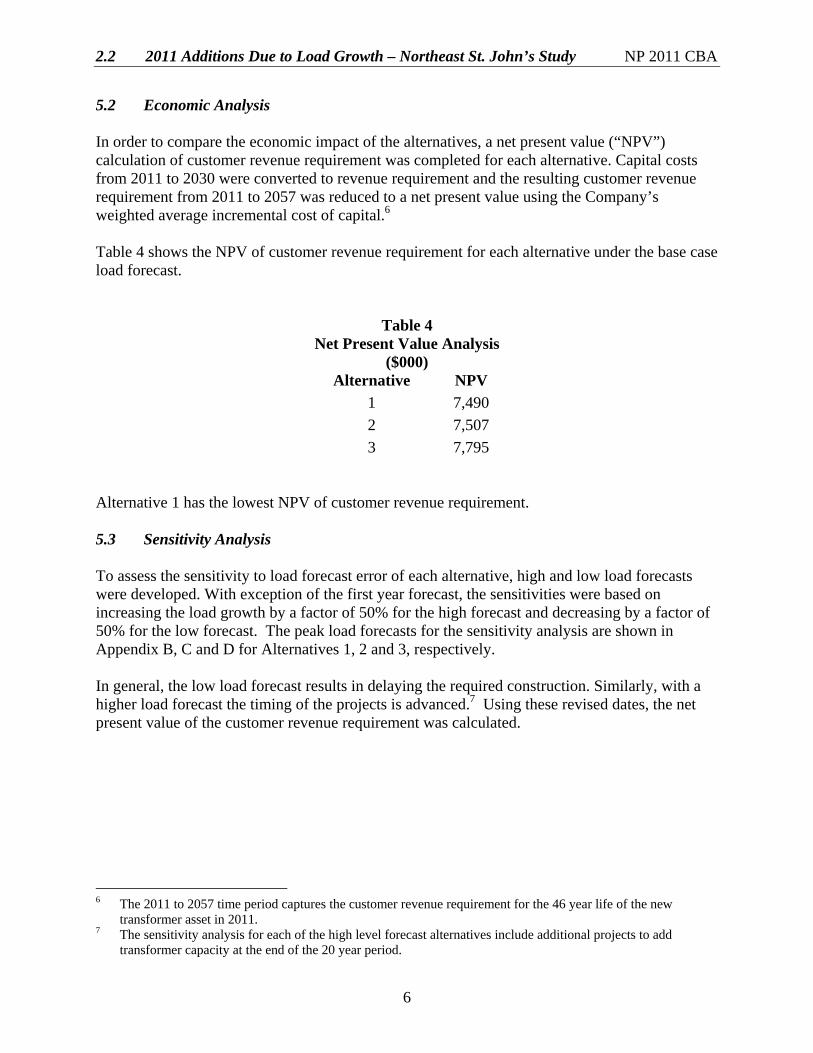
5.2 Economic Analysis In order to compare the economic impact of the alternatives, a net present value (“NPV”) calculation of customer revenue requirement was completed for each alternative. Capital costs from 2011 to 2030 were converted to revenue requirement and the resulting customer revenue requirement from 2011 to 2057 was reduced to a net present value using the Company’s weighted average incremental cost of capital.5 Table 4 shows the NPV of customer revenue requirement for each alternative under the base case load forecast.
Table 4 Net Present Value Analysis
($000) Alternative NPV
1 5,969 2 6,660 3 6,261
Alternative 1 has the lowest NPV of customer revenue requirement. 5.3 Sensitivity Analysis To assess the sensitivity to load forecast error of each alternative, high and low load forecasts were developed. The peak load forecasts for the sensitivity analysis are shown in Appendix B, C and D for Alternatives 1, 2 and 3, respectively. In general, the low load forecast results in delaying the required construction. Similarly, with a higher load forecast the timing of the projects is advanced.6 Using these revised dates, the net present value of the customer revenue requirement was calculated.
5 The 2011 to 2057 time period captures the customer revenue requirement for the 46 year life of the new
transformer asset in 2011. 6 The sensitivity analysis for each of the high level forecast alternatives include additional projects to add
transformer capacity at the end of the 20 year period.
2.2 2011 Additions Due to Load Growth – Conception Bay South Study NP 2011 CBA
7
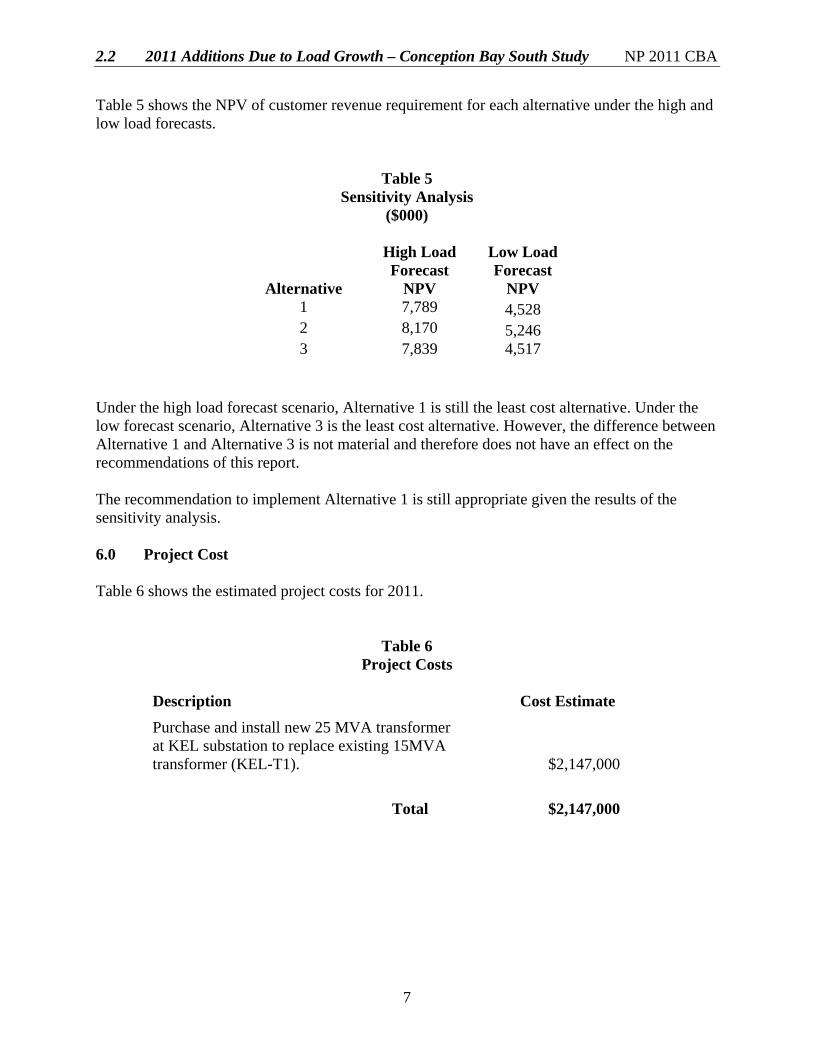
Table 5 shows the NPV of customer revenue requirement for each alternative under the high and low load forecasts.
Table 5 Sensitivity Analysis
($000)
Alternative
High Load Forecast
NPV
Low Load Forecast
NPV 1 7,789 4,528 2 8,170 5,246 3 7,839 4,517
Under the high load forecast scenario, Alternative 1 is still the least cost alternative. Under the low forecast scenario, Alternative 3 is the least cost alternative. However, the difference between Alternative 1 and Alternative 3 is not material and therefore does not have an effect on the recommendations of this report. The recommendation to implement Alternative 1 is still appropriate given the results of the sensitivity analysis. 6.0 Project Cost Table 6 shows the estimated project costs for 2011.
Table 6 Project Costs
Description Cost Estimate Purchase and install new 25 MVA transformer at KEL substation to replace existing 15MVA transformer (KEL-T1).
$2,147,000
Total $2,147,000

2.2 2011 Additions Due to Load Growth – Conception Bay South Study NP 2011 CBA
8
7.0 Conclusion and Recommendation A 20-year load forecast has projected the electrical demands for the towns of Conception Bay South and Paradise. This area includes customers serviced from KEL, CHA, SCV and HWD substations. The development and analysis of alternatives has established a preferred expansion plan to meet the forecast needs. The least cost alternative that meets all technical criteria is the expansion plan described in Alternative 1. Further, a sensitivity analysis has confirmed the recommended alternative is appropriate under varying load growth forecasts. The 2011 project that is part of the least cost expansion plan is to replace the existing 15 MVA KEL-T1 power transformer with a 25 MVA transformer. This project is estimated to cost $2,147,000.
2.2 2011 Additions Due to Load Growth – Conception Bay South Study NP 2011 CBA
Appendix A
2010 Substation Load Forecast – Base Case
2.2 2011 Additions Due to Load Growth – Conception Bay South Study NP 2011 CBA
A-1
20 Year Substation Load Forecast – Base Case
Device CHA-T1 CHA-T2 HWD-T3 KEL-T1 SCV-T2 Voltage (kV) 24.94 24.94 24.94 12.47 12.47
Rating (MVA) 25 25 25 14.95 11.2 2009 Peak (MVA) 19.9 19.9 23.9 14.5 9.3
Year Forecasted Undiversified Peak - MVA 2010 22.1 22.1 23.6 14.8 10.1 2011 22.7 22.7 24.2 15.1 10.3 2012 24.4 24.4 24.3 15.4 10.5 2013 24.9 24.9 24.9 15.7 10.7 2014 25.5 25.5 25.5 16.0 10.9 2015 26.1 26.1 26.1 16.3 11.1 2016 26.7 26.7 26.7 16.6 11.3 2017 27.3 27.3 27.3 16.9 11.6 2018 28.0 28.0 27.9 17.2 11.8 2019 28.6 28.6 28.6 17.5 12.0 2020 29.3 29.3 29.2 17.8 12.2 2021 30.0 30.0 29.9 18.2 12.4 2022 30.7 30.7 30.6 18.5 12.7 2023 31.4 31.4 31.3 18.9 12.9 2024 32.2 32.2 32.1 19.2 13.2 2025 32.9 32.9 32.8 19.6 13.4 2026 33.7 33.7 33.6 19.9 13.7 2027 34.5 34.5 34.4 20.3 13.9 2028 35.3 35.3 35.2 20.7 14.2 2029 36.1 36.1 36.0 21.1 14.4 2030 36.9 36.9 36.9 21.5 14.7

2.2 2011 Additions Due to Load Growth – Conception Bay South Study NP 2010 CBA
Appendix B
Alternative 1 20 Year Substation Load Forecasts
2.2 2011 Additions Due to Load Growth – Conception Bay South Study NP 2010 CBA
B-1
Alternative 1 20 Year Substation Base Case Load Forecasts - Base Case
7 Ratings reflect the transformer capacity rating in 2030 as per the expansion plan.
Device CHA-T1 CHA-T2 CHA-T3 HWD-T3 HWD-T4 KEL-T1 SCV-T2 Voltage (kV) 24.94 24.94 24.94 24.94 24.94 12.47 12.47
Rating (MVA)7 25 25 25 25 25 25 11.2 2009 Peak (MVA) 19.9 19.9 0.0 23.9 0.0 14.5 9.3
Year Forecasted Undiversified Peak - MVA 2010 22.1 22.1 0.0 23.6 0.0 14.8 10.1 2011 22.7 22.7 0.0 24.2 0.0 15.1 10.3 2012 24.4 24.4 0.0 24.3 0.0 15.4 10.5 2013 24.9 24.9 0.0 24.9 0.0 16.2 10.2 2014 23.0 23.0 0.0 15.2 15.2 16.5 10.4 2015 23.6 23.6 0.0 15.6 15.6 16.8 10.6 2016 24.1 24.1 0.0 15.9 15.9 17.1 10.8 2017 24.7 24.7 0.0 16.3 16.3 17.4 11.0 2018 22.7 22.7 0.0 19.2 19.2 20.0 8.9 2019 23.3 23.3 0.0 19.7 19.7 20.4 9.1 2020 23.8 23.8 0.0 20.1 20.1 20.8 9.3 2021 24.4 24.4 0.0 20.6 20.6 21.2 9.4 2022 24.9 24.9 0.0 21.1 21.1 21.6 9.6 2023 23.5 23.5 0.0 23.6 23.6 22.0 9.8 2024 24.1 24.1 0.0 24.1 24.1 22.4 10.0 2025 24.6 24.6 0.0 24.7 24.7 22.8 10.2 2026 10.1 10.1 10.1 22.8 22.8 23.2 10.3 2027 10.3 10.3 10.3 23.3 23.3 23.7 10.5 2028 10.6 10.6 10.6 23.8 23.8 24.1 10.7 2029 10.8 10.8 10.8 24.4 24.4 24.6 10.9 2030 11.1 11.1 11.1 25.0 25.0 25.0 11.1

2.2 2011 Additions Due to Load Growth – Conception Bay South Study NP 2010 CBA
B-2
Alternative 1
20 Year Substation Load Forecast – High Growth
8 Ratings reflect the transformer capacity rating in 2030 as per the expansion plan.
Device CHA-T1 CHA-T2 CHA-T3 HWD-T3 HWD-T4 KEL-T1 SCV-T2 Voltage (kV) 24.94 24.94 24.94 24.94 24.94 12.47 12.47
Rating (MVA)8 25 25 25 25 25 25 11.2 2009 Peak (MVA) 19.9 19.9 0.0 23.9 0.0 14.5 9.3
Year Forecasted Undiversified Peak - MVA 2010 22.1 22.1 0.0 23.6 0.0 14.8 10.1 2011 23.0 23.0 0.0 24.5 0.0 15.2 10.4 2012 24.9 24.9 0.0 24.9 0.0 15.7 10.7 2013 23.3 23.3 0.0 15.4 15.4 16.6 10.6 2014 24.1 24.1 0.0 15.9 15.9 17.1 10.8 2015 25.0 25.0 0.0 16.5 16.5 17.6 11.1 2016 23.3 23.3 0.0 19.6 19.6 20.4 9.2 2017 24.2 24.2 0.0 20.3 20.3 20.9 9.4 2018 22.5 22.5 0.0 23.5 23.5 21.5 9.7 2019 23.3 23.3 0.0 24.3 24.3 22.1 9.9 2020 24.6 24.6 0.0 24.6 24.6 22.7 10.2 2021 10.2 10.2 10.2 23.0 23.0 23.4 10.5 2022 10.5 10.5 10.5 23.8 23.8 24.0 10.8 2023 10.9 10.9 10.9 24.6 24.6 24.7 11.1 2024 15.3 15.3 15.3 19.5 19.5 20.9 15.9 2025 15.8 15.8 15.8 20.2 20.2 21.5 16.4 2026 16.4 16.4 16.4 20.9 20.9 22.1 16.8 2027 16.9 16.9 16.9 21.6 21.6 22.7 17.3 2028 17.5 17.5 17.5 22.4 22.4 23.3 17.8 2029 18.1 18.1 18.1 23.2 23.2 24.0 18.3 2030 18.8 18.8 18.8 24.0 24.0 24.7 18.8

2.2 2011 Additions Due to Load Growth – Conception Bay South Study NP 2010 CBA
B-3
Alternative 1
20 Year Substation Load Forecast – Low Growth
9 Ratings reflect the transformer capacity rating in 2030 as per the expansion plan.
Device CHA-T1 CHA-T2 CHA-T3 HWD-T3 HWD-T4 KEL-T1 SCV-T2 Voltage (kV) 24.94 24.94 24.94 24.94 24.94 12.47 12.47
Rating (MVA)9 25 25 25 25 25 25 11.2 2009 Peak (MVA) 19.9 19.9 0.0 23.9 0.0 14.5 9.3
Year Forecasted Undiversified Peak - MVA 2010 22.1 22.1 0.0 23.6 0.0 14.8 10.1 2011 22.5 22.5 0.0 24.0 0.0 15.0 10.3 2012 24.0 24.0 0.0 23.9 0.0 15.2 10.4 2013 24.4 24.4 0.0 24.3 0.0 15.4 10.5 2014 24.7 24.7 0.0 24.7 0.0 15.6 10.7 2015 22.6 22.6 0.0 15.0 15.0 15.8 10.8 2016 23.0 23.0 0.0 15.3 15.3 16.0 10.9 2017 23.3 23.3 0.0 15.5 15.5 16.6 10.6 2018 23.7 23.7 0.0 15.7 15.7 16.9 10.7 2019 24.1 24.1 0.0 16.0 16.0 17.1 10.8 2020 24.4 24.4 0.0 16.2 16.2 17.3 11.0 2021 24.8 24.8 0.0 16.5 16.5 17.5 11.1 2022 23.2 23.2 0.0 18.7 18.7 17.7 11.2 2023 23.6 23.6 0.0 19.0 19.0 20.2 9.1 2024 23.9 23.9 0.0 19.3 19.3 20.5 9.2 2025 24.3 24.3 0.0 19.6 19.6 20.7 9.3 2026 24.7 24.7 0.0 19.9 19.9 21.0 9.4 2027 22.6 22.6 0.0 22.8 22.8 21.3 9.5 2028 22.9 22.9 0.0 23.1 23.1 21.5 9.7 2029 23.3 23.3 0.0 23.5 23.5 21.8 9.8 2030 23.7 23.7 0.0 23.8 23.8 22.1 9.9

2.2 2011 Additions Due to Load Growth – Conception Bay South Study NP 2010 CBA
Appendix C
Alternative 2 20 Year Substation Load Forecasts
2.2 2011 Additions Due to Load Growth – Conception Bay South Study NP 2010 CBA
C-1
Alternative 2 20 Year Substation Load Forecast – Base Case
10 Ratings reflect the transformer capacity rating in 2030 as per the expansion plan.
Device CHA-T1 CHA-T2 CHA-T3 HWD-T3 HWD-T4 KEL-T1 SCV-T2 Voltage (kV) 24.94 24.94 24.94 24.94 24.94 12.47 12.47
Rating (MVA)10 25 25 25 25 25 14.95 25 2009 Peak (MVA) 19.9 19.9 0.0 23.9 0.0 14.5 9.3
Year Forecasted Undiversified Peak – MVA 2010 22.1 22.1 0.0 23.6 0.0 14.8 10.1 2011 22.7 22.7 0.0 24.2 0.0 10.1 15.3 2012 24.4 24.4 0.0 24.3 0.0 10.3 15.6 2013 24.9 24.9 0.0 24.9 0.0 10.5 15.9 2014 23.0 23.0 0.0 15.2 15.2 10.7 16.2 2015 23.6 23.6 0.0 15.6 15.6 10.9 16.5 2016 24.1 24.1 0.0 15.9 15.9 11.1 16.8 2017 24.7 24.7 0.0 16.3 16.3 11.3 17.1 2018 22.7 22.7 0.0 19.2 19.2 11.5 17.5 2019 23.3 23.3 0.0 19.7 19.7 11.7 17.8 2020 23.8 23.8 0.0 20.1 20.1 11.9 18.1 2021 24.4 24.4 0.0 20.6 20.6 12.1 18.5 2022 24.9 24.9 0.0 21.1 21.1 12.4 18.8 2023 23.5 23.5 0.0 23.6 23.6 12.6 19.2 2024 24.1 24.1 0.0 24.1 24.1 12.8 19.5 2025 24.6 24.6 0.0 24.7 24.7 13.1 19.9 2026 10.1 10.1 10.1 22.8 22.8 13.3 20.3 2027 10.3 10.3 10.3 23.3 23.3 13.6 20.6 2028 10.6 10.6 10.6 23.8 23.8 13.8 21.0 2029 10.8 10.8 10.8 24.4 24.4 14.1 21.4 2030 11.1 11.1 11.1 25.0 25.0 14.4 21.8
2.2 2011 Additions Due to Load Growth – Conception Bay South Study NP 2010 CBA
C-2
Alternative 2
20 Year Substation Load Forecast – High Growth
11 Ratings reflect the transformer capacity rating in 2030 as per the expansion plan.
Device CHA-T1 CHA-T2 CHA-T3 HWD-T3 HWD-T4 KEL-T1 SCV-T2 Voltage (kV) 24.94 24.94 24.94 24.94 24.94 12.47 12.47
Rating (MVA)11 25 25 25 25 25 14.95 25 2009 Peak (MVA) 19.9 19.9 0.0 23.9 0.0 14.5 9.3
Year Forecasted Undiversified Peak – MVA 2010 22.1 22.1 0.0 23.6 0.0 14.8 10.1 2011 23.0 23.0 0.0 24.5 0.0 10.2 15.4 2012 24.9 24.9 0.0 24.9 0.0 10.5 15.9 2013 23.3 23.3 0.0 15.4 15.4 10.8 16.3 2014 24.1 24.1 0.0 15.9 15.9 11.1 16.8 2015 25.0 25.0 0.0 16.5 16.5 11.4 17.3 2016 23.3 23.3 0.0 19.6 19.6 11.8 17.7 2017 24.2 24.2 0.0 20.3 20.3 12.1 18.2 2018 22.5 22.5 0.0 23.5 23.5 12.4 18.8 2019 23.3 23.3 0.0 24.3 24.3 12.8 19.3 2020 24.6 24.6 0.0 24.7 24.7 13.1 19.8 2021 10.2 10.2 10.2 23.0 23.0 13.5 20.4 2022 10.5 10.5 10.5 23.8 23.8 13.9 21.0 2023 10.9 10.9 10.9 24.7 24.7 14.3 21.5 2024 15.3 15.3 15.3 19.5 19.5 14.7 22.1 2025 15.8 15.8 15.8 20.2 20.2 14.2 23.7 2026 16.4 16.4 16.4 20.9 20.9 14.6 24.3 2027 16.9 16.9 16.9 21.7 21.7 15.0 25.0 2028 17.5 17.5 17.5 22.4 22.4 17.9 23.2 2029 18.2 18.2 18.2 23.2 23.2 18.4 23.9 2030 18.8 18.8 18.8 24.0 24.0 19.0 24.5
2.2 2011 Additions Due to Load Growth – Conception Bay South Study NP 2010 CBA
C-3
Alternative 2
20 Year Substation Load Forecast – Low Growth
12 Ratings reflect the transformer capacity rating in 2030 as per the expansion plan.
Device CHA-T1 CHA-T2 CHA-T3 HWD-T3 HWD-T4 KEL-T1 SCV-T2 Voltage (kV) 24.94 24.94 24.94 24.94 24.94 12.47 12.47
Rating (MVA)12 25 25 25 25 25 14.95 25 2009 Peak (MVA) 19.9 19.9 0.0 23.9 0.0 14.5 9.3
Year Forecasted Undiversified Peak – MVA 2010 22.1 22.1 0.0 23.6 0.0 14.8 10.1 2011 22.5 22.5 0.0 24.0 0.0 15.0 10.3 2012 24.0 24.0 0.0 23.9 0.0 10.1 15.5 2013 24.4 24.4 0.0 24.3 0.0 10.2 15.7 2014 24.7 24.7 0.0 24.7 0.0 10.4 15.8 2015 22.6 22.6 0.0 15.0 0.0 10.5 16.0 2016 23.0 23.0 0.0 15.3 0.0 10.6 16.2 2017 23.3 23.3 0.0 15.5 0.0 10.8 16.5 2018 23.7 23.7 0.0 15.7 2.5 10.9 16.7 2019 24.1 24.1 0.0 16.0 2.6 11.0 16.9 2020 24.4 24.4 0.0 16.2 2.6 11.2 17.1 2021 24.8 24.8 0.0 16.5 2.7 11.3 17.3 2022 23.2 23.2 0.0 18.7 2.7 11.5 17.5 2023 23.6 23.6 0.0 19.0 4.8 11.6 17.7 2024 23.9 23.9 0.0 19.3 4.9 11.7 17.9 2025 24.3 24.3 0.0 19.6 5.0 11.9 18.2 2026 24.7 24.7 0.0 19.9 2.7 12.0 18.4 2027 22.6 22.6 0.0 22.8 2.7 12.2 18.6 2028 22.9 22.9 0.0 23.1 2.8 12.3 18.9 2029 23.3 23.3 0.0 23.5 2.8 12.5 19.1 2030 23.7 23.7 0.0 23.8 2.9 12.6 19.3

2.2 2011 Additions Due to Load Growth – Conception Bay South Study NP 2010 CBA
Appendix D
Alternative 3 20 Year Substation Load Forecasts

2.2 2011 Additions Due to Load Growth – Conception Bay South Study NP 2010 CBA
D-1
Alternative 3 20 Year Substation Load Forecast – Base Case
13 Ratings reflect the transformer capacity rating in 2030 as per the expansion plan.
Device CHA-T1 CHA-T2 CHA-T3 HWD-T3 HWD-T4 KEL-T1 SCV-T2 Voltage (kV) 24.94 24.94 24.94 24.94 24.94 12.47 12.47
Rating (MVA)13 25 25 25 25 25 25 11.2 2009 Peak (MVA) 19.9 19.9 0.0 23.9 0.0 14.5 9.3
Year Forecasted Undiversified Peak – MVA 2010 22.1 22.1 0.0 23.6 0.0 14.8 10.6 2011 24.2 24.2 0.0 24.2 0.0 12.1 10.8 2012 22.9 22.9 0.0 15.2 15.2 12.3 11.1 2013 23.5 23.5 0.0 15.5 15.5 13.1 10.8 2014 24.0 24.0 0.0 15.9 15.9 13.3 11.0 2015 24.5 24.5 0.0 16.2 16.2 13.5 11.2 2016 22.6 22.6 0.0 19.1 19.1 16.1 9.1 2017 23.1 23.1 0.0 19.6 19.6 16.4 9.2 2018 23.7 23.7 0.0 20.0 20.0 16.7 9.4 2019 24.2 24.2 0.0 20.5 20.5 17.0 9.6 2020 24.8 24.8 0.0 21.0 21.0 17.3 9.8 2021 23.4 23.4 0.0 23.5 23.5 17.7 10.0 2022 23.9 23.9 0.0 24.0 24.0 18.0 10.1 2023 24.5 24.5 0.0 24.6 24.6 18.3 10.3 2024 10.7 10.7 10.7 21.7 21.7 18.7 10.5 2025 10.9 10.9 10.9 22.2 22.2 19.0 10.7 2026 11.2 11.2 11.2 22.7 22.7 19.4 10.9 2027 11.5 11.5 11.5 23.2 23.2 19.7 11.1 2028 11.7 11.7 11.7 23.7 23.7 20.6 10.8 2029 12.0 12.0 12.0 24.3 24.3 21.0 11.0 2030 12.3 12.3 12.3 24.9 24.9 21.4 11.2
2.2 2011 Additions Due to Load Growth – Conception Bay South Study NP 2010 CBA
D-2
Alternative 3 20 Year Substation Load Forecast – High Growth
14 Ratings reflect the transformer capacity rating in 2030 as per the expansion plan.
Device CHA-T1 CHA-T2 CHA-T3 HWD-T3 HWD-T4 KEL-T1 SCV-T2 Voltage (kV) 24.94 24.94 24.94 24.94 24.94 12.47 12.47
Rating (MVA)14 25 25 25 25 25 25 11.2 2009 Peak (MVA) 19.9 19.9 0.0 23.9 0.0 14.5 9.3
Year Forecasted Undiversified Peak – MVA 2010 22.1 22.1 0.0 23.6 0.0 14.8 10.1 2011 24.5 24.5 0.0 24.5 0.0 12.2 10.4 2012 23.5 23.5 0.0 15.5 15.5 12.6 10.7 2013 24.3 24.3 0.0 16.0 16.0 13.0 11.1 2014 22.7 22.7 0.0 19.1 19.1 15.6 9.0 2015 23.4 23.4 0.0 19.7 19.7 16.0 9.3 2016 24.3 24.3 0.0 20.4 20.4 16.5 9.6 2017 23.1 23.1 0.0 23.1 23.1 17.0 9.8 2018 23.9 23.9 0.0 24.0 24.0 17.4 10.1 2019 24.8 24.8 0.0 24.8 24.8 17.9 10.4 2020 10.9 10.9 10.9 22.2 22.2 18.4 10.7 2021 11.3 11.3 11.3 22.9 22.9 18.9 11.0 2022 11.7 11.7 11.7 23.8 23.8 21.3 9.5 2023 12.1 12.1 12.1 24.6 24.6 21.9 9.8 2024 16.5 16.5 16.5 19.5 19.5 22.5 10.0 2025 17.1 17.1 17.1 20.1 20.1 23.1 10.3 2026 17.7 17.7 17.7 20.9 20.9 23.8 10.6 2027 18.3 18.3 18.3 21.6 21.6 24.4 10.9 2028 19.0 19.0 19.0 22.3 22.3 23.6 12.7 2029 19.6 19.6 19.6 23.1 23.1 24.3 13.1 2030 20.3 20.3 20.3 23.9 23.9 25.0 13.4
2.2 2011 Additions Due to Load Growth – Conception Bay South Study NP 2010 CBA
D-3
Alternative 3
20 Year Substation Load Forecast – Low Growth
15 Ratings reflect the transformer capacity rating in 2030 as per the expansion plan.
Device CHA-T1 CHA-T2 CHA-T3 HWD-T3 HWD-T4 KEL-T1 SCV-T2 Voltage (kV) 24.94 24.94 24.94 24.94 24.94 12.47 12.47
Rating (MVA)15 25 25 25 25 25 25 11.2 2009 Peak (MVA) 19.9 19.9 0.0 23.9 0.0 14.5 9.3
Year Forecasted Undiversified Peak - MVA 2010 22.1 22.1 0.0 23.6 0.0 14.8 10.6 2011 22.5 22.5 0.0 24.0 0.0 15.0 10.8 2012 25.0 25.0 0.0 24.9 0.0 12.2 10.9 2013 22.4 22.4 0.0 15.7 15.7 12.3 11.1 2014 22.7 22.7 0.0 15.9 15.9 12.5 11.2 2015 23.1 23.1 0.0 16.1 16.1 13.1 10.8 2016 23.4 23.4 0.0 16.4 16.4 13.3 11.0 2017 23.8 23.8 0.0 16.6 16.6 13.5 11.1 2018 24.2 24.2 0.0 16.9 16.9 13.6 11.2 2019 24.6 24.6 0.0 17.2 17.2 16.1 9.1 2020 24.9 24.9 0.0 17.4 17.4 16.3 9.2 2021 23.3 23.3 0.0 19.7 19.7 16.5 9.3 2022 23.7 23.7 0.0 20.0 20.0 16.7 9.4 2023 24.1 24.1 0.0 20.3 20.3 16.9 9.5 2024 24.4 24.4 0.0 20.6 20.6 17.1 9.7 2025 24.8 24.8 0.0 21.0 21.0 17.4 9.8 2026 23.2 23.2 0.0 23.3 23.3 17.6 9.9 2027 23.6 23.6 0.0 23.7 23.7 17.8 10.0 2028 23.9 23.9 0.0 24.0 24.0 18.0 10.1 2029 24.3 24.3 0.0 24.4 24.4 18.2 10.3 2030 24.7 24.7 0.0 24.8 24.8 18.5 10.4

2.2 2011 Additions Due to Load Growth – Northeast St. John’s Study NP 2011 CBA
i
Attachment B
Northeast St. John’s Study

2.2 2011 Additions Due to Load Growth – Northeast St. John’s Study NP 2011 CBA
ii
Table of Contents
Page 1.0 Introduction ....................................................................................................................... 1 2.0 Description of Existing System ........................................................................................ 1 2.1 BCV Substation .................................................................................................... 1 2.2 PUL Substation ..................................................................................................... 1 2.3 HWD Substation ................................................................................................... 2 3.0 Load Forecast .................................................................................................................... 2 4.0 Development of Alternatives ............................................................................................ 2 4.1 Alternative 1.......................................................................................................... 3 4.2 Alternative 2.......................................................................................................... 3 4.3 Alternative 3.......................................................................................................... 3 5.0 Evaluation of Alternatives ................................................................................................ 4 5.1 Cost of Alternatives .............................................................................................. 4 5.2 Economic Analysis ............................................................................................... 6 5.3 Sensitivity Analysis .............................................................................................. 6 6.0 Project Cost ....................................................................................................................... 7 7.0 Conclusion and Recommendation ................................................................................... 8 Appendix A: 2010 Substation Load Forecast – Base Case Appendix B: Alternative #1 20 Year Substation Load Forecast Appendix C: Alternative #2 20 Year Substation Load Forecast Appendix D: Alternative #3 20 Year Substation Load Forecast

2.2 2011 Additions Due to Load Growth – Northeast St. John’s Study NP 2011 CBA
1
1.0 Introduction The purpose of this study is to determine the distribution system alternative that best meets the electrical demands in the area northeast of the city of St. John’s. The Northeast St. John’s Area includes customers serviced from Pulpit Rock (“PUL”), and Broad Cove (“BCV”) substations. Hardwoods (“HWD”) 25kV distribution system, which supplies the Town of Paradise, is also included in this report due to its interconnection to the BCV distribution system. In 2009, the distribution power transformers supplying the area experienced a total peak load of 72.2 MVA compared to a total capacity of 75 MVA. A transformer at BCV (”BCV-T1”) experienced a peak load of 25.6 MVA, exceeding its capacity rating of 25 MVA.1 Load growth on this transformer is primarily the result of residential load growth. This report identifies the capital project(s) required to address the overload on BCV-T1 by determining the least cost expansion plan required to meet a 20 year load forecast. 2.0 Description of Existing System 2.1 BCV Substation BCV substation is located at Broad Cove in the community of Portugal Cove-St. Phillips. The substation has one transformer, BCV-T1.2 This is a 25 MVA transformer used to convert the 66 kV transmission voltage to the 12.5 kV distribution voltage and supply customers through BCV substation feeders. There are four 12.5 kV feeders supplied from BCV substation. BCV-01 feeder extends from the substation along Old Broad Cove Road and onto Portugal Cove Road supplying approximately 866 customers. BCV-02 extends to Bell Island via a submersible cable where it supplies approximately 1,529 customers. BCV-03 feeder extends west from the substation along Thorburn Road and onto St. Thomas Line supplying approximately 997 customers. BCV-04 feeder extends south from the substation along Tuckers Hill Road and into Portugal Cove supplying approximately 1,034 customers. 2.2 PUL Substation PUL substation is located in the community of Torbay, located on the Northeast Avalon Peninsula. There is one transformer located in the substation, PUL-T1. This is a 25 MVA transformer used to convert 66 kV transmission voltage to 12.5 kV distribution voltage and supply customers through PUL substation feeders. There are three 12.5 kV feeders originating from PUL substation. PUL-01 feeder supplies approximately 1,947 customers in the community of Torbay. PUL-02 feeder extends north from
1 This overload occurred despite a load transfer to HWD-T3 that was completed in 2009. This reflects higher
than forecast load growth on BCV-T1. 2 A distribution power transformer converts electricity from transmission voltages (typically 66 kV) to
distribution primary voltages (typically between 4kV and 25kV).
2.2 2011 Additions Due to Load Growth – Northeast St. John’s Study NP 2011 CBA
2
the substation and supplies approximately 1,463 customers in the communities of Flatrock and Pouch Cove. PUL-03 feeder also extends north from the substation along the Bauline Line and supplies approximately 871 customers in Torbay and Bauline. 2.3 HWD Substation HWD substation is located in the community of Paradise, on the Avalon Peninsula west of the City of St. John’s. There are three transformers located in the substation. HWD-T1 and HWD-T2 are both 20 MVA rated transformers used to convert 66kV transmission voltage to 12.5kV distribution voltage and supply customers on five distribution feeders through HWD substation.3 HWD-T3 is a 25 MVA transformer used to convert 66 kV transmission voltage to 25 kV distribution voltage and supply customers through two HWD substation feeders. HWD-07 extends along Karwood Drive onto Topsail Road and along Paradise Road to St. Thomas Line, supplying approximately 2,508 customers. HWD-08 feeder extends along Karwood Drive onto Topsail Road and supplies approximately 1,685 customers in the Paradise Area. 3.0 Load Forecast The following are the peak substation transformer loads recorded this past winter for each of these substations.
• BCV-T1 is rated at 25 MVA. The load on this transformer peaked at 25.6 MVA in 2009. • PUL-T1 is rated at 25 MVA. The load on this transformer peaked at 22.7 MVA in 2009. • HWD-T3 is rated at 25 MVA. The load on this transformer peaked at 23.9 MVA in
2009. This study uses a 20-year load forecast for these power transformers. The base case 20 year forecasts for BCV-T1, PUL-T1 and HWD-T3 are located in Appendix A. A high and low load growth forecast has also been created for each of the alternatives for use in a sensitivity analysis. With the exception of the first year forecast, the sensitivities are based on increasing the load growth by a factor of 50% for the high forecast and decreasing it by 50% for the low forecast. 4.0 Development of Alternatives Three alternatives have been developed to eliminate the existing and forecasted overload conditions using a set of defined technical criteria.4 These alternatives will provide sufficient capacity to meet forecasted loads over the next 20 years.
3 The five 12.5 kV feeders originating from HWD substation do not service the Northeast Avalon area included
in this study, and therefore HWD-T1 and HWD-T2 are not included in this report. 4 The following technical criteria were applied.
• The steady state power transformer loading should not exceed the nameplate rating. • The minimum steady state feeder voltage should not fall below 116 Volts (on a 120 Volt base). • The feeder normal peak loading should be sufficient to permit cold load pickup. • The conductor loading should not exceed the ampacity rating established in the distribution planning
guidelines.
2.2 2011 Additions Due to Load Growth – Northeast St. John’s Study NP 2011 CBA
3
Each alternative contains estimates for all costs involved including transformers, new feeders and load transfers. The results of net present value calculations are provided for each alternative. 4.1 Alternative 1
• New 25 MVA, 66/12.5kV transformer at PUL substation to increase the total substation transformer capacity to 50 MVA in 2011.
• New distribution feeder from PUL to complete load transfer from BCV to PUL in 2011. • New 25 MVA, 66/25kV transformer at HWD substation to increase the total 25kV
transformer capacity to 50 MVA in 2014.5 • Upgrade and extend PUL-03 feeder to allow additional load transfers from BCV to PUL
in 2016. • New 25 MVA, 66/12.5kV transformer at BCV substation to increase the total transformer
capacity to 50 MVA in 2023. The resulting peak load forecasts for each transformer under Alternative 1 are shown in Appendix B. 4.2 Alternative 2
• New 25 MVA, 66/12.5kV transformer at BCV substation to increase the total transformer capacity to 50 MVA in 2011.
• New distribution feeder from BCV to complete load transfer from PUL to BCV in 2012. • New 25 MVA, 66/25kV transformer at HWD substation to increase the total 25kV
transformer capacity to 50 MVA in 2014. • Upgrade and extend BCV-04 feeder to allow additional load transfers from PUL to BCV
in 2021. • New 25 MVA, 66/12.5kV transformer at PUL substation to increase the total transformer
capacity to 50 MVA in 2027. • New distribution feeder from PUL to complete load transfer from BCV to PUL in 2027.
The resulting peak load forecasts for each transformer under Alternative 2 are shown in Appendix C.
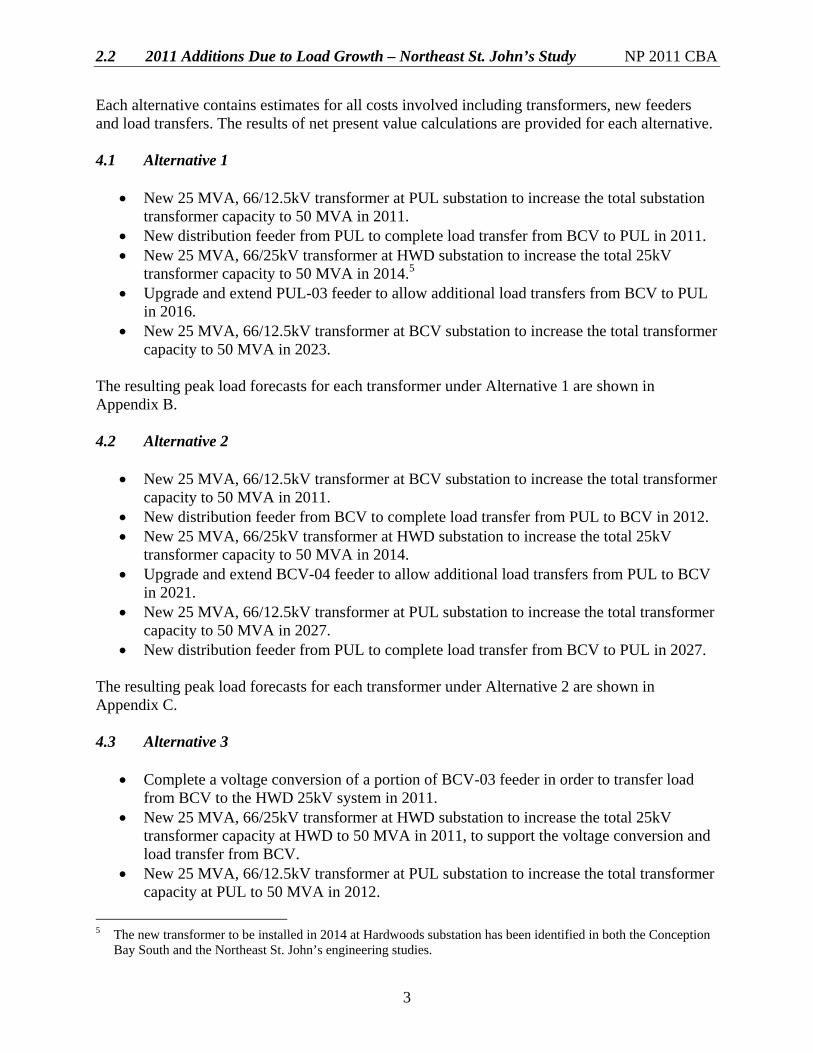
4.3 Alternative 3
• Complete a voltage conversion of a portion of BCV-03 feeder in order to transfer load from BCV to the HWD 25kV system in 2011.
• New 25 MVA, 66/25kV transformer at HWD substation to increase the total 25kV transformer capacity at HWD to 50 MVA in 2011, to support the voltage conversion and load transfer from BCV.
• New 25 MVA, 66/12.5kV transformer at PUL substation to increase the total transformer capacity at PUL to 50 MVA in 2012.
5 The new transformer to be installed in 2014 at Hardwoods substation has been identified in both the Conception
Bay South and the Northeast St. John’s engineering studies.

2.2 2011 Additions Due to Load Growth – Northeast St. John’s Study NP 2011 CBA
4
• New distribution feeder from PUL to complete load transfer from BCV to PUL in 2012. • Upgrade and extend PUL-03 feeder to allow additional load transfers from BCV to PUL
in 2021. • New 25 MVA, 66/12.5kV transformer at BCV substation to increase the total transformer
capacity at BCV to 50 MVA in 2029.
The resulting peak load forecasts for each transformer under Alternative 2 are shown in Appendix D. 5.0 Evaluation of Alternatives 5.1 Cost of Alternatives Table 1 shows the capital costs estimated for Alternative 1.
Table 1 Alternative 1 Capital Costs
Year Item Cost 2011 Purchase and install new 25 MVA transformer at PUL substation
and complete substation modifications for new feeder.
$2,705,000
2011 Construct new PUL distribution feeder.
$638,000
2014 Purchase and install new 25 MVA transformer at HWD substation. $2,500,000
2016 Extend and upgrade PUL-03 feeder.
$427,000
2023 Purchase and install new 25 MVA transformer at BCV substation.
$2,500,000
Total $8,770,000
2.2 2011 Additions Due to Load Growth – Northeast St. John’s Study NP 2011 CBA
5
Table 2 shows the capital costs estimated for Alternative 2.
Table 2 Alternative 2 Capital Costs
Year Item Cost 2011 Purchase and install new 25 MVA transformer at BCV substation
and complete substation modifications for new feeder.
$2,705,000
2012 Construct new BCV distribution feeder.
$850,000
2014 Purchase and install new 25 MVA transformer at HWD substation.
$2,500,000
2021 Extend and upgrade BCV-04 feeder.
$427,000
2027 Purchase and install new 25 MVA transformer at PUL substation and complete substation modifications for new feeder.
$2,705,000
2027 Construct new PUL distribution feeder.
$290,000
Total $9,477,000 Table 3 shows the capital costs estimated for Alternative 3.
Table 3 Alternative 3 Capital Costs
Year Item Cost 2011 Convert 3MVA of load from BCV-12.5kV to HWD-25kV
$550,000
2011
Purchase and install a new 25 MVA transformer at HWD. $2,500,000
2012 Purchase and install new 25 MVA transformer at PUL substation and complete substation modifications for new feeder.
$2,705,000
2012 Construct new PUL distribution feeder.
$638,000
2021 Extend and upgrade PUL-03 feeder.
$427,000
2029 Purchase and install new 25 MVA transformer at BCV substation.
$2,500,000
Total $9,320,000
2.2 2011 Additions Due to Load Growth – Northeast St. John’s Study NP 2011 CBA
6
5.2 Economic Analysis In order to compare the economic impact of the alternatives, a net present value (“NPV”) calculation of customer revenue requirement was completed for each alternative. Capital costs from 2011 to 2030 were converted to revenue requirement and the resulting customer revenue requirement from 2011 to 2057 was reduced to a net present value using the Company’s weighted average incremental cost of capital.6 Table 4 shows the NPV of customer revenue requirement for each alternative under the base case load forecast.
Table 4 Net Present Value Analysis
($000) Alternative NPV
1 7,490 2 7,507 3 7,795
Alternative 1 has the lowest NPV of customer revenue requirement. 5.3 Sensitivity Analysis To assess the sensitivity to load forecast error of each alternative, high and low load forecasts were developed. With exception of the first year forecast, the sensitivities were based on increasing the load growth by a factor of 50% for the high forecast and decreasing by a factor of 50% for the low forecast. The peak load forecasts for the sensitivity analysis are shown in Appendix B, C and D for Alternatives 1, 2 and 3, respectively. In general, the low load forecast results in delaying the required construction. Similarly, with a higher load forecast the timing of the projects is advanced.7 Using these revised dates, the net present value of the customer revenue requirement was calculated.
6 The 2011 to 2057 time period captures the customer revenue requirement for the 46 year life of the new
transformer asset in 2011. 7 The sensitivity analysis for each of the high level forecast alternatives include additional projects to add
transformer capacity at the end of the 20 year period.

2.2 2011 Additions Due to Load Growth – Northeast St. John’s Study NP 2011 CBA
7
Table 5 shows the NPV of customer revenue requirement for each alternative under the high and low load forecasts.
Table 5 Sensitivity Analysis
($000)
Alternative
High Load Forecast
NPV
Low Load Forecast
NPV 1 8,947 5,868 2 9,086 6,096 3 8,894 6,783
Under the low load forecast, Alternative 1 is still the least cost alternative. Under the high forecast, Alternative 3 is the least cost alternative. However, the difference between Alternative 1 and Alternative 3 is small. Further, in the case of high load growth, Alternative 3 results in lower aggregate capacity to meet future load growth beyond 2030, relative to Alternatives 1 and 2.8 This will tend to increase costs beyond 2030. The recommendation to implement Alternative 1 is still appropriate given the results of the sensitivity analysis. 6.0 Project Cost Table 6 shows the estimated costs for the projects to be completed in 2011.
Table 6 Project Costs
Description Cost Estimate Purchase and install new 25 MVA transformer at PUL substation. Complete substation modifications at PUL for new distribution feeder.
$2,500,00
$205,000
Construct new PUL distribution feeder. $638,000
Total $3,343,000
8 In 2030, under the high forecast scenario, Alternative 3 has a total distribution transformer capacity of 150
MVA while Alternatives 1 and 2 have a total capacity of 175 MVA
2.2 2011 Additions Due to Load Growth – Northeast St. John’s Study NP 2011 CBA
8
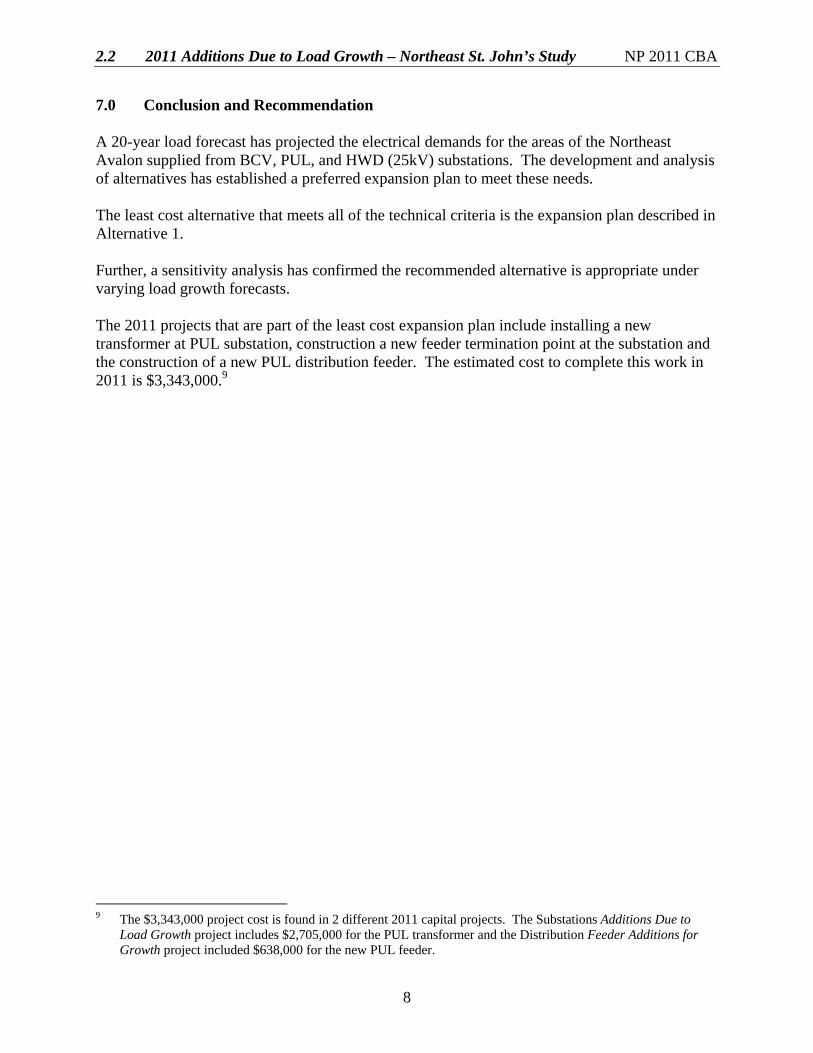
7.0 Conclusion and Recommendation A 20-year load forecast has projected the electrical demands for the areas of the Northeast Avalon supplied from BCV, PUL, and HWD (25kV) substations. The development and analysis of alternatives has established a preferred expansion plan to meet these needs. The least cost alternative that meets all of the technical criteria is the expansion plan described in Alternative 1. Further, a sensitivity analysis has confirmed the recommended alternative is appropriate under varying load growth forecasts. The 2011 projects that are part of the least cost expansion plan include installing a new transformer at PUL substation, construction a new feeder termination point at the substation and the construction of a new PUL distribution feeder. The estimated cost to complete this work in 2011 is $3,343,000.9
9 The $3,343,000 project cost is found in 2 different 2011 capital projects. The Substations Additions Due to
Load Growth project includes $2,705,000 for the PUL transformer and the Distribution Feeder Additions for Growth project included $638,000 for the new PUL feeder.
2.2 2011 Additions Due to Load Growth – Northeast St. John’s Study NP 2011 CBA
Appendix A
2010 Substation Load Forecast – Base Case

2.2 2011 Additions Due to Load Growth – Northeast St. John’s Study NP 2011 CBA
A-1
20 Year Substation Load Forecast – Base Case
Device BCV-T1 HWD-T3 PUL-T1 Voltage (kV) 12.47 24.94 12.47
Rating (MVA) 25 25 25 2009 Peak (MVA) 25.6 23.9 22.7
Year Forecasted Undiversified Peak - MVA 2010 27.3 23.6 24.2 2011 28.0 24.2 24.8 2012 28.7 24.3 25.4 2013 29.3 24.9 26.0 2014 30.0 25.5 26.6 2015 30.7 26.1 27.2 2016 31.4 26.7 27.9 2017 32.2 27.3 28.5 2018 32.9 27.9 29.2 2019 33.7 28.6 29.9 2020 34.5 29.2 30.6 2021 35.3 29.9 31.3 2022 36.1 30.6 32.0 2023 36.9 31.3 32.8 2024 37.8 32.1 33.5 2025 38.7 32.8 34.3 2026 39.6 33.6 35.1 2027 40.5 34.4 35.9 2028 41.5 35.2 36.8 2029 42.4 36.0 37.6 2030 43.4 36.9 38.5

2.2 2011 Additions Due to Load Growth- Northeast St. John’s Study NP 2011 CBA
Appendix B
Alternative 1 20 Year Substation Load Forecast
2.2 2011 Additions Due to Load Growth- Northeast St. John’s Study NP 2011 CBA
B-1
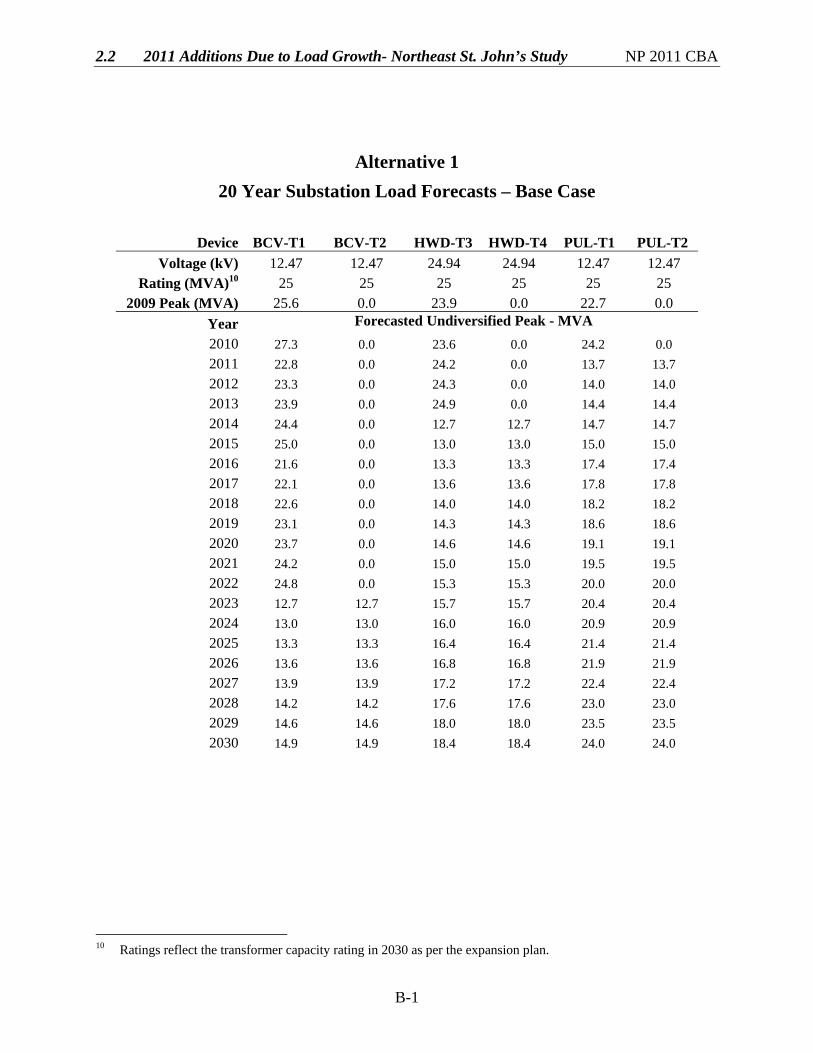
Alternative 1 20 Year Substation Load Forecasts – Base Case
10 Ratings reflect the transformer capacity rating in 2030 as per the expansion plan.
Device BCV-T1 BCV-T2 HWD-T3 HWD-T4 PUL-T1 PUL-T2 Voltage (kV) 12.47 12.47 24.94 24.94 12.47 12.47
Rating (MVA)10 25 25 25 25 25 25 2009 Peak (MVA) 25.6 0.0 23.9 0.0 22.7 0.0
Year Forecasted Undiversified Peak - MVA 2010 27.3 0.0 23.6 0.0 24.2 0.0 2011 22.8 0.0 24.2 0.0 13.7 13.7 2012 23.3 0.0 24.3 0.0 14.0 14.0 2013 23.9 0.0 24.9 0.0 14.4 14.4 2014 24.4 0.0 12.7 12.7 14.7 14.7 2015 25.0 0.0 13.0 13.0 15.0 15.0 2016 21.6 0.0 13.3 13.3 17.4 17.4 2017 22.1 0.0 13.6 13.6 17.8 17.8 2018 22.6 0.0 14.0 14.0 18.2 18.2 2019 23.1 0.0 14.3 14.3 18.6 18.6 2020 23.7 0.0 14.6 14.6 19.1 19.1 2021 24.2 0.0 15.0 15.0 19.5 19.5 2022 24.8 0.0 15.3 15.3 20.0 20.0 2023 12.7 12.7 15.7 15.7 20.4 20.4 2024 13.0 13.0 16.0 16.0 20.9 20.9 2025 13.3 13.3 16.4 16.4 21.4 21.4 2026 13.6 13.6 16.8 16.8 21.9 21.9 2027 13.9 13.9 17.2 17.2 22.4 22.4 2028 14.2 14.2 17.6 17.6 23.0 23.0 2029 14.6 14.6 18.0 18.0 23.5 23.5 2030 14.9 14.9 18.4 18.4 24.0 24.0

2.2 2011 Additions Due to Load Growth- Northeast St. John’s Study NP 2011 CBA
B-2
Alternative 1
20 Year Substation Load Forecast – High Growth
11 Ratings reflect the transformer capacity rating in 2030 as per the expansion plan.
Device BCV-T1 BCV-T2 HWD-T3 HWD-T4 PUL-T1 PUL-T2 PUL-T3 Voltage (kV) 12.47 12.47 24.94 24.94 12.47 12.47 12.47
Rating (MVA)11 25 25 25 25 25 25 25 2009 Peak (MVA) 25.6 0.0 23.9 0.0 22.7 0.0 0.0
Year Forecasted Undiversified Peak - MVA 2010 27.3 0.0 23.6 0.0 24.2 0.0 0.0 2011 23.1 0.0 24.5 0.0 15.2 15.2 0.0 2012 24.0 0.0 24.9 0.0 15.7 15.7 0.0 2013 24.8 0.0 12.9 12.9 16.3 16.3 0.0 2014 21.7 0.0 13.3 13.3 18.8 18.8 0.0 2015 22.4 0.0 13.8 13.8 19.5 19.5 0.0 2016 23.2 0.0 14.3 14.3 20.2 20.2 0.0 2017 24.0 0.0 14.8 14.8 20.9 20.9 0.0 2018 24.9 0.0 15.3 15.3 21.6 21.6 0.0 2019 12.9 12.9 15.9 15.9 22.4 22.4 0.0 2020 13.3 13.3 16.4 16.4 23.2 23.2 0.0 2021 13.8 13.8 17.0 17.0 24.0 24.0 0.0 2022 14.3 14.3 17.6 17.6 24.8 24.8 0.0 2023 17.8 17.8 18.2 18.2 22.7 22.7 0.0 2024 18.4 18.4 18.9 18.9 23.5 23.5 0.0 2025 19.1 19.1 19.5 19.5 24.3 24.3 0.0 2026 21.7 21.7 20.2 20.2 23.2 23.2 0.0 2027 22.5 22.5 20.9 20.9 24.0 24.0 0.0 2028 23.3 23.3 21.7 21.7 24.8 24.8 0.0 2029 24.1 24.1 22.4 22.4 8.6 8.6 8.6 2030 25.0 25.0 23.2 23.2 8.9 8.9 8.9

2.2 2011 Additions Due to Load Growth- Northeast St. John’s Study NP 2011 CBA
Alternative 1
20 Year Substation Load Forecast – Low Growth
12 Ratings reflect the transformer capacity rating in 2030 as per the expansion plan.
Device BCV-T1 BCV-T2 HWD-T3 HWD-T4 PUL-T1 PUL-T2 Voltage (kV) 12.47 12.47 24.94 24.94 12.47 12.47
Rating (MVA)12 25 25 25 25 25 25 2009 Peak (MVA) 25.6 0.0 23.9 0.0 22.7 0.0
Year Forecasted Undiversified Peak - MVA 2010 27.3 0.0 23.6 0.0 24.2 0.0 2011 22.5 0.0 24.0 0.0 13.6 13.6 2012 22.9 0.0 23.9 0.0 13.8 13.8 2013 23.3 0.0 24.3 0.0 14.0 14.0 2014 23.6 0.0 24.7 0.0 14.3 14.3 2015 24.0 0.0 25.0 0.0 14.5 14.5 2016 24.4 0.0 12.7 12.7 14.7 14.7 2017 24.7 0.0 12.9 12.9 14.9 14.9 2018 21.1 0.0 13.1 13.1 17.2 17.2 2019 21.5 0.0 13.3 13.3 17.4 17.4 2020 21.8 0.0 13.5 13.5 17.7 17.7 2021 22.1 0.0 13.7 13.7 18.0 18.0 2022 22.5 0.0 14.0 14.0 18.3 18.3 2023 22.8 0.0 14.2 14.2 18.5 18.5 2024 23.2 0.0 14.4 14.4 18.8 18.8 2025 23.5 0.0 14.6 14.6 19.1 19.1 2026 23.9 0.0 14.8 14.8 19.4 19.4 2027 24.3 0.0 15.1 15.1 19.7 19.7 2028 24.7 0.0 15.3 15.3 20.0 20.0 2029 24.1 0.0 15.6 15.6 20.8 20.8 2030 24.4 0.0 15.8 15.8 21.2 21.2

2.2 2011 Additions Due to Load Growth- Northeast St. John’s Study NP 2011 CBA
Appendix C
Alternative 2 20 Year Substation Load Forecasts

2.2 2011 Additions Due to Load Growth- Northeast St. John’s Study NP 2011 CBA
C-1
Alternative 2 20 Year Substation Load Forecasts – Base Case
13 Ratings reflect the transformer capacity rating in 2030 as per the expansion plan.
Device BCV-T1 BCV-T2 HWD-T3 HWD-T4 PUL-T1 PUL-T2 Voltage (kV) 12.47 12.47 24.94 24.94 12.47 12.47
Rating (MVA)13 25 25 25 25 25 25 2009 Peak (MVA) 25.6 0.0 23.9 0.0 22.7 0.0
Year Forecasted Undiversified Peak - MVA 2010 27.3 0.0 23.6 0.0 24.2 0.0 2011 14.0 14.0 24.2 0.0 24.8 0.0 2012 16.8 16.8 24.3 0.0 20.4 0.0 2013 17.2 17.2 24.9 0.0 20.9 0.0 2014 17.6 17.6 12.7 12.7 21.4 0.0 2015 18.0 18.0 13.0 13.0 21.9 0.0 2016 18.4 18.4 13.3 13.3 22.4 0.0 2017 18.9 18.9 13.6 13.6 22.9 0.0 2018 19.3 19.3 14.0 14.0 23.4 0.0 2019 19.8 19.8 14.3 14.3 24.0 0.0 2020 20.2 20.2 14.6 14.6 24.5 0.0 2021 22.2 22.2 15.0 15.0 22.1 0.0 2022 22.7 22.7 15.3 15.3 22.6 0.0 2023 23.3 23.3 15.7 15.7 23.2 0.0 2024 23.8 23.8 16.0 16.0 23.7 0.0 2025 24.4 24.4 16.4 16.4 24.3 0.0 2026 24.9 24.9 16.8 16.8 24.8 0.0 2027 22.5 22.5 17.2 17.2 15.7 15.7 2028 23.0 23.0 17.6 17.6 16.1 16.1 2029 23.6 23.6 18.0 18.0 16.5 16.5 2030 24.1 24.1 18.4 18.4 16.8 16.8
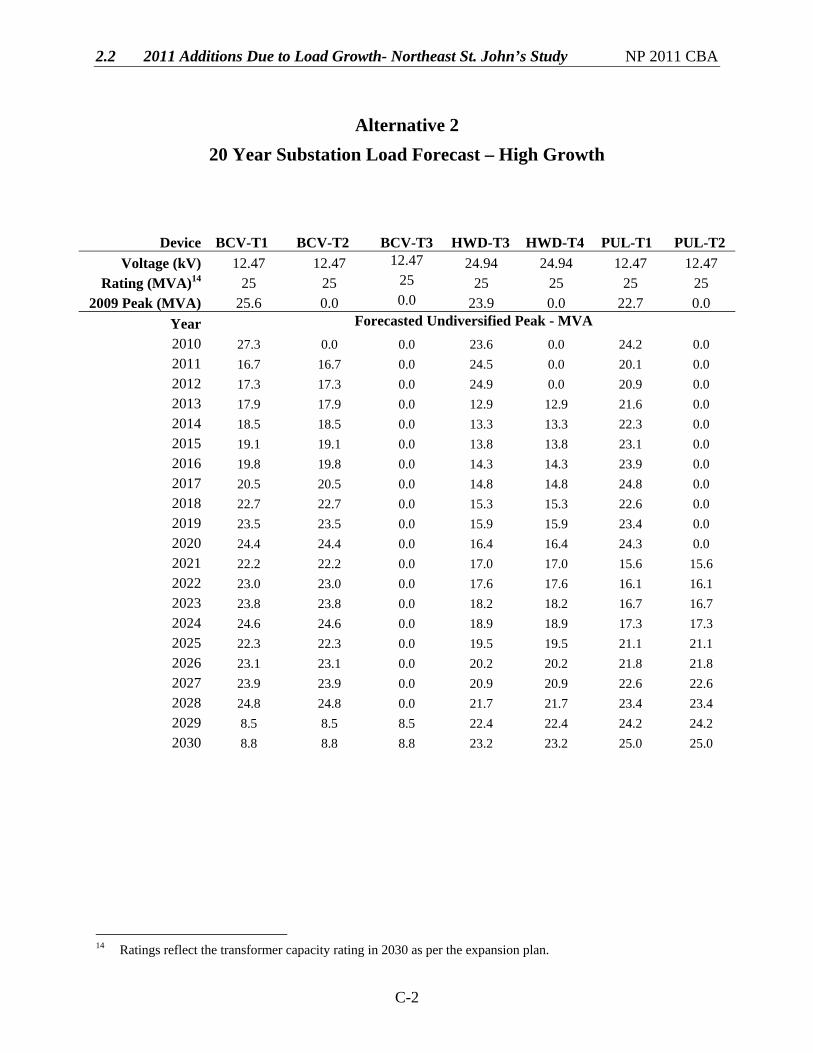
2.2 2011 Additions Due to Load Growth- Northeast St. John’s Study NP 2011 CBA
C-2
Alternative 2
20 Year Substation Load Forecast – High Growth
14 Ratings reflect the transformer capacity rating in 2030 as per the expansion plan.
Device BCV-T1 BCV-T2 BCV-T3 HWD-T3 HWD-T4 PUL-T1 PUL-T2 Voltage (kV) 12.47 12.47 12.47 24.94 24.94 12.47 12.47
Rating (MVA)14 25 25 25 25 25 25 25 2009 Peak (MVA) 25.6 0.0 0.0 23.9 0.0 22.7 0.0
Year Forecasted Undiversified Peak - MVA 2010 27.3 0.0 0.0 23.6 0.0 24.2 0.0 2011 16.7 16.7 0.0 24.5 0.0 20.1 0.0 2012 17.3 17.3 0.0 24.9 0.0 20.9 0.0 2013 17.9 17.9 0.0 12.9 12.9 21.6 0.0 2014 18.5 18.5 0.0 13.3 13.3 22.3 0.0 2015 19.1 19.1 0.0 13.8 13.8 23.1 0.0 2016 19.8 19.8 0.0 14.3 14.3 23.9 0.0 2017 20.5 20.5 0.0 14.8 14.8 24.8 0.0 2018 22.7 22.7 0.0 15.3 15.3 22.6 0.0 2019 23.5 23.5 0.0 15.9 15.9 23.4 0.0 2020 24.4 24.4 0.0 16.4 16.4 24.3 0.0 2021 22.2 22.2 0.0 17.0 17.0 15.6 15.6 2022 23.0 23.0 0.0 17.6 17.6 16.1 16.1 2023 23.8 23.8 0.0 18.2 18.2 16.7 16.7 2024 24.6 24.6 0.0 18.9 18.9 17.3 17.3 2025 22.3 22.3 0.0 19.5 19.5 21.1 21.1 2026 23.1 23.1 0.0 20.2 20.2 21.8 21.8 2027 23.9 23.9 0.0 20.9 20.9 22.6 22.6 2028 24.8 24.8 0.0 21.7 21.7 23.4 23.4 2029 8.5 8.5 8.5 22.4 22.4 24.2 24.2 2030 8.8 8.8 8.8 23.2 23.2 25.0 25.0

2.2 2011 Additions Due to Load Growth- Northeast St. John’s Study NP 2011 CBA
C-3
Alternative 2
20 Year Substation Load Forecast – Low Growth
15 Ratings reflect the transformer capacity rating in 2030 as per the expansion plan.
Device BCV-T1 BCV-T2 HWD-T3 HWD-T4 PUL-T1 PUL-T2 Voltage (kV) 12.47 12.47 24.94 24.94 12.47 12.47
Rating (MVA)15 25 25 25 25 25 25 2009 Peak (MVA) 25.6 0.0 23.9 0.0 22.7 0.0
Year Forecasted Undiversified Peak - MVA 2010 27.3 0.0 23.6 0.0 24.2 0.0 2011 13.9 13.9 24.0 0.0 24.6 0.0 2012 14.1 14.1 23.9 0.0 25.0 0.0 2013 16.8 16.8 24.3 0.0 20.4 0.0 2014 17.1 17.1 24.7 0.0 20.7 0.0 2015 17.3 17.3 25.0 0.0 21.0 0.0 2016 17.6 17.6 12.7 12.7 21.4 0.0 2017 17.9 17.9 12.9 12.9 21.7 0.0 2018 18.2 18.2 13.1 13.1 22.0 0.0 2019 18.4 18.4 13.3 13.3 22.4 0.0 2020 18.7 18.7 13.5 13.5 22.7 0.0 2021 19.0 19.0 13.7 13.7 23.1 0.0 2022 19.3 19.3 14.0 14.0 23.4 0.0 2023 19.6 19.6 14.2 14.2 23.8 0.0 2024 19.9 19.9 14.4 14.4 24.2 0.0 2025 20.2 20.2 14.6 14.6 24.5 0.0 2026 20.6 20.6 14.8 14.8 24.9 0.0 2027 22.4 22.4 15.1 15.1 22.3 0.0 2028 22.7 22.7 15.3 15.3 22.7 0.0 2029 23.1 23.1 15.6 15.6 23.0 0.0 2030 23.4 23.4 15.8 15.8 23.4 0.0

2.2 2011 Additions Due to Load Growth- Northeast St. John’s Study NP 2011 CBA
Appendix D
Alternative 3 20 Year Substation Load Forecasts

2.2 2011 Additions Due to Load Growth- Northeast St. John’s Study NP 2011 CBA
D-1
Alternative 3 20 Year Substation Load Forecasts – Base Case
16 Ratings reflect the transformer capacity rating in 2030 as per the expansion plan.
Device BCV-T1 BCV-T2 HWD-T3 HWD-T4 PUL-T1 PUL-T2 Voltage (kV) 12.47 12.47 24.94 24.94 12.47 12.47
Rating (MVA)16 25 25 25 25 25 25 2009 Peak (MVA) 25.6 0.0 23.9 0.0 22.7 0.0
Year Forecasted Undiversified Peak – MVA 2010 27.3 0.0 23.6 0.0 24.2 0.0 2011 25.0 0.0 13.4 13.4 24.8 0.0 2012 20.4 0.0 13.7 13.7 15.3 15.3 2013 20.9 0.0 14.0 14.0 15.7 15.7 2014 21.3 0.0 14.3 14.3 16.0 16.0 2015 21.8 0.0 14.7 14.7 16.4 16.4 2016 22.3 0.0 15.0 15.0 16.8 16.8 2017 22.9 0.0 15.4 15.4 17.2 17.2 2018 23.4 0.0 15.7 15.7 17.6 17.6 2019 24.0 0.0 16.1 16.1 18.0 18.0 2020 24.5 0.0 16.5 16.5 18.4 18.4 2021 21.1 0.0 16.8 16.8 20.8 20.8 2022 21.6 0.0 17.2 17.2 21.3 21.3 2023 22.1 0.0 17.6 17.6 21.8 21.8 2024 22.6 0.0 18.1 18.1 22.3 22.3 2025 23.1 0.0 18.5 18.5 22.9 22.9 2026 23.7 0.0 18.9 18.9 23.4 23.4 2027 24.2 0.0 19.4 19.4 23.9 23.9 2028 24.8 0.0 19.8 19.8 24.5 24.5 2029 12.7 12.7 20.3 20.3 23.1 23.1 2030 13.0 13.0 20.7 20.7 23.6 23.6

2.2 2011 Additions Due to Load Growth- Northeast St. John’s Study NP 2011 CBA
D-2
Alternative 3 20 Year Substation Load Forecast – High Growth
17 Ratings reflect the transformer capacity rating in 2030 as per the expansion plan.
Device BCV-T1 BCV-T2 HWD-T3 HWD-T4 PUL-T1 PUL-T2 Voltage (kV) 12.47 12.47 24.94 24.94 12.47 12.47
Rating (MVA)17 25 25 25 25 25 25 2009 Peak (MVA) 25.6 0.0 23.9 0.0 22.7 0.0
Year Forecasted Undiversified Peak - MVA 2010 27.3 0.0 23.6 0.0 24.2 0.0 2011 20.1 0.0 13.5 13.5 15.2 15.2 2012 20.9 0.0 14.0 14.0 15.7 15.7 2013 21.6 0.0 14.5 14.5 16.3 16.3 2014 22.3 0.0 15.0 15.0 16.8 16.8 2015 23.1 0.0 15.5 15.5 17.4 17.4 2016 23.9 0.0 16.1 16.1 18.0 18.0 2017 24.8 0.0 16.6 16.6 18.7 18.7 2018 21.6 0.0 17.2 17.2 21.3 21.3 2019 22.4 0.0 17.8 17.8 22.1 22.1 2020 23.2 0.0 18.5 18.5 22.8 22.8 2021 24.0 0.0 19.1 19.1 23.6 23.6 2022 24.9 0.0 19.8 19.8 24.5 24.5 2023 14.9 14.9 20.5 20.5 23.3 23.3 2024 15.4 15.4 21.2 21.2 24.2 24.2 2025 19.9 19.9 21.9 21.9 21.0 21.0 2026 20.6 20.6 22.7 22.7 21.8 21.8 2027 21.4 21.4 23.5 23.5 22.5 22.5 2028 22.1 22.1 24.3 24.3 23.3 23.3 2029 22.9 22.9 24.0 24.0 24.1 24.1 2030 23.7 23.7 24.8 24.8 25.0 25.0
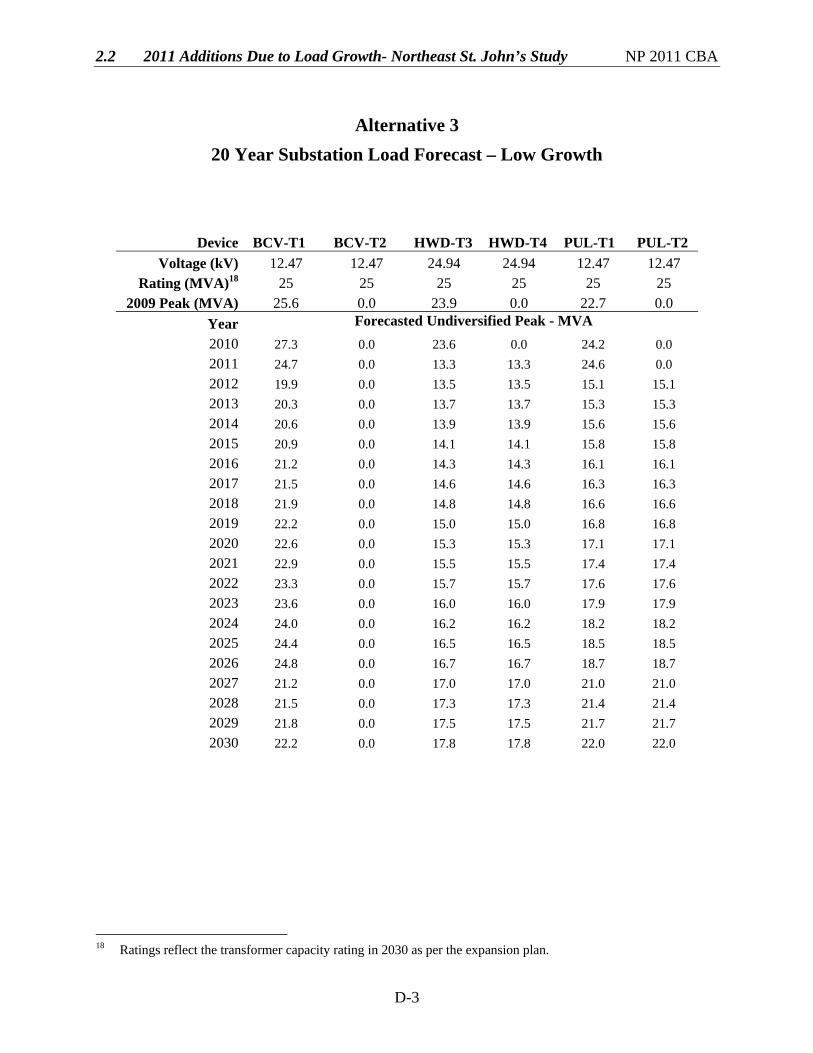
2.2 2011 Additions Due to Load Growth- Northeast St. John’s Study NP 2011 CBA
D-3
Alternative 3
20 Year Substation Load Forecast – Low Growth
18 Ratings reflect the transformer capacity rating in 2030 as per the expansion plan.
Device BCV-T1 BCV-T2 HWD-T3 HWD-T4 PUL-T1 PUL-T2 Voltage (kV) 12.47 12.47 24.94 24.94 12.47 12.47
Rating (MVA)18 25 25 25 25 25 25 2009 Peak (MVA) 25.6 0.0 23.9 0.0 22.7 0.0
Year Forecasted Undiversified Peak - MVA 2010 27.3 0.0 23.6 0.0 24.2 0.0 2011 24.7 0.0 13.3 13.3 24.6 0.0 2012 19.9 0.0 13.5 13.5 15.1 15.1 2013 20.3 0.0 13.7 13.7 15.3 15.3 2014 20.6 0.0 13.9 13.9 15.6 15.6 2015 20.9 0.0 14.1 14.1 15.8 15.8 2016 21.2 0.0 14.3 14.3 16.1 16.1 2017 21.5 0.0 14.6 14.6 16.3 16.3 2018 21.9 0.0 14.8 14.8 16.6 16.6 2019 22.2 0.0 15.0 15.0 16.8 16.8 2020 22.6 0.0 15.3 15.3 17.1 17.1 2021 22.9 0.0 15.5 15.5 17.4 17.4 2022 23.3 0.0 15.7 15.7 17.6 17.6 2023 23.6 0.0 16.0 16.0 17.9 17.9 2024 24.0 0.0 16.2 16.2 18.2 18.2 2025 24.4 0.0 16.5 16.5 18.5 18.5 2026 24.8 0.0 16.7 16.7 18.7 18.7 2027 21.2 0.0 17.0 17.0 21.0 21.0 2028 21.5 0.0 17.3 17.3 21.4 21.4 2029 21.8 0.0 17.5 17.5 21.7 21.7 2030 22.2 0.0 17.8 17.8 22.0 22.0
2.3 2011 PCB Rerizoval Strategy NP 201 1 CBA
2011 PCB Removal Strategy
June 2010
Prepared by:
Peter Feehan, P.Eng.

2.3 2011 PCB Removal Strategy NP 2011 CBA
i
Table of Contents
Page 1.0 Introduction ....................................................................................................................... 1 2.0 PCB Equipment Remediation Strategy ............................................................................. 2 2.1 Power Transformers .............................................................................................. 2 2.2 Bulk Oil Circuit Breakers ..................................................................................... 4 2.3 Potential and Current Transformers ...................................................................... 6 2.4 Metering Tanks ..................................................................................................... 7 2.5 Station Service Transformers ................................................................................ 7 3.0 Project Cost ....................................................................................................................... 7 4.0 Concluding ........................................................................................................................ 8 Appendix A: Extension of End-of-Use Date for Equipment and Liquids Containing PCBs
2.3 2011 PCB Removal Strategy NP 2011 CBA
1
1.0 Introduction In September, 2008 the Canadian Environment Protection Act was amended by the Government of Canada with the PCB Regulations coming into effect and the repealing of The Chlorobiphenyls Regulations and the Storage of PCB Material Regulations. The PCB Regulations (“the Regulations”) came into effect for the purpose of minimizing risks posed by polychlorinated biphenyls (“PCBs”) and accelerating the elimination of PCBs from electrical equipment in Canada.1 Section 16 (1) of the Regulations establishes end-of–use dates for PCB contaminated equipment based on: PCB concentration, equipment type and location. Certain equipment such as power transformers, circuit breakers, reclosers, pad-mounted transformers, current transformers, potential transformers, and bushings with a PCB concentration of 500 mg/kg or more must be removed from service by December 31, 2009. The Regulations permit an extension to the deadline until December 31, 2014, based on approval from the Minister of Environment.2 The Company sought and was granted an end-of-use extension to December 31, 2014 for all bushings and instrument transformers where the PCB concentrations are unknown or at 500 mg/kg or more as allowed under Section 17(2) of the Regulations.3 Prior to the enactment of the new regulations, Canadian electric utilities were working towards removing from service equipment having a PCB concentration level of 500 mg/kg or more prior to December 31, 2025. This schedule was the result of the 2006 publication by Environment Canada in the Canada Gazette, Part 1, Section 18(c) which stated “A person may continue to use, until December 31, 2025……current transformers, potential transformers, circuit breakers, reclosers and bushings that are located at an electrical generation, transmission or distribution facility”. Thus Newfoundland Power and other Canadian utilities planned to phase-out these types of PCB contaminated equipment by the 2025 deadline. The schedule for testing and replacement of bushings and instrument transformers presented in this report was developed to meet the December 31, 2014 deadline. The Company considers this schedule to be very aggressive. In many instances testing and remedial work will require substation outages which will interrupt electricity service to customers, and will create resource challenges with respect to the Company’s other capital work. In light of these issues Newfoundland Power and other utilities have expressed their concern over the 2014 deadline to Environment Canada and is working with the Canadian Electricity Association (“CEA”) to reinstate the original 2025 date. 1 In the Canada Gazette, Part 1 published in November 2006, Environment Canada states that the purpose of the
proposed regulations was to improve the protection of Canada’s environment and the health of Canadians and as well, to implement Canada’s national and international commitments on the use, storage and elimination of PCBs.
2 The deadline and extension requirement also apply to the equipment listed above with a PCB concentration of 50 mg/kg or more that is located in sensitive locations. In addition, the above listed equipment with PCB concentrations of 50 mg/kg or more (including pole-top electrical transformers) must be removed from service by December 31, 2025.
3 This is the only equipment for which Newfoundland Power requires the end-of-use date extension. All other equipment such as pole mounted transformers, power transformers and breakers have been confirmed to be less than 500 mg/kg or less than 50 mg/kg in sensitive locations. The end-of-use date extension is included in Appendix A.
2.3 2011 PCB Removal Strategy NP 2011 CBA
2
2.0 PCB Equipment Remediation Strategy Newfoundland Power’s end-of-use date extension application (“the Extension Application”), as approved by Environment Canada, identified a total of 429 pieces of equipment which require PCB testing and possible remediation. This included 161 power transformers, 186 circuit breakers, 56 potential transformers, 12 current transformers, 6 metering tanks and 8 station service transformers. A total of 2,330 bushings are associated with this equipment. The PCB concentration of these items is unknown.4
Newfoundland Power will conduct PCB testing and, if required, replace any bushings and instrument transformers with a PCB concentration at 500 mg/kg or more to meet the December 31, 2014 deadline.
The strategy is comprised of two parts:
• Part 1 - Test all of the equipment identified to determine actual PCB concentration or to identify which pieces of equipment cannot be tested (for example hermetically sealed oil filled bushings).
• Part 2 - Replace all equipment that either cannot be tested or has a PCB concentration of 500 mg/kg or more. Equipment that cannot be tested will have to be replaced as the level of PCB contamination cannot be determined.
The remediation strategy for each equipment category is discussed in the sections to follow. 2.1 Power Transformers The average age of the 161 power transformers identified in the Extension Application is approximately 40 years. Over 1,200 transformer bushings were listed in the Extension Application that was approved by Environment Canada.5 The remediation strategy for power transformers will require the replacement of the transformer bushings for units that test at 500 mg/kg or more. Replacement of the oil contained within the bushings is not an option as the majority of the PCB contaminated oil in a bushing is contained in the bushing’s paper, which cannot be replaced on site. Due to the high replacement cost of power transformers and their relatively long life, the remediation strategy for power transformer bushings will be to test individual bushings and order replacements for units that test at 500 mg/kg or more.6
4 Equipment that was built since January 1st, 1986 was deemed to be free of PCB contamination based on a
review of Newfoundland Power’s records. Consequently all of the equipment in question is twenty-five years old or older.
5 This list has been reduced to approximately 1,100 units by identifying specific types of bushings that are not oil filled and therefore are not subject to PCB contamination.
6 There is a six month lead time required to procure new power transformer bushings.

2.3 2011 PCB Removal Strategy NP 2011 CBA
3
Figure 1 shows the location of the bushings at the top of the power transformer tank.
Figure 1 – Power Transformer Bushings
In situations with one or more of a transformer’s bushings test at 500 mg/kg or more, all bushings that test above 50 mg/kg will also be replaced. While bushings that test between 50 mg/kg and 500 mg/kg can remain in service until 2025, it is cost effective to replace all bushings during the one power transformer outage, especially in situations where installing a portable substation is required. Approximately half of the transformer bushings can be tested and remediated without incurring customer outages.7 The other half will require customer outages to allow testing to be completed. It is estimated that there are 63 transformer locations where the portable substations will not be available to maintain electricity service to customers while testing of the transformer bushings is completed. Each of these 63 transformers will require a four hour customer outage to complete the testing. Where practical, the Company will schedule bushing testing and remediation to the transformer’s normal maintenance schedule. However, because of the requirement to complete all testing and remediation before the 2014 deadline, only one third of the transformer bushings will be tested during the normal maintenance cycle. All testing and remediation work required to meet the 2014 deadline that is completed outside of the normal maintenance schedule will be part of the PCB removal capital project. To date, the Company has very few actual PCB test results for power transformer bushings. Until the Company accumulates a reasonable sample of its own test data a failure rate will have 7 In some locations customer load can be transferred to adjacent substations, or there are multiple transformers in
the same substation servicing customers. In these situations the testing can be completed without incurring a customer outage.
Transformer Bushings
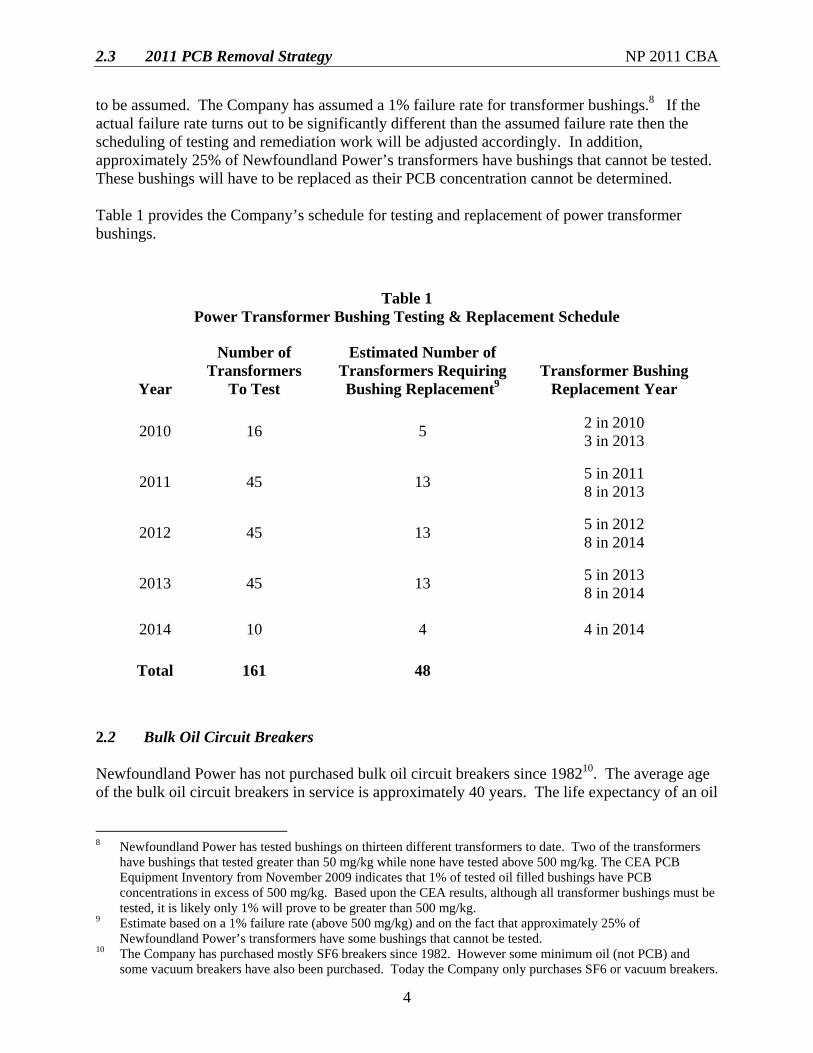
2.3 2011 PCB Removal Strategy NP 2011 CBA
4
to be assumed. The Company has assumed a 1% failure rate for transformer bushings.8 If the actual failure rate turns out to be significantly different than the assumed failure rate then the scheduling of testing and remediation work will be adjusted accordingly. In addition, approximately 25% of Newfoundland Power’s transformers have bushings that cannot be tested. These bushings will have to be replaced as their PCB concentration cannot be determined. Table 1 provides the Company’s schedule for testing and replacement of power transformer bushings.
Table 1 Power Transformer Bushing Testing & Replacement Schedule
Year
Number of Transformers
To Test
Estimated Number of Transformers Requiring Bushing Replacement9
Transformer Bushing Replacement Year
2010 16 5 2 in 2010 3 in 2013
2011 45 13 5 in 2011 8 in 2013
2012 45 13 5 in 2012 8 in 2014
2013 45 13 5 in 2013 8 in 2014
2014 10 4 4 in 2014
Total 161 48
2.2 Bulk Oil Circuit Breakers Newfoundland Power has not purchased bulk oil circuit breakers since 198210. The average age of the bulk oil circuit breakers in service is approximately 40 years. The life expectancy of an oil
8 Newfoundland Power has tested bushings on thirteen different transformers to date. Two of the transformers
have bushings that tested greater than 50 mg/kg while none have tested above 500 mg/kg. The CEA PCB Equipment Inventory from November 2009 indicates that 1% of tested oil filled bushings have PCB concentrations in excess of 500 mg/kg. Based upon the CEA results, although all transformer bushings must be tested, it is likely only 1% will prove to be greater than 500 mg/kg.
9 Estimate based on a 1% failure rate (above 500 mg/kg) and on the fact that approximately 25% of Newfoundland Power’s transformers have some bushings that cannot be tested.
10 The Company has purchased mostly SF6 breakers since 1982. However some minimum oil (not PCB) and some vacuum breakers have also been purchased. Today the Company only purchases SF6 or vacuum breakers.

2.3 2011 PCB Removal Strategy NP 2011 CBA
5
circuit breaker varies; however, based on experience an average life span of 38 years is reasonable. Whenever one breaker bushing tests at 500 mg/kg or more then it is likely all 6 bushings on that breaker will have similar PCB content. Replacing all 6 bushings on these breakers would approach the cost of purchasing a new breaker. Therefore, due to their age and the cost of bushing replacement, the complete breaker will be replaced when 1 bushing tests greater than 500 mg/kg.11 Figure 2 shows the location of the bushings at the top of the bulk oil circuit breaker tank.
Figure 2 - 66 kV Bulk Oil Breaker
Where practical, the Company will schedule bushing testing and remediation to the breaker’s normal maintenance schedule. However, because of the requirement to complete testing and remediation before the 2014 deadline, only one third of the breaker bushings will be tested during the normal maintenance cycle. All testing and remediation work required to meet the 2014 deadline that is completed outside of the normal maintenance schedule will be part of the PCB removal capital project.
11 The Company anticipates that the majority of breaker bushings can be tested. However, any breakers with
bushings that cannot be tested will also be replaced as the PCB concentration cannot be determined.
Breaker Bushings

2.3 2011 PCB Removal Strategy NP 2011 CBA
6
Table 2 provides the Company’s schedule for testing and replacement of circuit breaker bushings.
Table 2 Circuit Breaker Bushing Testing & Replacement Schedule
Testing Year
Number of Breakers To
Test
Estimated Number of Breakers Requiring
Replacement 12 Breaker Bushing
Replacement Year
2010 12 1 2012
2011 85 8 2012
2012 85 8 2013
2013 4 1 2014
2014 0 0 -
Total 186 18
Approximately 95% of the breakers can be tested and remediated without incurring customer outages. The remaining 5% will require customer outages to allow testing to be completed. 13 To minimize the total number of customer outages required, remediation of the latter group of breakers will be completed at the same time as the testing for the transformer bushings is completed. 2.3 Potential and Current Transformers Potential and current transformers are typically hermetically sealed therefore they cannot be tested for PCB concentrations. The units with sampling ports will be tested, and those that test at 500 mg/kg or more will be replaced. All units that cannot be tested will be replaced with new units. Approximately 60% of the Company’s potential transformers (“PTs”) and 50% of the current transformers (“CTs”) can be tested and remediated without a customer outage. The remainder of the units will require customer outages to test. Replacement of these units will also require outages or the installation of a portable substation if available in order to complete the replacements.
12 Newfoundland Power has completed testing for the bushings on only 11 breakers. As a result there is little
empirical data on which to base an estimated failure rate. For the purpose of preparing a budgetary estimate it is assumed that a minimum of 1 breaker will require replacement during a year when testing is undertaken. A maximum failure rate of 10% is assumed for any year in which testing is completed.
13 Approximately 6 locations.
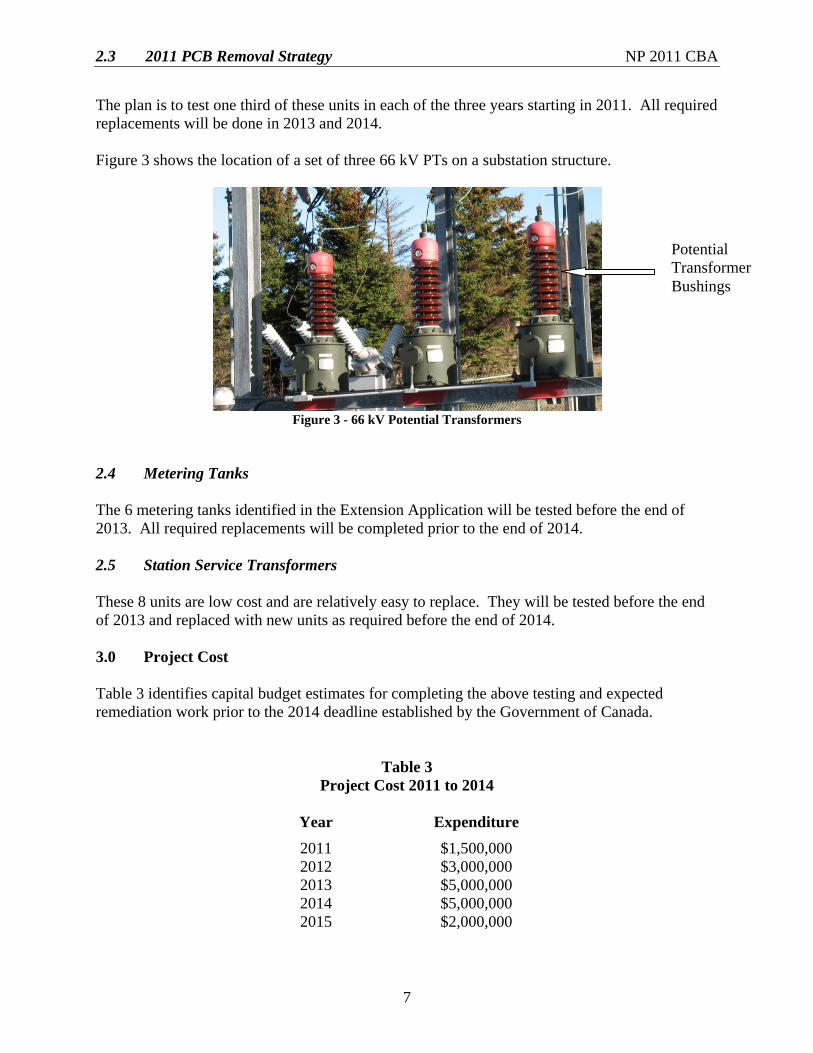
2.3 2011 PCB Removal Strategy NP 2011 CBA
7
The plan is to test one third of these units in each of the three years starting in 2011. All required replacements will be done in 2013 and 2014. Figure 3 shows the location of a set of three 66 kV PTs on a substation structure.
Figure 3 - 66 kV Potential Transformers
2.4 Metering Tanks The 6 metering tanks identified in the Extension Application will be tested before the end of 2013. All required replacements will be completed prior to the end of 2014. 2.5 Station Service Transformers These 8 units are low cost and are relatively easy to replace. They will be tested before the end of 2013 and replaced with new units as required before the end of 2014. 3.0 Project Cost Table 3 identifies capital budget estimates for completing the above testing and expected remediation work prior to the 2014 deadline established by the Government of Canada.
Table 3 Project Cost 2011 to 2014
Year Expenditure 2011 $1,500,000 2012 $3,000,000 2013 $5,000,000 2014 $5,000,000 2015 $2,000,000
Potential Transformer Bushings
2.3 2011 PCB Removal Strategy NP 2011 CBA
8
The estimated expenditures include the work outlined in Tables 1 and 2 of section 2.0, including testing and replacement costs. Based on the limited data available from the manufacturers or testing programs completed by other utilities, several assumptions were made in developing the cost estimates for this strategy. As a result the actual expenditure in future years will vary depending upon the accuracy of the assumptions used to create the cost estimates. As more data is collected in 2010, 2011 and 2012 the full implications and cost of meeting the requirements of the Regulations will become better defined. 4.0 Concluding Replacing equipment with a PCB concentration that is either unknown or at 500mg/kg or more, by the 2014 deadline will be extremely difficult for Newfoundland Power and other Canadian electric utilities. On May 11, 2010 the Canadian Electricity Association (“CEA”) wrote to Environment Canada requesting that Canadian utilities be afforded the appropriate time to ensure proper management of PCB contaminated equipment in an economically feasible manner. The CEA has requested that the Regulations be amended to ascribe bushings and instrument transformers an end-of-use date of 2025. If the CEA amendment is accepted, and the deadline for dealing with the equipment is extended until 2025, the PCB phase-out can be completed over a 15 year period (2011-2025) compared to a 4 year period (2011-2014). This longer timeframe would put the Company in a better position to meet Environment Canada’s regulatory requirements without dramatically impacting the Company’s annual capital budget expenditures. The current legislation also requires other equipment such as pole-top transformers with a PCB concentration of 50 mg/kg or more be removed from the system by the end of 2025. The implication is that expenditures on PCB remediation will likely continue until 2025. The work completed over the next couple of years will allow clearer identification of the future remediation that will be required to meet the PCB Regulation. This project as presented is required to allow Newfoundland Power to meet its obligations as stated in the Extension Application and subsequent approval by Environment Canada.

2.3 2011 PCB Removal Strategy NP 2011 CBA
Appendix A
Extension of End-of-Use Date for Equipment and Liquids Containing PCBs