Embed Size (px)
Citation preview

U.S. Fish and Wildlife Service and U.S. Census Bureau 2011 National Survey of Fishing, Hunting, and Wildlife-Associated Recreation 1
Bait
U.S. Fish & Wildlife Service
2011 National Survey of Fishing, Hunting, and Wildlife-AssociatedRecreation


Bait
FHW/11-NAT (RV) Revised February 2014
2011 National Survey of Fishing, Hunting, and
Wildlife-Associated Recreation
U.S. Department of the Interior Sally Jewell, Secretary
U.S. Fish and Wildlife Service Dan Ashe,Director
U.S. Department of CommercePenny Pritzker,Secretary
Economics and Statistics AdministrationMark Doms,Under Secretary for Economic Affairs
U.S. CENSUS BUREAUJohn H. Thompson,Director

Economics and Statistics AdministrationMark Doms, Under Secretary for Economic Affairs
U.S. Department of the Interior Sally Jewell, Secretary
U.S. CENSUS BUREAU John H. Thompson,Director
U.S. Fish and Wildlife Service Dan Ashe,Director
Wildlife and Sport Fish Restoration Hannibal Bolton, Assistant Director
The U.S. Department of the Interior protects and manages the Nation’s natural resources and cultural heritage; provides scientific and other information about those resources; and honors its trust responsi-bilities or special commitments to American Indians, Alaska Natives, and affiliated Island Communities.The mission of the Department’s U.S. Fish and Wildlife Service is working with others to conserve, protect, and enhance fish, wildlife, and their habitats for the continuing benefit of the American people. The Service is responsible for national programs of vital importance to our natural resources, including administration of the Wildlife and Sport Fish Restoration Programs. These two programs provide finan-cial assistance to the States for projects to enhance and protect fish and wildlife resources and to assure their availability to the public for recreational purposes. Multistate grants from these programs fund the National Survey of Fishing, Hunting, and Wildlife-Associated Recreation.
Suggested Citation
U.S. Department of the Interior, U.S. Fish and Wildlife Service, and U.S. Department of Commerce, U.S. Census Bureau. 2011 National Survey of Fishing, Hunting, and Wildlife-Associated Recreation.

U.S. Fish and Wildlife Service and U.S. Census Bureau 2011 National Survey of Fishing, Hunting, and Wildlife-Associated Recreation iii
Contents
List of Tables . . . . . . . . . . . . . . . . . . . . . . . . . . . . . . . . . . . . . . . . . . . . . . . . . . . . . . . . . . . . . . . . . . . . . . . . . . . . . . . . . . . . . . . . ivForeword . . . . . . . . . . . . . . . . . . . . . . . . . . . . . . . . . . . . . . . . . . . . . . . . . . . . . . . . . . . . . . . . . . . . . . . . . . . . . . . . . . . . . . . . . . . viSurvey Background and Method . . . . . . . . . . . . . . . . . . . . . . . . . . . . . . . . . . . . . . . . . . . . . . . . . . . . . . . . . . . . . . . . . . . . . . . .vii
Highlights
Introduction . . . . . . . . . . . . . . . . . . . . . . . . . . . . . . . . . . . . . . . . . . . . . . . . . . . . . . . . . . . . . . . . . . . . . . . . . . . . . . . . . . . . . . . . . . 2Summary . . . . . . . . . . . . . . . . . . . . . . . . . . . . . . . . . . . . . . . . . . . . . . . . . . . . . . . . . . . . . . . . . . . . . . . . . . . . . . . . . . . . . . . . . . . . 4Fishing. . . . . . . . . . . . . . . . . . . . . . . . . . . . . . . . . . . . . . . . . . . . . . . . . . . . . . . . . . . . . . . . . . . . . . . . . . . . . . . . . . . . . . . . . . . . . . 7Hunting . . . . . . . . . . . . . . . . . . . . . . . . . . . . . . . . . . . . . . . . . . . . . . . . . . . . . . . . . . . . . . . . . . . . . . . . . . . . . . . . . . . . . . . . . . . . 21Wildlife Watching . . . . . . . . . . . . . . . . . . . . . . . . . . . . . . . . . . . . . . . . . . . . . . . . . . . . . . . . . . . . . . . . . . . . . . . . . . . . . . . . . . . . 35
Tables
Guide to Statistical Tables . . . . . . . . . . . . . . . . . . . . . . . . . . . . . . . . . . . . . . . . . . . . . . . . . . . . . . . . . . . . . . . . . . . . . . . . . . . . . . 56Fishing and Hunting Tables . . . . . . . . . . . . . . . . . . . . . . . . . . . . . . . . . . . . . . . . . . . . . . . . . . . . . . . . . . . . . . . . . . . . . . . . . . . . 57Wildlife-Watching Tables . . . . . . . . . . . . . . . . . . . . . . . . . . . . . . . . . . . . . . . . . . . . . . . . . . . . . . . . . . . . . . . . . . . . . . . . . . . . . . 85State Tables . . . . . . . . . . . . . . . . . . . . . . . . . . . . . . . . . . . . . . . . . . . . . . . . . . . . . . . . . . . . . . . . . . . . . . . . . . . . . . . . . . . . . . . . . 94
Appendixes
A. Definitions . . . . . . . . . . . . . . . . . . . . . . . . . . . . . . . . . . . . . . . . . . . . . . . . . . . . . . . . . . . . . . . . . . . . . . . . . . . . . . . . . . . . . 116B. 2010 Participation of 6- to 15-Year-Olds and Historical Participation of Sportspersons: Data From Screening Interviews . . . . . . . . . . . . . . . . . . . . . . . . . . . . . . . . . . . . . . . . . . . . . . . . . . . . . . . . . . . . . . . . . . . 120C. Significant Methodological Changes From Previous Surveys and Regional Trends . . . . . . . . . . . . . . . . . . . . . . . . . . . . 132D. Sample Design and Statistical Accuracy . . . . . . . . . . . . . . . . . . . . . . . . . . . . . . . . . . . . . . . . . . . . . . . . . . . . . . . . . . . . . . 144

iv 2011 National Survey of Fishing, Hunting, and Wildlife-Associated Recreation U.S. Fish and Wildlife Service and U.S. Census Bureau
List of Tables
Fishing and Hunting
1. Anglers and Hunters 16 Years Old and Older, Days of Participation, and Trips by Type of Fishing and Hunting: 2011 . . . . . . . . . . . . . . . . . . . . . . . . . . . . . . . . . . . . . . . . . . . . . . . . . . . . . . . . . . . . . . . . . . . . . . . . . . . 572. Anglers, Trips, and Days of Fishing by Type of Fishing: 2011 . . . . . . . . . . . . . . . . . . . . . . . . . . . . . . . . . . . . . . . . . . 573. Freshwater Anglers and Days of Fishing by Type of Fish: 2011 . . . . . . . . . . . . . . . . . . . . . . . . . . . . . . . . . . . . . . . . . 584. Great Lakes Anglers and Days of Fishing by Type of Fish: 2011 . . . . . . . . . . . . . . . . . . . . . . . . . . . . . . . . . . . . . . . . 585. Saltwater Anglers and Days of Fishing by Type of Fish: 2011 . . . . . . . . . . . . . . . . . . . . . . . . . . . . . . . . . . . . . . . . . . 596. Hunters, Trips, and Days of Hunting by Type of Hunting: 2011 . . . . . . . . . . . . . . . . . . . . . . . . . . . . . . . . . . . . . . . . . 597. Hunters and Days of Hunting by Type of Game: 2011 . . . . . . . . . . . . . . . . . . . . . . . . . . . . . . . . . . . . . . . . . . . . . . . . 608. Selected Characteristics of Anglers and Hunters: 2011 . . . . . . . . . . . . . . . . . . . . . . . . . . . . . . . . . . . . . . . . . . . . . . . . 619. Selected Characteristics of Anglers by Type of Fishing: 2011 . . . . . . . . . . . . . . . . . . . . . . . . . . . . . . . . . . . . . . . . . . 6310. Selected Characteristics of Hunters by Type of Hunting: 2011 . . . . . . . . . . . . . . . . . . . . . . . . . . . . . . . . . . . . . . . . . . 6511. Summary of Expenditures for Fishing and Hunting: 2011 . . . . . . . . . . . . . . . . . . . . . . . . . . . . . . . . . . . . . . . . . . . . . . 6712. Expenditures for Fishing: 2011 . . . . . . . . . . . . . . . . . . . . . . . . . . . . . . . . . . . . . . . . . . . . . . . . . . . . . . . . . . . . . . . . . . 6813. Trip and Equipment Expenditures for Freshwater Fishing: 2011 . . . . . . . . . . . . . . . . . . . . . . . . . . . . . . . . . . . . . . . . 6914. Trip and Equipment Expenditures for Freshwater Fishing, Except Great Lakes: 2011 . . . . . . . . . . . . . . . . . . . . . . . 7015. Trip and Equipment Expenditures for Great Lakes Fishing: 2011 . . . . . . . . . . . . . . . . . . . . . . . . . . . . . . . . . . . . . . . . 7116. Trip and Equipment Expenditures for Saltwater Fishing: 2011 . . . . . . . . . . . . . . . . . . . . . . . . . . . . . . . . . . . . . . . . . . 7217. Expenditures for Hunting: 2011 . . . . . . . . . . . . . . . . . . . . . . . . . . . . . . . . . . . . . . . . . . . . . . . . . . . . . . . . . . . . . . . . . . 7318. Trip and Equipment Expenditures for Big Game Hunting: 2011 . . . . . . . . . . . . . . . . . . . . . . . . . . . . . . . . . . . . . . . . 7419. Trip and Equipment Expenditures for Small Game Hunting: 2011 . . . . . . . . . . . . . . . . . . . . . . . . . . . . . . . . . . . . . . . 7520. Trip and Equipment Expenditures for Migratory Bird Hunting: 2011 . . . . . . . . . . . . . . . . . . . . . . . . . . . . . . . . . . . . 7621. Trip and Equipment Expenditures for Hunting Other Animals: 2011 . . . . . . . . . . . . . . . . . . . . . . . . . . . . . . . . . . . . . 7722. Special Equipment Expenditures for Fishing and Hunting: 2011 . . . . . . . . . . . . . . . . . . . . . . . . . . . . . . . . . . . . . . . . 7823. Anglers and Hunters Who Purchased Licenses or Were Exempt: 2011 . . . . . . . . . . . . . . . . . . . . . . . . . . . . . . . . . . . . 7824. Selected Characteristics of Anglers and Hunters Who Purchased Licenses: 2011. . . . . . . . . . . . . . . . . . . . . . . . . . . . 7925. Freshwater Anglers and Days of Fishing by Type of Water: 2011 . . . . . . . . . . . . . . . . . . . . . . . . . . . . . . . . . . . . . . . . 8026. Great Lakes Anglers and Days of Fishing by Great Lake: 2011 . . . . . . . . . . . . . . . . . . . . . . . . . . . . . . . . . . . . . . . . . 8027. Hunters and Days of Hunting on Public and Private Land by Type of Hunting: 2011 . . . . . . . . . . . . . . . . . . . . . . . . 8028. Hunters and Days of Hunting on Public Land by Selected Characteristic: 2011 . . . . . . . . . . . . . . . . . . . . . . . . . . . . . 8129. Hunters and Days of Hunting on Private Land by Selected Characteristic: 2011 . . . . . . . . . . . . . . . . . . . . . . . . . . . . 8230. Anglers Fishing From Boats and Days of Participation by Type of Fishing: 2011 . . . . . . . . . . . . . . . . . . . . . . . . . . . 8331. Participation in Ice Fishing and Fly-Fishing: 2011 . . . . . . . . . . . . . . . . . . . . . . . . . . . . . . . . . . . . . . . . . . . . . . . . . . . 8332. Hunters Using Bows and Arrows, Muzzleloaders, or Other Firearms: 2011 . . . . . . . . . . . . . . . . . . . . . . . . . . . . . . . . 8333. Hunters Preparing for Hunting by Target Shooting: 2011 . . . . . . . . . . . . . . . . . . . . . . . . . . . . . . . . . . . . . . . . . . . . . . 8434. Land Owned or Leased for the Primary Purpose of Fishing or Hunting: 2011 . . . . . . . . . . . . . . . . . . . . . . . . . . . . . . 84
U.S. Fish and Wildlife Service and U.S. Census Bureau 2011 National Survey of Fishing, Hunting, and Wildlife-Associated Recreation v
Wildlife Watching
35. Wildlife-Watching Participants by Type of Activity: 2011 . . . . . . . . . . . . . . . . . . . . . . . . . . . . . . . . . . . . . . . . . . . . . 8536. Participants, Area Visited, Trips, and Days of Participation in Wildlife Watching Away From Home: 2011 . . . . . . . 8537. Participation in Wildlife-Watching Activities Around the Home: 2011 . . . . . . . . . . . . . . . . . . . . . . . . . . . . . . . . . . . 8638. Away-From-Home Wildlife Watchers by Wildlife Observed, Photographed, or Fed and Place: 2011 . . . . . . . . . . . . 8739. Wild Bird Observers and Days of Observation: 2011 . . . . . . . . . . . . . . . . . . . . . . . . . . . . . . . . . . . . . . . . . . . . . . . . . 8740. Expenditures for Wildlife Watching: 2011 . . . . . . . . . . . . . . . . . . . . . . . . . . . . . . . . . . . . . . . . . . . . . . . . . . . . . . . . . . 8841. Selected Characteristics of Participants in Wildlife-Watching Activities Away From Home: 2011 . . . . . . . . . . . . . . 8942. Selected Characteristics of Participants in Wildlife-Watching Activities Around the Home: 2011 . . . . . . . . . . . . . . 9143. Land Owned or Leased for the Primary Purpose of Wildlife Watching: 2011 . . . . . . . . . . . . . . . . . . . . . . . . . . . . . . 9344. Participation of Wildlife-Watching Participants in Fishing and Hunting: 2011 . . . . . . . . . . . . . . . . . . . . . . . . . . . . . . 9345. Participation of Sportspersons in Wildlife-Watching Activities: 2011 . . . . . . . . . . . . . . . . . . . . . . . . . . . . . . . . . . . . 93
State Wildlife-Related Recreation
46. Participation in Wildlife-Related Recreation by State Residents Both Inside and Outside Their Resident State: 2011 . . . . . . . . . . . . . . . . . . . . . . . . . . . . . . . . . . . . . . . . . . . . . . . . . . . . . . . . . . . . . . . . . . . . . 94
47. Participation in Wildlife-Related Recreation in Each State by Both Residents and Nonresidents of the State: 2011 . . . . . . . . . . . . . . . . . . . . . . . . . . . . . . . . . . . . . . . . . . . . . . . . . . . . . . . . . . . . . . . . . 95
48. Expenditures for Wildlife-Related Recreation by State Where Spending Took Place: 2011 . . . . . . . . . . . . . . . . . . . . 9649. Expenditures for Wildlife-Related Recreation in the United States by State Residents Both Inside and Outside Their Resident State: 2011 . . . . . . . . . . . . . . . . . . . . . . . . . . . . . . . . . . . . . . . . . . . . . . . . . . . . . . . . . . . . . . . . . . . . . . 9850. Anglers and Hunters by Sportsperson’s State of Residence: 2011 . . . . . . . . . . . . . . . . . . . . . . . . . . . . . . . . . . . . . . . . 10051. Anglers and Hunters by State Where Fishing or Hunting Took Place: 2011 . . . . . . . . . . . . . . . . . . . . . . . . . . . . . . . . . 10152. Hunters by Type of Hunting and State Where Hunting Took Place: 2011 . . . . . . . . . . . . . . . . . . . . . . . . . . . . . . . . . . 10253. Days of Hunting by State Where Hunting Took Place and Hunter’s State of Residence: 2011 . . . . . . . . . . . . . . . . . . 10354. Days of Hunting by Type of Hunting and State Where Hunting Took Place: 2011 . . . . . . . . . . . . . . . . . . . . . . . . . . . 10455. Expenditures for Hunting by State Where Spending Took Place: 2011 . . . . . . . . . . . . . . . . . . . . . . . . . . . . . . . . . . . . 10556. Freshwater (Except Great Lakes) Anglers and Days of Fishing by State Where Fishing Took Place: 2011 . . . . . . . . . . . . . . . . . . . . . . . . . . . . . . . . . . . . . . . . . . . . . . . . . . . . . . . . . . . . . . . . . . . . . . . . . . . . . 10657. Great Lakes Anglers and Days of Great Lakes Fishing by State Where Fishing Took Place: 2011 . . . . . . . . . . . . . . . 10758. Saltwater Anglers and Days of Saltwater Fishing by State Where Fishing Took Place: 2011 . . . . . . . . . . . . . . . . . . . 10759. Days of Fishing by State Where Fishing Took Place and Angler’s State of Residence: 2011 . . . . . . . . . . . . . . . . . . . 10860. Expenditures for Fishing by State Where Spending Took Place: 2011 . . . . . . . . . . . . . . . . . . . . . . . . . . . . . . . . . . . . . 10961. Participation in Wildlife-Watching Activities by State Residents Both Inside and Outside Their Resident State: 2011 . . . . . . . . . . . . . . . . . . . . . . . . . . . . . . . . . . . . . . . . . . . . . . . . . . . . . . . . . . . . . . . 11062. Participation in Wildlife-Watching Activities by State Where Activity Took Place: 2011 . . . . . . . . . . . . . . . . . . . . . . 11163. Participation in Away-From-Home Wildlife Watching by State Where Activity Took Place: 2011 . . . . . . . . . . . . . . . 11264. Days of Wildlife Watching Away From Home by State Where Activity Took Place and Participant’s State of Residence: 2011 . . . . . . . . . . . . . . . . . . . . . . . . . . . . . . . . . . . . . . . . . . . . . . . . . . . . . . . . . . . . . 11365. Expenditures for Wildlife-Watching Activities by State Where Spending Took Place: 2011 . . . . . . . . . . . . . . . . . . . . 114

vi 2011 National Survey of Fishing, Hunting, and Wildlife-Associated Recreation U.S. Fish and Wildlife Service and U.S. Census Bureau
Foreword
When I was growing up, it was taken as a matter of faith that kids belonged outside. I grew up with 4 brothers, and during those long, hot Atlanta summers, it was common for our mom to holler, “You boys get outside, and don’t come back ‘til it’s dark.” It never occurred to me or my brothers to do anything else in our spare time but explore the world around us. The truth is, we had little else to do. But those experiences – waking up on frosty mornings and starting the campfire, scanning trees for a shot at a scampering gray squirrel in the dawn light, scouring creek beds for crawdads and other fishing bait, or simply of the fun we had tramping through the forest – shaped who I am, and drew me to a career in conserva-tion.
That’s why I’m excited by this 2011 National Survey of Fishing, Hunting, and Wildlife-Associated Recreation. This report, the 12th in a series that began in 1955, documents a significant resurgence in the number of people embracing America’s Great Outdoors. Hunting participation has increased by 9 percent, while angling participation grew by 11 percent. Nearly 38 percent of Americans participated in wildlife-related recreation, an increase of 2.6 million participants from the 2006 Survey.
In addition, wildlife-related recre-ation is a major driver of the nation’s economy. The 2011 Survey estimates that Americans spent $145 billion on related gear, trips, licenses, land acqui-sition or leases, and other purchases, representing about one percent of the nation’s gross domestic product. This spending creates thousands of jobs, supports countless local communities and provides vital funding for conser-vation.
This year marks the 75th anniversary of the Wildlife and Sport Fish Restora-tion Program, a cornerstone of wildlife conservation in the United States. Through excise taxes on firearms, ammunition, archery and angling equipment, the U.S. Fish and Wildlife Service has distributed over $14 billion for State and territorial wildlife conser-vation programs.
This report would not have been possible without the combined efforts of state wildlife agencies – which provided financial support through the Multi-State Conservation Grant Programs – the Association of Fish and Wildlife Agencies and a number of major national conservation organiza-tions. We also owe our gratitude to the thousands of survey respondents from households across America. Because of you, this Survey is the nation’s definitive wildlife-related recreation database and information source concerning participation and purchases associated with hunting, fishing and other forms of wildlife-associated recreation nationwide.
The Fish and Wildlife Service is dedi-cated to connecting people and families with nature. We are proud to celebrate the good news in this report, and we look forward to continuing progress as we work with the States, and all our partners and the public to help keep recreational fishing, hunting, and wildlife watching growing and going strong.
Dan AsheDirector, U.S. Fish and Wildlife Service

U.S. Fish and Wildlife Service and U.S. Census Bureau 2011 National Survey of Fishing, Hunting, and Wildlife-Associated Recreation vii
Survey Background and Method
The National Survey of Fishing, Hunting, and Wildlife-Associated Recreation (Survey) has been conducted since 1955 and is one of the oldest and most comprehensive continuing recreation surveys. The Survey collects information on the number of anglers, hunters, and wild-life watchers, how often they partici-pate, and how much they spend on their activities in the United States.
Preparations for the 2011 Survey began in 2008 when the Association of Fish and Wildlife Agencies (AFWA) asked the Fish and Wildlife Service to coordinate the twelfth National Survey of wildlife-related recreation. Funding came from the Multistate Conservation Grant Programs, authorized by Wildlife and Sport Fish Restoration Acts, as amended.
Four regional technical committees were set up under the auspices of AFWA to ensure that State fish and wildlife agencies had an opportunity to participate in all phases of survey plan-ning and design. The committees were made up of agency representatives.
We consulted with State and Federal agencies and nongovernmental organizations such as the American Sportfishing Association and National Shooting Sports Foundation to deter-mine survey content. Other sportsper-sons’ organizations and conservation
groups, industry representatives, and researchers also provided valuable advice.
Data collection for the Survey was carried out in two phases by the U.S. Census Bureau. The first phase was the screen which began in April 2011. During the screening phase, the Census Bureau interviewed a sample of 48,600 households nationwide, to determine who in the household had fished, hunted, or wildlife watched in 2010, and who had engaged or planned to engage in those activities in 2011. In most cases, one adult household member provided information for all members. The screen primarily covered 2010 activities while the next, more in-depth phase covered 2011 activities. For more information on the 2010 data, refer to Appendix B.
The second phase of data collection consisted of three detailed interview waves. The first wave began in April 2011 concurrent with the screen, the second in September 2011, and the last in January 2012. Interviews were conducted with samples of likely anglers, hunters, and wildlife watchers who were identified in the initial screening phase. Interviews were conducted primarily by telephone, with in-person interviews for respondents who could not be reached by phone. Respondents in the second survey phase were limited to those who were
at least 16 years old. Each respondent provided information pertaining only to his or her activities and expendi-tures. Sample sizes were designed to provide statistically reliable results at the state level. Altogether, interviews were completed for 11,330 anglers and hunters and 9,329 wildlife watchers. More detailed information on sampling procedures and response rates is found in Appendix D.
Comparability With Previous Surveys
The 2011 Survey’s questions and methodology were similar to those used in the 2006, 2001, 1996, and 1991 Surveys. Therefore, the estimates are comparable.
The methodology for these Surveys differs significantly from the 1955 to 1985 Surveys, so these estimates are not directly comparable to those of earlier surveys. Changes in meth-odology included reducing the recall period over which respondents had to report their activities and expenditures. Previous Surveys used a 12-month recall period which resulted in greater reporting bias. Research found that the amount of activity and expenditures reported in 12-month recall surveys was overestimated in comparison with that reported using shorter recall periods.

Highlights

Highlights

2 2011 National Survey of Fishing, Hunting, and Wildlife-Associated Recreation U.S. Fish and Wildlife Service and U.S. Census Bureau
Introduction
The National Survey of Fishing, Hunting, and Wildlife-Associated Recreation reports results from inter-views with U.S. residents about their fishing, hunting, and wildlife watching. This report focuses on 2011 participa-tion and expenditures of persons 16 years of age and older.
However, in addition to 2011 numbers, we also provide trend information in the Highlights sections and Appendix C of the report. The 2011 numbers reported can be compared with those in the 1991, 1996, 2001, and 2006 Survey reports because they used similar meth-odologies. However, the 2011 estimates should not be directly compared with results from Surveys conducted earlier than 1991 because of changes in meth-odology to improve accuracy.
The report also provides information on participation in wildlife-related recreation in 2010, particularly of persons 6 to 15 years of age. The 2010 information is provided in Appendix B. Information about the scope and coverage of the 2011 Survey can be found in Appendix D. The remainder of this section defines important terms used in the Survey.
Wildlife-Related Recreation
Wildlife-related recreation is fishing, hunting, and wildlife-watching activi-ties. These categories are not mutually exclusive because many individuals participated in more than one activity. Wildlife-related recreation is reported in two major categories: (1) fishing and hunting, and (2) wildlife watching, which includes observing, photo-graphing, and feeding fish or wildlife.
Fishing and Hunting
This Survey reports information about residents of the United States who fished or hunted in 2011, regardless of whether they were licensed. The fishing and hunting sections report information for three groups: (1) sportspersons, (2) anglers, and (3) hunters.
Sportspersons
Sportspersons are those who fished or hunted. Individuals who fished or hunted commercially in 2011 are reported as sportspersons only if they also fished or hunted for recreation. The sportspersons group is composed of the three subgroups shown in the diagram below: (1) those that fished and hunted, (2) those that only fished, and (3) those that only hunted.
The total number of sportspersons is equal to the sum of people who only fished, only hunted, and both hunted and fished. It is not the sum of all anglers and all hunters because those people who both fished and hunted are included in both the angler and hunter population and would be incorrectly counted twice.
Anglers
Anglers are sportspersons who only fished plus those who fished and hunted. Anglers include not only licensed hook and line anglers, but also those who have no license and those who use special methods such as fishing with spears. Three types of fishing are reported: (1) freshwater, excluding the Great Lakes, (2) Great Lakes, and (3) saltwater. Since many anglers participated in more than one type of fishing, the total number of anglers is less than the sum of the three types of fishing.
Hunters
Hunters are sportspersons who only hunted plus those who hunted and fished. Hunters include not only licensed hunters using rifles and shotguns, but also those who have no license and those who engage in hunting with archery equipment, muzzleloaders, other primitive firearms, or pistols or handguns. Four types of hunting are reported: (1) big game, (2) small game, (3) migratory bird, and (4) other animals. Since many hunters partici-pated in more than one type of hunting, the sum of hunters for big game, small game, migratory bird, and other animals exceeds the total number of hunters.
Wildlife Watchers
Since 1980, the National Survey has included information on wildlife-watching activities in addition to fishing and hunting. However, unlike the 1980 and 1985 Surveys, the National Surveys since 1991 have collected data only for those activities where the primary purpose was wildlife
Sportspersons
Anglers Hunters
Fished only
Fishedandhunted
Huntedonly

U.S. Fish and Wildlife Service and U.S. Census Bureau 2011 National Survey of Fishing, Hunting, and Wildlife-Associated Recreation 3
watching (observing, photographing, or feeding wildlife).
The 2011 Survey uses a strict definition of wildlife watching. Participants must either take a “special interest” in wild-life around their homes or take a trip for the “primary purpose” of wildlife watching. Secondary wildlife watching, such as incidentally observing wildlife while pleasure driving, is not included.
Two types of wildlife-watching activity are reported: (1) away-from-home (formerly nonresidential) activities and (2) around-the-home (formerly residen-tial) activities. Because some people participated in more than one type of wildlife watching, the sum of partici-pants in each type will be greater than the total number of wildlife watchers. Only those engaged in activities whose
primary purpose was wildlife watching are included in the Survey. The two types of wildlife-watching activity are defined below.
Away-From-Home
This group includes persons who took trips or outings of at least 1 mile from home for the primary purpose of observing, feeding, or photographing fish and wildlife. Trips to fish or hunt or scout and trips to zoos, circuses, aquar-iums, and museums are not considered wildlife-watching activities.
Around-The-Home
This group includes those who participated within 1 mile of home and involves one or more of the following: (1) closely observing or trying to iden-tify birds or other wildlife; (2) photo-
graphing wildlife; (3) feeding birds or other wildlife; (4) maintaining natural areas of at least 1/4 acre where benefit to wildlife is the primary concern; (5) maintaining plantings (shrubs, agricultural crops, etc.) where benefit to wildlife is the primary concern; or (6) visiting parks and natural areas within 1 mile of home for the primary purpose of observing, feeding, or photographing wildlife.
4 2011 National Survey of Fishing, Hunting, and Wildlife-Associated Recreation U.S. Fish and Wildlife Service and U.S. Census Bureau
Summary
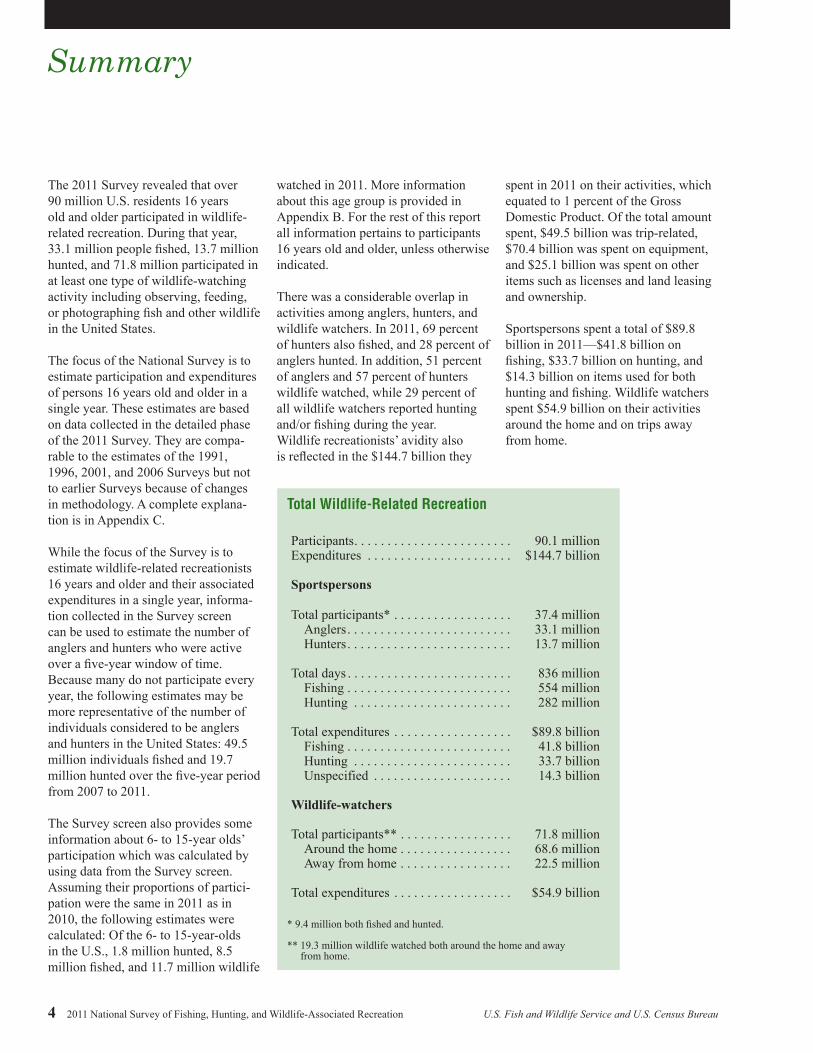
The 2011 Survey revealed that over 90 million U.S. residents 16 years old and older participated in wildlife-related recreation. During that year, 33.1 million people fished, 13.7 million hunted, and 71.8 million participated in at least one type of wildlife-watching activity including observing, feeding, or photographing fish and other wildlife in the United States.
The focus of the National Survey is to estimate participation and expenditures of persons 16 years old and older in a single year. These estimates are based on data collected in the detailed phase of the 2011 Survey. They are compa-rable to the estimates of the 1991, 1996, 2001, and 2006 Surveys but not to earlier Surveys because of changes in methodology. A complete explana-tion is in Appendix C.
While the focus of the Survey is to estimate wildlife-related recreationists 16 years and older and their associated expenditures in a single year, informa-tion collected in the Survey screen can be used to estimate the number of anglers and hunters who were active over a five-year window of time. Because many do not participate every year, the following estimates may be more representative of the number of individuals considered to be anglers and hunters in the United States: 49.5 million individuals fished and 19.7 million hunted over the five-year period from 2007 to 2011.
The Survey screen also provides some information about 6- to 15-year olds’ participation which was calculated by using data from the Survey screen. Assuming their proportions of partici-pation were the same in 2011 as in 2010, the following estimates were calculated: Of the 6- to 15-year-olds in the U.S., 1.8 million hunted, 8.5 million fished, and 11.7 million wildlife
watched in 2011. More information about this age group is provided in Appendix B. For the rest of this report all information pertains to participants 16 years old and older, unless otherwise indicated.
There was a considerable overlap in activities among anglers, hunters, and wildlife watchers. In 2011, 69 percent of hunters also fished, and 28 percent of anglers hunted. In addition, 51 percent of anglers and 57 percent of hunters wildlife watched, while 29 percent of all wildlife watchers reported hunting and/or fishing during the year.Wildlife recreationists’ avidity also is reflected in the $144.7 billion they
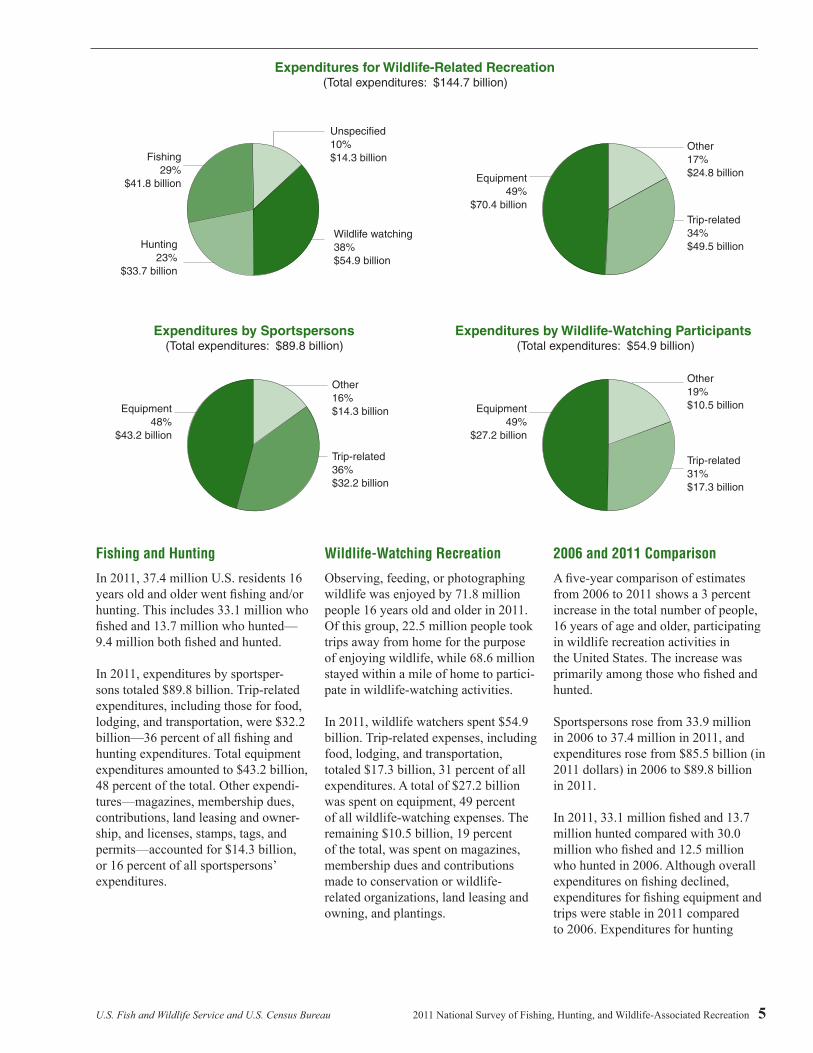
spent in 2011 on their activities, which equated to 1 percent of the Gross Domestic Product. Of the total amount spent, $49.5 billion was trip-related, $70.4 billion was spent on equipment, and $25.1 billion was spent on other items such as licenses and land leasing and ownership.
Sportspersons spent a total of $89.8 billion in 2011—$41.8 billion on fishing, $33.7 billion on hunting, and $14.3 billion on items used for both hunting and fishing. Wildlife watchers spent $54.9 billion on their activities around the home and on trips away from home.
Total Wildlife-Related Recreation
Participants. . . . . . . . . . . . . . . . . . . . . . . .Expenditures . . . . . . . . . . . . . . . . . . . . . .
90.1 million$144.7 billion
Sportspersons
Total participants* . . . . . . . . . . . . . . . . . . 37.4 millionAnglers. . . . . . . . . . . . . . . . . . . . . . . . . 33.1 millionHunters. . . . . . . . . . . . . . . . . . . . . . . . . 13.7 million
Total days . . . . . . . . . . . . . . . . . . . . . . . . . 836 millionFishing . . . . . . . . . . . . . . . . . . . . . . . . . 554 millionHunting . . . . . . . . . . . . . . . . . . . . . . . . 282 million
Total expenditures . . . . . . . . . . . . . . . . . . $89.8 billionFishing . . . . . . . . . . . . . . . . . . . . . . . . . 41.8 billionHunting . . . . . . . . . . . . . . . . . . . . . . . . 33.7 billionUnspecified . . . . . . . . . . . . . . . . . . . . . 14.3 billion
Wildlife-watchers
Total participants** . . . . . . . . . . . . . . . . . 71.8 millionAround the home . . . . . . . . . . . . . . . . . 68.6 millionAway from home . . . . . . . . . . . . . . . . . 22.5 million
Total expenditures . . . . . . . . . . . . . . . . . . $54.9 billion
* 9.4 million both fished and hunted.
** 19.3 million wildlife watched both around the home and away from home.
U.S. Fish and Wildlife Service and U.S. Census Bureau 2011 National Survey of Fishing, Hunting, and Wildlife-Associated Recreation 5
Fishing and Hunting
In 2011, 37.4 million U.S. residents 16 years old and older went fishing and/or hunting. This includes 33.1 million who fished and 13.7 million who hunted—9.4 million both fished and hunted.
In 2011, expenditures by sportsper-sons totaled $89.8 billion. Trip-related expenditures, including those for food, lodging, and transportation, were $32.2 billion—36 percent of all fishing and hunting expenditures. Total equipment expenditures amounted to $43.2 billion, 48 percent of the total. Other expendi-tures—magazines, membership dues, contributions, land leasing and owner-ship, and licenses, stamps, tags, and permits—accounted for $14.3 billion, or 16 percent of all sportspersons’ expenditures.
Wildlife-Watching Recreation
Observing, feeding, or photographing wildlife was enjoyed by 71.8 million people 16 years old and older in 2011. Of this group, 22.5 million people took trips away from home for the purpose of enjoying wildlife, while 68.6 million stayed within a mile of home to partici-pate in wildlife-watching activities.
In 2011, wildlife watchers spent $54.9 billion. Trip-related expenses, including food, lodging, and transportation, totaled $17.3 billion, 31 percent of all expenditures. A total of $27.2 billion was spent on equipment, 49 percent of all wildlife-watching expenses. The remaining $10.5 billion, 19 percent of the total, was spent on magazines, membership dues and contributions made to conservation or wildlife-related organizations, land leasing and owning, and plantings.
2006 and 2011 Comparison
A five-year comparison of estimates from 2006 to 2011 shows a 3 percent increase in the total number of people, 16 years of age and older, participating in wildlife recreation activities in the United States. The increase was primarily among those who fished and hunted.
Sportspersons rose from 33.9 million in 2006 to 37.4 million in 2011, and expenditures rose from $85.5 billion (in 2011 dollars) in 2006 to $89.8 billion in 2011.
In 2011, 33.1 million fished and 13.7 million hunted compared with 30.0 million who fished and 12.5 million who hunted in 2006. Although overall expenditures on fishing declined, expenditures for fishing equipment and trips were stable in 2011 compared to 2006. Expenditures for hunting
Expenditures for Wildlife-Related Recreation (Total expenditures: $144.7 billion)
Unspecified 10% $14.3 billion
Hunting 23%
$33.7 billion
Wildlife watching38%$54.9 billion
Fishing29%
$41.8 billion
Other 17% $24.8 billion
Trip-related 34%$49.5 billion
Equipment49%
$70.4 billion
Expenditures by Sportspersons (Total expenditures: $89.8 billion)
Other 16% $14.3 billion
Trip-related 36% $32.2 billion
Equipment48%
$43.2 billion
Expenditures by Wildlife-Watching Participants (Total expenditures: $54.9 billion)
Other 19% $10.5 billion
Trip-related 31% $17.3 billion
Equipment49%
$27.2 billion

6 2011 National Survey of Fishing, Hunting, and Wildlife-Associated Recreation U.S. Fish and Wildlife Service and U.S. Census Bureau
equipment (firearms, ammunition, archery equipment, etc.) increased by 17 percent and for trips by 40 percent. The increase in sportspersons’ expen-ditures was largely due to trip-related expenses, which went up 18 percent.
Equipment expenditures went down 5 percent. From 2006 to 2011 the number of wildlife watchers and their expenditures did not change significantly.
Fishing 2006–2011 Wildlife-Associated Recreation Comparison of Participants (Numbers in thousands)
2006 2011Number Percent Number Percent
Total wildlife-related recreationists . . . . . . . . . . . . 87,465 100 90,108 100
Total sportspersons . . . . . . . . . . . . . . . . . . . . . . . . . 33,916 39 37,397 42 Anglers . . . . . . . . . . . . . . . . . . . . . . . . . . . . . . . . . . 29,952 34 33,112 37 Hunters. . . . . . . . . . . . . . . . . . . . . . . . . . . . . . . . . . 12,510 14 13,674 15
Total wildlife-watching participants. . . . . . . . . . . . 71,132 81 71,776 80 Around the home . . . . . . . . . . . . . . . . . . . . . . . . . . 67,756 77 68,598 76 Away from home . . . . . . . . . . . . . . . . . . . . . . . . . . 22,977 26 22,496 25
2006–2011 Wildlife-Associated Recreation Comparison of Expenditures (Numbers in billions of 2011 dollars)
2006 2011Number Percent Number Percent
Total, wildlife-related recreation expenditures . . . 136.4 100 144.7 100
Total, fishing and hunting expenditures. . . . . . . . . 85.5 100 89.8 100
Fishing expenditures, total . . . . . . . . . . . . . . . . . . . 47.0 100 41.8 100 Trip-related. . . . . . . . . . . . . . . . . . . . . . . . . . . . . . . 19.9 42 21.8 52 Equipment, total. . . . . . . . . . . . . . . . . . . . . . . . . . . 20.9 45 15.5 37 Fishing equipment . . . . . . . . . . . . . . . . . . . . . . . 5.9 13 6.1 15 Auxiliary equipment. . . . . . . . . . . . . . . . . . . . . . 0.9 2 1.1 3 Special equipment . . . . . . . . . . . . . . . . . . . . . . . 14.1 30 8.3 20 Other . . . . . . . . . . . . . . . . . . . . . . . . . . . . . . . . . . . 6.2 13 4.5 11
Hunting expenditures, total. . . . . . . . . . . . . . . . . . . 25.5 100 33.7 100 Trip-related. . . . . . . . . . . . . . . . . . . . . . . . . . . . . . . 7.5 29 10.4 31 Equipment, total. . . . . . . . . . . . . . . . . . . . . . . . . . . 12.0 47 14.0 41 Hunting equipment . . . . . . . . . . . . . . . . . . . . . . 6.0 24 7.7 23 Auxiliary equipment . . . . . . . . . . . . . . . . . . . . . 1.5 6 1.8 5 Special equipment. . . . . . . . . . . . . . . . . . . . . . . 4.5 17 4.4 13 Other . . . . . . . . . . . . . . . . . . . . . . . . . . . . . . . . . . . 6.1 24 9.3 28
Wildlife-watching expenditures, total . . . . . . . . . . 50.9 100 54.9 100 Trip-related. . . . . . . . . . . . . . . . . . . . . . . . . . . . . . . 14.4 28 17.3 31 Equipment, total. . . . . . . . . . . . . . . . . . . . . . . . . . . 25.9 51 27.2 49 Wildlife-watching equipment . . . . . . . . . . . . . . 11.0 22 11.3 21 Auxiliary equipment . . . . . . . . . . . . . . . . . . . . . 1.2 2 1.6 3 Special equipment. . . . . . . . . . . . . . . . . . . . . . . 13.7 27 14.3 26 Other . . . . . . . . . . . . . . . . . . . . . . . . . . . . . . . . . . . 10.7 21 10.5 19

Fishing
8 2011 National Survey of Fishing, Hunting, and Wildlife-Associated Recreation U.S. Fish and Wildlife Service and U.S. Census Bureau
Fishing Highlights
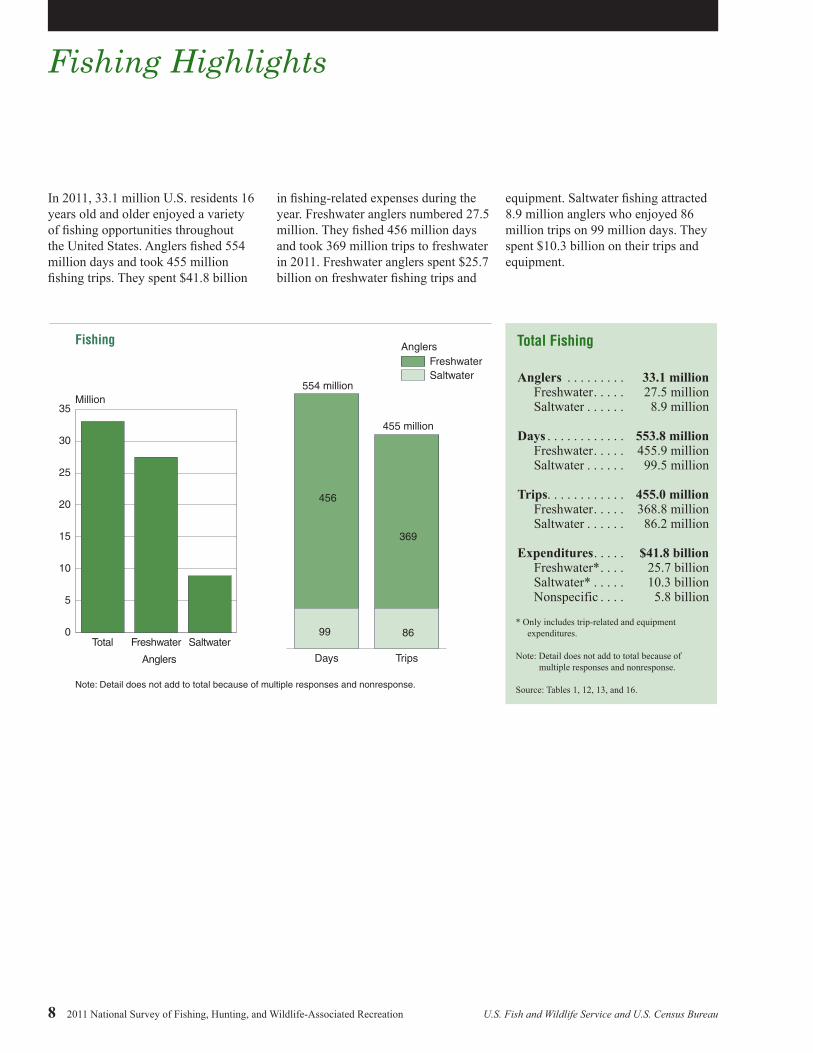
In 2011, 33.1 million U.S. residents 16 years old and older enjoyed a variety of fishing opportunities throughout the United States. Anglers fished 554 million days and took 455 million fishing trips. They spent $41.8 billion
in fishing-related expenses during the year. Freshwater anglers numbered 27.5 million. They fished 456 million days and took 369 million trips to freshwater in 2011. Freshwater anglers spent $25.7 billion on freshwater fishing trips and
equipment. Saltwater fishing attracted 8.9 million anglers who enjoyed 86 million trips on 99 million days. They spent $10.3 billion on their trips and equipment.
Fishing
0
5
10
15
20
25
30
35
SaltwaterFreshwaterTotal
Million
TripsDays
FreshwaterSaltwater
Note: Detail does not add to total because of multiple responses and nonresponse.
554 million
455 million
456
99
369
86
Anglers
Anglers Total Fishing
Anglers . . . . . . . . . 33.1 millionFreshwater . . . . . 27.5 millionSaltwater . . . . . . 8.9 million
Days . . . . . . . . . . . . 553.8 millionFreshwater . . . . . 455.9 millionSaltwater . . . . . . 99.5 million
Trips. . . . . . . . . . . . 455.0 millionFreshwater . . . . . 368.8 millionSaltwater . . . . . . 86.2 million
Expenditures. . . . . $41.8 billionFreshwater* . . . . 25.7 billionSaltwater* . . . . . 10.3 billionNonspecific . . . . 5.8 billion
* Only includes trip-related and equipment expenditures.
Note: Detail does not add to total because of multiple responses and nonresponse.
Source: Tables 1, 12, 13, and 16.

U.S. Fish and Wildlife Service and U.S. Census Bureau 2011 National Survey of Fishing, Hunting, and Wildlife-Associated Recreation 9
Fishing Expenditures
Anglers spent $41.8 billion in 2011 including $21.8 billion on travel-related items—52 percent of all fishing expen-ditures. Food and lodging accounted for $7.7 billion, 35 percent of all trip-related costs. Spending on transporta-tion totaled $6.3 billion, 29 percent of trip-related expenditures. Other trip expenditures such as land use fees, guide fees, equipment rental, boating expenses, and bait cost anglers $7.8 billion—36 percent of all trip expenses.
Fishing equipment expenditures totaled $15.5 billion, 37 percent of all fishing expenditures. Anglers spent $6.1 billion on fishing equipment such as rods, reels, tackle boxes, depth finders, and artificial lures and flies. This amounted to 40 percent of all equipment expenditures. Auxiliary equipment expenditures, which include camping equipment, binoculars, and special fishing clothing, totaled $1.1 billion—7 percent of equipment costs. Expenditures for special equipment such as boats, vans, and cabins were $8.3 billion—53 percent of all equip-ment costs.
Anglers also spent a considerable amount on other fishing-related items, such as land leasing and ownership, membership dues, contributions, licenses, stamps, and permits. Land leasing and ownership spending totaled $3.4 billion, which is 8 percent of all expenditures. Expenditures on maga-zines, books, DVDs, membership dues and contributions, licenses, stamps, tags, and permits were $1.1 billion.
Total Fishing Expenditures
Total fishing expenditures . . . . . . . . . . . . . . . . . . . . . . . . . . $41.8 billion
Total trip-related expenditures . . . . . . . . . . . . . . . . . . . . . . $21.8 billionFood and lodging . . . . . . . . . . . . . . . . . . . . . . . . . . . . . . . . 7.7 billionTransportation . . . . . . . . . . . . . . . . . . . . . . . . . . . . . . . . . . . 6.3 billionOther trip costs . . . . . . . . . . . . . . . . . . . . . . . . . . . . . . . . . . 7.8 billion
Total equipment expenditures . . . . . . . . . . . . . . . . . . . . . . . $15.5 billionFishing equipment . . . . . . . . . . . . . . . . . . . . . . . . . . . . . . . . 6.1 billionAuxiliary equipment . . . . . . . . . . . . . . . . . . . . . . . . . . . . . . 1.1 billionSpecial equipment . . . . . . . . . . . . . . . . . . . . . . . . . . . . . . . . 8.3 billion
Total other fishing expenditures . . . . . . . . . . . . . . . . . . . . . $4.5 billionMagazines, books, DVDs . . . . . . . . . . . . . . . . . . . . . . . . . . 0.1 billionMembership dues and contributions . . . . . . . . . . . . . . . . . . 0.3 billionLand leasing and ownership . . . . . . . . . . . . . . . . . . . . . . . . 3.4 billionLicenses, stamps, tags, and permits . . . . . . . . . . . . . . . . . . 0.6 billion
Source: Table 12.
Fishing Expenditures by Type of Fishing (Total expenditures: $41.8 billion)
Freshwater*61% $25.7 billion
Saltwater*25%
$10.3 billion
Nonspecific14%
$5.8 billion
* Only includes trip-related and equipment expenditures.
Percent of Total Fishing Expenditures (Total expenditures: $41.8 billion)
Other11%
Equipment 37%
Trip-related52%
10 2011 National Survey of Fishing, Hunting, and Wildlife-Associated Recreation U.S. Fish and Wildlife Service and U.S. Census Bureau
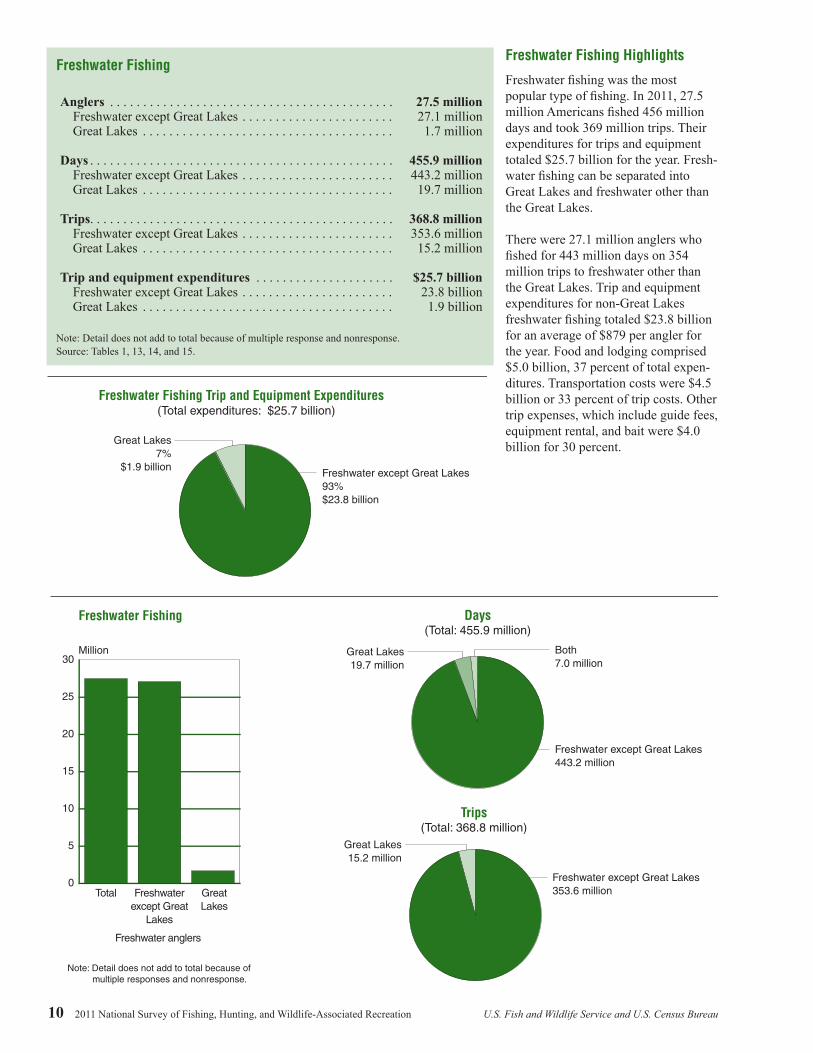
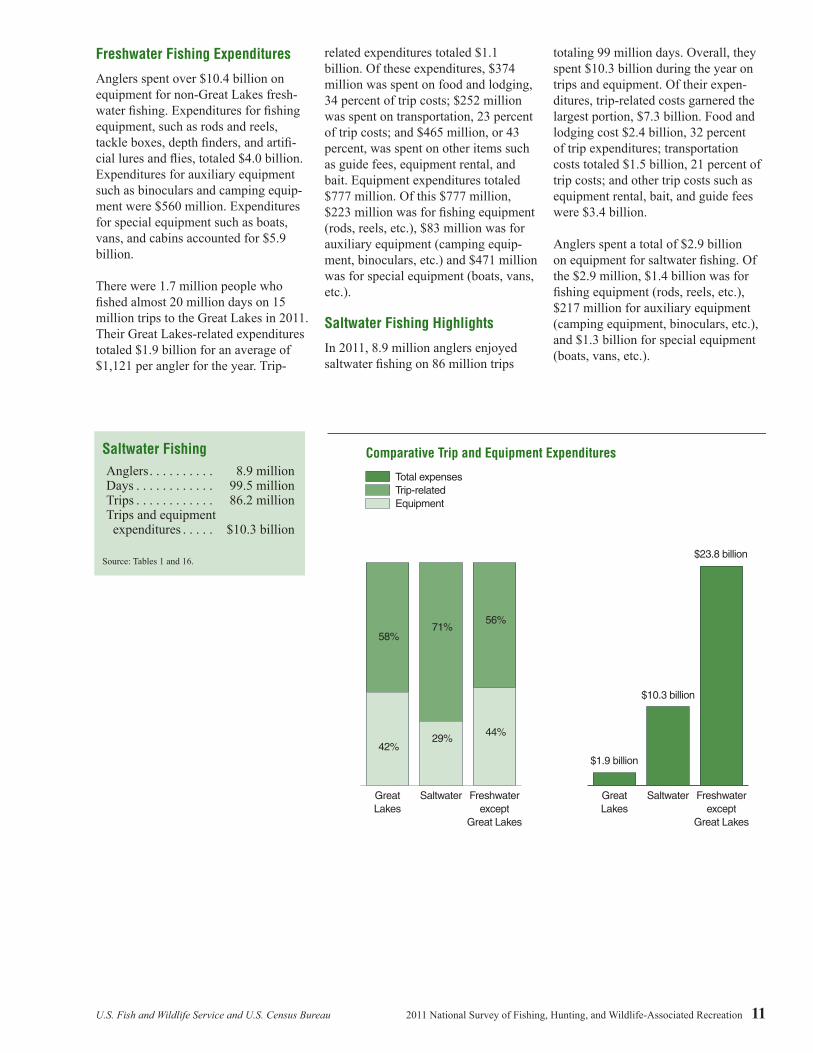
Freshwater Fishing Highlights
Freshwater fishing was the most popular type of fishing. In 2011, 27.5 million Americans fished 456 million days and took 369 million trips. Their expenditures for trips and equipment totaled $25.7 billion for the year. Fresh-water fishing can be separated into Great Lakes and freshwater other than the Great Lakes.
There were 27.1 million anglers who fished for 443 million days on 354 million trips to freshwater other than the Great Lakes. Trip and equipment expenditures for non-Great Lakes freshwater fishing totaled $23.8 billion for an average of $879 per angler for the year. Food and lodging comprised $5.0 billion, 37 percent of total expen-ditures. Transportation costs were $4.5 billion or 33 percent of trip costs. Other trip expenses, which include guide fees, equipment rental, and bait were $4.0 billion for 30 percent.
Freshwater Fishing Trip and Equipment Expenditures (Total expenditures: $25.7 billion)
Freshwater except Great Lakes 93%$23.8 billion
Great Lakes7%
$1.9 billion
Freshwater Fishing
0
5
10
15
20
25
30
GreatLakes
Freshwaterexcept Great
Lakes
Total
Million
Note: Detail does not add to total because of multiple responses and nonresponse.
Freshwater anglers
Days(Total: 455.9 million)
Freshwater except Great Lakes 443.2 million
Great Lakes19.7 million
Both7.0 million
Trips(Total: 368.8 million)
Freshwater except Great Lakes 353.6 million
Great Lakes15.2 million
Freshwater Fishing
Anglers . . . . . . . . . . . . . . . . . . . . . . . . . . . . . . . . . . . . . . . . . . . 27.5 millionFreshwater except Great Lakes . . . . . . . . . . . . . . . . . . . . . . . 27.1 millionGreat Lakes . . . . . . . . . . . . . . . . . . . . . . . . . . . . . . . . . . . . . . 1.7 million
Days . . . . . . . . . . . . . . . . . . . . . . . . . . . . . . . . . . . . . . . . . . . . . . 455.9 millionFreshwater except Great Lakes . . . . . . . . . . . . . . . . . . . . . . . 443.2 millionGreat Lakes . . . . . . . . . . . . . . . . . . . . . . . . . . . . . . . . . . . . . . 19.7 million
Trips. . . . . . . . . . . . . . . . . . . . . . . . . . . . . . . . . . . . . . . . . . . . . . 368.8 millionFreshwater except Great Lakes . . . . . . . . . . . . . . . . . . . . . . . 353.6 millionGreat Lakes . . . . . . . . . . . . . . . . . . . . . . . . . . . . . . . . . . . . . . 15.2 million
Trip and equipment expenditures . . . . . . . . . . . . . . . . . . . . . $25.7 billionFreshwater except Great Lakes . . . . . . . . . . . . . . . . . . . . . . . 23.8 billionGreat Lakes . . . . . . . . . . . . . . . . . . . . . . . . . . . . . . . . . . . . . . 1.9 billion
Note: Detail does not add to total because of multiple response and nonresponse. Source: Tables 1, 13, 14, and 15.
U.S. Fish and Wildlife Service and U.S. Census Bureau 2011 National Survey of Fishing, Hunting, and Wildlife-Associated Recreation 11
Freshwater Fishing Expenditures
Anglers spent over $10.4 billion on equipment for non-Great Lakes fresh-water fishing. Expenditures for fishing equipment, such as rods and reels, tackle boxes, depth finders, and artifi-cial lures and flies, totaled $4.0 billion. Expenditures for auxiliary equipment such as binoculars and camping equip-ment were $560 million. Expenditures for special equipment such as boats, vans, and cabins accounted for $5.9 billion.
There were 1.7 million people who fished almost 20 million days on 15 million trips to the Great Lakes in 2011. Their Great Lakes-related expenditures totaled $1.9 billion for an average of $1,121 per angler for the year. Trip-
related expenditures totaled $1.1 billion. Of these expenditures, $374 million was spent on food and lodging, 34 percent of trip costs; $252 million was spent on transportation, 23 percent of trip costs; and $465 million, or 43 percent, was spent on other items such as guide fees, equipment rental, and bait. Equipment expenditures totaled $777 million. Of this $777 million, $223 million was for fishing equipment (rods, reels, etc.), $83 million was for auxiliary equipment (camping equip-ment, binoculars, etc.) and $471 million was for special equipment (boats, vans, etc.).
Saltwater Fishing Highlights
In 2011, 8.9 million anglers enjoyed saltwater fishing on 86 million trips
totaling 99 million days. Overall, they spent $10.3 billion during the year on trips and equipment. Of their expen-ditures, trip-related costs garnered the largest portion, $7.3 billion. Food and lodging cost $2.4 billion, 32 percent of trip expenditures; transportation costs totaled $1.5 billion, 21 percent of trip costs; and other trip costs such as equipment rental, bait, and guide fees were $3.4 billion.
Anglers spent a total of $2.9 billion on equipment for saltwater fishing. Of the $2.9 million, $1.4 billion was for fishing equipment (rods, reels, etc.), $217 million for auxiliary equipment (camping equipment, binoculars, etc.), and $1.3 billion for special equipment (boats, vans, etc.).
Saltwater FishingAnglers. . . . . . . . . . 8.9 millionDays . . . . . . . . . . . . 99.5 millionTrips . . . . . . . . . . . . 86.2 millionTrips and equipment expenditures . . . . . $10.3 billion
Source: Tables 1 and 16.
Comparative Trip and Equipment Expenditures
Total expensesTrip-related Equipment
Freshwaterexcept
Great Lakes
SaltwaterGreatLakes
$1.9 billion
$10.3 billion
$23.8 billion
Freshwaterexcept
Great Lakes
SaltwaterGreatLakes
58%71%
56%
42%29%
44%

12 2011 National Survey of Fishing, Hunting, and Wildlife-Associated Recreation U.S. Fish and Wildlife Service and U.S. Census Bureau
Comparative Fishing Highlights
In 2011, anglers spent an average of 17 days fishing and took an average of 14 fishing trips. Freshwater, non-Great Lakes anglers averaged 16 days fishing and 13 trips while Great Lakes anglers averaged 12 days fishing and 9 trips. Saltwater anglers fished fewer days on average, 11, and averaged 10 trips.
Overall, anglers spent an average of $1,262 on fishing-related expenses in 2011. They averaged $658 per angler for their trip-related costs, a daily average of $39. Freshwater anglers, excluding the Great Lakes, averaged $494 per participant for their trips in 2011, equaling $30 per day. Great Lakes anglers spent an average of $655 on trip-related expenses, $55 per day. Saltwater anglers experienced the highest average expenditure amount at $824, an average of $74 per day.
Fishing for Selected Fish
The most popular fish species among the 27.1 million anglers who fished freshwater, other than the Great Lakes, was black bass. More than 10.6 million participants spent 171 million days fishing for black bass. Panfish were sought by 7.3 million anglers on 97 million days. Trout fishing attracted 7.2 million anglers on 76 million days. Catfish and bullheads drew 7.0 million anglers on 96 million days. Over 6.1 million anglers fished for crappie on 102 million days. Nearly 4.4 million anglers fished for white bass and striped bass on 61 million days. Fresh-water anglers also commonly fished for walleye, northern pike, sauger, salmon, and steelhead.
In 2011, 1.7 million anglers fished the Great Lakes. Walleye and sauger, the most commonly sought fish for these waters, attracted 584 thousand anglers, fishing nearly 6 million days. Black bass attracted 559 thousand anglers who fished for them 5 million days. Perch, another popular fish, was fished for by 497 thousand anglers for 6 million days. Salmon drew 379 thousand anglers for almost 3 million days of fishing. Great Lakes anglers also commonly fished for northern
Trip expendituresper day
Trip expendituresper angler
Comparative Fishing by Type of Fishing
All fishingFreshwater except Great LakesGreat LakesSaltwater
17
16
12
11
14
13
9
10
$658
$494
$655
$824
$39
$30
$55
$74
Trips per angler
Days per angler
Selected Fish by Type of Fishing(In millions)
Type of fishing Anglers Days
Freshwater except Great Lakes, total . . . . . . . . . . . . . . . . . . 27.1 443 Black bass . . . . . . . . . . . . . . . . . . . . . . . . . . . . . . . . . . . . . . . 10.6 171Panfish . . . . . . . . . . . . . . . . . . . . . . . . . . . . . . . . . . . . . . . . . . 7.3 97Trout. . . . . . . . . . . . . . . . . . . . . . . . . . . . . . . . . . . . . . . . . . . . 7.2 76Catfish/bullhead . . . . . . . . . . . . . . . . . . . . . . . . . . . . . . . . . . . 7.0 96Crappie . . . . . . . . . . . . . . . . . . . . . . . . . . . . . . . . . . . . . . . . . . 6.1 102White bass, striped bass, and striped bass hybrids. . . . . . . . . 4.4 61
Great Lakes, total. . . . . . . . . . . . . . . . . . . . . . . . . . . . . . . . . . . 1.7 20Walleye, sauger . . . . . . . . . . . . . . . . . . . . . . . . . . . . . . . . . . . 0.6 6Black bass . . . . . . . . . . . . . . . . . . . . . . . . . . . . . . . . . . . . . . . 0.6 5Perch . . . . . . . . . . . . . . . . . . . . . . . . . . . . . . . . . . . . . . . . . . . 0.5 6Salmon . . . . . . . . . . . . . . . . . . . . . . . . . . . . . . . . . . . . . . . . . . 0.4 5Northern pike, pickerel, muskie, muskie hybrids . . . . . . . . . *0.2 *2Lake trout . . . . . . . . . . . . . . . . . . . . . . . . . . . . . . . . . . . . . . . . *0.2 *4
Saltwater, total . . . . . . . . . . . . . . . . . . . . . . . . . . . . . . . . . . . . . 8.9 99Striped bass . . . . . . . . . . . . . . . . . . . . . . . . . . . . . . . . . . . . . . 2.1 18Flatfish (flounder, halibut) . . . . . . . . . . . . . . . . . . . . . . . . . . . 2.0 22Red drum (redfish). . . . . . . . . . . . . . . . . . . . . . . . . . . . . . . . . 1.5 21Sea trout (weakfish) . . . . . . . . . . . . . . . . . . . . . . . . . . . . . . . . 1.1 15Bluefish . . . . . . . . . . . . . . . . . . . . . . . . . . . . . . . . . . . . . . . . . 1.0 10Salmon . . . . . . . . . . . . . . . . . . . . . . . . . . . . . . . . . . . . . . . . . . 0.7 4
* Estimate based on a sample size of 10–29.
Source: Tables 3, 4, and 5.

U.S. Fish and Wildlife Service and U.S. Census Bureau 2011 National Survey of Fishing, Hunting, and Wildlife-Associated Recreation 13
pike, pickerel, and muskie, as well as steelhead and lake trout.
Among the nearly 8.9 million salt-water anglers, 2.1 million fished for striped bass for 18 million days. Two million anglers fished for flatfish, which includes flounder and halibut, on 22 million days. Also popular were red drum (redfish) and sea trout (weakfish) with 1.5 million and 1.1 million anglers who fished for 21 million and 15 million days, respectively. Other promi-nent saltwater species sought were mackerel with 650 thousand anglers, tuna with 564 thousand anglers, and mahi mahi (dolphinfish) with 538 thousand anglers.
Participation by Geographic Region
In 2011, 239 million people 16 years old and older lived in the United States and 1 in 7 of these U.S. residents went fishing. While the national participation rate was 14 percent, the regional rates ranged from 9 percent in the Pacific to 23 percent in the West North Central Region. The West North Central, East North Central, East South Central, West South Central, and Mountain Regions all reported participation rates above the national rate. The Middle Atlantic, South Atlantic, New England, and Pacific Regions fell below the national rate.
Fishing in State of Residence and in Other States
A large majority of the 33.1 million anglers who fished in 2011 did so within their home state. Approximately 30.0 million participants, 91 percent of all anglers, fished in their resident state. Nearly 7.0 million, 21 percent, fished out-of-state. Percentages do not add to 100 because those anglers who fished both in-state and out-of-state were included in both categories.
Of the 27.1 million non-Great Lakes anglers, 92 percent, 24.9 million, fished within their resident state. Over 4.5 million, 17 percent, of these freshwater anglers fished out-of-state. Ninety-two percent, 1.5 million, of all Great Lakes anglers enjoyed fishing
within their home state in 2011. Thir-teen percent, 224 thousand, of all Great Lakes anglers fished out-of-state.
Of the three different types of fishing, saltwater fishing had both the highest percentage of anglers fishing outside their resident state, 31 percent, and the lowest percentage fishing within their resident state, 74 percent. Nonresident saltwater anglers numbered 2.8 million and resident anglers 6.6 million.
AK
WA
OR
CA
MT
WY
ID
NVUT
AZ
CO
NM
ND
SD
NE
KS
OK
TX
MN
IA
MO
AR
LA
WI
IL
MI
IN OH
KY
TN
MS AL
FL
GA
SC
NC
VAWV
PA
NY
MENHVT
MA
RICT
NJ
DEMD
DC
HI
Fishing Participation(National participation rate: 14 percent)
Pacific9%
Mountain15%
West North Central
23%
East North Central
16%
Middle Atlantic
11%
New England 12%
South Atlantic 13%
East South Central
17%West South Central
16%
Percent of All Fishing in State of Residence and in Other States(Total: 33.1 million participants)
In state of residence and other states 12%
In state of residence only79%
In other states only 9%
Fishing in State of Residence and in Other States(In millions)
In stateOut of
state
Total anglers . . . . . . 30.0 7.0 Freshwater except Great Lakes . . . 24.9 4.5 Great Lakes . . . . . 1.5 0.2 Saltwater . . . . . . . 6.6 2.8
Source: Table 2.

14 2011 National Survey of Fishing, Hunting, and Wildlife-Associated Recreation U.S. Fish and Wildlife Service and U.S. Census Bureau
Types of Freshwater Fished, Excluding Great Lakes
Excluding the Great Lakes, 84 percent or 22.8 million of all freshwater anglers fished in reservoirs, lakes, and ponds. 44 percent or 11.9 million fished in rivers and streams. They spent 336 million days fishing in lakes, reservoirs, and ponds and 148 million days fishing in rivers and streams.
Great Lakes Anglers
Great Lakes fishing includes not only the Great Lakes, but also their tribu-taries—bodies of water that connect the Great Lakes, and the St. Lawrence River south of the bridge at Cornwall. The most popular of the Lakes among anglers was Lake Erie, attracting 38 percent of all Great Lakes anglers. They averaged 13 days of fishing in Lake Erie during 2011. Lake Michigan ranked second in popularity, hosting 25 percent of Great Lakes anglers with an average of 6 days per angler. Lake Huron attracted 16 percent of Great Lakes anglers for an average of 17 days per angler. Lake Superior drew 9 percent, as did Lake Ontario, of all Great Lakes fishing in 2011. Anglers fished an average of 15 days in Lake Ontario and 10 days in Lake Superior. The tributaries to the lakes drew 10 percent, 159 thousand anglers, who averaged 8 days of fishing there.
Types of Freshwater Fished, Excluding Great Lakes (In millions)
27.1
22.8
11.9
443
336
148
Anglers
Days
Rivers and streams
Lakes, reservoirs,and ponds
Total freshwaterexcluding Great Lakes
Rivers and streams
Lakes, reservoirs,and ponds
Total freshwaterexcluding Great Lakes
Great Lakes FishingPercentage
Anglers of all Great(thousands) Lakes Anglers
Total, all Great Lakes . . . . . . . . . . . . . . . . . 1,665 100Lake Erie . . . . . . . . . . . . . . . . . . . . . . . . . . 639 38Lake Michigan . . . . . . . . . . . . . . . . . . . . . . 413 25Lake Huron . . . . . . . . . . . . . . . . . . . . . . . . *262 *16Tributaries to the Great Lakes . . . . . . . . . . *159 *10Lake Superior. . . . . . . . . . . . . . . . . . . . . . . *147 *9Lake Ontario . . . . . . . . . . . . . . . . . . . . . . . *143 *9St. Lawrence . . . . . . . . . . . . . . . . . . . . . . . … …Lake St. Clair . . . . . . . . . . . . . . . . . . . . . . . … …
* Estimate based on a sample of 10–29.… Sample size too small to report data reliably.
Source: Table 26.

U.S. Fish and Wildlife Service and U.S. Census Bureau 2011 National Survey of Fishing, Hunting, and Wildlife-Associated Recreation 15
Sex and Age of Anglers
Although more men than women fished in 2011, a substantial number of women, 8.9 million, fished. Approxi-mately 21 percent of all males 16 years old and older went fishing, while 7 percent of all females fished. Of the 33.1 million anglers who fished in the United States, 73 percent, 24.2 million, were male and 27 percent were female.
Of the age categories, 7.4 million anglers were 45 to 54 years old. They composed 22 percent of all anglers and had a participation rate of 16 percent. The 25- to 34-year-old age group accounted for 6.1 million anglers, 19 percent of all anglers. They had 15 percent participation. Six million anglers, 18 percent of all anglers, were 35 to 44 years old. Their participa-tion rate was 15 percent of the U.S. population in that age group. The 5.9 million 55- to 64-year-olds who fished comprised 18 percent of all anglers and had a participation rate of 15 percent. The 2.7 million anglers 18 to 24 years old made up 8 percent of the angler population, and had a participa-tion rate of 10 percent. Anglers 75 and older numbered 1.0 million, 3 percent of all anglers, and had a participation rate of 7 percent. The 16- and 17-year-olds added 942 thousand individuals to the angler population. They made up 3 percent of all anglers, and had a 12 percent participation rate.
Anglers by Sex and AgeTotal, both sexes . . . 33.1 million
Male . . . . . . . . . . . 24.2 millionFemale . . . . . . . . . 8.9 million
Total, all ages . . . . . 33.1 million16 and 17 . . . . . . . 0.9 million18 to 24 . . . . . . . . 2.7 million25 to 34 . . . . . . . . 6.1 million35 to 44 . . . . . . . . 6.0 million45 to 54 . . . . . . . . 7.4 million55 to 64 . . . . . . . . 5.9 million65 and older . . . . . 4.1 million
Source: Table 9.
Percent of Males and Females Who Fished in the United States
Females
Males 21%
7%
Percent of Anglers by Sex
Males 73%
Females27%
Percent of Anglers by Age
65 and older 12%
55 to 64 18%
16 and 173%
45 to 54 22%
35 to 44 18%
25 to 3419%
18 to 248%
Percent of U.S. Population Who Fished by Age
65 and older
55 to 64
45 to 54
35 to 44
25 to 34
18 to 24
16 and 17 12%
10%
15%
15%
16%
15%
11%
16 2011 National Survey of Fishing, Hunting, and Wildlife-Associated Recreation U.S. Fish and Wildlife Service and U.S. Census Bureau
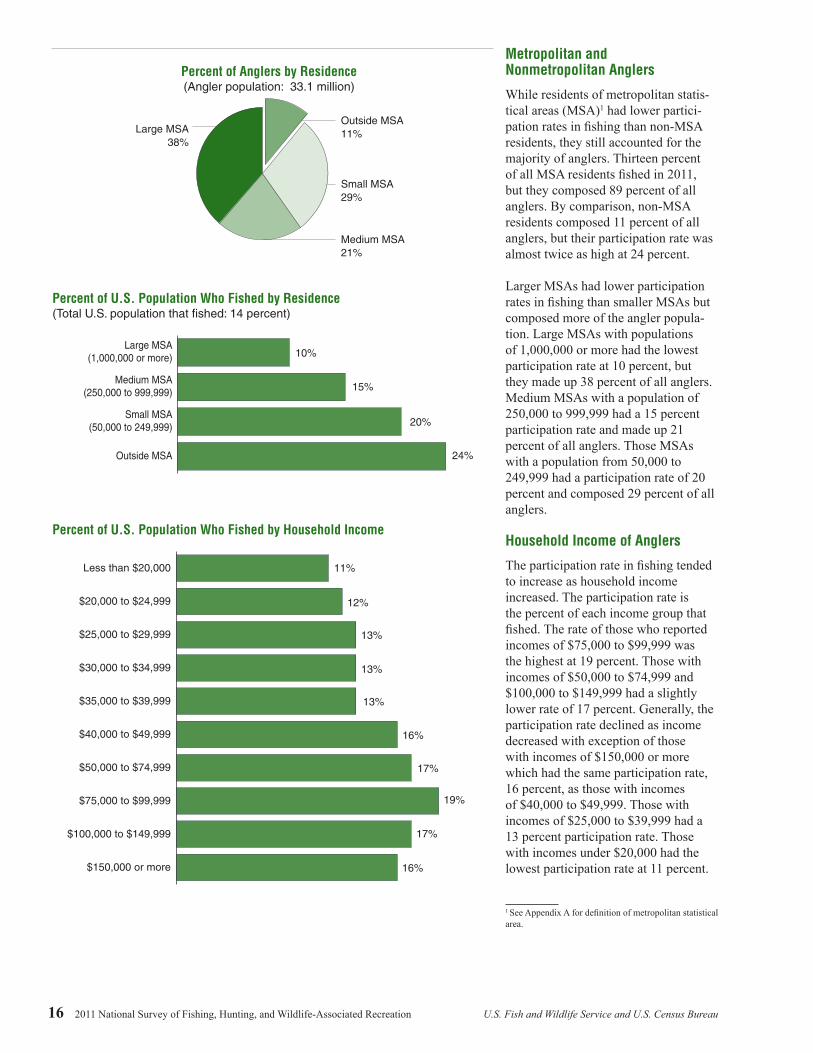
Metropolitan and Nonmetropolitan Anglers
While residents of metropolitan statis-tical areas (MSA)1 had lower partici-pation rates in fishing than non-MSA residents, they still accounted for the majority of anglers. Thirteen percent of all MSA residents fished in 2011, but they composed 89 percent of all anglers. By comparison, non-MSA residents composed 11 percent of all anglers, but their participation rate was almost twice as high at 24 percent.
Larger MSAs had lower participation rates in fishing than smaller MSAs but composed more of the angler popula-tion. Large MSAs with populations of 1,000,000 or more had the lowest participation rate at 10 percent, but they made up 38 percent of all anglers. Medium MSAs with a population of 250,000 to 999,999 had a 15 percent participation rate and made up 21 percent of all anglers. Those MSAs with a population from 50,000 to 249,999 had a participation rate of 20 percent and composed 29 percent of all anglers.
Household Income of Anglers
The participation rate in fishing tended to increase as household income increased. The participation rate is the percent of each income group that fished. The rate of those who reported incomes of $75,000 to $99,999 was the highest at 19 percent. Those with incomes of $50,000 to $74,999 and $100,000 to $149,999 had a slightly lower rate of 17 percent. Generally, the participation rate declined as income decreased with exception of those with incomes of $150,000 or more which had the same participation rate, 16 percent, as those with incomes of $40,000 to $49,999. Those with incomes of $25,000 to $39,999 had a 13 percent participation rate. Those with incomes under $20,000 had the lowest participation rate at 11 percent.
1 See Appendix A for definition of metropolitan statistical area.
Percent of Anglers by Residence(Angler population: 33.1 million)
Outside MSA 11%Large MSA
38%
Small MSA 29%
Medium MSA 21%
Percent of U.S. Population Who Fished by Residence(Total U.S. population that fished: 14 percent)
Outside MSA
Small MSA(50,000 to 249,999)
Medium MSA(250,000 to 999,999)
Large MSA(1,000,000 or more) 10%
15%
20%
24%
Percent of U.S. Population Who Fished by Household Income
$150,000 or more
$100,000 to $149,999
$75,000 to $99,999
$50,000 to $74,999
$40,000 to $49,999
$35,000 to $39,999
$30,000 to $34,999
$25,000 to $29,999
$20,000 to $24,999
Less than $20,000
16%
17%
19%
17%
16%
13%
13%
13%
12%
11%
U.S. Fish and Wildlife Service and U.S. Census Bureau 2011 National Survey of Fishing, Hunting, and Wildlife-Associated Recreation 17
The majority of anglers had house-hold incomes of $50,000 or more. Among anglers who reported income, 60 percent were from households with incomes of $50,000 or more and 40 percent were from households with incomes less than $50,000.
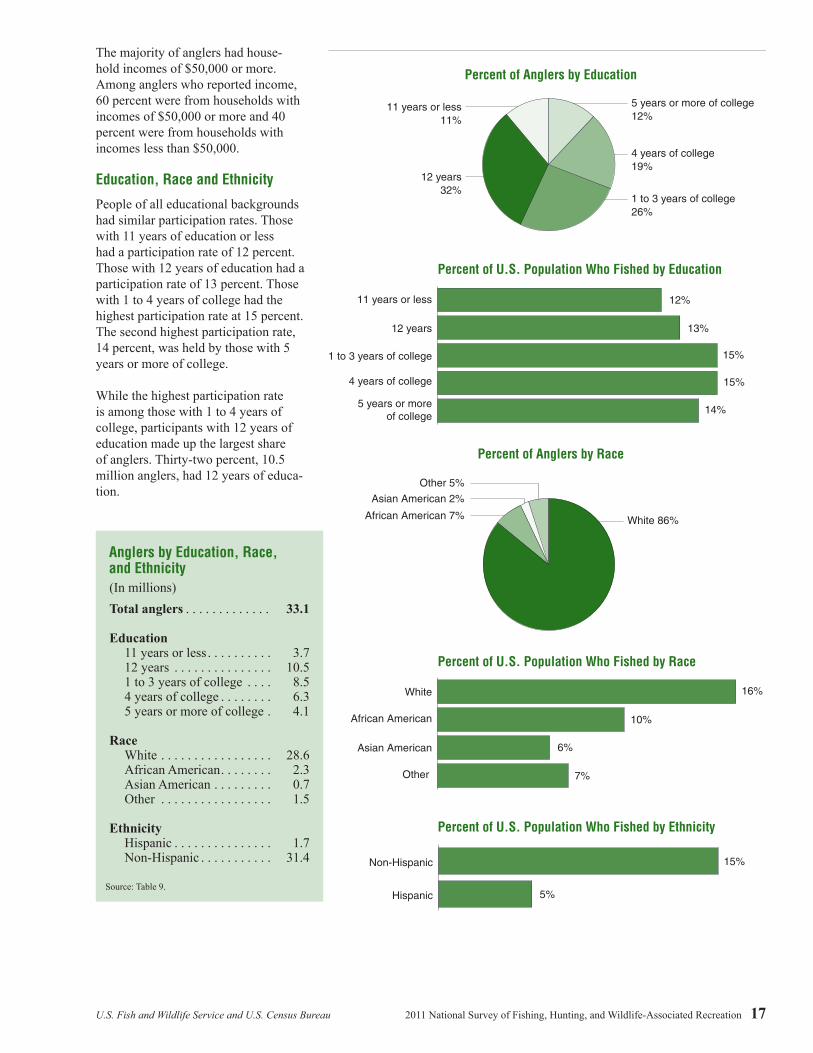
Education, Race and Ethnicity
People of all educational backgrounds had similar participation rates. Those with 11 years of education or less had a participation rate of 12 percent. Those with 12 years of education had a participation rate of 13 percent. Those with 1 to 4 years of college had the highest participation rate at 15 percent. The second highest participation rate, 14 percent, was held by those with 5 years or more of college.
While the highest participation rate is among those with 1 to 4 years of college, participants with 12 years of education made up the largest share of anglers. Thirty-two percent, 10.5 million anglers, had 12 years of educa-tion.
Anglers by Education, Race, and Ethnicity(In millions)Total anglers . . . . . . . . . . . . . 33.1
Education11 years or less. . . . . . . . . . 3.712 years . . . . . . . . . . . . . . . 10.51 to 3 years of college . . . . 8.54 years of college . . . . . . . . 6.35 years or more of college . 4.1
RaceWhite . . . . . . . . . . . . . . . . . 28.6African American. . . . . . . . 2.3Asian American . . . . . . . . . 0.7Other . . . . . . . . . . . . . . . . . 1.5
EthnicityHispanic . . . . . . . . . . . . . . . 1.7Non-Hispanic . . . . . . . . . . . 31.4
Source: Table 9.
Percent of Anglers by Education
4 years of college 19%
11 years or less11%
5 years or more of college 12%
1 to 3 years of college 26%
12 years32%
Percent of U.S. Population Who Fished by Education
5 years or moreof college
4 years of college
1 to 3 years of college
12 years
11 years or less 12%
13%
15%
15%
14%
Percent of Anglers by Race
White 86%
Other 5%
African American 7%
Asian American 2%
Percent of U.S. Population Who Fished by Race
Other
Asian American
African American
White 16%
10%
6%
7%
Percent of U.S. Population Who Fished by Ethnicity
Hispanic
Non-Hispanic 15%
5%

18 2011 National Survey of Fishing, Hunting, and Wildlife-Associated Recreation U.S. Fish and Wildlife Service and U.S. Census Bureau
Fishing was most popular among Whites and African Americans. Whites participated at a 16 percent rate and African Americans participated at a 10 percent rate. Other races, which include Native Americans, Pacific Islanders, and those of mixed race, participated at a 7 percent rate. Asian Americans participated at a 6 percent rate. Of all anglers, 86 percent were White, 7 percent were African American, 5 percent were other races, and 2 percent were Asian Americans.
2001–2011 Comparison of Fishing Activity
In 2011 the number of people fishing was 11 percent higher than in 2006.
Specifically, participation in freshwater, except Great Lakes, and saltwater fishing were up significantly, 8 and 15 percent, respectively. The number of Great Lakes anglers did not undergo a significant change. Days fishing, however, did not have statistically significant changes for any type of fishing, which means average days per freshwater, except Great Lakes, and Great Lakes anglers were slightly down. Expenditures for trip-related items and equipment decreased 11 percent overall, primarily due to a 41 percent drop in big-ticket special equipment such as cabins and boats. Comparing fishing in 2011 to that in 2001, there was no significant differ-
ence in either the number of partici-pants or days for any type of fishing. The drop in fishing from 2001 to 2006 was reversed across the board by the increase from 2006 to 2011. Total expenditures also did not change significantly, although when expen-ditures are broken down into its two components, trip-related and equipment items, there were differences. Anglers spent significantly more in 2011 for trip-related expenses and less for equipment purchases, particularly the big-ticket items.
Number of Anglers(Millions)
201120062001
34.1
30.033.1
Days of Fishing (Millions)
201120062001
557517
554
Fishing Expenditures (Billions of 2011 dollars)
201120062001
$45.3$47.0
$41.8

U.S. Fish and Wildlife Service and U.S. Census Bureau 2011 National Survey of Fishing, Hunting, and Wildlife-Associated Recreation 19
2001–2011 Fishing Participants, Days, and Expenditures(U.S. population 16 years old and older. Numbers in thousands)
2001 2011 2001–2011Number Percent Number Percent percent change
Anglers, total . . . . . . . . . . . . . . . . . . . . . . . 34,07128,43927,9131,8479,051
10083825
27
33,11227,54727,0601,6658,889
10083825
27
NS–3NS–3NS–3
NS–10NS–2
All freshwater . . . . . . . . . . . . . . . . . . . . . Freshwater, except Great Lakes . . . . . Great Lakes . . . . . . . . . . . . . . . . . . . . . Saltwater . . . . . . . . . . . . . . . . . . . . . . . . .
Days, total . . . . . . . . . . . . . . . . . . . . . . . . . . 557,394
466,984443,24723,13890,838
10084804
16
553,841455,862443,22319,66199,474
10082804
18
NS–1NS–2
0NS–15
NS10
All freshwater . . . . . . . . . . . . . . . . . . . . . Freshwater, except Great Lakes . . . . . Great Lakes . . . . . . . . . . . . . . . . . . . . . Saltwater . . . . . . . . . . . . . . . . . . . . . . . . .
Fishing, total (2011 dollars) . . . . . . . . . . . . $45,257,393
18,614,94121,545,7815,864,914
915,822 14,765,019 5,096,669
1004148132
3311
$41,788,936 21,789,46515,506,4336,141,8951,106,8658,257,6734,493,037
1005237153
2011
NS–817
–28NS5
NS21 –44
NS–12
Trip-related . . . . . . . . . . . . . . . . . . . . . . . Equipment, total . . . . . . . . . . . . . . . . . . . Fishing equipment . . . . . . . . . . . . . . . Auxiliary equipment. . . . . . . . . . . . . . Special equipment. . . . . . . . . . . . . . . . . . Other . . . . . . . . . . . . . . . . . . . . . . . . . . . .
NS Not different from zero at the 5 percent level of significance.
2006–2011 Fishing Participants, Days, and Expenditures(U.S. population 16 years old and older. Numbers in thousands)
2006 2011 2006–2011Number Percent Number Percent percent change
Anglers, total . . . . . . . . . . . . . . . . . . . . . . . 29,95225,43125,0351,4207,717
10085845
26
33,11227,54727,0601,6658,889
10083825
27
1188
NS1715
All freshwater . . . . . . . . . . . . . . . . . . . . . Freshwater, except Great Lakes . . . . . Great Lakes . . . . . . . . . . . . . . . . . . . . . Saltwater . . . . . . . . . . . . . . . . . . . . . . . . .
Days, total . . . . . . . . . . . . . . . . . . . . . . . . . . 516,781
433,337419,94218,01685,663
10084813
17
553,841455,862443,22319,66199,474
10082804
18
NS7NS5NS6NS9
NS16
All freshwater . . . . . . . . . . . . . . . . . . . . . Freshwater, except Great Lakes . . . . . Great Lakes . . . . . . . . . . . . . . . . . . . . . Saltwater . . . . . . . . . . . . . . . . . . . . . . . . .
Fishing, total (2011 dollars) . . . . . . . . . . . . $47,036,454
19,948,34020,928,8895,949,727
868,89414,110,2686,159,225
1002947236
1824
$41,788,936 21,789,46515,506,4336,141,8951,106,8658,257,6734,493,037
1005237153
2011
NS–11NS9
–26NS3
NS27 –41 –27
Trip-related . . . . . . . . . . . . . . . . . . . . . . . Equipment, total . . . . . . . . . . . . . . . . . . . Fishing equipment . . . . . . . . . . . . . . . Auxiliary equipment. . . . . . . . . . . . . . Special equipment . . . . . . . . . . . . . . . Other . . . . . . . . . . . . . . . . . . . . . . . . . . . .
NS Not different from zero at the 5 percent level of significance.

Hunting
U.S. Fish and Wildlife Service and U.S. Census Bureau 2011 National Survey of Fishing, Hunting, and Wildlife-Associated Recreation 21
Hunting

22 2011 National Survey of Fishing, Hunting, and Wildlife-Associated Recreation U.S. Fish and Wildlife Service and U.S. Census Bureau
Hunting Highlights
In 2011, 13.7 million people 16 years old and older enjoyed hunting a variety of animals within the United States. They hunted 282 million days and took 257 million trips. Hunting expenditures totaled $33.7 billion.
Big game hunting was the most popular type of hunting. Almost 11.6 million hunters pursued big game such as
deer and elk on 212 million days. Big game-related expenditures for trips and equipment totaled $16.9 billion. There were 4.5 million hunters of small game including squirrels and rabbits. They hunted small game on 51 million days and spent $2.6 billion on small game hunting trips and equipment. Migra-tory bird hunters numbered 2.6 million. They spent 23 million days hunting
birds such as waterfowl and doves. Migratory bird-related trip and equip-ment expenditures totaled $1.8 billion. Nearly 2.2 million hunters sought other animals such as raccoons and feral pigs on 34 million days, and their expendi-tures for trips and equipment were $858 million.
Hunting
0
2
4
6
8
10
12
14
Otheranimals
Migratorybirds
Smallgame
Biggame
Totalhunting
Million
TripsDays
Big game Small game Migratory bird Other animals
Note: Detail does not add to total because of multiple responses and nonresponse.
282 million
257 million
Hunters
212
167
5143
2321
34 25
Total Hunting
Hunters . . . . . . . . . 13.7 millionBig game . . . . . . 11.6 millionSmall game . . . . 4.5 millionMigratory birds . 2.6 millionOther animals . . 2.2 million
Days . . . . . . . . . . . . 282 millionBig game . . . . . . 212 millionSmall game . . . . 51 millionMigratory birds . 23 millionOther animals . . 34 million
Trips. . . . . . . . . . . . 257 millionBig game . . . . . . 167 millionSmall game . . . . 43 millionMigratory birds . 21 millionOther animals . . 25 million
Expenditures. . . . . $33.7 billionBig game . . . . . . 16.9 billionSmall game . . . . 2.6 billionMigratory birds . 1.8 billionOther animals . . 0.9 billionNonspecific . . . . 11.9 billion
Source: Tables 1 and 17–21.

U.S. Fish and Wildlife Service and U.S. Census Bureau 2011 National Survey of Fishing, Hunting, and Wildlife-Associated Recreation 23
Hunting Expenditures
Of the $33.7 billion spent by hunters in 2011, 31 percent, $10.4 billion, was spent on trip-related expenses. Food and lodging totaled $3.9 billion, 37 percent of all trip-related expenses. Transportation spending was $4.8 billion, 46 percent of trip expenditures. Other trip expenses such as guide fees, land use fees, and equipment rental were $1.8 billion or 17 percent of all trip-related expenses.
Total equipment expenditures for hunting were $14.0 billion in 2011, 41 percent of all hunting expenses. Hunting equipment, such as guns and rifles, telescopic sights, and ammu-nition, composed $7.7 billion, or 55 percent of all equipment costs. Expenditures for auxiliary equip-ment, including camping equip-ment, binoculars, and special hunting clothing, accounted for $1.8 billion or 13 percent of all equipment expenses. Special equipment, such as campers or all-terrain vehicles, amounted to $4.4 billion or 31 percent of all equipment expenditures.
Land leasing and ownership for hunting was a large expenditure category. Hunters spent $7.1 billion on land leasing and ownership, which was 21 percent of all hunting-related expenditures. Expenditures for maga-zines, books, DVDs, membership dues, contributions, licenses, tags, and permits totaled $1.5 billion or 4 percent. Expenditures for plantings, $703 million, was 2 percent of all hunting expenditures.
Total Hunting Expenditures
Total hunting expenditures. . . . . . . . . . . . . . . . . . . . . . . . . . $33.7 billion
Total trip-related expenditures . . . . . . . . . . . . . . . . . . . . . . $10.4 billionFood and lodging . . . . . . . . . . . . . . . . . . . . . . . . . . . . . . . . 3.9 billionTransportation . . . . . . . . . . . . . . . . . . . . . . . . . . . . . . . . . . . 4.8 billionOther trip costs . . . . . . . . . . . . . . . . . . . . . . . . . . . . . . . . . . 1.8 billion
Total equipment expenditures . . . . . . . . . . . . . . . . . . . . . . . $14.0 billionHunting equipment . . . . . . . . . . . . . . . . . . . . . . . . . . . . . . . 7.7 billionAuxiliary equipment . . . . . . . . . . . . . . . . . . . . . . . . . . . . . . 1.8 billionSpecial equipment . . . . . . . . . . . . . . . . . . . . . . . . . . . . . . . . 4.4 billion
Total other hunting expenditures . . . . . . . . . . . . . . . . . . . . $9.3 billionMagazines, books, DVDs . . . . . . . . . . . . . . . . . . . . . . . . . . 0.1 billionMembership dues and contributions . . . . . . . . . . . . . . . . . . 0.4 billionLand leasing and ownership . . . . . . . . . . . . . . . . . . . . . . . . 7.1 billionLicenses, stamps, tags, and permits . . . . . . . . . . . . . . . . . . 1.0 billionPlantings . . . . . . . . . . . . . . . . . . . . . . . . . . . . . . . . . . . . . . . 0.7 billion
Source: Table 17.
Hunting Expenditures by Type of Hunting(Total expenditures: $33.7 billion)
Big game$16.9 billion50%
Other animals $0.9 billion
3%
Small game $2.6 billion8%
Nonspecific$11.6 billion
34%
Migratory birds$1.8 billion
5%
Percent of Total Hunting Expenditures(Total expenditures: $33.7 billion)
Other$9.3 billion 28%
Trip-related$10.4 billion 31%
Equipment$14.0 billion
41%

24 2011 National Survey of Fishing, Hunting, and Wildlife-Associated Recreation U.S. Fish and Wildlife Service and U.S. Census Bureau
Big Game Hunting
In 2011, a majority of hunters, 11.6 million, devoted 212 million days to hunting big game including deer, elk, bear, and wild turkey. They took 167 million trips and spent an average of 18 days hunting big game.
Trip and equipment expenditures for big game hunting totaled $16.9 billion. Trip-related expenses were $7.3 billion. Of that amount, food and lodging accounted for $2.6 billion or 37 percent of all trip-related costs. Transportation costs were $3.4 billion, 46 percent of trip costs. Other trip-related expenses amounted to $1.2 billion or 17 percent of trip costs.
Fifty-seven percent of big game-related expenditures were on equipment, which totaled $9.6 billion. Hunting equip-ment, which includes firearms, ammu-nition, bows, and arrows, accounted for $3.9 billion or 41 percent of all equip-ment. Purchases of auxiliary equipment such as tents and binoculars totaled $1.5 billion (16 percent). Special equip-ment such as campers and all-terrain vehicles accounted for $4.1 billion (43 percent).
Small Game Hunting
Small game such as rabbits, squirrels, pheasants, quail, and grouse was also popular with hunters. Just over 4.5 million hunters pursued small game for a total of 51 million days. They took 43
million trips and averaged 11 days in the field hunting small game.These hunters spent $2.6 billion on trips and equipment for small game hunting. Trip expenditures totaled $1.6 billion. Spending on food and lodging was $658 million or 42 percent of trip expenditures. Transportation costs totaled $686 million or 43 percent of small game trip expenses. Other trip-related expenditures were $233 million or 15 percent of all trip costs.
Equipment expenditures for small game hunting were $984 million. For the pursuit of small game, hunters spent $854 million on hunting equipment (firearms, ammunition, etc.) and $85 million on auxiliary equipment, 87 and 9 percent of equipment expenditures, respectively.
Big GameHunters. . . . . . . . . . 11.6 millionDays . . . . . . . . . . . . 212 millionTrips . . . . . . . . . . . . 167 millionTrips and equipment expenditures . . . . . $16.9 billion
Source: Tables 1 and 18.
Small GameHunters. . . . . . . . . . 4.5 millionDays . . . . . . . . . . . . 51 millionTrips . . . . . . . . . . . . 43 millionTrips and equipment expenditures . . . . . $2.6 billion
Source: Tables 1 and 19.
Big Game Trip and Equipment Expenditures (Total expenditures: $16.9 billion)
Trip-related
Equipment $9.6 billion
$7.3 billion
Small Game Trip and Equipment Expenditures (Total expenditures: $2.6 billion)
Trip-related
Equipment $0.9 billion
$1.6 billion

U.S. Fish and Wildlife Service and U.S. Census Bureau 2011 National Survey of Fishing, Hunting, and Wildlife-Associated Recreation 25
Migratory Bird Hunting
In 2011, 2.6 million migratory bird hunters devoted 23 million days on 21 million trips for hunting birds such as doves, ducks, and geese. Hunters aver-aged 9 days pursuing migratory birds for the year.
Migratory bird-related spending for trips and equipment was $1.8 billion in 2011. Of this amount, $942 million was spent on hunting trips. An estimated $316 million or 34 percent of all trip expenditures were on food and lodging, and $390 million (41 percent) were on transportation. Other trip expenses were $235 million (25 percent) of the total trip-related expenditures for migratory bird hunters.
Equipment purchases for migratory bird hunting totaled $866 million in 2011. Of this amount, $767 million was spent on hunting equipment (firearms, ammunition, etc.) and $59 million on auxiliary equipment, 89 and 7 percent of total equipment purchases, respec-tively.
Hunting Other Animals
Nearly 2.2 million hunters reported spending 34 million days on 25 million trips pursuing other animals such as groundhogs, feral pigs, raccoons, foxes, and coyotes. They averaged 16 days of hunting.
These hunters spent $858 million in 2011 on trips and equipment for the pursuit of other animals. Trip-related costs totaled $653 million. Of that, food and lodging were $259 million or 40 percent of all trip costs; transportation was $324 million, 50 percent of trip expenses; and other trip expenses were $70 million, 11 percent of all trip costs.
Equipment expenditures for hunting other animals totaled $205 million. For the pursuit of other animals, hunters spent $189 million on hunting equip-ment (firearms, ammunition, etc.) and $6 million on auxiliary equipment, 92 and 3 percent of total equipment expen-ditures, respectively.
Comparative Hunting Highlights
In 2011 big game hunters pursued big game an average of 18 days on 14 trips. Small game hunters pursued small game an average of 11 days on 10 trips. Migratory bird hunters hunted migratory birds an average of 9 days on 8 trips. Individuals hunting other animals did so an average of 16 days on 11 trips.
Average spending on trips and equip-ment was about twice as high for big game hunting than for any other type of hunting. For hunting big game, participants spent an average of $1,457 for the year. By comparison, spending on small game hunting by participants averaged $568, spending on migratory bird hunting by participants averaged $700, and spending on other animal hunting averaged $396.
During 2011 trip expenditures for all hunting averaged $762 per hunter, a daily average of $37. In pursuit of big game, hunters averaged trip expendi-tures of $627, which was $34 per day. Hunters spent an average of $350 while
Migratory BirdsHunters. . . . . . . . . . 2.6 millionDays . . . . . . . . . . . . 23 millionTrips . . . . . . . . . . . . 21 millionTrips and equipment expenditures . . . . . $1.8 billion
Source: Tables 1 and 20.
Other AnimalsHunters. . . . . . . . . . 2.2 millionDays . . . . . . . . . . . . 34 millionTrips . . . . . . . . . . . . 25 millionTrips and equipment expenditures . . . . . $0.9 billion
Source: Tables 1 and 21.
Migratory Bird Trip and Equipment Expenditures (Total expenditures: $1.8 billion)
Trip-related
Equipment $0.9 billion
$0.9 billion
Trip and Equipment Expenditures for Hunting Other Animals (Total expenditures: $0.9 billion)
$0.7 billionTrip-related
Equipment $0.2 billion
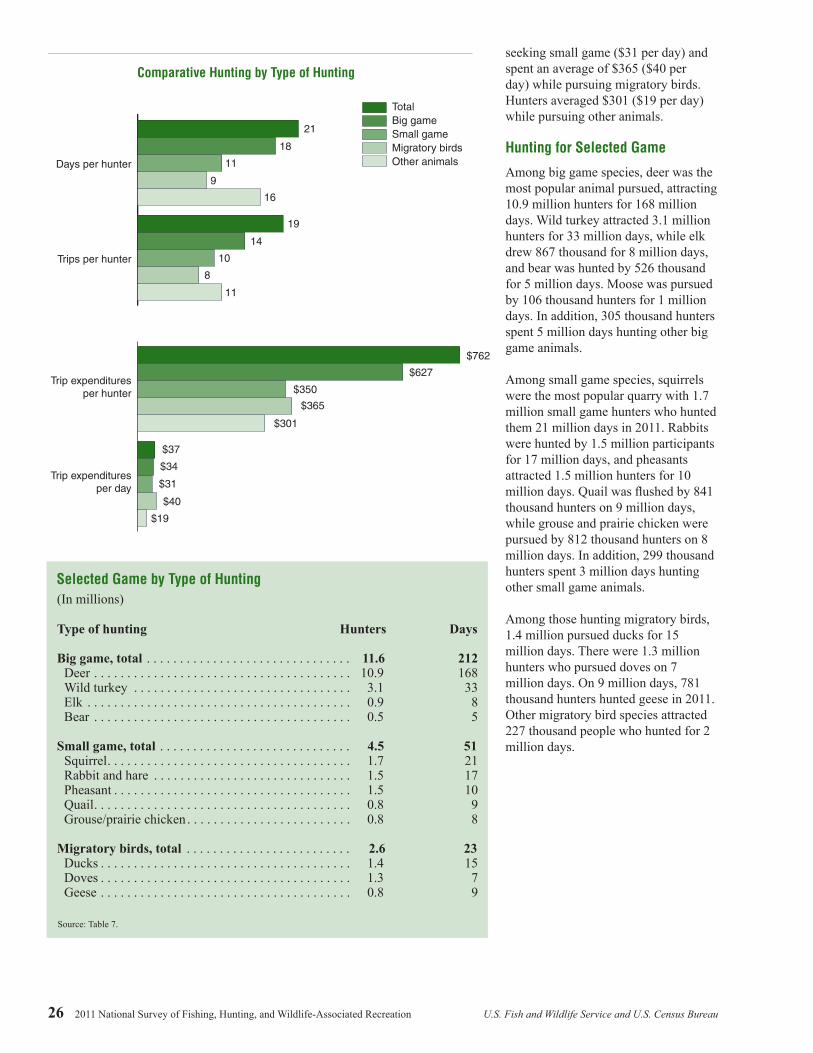
26 2011 National Survey of Fishing, Hunting, and Wildlife-Associated Recreation U.S. Fish and Wildlife Service and U.S. Census Bureau
seeking small game ($31 per day) and spent an average of $365 ($40 per day) while pursuing migratory birds. Hunters averaged $301 ($19 per day) while pursuing other animals.
Hunting for Selected Game
Among big game species, deer was the most popular animal pursued, attracting 10.9 million hunters for 168 million days. Wild turkey attracted 3.1 million hunters for 33 million days, while elk drew 867 thousand for 8 million days, and bear was hunted by 526 thousand for 5 million days. Moose was pursued by 106 thousand hunters for 1 million days. In addition, 305 thousand hunters spent 5 million days hunting other big game animals.
Among small game species, squirrels were the most popular quarry with 1.7 million small game hunters who hunted them 21 million days in 2011. Rabbits were hunted by 1.5 million participants for 17 million days, and pheasants attracted 1.5 million hunters for 10 million days. Quail was flushed by 841 thousand hunters on 9 million days, while grouse and prairie chicken were pursued by 812 thousand hunters on 8 million days. In addition, 299 thousand hunters spent 3 million days hunting other small game animals.
Among those hunting migratory birds, 1.4 million pursued ducks for 15 million days. There were 1.3 million hunters who pursued doves on 7 million days. On 9 million days, 781 thousand hunters hunted geese in 2011. Other migratory bird species attracted 227 thousand people who hunted for 2 million days.
Trip expendituresper day
Trip expendituresper hunter
Trips per hunter
Days per hunter
Comparative Hunting by Type of Hunting
TotalBig gameSmall gameMigratory birdsOther animals
21
18
11
9
19
14
10
8
$762
$627
$350
$365
$37
$34
$31
$40
16
11
$301
$19
Selected Game by Type of Hunting(In millions)
Type of hunting Hunters Days
Big game, total . . . . . . . . . . . . . . . . . . . . . . . . . . . . . . . 11.6 212Deer . . . . . . . . . . . . . . . . . . . . . . . . . . . . . . . . . . . . . . . 10.9 168Wild turkey . . . . . . . . . . . . . . . . . . . . . . . . . . . . . . . . . 3.1 33Elk . . . . . . . . . . . . . . . . . . . . . . . . . . . . . . . . . . . . . . . . 0.9 8Bear . . . . . . . . . . . . . . . . . . . . . . . . . . . . . . . . . . . . . . . 0.5 5
Small game, total . . . . . . . . . . . . . . . . . . . . . . . . . . . . . 4.5 51Squirrel. . . . . . . . . . . . . . . . . . . . . . . . . . . . . . . . . . . . . 1.7 21Rabbit and hare . . . . . . . . . . . . . . . . . . . . . . . . . . . . . . 1.5 17Pheasant . . . . . . . . . . . . . . . . . . . . . . . . . . . . . . . . . . . . 1.5 10Quail. . . . . . . . . . . . . . . . . . . . . . . . . . . . . . . . . . . . . . . 0.8 9Grouse/prairie chicken . . . . . . . . . . . . . . . . . . . . . . . . . 0.8 8
Migratory birds, total . . . . . . . . . . . . . . . . . . . . . . . . . 2.6 23Ducks . . . . . . . . . . . . . . . . . . . . . . . . . . . . . . . . . . . . . . 1.4 15Doves . . . . . . . . . . . . . . . . . . . . . . . . . . . . . . . . . . . . . . 1.3 7Geese . . . . . . . . . . . . . . . . . . . . . . . . . . . . . . . . . . . . . . 0.8 9
Source: Table 7.

U.S. Fish and Wildlife Service and U.S. Census Bureau 2011 National Survey of Fishing, Hunting, and Wildlife-Associated Recreation 27
Participation by Geographic Region
Regionally, participation rates in hunting ranged from 3 percent in the Pacific Region to 11 percent in the East South Central Region. The East North Central, West North Central, and West South Central Regions also had partici-pation rates above the national average of 6 percent. Regions with participa-tion rates below the national rate were New England, Middle Atlantic, South Atlantic, and Pacific. The rate in the Mountain Region was equal to the average at 6 percent.
Hunting in State of Residence and in Other States
A large majority of participants, 94 percent or 12.9 million, hunted within their resident state in 2011. Only 1.9 million, 14 percent, hunted in another state. Percentages do not add to 100 because those who hunted both in state and out of state were included in both categories.
The overall resident/nonresident pattern is relatively constant across all types of hunting. Eleven million big game hunters, 95 percent of all big game hunters, hunted within their state of residence, while 11 percent, 1.3 million
people, traveled to another state to hunt big game. Four million small game hunters, 90 percent of all small game hunters, pursued game in their resident state. An estimated 708 thou-sand small game hunters, 16 percent ventured across state lines to hunt small game. Over 2.4 million migratory bird hunters, 94 percent of all migratory bird hunters, hunted within their resident state. Eleven percent or 284 thousand hunted out of state. Among sportsper-sons who hunted other animals, 92 percent, 2 million, hunted in state and 10 percent, 224 thousand participants, hunted out of state.
Hunting in State of Residence and in Other States(In millions)
In stateOut of
state
All hunters . . . . . . 12.9 1.9 Big game . . . . . . . 11.0 1.3 Small game . . . . . 4.0 0.7 Migratory birds . . 2.4 0.3 Other animals . . . 2.0 0.2
Source: Table 6.
AK
WA
OR
CA
MT
WY
ID
NVUT
AZ
CO
NM
ND
SD
NE
KS
OK
TX
MN
IA
MO
AR
LA
WI
IL
MI
IN OH
KY
TN
MS AL
FL
GA
SC
NC
VAWV
PA
NY
MENHVT
MA
RICT
NJ
DEMD
DC
HI
Hunting Participation(National participation rate: 6 percent)
Pacific3%
Mountain6%
West North Central
10%
East North Central
7%
Middle Atlantic
5%
New England 4%
South Atlantic 4%
East South Central
11%West South Central
7%

28 2011 National Survey of Fishing, Hunting, and Wildlife-Associated Recreation U.S. Fish and Wildlife Service and U.S. Census Bureau
Hunting on Public and Private Lands
In 2011, 13.7 million hunters 16 years old and older hunted on public land, private land, or both. Of this number, 4.9 million or 36 percent hunted on publicly owned lands compared to 11.5 million or 84 percent who hunted on privately owned land. Some hunters hunted exclusively on public land and others hunted exclusively on private land—1.7 million, 13 percent of all hunters, used public lands only, and 8.4 million hunted only on private land, 61 percent of all hunters. Nearly 3.2
million hunters, 23 percent, hunted on both public and private lands.
During 2011, 4.9 million hunters used public lands on 61 million days, which represents 22 percent of all hunting days. Thirty-three percent of big game hunters pursued big game on public land for 39 million days. Thirty-one percent of all small game hunters, 1.4 million, pursued small game on public land for 14 million days. An estimated 923 thousand migratory bird hunters, 36 percent, hunted migratory birds on public lands for 8 million days. Twenty-four percent, 523 thousand,
of all hunters pursued other animals on public land for over 5 million days.
The percent of hunters on private land is similar among different types of hunting. Eighty-four percent of big game hunters hunted on private land, which compares to 83 percent seeking small game, 77 percent seeking migra-tory birds, and 87 percent seeking other animals.
Of all days hunting, 78 percent or 219 million were on private land. The percent of hunting days on private land varied slightly more among types of hunting than the percent of hunters. Seventy-nine percent of big game hunting days, 73 percent of small game hunting days, 57 percent of migra-tory bird hunting days, and 79 percent of other animal days were on private land. Total hunting days pursuing these species on private land were as follows: big game 167 million, small game 37 million, migratory bird 13 million, and other animals 27 million.
Participation in Target Shooting
In preparation for hunting, 7.2 million hunters, 52 percent of all hunters, went target shooting. Twenty-two percent of all hunters, 2.9 million, used shooting ranges. The most commonly used fire-arms at a shooting range were shotguns and rifles (2.3 million hunters) and handguns (1.1 million).
Percent of All Hunting in State of Residence and in Other States (Total: 13.7 million participants)
In state of residence only86%
In state of residenceand other states
8%
In other states only6%
People Hunting on Public and Private Lands
Private only 8.4 million
Public only1.7 million
Public and private3.2 million
Undetermined0.4 million
Number of Hunters Who Target Shoot and Use Shooting Ranges
Used shooting ranges
Target shooting in preparation for hunting 7.2 million
(Total hunters: 13.7 million)
2.9 million

U.S. Fish and Wildlife Service and U.S. Census Bureau 2011 National Survey of Fishing, Hunting, and Wildlife-Associated Recreation 29
Sex and Age
Of the U.S. population 16 years old and older, 11 percent of the males and 1 percent of the females enjoyed hunting in 2011. Of the 13.7 million participants who hunted, 89 percent (12.2 million) were male and 11 percent (1.5 million) were female.
The participation rate in hunting tended to increase with age until indi-viduals reached 65 years of age, and thereafter it declined. During 2011, 5 percent or 419 thousand 16- and 17-year-olds hunted. The participa-tion rate was also 5 percent for 18- to 24-year olds and 25- to 34-year olds. The participation rate climbed to 6 percent for 35- to 44-year olds, and then to 7 percent for 45- to 54-year olds and 55- to 64-year olds. People 65 and older had a participation rate of 4 percent. However, of the 65 and older age group, those who were 65 to 74 years of age had a 5 percent hunting participation rate, while those who were 75 and older had a 2 percent rate.
The age group that contributed the most hunters was 45 to 54 years old. About 3.1 million hunters, which was 23 percent of all hunters, were 45 to 54. Individuals 55 to 64 years old were close in total number of hunters at 2.8 million.
Hunters by Sex and AgeTotal, both sexes . . . 13.7 million
Male . . . . . . . . . . . 12.2 millionFemale . . . . . . . . . 1.5 million
Total, all ages . . . . . 13.7 million16 and 17 . . . . . . . 0.4 million18 to 24 . . . . . . . . 1.3 million25 to 34 . . . . . . . . 2.1 million35 to 44 . . . . . . . . 2.4 million45 to 54 . . . . . . . . 3.1 million55 to 64 . . . . . . . . 2.8 million65 and older . . . . . 1.5 million
Source: Table 10.
Percent of Males and Females Who Hunted in the United States
Females
Males 11%
1%
Percent of Hunters by Sex
Males 89%
Females11%
Percent of Hunters by Age
65 and older 11%
55 to 64 21%
16 and 173%
45 to 54 23%
35 to 44 18%
25 to 3415%
18 to 249%
Percent of U.S. Population Who Hunted by Age
65 and older
55 to 64
45 to 54
35 to 44
25 to 34
18 to 24
16 and 17 5%
5%
5%
6%
7%
7%
4%

30 2011 National Survey of Fishing, Hunting, and Wildlife-Associated Recreation U.S. Fish and Wildlife Service and U.S. Census Bureau
Metropolitan and Nonmetropolitan Hunters
As was the case for fishing, participa-tion rates for hunting were the lowest among residents of the largest metro-politan statistical areas (MSAs)1 and were the highest among non-MSA residents. Residents of the MSAs with a population of 1 million or more hunted at a 3 percent rate, which compares to 18 percent of those who resided outside MSAs. Furthermore the smaller the MSA the higher the participation rate. The rate among residents of MSAs of 50,000 to 249,999 was 11 percent and among residents of MSAs with 250,000 to 999,999 inhabitants the rate was 5 percent.
Despite the lower participation rates among MSA residents, they still made up the majority of hunters. Over 10.9 million hunters were MSA residents, compared to 2.8 million who were non-metropolitan residents.
Household Income of Hunters
The participation rate in hunting increased as household income increased until it reached incomes of $100,000 or more. The participation was highest among those with incomes of $75,000 to $99,999 at 9 percent. Participation rates for those who reported incomes of $50,000 to $74,999 and $100,000 to $149,999 was slightly lower at 8 percent. The participation rate in hunting for household incomes of $40,000 to $49,999 was 7 percent. A participation rate of 5 percent was reported for the following four income groups: $25,000 to $29,999; $30,000 to $34,999; $35,000 to $39,999; and $150,000 or more. The lowest partici-pation rate was 3 percent reported for household incomes of less than $20,000.
The majority of hunters had house-hold incomes of $50,000 or more. Among hunters who reported income, 64 percent had household incomes of $50,000 or more, and 36 percent had household incomes of less than
1 See Appendix A for definition of metropolitan statisti-cal area.
Percent of Hunters by Residence(Hunter population: 13.7 million)
Outside MSA 20%Large MSA
25%
Small MSA 38%
Medium MSA17%
Percent of U.S. Population Who Hunted by Residence(Total U.S. population that hunted: 6 percent)
Outside MSA
Small MSA(50,000 to 249,999)
Medium MSA(250,000 to 999,999)
Large MSA(1,000,000 or more)
3%
5%
11%
18%
Percent of U.S. Population Who Hunted by Household Income
$150,000 or more
$100,000 to $149,999
$75,000 to $99,999
$50,000 to $74,999
$40,000 to $49,999
$35,000 to $39,999
$30,000 to $34,999
$25,000 to $29,999
$20,000 to $24,999
Less than $20,000
5%
8%
9%
8%
7%
5%
5%
5%
4%
3%
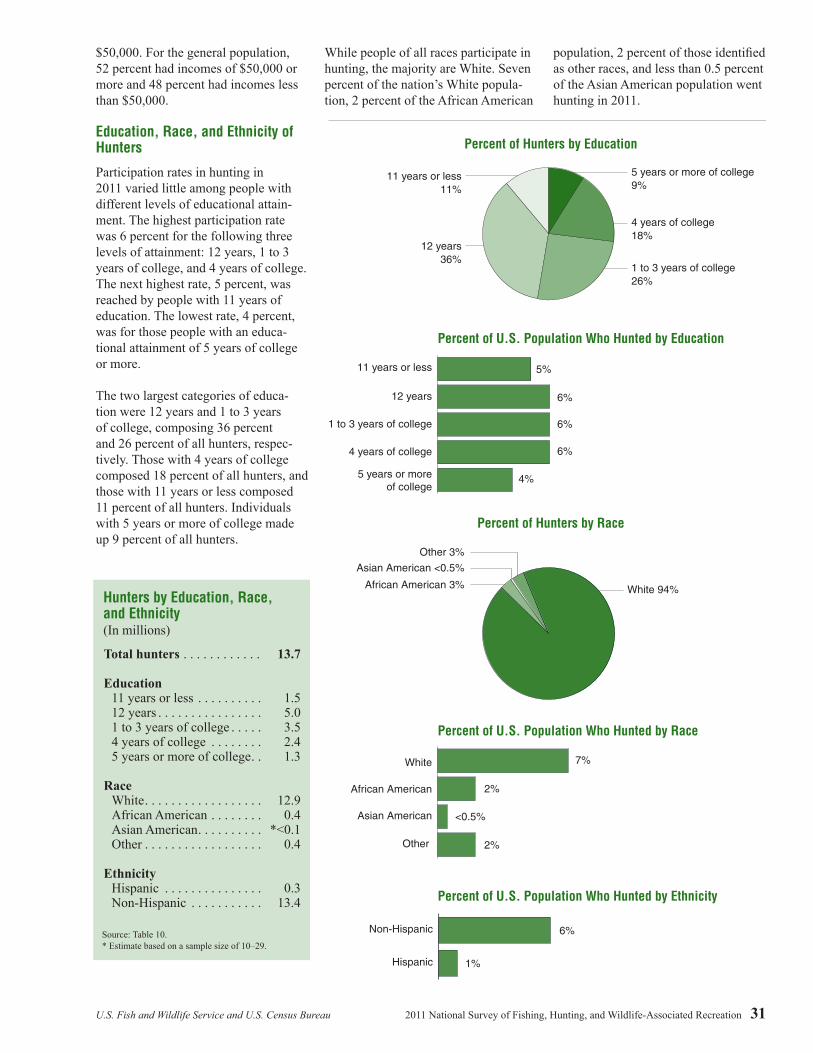
U.S. Fish and Wildlife Service and U.S. Census Bureau 2011 National Survey of Fishing, Hunting, and Wildlife-Associated Recreation 31
$50,000. For the general population, 52 percent had incomes of $50,000 or more and 48 percent had incomes less than $50,000.
Education, Race, and Ethnicity of Hunters
Participation rates in hunting in 2011 varied little among people with different levels of educational attain-ment. The highest participation rate was 6 percent for the following three levels of attainment: 12 years, 1 to 3 years of college, and 4 years of college. The next highest rate, 5 percent, was reached by people with 11 years of education. The lowest rate, 4 percent, was for those people with an educa-tional attainment of 5 years of college or more.
The two largest categories of educa-tion were 12 years and 1 to 3 years of college, composing 36 percent and 26 percent of all hunters, respec-tively. Those with 4 years of college composed 18 percent of all hunters, and those with 11 years or less composed 11 percent of all hunters. Individuals with 5 years or more of college made up 9 percent of all hunters.
While people of all races participate in hunting, the majority are White. Seven percent of the nation’s White popula-tion, 2 percent of the African American
population, 2 percent of those identified as other races, and less than 0.5 percent of the Asian American population went hunting in 2011.
Hunters by Education, Race, and Ethnicity (In millions)
Total hunters . . . . . . . . . . . . 13.7
Education11 years or less . . . . . . . . . . 1.512 years . . . . . . . . . . . . . . . . 5.01 to 3 years of college . . . . . 3.54 years of college . . . . . . . . 2.45 years or more of college . . 1.3
RaceWhite . . . . . . . . . . . . . . . . . . 12.9African American . . . . . . . . 0.4Asian American . . . . . . . . . . *<0.1Other . . . . . . . . . . . . . . . . . . 0.4
EthnicityHispanic . . . . . . . . . . . . . . . 0.3Non-Hispanic . . . . . . . . . . . 13.4
Source: Table 10. * Estimate based on a sample size of 10–29.
Percent of Hunters by Education
4 years of college 18%
11 years or less11%
5 years or more of college 9%
1 to 3 years of college 26%
12 years36%
Percent of U.S. Population Who Hunted by Education
5 years or moreof college
4 years of college
1 to 3 years of college
12 years
11 years or less 5%
6%
6%
6%
4%
Percent of Hunters by Race
White 94%
Other 3%
African American 3%
Asian American <0.5%
Percent of U.S. Population Who Hunted by Race
Other
Asian American
African American
White 7%
2%
<0.5%
2%
Percent of U.S. Population Who Hunted by Ethnicity
Hispanic
Non-Hispanic 6%
1%

32 2011 National Survey of Fishing, Hunting, and Wildlife-Associated Recreation U.S. Fish and Wildlife Service and U.S. Census Bureau
Hispanics, who represent a growing percentage of the U.S population, hunted at a much lower rate than non-Hispanics. One percent of all Hispanics hunted in 2011 compared to 6 percent of non-Hispanics. The 271 thousand Hispanics who hunted in 2011 made up 2 percent of all hunters.
2001–2011 Comparison of Hunting Activity
The number of hunters increased 9 percent from 2006 to 2011. Other animal hunters increased 92 percent in number and the other types of hunting stayed level at the 95 percent level of significance. Total days of hunting went up 28 percent, primarily due to a 29 percent increase in big game hunting days. Other animal
hunting days also went up signifi-cantly. Trip-related, equipment, and other expenditures went up 29 percent. Trip-related expenditures increased 39 percent, equipment expenditures did not increase significantly, and other expenditures such as land leasing and owning went up 40 percent.
Comparing 2001 and 2011 estimates reveals no statistically significant change in the number of overall hunters, but does show increases in the number of days and expendi-tures. Small game hunting participant numbers went down, while other animal participant numbers went up. Days of big game and other animal hunting went up significantly, while small game and migratory bird hunting
days did not have a significant change. Turning to expenditures, the compar-ison is similar to 2006–2011. Overall expenditures went up, with trip-related and other items undergoing an increase and equipment staying level.
The across-the-board increases in 2011 hunting participation, day, and expenditure estimates run counter to the downward trends documented in the preceding three FHWAR National Surveys. From 1991 to 2006, hunting participation had dropped 11 percent and the number of hunting days had not significantly changed. The 9 percent participant and 28 percent day increases puts the 2011 hunting status on par with that of 1991 hunting, the high point of hunting in the last twenty years.
Number of Hunters(Millions)
201120062001
13.0 12.5 13.7
Days of Hunting (Millions)
201120062001
H(
228 220
282
unting Expenditures Billions of 2011 dollars)
201120062001
$26.2 $25.5
$33.0

U.S. Fish and Wildlife Service and U.S. Census Bureau 2011 National Survey of Fishing, Hunting, and Wildlife-Associated Recreation 33
2001–2011 Hunting Participants, Days, and Expenditures (U.S. population 16 years old and older. Numbers in thousands)
2001 2011 2001-2011Number Percent Number Percent percent change
Hunters, total . . . . . . . . . . . . . . . . . . . . . . . 13,03410,9115,4342,9561,047
1008442238
13,67411,5704,5062,583
**2,168
10085331916
NS5NS6
–17NS–13
107
Big game . . . . . . . . . . . . . . . . . . . . . . . . . Small game . . . . . . . . . . . . . . . . . . . . . . . Migratory birds . . . . . . . . . . . . . . . . . . . . Other animals . . . . . . . . . . . . . . . . . . . . .
Days, total . . . . . . . . . . . . . . . . . . . . . . . . . . 228,368
153,19160,14229,31019,207
1006726138
281,884212,11650,88423,263
**34,434
10075188
12
2338
NS–15NS–21
79
Big game . . . . . . . . . . . . . . . . . . . . . . . . . Small game . . . . . . . . . . . . . . . . . . . . . . . Migratory birds . . . . . . . . . . . . . . . . . . . . Other animals . . . . . . . . . . . . . . . . . . . . .
Hunting, total (2011 dollars) . . . . . . . . . . . $26,178,562
6,671,18913,160,3875,793,9371,527,7365,838,6876,346,987
1002550226
2224
***$32,999,416 10,421,18913,972,4907,738,3241,844,8804,389,286
***8,605,739
1003242236
1326
2656
NS 634
NS21NS–25
36
Trip-related . . . . . . . . . . . . . . . . . . . . . . . Equipment, total . . . . . . . . . . . . . . . . . . . Hunting equipment . . . . . . . . . . . . . . . Auxiliary equipment . . . . . . . . . . . . . . Special equipment. . . . . . . . . . . . . . . . Other . . . . . . . . . . . . . . . . . . . . . . . . . . . .
NS Not different from zero at the 5 percent level of significance. ** Other animals redefined to include feral pigs. *** Plantings not included in 2011 expenditures for comparison purposes. 2011 was first year plantings were included.
2006–2011 Hunting Participants, Days, and Expenditures (U.S. population 16 years old and older. Numbers in thousands)
2006 2011 2006-2011Number Percent Number Percent percent change
Hunters, total . . . . . . . . . . . . . . . . . . . . . . . 12,51010,6824,7972,2931,128
1008538189
13,67411,5704,5062,583
**2,168
10085331916
9NS8
NS–6NS13
92
Big game . . . . . . . . . . . . . . . . . . . . . . . . . Small game . . . . . . . . . . . . . . . . . . . . . . . Migratory birds . . . . . . . . . . . . . . . . . . . . Other animals . . . . . . . . . . . . . . . . . . . . .
Days, total . . . . . . . . . . . . . . . . . . . . . . . . . . 219,925
164,06152,39519,77015,205
100752497
281,884212,11650,88423,263
**34,434
10075188
12
2829
NS–3NS18126
Big game . . . . . . . . . . . . . . . . . . . . . . . . . Small game . . . . . . . . . . . . . . . . . . . . . . . Migratory birds . . . . . . . . . . . . . . . . . . . . Other animals . . . . . . . . . . . . . . . . . . . . .
Hunting, total (2011 dollars) . . . . . . . . . . . $25,543,470
7,451,78911,973,8755,987,6111,484,2144,502,0476,117,806
1002947236
1824
***$32,999,41610,421,18913,972,4907,738,3241,844,8804,389,286
***8,605,739
1003242236
1326
2940
NS1729
NS24NS–3
41
Trip-related. . . . . . . . . . . . . . . . . . . . . . . . . Equipment, total. . . . . . . . . . . . . . . . . . . . . Hunting equipment. . . . . . . . . . . . . . . . . Auxiliary equipment. . . . . . . . . . . . . . . . Special equipment . . . . . . . . . . . . . . . . . Other . . . . . . . . . . . . . . . . . . . . . . . . . . . . .
NS Not different from zero at the 5 percent level of significance. ** Other animals redefined to include feral pigs. *** Plantings not included in 2011 expenditures for comparison purposes. 2011 was first year plantings were included.

Wildlife Watching

U.S. Fish and Wildlife Service and U.S. Census Bureau 2011 National Survey of Fishing, Hunting, and Wildlife-Associated Recreation 35
Wildlife Watching

36 2011 National Survey of Fishing, Hunting, and Wildlife-Associated Recreation U.S. Fish and Wildlife Service and U.S. Census Bureau
Wildlife Watching Highlights
Nearly a third of the U.S. population enjoyed wildlife watching in 2011. Wildlife watching is defined here as closely observing, feeding, and photo-graphing wildlife, visiting public parks around the home because of wildlife, and maintaining plantings and natural areas around the home for the benefit of wildlife. These activities are catego-rized as around the home (within a mile of home) or away from home (at least one mile from home).
The 2011 Survey counts wildlife watching as recreational activities, as defined above, in which the primary objective was to watch wildlife. Secondary or incidental participation, such as observing wildlife while doing something else, was not included in the Survey.
During 2011, 71.8 million U.S. resi-dents, 30 percent of the U.S. popula-tion 16 years old or older, participated
in wildlife-watching activities. People who took an interest in wildlife around their homes numbered 68.6 million, while those who took trips away from their homes to wildlife watch numbered 22.5 million people.
Wild Bird Observers
Of all the wildlife in the United States, birds attracted the biggest following. Approximately 46.7 million people observed birds around the home and on trips in 2011. A large majority, 88 percent (41.3 million), observed wild birds around the home, while 38 percent, 17.8 million, took trips away from home to observe wild birds. Participants averaged a startling 110 days of birding in 2011, due to the 119 days by around-the-home birders. Away-from-home birders averaged 13 days.
Wildlife-Watching Participants (In millions)
Away from home
Around the home
Total 71.8
68.6
22.5
Bird Watchers (In millions)
Away from home
Around the home
Total 46.7
41.3
17.8
Wildlife-Watching Participants by Activity (In millions)
Total wildlife-watching participants . . . . . . . . . . . . 71.8
Away from home . . . . . . . . 22.5Observers . . . . . . . . . . . . 19.8Photographers . . . . . . . . . 12.4Feeders . . . . . . . . . . . . . . 5.4
Around the home . . . . . . . . 68.6Feeders . . . . . . . . . . . . . . 52.8Observers . . . . . . . . . . . . 45.0Photographers . . . . . . . . . 25.4Maintainers of plantings or natural areas . . . . . . . . 13.4Visitors of parks or natural areas . . . . . . . . 12.3
Source: Table 35.

U.S. Fish and Wildlife Service and U.S. Census Bureau 2011 National Survey of Fishing, Hunting, and Wildlife-Associated Recreation 37
Wildlife-Watching Expenditures
Thirty-eight percent of all the dollars spent in 2011 for wildlife-related recre-ation was due to wildlife watching. Wildlife-watching participants 16 years old or older spent $54.9 billion, an average of $981 per spender. Seventy-eight percent of all wildlife watchers spent money on their avocation.
Wildlife watchers spent $17.3 billion on trips pursuing their activities. Food and lodging accounted for $9.3 billion (54 percent of all trip-related expendi-tures), transportation expenses totaled $6.0 billion (35 percent), and other trip costs, such as land use fees and equip-ment rental, amounted to $1.9 billion (11 percent) for the year.
These recreationists purchased $27.2 billion worth of equipment for wildlife watching. They spent $11.3 billion (42 percent of all equipment expendi-tures) on wildlife-watching equipment including binoculars, cameras, bird food, and special clothing. Expendi-tures for auxiliary equipment, such as tents and backpacking equipment, totaled $1.6 billion (6 percent) for the year. Participants spent $14.3 billion (53 percent) on special equipment, including off-road vehicles, campers, and boats.
Also for the year, wildlife watchers spent $5.7 billion on land leasing and owning; $2.2 billion on plantings for the benefit of wildlife; $2.2 billion on membership dues and contributions; and $0.4 billion on magazines, books, and DVDs.
Total Wildlife-Watching Expenditures
Total wildlife-watching expenditures . . . . . . . . . . . . . . . . . $54.9 billion
Total trip-related . . . . . . . . . . . . . . . . . . . . . . . . . . . . . . . . . . $17.3 billionFood and lodging . . . . . . . . . . . . . . . . . . . . . . . . . . . . . . . . 9.3 billionTransportation . . . . . . . . . . . . . . . . . . . . . . . . . . . . . . . . . . . 6.0 billionOther trip costs . . . . . . . . . . . . . . . . . . . . . . . . . . . . . . . . . . 1.9 billion
Total equipment expenditures . . . . . . . . . . . . . . . . . . . . . . . $27.2 billionWildlife-watching equipment . . . . . . . . . . . . . . . . . . . . . . . 11.3 billionAuxiliary equipment . . . . . . . . . . . . . . . . . . . . . . . . . . . . . . 1.6 billionSpecial equipment . . . . . . . . . . . . . . . . . . . . . . . . . . . . . . . . 14.3 billion
Total other equipment. . . . . . . . . . . . . . . . . . . . . . . . . . . . . . $10.5 billionLand leasing and owning . . . . . . . . . . . . . . . . . . . . . . . . . . 5.7 billionPlantings . . . . . . . . . . . . . . . . . . . . . . . . . . . . . . . . . . . . . . . 2.2 billionMembership dues and contributions . . . . . . . . . . . . . . . . . . 2.2 billionMagazines, books, DVDs . . . . . . . . . . . . . . . . . . . . . . . . . . 0.4 billion
Source: Table 40.
Wildlife-Watching Expenditures(Total expenditures: $54.9 billion)
Other $10.5 billion19%
Trip-related $17.3 billion31%
Equipment$27.2 billion
49%
Trip-Related Expenditures (Total expenditures: $17.3 billion)
Transportation $6.0 billion35%
Other trip-related costs$1.9 billion
11%
Food $5.5 billion32%
Lodging$3.9 billion
22%

38 2011 National Survey of Fishing, Hunting, and Wildlife-Associated Recreation U.S. Fish and Wildlife Service and U.S. Census Bureau
Around-The-Home Wildlife-Watching Highlights
In 2011, around-the-home participants 16 years old and older numbered 68.6 million—96 percent of all wildlife-watching recreationists. The most popular activity, feeding birds and other wildlife, accounted for 52.8 million wildlife watchers—77 percent of all around-the-home participants. About 45 million people observed wildlife, representing 66 percent of all around-the-home participants.
Approximately 25.4 million recreation-ists (37 percent of all around-the-home wildlife watchers) photographed wildlife. About 13.4 million maintained plantings or natural areas for the benefit of wildlife. They made up 19 percent of all around-the-home participants. Finally, 12.3 million people visited parks or natural areas within one mile of their homes for wildlife watching. They comprised 18 percent of all around-the-home participants.
Percent of Total Around-The-Home Participants by Activity (Total: 68.6 million participants)
Maintainplantings
Maintainnaturalareas
Visitparks ornaturalareas
PhotographFeedother
wildlife
ObserveFeedwildbirds
73%
13%12%
18%
37%
22%
66%
Around-The-Home Participants (In millions)Total participants . . . . . . . . 68.6
Feed wildlife . . . . . . . . . . . 52.8Observe wildlife . . . . . . . . 45.0Photograph wildlife . . . . . . 25.4Visits parks or natural areas . . . . . . . . . . . . . . . . . 12.3Maintain plantings . . . . . . 9.2Maintain natural areas . . . . 8.0
Source: Table 37.

U.S. Fish and Wildlife Service and U.S. Census Bureau 2011 National Survey of Fishing, Hunting, and Wildlife-Associated Recreation 39
Wildlife Fed, Observed, or Photographed by Around-The-Home Participants
Of the 52.8 million people feeding wildlife around their homes in 2011, 95 percent (50.2 million) fed wild birds, while 28 percent (14.8 million) fed other wildlife.
Approximately 45.0 million partici-pants closely observed wildlife around their homes, of which 41.3 million observed birds. Observing mammals was undertaken by 35.9 million partici-pants. Insects and spiders attracted the attention of 16.6 million people; 14.1 million observed amphibians or reptiles; and 8.4 million people observed fish and other wildlife. The median number of days for around-the-home observations for all animals was a little over 87 days in 2011.
About 25.4 million people photo-graphed wildlife around their homes. The median number of days people took pictures of wildlife around their homes in 2011 was 4 days, although 3.7 million people (15 percent) photo-graphed wildlife 21 days or more.
Around-The-Home Wildlife Watchers by Geographic Region
In 2011, over 239 million people 16 years old or older lived in the United States. Of those, 29 percent wildlife watched around their homes. The participation rates of these around-the-home participants varied by region.
The percentages of regional popula-tions that wildlife watched around their homes ranged from 24 percent in the Pacific Region to 35 percent in the East North Central Region. The New England, East North Central, West North Central, and East South Central had participation rates above the national average of 29 percent.
The regions making up the largest number of around-the-home wild-life watchers in the United States were the South Atlantic (12.8 million participants) and the East North Central Region (12.5 million participants).
Percent of Around-The-Home Observersby Type of Wildlife Observed
(Total wildlife observers: 45.0 million)
Percent of Around-The-Home Photographersby Days Spent Photographing Wildlife
(Total wildlife photographers: 25.4 million)
21 days or more15%
11 to 20 days12%
6 to 10 days17%
Fish orother wildlife
Amphibiansor reptiles
Insects orspiders
Mammals
Birds 92%
19%
31%
37%
80%
4 to 5 days15%
2 to 3 days23%
1 day17%
AK
WA
OR
CA
MT
WY
ID
NVUT
AZ
CO
NM
ND
SD
NE
KS
OK
TX
MN
IA
MO
AR
LA
WI
IL
MI
IN OH
KY
TN
MS AL
FL
GA
SC
NC
VAWV
PA
NY
MENHVT
MA
RICT
NJ
DEMD
DC
HI
Around-The-Home Wildlife-Watching Participation(National participation rate: 29 percent)
Pacific24%
Mountain28%
West North Central
33%
East North Central
35%
Middle Atlantic
27%
New England 33%
South Atlantic 28%
East South Central
31%West South Central
26%

40 2011 National Survey of Fishing, Hunting, and Wildlife-Associated Recreation U.S. Fish and Wildlife Service and U.S. Census Bureau
Sex and Age of Around-The-Home Wildlife Watchers
Females and males had similar partici-pation rates for around-the-home wildlife watching. In 2011, 30 percent of females and 27 percent of males enjoyed around-the-home activities. Of the 68.6 million around-the-home wildlife watchers, 54 percent (37.3 million) were females and 46 percent (31.3 million) were males.
People in the 65- to 74-year-old age group were most likely to participate at 53 percent (11.9 million). People in the 18- to 24-year-old age group were the least likely to participate, with 9 percent (2.4 million). The disparity in participation rates between people 16 to 34 years old (14 percent) and those 35 years old and older (35 percent) is striking.
Percent of Males and Females Who Participated Around-The-Home
Females
Males 27%
30%
Percent of Around-The-Home Wildlife Watchers by Sex(Total participants: 68.6 million)
Males 46%
Females54%
Percent of Around-The-Home Wildlife Watchers by Age(Total participants: 68.6 million)
65 and older 26%
55 to 64 23%
16 and 171%
45 to 54 22%
35 to 4413%
25 to 3411%
18 to 243%
Percent of U.S. Population Who Participated Around-The-Home by Age
65 and older
55 to 64
45 to 54
35 to 44
25 to 34
18 to 24
16 and 17 12%
9%
18%
23%
32%
41%
47%
Around-The-Home Participants by Sex and Age (In millions)Total, both sexes. . . . 68.6 million
Male . . . . . . . . . . . 31.3 millionFemale . . . . . . . . . . 37.3 million
Total, all ages . . . . . . 68.6 million16 and 17 . . . . . . . . 0.9 million18 to 24 . . . . . . . . . 2.4 million25 to 34 . . . . . . . . . 7.3 million35 to 44 . . . . . . . . . 9.3 million45 to 54 . . . . . . . . . 14.9 million55 to 64 . . . . . . . . . 15.8 million65 and older . . . . . . 18.1 million
Source: Table 42.
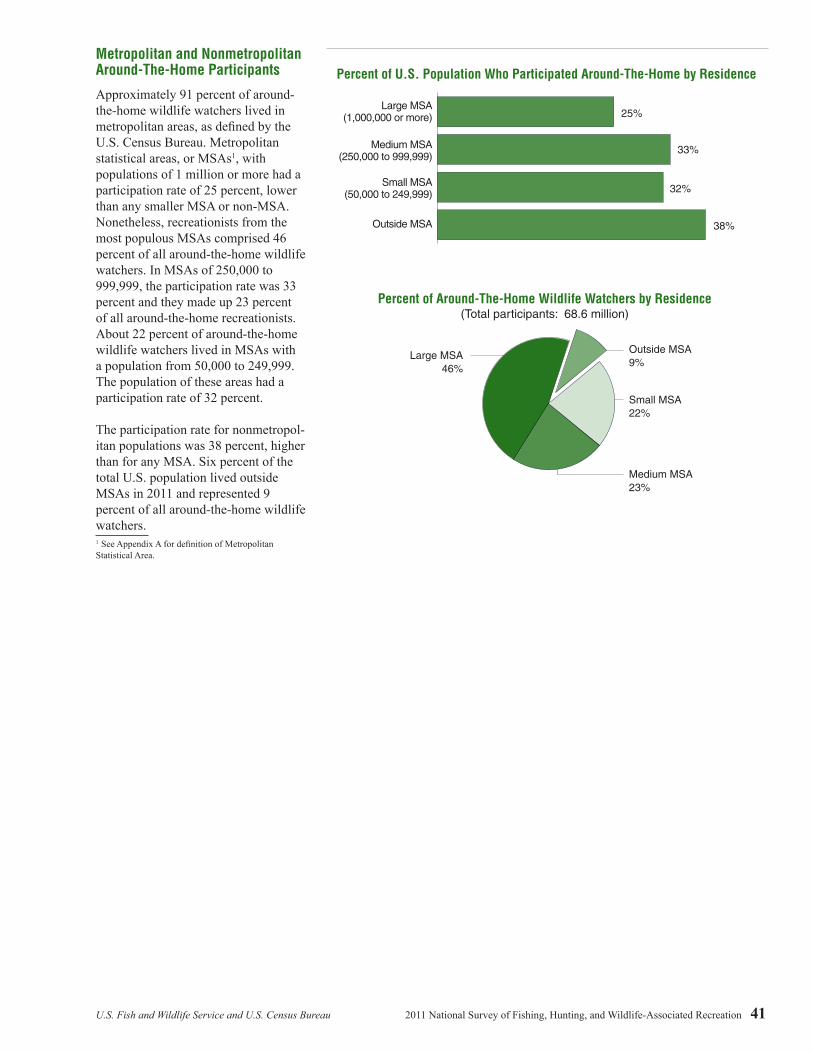
U.S. Fish and Wildlife Service and U.S. Census Bureau 2011 National Survey of Fishing, Hunting, and Wildlife-Associated Recreation 41
Metropolitan and Nonmetropolitan Around-The-Home Participants
Approximately 91 percent of around-the-home wildlife watchers lived in metropolitan areas, as defined by the U.S. Census Bureau. Metropolitan statistical areas, or MSAs1, with populations of 1 million or more had a participation rate of 25 percent, lower than any smaller MSA or non-MSA. Nonetheless, recreationists from the most populous MSAs comprised 46 percent of all around-the-home wildlife watchers. In MSAs of 250,000 to 999,999, the participation rate was 33 percent and they made up 23 percent of all around-the-home recreationists. About 22 percent of around-the-home wildlife watchers lived in MSAs with a population from 50,000 to 249,999. The population of these areas had a participation rate of 32 percent.
The participation rate for nonmetropol-itan populations was 38 percent, higher than for any MSA. Six percent of the total U.S. population lived outside MSAs in 2011 and represented 9 percent of all around-the-home wildlife watchers.1 See Appendix A for definition of Metropolitan Statistical Area.
Percent of U.S. Population Who Participated Around-The-Home by Residence
Outside MSA
Small MSA(50,000 to 249,999)
Medium MSA(250,000 to 999,999)
Large MSA(1,000,000 or more)
38%
32%
33%
25%
Percent of Around-The-Home Wildlife Watchers by Residence(Total participants: 68.6 million)
Outside MSA 9%
Small MSA22%
Medium MSA 23%
Large MSA46%

42 2011 National Survey of Fishing, Hunting, and Wildlife-Associated Recreation U.S. Fish and Wildlife Service and U.S. Census Bureau
Household Income of Around-The-Home Participants
Participation rates ranged from 22 percent among U.S. residents living in households earning less than $20,000 per year and $25,000 to $29,999 per year to 36 percent of those living in households earning $150,000 or more annually. These participants made up 10 percent, 3 percent, and 9 percent, respectively, of the 68.6 million
around-the-home wildlife watchers in 2011.
Participants in households earning $50,000 to $74,999 a year constituted the largest number, 11.7 million, and had a 35 percent participation rate. The next two income groups with the largest numbers of participants had household incomes of $75,000 to $99,999 and $100,000 to $149,999. The former contributed 8.6 million participants
and had a 34 percent participation rate, while the latter contributed 8.3 million and had a 35 percent participation rate. The number of around-the-home recreationists contributed by other income groups ranged from 2.2 million participants with $25,000 to $29,999 household incomes and 22 percent participation rates to 6.1 million partici-pants with $150,000 or more incomes and 36 percent participation rates.
Percent of U.S. Population Who Participated Around-The-Home by Household Income
$150,000 or more
$100,000 to $149,999
$75,000 to $99,999
$50,000 to $74,999
$40,000 to $49,999
$35,000 to $39,999
$30,000 to $34,999
$25,000 to $29,999
$20,000 to $24,999
Less than $20,000
36%
35%
34%
35%
29%
28%
35%
22%
27%
22%

U.S. Fish and Wildlife Service and U.S. Census Bureau 2011 National Survey of Fishing, Hunting, and Wildlife-Associated Recreation 43
Education, Race, and Ethnicity of Around-The-Home Participants
Looking at the educational background of participants, it was found that the rate of participation in around-the-home wildlife watching increased with the increase in educational attainment. The highest participation rate was among recreationists with 5 years or more of college, 43 percent. They made up 18 percent of all around-the-home wildlife watchers. The lowest participa-tion rate, 17 percent, was among people with 11 years or less of education— 8 percent of all participants. Recre-ationists with 12 years of education, 30 percent of all around-the-home participants, had a participation rate of 25 percent. Participants with 1 to 3 years of college, 22 percent of all participants, had a participation rate of 28 percent. Recreationists with 4 years of college, 23 percent of all partici-pants, had a participation rate of 36 percent.
A wide range of participation rates were found among the different races and ethnic groups. About 34 percent of the White population engaged in
Percent of Around-The-Home Wildlife Watchers by Education(Total: 68.6 million participants)
5 years or more of college18%
4 years of college23%
1 to 3 years of college 22%
12 years30%
11 years or less8%
Percent of U.S. Population Who Participated Around-The-Home by Education
5 years or moreof college
4 years of college
1 to 3 years of college
12 years
11 years or less 17%
43%
36%
28%
25%
Percent of Around-The-Home Wildlife Watchers by Race(Total: 68.6 million participants)
White 91%
Asian American 1%African American 4%
Other 4%
Percent of U.S. Population Who Participated Around-The-Home by Ethnicity
Hispanic
Non-Hispanic 32%
10%
Around-The-Home Participants by Education, Race, and Ethnicity (In millions)Total participants. . . . . . . . . 68.6
Education11 years of less . . . . . . . . . 5.412 years . . . . . . . . . . . . . . . 20.31 to 3 years of college . . . . 15.34 years of college . . . . . . . 15.55 years or more of college . 12.1
RaceWhite . . . . . . . . . . . . . . . . . 62.5African American . . . . . . . 2.6Asian American . . . . . . . . . 1.0Other . . . . . . . . . . . . . . . . . 2.6
EthnicityHispanic . . . . . . . . . . . . . . 3.4Non-Hispanic . . . . . . . . . . 65.2
Source: Table 42.

44 2011 National Survey of Fishing, Hunting, and Wildlife-Associated Recreation U.S. Fish and Wildlife Service and U.S. Census Bureau
around-the-home wildlife watching, contrasted with 11 percent of the African American population, 8 percent of the Asian American population, and 12 percent of individuals comprising other races. Of the total number of around-the-home participants, 91 percent were White, 4 percent were African Americans, 1 percent was Asian American, and 4 percent were all other races.
Ten percent of the U.S. Hispanic popu-lation engaged in wildlife watching around their homes in comparison with 32 percent of the non-Hispanic popula-tion. The 65.2 million non-Hispanic participants comprised 95 percent of all around-the-home wildlife watchers and
the 3.4 million Hispanic participants made up 5 percent.
Away-From-Home Wildlife-Watching Highlights
In 2011, 22.5 million people 16 years old and older took trips away from home to feed, observe, or photograph wildlife. They comprised 31 percent of all wildlife watchers. Most popular with away-from-home participants was closely observing wildlife. About 19.8 million participants, 8 percent of the U.S. population 16 years old and older, observed wildlife an average of 14 days in 2011. Photographing wildlife was enjoyed by 12.4 million people, 5 percent of the U.S. population. They averaged 9 days per photographer.
Approximately 5.4 million people fed wildlife an average of 11 days and comprised 2 percent of the U.S. popula-tion.
About 82 percent of all away-from-home participants took trips within their resident state to participate in wildlife watching. Approximately 70 percent took trips only in their resident state, 12 percent took trips both inside and outside their resident state, and 18 percent took trips only to other states. Altogether, 30 percent of all away-from-home participants took at least some of their trips to other states.
Percent of U.S. Population Who Participated Away-From-Home by Type of Activity(Total: 22.5 million participants)
Feed
Photograph
Observe
24%
55%
88%
Away-From-Home Participants (In millions)Total participants . . . . . . . . . 22.5
Observers . . . . . . . . . . . . . 19.8Photographers . . . . . . . . . . 12.4Feeders . . . . . . . . . . . . . . . 5.4
Total days . . . . . . . . . . . . . . . 336Observers . . . . . . . . . . . . . 269Photographers . . . . . . . . . . 110Feeders . . . . . . . . . . . . . . . 59
Source: Table 36.
Percent of Away-From-Home Wildlife Watchersin State of Residence and Other States
(Total participants: 22.5 million)
In state of residence and in other states12%
In state of residence only70%
In other states only18%

U.S. Fish and Wildlife Service and U.S. Census Bureau 2011 National Survey of Fishing, Hunting, and Wildlife-Associated Recreation 45
Wildlife Observed, Fed, or Photographed by Away-From-Home Participants
Wild birds attracted the most interest from wildlife watchers on their trips—18.9 million people or 84 percent of all away-from-home participants. The most-watched birds, waterfowl (ducks and geese, primarily), were watched by 13.3 million people. Next on the list of most-watched were birds of prey which drew 12.9 million trip-takers, followed by songbirds with 12.1 million watchers. Herons, shore birds, and other water birds attracted 10.6 million recreationists. Lastly, other birds, such as road runners and turkeys, attracted 6.9 million wildlife watchers.
Land mammals, such as deer, bears, and coyotes, were observed, fed, or photographed by 13.7 million people—61 percent of all away-from-home participants. Fish attracted the attention of 6.4 million people or 28 percent of all away-from-home recre-ationists.
About 4.0 million people or 18 percent of all away-from-home participants observed, fed, or photographed marine mammals, such as whales, seals, and dolphins. Other wildlife, such as butter-flies, snakes, and turtles, appealed to 10.1 million people or 45 percent of all away-from-home wildlife watchers.
Away-From-Home Participants by Type of Wildlife Observed, Fed, or Photographed(In millions)Total participants . . . . . . . . 22.5
Birds, total . . . . . . . . . . . . . 18.9Waterfowl. . . . . . . . . . . . . . 13.3Birds of prey . . . . . . . . . . . 12.9Songbirds . . . . . . . . . . . . . . 12.1Other water birds . . . . . . . . 10.6Other birds . . . . . . . . . . . . . 6.9
Land mammals, total . . . . . 13.7Large land mammals . . . . . 10.4Small land mammals . . . . . 10.3
Fish . . . . . . . . . . . . . . . . . . . 6.4
Marine mammals . . . . . . . . 4.0
Other (turtles, butterflies, etc.) . . . . . . . . . 10.1
Source: Table 38.
Percent of Away-From-Home Wildlife Watchers Who Observed, Fed, or Photographed Wildlife
(Total: 22.5 million participants)
Other (turtles,butterflies, etc.)
Marine mammals
Fish
Land mammals
Birds 84%
45%
18%
28%
61%

46 2011 National Survey of Fishing, Hunting, and Wildlife-Associated Recreation U.S. Fish and Wildlife Service and U.S. Census Bureau
Area Visited by Away-From-Home Participants
In 2011, the most visited areas for Americans to observe, feed, or photo-graph wildlife were publicly owned. Approximately 82 percent of all trip-taking wildlife watchers used public areas while just 34 percent used private areas. About 25 percent of all away-from-home participants, 5.5 million, visited both public and private areas. Approximately 12.8 million, 57 percent, visited only public areas to engage in their activities while 2.0 million, 9 percent, visited only private areas.
Percent of Away-From-Home Wildlife Watchersby Public and Private Land
(Total participants: 22.5 million)
Public and private25%
Private only9%
Public only57%
Not reported9%
Away-From-Home Participants by Public and Private Land (In millions)Total participants . . . . . . . . . 22.5
Public land only . . . . . . . . 12.8Private land only . . . . . . . . 2.1Public and private land . . . 5.5Not reported . . . . . . . . . . . 2.0
Source: Table 36.

U.S. Fish and Wildlife Service and U.S. Census Bureau 2011 National Survey of Fishing, Hunting, and Wildlife-Associated Recreation 47
Away-From-Home Wildlife Watchers by Geographic Region
In 2011, 239 million people 16 years old and older lived in the United States—9 percent of whom took trips to wildlife watch.
Away-from-home participation rates ranged from 6 percent in the West South Central Region to 13 percent in the Mountain Region. The regions that had participation rates higher than the national average were New England, West North Central, East South Central, Mountain, and Pacific.
AK
WA
OR
CA
MT
WY
ID
NVUT
AZ
CO
NM
ND
SD
NE
KS
OK
TX
MN
IA
MO
AR
LA
WI
IL
MI
IN OH
KY
TN
MS AL
FL
GA
SC
NC
VAWV
PA
NY
MENHVT
MA
RICT
NJ
DEMD
DC
HI
Away-From-Home Wildlife Watchers by Geographic Region(National participation rate: 9 percent)
Pacific10%
Mountain13%
West North Central
11%
East North Central
9%
Middle Atlantic
8%
New England 10%
South Atlantic 9%
East South Central
10%West South Central
6%

48 2011 National Survey of Fishing, Hunting, and Wildlife-Associated Recreation U.S. Fish and Wildlife Service and U.S. Census Bureau
Sex and Age of Away-From-Home Wildlife Watchers
A similar number of males and females participated in away-from-home wild-life watching in 2011. Fifty-one percent (11.5 million) of all participants were males and 49 percent (11.0 million) were females. Ten percent of males and 9 percent of females in the United States enjoyed observing, feeding, or photographing wildlife away from home.
The 45- to 54-year-old age group had the most away-from-home recreation-ists, 5.8 million. This age group, the 55- to 64-year-olds, and the 65- to 74-year olds had the highest participa-tion rate, 12 percent. Another age group that had a high participation rate was the 35- to 44-year-old age group, 11 percent. The 18- to 24-year-olds had the lowest participation rate, at 3 percent.
Percent of Males and Females Who Participated Away-From-Home
Females
Males 10%
9%
Percent of Away-From-Home Wildlife Watchers by Sex
Males51%
Females49%
Percent of Away-From-Home Wildlife Watchers by Age
65 and older15%
45 to 5426%
35 to 4419%
16 and 172%
55 to 6421%
25 to 3414%
18 to 243%
Percent of U.S. Population Who Participated by Age
65 and older
55 to 64
45 to 54
35 to 44
25 to 34
18 to 24
16 and 17
12%
12%
9%
11%
7%
3%
4%
Away-From-Home Participants by Sex and Age (In millions)Total, both sexes. . . . . . . . . . 22.5
Male . . . . . . . . . . . . . . . . . 11.5Female . . . . . . . . . . . . . . . . 11.0
Total, all ages . . . . . . . . . . . . 22.516 and 17 . . . . . . . . . . . . . . 0.318 to 24 . . . . . . . . . . . . . . . 0.825 to 34 . . . . . . . . . . . . . . . 3.135 to 44 . . . . . . . . . . . . . . . 4.345 to 54 . . . . . . . . . . . . . . . 5.855 to 64 . . . . . . . . . . . . . . . 4.765 and older . . . . . . . . . . . . 3.4
Source: Table 41.
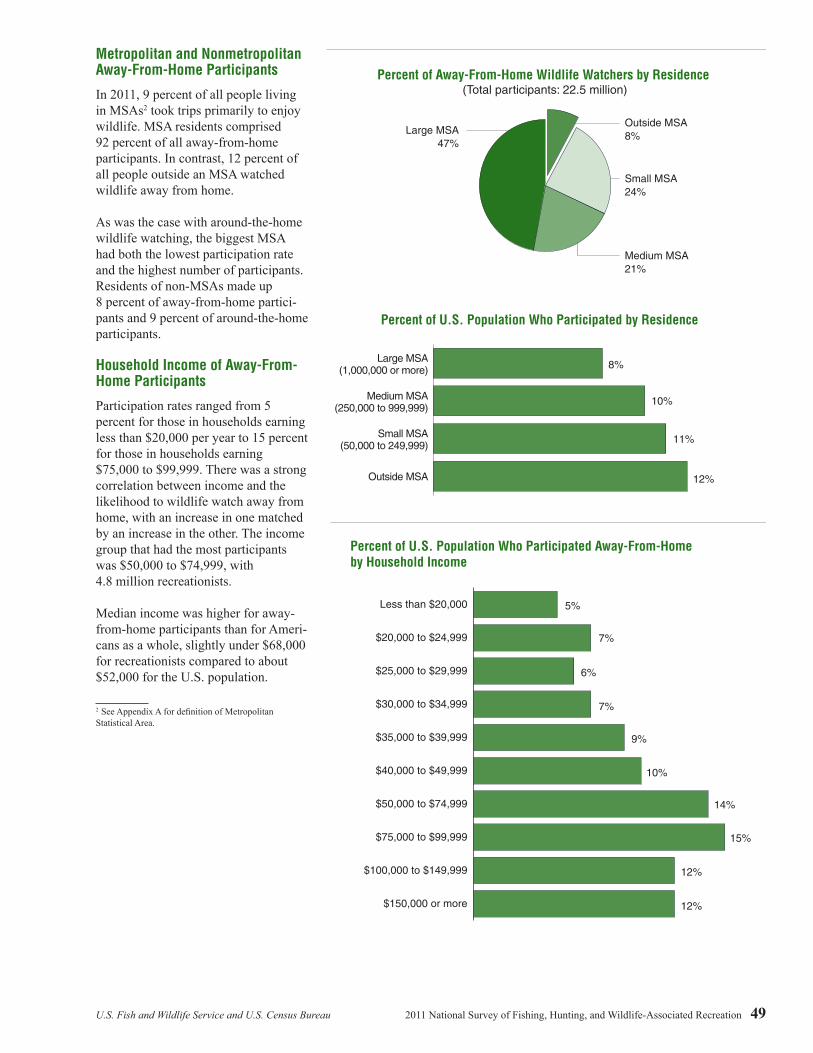
U.S. Fish and Wildlife Service and U.S. Census Bureau 2011 National Survey of Fishing, Hunting, and Wildlife-Associated Recreation 49
Metropolitan and Nonmetropolitan Away-From-Home Participants
In 2011, 9 percent of all people living in MSAs2 took trips primarily to enjoy wildlife. MSA residents comprised 92 percent of all away-from-home participants. In contrast, 12 percent of all people outside an MSA watched wildlife away from home.
As was the case with around-the-home wildlife watching, the biggest MSA had both the lowest participation rate and the highest number of participants. Residents of non-MSAs made up 8 percent of away-from-home partici-pants and 9 percent of around-the-home participants.
Household Income of Away-From-Home Participants
Participation rates ranged from 5 percent for those in households earning less than $20,000 per year to 15 percent for those in households earning $75,000 to $99,999. There was a strong correlation between income and the likelihood to wildlife watch away from home, with an increase in one matched by an increase in the other. The income group that had the most participants was $50,000 to $74,999, with 4.8 million recreationists.
Median income was higher for away-from-home participants than for Ameri-cans as a whole, slightly under $68,000 for recreationists compared to about $52,000 for the U.S. population.
2 See Appendix A for definition of Metropolitan Statistical Area.
Percent of Away-From-Home Wildlife Watchers by Residence (Total participants: 22.5 million)
Outside MSA 8%
Small MSA24%
Medium MSA 21%
Large MSA47%
Percent of U.S. Population Who Participated by Residence
Outside MSA
Small MSA(50,000 to 249,999)
Medium MSA(250,000 to 999,999)
Large MSA(1,000,000 or more)
12%
11%
10%
8%
Percent of U.S. Population Who Participated Away-From-Home by Household Income
$150,000 or more
$100,000 to $149,999
$75,000 to $99,999
$50,000 to $74,999
$40,000 to $49,999
$35,000 to $39,999
$30,000 to $34,999
$25,000 to $29,999
$20,000 to $24,999
Less than $20,000
12%
12%
15%
14%
10%
9%
7%
6%
7%
5%

50 2011 National Survey of Fishing, Hunting, and Wildlife-Associated Recreation U.S. Fish and Wildlife Service and U.S. Census Bureau
Education, Race, and Ethnicity of Away-From-Home Participants
As in the case of household income, educational achievement and partici-pation in away-from-home wildlife watching have a direct correlation. About 4 percent of the U.S. popula-tion with 11 years of education or less participated, compared to 19 percent of the population with 5 years or more of college. The educational cohort with the most participants was 4 years of college, with 5.4 million recreationists. The educational cohort with the fewest recreationists was 11 years or less, with 1.2 million.
The participation rates by race varied greatly. Approximately 11 percent of Whites and 5 percent of other races except African Americans and Asian Americans took trips to wildlife watch. In contrast, 3 percent of African Ameri-cans and 2 percent of Asian Americans participated. Of the total 22.5 million away-from-home participants, 92 percent were White, 3 percent were African Americans, 1 percent were Asian Americans, and 4 percent were other races.
About 1.4 million recreationists were Hispanic, 6 percent of all participants. Approximately 4 percent of the U.S. Hispanic population took trips to engage in wildlife watching. Of the
non-Hispanic population, 10 percent (21.1 million participants) took trips to wildlife watch. They were 94 percent of all away-from-home wildlife watchers.
Percent of Away-From-Home Wildlife Watchers by Education(Total participants: 22.5 million)
5 years or more of college23%
4 years of college24%
1 to 3 years of college24%
12 years23%
11 years or less5%
Percent of U.S. Population Who Participated Away-From-Home by Education
5 years or moreof college
4 years of college
1 to 3 years of college
12 years
11 years or less 4%
19%
13%
10%
6%
Percent of Away-From-Home Wildlife Watchers by Race(Total participants: 22.5 million)
White 92%
Asian American 1%African American 3%
Other 4%
Percent of U.S. Population Who Participated Away-From-Home by Ethnicity
Hispanic
Non-Hispanic 10%
4%
Away-From-Home Participants by Education, Race and Ethnicity(In millions)Total participants . . . . . . . . . 22.5
Education11 years or less. . . . . . . . . . 1.212 years . . . . . . . . . . . . . . . 5.21 to 3 years of college . . . . 5.34 years of college . . . . . . . . 5.45 years or more of college .
5.3
RaceWhite . . . . . . . . . . . . . . . . . 20.6African American. . . . . . . . 0.6Asian American . . . . . . . . . 0.3Other . . . . . . . . . . . . . . . . . 1.0
EthnicityHispanic . . . . . . . . . . . . . . . 1.4Non-Hispanic . . . . . . . . . . . 21.1
Source: Table 41.

U.S. Fish and Wildlife Service and U.S. Census Bureau 2011 National Survey of Fishing, Hunting, and Wildlife-Associated Recreation 51
2001–2011 Comparison of Wildlife-Watching Participation
Comparing 2006 and 2011 wildlife-watching measures finds no statistically significant change in the number of total participants, days, or expendi-tures. The increase in people photo-graphing wildlife around the home was partially balanced by the decrease in people feeding wildlife. Away-from-home observers and feeders decreased in number, but not enough to affect overall away-from-home wildlife watching. The number of days of away-
from-home wildlife watching did not change for any category. Similarly, the amount spent for wildlife watching was stable for all categories in 2006 and 2011.
From 2001 to 2011 the number of participants increased 9 percent. All categories of around-the-home wild-life watching increased or stayed level, led by the 82 percent increase in photographing wildlife. Overall away-from-home wildlife watching partici-pant numbers stayed level, with the increase in photographers somewhat
countered by the decrease in feeding wildlife. Similarly, the overall number of away-from-home days did not significantly change, with the increase in photographing days and decrease in feeding days roughly balancing each other. Trip-related expenditures increased significantly, but not enough to propel overall expenditures signifi-cantly higher. Equipment purchases, the largest component of wildlife-watching expenditures, did not increase or decrease significantly.
Number of Wildlife Watchers(Millions)
201120062001
66.171.1 71.8
Days of Away-From-Home Wildlife Watching(Millions)
201120062001
372352
336
Wildlife-Watching Expenditures (Billions of 2011 dollars)
201120062001
48.851.1
54.9

52 2011 National Survey of Fishing, Hunting, and Wildlife-Associated Recreation U.S. Fish and Wildlife Service and U.S. Census Bureau
2001–2011 Wildlife-Watching Participants, Days, and Expenditures (U.S. population 16 years old and older. Numbers in thousands)
2001 2011 2001-2011Number Percent Number Percent percent change
Wildlife-watching participants, total . . . . . . 66,105 100 71,776 100 9 Around the home. . . . . . . . . . . . . . . . . . . . . 62,928 95 68,598 96 9 Observers . . . . . . . . . . . . . . . . . . . . . . . . 42,111 64 45,046 63 7 Photographers . . . . . . . . . . . . . . . . . . . . 13,937 21 25,370 35 82 Feeders . . . . . . . . . . . . . . . . . . . . . . . . . . 53,988 82 52,817 74 NS–2 Visitors of parks or natural areas . . . . . . 10,981 17 12,311 17 12 Maintainers of plantings or natural areas 13,072 20 13,399 19 NS3
Away from home. . . . . . . . . . . . . . . . . . . . . 21,823 33 22,496 31 NS3 Observers . . . . . . . . . . . . . . . . . . . . . . . . 20,080 30 19,808 28 NS–1 Photographers . . . . . . . . . . . . . . . . . . . . 9,427 14 12,354 17 31 Feeders . . . . . . . . . . . . . . . . . . . . . . . . . . 7,077 11 5,399 8 –24
Days, away from home . . . . . . . . . . . . . . . . 372,006 100 335,625 100 NS–10 Observing . . . . . . . . . . . . . . . . . . . . . . . . 295,345 79 268,798 80 NS–9 Photographing . . . . . . . . . . . . . . . . . . . . 76,324 21 110,459 33 45 Feeding. . . . . . . . . . . . . . . . . . . . . . . . . . 103,307 28 59,255 18 –43
Wildlife-watching expenditures, total (2011 dollars). . . . . . . . . . . . . . . . . . . $48,791,172 100 $54,890,272 100 NS13
Trip-related . . . . . . . . . . . . . . . . . . . . . . . . . 10,367,312 21 17,274,675 31 67
Equipment, total . . . . . . . . . . . . . . . . . . . . . 29,898,207 61 27,150,921 49 NS–9 Wildlife-watching equipment. . . . . . . . . 9,340,464 19 11,323,179 21 21 Auxiliary equipment. . . . . . . . . . . . . . . . 910,552 2 1,555,374 3 71 Special equipment . . . . . . . . . . . . . . . . . 19,647,191 40 14,272,368 26 NS–27
Other . . . . . . . . . . . . . . . . . . . . . . . . . . . . . . 8,525,654 17 10,464,677 19 NS23
NS Not different from zero at the 5 percent level of significance.

U.S. Fish and Wildlife Service and U.S. Census Bureau 2011 National Survey of Fishing, Hunting, and Wildlife-Associated Recreation 53
2006–2011 Wildlife-Watching Participants, Days, and Expenditures (U.S. population 16 years old and older. Numbers in thousands)
2006 2011 2006-2011Number Percent Number Percent percent change
Wildlife-watching participants, total . . . . . . 71,132 100 71,776 100 NS1 Around the home. . . . . . . . . . . . . . . . . . . . . 67,756 95 68,598 96 NS1 Observers . . . . . . . . . . . . . . . . . . . . . . . . 44,467 36 45,046 63 NS1 Photographers . . . . . . . . . . . . . . . . . . . . 18,763 26 25,370 35 35 Feeders . . . . . . . . . . . . . . . . . . . . . . . . . . 55,512 78 52,817 74 –5 Visitors of parks or natural areas . . . . . . 13,271 19 12,311 17 NS–7 Maintainers of plantings or natural areas 14,508 20 13,399 19 NS–8
Away from home. . . . . . . . . . . . . . . . . . . . . 22,977 32 22,496 31 NS–2 Observers . . . . . . . . . . . . . . . . . . . . . . . . 21,546 30 19,808 28 NS–8 Photographers . . . . . . . . . . . . . . . . . . . . 11,708 16 12,354 17 NS6 Feeders . . . . . . . . . . . . . . . . . . . . . . . . . . 7,084 10 5,399 8 –24
Days, away from home . . . . . . . . . . . . . . . . 352,070 100 335,625 100 NS–5 Observers . . . . . . . . . . . . . . . . . . . . . . . . 291,027 82 268,798 80 NS–8 Photographers . . . . . . . . . . . . . . . . . . . . 103,872 30 110,459 33 NS6 Feeders . . . . . . . . . . . . . . . . . . . . . . . . . . 77,329 22 59,255 18 NS–23
Wildlife-watching expenditures, total (2011 dollars) . . . . . . . . . . . . . . . . . . . . . . . $51,133,555 100 $54,890,272 100 NS7
Trip-related . . . . . . . . . . . . . . . . . . . . . . . . . 14,420,170 28 17,274,675 31 NS20
Equipment, total . . . . . . . . . . . . . . . . . . . . . 25,954,939 51 27,150,921 49 NS5 Wildlife-watching equipment. . . . . . . . . 11,054,094 22 11,323,179 21 NS2 Auxiliary equipment. . . . . . . . . . . . . . . . 1,157,027 2 1,555,374 3 NS34 Special equipment . . . . . . . . . . . . . . . . . 13,743,818 27 14,272,368 26 NS4
Other . . . . . . . . . . . . . . . . . . . . . . . . . . . . . . 10,758,446 21 10,464,677 19 NS–3
NS Not different from zero at the 5 percent level of significance.

Tables

56 2011 National Survey of Fishing, Hunting, and Wildlife-Associated Recreation U.S. Fish and Wildlife Service and U.S. Census Bureau
Guide to Statistical Tables
Purpose and Coverage of Tables
The statistical tables of this report were designed to meet a wide range of needs for those interested in wildlife-related recreation. Special terms used in these tables are defined in Appendix A.
The tables are based on responses to the 2011 Survey, which was designed to collect data about participation in wi ldlife-related recreation. To have taken part in the Survey, a respondent must have been a U.S. resident (a resident of one of the 50 states or the District of Columbia). No one residing outside the United States (including U.S. citizens) was eligible for inter-viewing. Therefore, reported national totals do not include participation by those who were not U.S. residents or who were U.S. citizens residing outside the United States.
Comparability With Previous Surveys
The numbers reported can be compared with those in the 1991, 1996, 2001, and 2006 Survey Reports. The methodology used in 2011 was similar to that used in those Surveys. These results should not be directly compared to results from Surveys earlier than 1991 since there were major changes in methodology. These changes were made to improve accuracy in the information provided. Trends further back than 1991 are presented in Appendix C. These trends were developed using parts of the Surveys that were comparable.
Coverage of an Individual Table
Since the Survey covers many activi-ties in various places by participants of different ages, all table titles, headnotes, stubs, and footnotes are designed to identify and articulate each item being reported in the table. For example, the title of Table 1 shows that data about anglers and hunters, their days of participation, and their number of trips are reported by type of activity. By contrast, the title of Table 3 indi-cates that it contains data on freshwater anglers and the days they fished for different species.
Percentages Reported in the Tables
Percentages are reported in the tables for the convenience of the user. When exclusive groups are being reported, the base of a percentage is apparent from its context because the percents add to 100 percent (plus or minus a rounding error). For example, Table 1 reports the number of trips taken by big game hunters (65 percent), those taken by small game hunters (17 percent), those taken by migratory bird hunters (8 percent), and those taken by hunters pursuing other animals (10 percent). These comprise 100 percent because they are exclusive categories.
Percents should not add to 100 when nonexclusive groups are being reported. Using Table 1 as an example again, note that adding the percentages associated with the total number of big game hunters (85 percent), total small game hunters (33 percent), total migra-tory bird hunters (19 percent), and total hunters of other animals (16 percent) will not yield total hunters (100 percent) because respondents could hunt for more than one type of game.
When the base of the percentage is not apparent in context, it is identified in a footnote. For example, Table 6 reports three percentages with different bases: one for the number of hunters, one for the number of trips, and one for days of hunting. Footnotes are used to clarify the bases of the reported percentages.
Footnotes to the Tables
Footnotes are used to clarify the infor-mation or items that are being reported in a table. Symbols in the body of a table indicate important footnotes. The following symbols are used in the tables to refer to the same footnote each time they appear:
* Estimate based on a sample size of 10–29.
... Sample size too small to report data reliably.
Z Less than 0.5 percent.
X Not applicable.
NA Not available.
Estimates based upon fewer than ten responses are regarded as being based on a sample size that is too small for reliable reporting. An estimate based upon at least 10 but fewer than 30 responses is treated as an estimate based on a small sample size. Other footnotes appear, as necessary, to qualify or clarify the estimates reported in the tables. In addition, these two important footnotes appear frequently:
• Detail does not add to total because of multiple responses.
• Detail does not add to total because of multiple responses and no nresponse.
“Multiple responses” is a term used to reflect the fact that individuals or their characteristics fall into more than one category. Using Table 2 as an example, those who fished in saltwater and fresh-water appear in both of these totals. Yet each angler is represented only once in the “Total, all fishing” column. Simi-larly, in Table 6, those who hunt for big game and small game are counted only once as a hunter in the “Total, all hunting” column. Therefore, totals will be smaller than the sum of subcatego-ries when multiple responses exist.
“Nonresponse” exists because the Survey questions were answered voluntarily, and some respondents did not or could not answer all the ques-tions. The effect of nonresponse is illustrated in Table 27, where the total days of hunting is greater than the sum of hunting days on private land and hunting days on public land. This occurs because some respondents did not answer the days hunted on private/public land questions. As a result, it is known how many days hunters hunted but not known if those days were on public or private land. In this case, totals are greater than the sum of subcategories when nonresponses have occurred.
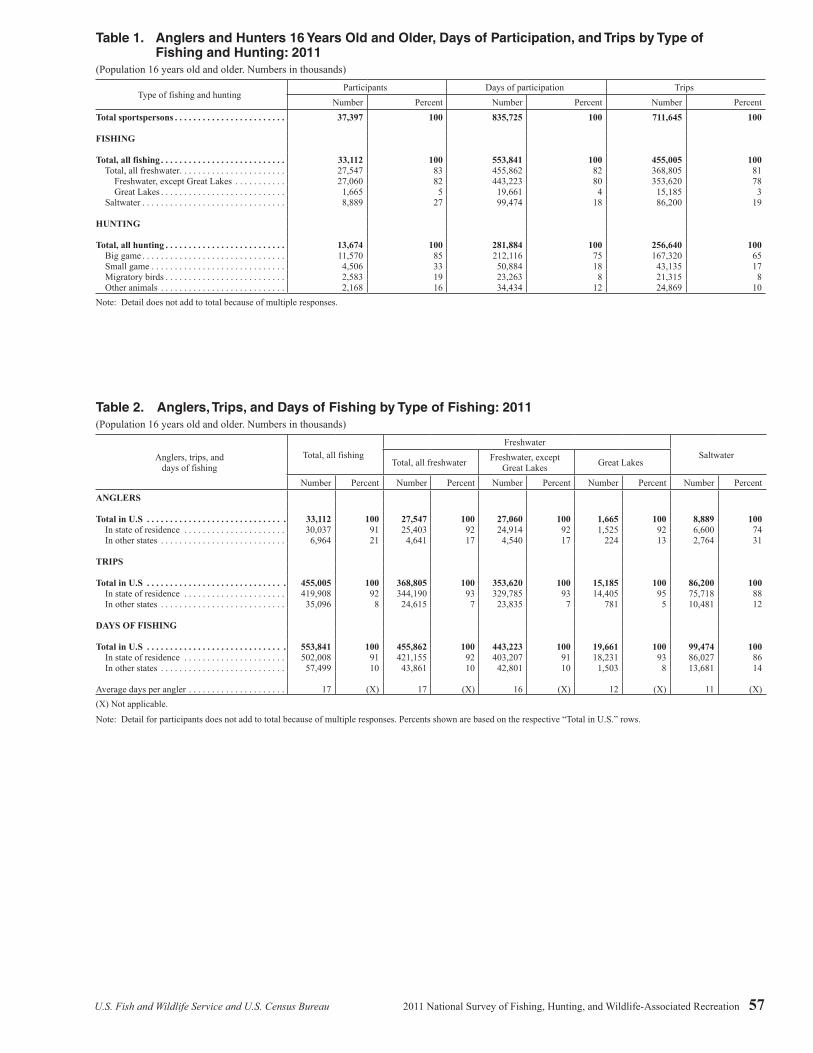
U.S. Fish and Wildlife Service and U.S. Census Bureau 2011 National Survey of Fishing, Hunting, and Wildlife-Associated Recreation 57
Table 1. Anglers and Hunters 16 Years Old and Older, Days of Participation, and Trips by Type of Fishing and Hunting: 2011
(Population 16 years old and older. Numbers in thousands)
Type of fishing and huntingParticipants Days of participation Trips
Number Percent Number Percent Number PercentTotal sportspersons . . . . . . . . . . . . . . . . . . . . . . . . 37,397 100 835,725 100 711,645 100
FISHING
Total, all fishing . . . . . . . . . . . . . . . . . . . . . . . . . . . 33,112 100 553,841 100 455,005 100 Total, all freshwater . . . . . . . . . . . . . . . . . . . . . . . 27,547 83 455,862 82 368,805 81 Freshwater, except Great Lakes . . . . . . . . . . . 27,060 82 443,223 80 353,620 78 Great Lakes . . . . . . . . . . . . . . . . . . . . . . . . . . . 1,665 5 19,661 4 15,185 3 Saltwater . . . . . . . . . . . . . . . . . . . . . . . . . . . . . . . 8,889 27 99,474 18 86,200 19
HUNTING
Total, all hunting . . . . . . . . . . . . . . . . . . . . . . . . . . 13,674 100 281,884 100 256,640 100 Big game . . . . . . . . . . . . . . . . . . . . . . . . . . . . . . . 11,570 85 212,116 75 167,320 65 Small game . . . . . . . . . . . . . . . . . . . . . . . . . . . . . 4,506 33 50,884 18 43,135 17 Migratory birds . . . . . . . . . . . . . . . . . . . . . . . . . . 2,583 19 23,263 8 21,315 8 Other animals . . . . . . . . . . . . . . . . . . . . . . . . . . . 2,168 16 34,434 12 24,869 10Note: Detail does not add to total because of multiple responses.
Table 2. Anglers, Trips, and Days of Fishing by Type of Fishing: 2011(Population 16 years old and older. Numbers in thousands)
Anglers, trips, and days of fishing
Total, all fishingFreshwater
SaltwaterTotal, all freshwater Freshwater, except
Great Lakes Great Lakes
Number Percent Number Percent Number Percent Number Percent Number PercentANGLERS
Total in U.S . . . . . . . . . . . . . . . . . . . . . . . . . . . . . . 33,112 100 27,547 100 27,060 100 1,665 100 8,889 100 In state of residence . . . . . . . . . . . . . . . . . . . . . . 30,037 91 25,403 92 24,914 92 1,525 92 6,600 74 In other states . . . . . . . . . . . . . . . . . . . . . . . . . . . 6,964 21 4,641 17 4,540 17 224 13 2,764 31
TRIPS
Total in U.S . . . . . . . . . . . . . . . . . . . . . . . . . . . . . . 455,005 100 368,805 100 353,620 100 15,185 100 86,200 100 In state of residence . . . . . . . . . . . . . . . . . . . . . . 419,908 92 344,190 93 329,785 93 14,405 95 75,718 88 In other states . . . . . . . . . . . . . . . . . . . . . . . . . . . 35,096 8 24,615 7 23,835 7 781 5 10,481 12
DAYS OF FISHING
Total in U.S . . . . . . . . . . . . . . . . . . . . . . . . . . . . . . 553,841 100 455,862 100 443,223 100 19,661 100 99,474 100 In state of residence . . . . . . . . . . . . . . . . . . . . . . 502,008 91 421,155 92 403,207 91 18,231 93 86,027 86 In other states . . . . . . . . . . . . . . . . . . . . . . . . . . . 57,499 10 43,861 10 42,801 10 1,503 8 13,681 14
Average days per angler . . . . . . . . . . . . . . . . . . . . . 17 (X) 17 (X) 16 (X) 12 (X) 11 (X)(X) Not applicable.
Note: Detail for participants does not add to total because of multiple responses. Percents shown are based on the respective “Total in U.S.” rows.

58 2011 National Survey of Fishing, Hunting, and Wildlife-Associated Recreation U.S. Fish and Wildlife Service and U.S. Census Bureau
Table 3. Freshwater Anglers and Days of Fishing by Type of Fish: 2011(Population 16 years old and older. Numbers in thousands. Excludes Great Lakes fishing)
Type of fishAnglers Days of fishing Average days
per anglerNumber Percent Number PercentTotal, all types of fish . . . . . . . . . . . . . . . . . . . . . . . . . . . . . . . . 27,060 100 443,223 100 16 Black bass (largemouth, smallmouth, etc.) . . . . . . . . . . . . . . . 10,626 39 171,279 39 16 White bass, striped bass and striped bass hybrids . . . . . . . . . . 4,374 16 60,998 14 14 Panfish. . . . . . . . . . . . . . . . . . . . . . . . . . . . . . . . . . . . . . . . . . . 7,263 27 96,925 22 13 Crappie . . . . . . . . . . . . . . . . . . . . . . . . . . . . . . . . . . . . . . . . . . 6,123 23 101,958 23 17 Catfish and Bullheads . . . . . . . . . . . . . . . . . . . . . . . . . . . . . . . 7,048 26 95,749 22 14 Walleye . . . . . . . . . . . . . . . . . . . . . . . . . . . . . . . . . . . . . . . . . . 2,493 9 38,361 9 15 Sauger . . . . . . . . . . . . . . . . . . . . . . . . . . . . . . . . . . . . . . . . . . . 219 1 3,795 1 17 Northern pike, pickerel, muskie, muskie hybrids . . . . . . . . . . 1,642 6 23,420 5 14 Trout . . . . . . . . . . . . . . . . . . . . . . . . . . . . . . . . . . . . . . . . . . . . 7,157 26 75,748 17 11 Salmon . . . . . . . . . . . . . . . . . . . . . . . . . . . . . . . . . . . . . . . . . . 1,160 4 12,402 3 11 Steelhead . . . . . . . . . . . . . . . . . . . . . . . . . . . . . . . . . . . . . . . . . 594 2 8,585 2 14 Anything1. . . . . . . . . . . . . . . . . . . . . . . . . . . . . . . . . . . . . . . . . 3,360 12 37,224 8 11 Another type of freshwater fish . . . . . . . . . . . . . . . . . . . . . . . . 1,327 5 20,268 5 151 Respondent fished for no specific species and identified “Anything” from a list of categories of fish.
Note: Detail for participants does not add to total because of multiple responses.
Table 4. Great Lakes Anglers and Days of Fishing by Type of Fish: 2011(Population 16 years old and older. Numbers in thousands)
Type of fishAnglers Days of fishing Average days
per anglerNumber Percent Number PercentTotal, all types of fish . . . . . . . . . . . . . . . . . . . . . . . . . . . . . . . . . . 1,665 100 19,661 100 12 Black bass (largemouth, smallmouth, etc.) . . . . . . . . . . . . . . . . . 559 34 4,830 25 9 Walleye, Sauger. . . . . . . . . . . . . . . . . . . . . . . . . . . . . . . . . . . . . . 584 35 5,612 29 10 Northern pike, pickerel, muskie, muskie hybrids . . . . . . . . . . . . *224 *13 *2,271 *12 *10 Perch . . . . . . . . . . . . . . . . . . . . . . . . . . . . . . . . . . . . . . . . . . . . . . 497 30 5,805 30 12 Salmon . . . . . . . . . . . . . . . . . . . . . . . . . . . . . . . . . . . . . . . . . . . . 379 23 5,297 27 14 Steelhead . . . . . . . . . . . . . . . . . . . . . . . . . . . . . . . . . . . . . . . . . . . *198 *12 *3,092 *16 *16 Lake trout . . . . . . . . . . . . . . . . . . . . . . . . . . . . . . . . . . . . . . . . . . *215 *13 *3,573 *18 *17 Other trout . . . . . . . . . . . . . . . . . . . . . . . . . . . . . . . . . . . . . . . . . . *97 *6 *700 *4 *7 Anything1. . . . . . . . . . . . . . . . . . . . . . . . . . . . . . . . . . . . . . . . . . . *148 *9 *1,464 *7 *10 Another type of Great Lakes fish . . . . . . . . . . . . . . . . . . . . . . . . *179 *11 *1,722 *9 *10* Estimate based on a sample size of 10–29. 1 Respondent fished for no specific species and identified “Anything” from a list of categories of fish.
Note: Detail for participants does not add to total because of multiple responses.

U.S. Fish and Wildlife Service and U.S. Census Bureau 2011 National Survey of Fishing, Hunting, and Wildlife-Associated Recreation 59
Table 5. Saltwater Anglers and Days of Fishing by Type of Fish: 2011(Population 16 years old and older. Numbers in thousands)
Type of fishAnglers Days of fishing Average days
per anglerNumber Percent Number PercentTotal, all types of fish . . . . . . . . . . . . . . . . . . . . . . . . . . . . . . . . . . . . . 8,889 100 99,474 100 11 Salmon . . . . . . . . . . . . . . . . . . . . . . . . . . . . . . . . . . . . . . . . . . . . . . . 671 8 3,965 4 6 Striped bass . . . . . . . . . . . . . . . . . . . . . . . . . . . . . . . . . . . . . . . . . . . . 2,142 24 17,757 18 8 Flatfish (flounder, halibut) . . . . . . . . . . . . . . . . . . . . . . . . . . . . . . . . 2,005 23 22,473 23 11 Bluefish . . . . . . . . . . . . . . . . . . . . . . . . . . . . . . . . . . . . . . . . . . . . . . . 1,028 12 10,044 10 10 Red drum (redfish) . . . . . . . . . . . . . . . . . . . . . . . . . . . . . . . . . . . . . . 1,548 17 21,130 21 14 Sea trout (weakfish) . . . . . . . . . . . . . . . . . . . . . . . . . . . . . . . . . . . . . 1,089 12 15,261 15 14 Mackerel . . . . . . . . . . . . . . . . . . . . . . . . . . . . . . . . . . . . . . . . . . . . . . 650 7 7,732 8 12 Mahi Mahi (dolphinfish) . . . . . . . . . . . . . . . . . . . . . . . . . . . . . . . . . . 538 6 7,352 7 14 Tuna. . . . . . . . . . . . . . . . . . . . . . . . . . . . . . . . . . . . . . . . . . . . . . . . . . 564 6 3,339 3 6 Shellfish . . . . . . . . . . . . . . . . . . . . . . . . . . . . . . . . . . . . . . . . . . . . . . 561 6 3,950 4 7 Anything1. . . . . . . . . . . . . . . . . . . . . . . . . . . . . . . . . . . . . . . . . . . . . . 1,962 22 16,082 16 8 Another type of saltwater fish . . . . . . . . . . . . . . . . . . . . . . . . . . . . . . 3,388 38 38,065 38 111 Respondent fished for no specific species and identified “Anything” from a list of categories of fish.
Note: Detail for participants does not add to total because of multiple responses.
Table 6. Hunters, Trips, and Days of Hunting by Type of Hunting: 2011(Population 16 years old and older. Numbers in thousands)
Hunters, trips, and days of huntingTotal, all hunting Big game Small game Migratory birds Other animalsNumber Percent Number Percent Number Percent Number Percent Number Percent
HUNTERS
Total in U.S . . . . . . . . . . . . . . . . . . . . . . . . . . . . . . 13,674 100 11,570 100 4,506 100 2,583 100 2,168 100 In state of residence . . . . . . . . . . . . . . . . . . . . . . 12,890 94 10,976 95 4,040 90 2,418 94 1,994 92 In other states . . . . . . . . . . . . . . . . . . . . . . . . . . .
TRIPS
1,942 14 1,282 11 708 16 284 11 224 10
Total in U.S . . . . . . . . . . . . . . . . . . . . . . . . . . . . . . 256,640 100 167,320 100 43,135 100 21,315 100 24,869 100 In state of residence . . . . . . . . . . . . . . . . . . . . . . 244,202 95 159,894 96 39,918 93 20,341 95 24,050 97 In other states . . . . . . . . . . . . . . . . . . . . . . . . . . .
DAYS OF HUNTING
12,438 5 7,426 4 3,218 7 974 5 819 3
Total in U.S . . . . . . . . . . . . . . . . . . . . . . . . . . . . . . 281,884 100 212,116 100 50,884 100 23,263 100 34,434 100 In state of residence . . . . . . . . . . . . . . . . . . . . . . 263,038 93 198,537 94 46,115 91 21,927 94 32,839 95 In other states . . . . . . . . . . . . . . . . . . . . . . . . . . . 20,291 7 14,581 7 4,975 10 1,409 6 1,687 5
Average days per hunter . . . . . . . . . . . . . . . . . . . . . 21 (X) 18 (X) 11 (X) 9 (X) 16 (X)(X) Not applicable.
Note: Detail does not add to total because of multiple responses. Percents shown are based on the respective “Total in U.S.” rows.

60 2011 National Survey of Fishing, Hunting, and Wildlife-Associated Recreation U.S. Fish and Wildlife Service and U.S. Census Bureau
Table 7. Hunters and Days of Hunting by Type of Game: 2011(Population 16 years old and older. Numbers in thousands)
Type of gameHunters Days of hunting Average days
per hunterNumber Percent Number PercentTotal, all big game . . . . . . . . . . . . . . . . . . . . . . . . 11,570 100 212,116 100 18 Deer . . . . . . . . . . . . . . . . . . . . . . . . . . . . . . . . . . 10,851 94 167,658 79 15 Elk . . . . . . . . . . . . . . . . . . . . . . . . . . . . . . . . . . . 867 7 7,715 4 9 Bear . . . . . . . . . . . . . . . . . . . . . . . . . . . . . . . . . . 526 5 4,824 2 9 Wild turkey . . . . . . . . . . . . . . . . . . . . . . . . . . . . 3,115 27 33,341 16 11 Moose . . . . . . . . . . . . . . . . . . . . . . . . . . . . . . . . 106 1 1,139 1 11 Other big game . . . . . . . . . . . . . . . . . . . . . . . . . 305 3 4,911 2 16
Total, all small game . . . . . . . . . . . . . . . . . . . . . . 4,506 100 50,884 100 11 Rabbit, hare . . . . . . . . . . . . . . . . . . . . . . . . . . . . 1,545 34 16,893 33 11 Quail . . . . . . . . . . . . . . . . . . . . . . . . . . . . . . . . . 841 19 9,419 19 11 Grouse/prairie chicken . . . . . . . . . . . . . . . . . . . 812 18 7,541 15 9 Squirrel . . . . . . . . . . . . . . . . . . . . . . . . . . . . . . . 1,691 38 20,542 40 12 Pheasant . . . . . . . . . . . . . . . . . . . . . . . . . . . . . . 1,474 33 9,670 19 7 Ptarmigan . . . . . . . . . . . . . . . . . . . . . . . . . . . . . *32 *1 *233 *(Z) *7 Other small game . . . . . . . . . . . . . . . . . . . . . . . 299 7 3,493 7 12
Total, all migratory birds . . . . . . . . . . . . . . . . . . 2,583 100 23,263 100 9 Water fowl (geese and/or ducks) . . . . . . . . . . . . 1,517 59 16,757 72 11 Geese . . . . . . . . . . . . . . . . . . . . . . . . . . . . . . . 781 30 8,684 37 11 Ducks . . . . . . . . . . . . . . . . . . . . . . . . . . . . . . 1,371 53 15,295 66 11 Doves . . . . . . . . . . . . . . . . . . . . . . . . . . . . . . . . 1,271 49 7,041 30 6 Other Migratory birds . . . . . . . . . . . . . . . . . . . . 227 9 1,576 7 7
Total, all other animals (fox, raccoon, groundhog, alligator, etc.) . . . . . . . . . . . . . . . . 2,168 100 34,434 100 16
* Estimate based on a sample size of 10–29. (Z) Less than 0.5 percent.
Note: Detail does not add to total because of multiple responses.
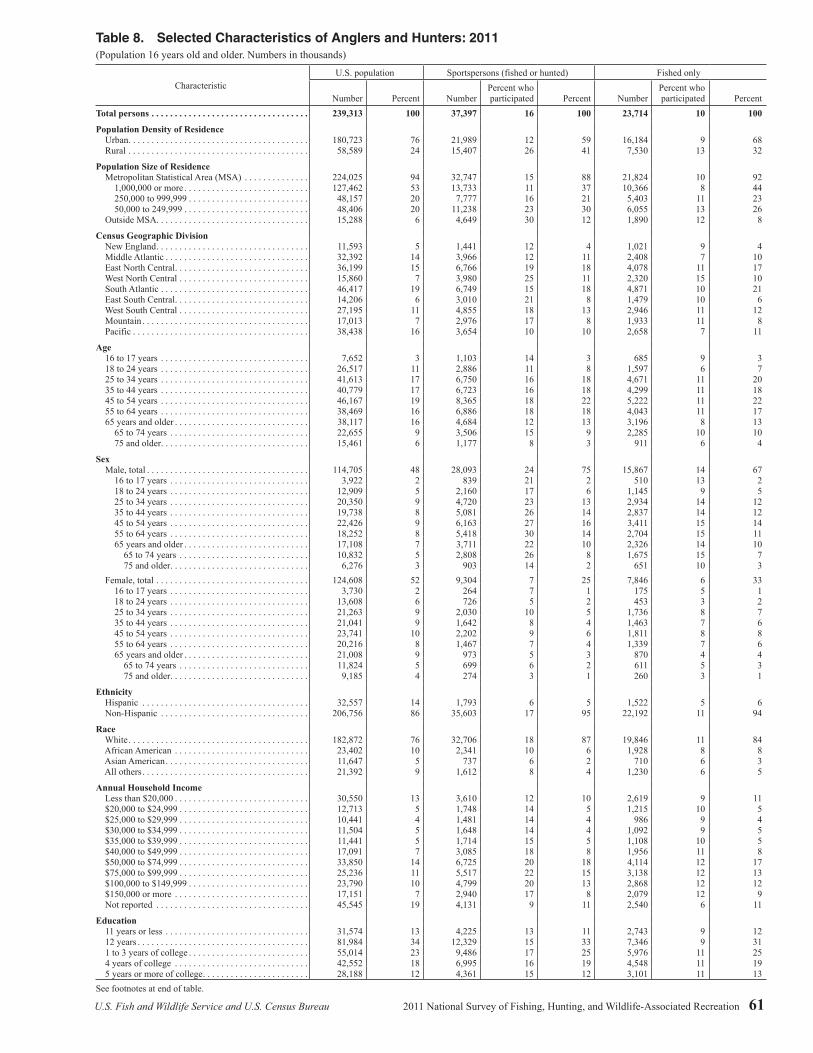
U.S. Fish and Wildlife Service and U.S. Census Bureau 2011 National Survey of Fishing, Hunting, and Wildlife-Associated Recreation 61
Table 8. Selected Characteristics of Anglers and Hunters: 2011(Population 16 years old and older. Numbers in thousands)
CharacteristicU.S. population Sportspersons (fished or hunted) Fished only
Number Percent NumberPercent who participated Percent Number
Percent who participated Percent
Total persons . . . . . . . . . . . . . . . . . . . . . . . . . . . . . . . . . . 239,313 100 37,397 16 100 23,714 10 100
Population Density of Residence Urban . . . . . . . . . . . . . . . . . . . . . . . . . . . . . . . . . . . . . . . 180,723 76 21,989 12 59 16,184 9 68 Rural . . . . . . . . . . . . . . . . . . . . . . . . . . . . . . . . . . . . . . . 58,589 24 15,407 26 41 7,530 13 32
Population Size of Residence Metropolitan Statistical Area (MSA) . . . . . . . . . . . . . . 224,025 94 32,747 15 88 21,824 10 92 1,000,000 or more . . . . . . . . . . . . . . . . . . . . . . . . . . . 127,462 53 13,733 11 37 10,366 8 44 250,000 to 999,999 . . . . . . . . . . . . . . . . . . . . . . . . . . 48,157 20 7,777 16 21 5,403 11 23 50,000 to 249,999 . . . . . . . . . . . . . . . . . . . . . . . . . . . 48,406 20 11,238 23 30 6,055 13 26 Outside MSA . . . . . . . . . . . . . . . . . . . . . . . . . . . . . . . . . 15,288 6 4,649 30 12 1,890 12 8
Census Geographic Division New England . . . . . . . . . . . . . . . . . . . . . . . . . . . . . . . . . 11,593 5 1,441 12 4 1,021 9 4 Middle Atlantic . . . . . . . . . . . . . . . . . . . . . . . . . . . . . . . 32,392 14 3,966 12 11 2,408 7 10 East North Central . . . . . . . . . . . . . . . . . . . . . . . . . . . . . 36,199 15 6,766 19 18 4,078 11 17 West North Central . . . . . . . . . . . . . . . . . . . . . . . . . . . . 15,860 7 3,980 25 11 2,320 15 10 South Atlantic . . . . . . . . . . . . . . . . . . . . . . . . . . . . . . . . 46,417 19 6,749 15 18 4,871 10 21 East South Central . . . . . . . . . . . . . . . . . . . . . . . . . . . . . 14,206 6 3,010 21 8 1,479 10 6 West South Central . . . . . . . . . . . . . . . . . . . . . . . . . . . . 27,195 11 4,855 18 13 2,946 11 12 Mountain . . . . . . . . . . . . . . . . . . . . . . . . . . . . . . . . . . . . 17,013 7 2,976 17 8 1,933 11 8 Pacific . . . . . . . . . . . . . . . . . . . . . . . . . . . . . . . . . . . . . . 38,438 16 3,654 10 10 2,658 7 11
Age 16 to 17 years . . . . . . . . . . . . . . . . . . . . . . . . . . . . . . . . 7,652 3 1,103 14 3 685 9 3 18 to 24 years . . . . . . . . . . . . . . . . . . . . . . . . . . . . . . . . 26,517 11 2,886 11 8 1,597 6 7 25 to 34 years . . . . . . . . . . . . . . . . . . . . . . . . . . . . . . . . 41,613 17 6,750 16 18 4,671 11 20 35 to 44 years . . . . . . . . . . . . . . . . . . . . . . . . . . . . . . . . 40,779 17 6,723 16 18 4,299 11 18 45 to 54 years . . . . . . . . . . . . . . . . . . . . . . . . . . . . . . . . 46,167 19 8,365 18 22 5,222 11 22 55 to 64 years . . . . . . . . . . . . . . . . . . . . . . . . . . . . . . . . 38,469 16 6,886 18 18 4,043 11 17 65 years and older . . . . . . . . . . . . . . . . . . . . . . . . . . . . . 38,117 16 4,684 12 13 3,196 8 13 65 to 74 years . . . . . . . . . . . . . . . . . . . . . . . . . . . . . . 22,655 9 3,506 15 9 2,285 10 10 75 and older . . . . . . . . . . . . . . . . . . . . . . . . . . . . . . . . 15,461 6 1,177 8 3 911 6 4
Sex Male, total . . . . . . . . . . . . . . . . . . . . . . . . . . . . . . . . . . . 114,705 48 28,093 24 75 15,867 14 67 16 to 17 years . . . . . . . . . . . . . . . . . . . . . . . . . . . . . . 3,922 2 839 21 2 510 13 2 18 to 24 years . . . . . . . . . . . . . . . . . . . . . . . . . . . . . . 12,909 5 2,160 17 6 1,145 9 5 25 to 34 years . . . . . . . . . . . . . . . . . . . . . . . . . . . . . . 20,350 9 4,720 23 13 2,934 14 12 35 to 44 years . . . . . . . . . . . . . . . . . . . . . . . . . . . . . . 19,738 8 5,081 26 14 2,837 14 12 45 to 54 years . . . . . . . . . . . . . . . . . . . . . . . . . . . . . . 22,426 9 6,163 27 16 3,411 15 14 55 to 64 years . . . . . . . . . . . . . . . . . . . . . . . . . . . . . . 18,252 8 5,418 30 14 2,704 15 11 65 years and older . . . . . . . . . . . . . . . . . . . . . . . . . . . 17,108 7 3,711 22 10 2,326 14 10 65 to 74 years . . . . . . . . . . . . . . . . . . . . . . . . . . . . 10,832 5 2,808 26 8 1,675 15 7 75 and older . . . . . . . . . . . . . . . . . . . . . . . . . . . . . . 6,276 3 903 14 2 651 10 3 Female, total . . . . . . . . . . . . . . . . . . . . . . . . . . . . . . . . . 124,608 52 9,304 7 25 7,846 6 33 16 to 17 years . . . . . . . . . . . . . . . . . . . . . . . . . . . . . . 3,730 2 264 7 1 175 5 1 18 to 24 years . . . . . . . . . . . . . . . . . . . . . . . . . . . . . . 13,608 6 726 5 2 453 3 2 25 to 34 years . . . . . . . . . . . . . . . . . . . . . . . . . . . . . . 21,263 9 2,030 10 5 1,736 8 7 35 to 44 years . . . . . . . . . . . . . . . . . . . . . . . . . . . . . . 21,041 9 1,642 8 4 1,463 7 6 45 to 54 years . . . . . . . . . . . . . . . . . . . . . . . . . . . . . . 23,741 10 2,202 9 6 1,811 8 8 55 to 64 years . . . . . . . . . . . . . . . . . . . . . . . . . . . . . . 20,216 8 1,467 7 4 1,339 7 6 65 years and older . . . . . . . . . . . . . . . . . . . . . . . . . . . 21,008 9 973 5 3 870 4 4 65 to 74 years . . . . . . . . . . . . . . . . . . . . . . . . . . . . 11,824 5 699 6 2 611 5 3 75 and older . . . . . . . . . . . . . . . . . . . . . . . . . . . . . . 9,185 4 274 3 1 260 3 1
Ethnicity Hispanic . . . . . . . . . . . . . . . . . . . . . . . . . . . . . . . . . . . . 32,557 14 1,793 6 5 1,522 5 6 Non-Hispanic . . . . . . . . . . . . . . . . . . . . . . . . . . . . . . . . 206,756 86 35,603 17 95 22,192 11 94
Race White . . . . . . . . . . . . . . . . . . . . . . . . . . . . . . . . . . . . . . . 182,872 76 32,706 18 87 19,846 11 84 African American . . . . . . . . . . . . . . . . . . . . . . . . . . . . . 23,402 10 2,341 10 6 1,928 8 8 Asian American . . . . . . . . . . . . . . . . . . . . . . . . . . . . . . . 11,647 5 737 6 2 710 6 3 All others . . . . . . . . . . . . . . . . . . . . . . . . . . . . . . . . . . . . 21,392 9 1,612 8 4 1,230 6 5
Annual Household Income Less than $20,000 . . . . . . . . . . . . . . . . . . . . . . . . . . . . . 30,550 13 3,610 12 10 2,619 9 11 $20,000 to $24,999 . . . . . . . . . . . . . . . . . . . . . . . . . . . . 12,713 5 1,748 14 5 1,215 10 5 $25,000 to $29,999 . . . . . . . . . . . . . . . . . . . . . . . . . . . . 10,441 4 1,481 14 4 986 9 4 $30,000 to $34,999 . . . . . . . . . . . . . . . . . . . . . . . . . . . . 11,504 5 1,648 14 4 1,092 9 5 $35,000 to $39,999 . . . . . . . . . . . . . . . . . . . . . . . . . . . . 11,441 5 1,714 15 5 1,108 10 5 $40,000 to $49,999 . . . . . . . . . . . . . . . . . . . . . . . . . . . . 17,091 7 3,085 18 8 1,956 11 8 $50,000 to $74,999 . . . . . . . . . . . . . . . . . . . . . . . . . . . . 33,850 14 6,725 20 18 4,114 12 17 $75,000 to $99,999 . . . . . . . . . . . . . . . . . . . . . . . . . . . . 25,236 11 5,517 22 15 3,138 12 13 $100,000 to $149,999 . . . . . . . . . . . . . . . . . . . . . . . . . . 23,790 10 4,799 20 13 2,868 12 12 $150,000 or more . . . . . . . . . . . . . . . . . . . . . . . . . . . . . 17,151 7 2,940 17 8 2,079 12 9 Not reported . . . . . . . . . . . . . . . . . . . . . . . . . . . . . . . . . 45,545 19 4,131 9 11 2,540 6 11
Education 11 years or less . . . . . . . . . . . . . . . . . . . . . . . . . . . . . . . 31,574 13 4,225 13 11 2,743 9 12 12 years . . . . . . . . . . . . . . . . . . . . . . . . . . . . . . . . . . . . . 81,984 34 12,329 15 33 7,346 9 31 1 to 3 years of college . . . . . . . . . . . . . . . . . . . . . . . . . . 55,014 23 9,486 17 25 5,976 11 25 4 years of college . . . . . . . . . . . . . . . . . . . . . . . . . . . . . 42,552 18 6,995 16 19 4,548 11 19 5 years or more of college . . . . . . . . . . . . . . . . . . . . . . . 28,188 12 4,361 15 12 3,101 11 13See footnotes at end of table.

62 2011 National Survey of Fishing, Hunting, and Wildlife-Associated Recreation U.S. Fish and Wildlife Service and U.S. Census Bureau
Table 8. Selected Characteristics of Anglers and Hunters: 2011—Continued(Population 16 years old and older. Numbers in thousands)
CharacteristicHunted only Fished and hunted
NumberPercent who participated Percent Number
Percent who participated Percent
Total persons . . . . . . . . . . . . . . . . . . . . . . . . . . . . . . . . . . . . . . . . . 4,285 2 100 9,389 4 100
Population Density of Residence Urban . . . . . . . . . . . . . . . . . . . . . . . . . . . . . . . . . . . . . . . . . . . . . . 1,774 1 41 4,023 2 43 Rural . . . . . . . . . . . . . . . . . . . . . . . . . . . . . . . . . . . . . . . . . . . . . . 2,511 4 59 5,366 9 57
Population Size of Residence Metropolitan Statistical Area (MSA) . . . . . . . . . . . . . . . . . . . . . 3,306 1 77 7,610 3 81 1,000,000 or more . . . . . . . . . . . . . . . . . . . . . . . . . . . . . . . . . . 1,064 1 25 2,303 2 25 250,000 to 999,999 . . . . . . . . . . . . . . . . . . . . . . . . . . . . . . . . . 706 1 16 1,668 3 18 50,000 to 249,999 . . . . . . . . . . . . . . . . . . . . . . . . . . . . . . . . . . 1,536 3 36 3,638 8 39 Outside MSA . . . . . . . . . . . . . . . . . . . . . . . . . . . . . . . . . . . . . . . . 979 6 23 1,780 12 19
Census Geographic Division New England . . . . . . . . . . . . . . . . . . . . . . . . . . . . . . . . . . . . . . . . 86 1 2 334 3 4 Middle Atlantic . . . . . . . . . . . . . . . . . . . . . . . . . . . . . . . . . . . . . . 471 1 11 1,087 3 12 East North Central . . . . . . . . . . . . . . . . . . . . . . . . . . . . . . . . . . . . 905 3 21 1,783 5 19 West North Central . . . . . . . . . . . . . . . . . . . . . . . . . . . . . . . . . . . 390 2 9 1,271 8 14 South Atlantic . . . . . . . . . . . . . . . . . . . . . . . . . . . . . . . . . . . . . . . 587 1 14 1,283 3 14 East South Central . . . . . . . . . . . . . . . . . . . . . . . . . . . . . . . . . . . . 566 4 13 965 7 10 West South Central . . . . . . . . . . . . . . . . . . . . . . . . . . . . . . . . . . . 556 2 13 1,353 5 14 Mountain . . . . . . . . . . . . . . . . . . . . . . . . . . . . . . . . . . . . . . . . . . . 390 2 9 653 4 7 Pacific . . . . . . . . . . . . . . . . . . . . . . . . . . . . . . . . . . . . . . . . . . . . . 335 1 8 661 2 7
Age 16 to 17 years . . . . . . . . . . . . . . . . . . . . . . . . . . . . . . . . . . . . . . . *161 *2 *4 258 3 3 18 to 24 years . . . . . . . . . . . . . . . . . . . . . . . . . . . . . . . . . . . . . . . 218 1 5 1,070 4 11 25 to 34 years . . . . . . . . . . . . . . . . . . . . . . . . . . . . . . . . . . . . . . . 616 1 14 1,463 4 16 35 to 44 years . . . . . . . . . . . . . . . . . . . . . . . . . . . . . . . . . . . . . . . 761 2 18 1,654 4 18 45 to 54 years . . . . . . . . . . . . . . . . . . . . . . . . . . . . . . . . . . . . . . . 937 2 22 2,206 5 23 55 to 64 years . . . . . . . . . . . . . . . . . . . . . . . . . . . . . . . . . . . . . . . 1,000 3 23 1,842 5 20 65 years and older . . . . . . . . . . . . . . . . . . . . . . . . . . . . . . . . . . . . 590 2 14 897 2 10 65 to 74 years . . . . . . . . . . . . . . . . . . . . . . . . . . . . . . . . . . . . . 455 2 11 766 3 8 75 and older . . . . . . . . . . . . . . . . . . . . . . . . . . . . . . . . . . . . . . . 135 1 3 131 1 1
Sex Male, total . . . . . . . . . . . . . . . . . . . . . . . . . . . . . . . . . . . . . . . . . . 3,867 3 90 8,351 7 89 16 to 17 years . . . . . . . . . . . . . . . . . . . . . . . . . . . . . . . . . . . . . *106 *3 *2 224 6 2 18 to 24 years . . . . . . . . . . . . . . . . . . . . . . . . . . . . . . . . . . . . . 188 1 4 827 6 9 25 to 34 years . . . . . . . . . . . . . . . . . . . . . . . . . . . . . . . . . . . . . 561 3 13 1,225 6 13 35 to 44 years . . . . . . . . . . . . . . . . . . . . . . . . . . . . . . . . . . . . . 676 3 16 1,560 8 17 45 to 54 years . . . . . . . . . . . . . . . . . . . . . . . . . . . . . . . . . . . . . 831 4 19 1,921 9 20 55 to 64 years . . . . . . . . . . . . . . . . . . . . . . . . . . . . . . . . . . . . . 980 5 23 1,734 9 18 65 years and older . . . . . . . . . . . . . . . . . . . . . . . . . . . . . . . . . . 525 3 12 860 5 9 65 to 74 years . . . . . . . . . . . . . . . . . . . . . . . . . . . . . . . . . . . 395 4 9 738 7 8 75 and older . . . . . . . . . . . . . . . . . . . . . . . . . . . . . . . . . . . . . 130 2 3 122 2 1
Female, total . . . . . . . . . . . . . . . . . . . . . . . . . . . . . . . . . . . . . . . . 418 (Z) 10 1,039 1 11 16 to 17 years . . . . . . . . . . . . . . . . . . . . . . . . . . . . . . . . . . . . . ... ... ... ... ... ... 18 to 24 years . . . . . . . . . . . . . . . . . . . . . . . . . . . . . . . . . . . . . ... ... ... *243 *2 *3 25 to 34 years . . . . . . . . . . . . . . . . . . . . . . . . . . . . . . . . . . . . . ... ... ... 238 1 3 35 to 44 years . . . . . . . . . . . . . . . . . . . . . . . . . . . . . . . . . . . . . *85 *(Z) *2 94 (Z) 1 45 to 54 years . . . . . . . . . . . . . . . . . . . . . . . . . . . . . . . . . . . . . *107 *(Z) *2 285 1 3 55 to 64 years . . . . . . . . . . . . . . . . . . . . . . . . . . . . . . . . . . . . . ... ... ... *108 *1 *1 65 years and older . . . . . . . . . . . . . . . . . . . . . . . . . . . . . . . . . . *65 *(Z) *2 *37 *(Z) *(Z) 65 to 74 years . . . . . . . . . . . . . . . . . . . . . . . . . . . . . . . . . . . ... ... ... *28 *(Z) *(Z) 75 and older . . . . . . . . . . . . . . . . . . . . . . . . . . . . . . . . . . . . . ... ... ... ... ... ...
Ethnicity Hispanic . . . . . . . . . . . . . . . . . . . . . . . . . . . . . . . . . . . . . . . . . . . *118 *(Z) *3 153 (Z) 2 Non-Hispanic . . . . . . . . . . . . . . . . . . . . . . . . . . . . . . . . . . . . . . . 4,167 2 97 9,236 4 98
Race White . . . . . . . . . . . . . . . . . . . . . . . . . . . . . . . . . . . . . . . . . . . . . . 4,146 2 97 8,706 5 93 African American . . . . . . . . . . . . . . . . . . . . . . . . . . . . . . . . . . . . ... ... ... 358 2 4 Asian American . . . . . . . . . . . . . . . . . . . . . . . . . . . . . . . . . . . . . . ... ... ... *23 *(Z) *(Z) All others . . . . . . . . . . . . . . . . . . . . . . . . . . . . . . . . . . . . . . . . . . . *79 *(Z) *2 303 1 3
Annual Household Income Less than $20,000 . . . . . . . . . . . . . . . . . . . . . . . . . . . . . . . . . . . . 343 1 8 648 2 7 $20,000 to $24,999 . . . . . . . . . . . . . . . . . . . . . . . . . . . . . . . . . . . *174 *1 *4 358 3 4 $25,000 to $29,999 . . . . . . . . . . . . . . . . . . . . . . . . . . . . . . . . . . . 117 1 3 378 4 4 $30,000 to $34,999 . . . . . . . . . . . . . . . . . . . . . . . . . . . . . . . . . . . 204 2 5 352 3 4 $35,000 to $39,999 . . . . . . . . . . . . . . . . . . . . . . . . . . . . . . . . . . . *193 *2 *4 413 4 4 $40,000 to $49,999 . . . . . . . . . . . . . . . . . . . . . . . . . . . . . . . . . . . 364 2 9 765 4 8 $50,000 to $74,999 . . . . . . . . . . . . . . . . . . . . . . . . . . . . . . . . . . . 874 3 20 1,737 5 18 $75,000 to $99,999 . . . . . . . . . . . . . . . . . . . . . . . . . . . . . . . . . . . 669 3 16 1,702 7 18 $100,000 to $149,999 . . . . . . . . . . . . . . . . . . . . . . . . . . . . . . . . . 669 3 16 1,263 5 13 $150,000 or more . . . . . . . . . . . . . . . . . . . . . . . . . . . . . . . . . . . . 218 1 5 643 4 7 Not reported . . . . . . . . . . . . . . . . . . . . . . . . . . . . . . . . . . . . . . . . 460 1 11 1,131 2 12
Education 11 years or less . . . . . . . . . . . . . . . . . . . . . . . . . . . . . . . . . . . . . . 521 2 12 961 3 10 12 years . . . . . . . . . . . . . . . . . . . . . . . . . . . . . . . . . . . . . . . . . . . . 1,826 2 43 3,149 4 34 1 to 3 years of college . . . . . . . . . . . . . . . . . . . . . . . . . . . . . . . . . 991 2 23 2,519 5 27 4 years of college . . . . . . . . . . . . . . . . . . . . . . . . . . . . . . . . . . . . 653 2 15 1,794 4 19 5 years or more of college . . . . . . . . . . . . . . . . . . . . . . . . . . . . . . 293 1 7 967 3 10
* Estimate based on a sample size of 10–29. … Sample size too small (less than 10) to report data reliably. (Z) Less than 0.5 percent.
Note: Percent who participated columns show the percent of each row’s population who participated in the activity named by the column. Percent columns show the percent of each column’s participants who are described by the row heading. Demographic variables we could include but haven’t are (1) relationship to head of household, (2) marital status, (3) population size of area participant grew up, (4) years participant lived in resident state, (5) whether or not participant has a job, and (6) whether or not participant is going to school, keeping house, or retired.

U.S. Fish and Wildlife Service and U.S. Census Bureau 2011 National Survey of Fishing, Hunting, and Wildlife-Associated Recreation 63
Table 9. Selected Characteristics of Anglers by Type of Fishing: 2011(Population 16 years old and older. Numbers in thousands)
CharacteristicU.S. population Total, all fishing Total freshwater
Number Percent NumberPercent who participated Percent Number
Percent who participated Percent
Total persons . . . . . . . . . . . . . . . . . . . . . . . . . . . . . . . . . . . 239,313 100 33,112 14 100 27,547 12 100
Population Density of Residence Urban . . . . . . . . . . . . . . . . . . . . . . . . . . . . . . . . . . . . . . . . 180,723 76 20,216 11 61 15,918 9 58 Rural . . . . . . . . . . . . . . . . . . . . . . . . . . . . . . . . . . . . . . . . 58,589 24 12,896 22 39 11,629 20 42
Population Size of Residence Metropolitan Statistical Area (MSA) . . . . . . . . . . . . . . . 224,025 94 29,442 13 89 24,133 11 88 1,000,000 or more . . . . . . . . . . . . . . . . . . . . . . . . . . . . 127,462 53 12,669 10 38 9,802 8 36 250,000 to 999,999 . . . . . . . . . . . . . . . . . . . . . . . . . . . 48,157 20 7,071 15 21 5,565 12 20 50,000 to 249,999 . . . . . . . . . . . . . . . . . . . . . . . . . . . . 48,406 20 9,702 20 29 8,766 18 32 Outside MSA . . . . . . . . . . . . . . . . . . . . . . . . . . . . . . . . . . 15,288 6 3,670 24 11 3,414 22 12
Census Geographic Division New England . . . . . . . . . . . . . . . . . . . . . . . . . . . . . . . . . . 11,593 5 1,355 12 4 1,000 9 4 Middle Atlantic . . . . . . . . . . . . . . . . . . . . . . . . . . . . . . . . 32,392 14 3,496 11 11 2,409 7 9 East North Central . . . . . . . . . . . . . . . . . . . . . . . . . . . . . . 36,199 15 5,861 16 18 5,266 15 19 West North Central . . . . . . . . . . . . . . . . . . . . . . . . . . . . . 15,860 7 3,591 23 11 3,421 22 12 South Atlantic . . . . . . . . . . . . . . . . . . . . . . . . . . . . . . . . . 46,417 19 6,163 13 19 4,254 9 15 East South Central . . . . . . . . . . . . . . . . . . . . . . . . . . . . . . 14,206 6 2,444 17 7 2,274 16 8 West South Central . . . . . . . . . . . . . . . . . . . . . . . . . . . . . 27,195 11 4,298 16 13 3,760 14 14 Mountain . . . . . . . . . . . . . . . . . . . . . . . . . . . . . . . . . . . . . 17,013 7 2,586 15 8 2,499 15 9 Pacific . . . . . . . . . . . . . . . . . . . . . . . . . . . . . . . . . . . . . . . 38,438 16 3,319 9 10 2,663 7 10
Age 16 to 17 years . . . . . . . . . . . . . . . . . . . . . . . . . . . . . . . . . 7,652 3 942 12 3 766 10 3 18 to 24 years . . . . . . . . . . . . . . . . . . . . . . . . . . . . . . . . . 26,517 11 2,668 10 8 2,228 8 8 25 to 34 years . . . . . . . . . . . . . . . . . . . . . . . . . . . . . . . . . 41,613 17 6,133 15 19 5,250 13 19 35 to 44 years . . . . . . . . . . . . . . . . . . . . . . . . . . . . . . . . . 40,779 17 5,962 15 18 4,923 12 18 45 to 54 years . . . . . . . . . . . . . . . . . . . . . . . . . . . . . . . . . 46,167 19 7,428 16 22 6,131 13 22 55 to 64 years . . . . . . . . . . . . . . . . . . . . . . . . . . . . . . . . . 38,469 16 5,886 15 18 4,993 13 18 65 years and older . . . . . . . . . . . . . . . . . . . . . . . . . . . . . . 38,117 16 4,093 11 12 3,255 9 12 65 to 74 years . . . . . . . . . . . . . . . . . . . . . . . . . . . . . . . 22,655 9 3,051 13 9 2,415 11 9 75 and older . . . . . . . . . . . . . . . . . . . . . . . . . . . . . . . . . 15,461 6 1,042 7 3 840 5 3
Sex Male . . . . . . . . . . . . . . . . . . . . . . . . . . . . . . . . . . . . . . . . 114,705 48 24,226 21 73 20,359 18 74 Female . . . . . . . . . . . . . . . . . . . . . . . . . . . . . . . . . . . . . . . 124,608 52 8,885 7 27 7,188 6 26
Ethnicity Hispanic . . . . . . . . . . . . . . . . . . . . . . . . . . . . . . . . . . . . . 32,557 14 1,675 5 5 1,267 4 5 Non-Hispanic . . . . . . . . . . . . . . . . . . . . . . . . . . . . . . . . . 206,756 86 31,436 15 95 26,280 13 95
Race White . . . . . . . . . . . . . . . . . . . . . . . . . . . . . . . . . . . . . . . . 182,872 76 28,560 16 86 23,995 13 87 African American . . . . . . . . . . . . . . . . . . . . . . . . . . . . . . 23,402 10 2,286 10 7 1,750 7 6 Asian American . . . . . . . . . . . . . . . . . . . . . . . . . . . . . . . . 11,647 5 733 6 2 472 4 2 All others . . . . . . . . . . . . . . . . . . . . . . . . . . . . . . . . . . . . . 21,392 9 1,533 7 5 1,331 6 5
Annual Household Income Less than $20,000 . . . . . . . . . . . . . . . . . . . . . . . . . . . . . . 30,550 13 3,266 11 10 2,677 9 10 $20,000 to $24,999 . . . . . . . . . . . . . . . . . . . . . . . . . . . . . 12,713 5 1,573 12 5 1,421 11 5 $25,000 to $29,999 . . . . . . . . . . . . . . . . . . . . . . . . . . . . . 10,441 4 1,364 13 4 1,132 11 4 $30,000 to $34,999 . . . . . . . . . . . . . . . . . . . . . . . . . . . . . 11,504 5 1,444 13 4 1,190 10 4 $35,000 to $39,999 . . . . . . . . . . . . . . . . . . . . . . . . . . . . . 11,441 5 1,521 13 5 1,276 11 5 $40,000 to $49,999 . . . . . . . . . . . . . . . . . . . . . . . . . . . . . 17,091 7 2,721 16 8 2,412 14 9 $50,000 to $74,999 . . . . . . . . . . . . . . . . . . . . . . . . . . . . . 33,850 14 5,851 17 18 5,000 15 18 $75,000 to $99,999 . . . . . . . . . . . . . . . . . . . . . . . . . . . . . 25,236 11 4,848 19 15 4,182 17 15 $100,000 to $149,999 . . . . . . . . . . . . . . . . . . . . . . . . . . . 23,790 10 4,131 17 12 3,366 14 12 $150,000 or more . . . . . . . . . . . . . . . . . . . . . . . . . . . . . . 17,151 7 2,722 16 8 2,047 12 7 Not reported . . . . . . . . . . . . . . . . . . . . . . . . . . . . . . . . . . 45,545 19 3,671 8 11 2,845 6 10
Education 11 years or less . . . . . . . . . . . . . . . . . . . . . . . . . . . . . . . . 31,574 13 3,705 12 11 3,062 10 11 12 years . . . . . . . . . . . . . . . . . . . . . . . . . . . . . . . . . . . . . . 81,984 34 10,503 13 32 8,766 11 32 1 to 3 years of college . . . . . . . . . . . . . . . . . . . . . . . . . . . 55,014 23 8,495 15 26 7,331 13 27 4 years of college . . . . . . . . . . . . . . . . . . . . . . . . . . . . . . 42,552 18 6,342 15 19 5,324 13 19 5 years or more of college . . . . . . . . . . . . . . . . . . . . . . . . 28,188 12 4,068 14 12 3,064 11 11
See footnotes at end of table.

64 2011 National Survey of Fishing, Hunting, and Wildlife-Associated Recreation U.S. Fish and Wildlife Service and U.S. Census Bureau
Table 9. Selected Characteristics of Anglers by Type of Fishing: 2011—Continued(Population 16 years old and older. Numbers in thousands)
Characteristic
FreshwaterSaltwater
Freshwater, except Great Lakes Great Lakes
Number
Percent who
participated Percent Number
Percent who
participated Percent Number
Percent who
participated PercentTotal persons . . . . . . . . . . . . . . . . . . . . . . . . . . . . . . . . . . . 27,060 11 100 1,665 1 100 8,889 4 100
Population Density of Residence Urban . . . . . . . . . . . . . . . . . . . . . . . . . . . . . . . . . . . . . . . . 15,656 9 58 907 1 54 6,654 4 75 Rural . . . . . . . . . . . . . . . . . . . . . . . . . . . . . . . . . . . . . . . . 11,404 19 42 758 1 46 2,235 4 25
Population Size of Residence Metropolitan Statistical Area (MSA) . . . . . . . . . . . . . . . 23,759 11 88 1,416 1 85 8,519 4 96 1,000,000 or more . . . . . . . . . . . . . . . . . . . . . . . . . . . . 9,598 8 35 555 (Z) 33 4,658 4 52 250,000 to 999,999 . . . . . . . . . . . . . . . . . . . . . . . . . . . 5,498 11 20 485 1 29 2,191 5 25 50,000 to 249,999 . . . . . . . . . . . . . . . . . . . . . . . . . . . . 8,663 18 32 376 1 23 1,669 3 19 Outside MSA . . . . . . . . . . . . . . . . . . . . . . . . . . . . . . . . . . 3,301 22 12 *249 *2 *15 370 2 4
Census Geographic Division New England . . . . . . . . . . . . . . . . . . . . . . . . . . . . . . . . . . 996 9 4 ... ... ... 661 6 7 Middle Atlantic . . . . . . . . . . . . . . . . . . . . . . . . . . . . . . . . 2,343 7 9 395 1 24 1,425 4 16 East North Central . . . . . . . . . . . . . . . . . . . . . . . . . . . . . . 4,871 13 18 1,139 3 68 533 1 6 West North Central . . . . . . . . . . . . . . . . . . . . . . . . . . . . . 3,418 22 13 *66 *(Z) *4 *63 *(Z) *1 South Atlantic . . . . . . . . . . . . . . . . . . . . . . . . . . . . . . . . . 4,241 9 16 *35 *(Z) *2 3,101 7 35 East South Central . . . . . . . . . . . . . . . . . . . . . . . . . . . . . . 2,274 16 8 ... ... ... 360 3 4 West South Central . . . . . . . . . . . . . . . . . . . . . . . . . . . . . 3,760 14 14 ... ... ... 1,092 4 12 Mountain . . . . . . . . . . . . . . . . . . . . . . . . . . . . . . . . . . . . . 2,494 15 9 ... ... ... 170 1 2 Pacific . . . . . . . . . . . . . . . . . . . . . . . . . . . . . . . . . . . . . . . 2,663 7 10 ... ... ... 1,482 4 17
Age 16 to 17 years . . . . . . . . . . . . . . . . . . . . . . . . . . . . . . . . . 754 10 3 ... ... ... 234 3 3 18 to 24 years . . . . . . . . . . . . . . . . . . . . . . . . . . . . . . . . . 2,228 8 8 ... ... ... 530 2 6 25 to 34 years . . . . . . . . . . . . . . . . . . . . . . . . . . . . . . . . . 5,127 12 19 *320 *1 *19 1,505 4 17 35 to 44 years . . . . . . . . . . . . . . . . . . . . . . . . . . . . . . . . . 4,847 12 18 232 1 14 1,571 4 18 45 to 54 years . . . . . . . . . . . . . . . . . . . . . . . . . . . . . . . . . 5,954 13 22 483 1 29 2,161 5 24 55 to 64 years . . . . . . . . . . . . . . . . . . . . . . . . . . . . . . . . . 4,911 13 18 359 1 22 1,730 4 19 65 years and older . . . . . . . . . . . . . . . . . . . . . . . . . . . . . . 3,239 8 12 *137 *(Z) *8 1,157 3 13 65 to 74 years . . . . . . . . . . . . . . . . . . . . . . . . . . . . . . . 2,403 11 9 *117 *1 *7 913 4 10 75 and older . . . . . . . . . . . . . . . . . . . . . . . . . . . . . . . . . 836 5 3 ... ... ... 244 2 3
Sex Male . . . . . . . . . . . . . . . . . . . . . . . . . . . . . . . . . . . . . . . . 20,033 17 74 1,257 1 75 6,610 6 74 Female . . . . . . . . . . . . . . . . . . . . . . . . . . . . . . . . . . . . . . . 7,026 6 26 408 (Z) 25 2,279 2 26
Ethnicity Hispanic . . . . . . . . . . . . . . . . . . . . . . . . . . . . . . . . . . . . . 1,267 4 5 ... ... ... 603 2 7 Non-Hispanic . . . . . . . . . . . . . . . . . . . . . . . . . . . . . . . . . 25,793 12 95 1,644 1 99 8,286 4 93
Race White . . . . . . . . . . . . . . . . . . . . . . . . . . . . . . . . . . . . . . . . 23,562 13 87 1,561 1 94 7,383 4 83 African American . . . . . . . . . . . . . . . . . . . . . . . . . . . . . . 1,701 7 6 ... ... ... 764 3 9 Asian American . . . . . . . . . . . . . . . . . . . . . . . . . . . . . . . . 472 4 2 ... ... ... 373 3 4 All others . . . . . . . . . . . . . . . . . . . . . . . . . . . . . . . . . . . . . 1,326 6 5 ... ... ... 369 2 4
Annual Household Income Less than $20,000 . . . . . . . . . . . . . . . . . . . . . . . . . . . . . . 2,631 9 10 ... ... ... 725 2 8 $20,000 to $24,999 . . . . . . . . . . . . . . . . . . . . . . . . . . . . . 1,416 11 5 ... ... ... *98 *1 *1 $25,000 to $29,999 . . . . . . . . . . . . . . . . . . . . . . . . . . . . . 1,132 11 4 ... ... ... 428 4 5 $30,000 to $34,999 . . . . . . . . . . . . . . . . . . . . . . . . . . . . . 1,155 10 4 ... ... ... 310 3 3 $35,000 to $39,999 . . . . . . . . . . . . . . . . . . . . . . . . . . . . . 1,276 11 5 ... ... ... 256 2 3 $40,000 to $49,999 . . . . . . . . . . . . . . . . . . . . . . . . . . . . . 2,346 14 9 *153 *1 *9 611 4 7 $50,000 to $74,999 . . . . . . . . . . . . . . . . . . . . . . . . . . . . . 4,921 15 18 278 1 17 1,731 5 19 $75,000 to $99,999 . . . . . . . . . . . . . . . . . . . . . . . . . . . . . 4,032 16 15 *321 *1 *19 1,367 5 15 $100,000 to $149,999 . . . . . . . . . . . . . . . . . . . . . . . . . . . 3,308 14 12 334 1 20 1,167 5 13 $150,000 or more . . . . . . . . . . . . . . . . . . . . . . . . . . . . . . 2,022 12 7 *72 *(Z) *4 1,050 6 12 Not reported . . . . . . . . . . . . . . . . . . . . . . . . . . . . . . . . . . 2,821 6 10 *123 *(Z) *7 1,146 3 13
Education 11 years or less . . . . . . . . . . . . . . . . . . . . . . . . . . . . . . . . 3,040 10 11 ... ... ... 706 2 8 12 years . . . . . . . . . . . . . . . . . . . . . . . . . . . . . . . . . . . . . . 8,596 10 32 517 1 31 2,399 3 27 1 to 3 years of college . . . . . . . . . . . . . . . . . . . . . . . . . . . 7,126 13 26 488 1 29 2,282 4 26 4 years of college . . . . . . . . . . . . . . . . . . . . . . . . . . . . . . 5,263 12 19 344 1 21 1,828 4 21 5 years or more of college . . . . . . . . . . . . . . . . . . . . . . . . 3,035 11 11 *177 *1 *11 1,673 6 19* Estimate based on a sample size of 10–29. … Sample size too small (less than 10) to report data reliably. (Z) Less than 0.5 percent.
Note: Percent who participated columns show the percent of each row’s population who participated in the activity named by the column. Percent columns show the percent of each column’s participants who are described by the row heading. Demographic variables we could include but haven’t are (1) relationship to head of household, (2) marital status, (3) population size of area participant grew up, (4) years participant lived in resident state, (5) whether or not participant has a job, and (6) whether or not participant is going to school, keeping house, or retired.

U.S. Fish and Wildlife Service and U.S. Census Bureau 2011 National Survey of Fishing, Hunting, and Wildlife-Associated Recreation 65
Table 10. Selected Characteristics of Hunters by Type of Hunting: 2011(Population 16 years old and older. Numbers in thousands)
CharacteristicU.S. population Total, all hunting Big game
Number Percent NumberPercent who participated Percent Number
Percent who participated Percent
Total persons . . . . . . . . . . . . . . . . . . . . . . . . . . 239,313 100 13,674 6 100 11,570 5 100
Population Density of Residence Urban . . . . . . . . . . . . . . . . . . . . . . . . . . . . . . . 180,723 76 5,797 3 42 4,470 2 39 Rural . . . . . . . . . . . . . . . . . . . . . . . . . . . . . . . 58,589 24 7,877 13 58 7,099 12 61
Population Size of Residence Metropolitan Statistical Area (MSA) . . . . . . 224,025 94 10,915 5 80 9,059 4 78 1,000,000 or more . . . . . . . . . . . . . . . . . . . 127,462 53 3,367 3 25 2,693 2 23 250,000 to 999,999 . . . . . . . . . . . . . . . . . . 48,157 20 2,374 5 17 1,898 4 16 50,000 to 249,999 . . . . . . . . . . . . . . . . . . . 48,406 20 5,174 11 38 4,468 9 39 Outside MSA . . . . . . . . . . . . . . . . . . . . . . . . . 15,288 6 2,759 18 20 2,510 16 22
Census Geographic Division New England . . . . . . . . . . . . . . . . . . . . . . . . . 11,593 5 420 4 3 335 3 3 Middle Atlantic . . . . . . . . . . . . . . . . . . . . . . . 32,392 14 1,558 5 11 1,530 5 13 East North Central . . . . . . . . . . . . . . . . . . . . . 36,199 15 2,688 7 20 2,336 6 20 West North Central . . . . . . . . . . . . . . . . . . . . 15,860 7 1,661 10 12 1,368 9 12 South Atlantic . . . . . . . . . . . . . . . . . . . . . . . . 46,417 19 1,870 4 14 1,653 4 14 East South Central . . . . . . . . . . . . . . . . . . . . . 14,206 6 1,531 11 11 1,416 10 12 West South Central . . . . . . . . . . . . . . . . . . . . 27,195 11 1,909 7 14 1,537 6 13 Mountain . . . . . . . . . . . . . . . . . . . . . . . . . . . . 17,013 7 1,043 6 8 730 4 6 Pacific . . . . . . . . . . . . . . . . . . . . . . . . . . . . . . 38,438 16 996 3 7 666 2 6
Age 16 to 17 years . . . . . . . . . . . . . . . . . . . . . . . . 7,652 3 419 5 3 385 5 3 18 to 24 years . . . . . . . . . . . . . . . . . . . . . . . . 26,517 11 1,288 5 9 1,049 4 9 25 to 34 years . . . . . . . . . . . . . . . . . . . . . . . . 41,613 17 2,079 5 15 1,677 4 14 35 to 44 years . . . . . . . . . . . . . . . . . . . . . . . . 40,779 17 2,416 6 18 2,110 5 18 45 to 54 years . . . . . . . . . . . . . . . . . . . . . . . . 46,167 19 3,143 7 23 2,719 6 24 55 to 64 years . . . . . . . . . . . . . . . . . . . . . . . . 38,469 16 2,842 7 21 2,478 6 21 65 years and older . . . . . . . . . . . . . . . . . . . . . 38,117 16 1,487 4 11 1,151 3 10 65 to 74 years . . . . . . . . . . . . . . . . . . . . . . 22,655 9 1,221 5 9 968 4 8 75 and older . . . . . . . . . . . . . . . . . . . . . . . . 15,461 6 266 2 2 182 1 2
Sex Male . . . . . . . . . . . . . . . . . . . . . . . . . . . . . . . 114,705 48 12,217 11 89 10,220 9 88 Female . . . . . . . . . . . . . . . . . . . . . . . . . . . . . . 124,608 52 1,457 1 11 1,350 1 12
Ethnicity Hispanic . . . . . . . . . . . . . . . . . . . . . . . . . . . . 32,557 14 271 1 2 214 1 2 Non-Hispanic . . . . . . . . . . . . . . . . . . . . . . . . 206,756 86 13,403 6 98 11,356 5 98
Race White . . . . . . . . . . . . . . . . . . . . . . . . . . . . . . . 182,872 76 12,852 7 94 10,855 6 94 African American . . . . . . . . . . . . . . . . . . . . . 23,402 10 413 2 3 364 2 3 Asian American . . . . . . . . . . . . . . . . . . . . . . . 11,647 5 *27 *(Z) *(Z) *18 *(Z) *(Z) All others . . . . . . . . . . . . . . . . . . . . . . . . . . . . 21,392 9 382 2 3 333 2 3
Annual Household Income Less than $20,000 . . . . . . . . . . . . . . . . . . . . . 30,550 13 991 3 7 876 3 8 $20,000 to $24,999 . . . . . . . . . . . . . . . . . . . . 12,713 5 533 4 4 496 4 4 $25,000 to $29,999 . . . . . . . . . . . . . . . . . . . . 10,441 4 495 5 4 447 4 4 $30,000 to $34,999 . . . . . . . . . . . . . . . . . . . . 11,504 5 556 5 4 486 4 4 $35,000 to $39,999 . . . . . . . . . . . . . . . . . . . . 11,441 5 606 5 4 523 5 5 $40,000 to $49,999 . . . . . . . . . . . . . . . . . . . . 17,091 7 1,129 7 8 908 5 8 $50,000 to $74,999 . . . . . . . . . . . . . . . . . . . . 33,850 14 2,610 8 19 2,332 7 20 $75,000 to $99,999 . . . . . . . . . . . . . . . . . . . . 25,236 11 2,371 9 17 2,087 8 18 $100,000 to $149,999 . . . . . . . . . . . . . . . . . . 23,790 10 1,932 8 14 1,433 6 12 $150,000 or more . . . . . . . . . . . . . . . . . . . . . 17,151 7 861 5 6 662 4 6 Not reported . . . . . . . . . . . . . . . . . . . . . . . . . 45,545 19 1,591 3 12 1,320 3 11
Education 11 years or less . . . . . . . . . . . . . . . . . . . . . . . 31,574 13 1,482 5 11 1,411 4 12 12 years . . . . . . . . . . . . . . . . . . . . . . . . . . . . . 81,984 34 4,975 6 36 4,454 5 38 1 to 3 years of college . . . . . . . . . . . . . . . . . . 55,014 23 3,510 6 26 2,874 5 25 4 years of college . . . . . . . . . . . . . . . . . . . . . 42,552 18 2,447 6 18 1,915 4 17 5 years or more of college . . . . . . . . . . . . . . . 28,188 12 1,260 4 9 916 3 8See footnotes at end of table.

66 2011 National Survey of Fishing, Hunting, and Wildlife-Associated Recreation U.S. Fish and Wildlife Service and U.S. Census Bureau
Table 10. Selected Characteristics of Hunters by Type of Hunting: 2011—Continued(Population 16 years old and older. Numbers in thousands)
CharacteristicSmall game Migratory birds Other animals
NumberPercent who participated Percent Number
Percent who participated Percent Number
Percent who participated Percent
Total persons . . . . . . . . . . . . . . . . . . . . . . . . . . 4,506 2 100 2,583 1 100 2,168 1 100
Population Density of Residence Urban . . . . . . . . . . . . . . . . . . . . . . . . . . . . . . . 2,118 1 47 1,172 1 45 1,065 1 49 Rural . . . . . . . . . . . . . . . . . . . . . . . . . . . . . . . 2,389 4 53 1,411 2 55 1,103 2 51
Population Size of Residence Metropolitan Statistical Area (MSA) . . . . . . 3,612 2 80 2,134 1 83 1,699 1 78 1,000,000 or more . . . . . . . . . . . . . . . . . . . 1,255 1 28 668 1 26 612 (Z) 28 250,000 to 999,999 . . . . . . . . . . . . . . . . . . 819 2 18 465 1 18 325 1 15 50,000 to 249,999 . . . . . . . . . . . . . . . . . . . 1,539 3 34 1,001 2 39 762 2 35 Outside MSA . . . . . . . . . . . . . . . . . . . . . . . . . 894 6 20 449 3 17 469 3 22
Census Geographic Division New England . . . . . . . . . . . . . . . . . . . . . . . . . 174 2 4 60 1 2 59 1 3 Middle Atlantic . . . . . . . . . . . . . . . . . . . . . . . 550 2 12 *71 *(Z) *3 *261 *1 *12 East North Central . . . . . . . . . . . . . . . . . . . . . 810 2 18 477 1 18 367 1 17 West North Central . . . . . . . . . . . . . . . . . . . . 735 5 16 326 2 13 192 1 9 South Atlantic . . . . . . . . . . . . . . . . . . . . . . . . 534 1 12 392 1 15 237 1 11 East South Central . . . . . . . . . . . . . . . . . . . . . 455 3 10 167 1 6 183 1 8 West South Central . . . . . . . . . . . . . . . . . . . . 584 2 13 602 2 23 596 2 27 Mountain . . . . . . . . . . . . . . . . . . . . . . . . . . . . 333 2 7 200 1 8 163 1 8 Pacific . . . . . . . . . . . . . . . . . . . . . . . . . . . . . . 331 1 7 287 1 11 *112 *(Z) *5
Age 16 to 17 years . . . . . . . . . . . . . . . . . . . . . . . . *102 *1 *2 *64 *1 *2 *68 *1 *3 18 to 24 years . . . . . . . . . . . . . . . . . . . . . . . . 364 1 8 291 1 11 175 1 8 25 to 34 years . . . . . . . . . . . . . . . . . . . . . . . . 801 2 18 619 1 24 436 1 20 35 to 44 years . . . . . . . . . . . . . . . . . . . . . . . . 837 2 19 449 1 17 473 1 22 45 to 54 years . . . . . . . . . . . . . . . . . . . . . . . . 963 2 21 475 1 18 402 1 19 55 to 64 years . . . . . . . . . . . . . . . . . . . . . . . . 935 2 21 405 1 16 452 1 21 65 years and older . . . . . . . . . . . . . . . . . . . . . 503 1 11 281 1 11 162 (Z) 7 65 to 74 years . . . . . . . . . . . . . . . . . . . . . . 407 2 9 235 1 9 135 1 6 75 and older . . . . . . . . . . . . . . . . . . . . . . . . 97 1 2 *46 *(Z) *2 *27 *(Z) *1
Sex Male . . . . . . . . . . . . . . . . . . . . . . . . . . . . . . . 4,251 4 94 2,353 2 91 2,020 2 93 Female . . . . . . . . . . . . . . . . . . . . . . . . . . . . . . 255 (Z) 6 *231 *(Z) *9 *148 *(Z) *7
Ethnicity Hispanic . . . . . . . . . . . . . . . . . . . . . . . . . . . . *91 *(Z) *2 *54 *(Z) *2 ... ... ... Non-Hispanic . . . . . . . . . . . . . . . . . . . . . . . . 4,415 2 98 2,529 1 98 2,058 1 95
Race White . . . . . . . . . . . . . . . . . . . . . . . . . . . . . . . 4,183 2 93 2,486 1 96 2,055 1 95 African American . . . . . . . . . . . . . . . . . . . . . *106 *(Z) *2 ... ... ... ... ... ... Asian American . . . . . . . . . . . . . . . . . . . . . . . ... ... ... ... ... ... ... ... ... All others . . . . . . . . . . . . . . . . . . . . . . . . . . . . 202 1 4 *90 *(Z) *4 *77 *(Z) *4
Annual Household Income Less than $20,000 . . . . . . . . . . . . . . . . . . . . . 269 1 6 *100 *(Z) *4 *49 *(Z) *2 $20,000 to $24,999 . . . . . . . . . . . . . . . . . . . . 104 1 2 *30 *(Z) *1 ... ... ... $25,000 to $29,999 . . . . . . . . . . . . . . . . . . . . 148 1 3 *120 *1 *5 *93 *1 *4 $30,000 to $34,999 . . . . . . . . . . . . . . . . . . . . 201 2 4 *79 *1 *3 *119 *1 *5 $35,000 to $39,999 . . . . . . . . . . . . . . . . . . . . 237 2 5 *84 *1 *3 *92 *1 *4 $40,000 to $49,999 . . . . . . . . . . . . . . . . . . . . 496 3 11 274 2 11 *279 *2 *13 $50,000 to $74,999 . . . . . . . . . . . . . . . . . . . . 762 2 17 453 1 18 367 1 17 $75,000 to $99,999 . . . . . . . . . . . . . . . . . . . . 769 3 17 500 2 19 338 1 16 $100,000 to $149,999 . . . . . . . . . . . . . . . . . . 719 3 16 428 2 17 326 1 15 $150,000 or more . . . . . . . . . . . . . . . . . . . . . 319 2 7 161 1 6 210 1 10 Not reported . . . . . . . . . . . . . . . . . . . . . . . . . 483 1 11 354 1 14 255 1 12
Education 11 years or less . . . . . . . . . . . . . . . . . . . . . . . 393 1 9 189 1 7 234 1 11 12 years . . . . . . . . . . . . . . . . . . . . . . . . . . . . . 1,578 2 35 655 1 25 728 1 34 1 to 3 years of college . . . . . . . . . . . . . . . . . . 1,248 2 28 785 1 30 700 1 32 4 years of college . . . . . . . . . . . . . . . . . . . . . 780 2 17 674 2 26 309 1 14 5 years or more of college . . . . . . . . . . . . . . . 508 2 11 281 1 11 197 1 9* Estimate based on a sample size of 10–29. … Sample size too small (less than 10) to report data reliably. (Z) Less than 0.5 percent.
Note: Percent who participated columns show the percent of each row’s population who participated in the activity named by the column. Percent columns show the percent of each column’s participants who are described by the row heading. Demographic variables we could include but haven’t are (1) relationship to head of household, (2) marital status, (3) population size of area participant grew up, (4) years participant lived in resident state, (5) whether or not participant has a job, and (6) whether or not participant is going to school, keeping house, or retired. Detail does not add to total because of multiple responses and nonresponse.

U.S. Fish and Wildlife Service and U.S. Census Bureau 2011 National Survey of Fishing, Hunting, and Wildlife-Associated Recreation 67
Table 11. Summary of Expenditures for Fishing and Hunting: 2011(Population 16 years old and older)
Expenditure item
Expenditures SpendersAmount
(thousands of dollars)
Average per sportsperson
(dollars)1Number
(thousands)Percent of
sportspersons
Average per spender
(dollars)1
Total, all items . . . . . . . . . . . . . . . . . . . . . . . . . . . . . . . . . . . . . . . . . . 89,761,524 2,400 35,990 96 2,494
TRIP-RELATED EXPENDITURES
Total trip-related . . . . . . . . . . . . . . . . . . . . . . . . . . . . . . . . . . . . . . . . 32,210,653 861 33,507 90 961
Food and lodging, total . . . . . . . . . . . . . . . . . . . . . . . . . . . . . . . . . . . 11,592,622 310 29,048 78 399 Food . . . . . . . . . . . . . . . . . . . . . . . . . . . . . . . . . . . . . . . . . . . . . . . . 8,653,068 231 28,773 77 301 Lodging . . . . . . . . . . . . . . . . . . . . . . . . . . . . . . . . . . . . . . . . . . . . . . 2,939,554 79 7,422 20 396
Transportation, total . . . . . . . . . . . . . . . . . . . . . . . . . . . . . . . . . . . . . 11,029,451 295 29,691 79 371 Public . . . . . . . . . . . . . . . . . . . . . . . . . . . . . . . . . . . . . . . . . . . . . . . 1,107,975 30 2,760 7 401 Private . . . . . . . . . . . . . . . . . . . . . . . . . . . . . . . . . . . . . . . . . . . . . . . 9,921,476 265 28,843 77 344
Other trip costs2 . . . . . . . . . . . . . . . . . . . . . . . . . . . . . . . . . . . . . . . . . 9,588,580 256 26,804 72 358
EQUIPMENT EXPENDITURES
Fishing equipment . . . . . . . . . . . . . . . . . . . . . . . . . . . . . . . . . . . . . . . . 6,179,132 165 21,920 59 282Hunting equipment . . . . . . . . . . . . . . . . . . . . . . . . . . . . . . . . . . . . . . . 8,182,297 219 11,585 31 706Auxiliary equipment3 . . . . . . . . . . . . . . . . . . . . . . . . . . . . . . . . . . . . . 3,736,648 100 11,198 30 334Special equipment4 . . . . . . . . . . . . . . . . . . . . . . . . . . . . . . . . . . . . . . . 25,129,326 672 3,990 11 6,298
OTHER EXPENDITURES
Magazines, books, DVDs . . . . . . . . . . . . . . . . . . . . . . . . . . . . . . . . . . 319,781 9 6,053 16 53Membership dues and contributions . . . . . . . . . . . . . . . . . . . . . . . . . . 1,122,787 30 5,394 14 208Land leasing and ownership . . . . . . . . . . . . . . . . . . . . . . . . . . . . . . . . 10,563,362 282 2,935 8 3,600Licenses, stamps, tags, and permits . . . . . . . . . . . . . . . . . . . . . . . . . . 1,614,937 43 24,099 64 67Plantings (for hunting) . . . . . . . . . . . . . . . . . . . . . . . . . . . . . . . . . . . . 702,601 19 1,273 3 5521 Average expenditures are annual estimates.2 Other trip costs include guide fees, pack trip or package fees, public and private land use fees, equipment rental, boating costs (which include launching, mooring, storage, maintenance, insurance, pumpout fees, and fuel), bait, ice, and heating and cooking fuel.3 Auxiliary equipment includes camping equipment, binoculars, special fishing and hunting clothing, processing and taxidermy costs, foul weather gear, boots, waders, field glasses, telescopes, and electronic equipment such as a GPS device.4 Special equipment includes boats, campers, cabins, trail bikes, dune buggies, 4 x 4 vehicles, ATVs, 4-wheelers, snowmobiles, pickups, vans, travel and tent trailers, motor homes, house trailers, recreational vehicles (RVs) and other special equipment.
Note: Detail does not add to total because of multiple responses. Detail in subsequent tables may not add to totals shown here because of nonresponse to individual questions.

68 2011 National Survey of Fishing, Hunting, and Wildlife-Associated Recreation U.S. Fish and Wildlife Service and U.S. Census Bureau
Table 12. Expenditures for Fishing: 2011(Population 16 years old and older)
Expenditure item
Expenditures SpendersAmount
(thousands of dollars)
Average per angler (dollars)1
Number (thousands)
Percent of anglers
Average per spender
(dollars)1
Total, all items . . . . . . . . . . . . . . . . . . . . . . . . . . . . . . . . . . . . . . . . . . . . . . . . . . . . . . . . . . . . . . . . . . . . 41,788,936 1,262 30,289 91 1,380
TRIP-RELATED EXPENDITURES
Total trip-related . . . . . . . . . . . . . . . . . . . . . . . . . . . . . . . . . . . . . . . . . . . . . . . . . . . . . . . . . . . . . . . . . . 21,789,465 658 29,309 89 743
Food and lodging, total . . . . . . . . . . . . . . . . . . . . . . . . . . . . . . . . . . . . . . . . . . . . . . . . . . . . . . . . . . . . . 7,711,318 233 25,158 76 307 Food . . . . . . . . . . . . . . . . . . . . . . . . . . . . . . . . . . . . . . . . . . . . . . . . . . . . . . . . . . . . . . . . . . . . . . . . . . 5,435,208 164 24,891 75 218 Lodging . . . . . . . . . . . . . . . . . . . . . . . . . . . . . . . . . . . . . . . . . . . . . . . . . . . . . . . . . . . . . . . . . . . . . . . . 2,276,110 69 5,983 18 380
Transportation, total . . . . . . . . . . . . . . . . . . . . . . . . . . . . . . . . . . . . . . . . . . . . . . . . . . . . . . . . . . . . . . . 6,261,536 189 25,293 76 248 Public . . . . . . . . . . . . . . . . . . . . . . . . . . . . . . . . . . . . . . . . . . . . . . . . . . . . . . . . . . . . . . . . . . . . . . . . . 803,771 24 2,222 7 362 Private . . . . . . . . . . . . . . . . . . . . . . . . . . . . . . . . . . . . . . . . . . . . . . . . . . . . . . . . . . . . . . . . . . . . . . . . . 5,457,766 165 24,504 74 223
Other trip costs, total . . . . . . . . . . . . . . . . . . . . . . . . . . . . . . . . . . . . . . . . . . . . . . . . . . . . . . . . . . . . . . 7,816,610 236 25,143 76 311 Guide fees, pack trip or package fees . . . . . . . . . . . . . . . . . . . . . . . . . . . . . . . . . . . . . . . . . . . . . . . . . 1,102,375 33 2,946 9 374 Public land use fees . . . . . . . . . . . . . . . . . . . . . . . . . . . . . . . . . . . . . . . . . . . . . . . . . . . . . . . . . . . . . . . 237,887 7 4,190 13 57 Private land use fees . . . . . . . . . . . . . . . . . . . . . . . . . . . . . . . . . . . . . . . . . . . . . . . . . . . . . . . . . . . . . . 243,705 7 1,744 5 140 Equipment rental . . . . . . . . . . . . . . . . . . . . . . . . . . . . . . . . . . . . . . . . . . . . . . . . . . . . . . . . . . . . . . . . . 245,547 7 1,872 6 131 Boating costs2 . . . . . . . . . . . . . . . . . . . . . . . . . . . . . . . . . . . . . . . . . . . . . . . . . . . . . . . . . . . . . . . . . . . 3,815,819 115 7,929 24 481 Bait . . . . . . . . . . . . . . . . . . . . . . . . . . . . . . . . . . . . . . . . . . . . . . . . . . . . . . . . . . . . . . . . . . . . . . . . . . . 1,497,445 45 19,717 60 76 Ice . . . . . . . . . . . . . . . . . . . . . . . . . . . . . . . . . . . . . . . . . . . . . . . . . . . . . . . . . . . . . . . . . . . . . . . . . . . . 509,494 15 13,400 40 38 Heating and cooking fuel . . . . . . . . . . . . . . . . . . . . . . . . . . . . . . . . . . . . . . . . . . . . . . . . . . . . . . . . . . 164,337 5 3,810 12 43
EQUIPMENT EXPENDITURES
Fishing equipment, total . . . . . . . . . . . . . . . . . . . . . . . . . . . . . . . . . . . . . . . . . . . . . . . . . . . . . . . . . . . . 6,141,895 185 21,527 65 285 Rods, reels, poles, and rodmaking components . . . . . . . . . . . . . . . . . . . . . . . . . . . . . . . . . . . . . . . . . 2,366,774 71 10,651 32 222 Lines and leaders . . . . . . . . . . . . . . . . . . . . . . . . . . . . . . . . . . . . . . . . . . . . . . . . . . . . . . . . . . . . . . . . . 593,398 18 13,756 42 43 Artificial lures, flies, baits, and dressing for flies or lines . . . . . . . . . . . . . . . . . . . . . . . . . . . . . . . . . 1,169,092 35 15,560 47 75 Hooks, sinkers, swivels, and other items attached to a line except lures and baits . . . . . . . . . . . . . . 628,600 19 16,496 50 38 Tackle boxes . . . . . . . . . . . . . . . . . . . . . . . . . . . . . . . . . . . . . . . . . . . . . . . . . . . . . . . . . . . . . . . . . . . . 141,789 4 4,271 13 33 Creels, stringers, fish bags, landing nets, and gaff hooks . . . . . . . . . . . . . . . . . . . . . . . . . . . . . . . . . . 131,515 4 3,655 11 36 Minnow traps, seines, and bait containers . . . . . . . . . . . . . . . . . . . . . . . . . . . . . . . . . . . . . . . . . . . . . 81,008 2 3,172 10 26 Depth finders, fish finders, and other electronic fishing devices . . . . . . . . . . . . . . . . . . . . . . . . . . . . 469,849 14 938 3 501 Ice fishing equipment . . . . . . . . . . . . . . . . . . . . . . . . . . . . . . . . . . . . . . . . . . . . . . . . . . . . . . . . . . . . . 241,328 7 637 2 379 Other fishing equipment . . . . . . . . . . . . . . . . . . . . . . . . . . . . . . . . . . . . . . . . . . . . . . . . . . . . . . . . . . . 318,542 10 4,228 13 75
Auxiliary equipment, total . . . . . . . . . . . . . . . . . . . . . . . . . . . . . . . . . . . . . . . . . . . . . . . . . . . . . . . . . . 1,106,865 33 4,420 13 250 Camping equipment . . . . . . . . . . . . . . . . . . . . . . . . . . . . . . . . . . . . . . . . . . . . . . . . . . . . . . . . . . . . . . 385,633 12 1,976 6 195 Binoculars, field glasses, telescopes, etc. . . . . . . . . . . . . . . . . . . . . . . . . . . . . . . . . . . . . . . . . . . . . . . 85,522 3 410 1 208 Special fishing clothing, rubber boots, waders, and foul weather gear . . . . . . . . . . . . . . . . . . . . . . . 318,382 10 2,472 7 129 Processing and taxidermy costs . . . . . . . . . . . . . . . . . . . . . . . . . . . . . . . . . . . . . . . . . . . . . . . . . . . . . 82,766 2 188 1 440 Other . . . . . . . . . . . . . . . . . . . . . . . . . . . . . . . . . . . . . . . . . . . . . . . . . . . . . . . . . . . . . . . . . . . . . . . . . . 234,562 7 720 2 326
Special equipment3 . . . . . . . . . . . . . . . . . . . . . . . . . . . . . . . . . . . . . . . . . . . . . . . . . . . . . . . . . . . . . . . . 8,257,673 249 2,296 7 3,596
OTHER EXPENDITURES
Magazines, books, DVDs . . . . . . . . . . . . . . . . . . . . . . . . . . . . . . . . . . . . . . . . . . . . . . . . . . . . . . . . . . . . 108,308 3 2,483 8 44Membership dues and contributions . . . . . . . . . . . . . . . . . . . . . . . . . . . . . . . . . . . . . . . . . . . . . . . . . . . . 321,990 10 1,728 5 186Land leasing and ownership . . . . . . . . . . . . . . . . . . . . . . . . . . . . . . . . . . . . . . . . . . . . . . . . . . . . . . . . . . 3,434,097 104 924 3 3,716Licenses, stamps, tags, and permits, total . . . . . . . . . . . . . . . . . . . . . . . . . . . . . . . . . . . . . . . . . . . . . . . . 628,642 19 17,166 52 37 Licenses . . . . . . . . . . . . . . . . . . . . . . . . . . . . . . . . . . . . . . . . . . . . . . . . . . . . . . . . . . . . . . . . . . . . . . . . 551,824 17 16,233 49 34 Stamps, tags, and permits . . . . . . . . . . . . . . . . . . . . . . . . . . . . . . . . . . . . . . . . . . . . . . . . . . . . . . . . . . 76,819 2 3,726 11 211 Average expenditures are annual estimates.2 Boating costs include launching, mooring, storage, maintenance, insurance, pumpout fees, and fuel.3 Special equipment includes boats, campers, cabins, trail bikes, dune buggies, 4 x 4 vehicles, ATVs, 4-wheelers, snowmobiles, pickups, vans, travel and tent trailers, motor homes, house trailers, recreational vehicles (RVs) and other special equipment.
Note: Detail does not add to total because of multiple responses. Detail in Tables 13 to 16 may not add to totals shown here because of multiple responses and nonresponse.

U.S. Fish and Wildlife Service and U.S. Census Bureau 2011 National Survey of Fishing, Hunting, and Wildlife-Associated Recreation 69
Table 13. Trip and Equipment Expenditures for Freshwater Fishing: 2011(Population 16 years old and older)
Expenditure item
Expenditures SpendersAmount
(thousands of dollars)
Average per angler (dollars)1
Number (thousands)
Percent of anglers
Average per spender
(dollars)1
Total, all items . . . . . . . . . . . . . . . . . . . . . . . . . . . . . . . . . . . . . . . . . . . . . . . . . . . . . . . . . . . . . . . . . 25,732,493 934 25,498 93 1,009
TRIP-RELATED EXPENDITURES
Total trip-related . . . . . . . . . . . . . . . . . . . . . . . . . . . . . . . . . . . . . . . . . . . . . . . . . . . . . . . . . . . . . . . 14,463,533 525 25,020 91 578
Food and lodging, total . . . . . . . . . . . . . . . . . . . . . . . . . . . . . . . . . . . . . . . . . . . . . . . . . . . . . . . . . . 5,334,362 194 21,469 78 248 Food . . . . . . . . . . . . . . . . . . . . . . . . . . . . . . . . . . . . . . . . . . . . . . . . . . . . . . . . . . . . . . . . . . . . . . . 3,811,899 138 21,316 77 179 Lodging . . . . . . . . . . . . . . . . . . . . . . . . . . . . . . . . . . . . . . . . . . . . . . . . . . . . . . . . . . . . . . . . . . . . . 1,522,464 55 4,559 17 334
Transportation, total . . . . . . . . . . . . . . . . . . . . . . . . . . . . . . . . . . . . . . . . . . . . . . . . . . . . . . . . . . . . 4,714,131 171 21,565 78 219 Public . . . . . . . . . . . . . . . . . . . . . . . . . . . . . . . . . . . . . . . . . . . . . . . . . . . . . . . . . . . . . . . . . . . . . . 479,435 17 1,393 5 344 Private . . . . . . . . . . . . . . . . . . . . . . . . . . . . . . . . . . . . . . . . . . . . . . . . . . . . . . . . . . . . . . . . . . . . . . 4,234,697 154 21,092 77 201
Other trip costs, total . . . . . . . . . . . . . . . . . . . . . . . . . . . . . . . . . . . . . . . . . . . . . . . . . . . . . . . . . . . 4,415,039 160 21,102 77 209 Guide fees, pack trip or package fees . . . . . . . . . . . . . . . . . . . . . . . . . . . . . . . . . . . . . . . . . . . . . . 525,501 19 1,460 5 360 Public land use fees . . . . . . . . . . . . . . . . . . . . . . . . . . . . . . . . . . . . . . . . . . . . . . . . . . . . . . . . . . . . 188,463 7 3,568 13 53 Private land use fees . . . . . . . . . . . . . . . . . . . . . . . . . . . . . . . . . . . . . . . . . . . . . . . . . . . . . . . . . . . 112,358 4 1,475 5 76 Equipment rental . . . . . . . . . . . . . . . . . . . . . . . . . . . . . . . . . . . . . . . . . . . . . . . . . . . . . . . . . . . . . . 183,811 7 1,468 5 125 Boating costs2 . . . . . . . . . . . . . . . . . . . . . . . . . . . . . . . . . . . . . . . . . . . . . . . . . . . . . . . . . . . . . . . . 1,980,784 72 6,231 23 318 Bait . . . . . . . . . . . . . . . . . . . . . . . . . . . . . . . . . . . . . . . . . . . . . . . . . . . . . . . . . . . . . . . . . . . . . . . . 950,729 35 16,644 60 57 Ice . . . . . . . . . . . . . . . . . . . . . . . . . . . . . . . . . . . . . . . . . . . . . . . . . . . . . . . . . . . . . . . . . . . . . . . . . 323,059 12 11,162 41 29 Heating and cooking fuel . . . . . . . . . . . . . . . . . . . . . . . . . . . . . . . . . . . . . . . . . . . . . . . . . . . . . . . 150,335 5 3,490 13 43
EQUIPMENT EXPENDITURES
Fishing equipment, total . . . . . . . . . . . . . . . . . . . . . . . . . . . . . . . . . . . . . . . . . . . . . . . . . . . . . . . . . 4,269,676 155 17,043 62 251 Rods, reels, poles, and rodmaking components . . . . . . . . . . . . . . . . . . . . . . . . . . . . . . . . . . . . . . 1,597,184 58 8,174 30 195 Lines and leaders . . . . . . . . . . . . . . . . . . . . . . . . . . . . . . . . . . . . . . . . . . . . . . . . . . . . . . . . . . . . . . 387,736 14 10,282 37 38 Artificial lures, flies, baits, and dressing for flies or lines . . . . . . . . . . . . . . . . . . . . . . . . . . . . . . 914,388 33 12,375 45 74 Hooks, sinkers, swivels, and other items attached to a line except lures and baits . . . . . . . . . . . 416,799 15 12,350 45 34 Tackle boxes . . . . . . . . . . . . . . . . . . . . . . . . . . . . . . . . . . . . . . . . . . . . . . . . . . . . . . . . . . . . . . . . . 92,797 3 2,990 11 31 Creels, stringers, fish bags, landing nets, and gaff hooks . . . . . . . . . . . . . . . . . . . . . . . . . . . . . . . 95,022 3 2,726 10 35 Minnow traps, seines, and bait containers . . . . . . . . . . . . . . . . . . . . . . . . . . . . . . . . . . . . . . . . . . 43,532 2 2,278 8 19 Depth finders, fish finders, and other electronic fishing devices . . . . . . . . . . . . . . . . . . . . . . . . . 303,931 11 709 3 428 Ice fishing equipment . . . . . . . . . . . . . . . . . . . . . . . . . . . . . . . . . . . . . . . . . . . . . . . . . . . . . . . . . . 241,196 9 625 2 386 Other fishing equipment . . . . . . . . . . . . . . . . . . . . . . . . . . . . . . . . . . . . . . . . . . . . . . . . . . . . . . . . 177,091 6 2,787 10 64
Auxiliary equipment, total . . . . . . . . . . . . . . . . . . . . . . . . . . . . . . . . . . . . . . . . . . . . . . . . . . . . . . . 646,603 23 2,741 10 236 Camping equipment . . . . . . . . . . . . . . . . . . . . . . . . . . . . . . . . . . . . . . . . . . . . . . . . . . . . . . . . . . . 150,712 5 800 3 188 Binoculars, field glasses, telescopes, etc. . . . . . . . . . . . . . . . . . . . . . . . . . . . . . . . . . . . . . . . . . . . 65,985 2 242 1 273 Special fishing clothing, rubber boots, waders, and foul weather gear . . . . . . . . . . . . . . . . . . . . 209,291 8 1,645 6 127 Processing and taxidermy costs . . . . . . . . . . . . . . . . . . . . . . . . . . . . . . . . . . . . . . . . . . . . . . . . . . *59,678 *2 *126 *(Z) *473 Other . . . . . . . . . . . . . . . . . . . . . . . . . . . . . . . . . . . . . . . . . . . . . . . . . . . . . . . . . . . . . . . . . . . . . . . 160,936 6 501 2 321
Special equipment3 . . . . . . . . . . . . . . . . . . . . . . . . . . . . . . . . . . . . . . . . . . . . . . . . . . . . . . . . . . . . . 6,352,682 231 1,764 6 3,602* Estimate based on a sample size of 10–29. (Z) Less than 0.5 percent. 1 Average expenditures are annual estimates.2 Boating costs include launching, mooring, storage, maintenance, insurance, pumpout fees, and fuel.3 Special equipment includes boats, campers, cabins, trail bikes, dune buggies, 4 x 4 vehicles, ATVs, 4-wheelers, snowmobiles, pickups, vans, travel and tent trailers, motor homes, house trailers, recreational vehicles (RVs) and other special equipment.
Note: Detail does not add to total because of multiple responses.
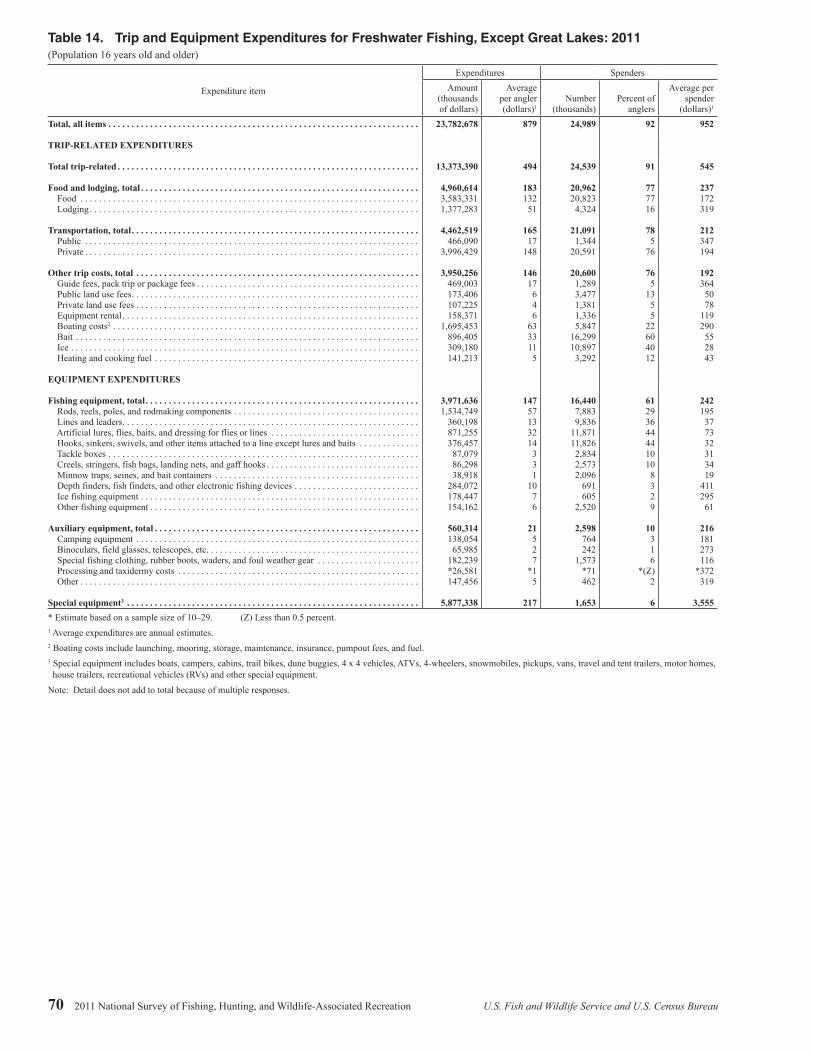
70 2011 National Survey of Fishing, Hunting, and Wildlife-Associated Recreation U.S. Fish and Wildlife Service and U.S. Census Bureau
Table 14. Trip and Equipment Expenditures for Freshwater Fishing, Except Great Lakes: 2011(Population 16 years old and older)
Expenditure item
Expenditures SpendersAmount
(thousands of dollars)
Average per angler (dollars)1
Number (thousands)
Percent of anglers
Average per spender
(dollars)1
Total, all items . . . . . . . . . . . . . . . . . . . . . . . . . . . . . . . . . . . . . . . . . . . . . . . . . . . . . . . . . . . . . . . . . . . 23,782,678 879 24,989 92 952
TRIP-RELATED EXPENDITURES
Total trip-related . . . . . . . . . . . . . . . . . . . . . . . . . . . . . . . . . . . . . . . . . . . . . . . . . . . . . . . . . . . . . . . . . 13,373,390 494 24,539 91 545
Food and lodging, total . . . . . . . . . . . . . . . . . . . . . . . . . . . . . . . . . . . . . . . . . . . . . . . . . . . . . . . . . . . . 4,960,614 183 20,962 77 237 Food . . . . . . . . . . . . . . . . . . . . . . . . . . . . . . . . . . . . . . . . . . . . . . . . . . . . . . . . . . . . . . . . . . . . . . . . . 3,583,331 132 20,823 77 172 Lodging . . . . . . . . . . . . . . . . . . . . . . . . . . . . . . . . . . . . . . . . . . . . . . . . . . . . . . . . . . . . . . . . . . . . . . . 1,377,283 51 4,324 16 319
Transportation, total . . . . . . . . . . . . . . . . . . . . . . . . . . . . . . . . . . . . . . . . . . . . . . . . . . . . . . . . . . . . . . 4,462,519 165 21,091 78 212 Public . . . . . . . . . . . . . . . . . . . . . . . . . . . . . . . . . . . . . . . . . . . . . . . . . . . . . . . . . . . . . . . . . . . . . . . . 466,090 17 1,344 5 347 Private . . . . . . . . . . . . . . . . . . . . . . . . . . . . . . . . . . . . . . . . . . . . . . . . . . . . . . . . . . . . . . . . . . . . . . . . 3,996,429 148 20,591 76 194
Other trip costs, total . . . . . . . . . . . . . . . . . . . . . . . . . . . . . . . . . . . . . . . . . . . . . . . . . . . . . . . . . . . . . 3,950,256 146 20,600 76 192 Guide fees, pack trip or package fees . . . . . . . . . . . . . . . . . . . . . . . . . . . . . . . . . . . . . . . . . . . . . . . . 469,003 17 1,289 5 364 Public land use fees . . . . . . . . . . . . . . . . . . . . . . . . . . . . . . . . . . . . . . . . . . . . . . . . . . . . . . . . . . . . . . 173,406 6 3,477 13 50 Private land use fees . . . . . . . . . . . . . . . . . . . . . . . . . . . . . . . . . . . . . . . . . . . . . . . . . . . . . . . . . . . . . 107,225 4 1,381 5 78 Equipment rental . . . . . . . . . . . . . . . . . . . . . . . . . . . . . . . . . . . . . . . . . . . . . . . . . . . . . . . . . . . . . . . . 158,371 6 1,336 5 119 Boating costs2 . . . . . . . . . . . . . . . . . . . . . . . . . . . . . . . . . . . . . . . . . . . . . . . . . . . . . . . . . . . . . . . . . . 1,695,453 63 5,847 22 290 Bait . . . . . . . . . . . . . . . . . . . . . . . . . . . . . . . . . . . . . . . . . . . . . . . . . . . . . . . . . . . . . . . . . . . . . . . . . . 896,405 33 16,299 60 55 Ice . . . . . . . . . . . . . . . . . . . . . . . . . . . . . . . . . . . . . . . . . . . . . . . . . . . . . . . . . . . . . . . . . . . . . . . . . . . 309,180 11 10,897 40 28 Heating and cooking fuel . . . . . . . . . . . . . . . . . . . . . . . . . . . . . . . . . . . . . . . . . . . . . . . . . . . . . . . . . 141,213 5 3,292 12 43
EQUIPMENT EXPENDITURES
Fishing equipment, total . . . . . . . . . . . . . . . . . . . . . . . . . . . . . . . . . . . . . . . . . . . . . . . . . . . . . . . . . . . 3,971,636 147 16,440 61 242 Rods, reels, poles, and rodmaking components . . . . . . . . . . . . . . . . . . . . . . . . . . . . . . . . . . . . . . . . 1,534,749 57 7,883 29 195 Lines and leaders . . . . . . . . . . . . . . . . . . . . . . . . . . . . . . . . . . . . . . . . . . . . . . . . . . . . . . . . . . . . . . . . 360,198 13 9,836 36 37 Artificial lures, flies, baits, and dressing for flies or lines . . . . . . . . . . . . . . . . . . . . . . . . . . . . . . . . 871,255 32 11,871 44 73 Hooks, sinkers, swivels, and other items attached to a line except lures and baits . . . . . . . . . . . . . 376,457 14 11,826 44 32 Tackle boxes . . . . . . . . . . . . . . . . . . . . . . . . . . . . . . . . . . . . . . . . . . . . . . . . . . . . . . . . . . . . . . . . . . . 87,079 3 2,834 10 31 Creels, stringers, fish bags, landing nets, and gaff hooks . . . . . . . . . . . . . . . . . . . . . . . . . . . . . . . . . 86,298 3 2,573 10 34 Minnow traps, seines, and bait containers . . . . . . . . . . . . . . . . . . . . . . . . . . . . . . . . . . . . . . . . . . . . 38,918 1 2,096 8 19 Depth finders, fish finders, and other electronic fishing devices . . . . . . . . . . . . . . . . . . . . . . . . . . . 284,072 10 691 3 411 Ice fishing equipment . . . . . . . . . . . . . . . . . . . . . . . . . . . . . . . . . . . . . . . . . . . . . . . . . . . . . . . . . . . . 178,447 7 605 2 295 Other fishing equipment . . . . . . . . . . . . . . . . . . . . . . . . . . . . . . . . . . . . . . . . . . . . . . . . . . . . . . . . . . 154,162 6 2,520 9 61
Auxiliary equipment, total . . . . . . . . . . . . . . . . . . . . . . . . . . . . . . . . . . . . . . . . . . . . . . . . . . . . . . . . . 560,314 21 2,598 10 216 Camping equipment . . . . . . . . . . . . . . . . . . . . . . . . . . . . . . . . . . . . . . . . . . . . . . . . . . . . . . . . . . . . . 138,054 5 764 3 181 Binoculars, field glasses, telescopes, etc. . . . . . . . . . . . . . . . . . . . . . . . . . . . . . . . . . . . . . . . . . . . . . 65,985 2 242 1 273 Special fishing clothing, rubber boots, waders, and foul weather gear . . . . . . . . . . . . . . . . . . . . . . 182,239 7 1,573 6 116 Processing and taxidermy costs . . . . . . . . . . . . . . . . . . . . . . . . . . . . . . . . . . . . . . . . . . . . . . . . . . . . *26,581 *1 *71 *(Z) *372 Other . . . . . . . . . . . . . . . . . . . . . . . . . . . . . . . . . . . . . . . . . . . . . . . . . . . . . . . . . . . . . . . . . . . . . . . . . 147,456 5 462 2 319
Special equipment3 . . . . . . . . . . . . . . . . . . . . . . . . . . . . . . . . . . . . . . . . . . . . . . . . . . . . . . . . . . . . . . . 5,877,338 217 1,653 6 3,555* Estimate based on a sample size of 10–29. (Z) Less than 0.5 percent.1 Average expenditures are annual estimates.2 Boating costs include launching, mooring, storage, maintenance, insurance, pumpout fees, and fuel.3 Special equipment includes boats, campers, cabins, trail bikes, dune buggies, 4 x 4 vehicles, ATVs, 4-wheelers, snowmobiles, pickups, vans, travel and tent trailers, motor homes, house trailers, recreational vehicles (RVs) and other special equipment.
Note: Detail does not add to total because of multiple responses.

U.S. Fish and Wildlife Service and U.S. Census Bureau 2011 National Survey of Fishing, Hunting, and Wildlife-Associated Recreation 71
Table 15. Trip and Equipment Expenditures for Great Lakes Fishing: 2011(Population 16 years old and older)
Expenditure item
Expenditures SpendersAmount
(thousands of dollars)
Average per angler (dollars)1
Number (thousands)
Percent of anglers
Average per spender
(dollars)1
Total, all items . . . . . . . . . . . . . . . . . . . . . . . . . . . . . . . . . . . . . . . . . . . . . . . . . . . . . . . . . . . . . . . . . . . . . 1,867,098 1,121 1,583 95 1,180
TRIP-RELATED EXPENDITURES
Total trip-related . . . . . . . . . . . . . . . . . . . . . . . . . . . . . . . . . . . . . . . . . . . . . . . . . . . . . . . . . . . . . . . . . . . 1,090,143 655 1,583 95 689
Food and lodging, total . . . . . . . . . . . . . . . . . . . . . . . . . . . . . . . . . . . . . . . . . . . . . . . . . . . . . . . . . . . . . . 373,748 224 1,497 90 250 Food . . . . . . . . . . . . . . . . . . . . . . . . . . . . . . . . . . . . . . . . . . . . . . . . . . . . . . . . . . . . . . . . . . . . . . . . . . . 228,567 137 1,484 89 154 Lodging . . . . . . . . . . . . . . . . . . . . . . . . . . . . . . . . . . . . . . . . . . . . . . . . . . . . . . . . . . . . . . . . . . . . . . . . . 145,181 87 399 24 364
Transportation, total . . . . . . . . . . . . . . . . . . . . . . . . . . . . . . . . . . . . . . . . . . . . . . . . . . . . . . . . . . . . . . . . 251,612 151 1,418 85 177 Public . . . . . . . . . . . . . . . . . . . . . . . . . . . . . . . . . . . . . . . . . . . . . . . . . . . . . . . . . . . . . . . . . . . . . . . . . . ... ... ... ... ... Private . . . . . . . . . . . . . . . . . . . . . . . . . . . . . . . . . . . . . . . . . . . . . . . . . . . . . . . . . . . . . . . . . . . . . . . . . . 238,268 143 1,403 84 170
Other trip costs, total . . . . . . . . . . . . . . . . . . . . . . . . . . . . . . . . . . . . . . . . . . . . . . . . . . . . . . . . . . . . . . . 464,783 279 1,486 89 313 Guide fees, pack trip or package fees . . . . . . . . . . . . . . . . . . . . . . . . . . . . . . . . . . . . . . . . . . . . . . . . . . *56,498 *34 *216 *13 *262 Public land use fees . . . . . . . . . . . . . . . . . . . . . . . . . . . . . . . . . . . . . . . . . . . . . . . . . . . . . . . . . . . . . . . . *15,057 *9 *116 *7 *130 Private land use fees . . . . . . . . . . . . . . . . . . . . . . . . . . . . . . . . . . . . . . . . . . . . . . . . . . . . . . . . . . . . . . . ... ... ... ... ... Equipment rental . . . . . . . . . . . . . . . . . . . . . . . . . . . . . . . . . . . . . . . . . . . . . . . . . . . . . . . . . . . . . . . . . . *25,440 *15 *142 *9 *180 Boating costs2 . . . . . . . . . . . . . . . . . . . . . . . . . . . . . . . . . . . . . . . . . . . . . . . . . . . . . . . . . . . . . . . . . . . . 285,330 171 660 40 432 Bait . . . . . . . . . . . . . . . . . . . . . . . . . . . . . . . . . . . . . . . . . . . . . . . . . . . . . . . . . . . . . . . . . . . . . . . . . . . . 54,324 33 1,016 61 53 Ice . . . . . . . . . . . . . . . . . . . . . . . . . . . . . . . . . . . . . . . . . . . . . . . . . . . . . . . . . . . . . . . . . . . . . . . . . . . . . 13,879 8 712 43 20 Heating and cooking fuel . . . . . . . . . . . . . . . . . . . . . . . . . . . . . . . . . . . . . . . . . . . . . . . . . . . . . . . . . . . *9,122 *5 *302 *18 *30
EQUIPMENT EXPENDITURES
Fishing equipment, total . . . . . . . . . . . . . . . . . . . . . . . . . . . . . . . . . . . . . . . . . . . . . . . . . . . . . . . . . . . . . 222,925 134 630 38 354 Rods, reels, poles, and rodmaking components . . . . . . . . . . . . . . . . . . . . . . . . . . . . . . . . . . . . . . . . . . *49,524 *30 *281 *17 *176 Lines and leaders . . . . . . . . . . . . . . . . . . . . . . . . . . . . . . . . . . . . . . . . . . . . . . . . . . . . . . . . . . . . . . . . . . 24,424 15 402 24 61 Artificial lures, flies, baits, and dressing for flies or lines . . . . . . . . . . . . . . . . . . . . . . . . . . . . . . . . . . 38,319 23 382 23 100 Hooks, sinkers, swivels, and other items attached to a line except lures and baits . . . . . . . . . . . . . . . 26,938 16 420 25 64 Tackle boxes . . . . . . . . . . . . . . . . . . . . . . . . . . . . . . . . . . . . . . . . . . . . . . . . . . . . . . . . . . . . . . . . . . . . . ... ... ... ... ... Creels, stringers, fish bags, landing nets, and gaff hooks . . . . . . . . . . . . . . . . . . . . . . . . . . . . . . . . . . . ... ... ... ... ... Minnow traps, seines, and bait containers . . . . . . . . . . . . . . . . . . . . . . . . . . . . . . . . . . . . . . . . . . . . . . ... ... ... ... ... Depth finders, fish finders, and other electronic fishing devices . . . . . . . . . . . . . . . . . . . . . . . . . . . . . ... ... ... ... ... Ice fishing equipment . . . . . . . . . . . . . . . . . . . . . . . . . . . . . . . . . . . . . . . . . . . . . . . . . . . . . . . . . . . . . . ... ... ... ... ... Other fishing equipment . . . . . . . . . . . . . . . . . . . . . . . . . . . . . . . . . . . . . . . . . . . . . . . . . . . . . . . . . . . . *19,738 *12 *210 *13 *94
Auxiliary equipment, total . . . . . . . . . . . . . . . . . . . . . . . . . . . . . . . . . . . . . . . . . . . . . . . . . . . . . . . . . . . *83,388 *50 *126 *8 *660 Camping equipment . . . . . . . . . . . . . . . . . . . . . . . . . . . . . . . . . . . . . . . . . . . . . . . . . . . . . . . . . . . . . . . ... ... ... ... ... Binoculars, field glasses, telescopes, etc. . . . . . . . . . . . . . . . . . . . . . . . . . . . . . . . . . . . . . . . . . . . . . . . ... ... ... ... ... Special fishing clothing, rubber boots, waders, and foul weather gear . . . . . . . . . . . . . . . . . . . . . . . . ... ... ... ... ... Processing and taxidermy costs . . . . . . . . . . . . . . . . . . . . . . . . . . . . . . . . . . . . . . . . . . . . . . . . . . . . . . ... ... ... ... ... Other . . . . . . . . . . . . . . . . . . . . . . . . . . . . . . . . . . . . . . . . . . . . . . . . . . . . . . . . . . . . . . . . . . . . . . . . . . . ... ... ... ... ...
Special equipment3 . . . . . . . . . . . . . . . . . . . . . . . . . . . . . . . . . . . . . . . . . . . . . . . . . . . . . . . . . . . . . . . . . *470,642 *283 *103 *6 *457* Estimate based on a sample size of 10–29. … Sample size too small (less than 10) to report data reliably. 1 Average expenditures are annual estimates.2 Boating costs include launching, mooring, storage, maintenance, insurance, pumpout fees, and fuel.3 Special equipment includes boats, campers, cabins, trail bikes, dune buggies, 4 x 4 vehicles, ATVs, 4-wheelers, snowmobiles, pickups, vans, travel and tent trailers, motor homes, house trailers, recreational vehicles (RVs) and other special equipment.
Note: Detail does not add to total because of multiple responses.

72 2011 National Survey of Fishing, Hunting, and Wildlife-Associated Recreation U.S. Fish and Wildlife Service and U.S. Census Bureau
Table 16. Trip and Equipment Expenditures for Saltwater Fishing: 2011(Population 16 years old and older)
Expenditure item
Expenditures SpendersAmount
(thousands of dollars)
Average per angler
(dollars)1Number
(thousands)Percent of
anglers
Average per spender
(dollars)1
Total, all items . . . . . . . . . . . . . . . . . . . . . . . . . . . . . . . . . . . . . . . . . . . . . . . . . . . . . . . . . . . . . . . . . . . . . . 10,266,904 1,155 8,115 91 1,265
TRIP-RELATED EXPENDITURES
Total trip-related . . . . . . . . . . . . . . . . . . . . . . . . . . . . . . . . . . . . . . . . . . . . . . . . . . . . . . . . . . . . . . . . . . . . 7,325,932 824 8,046 91 911
Food and lodging, total . . . . . . . . . . . . . . . . . . . . . . . . . . . . . . . . . . . . . . . . . . . . . . . . . . . . . . . . . . . . . . . 2,376,956 267 6,920 78 343 Food . . . . . . . . . . . . . . . . . . . . . . . . . . . . . . . . . . . . . . . . . . . . . . . . . . . . . . . . . . . . . . . . . . . . . . . . . . . . 1,623,310 183 6,767 76 240 Lodging . . . . . . . . . . . . . . . . . . . . . . . . . . . . . . . . . . . . . . . . . . . . . . . . . . . . . . . . . . . . . . . . . . . . . . . . . . 753,647 85 1,677 19 449
Transportation, total . . . . . . . . . . . . . . . . . . . . . . . . . . . . . . . . . . . . . . . . . . . . . . . . . . . . . . . . . . . . . . . . . 1,547,405 174 6,809 77 227 Public . . . . . . . . . . . . . . . . . . . . . . . . . . . . . . . . . . . . . . . . . . . . . . . . . . . . . . . . . . . . . . . . . . . . . . . . . . . 324,336 36 979 11 331 Private . . . . . . . . . . . . . . . . . . . . . . . . . . . . . . . . . . . . . . . . . . . . . . . . . . . . . . . . . . . . . . . . . . . . . . . . . . . 1,223,069 138 6,199 70 197
Other trip costs, total . . . . . . . . . . . . . . . . . . . . . . . . . . . . . . . . . . . . . . . . . . . . . . . . . . . . . . . . . . . . . . . . 3,401,571 383 6,885 77 494 Guide fees, pack trip or package fees . . . . . . . . . . . . . . . . . . . . . . . . . . . . . . . . . . . . . . . . . . . . . . . . . . . 576,874 65 1,596 18 361 Public land use fees . . . . . . . . . . . . . . . . . . . . . . . . . . . . . . . . . . . . . . . . . . . . . . . . . . . . . . . . . . . . . . . . . 49,424 6 894 10 55 Private land use fees . . . . . . . . . . . . . . . . . . . . . . . . . . . . . . . . . . . . . . . . . . . . . . . . . . . . . . . . . . . . . . . . 131,347 15 289 3 454 Equipment rental . . . . . . . . . . . . . . . . . . . . . . . . . . . . . . . . . . . . . . . . . . . . . . . . . . . . . . . . . . . . . . . . . . . 61,736 7 493 6 125 Boating costs2 . . . . . . . . . . . . . . . . . . . . . . . . . . . . . . . . . . . . . . . . . . . . . . . . . . . . . . . . . . . . . . . . . . . . . 1,835,036 206 2,230 25 823 Bait . . . . . . . . . . . . . . . . . . . . . . . . . . . . . . . . . . . . . . . . . . . . . . . . . . . . . . . . . . . . . . . . . . . . . . . . . . . . . 546,716 62 4,725 53 116 Ice . . . . . . . . . . . . . . . . . . . . . . . . . . . . . . . . . . . . . . . . . . . . . . . . . . . . . . . . . . . . . . . . . . . . . . . . . . . . . . 186,435 21 3,534 40 53 Heating and cooking fuel . . . . . . . . . . . . . . . . . . . . . . . . . . . . . . . . . . . . . . . . . . . . . . . . . . . . . . . . . . . . 14,003 2 482 5 29
EQUIPMENT EXPENDITURES
Fishing equipment, total . . . . . . . . . . . . . . . . . . . . . . . . . . . . . . . . . . . . . . . . . . . . . . . . . . . . . . . . . . . . . . 1,424,590 160 3,936 44 362 Rods, reels, poles, and rodmaking components . . . . . . . . . . . . . . . . . . . . . . . . . . . . . . . . . . . . . . . . . . . 608,539 68 1,880 21 324 Lines and leaders . . . . . . . . . . . . . . . . . . . . . . . . . . . . . . . . . . . . . . . . . . . . . . . . . . . . . . . . . . . . . . . . . . . 154,622 17 2,622 30 59 Artificial lures, flies, baits, and dressing for flies or lines . . . . . . . . . . . . . . . . . . . . . . . . . . . . . . . . . . . 180,156 20 2,288 26 79 Hooks, sinkers, swivels, and other items attached to a line except lures and baits . . . . . . . . . . . . . . . . 163,544 18 3,139 35 52 Tackle boxes . . . . . . . . . . . . . . . . . . . . . . . . . . . . . . . . . . . . . . . . . . . . . . . . . . . . . . . . . . . . . . . . . . . . . . 29,830 3 731 8 41 Creels, stringers, fish bags, landing nets, and gaff hooks . . . . . . . . . . . . . . . . . . . . . . . . . . . . . . . . . . . . 27,856 3 645 7 43 Minnow traps, seines, and bait containers . . . . . . . . . . . . . . . . . . . . . . . . . . . . . . . . . . . . . . . . . . . . . . . 28,270 3 587 7 48 Depth finders, fish finders, and other electronic fishing devices . . . . . . . . . . . . . . . . . . . . . . . . . . . . . . 127,941 14 158 2 809 Other fishing equipment . . . . . . . . . . . . . . . . . . . . . . . . . . . . . . . . . . . . . . . . . . . . . . . . . . . . . . . . . . . . . 103,831 12 997 11 104
Auxiliary equipment, total . . . . . . . . . . . . . . . . . . . . . . . . . . . . . . . . . . . . . . . . . . . . . . . . . . . . . . . . . . . . 216,557 24 858 10 252 Camping equipment . . . . . . . . . . . . . . . . . . . . . . . . . . . . . . . . . . . . . . . . . . . . . . . . . . . . . . . . . . . . . . . . *41,261 *5 *164 *2 *252 Binoculars, field glasses, telescopes, etc. . . . . . . . . . . . . . . . . . . . . . . . . . . . . . . . . . . . . . . . . . . . . . . . . *17,818 *2 *132 *1 *135 Special fishing clothing, rubber boots, waders, and foul weather gear . . . . . . . . . . . . . . . . . . . . . . . . . 76,434 9 621 7 123 Processing and taxidermy costs . . . . . . . . . . . . . . . . . . . . . . . . . . . . . . . . . . . . . . . . . . . . . . . . . . . . . . . *14,690 *2 *48 *1 *309 Other . . . . . . . . . . . . . . . . . . . . . . . . . . . . . . . . . . . . . . . . . . . . . . . . . . . . . . . . . . . . . . . . . . . . . . . . . . . . 66,354 7 159 2 417
Special equipment3 . . . . . . . . . . . . . . . . . . . . . . . . . . . . . . . . . . . . . . . . . . . . . . . . . . . . . . . . . . . . . . . . . . 1,299,825 146 332 4 3,912* Estimate based on a sample size of 10–29. 1 Average expenditures are annual estimates.2 Boating costs include launching, mooring, storage, maintenance, insurance, pumpout fees, and fuel.3 Special equipment includes boats, campers, cabins, trail bikes, dune buggies, 4 x 4 vehicles, ATVs, 4-wheelers, snowmobiles, pickups, vans, travel and tent trailers, motor homes, house trailers, recreational vehicles (RVs) and other special equipment.
Note: Detail does not add to total because of multiple responses.

U.S. Fish and Wildlife Service and U.S. Census Bureau 2011 National Survey of Fishing, Hunting, and Wildlife-Associated Recreation 73
Table 17. Expenditures for Hunting: 2011(Population 16 years old and older)
Expenditure item
Expenditures SpendersAmount
(thousandsof dollars)
Average per hunter (dollars)1
Number (thousands)
Percent of hunters
Average per spender
(dollars)1
Total, all items . . . . . . . . . . . . . . . . . . . . . . . . . . . . . . . . . . . . . . . . . . . . . . . . . . . . . . . . . . . . . 33,702,017 2,465 13,364 98 2,522
TRIP-RELATED EXPENDITURES
Total trip-related . . . . . . . . . . . . . . . . . . . . . . . . . . . . . . . . . . . . . . . . . . . . . . . . . . . . . . . . . . . 10,421,189 762 11,914 87 875
Food and lodging, total . . . . . . . . . . . . . . . . . . . . . . . . . . . . . . . . . . . . . . . . . . . . . . . . . . . . . . 3,881,304 284 10,289 75 377 Food . . . . . . . . . . . . . . . . . . . . . . . . . . . . . . . . . . . . . . . . . . . . . . . . . . . . . . . . . . . . . . . . . . . 3,217,859 235 10,253 75 314 Lodging . . . . . . . . . . . . . . . . . . . . . . . . . . . . . . . . . . . . . . . . . . . . . . . . . . . . . . . . . . . . . . . . . 663,444 49 1,881 14 353
Transportation, total . . . . . . . . . . . . . . . . . . . . . . . . . . . . . . . . . . . . . . . . . . . . . . . . . . . . . . . . 4,767,915 349 10,990 80 434 Public . . . . . . . . . . . . . . . . . . . . . . . . . . . . . . . . . . . . . . . . . . . . . . . . . . . . . . . . . . . . . . . . . . 304,204 22 648 5 469 Private . . . . . . . . . . . . . . . . . . . . . . . . . . . . . . . . . . . . . . . . . . . . . . . . . . . . . . . . . . . . . . . . . . 4,463,711 326 10,885 80 410
Other trip costs, total . . . . . . . . . . . . . . . . . . . . . . . . . . . . . . . . . . . . . . . . . . . . . . . . . . . . . . . 1,771,970 130 4,581 34 387 Guide fees, pack trip or package fees . . . . . . . . . . . . . . . . . . . . . . . . . . . . . . . . . . . . . . . . . . 493,913 36 1,024 7 482 Public land use fees . . . . . . . . . . . . . . . . . . . . . . . . . . . . . . . . . . . . . . . . . . . . . . . . . . . . . . . . 40,447 3 709 5 57 Private land use fees . . . . . . . . . . . . . . . . . . . . . . . . . . . . . . . . . . . . . . . . . . . . . . . . . . . . . . . 755,087 55 1,193 9 633 Equipment rental . . . . . . . . . . . . . . . . . . . . . . . . . . . . . . . . . . . . . . . . . . . . . . . . . . . . . . . . . . 62,747 5 490 4 128 Boating costs2 . . . . . . . . . . . . . . . . . . . . . . . . . . . . . . . . . . . . . . . . . . . . . . . . . . . . . . . . . . . . 213,817 16 519 4 412 Heating and cooking fuel . . . . . . . . . . . . . . . . . . . . . . . . . . . . . . . . . . . . . . . . . . . . . . . . . . . 205,959 15 2,817 21 73
EQUIPMENT EXPENDITURES
Hunting equipment, total . . . . . . . . . . . . . . . . . . . . . . . . . . . . . . . . . . . . . . . . . . . . . . . . . . . . 7,738,324 566 10,400 76 744 Firearms . . . . . . . . . . . . . . . . . . . . . . . . . . . . . . . . . . . . . . . . . . . . . . . . . . . . . . . . . . . . . . . . 3,050,322 223 3,007 22 1,015 Rifles . . . . . . . . . . . . . . . . . . . . . . . . . . . . . . . . . . . . . . . . . . . . . . . . . . . . . . . . . . . . . . . . . 1,429,097 105 1,695 12 843 Shotguns . . . . . . . . . . . . . . . . . . . . . . . . . . . . . . . . . . . . . . . . . . . . . . . . . . . . . . . . . . . . . . 914,619 67 1,213 9 754 Muzzleloaders, primitive firearms . . . . . . . . . . . . . . . . . . . . . . . . . . . . . . . . . . . . . . . . . . 122,035 9 370 3 330 Pistols, handguns. . . . . . . . . . . . . . . . . . . . . . . . . . . . . . . . . . . . . . . . . . . . . . . . . . . . . . . . 584,570 43 901 7 649 Bows, arrows, archery equipment . . . . . . . . . . . . . . . . . . . . . . . . . . . . . . . . . . . . . . . . . . . . . 934,847 68 2,829 21 331 Telescopic sights . . . . . . . . . . . . . . . . . . . . . . . . . . . . . . . . . . . . . . . . . . . . . . . . . . . . . . . . . . 530,655 39 1,748 13 304 Decoys and game calls . . . . . . . . . . . . . . . . . . . . . . . . . . . . . . . . . . . . . . . . . . . . . . . . . . . . . 301,995 22 2,738 20 110 Ammunition . . . . . . . . . . . . . . . . . . . . . . . . . . . . . . . . . . . . . . . . . . . . . . . . . . . . . . . . . . . . . 1,298,456 95 8,828 65 147 Hand loading equipment . . . . . . . . . . . . . . . . . . . . . . . . . . . . . . . . . . . . . . . . . . . . . . . . . . . . 199,019 15 1,262 9 158 Hunting dogs and associated costs . . . . . . . . . . . . . . . . . . . . . . . . . . . . . . . . . . . . . . . . . . . . 951,110 70 1,007 7 945 Other . . . . . . . . . . . . . . . . . . . . . . . . . . . . . . . . . . . . . . . . . . . . . . . . . . . . . . . . . . . . . . . . . . . 471,920 35 3,125 23 151
Auxiliary equipment, total . . . . . . . . . . . . . . . . . . . . . . . . . . . . . . . . . . . . . . . . . . . . . . . . . . . 1,844,880 135 5,101 37 362 Camping equipment . . . . . . . . . . . . . . . . . . . . . . . . . . . . . . . . . . . . . . . . . . . . . . . . . . . . . . . 159,853 12 570 4 280 Binoculars, field glasses, telescopes, etc. . . . . . . . . . . . . . . . . . . . . . . . . . . . . . . . . . . . . . . . 287,186 21 1,210 9 237 Special hunting clothing, rubber boots, waders, and foul weather gear . . . . . . . . . . . . . . . . 570,308 42 3,082 23 185 Processing and taxidermy costs . . . . . . . . . . . . . . . . . . . . . . . . . . . . . . . . . . . . . . . . . . . . . . 672,759 49 2,055 15 327 Other . . . . . . . . . . . . . . . . . . . . . . . . . . . . . . . . . . . . . . . . . . . . . . . . . . . . . . . . . . . . . . . . . . . 154,774 11 619 5 250
Special equipment3 . . . . . . . . . . . . . . . . . . . . . . . . . . . . . . . . . . . . . . . . . . . . . . . . . . . . . . . . . 4,389,286 321 613 4 7,159
OTHER EXPENDITURES
Magazines, books, DVDs . . . . . . . . . . . . . . . . . . . . . . . . . . . . . . . . . . . . . . . . . . . . . . . . . . . . . 107,272 8 1,934 14 55Membership dues and contributions . . . . . . . . . . . . . . . . . . . . . . . . . . . . . . . . . . . . . . . . . . . . . 382,817 28 1,885 14 203Land leasing and ownership . . . . . . . . . . . . . . . . . . . . . . . . . . . . . . . . . . . . . . . . . . . . . . . . . . . 7,129,265 521 2,279 17 3,128Licenses, stamps, tags, and permits, total . . . . . . . . . . . . . . . . . . . . . . . . . . . . . . . . . . . . . . . . . 986,385 72 10,214 75 97 Licenses . . . . . . . . . . . . . . . . . . . . . . . . . . . . . . . . . . . . . . . . . . . . . . . . . . . . . . . . . . . . . . . . . 786,227 57 9,746 71 81 Federal duck stamps . . . . . . . . . . . . . . . . . . . . . . . . . . . . . . . . . . . . . . . . . . . . . . . . . . . . . . . 33,094 2 2,206 16 15 Stamps, tags, and permits . . . . . . . . . . . . . . . . . . . . . . . . . . . . . . . . . . . . . . . . . . . . . . . . . . . 167,064 12 3,554 26 47Plantings . . . . . . . . . . . . . . . . . . . . . . . . . . . . . . . . . . . . . . . . . . . . . . . . . . . . . . . . . . . . . . . . . . 702,601 51 1,273 9 5521 Average expenditures are annual estimates.2 Boating costs include launching, mooring, storage, maintenance, insurance, pumpout fees, and fuel.3 Special equipment includes boats, campers, cabins, trail bikes, dune buggies, 4 x 4 vehicles, ATVs, 4-wheelers, snowmobiles, pickups, vans, travel and tent trailers, motor homes, house trailers, recreational vehicles (RVs) and other special equipment.
Note: Detail does not add to total because of multiple responses. Detail in Tables 18 to 21 may not add to totals shown here because of multiple responses and nonresponse.
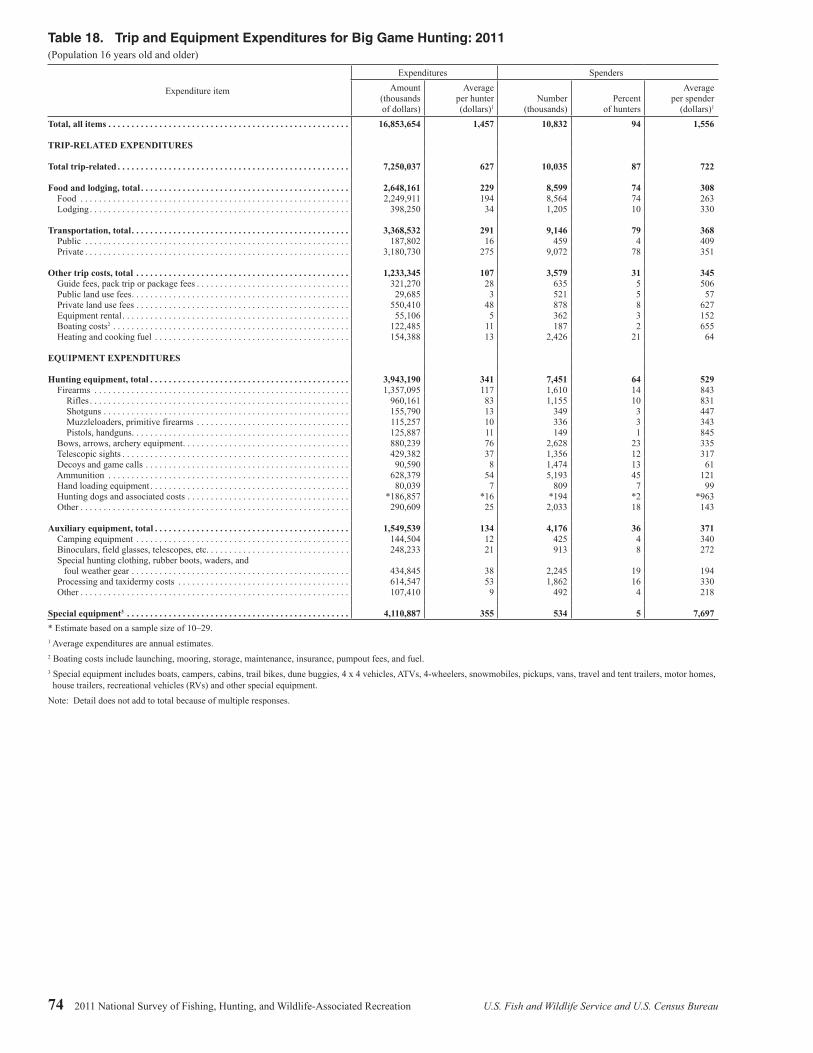
74 2011 National Survey of Fishing, Hunting, and Wildlife-Associated Recreation U.S. Fish and Wildlife Service and U.S. Census Bureau
Table 18. Trip and Equipment Expenditures for Big Game Hunting: 2011(Population 16 years old and older)
Expenditure item
Expenditures SpendersAmount
(thousands of dollars)
Average per hunter (dollars)1
Number (thousands)
Percent of hunters
Average per spender
(dollars)1
Total, all items . . . . . . . . . . . . . . . . . . . . . . . . . . . . . . . . . . . . . . . . . . . . . . . . . . . . 16,853,654 1,457 10,832 94 1,556
TRIP-RELATED EXPENDITURES
Total trip-related . . . . . . . . . . . . . . . . . . . . . . . . . . . . . . . . . . . . . . . . . . . . . . . . . . 7,250,037 627 10,035 87 722
Food and lodging, total . . . . . . . . . . . . . . . . . . . . . . . . . . . . . . . . . . . . . . . . . . . . . 2,648,161 229 8,599 74 308 Food . . . . . . . . . . . . . . . . . . . . . . . . . . . . . . . . . . . . . . . . . . . . . . . . . . . . . . . . . . 2,249,911 194 8,564 74 263 Lodging . . . . . . . . . . . . . . . . . . . . . . . . . . . . . . . . . . . . . . . . . . . . . . . . . . . . . . . . 398,250 34 1,205 10 330
Transportation, total . . . . . . . . . . . . . . . . . . . . . . . . . . . . . . . . . . . . . . . . . . . . . . . 3,368,532 291 9,146 79 368 Public . . . . . . . . . . . . . . . . . . . . . . . . . . . . . . . . . . . . . . . . . . . . . . . . . . . . . . . . . 187,802 16 459 4 409 Private . . . . . . . . . . . . . . . . . . . . . . . . . . . . . . . . . . . . . . . . . . . . . . . . . . . . . . . . . 3,180,730 275 9,072 78 351
Other trip costs, total . . . . . . . . . . . . . . . . . . . . . . . . . . . . . . . . . . . . . . . . . . . . . . 1,233,345 107 3,579 31 345 Guide fees, pack trip or package fees . . . . . . . . . . . . . . . . . . . . . . . . . . . . . . . . . 321,270 28 635 5 506 Public land use fees . . . . . . . . . . . . . . . . . . . . . . . . . . . . . . . . . . . . . . . . . . . . . . . 29,685 3 521 5 57 Private land use fees . . . . . . . . . . . . . . . . . . . . . . . . . . . . . . . . . . . . . . . . . . . . . . 550,410 48 878 8 627 Equipment rental . . . . . . . . . . . . . . . . . . . . . . . . . . . . . . . . . . . . . . . . . . . . . . . . . 55,106 5 362 3 152 Boating costs2 . . . . . . . . . . . . . . . . . . . . . . . . . . . . . . . . . . . . . . . . . . . . . . . . . . . 122,485 11 187 2 655 Heating and cooking fuel . . . . . . . . . . . . . . . . . . . . . . . . . . . . . . . . . . . . . . . . . . 154,388 13 2,426 21 64
EQUIPMENT EXPENDITURES
Hunting equipment, total . . . . . . . . . . . . . . . . . . . . . . . . . . . . . . . . . . . . . . . . . . . 3,943,190 341 7,451 64 529 Firearms . . . . . . . . . . . . . . . . . . . . . . . . . . . . . . . . . . . . . . . . . . . . . . . . . . . . . . . 1,357,095 117 1,610 14 843 Rifles . . . . . . . . . . . . . . . . . . . . . . . . . . . . . . . . . . . . . . . . . . . . . . . . . . . . . . . . 960,161 83 1,155 10 831 Shotguns . . . . . . . . . . . . . . . . . . . . . . . . . . . . . . . . . . . . . . . . . . . . . . . . . . . . . 155,790 13 349 3 447 Muzzleloaders, primitive firearms . . . . . . . . . . . . . . . . . . . . . . . . . . . . . . . . . 115,257 10 336 3 343 Pistols, handguns. . . . . . . . . . . . . . . . . . . . . . . . . . . . . . . . . . . . . . . . . . . . . . . 125,887 11 149 1 845 Bows, arrows, archery equipment . . . . . . . . . . . . . . . . . . . . . . . . . . . . . . . . . . . . 880,239 76 2,628 23 335 Telescopic sights . . . . . . . . . . . . . . . . . . . . . . . . . . . . . . . . . . . . . . . . . . . . . . . . . 429,382 37 1,356 12 317 Decoys and game calls . . . . . . . . . . . . . . . . . . . . . . . . . . . . . . . . . . . . . . . . . . . . 90,590 8 1,474 13 61 Ammunition . . . . . . . . . . . . . . . . . . . . . . . . . . . . . . . . . . . . . . . . . . . . . . . . . . . . 628,379 54 5,193 45 121 Hand loading equipment . . . . . . . . . . . . . . . . . . . . . . . . . . . . . . . . . . . . . . . . . . . 80,039 7 809 7 99 Hunting dogs and associated costs . . . . . . . . . . . . . . . . . . . . . . . . . . . . . . . . . . . *186,857 *16 *194 *2 *963 Other . . . . . . . . . . . . . . . . . . . . . . . . . . . . . . . . . . . . . . . . . . . . . . . . . . . . . . . . . . 290,609 25 2,033 18 143
Auxiliary equipment, total . . . . . . . . . . . . . . . . . . . . . . . . . . . . . . . . . . . . . . . . . . 1,549,539 134 4,176 36 371 Camping equipment . . . . . . . . . . . . . . . . . . . . . . . . . . . . . . . . . . . . . . . . . . . . . . 144,504 12 425 4 340 Binoculars, field glasses, telescopes, etc. . . . . . . . . . . . . . . . . . . . . . . . . . . . . . . 248,233 21 913 8 272 Special hunting clothing, rubber boots, waders, and
foul weather gear . . . . . . . . . . . . . . . . . . . . . . . . . . . . . . . . . . . . . . . . . . . . . . . 434,845 38 2,245 19 194 Processing and taxidermy costs . . . . . . . . . . . . . . . . . . . . . . . . . . . . . . . . . . . . . 614,547 53 1,862 16 330 Other . . . . . . . . . . . . . . . . . . . . . . . . . . . . . . . . . . . . . . . . . . . . . . . . . . . . . . . . . . 107,410 9 492 4 218
Special equipment3 . . . . . . . . . . . . . . . . . . . . . . . . . . . . . . . . . . . . . . . . . . . . . . . . 4,110,887 355 534 5 7,697* Estimate based on a sample size of 10–29. 1 Average expenditures are annual estimates.2 Boating costs include launching, mooring, storage, maintenance, insurance, pumpout fees, and fuel.3 Special equipment includes boats, campers, cabins, trail bikes, dune buggies, 4 x 4 vehicles, ATVs, 4-wheelers, snowmobiles, pickups, vans, travel and tent trailers, motor homes, house trailers, recreational vehicles (RVs) and other special equipment.
Note: Detail does not add to total because of multiple responses.

U.S. Fish and Wildlife Service and U.S. Census Bureau 2011 National Survey of Fishing, Hunting, and Wildlife-Associated Recreation 75
Table 19. Trip and Equipment Expenditures for Small Game Hunting: 2011(Population 16 years old and older)
Expenditure item
Expenditures SpendersAmount
(thousands of dollars)
Average per hunter (dollars)1
Number (thousands)
Percent of hunters
Average per spender
(dollars)1
Total, all items . . . . . . . . . . . . . . . . . . . . . . . . . . . . . . . . . . . . . . . . . . . . . . . . . . . . . . . 2,560,859 568 3,789 84 676
TRIP-RELATED EXPENDITURES
Total trip-related . . . . . . . . . . . . . . . . . . . . . . . . . . . . . . . . . . . . . . . . . . . . . . . . . . . . . 1,576,453 350 3,544 79 445
Food and lodging, total . . . . . . . . . . . . . . . . . . . . . . . . . . . . . . . . . . . . . . . . . . . . . . . . 657,647 146 2,950 65 223 Food . . . . . . . . . . . . . . . . . . . . . . . . . . . . . . . . . . . . . . . . . . . . . . . . . . . . . . . . . . . . . 484,121 107 2,915 65 166 Lodging . . . . . . . . . . . . . . . . . . . . . . . . . . . . . . . . . . . . . . . . . . . . . . . . . . . . . . . . . . . 173,526 39 571 13 304
Transportation, total . . . . . . . . . . . . . . . . . . . . . . . . . . . . . . . . . . . . . . . . . . . . . . . . . . 685,655 152 3,209 71 214 Public . . . . . . . . . . . . . . . . . . . . . . . . . . . . . . . . . . . . . . . . . . . . . . . . . . . . . . . . . . . . *96,961 *22 *296 *7 *327 Private . . . . . . . . . . . . . . . . . . . . . . . . . . . . . . . . . . . . . . . . . . . . . . . . . . . . . . . . . . . . 588,693 131 3,148 70 187
Other trip costs, total . . . . . . . . . . . . . . . . . . . . . . . . . . . . . . . . . . . . . . . . . . . . . . . . . 233,152 52 1,108 25 210 Guide fees, pack trip or package fees . . . . . . . . . . . . . . . . . . . . . . . . . . . . . . . . . . . . 97,596 22 403 9 242 Public land use fees . . . . . . . . . . . . . . . . . . . . . . . . . . . . . . . . . . . . . . . . . . . . . . . . . . 4,954 1 144 3 34 Private land use fees . . . . . . . . . . . . . . . . . . . . . . . . . . . . . . . . . . . . . . . . . . . . . . . . . 97,989 22 255 6 385 Equipment rental . . . . . . . . . . . . . . . . . . . . . . . . . . . . . . . . . . . . . . . . . . . . . . . . . . . . *2,114 *(Z) *84 *2 *25 Boating costs2 . . . . . . . . . . . . . . . . . . . . . . . . . . . . . . . . . . . . . . . . . . . . . . . . . . . . . . *10,573 *2 *53 *1 *199 Heating and cooking fuel . . . . . . . . . . . . . . . . . . . . . . . . . . . . . . . . . . . . . . . . . . . . . 19,926 4 558 12 36
EQUIPMENT EXPENDITURES
Hunting equipment, total . . . . . . . . . . . . . . . . . . . . . . . . . . . . . . . . . . . . . . . . . . . . . . 854,403 190 1,632 36 523 Firearms . . . . . . . . . . . . . . . . . . . . . . . . . . . . . . . . . . . . . . . . . . . . . . . . . . . . . . . . . . 363,391 81 495 11 735 Rifles . . . . . . . . . . . . . . . . . . . . . . . . . . . . . . . . . . . . . . . . . . . . . . . . . . . . . . . . . . . 59,291 13 117 3 506 Shotguns . . . . . . . . . . . . . . . . . . . . . . . . . . . . . . . . . . . . . . . . . . . . . . . . . . . . . . . . 247,430 55 328 7 753 Muzzleloaders, primitive firearms . . . . . . . . . . . . . . . . . . . . . . . . . . . . . . . . . . . . ... ... ... ... ... Pistols, handguns. . . . . . . . . . . . . . . . . . . . . . . . . . . . . . . . . . . . . . . . . . . . . . . . . . *55,453 *12 *89 *2 *625 Bows, arrows, archery equipment . . . . . . . . . . . . . . . . . . . . . . . . . . . . . . . . . . . . . . . ... ... ... ... ... Telescopic sights . . . . . . . . . . . . . . . . . . . . . . . . . . . . . . . . . . . . . . . . . . . . . . . . . . . . *17,965 *4 *102 *2 *177 Decoys and game calls . . . . . . . . . . . . . . . . . . . . . . . . . . . . . . . . . . . . . . . . . . . . . . . 14,130 3 184 4 77 Ammunition . . . . . . . . . . . . . . . . . . . . . . . . . . . . . . . . . . . . . . . . . . . . . . . . . . . . . . . 124,259 28 1,090 24 114 Hand loading equipment . . . . . . . . . . . . . . . . . . . . . . . . . . . . . . . . . . . . . . . . . . . . . . *7,918 *2 *82 *2 *97 Hunting dogs and associated costs . . . . . . . . . . . . . . . . . . . . . . . . . . . . . . . . . . . . . . 290,947 65 376 8 775 Other . . . . . . . . . . . . . . . . . . . . . . . . . . . . . . . . . . . . . . . . . . . . . . . . . . . . . . . . . . . . . 27,901 6 308 7 91
Auxiliary equipment, total . . . . . . . . . . . . . . . . . . . . . . . . . . . . . . . . . . . . . . . . . . . . . 84,992 19 411 9 207 Camping equipment . . . . . . . . . . . . . . . . . . . . . . . . . . . . . . . . . . . . . . . . . . . . . . . . . ... ... ... ... ... Binoculars, field glasses, telescopes, etc. . . . . . . . . . . . . . . . . . . . . . . . . . . . . . . . . . *6,479 *1 *82 *2 *79 Special hunting clothing, rubber boots, waders, and foul weather gear . . . . . . . . . . 31,707 7 259 6 122 Processing and taxidermy costs . . . . . . . . . . . . . . . . . . . . . . . . . . . . . . . . . . . . . . . . ... ... ... ... ... Other . . . . . . . . . . . . . . . . . . . . . . . . . . . . . . . . . . . . . . . . . . . . . . . . . . . . . . . . . . . . . ... ... ... ... ...
Special equipment3 . . . . . . . . . . . . . . . . . . . . . . . . . . . . . . . . . . . . . . . . . . . . . . . . . . . ... ... ... ... ...* Estimate based on a sample size of 10–29. … Sample size too small (less than 10) to report data reliably. (Z) Less than 0.5 percent. 1 Average expenditures are annual estimates.2 Boating costs include launching, mooring, storage, maintenance, insurance, pumpout fees, and fuel.3 Special equipment includes boats, campers, cabins, trail bikes, dune buggies, 4 x 4 vehicles, ATVs, 4-wheelers, snowmobiles, pickups, vans, travel and tent trailers, motor homes, house trailers, recreational vehicles (RVs) and other special equipment.
Note: Detail does not add to total because of multiple responses.

76 2011 National Survey of Fishing, Hunting, and Wildlife-Associated Recreation U.S. Fish and Wildlife Service and U.S. Census Bureau
Table 20. Trip and Equipment Expenditures for Migratory Bird Hunting: 2011(Population 16 years old and older)
Expenditure item
Expenditures SpendersAmount
(thousands of dollars)
Average per hunter (dollars)1
Number (thousands)
Percent of hunters
Average per spender
(dollars)1
Total, all items . . . . . . . . . . . . . . . . . . . . . . . . . . . . . . . . . . . . . . . . . . . . . . . . . . . . . . . 1,808,030 700 2,321 90 779
TRIP-RELATED EXPENDITURES
Total trip-related . . . . . . . . . . . . . . . . . . . . . . . . . . . . . . . . . . . . . . . . . . . . . . . . . . . . . 942,005 365 2,254 87 418
Food and lodging, total . . . . . . . . . . . . . . . . . . . . . . . . . . . . . . . . . . . . . . . . . . . . . . . . 316,443 122 1,819 70 174 Food . . . . . . . . . . . . . . . . . . . . . . . . . . . . . . . . . . . . . . . . . . . . . . . . . . . . . . . . . . . . . 266,521 103 1,819 70 147 Lodging . . . . . . . . . . . . . . . . . . . . . . . . . . . . . . . . . . . . . . . . . . . . . . . . . . . . . . . . . . . 49,922 19 170 7 293
Transportation, total . . . . . . . . . . . . . . . . . . . . . . . . . . . . . . . . . . . . . . . . . . . . . . . . . . 390,169 151 2,027 78 193 Public . . . . . . . . . . . . . . . . . . . . . . . . . . . . . . . . . . . . . . . . . . . . . . . . . . . . . . . . . . . . ... ... ... ... ... Private . . . . . . . . . . . . . . . . . . . . . . . . . . . . . . . . . . . . . . . . . . . . . . . . . . . . . . . . . . . . 381,398 148 2,020 78 189
Other trip costs, total . . . . . . . . . . . . . . . . . . . . . . . . . . . . . . . . . . . . . . . . . . . . . . . . . 235,393 91 757 29 311 Guide fees, pack trip or package fees . . . . . . . . . . . . . . . . . . . . . . . . . . . . . . . . . . . . *38,139 *15 *139 *5 *274 Public land use fees . . . . . . . . . . . . . . . . . . . . . . . . . . . . . . . . . . . . . . . . . . . . . . . . . . *5,173 *2 *121 *5 *43 Private land use fees . . . . . . . . . . . . . . . . . . . . . . . . . . . . . . . . . . . . . . . . . . . . . . . . . 86,532 33 212 8 408 Equipment rental . . . . . . . . . . . . . . . . . . . . . . . . . . . . . . . . . . . . . . . . . . . . . . . . . . . . *3,818 *1 *73 *3 *53 Boating costs2 . . . . . . . . . . . . . . . . . . . . . . . . . . . . . . . . . . . . . . . . . . . . . . . . . . . . . . 77,227 30 320 12 241 Heating and cooking fuel . . . . . . . . . . . . . . . . . . . . . . . . . . . . . . . . . . . . . . . . . . . . . 24,503 9 210 8 117
EQUIPMENT EXPENDITURES
Hunting equipment, total . . . . . . . . . . . . . . . . . . . . . . . . . . . . . . . . . . . . . . . . . . . . . . 766,927 297 1,198 46 640 Firearms . . . . . . . . . . . . . . . . . . . . . . . . . . . . . . . . . . . . . . . . . . . . . . . . . . . . . . . . . . 190,253 74 209 8 910 Rifles . . . . . . . . . . . . . . . . . . . . . . . . . . . . . . . . . . . . . . . . . . . . . . . . . . . . . . . . . . . ... ... ... ... ... Shotguns . . . . . . . . . . . . . . . . . . . . . . . . . . . . . . . . . . . . . . . . . . . . . . . . . . . . . . . . 190,253 74 209 8 910 Muzzleloaders, primitive firearms . . . . . . . . . . . . . . . . . . . . . . . . . . . . . . . . . . . . ... ... ... ... ... Pistols, handguns. . . . . . . . . . . . . . . . . . . . . . . . . . . . . . . . . . . . . . . . . . . . . . . . . . ... ... ... ... ... Bows, arrows, archery equipment . . . . . . . . . . . . . . . . . . . . . . . . . . . . . . . . . . . . . . . ... ... ... ... ... Telescopic sights . . . . . . . . . . . . . . . . . . . . . . . . . . . . . . . . . . . . . . . . . . . . . . . . . . . . ... ... ... ... ... Decoys and game calls . . . . . . . . . . . . . . . . . . . . . . . . . . . . . . . . . . . . . . . . . . . . . . . 129,258 50 460 18 281 Ammunition . . . . . . . . . . . . . . . . . . . . . . . . . . . . . . . . . . . . . . . . . . . . . . . . . . . . . . . 144,494 56 927 36 156 Hand loading equipment . . . . . . . . . . . . . . . . . . . . . . . . . . . . . . . . . . . . . . . . . . . . . . ... ... ... ... ... Hunting dogs and associated costs . . . . . . . . . . . . . . . . . . . . . . . . . . . . . . . . . . . . . . 253,925 98 231 9 1,098 Other . . . . . . . . . . . . . . . . . . . . . . . . . . . . . . . . . . . . . . . . . . . . . . . . . . . . . . . . . . . . . *38,806 *15 *155 *6 *250
Auxiliary equipment, total . . . . . . . . . . . . . . . . . . . . . . . . . . . . . . . . . . . . . . . . . . . . . 59,300 23 303 12 196 Camping equipment . . . . . . . . . . . . . . . . . . . . . . . . . . . . . . . . . . . . . . . . . . . . . . . . . ... ... ... ... ... Binoculars, field glasses, telescopes, etc . . . . . . . . . . . . . . . . . . . . . . . . . . . . . . . . . ... ... ... ... ... Special hunting clothing, rubber boots, waders, and foul weather gear . . . . . . . . . . 34,231 13 197 8 174 Processing and taxidermy costs . . . . . . . . . . . . . . . . . . . . . . . . . . . . . . . . . . . . . . . . ... ... ... ... ... Other . . . . . . . . . . . . . . . . . . . . . . . . . . . . . . . . . . . . . . . . . . . . . . . . . . . . . . . . . . . . . ... ... ... ... ...
Special equipment3 . . . . . . . . . . . . . . . . . . . . . . . . . . . . . . . . . . . . . . . . . . . . . . . . . . . ... ... ... ... ...* Estimate based on a sample size of 10–29. … Sample size too small (less than 10) to report data reliably. 1 Average expenditures are annual estimates.2 Boating costs include launching, mooring, storage, maintenance, insurance, pumpout fees, and fuel.3 Special equipment includes boats, campers, cabins, trail bikes, dune buggies, 4 x 4 vehicles, ATVs, 4-wheelers, snowmobiles, pickups, vans, travel and tent trailers, motor homes, house trailers, recreational vehicles (RVs) and other special equipment.
Note: Detail does not add to total because of multiple responses.

U.S. Fish and Wildlife Service and U.S. Census Bureau 2011 National Survey of Fishing, Hunting, and Wildlife-Associated Recreation 77
Table 21. Trip and Equipment Expenditures for Hunting Other Animals: 2011(Population 16 years old and older)
Expenditure item
Expenditures SpendersAmount
(thousands of dollars)
Average per hunter (dollars)1
Number (thousands)
Percent of hunters
Average per spender
(dollars)1
Total, all items . . . . . . . . . . . . . . . . . . . . . . . . . . . . . . . . . . . . . . . . . . . . . . . . . . . . . . . . . 857,607 396 1,589 73 540
TRIP-RELATED EXPENDITURES
Total trip-related . . . . . . . . . . . . . . . . . . . . . . . . . . . . . . . . . . . . . . . . . . . . . . . . . . . . . . . 652,693 301 1,536 71 425
Food and lodging, total . . . . . . . . . . . . . . . . . . . . . . . . . . . . . . . . . . . . . . . . . . . . . . . . . . 259,053 119 1,275 59 203 Food . . . . . . . . . . . . . . . . . . . . . . . . . . . . . . . . . . . . . . . . . . . . . . . . . . . . . . . . . . . . . . . 217,306 100 1,274 59 171 Lodging . . . . . . . . . . . . . . . . . . . . . . . . . . . . . . . . . . . . . . . . . . . . . . . . . . . . . . . . . . . . . *41,747 *19 *167 *8 *251
Transportation, total . . . . . . . . . . . . . . . . . . . . . . . . . . . . . . . . . . . . . . . . . . . . . . . . . . . . 323,560 149 1,388 64 233 Public . . . . . . . . . . . . . . . . . . . . . . . . . . . . . . . . . . . . . . . . . . . . . . . . . . . . . . . . . . . . . . *10,670 *5 *39 *2 *273 Private . . . . . . . . . . . . . . . . . . . . . . . . . . . . . . . . . . . . . . . . . . . . . . . . . . . . . . . . . . . . . . 312,889 144 1,380 64 227
Other trip costs, total . . . . . . . . . . . . . . . . . . . . . . . . . . . . . . . . . . . . . . . . . . . . . . . . . . . 70,080 32 412 19 170 Guide fees, pack trip or package fees . . . . . . . . . . . . . . . . . . . . . . . . . . . . . . . . . . . . . . *36,908 *17 *68 *3 *543 Public land use fees . . . . . . . . . . . . . . . . . . . . . . . . . . . . . . . . . . . . . . . . . . . . . . . . . . . . ... ... ... ... ... Private land use fees . . . . . . . . . . . . . . . . . . . . . . . . . . . . . . . . . . . . . . . . . . . . . . . . . . . ... ... ... ... ... Equipment rental . . . . . . . . . . . . . . . . . . . . . . . . . . . . . . . . . . . . . . . . . . . . . . . . . . . . . . ... ... ... ... ... Boating costs2 . . . . . . . . . . . . . . . . . . . . . . . . . . . . . . . . . . . . . . . . . . . . . . . . . . . . . . . . ... ... ... ... ... Heating and cooking fuel . . . . . . . . . . . . . . . . . . . . . . . . . . . . . . . . . . . . . . . . . . . . . . . 7,143 3 325 15 22
EQUIPMENT EXPENDITURES
Hunting equipment, total . . . . . . . . . . . . . . . . . . . . . . . . . . . . . . . . . . . . . . . . . . . . . . . . 189,043 87 348 16 543 Firearms . . . . . . . . . . . . . . . . . . . . . . . . . . . . . . . . . . . . . . . . . . . . . . . . . . . . . . . . . . . . *116,770 *54 *141 *7 *826 Rifles . . . . . . . . . . . . . . . . . . . . . . . . . . . . . . . . . . . . . . . . . . . . . . . . . . . . . . . . . . . . . ... ... ... ... ... Shotguns . . . . . . . . . . . . . . . . . . . . . . . . . . . . . . . . . . . . . . . . . . . . . . . . . . . . . . . . . . ... ... ... ... ... Muzzleloaders, primitive firearms . . . . . . . . . . . . . . . . . . . . . . . . . . . . . . . . . . . . . . ... ... ... ... ... Pistols, handguns. . . . . . . . . . . . . . . . . . . . . . . . . . . . . . . . . . . . . . . . . . . . . . . . . . . . *27,687 *13 *38 *2 *724 Bows, arrows, archery equipment . . . . . . . . . . . . . . . . . . . . . . . . . . . . . . . . . . . . . . . . . ... ... ... ... ... Telescopic sights . . . . . . . . . . . . . . . . . . . . . . . . . . . . . . . . . . . . . . . . . . . . . . . . . . . . . . ... ... ... ... ... Decoys and game calls . . . . . . . . . . . . . . . . . . . . . . . . . . . . . . . . . . . . . . . . . . . . . . . . . *9,554 *4 *130 *6 *74 Ammunition . . . . . . . . . . . . . . . . . . . . . . . . . . . . . . . . . . . . . . . . . . . . . . . . . . . . . . . . . *31,230 *14 *230 *11 *136 Hand loading equipment . . . . . . . . . . . . . . . . . . . . . . . . . . . . . . . . . . . . . . . . . . . . . . . . ... ... ... ... ... Hunting dogs and associated costs . . . . . . . . . . . . . . . . . . . . . . . . . . . . . . . . . . . . . . . . ... ... ... ... ... Other . . . . . . . . . . . . . . . . . . . . . . . . . . . . . . . . . . . . . . . . . . . . . . . . . . . . . . . . . . . . . . . ... ... ... ... ...
Auxiliary equipment, total . . . . . . . . . . . . . . . . . . . . . . . . . . . . . . . . . . . . . . . . . . . . . . . *5,889 *3 *55 *3 *107 Camping equipment . . . . . . . . . . . . . . . . . . . . . . . . . . . . . . . . . . . . . . . . . . . . . . . . . . . ... ... ... ... ... Binoculars, field glasses, telescopes, etc. . . . . . . . . . . . . . . . . . . . . . . . . . . . . . . . . . . . ... ... ... ... ... Special hunting clothing, rubber boots, waders, and foul weather gear . . . . . . . . . . . . ... ... ... ... ... Processing and taxidermy costs . . . . . . . . . . . . . . . . . . . . . . . . . . . . . . . . . . . . . . . . . . ... ... ... ... ... Other . . . . . . . . . . . . . . . . . . . . . . . . . . . . . . . . . . . . . . . . . . . . . . . . . . . . . . . . . . . . . . . ... ... ... ... ...
Special equipment3 . . . . . . . . . . . . . . . . . . . . . . . . . . . . . . . . . . . . . . . . . . . . . . . . . . . . . ... ... ... ... ...* Estimate based on a sample size of 10–29. … Sample size too small (less than 10) to report data reliably.1 Average expenditures are annual estimates.2 Boating costs include launching, mooring, storage, maintenance, insurance, pumpout fees, and fuel.3 Special equipment includes boats, campers, cabins, trail bikes, dune buggies, 4 x 4 vehicles, ATVs, 4-wheelers, snowmobiles, pickups, vans, travel and tent trailers, motor homes, house trailers, recreational vehicles (RVs) and other special equipment.
Note: Detail does not add to total because of multiple responses.

78 2011 National Survey of Fishing, Hunting, and Wildlife-Associated Recreation U.S. Fish and Wildlife Service and U.S. Census Bureau
Table 22. Special Equipment Expenditures for Fishing and Hunting: 2011(Population 16 years old and older)
Special equipment item
Expenditures SpendersAmount
(thousands of dollars)
Average per sportsperson
(dollars)1Number
(thousands)Percent of
sportsperson
Average per spender
(dollars)1
Total, all items . . . . . . . . . . . . . . . . . . . . . . . . . . . . . . . . . . . . . . . . . . . . . . . . . . . . . . . . . . . . . . . . . 25,129,326 672 3,990 11 6,298 Motor boat (other than bass boat) . . . . . . . . . . . . . . . . . . . . . . . . . . . . . . . . . . . . . . . . . . . . . . . . . 2,767,043 74 425 1 6,509 Bass boat . . . . . . . . . . . . . . . . . . . . . . . . . . . . . . . . . . . . . . . . . . . . . . . . . . . . . . . . . . . . . . . . . . . . 1,176,261 31 354 1 3,319 Canoe, other nonmotor boat . . . . . . . . . . . . . . . . . . . . . . . . . . . . . . . . . . . . . . . . . . . . . . . . . . . . . 223,387 6 471 1 474 Boat motor, trailer or hitch, or other boat accessories . . . . . . . . . . . . . . . . . . . . . . . . . . . . . . . . . 1,311,836 35 1,292 3 1,016 Travel or tent trailer, pickup, camper, van, motor home, recreational vehicle (RV),
house trailer . . . . . . . . . . . . . . . . . . . . . . . . . . . . . . . . . . . . . . . . . . . . . . . . . . . . . . . . . . . . . . . . 14,994,726 401 1,174 3 12,775 Cabin . . . . . . . . . . . . . . . . . . . . . . . . . . . . . . . . . . . . . . . . . . . . . . . . . . . . . . . . . . . . . . . . . . . . . . . *654,369 *17 *78 *(Z) *8,337 Trail bike, dune buggy, 4x4 vehicle, 4-wheeler, snowmobile . . . . . . . . . . . . . . . . . . . . . . . . . . . . 3,606,009 96 573 2 6,289 Other . . . . . . . . . . . . . . . . . . . . . . . . . . . . . . . . . . . . . . . . . . . . . . . . . . . . . . . . . . . . . . . . . . . . . . . 395,695 11 392 1 1,009* Estimate based on a sample size of 10–29. (Z) Less than 0.5 percent.1 Average expenditures are annual estimates.
Note: Detail does not add to total because of multiple responses.
Table 23. Anglers and Hunters Who Purchased Licenses or Were Exempt: 2011(Population 16 years old and older. Numbers in thousands)
SportspersonsAnglers Hunters
Number Percent Number PercentTotal sportspersons . . . . . . . . . . . . . . . . . . . . . . . . . . . . . . . . . 33,112 100 13,674 100
Total license purchasers1. . . . . . . . . . . . . . . . . . . . . . . . . . . . . 21,473 65 10,626 78 Sportspersons purchasing license In state of residence . . . . . . . . . . . . . . . . . . . . . . . . . . . . . 19,367 58 10,004 73 In other states . . . . . . . . . . . . . . . . . . . . . . . . . . . . . . . . . . 3,798 11 1,398 10
Total exempt from purchasing licenses . . . . . . . . . . . . . . . . . 5,890 18 2,741 20 Sportspersons exempt from license purchase In state of residence . . . . . . . . . . . . . . . . . . . . . . . . . . . . . 5,298 16 2,701 20 In other states . . . . . . . . . . . . . . . . . . . . . . . . . . . . . . . . . . 743 2 234 2
Other2 . . . . . . . . . . . . . . . . . . . . . . . . . . . . . . . . . . . . . . . . . . . . 6,832 21 1,099 8
Not reported. . . . . . . . . . . . . . . . . . . . . . . . . . . . . . . . . . . . . . . 839 3 282 21 Includes persons who had licenses bought for them. Does not include persons who purchased licenses and did not fish or hunt in 2011.2 Includes persons engages in activities requiring no licenses or exemptions and those who failed to buy a license for activities requiring a license.
Note: Detail does not add to total because of multiple responses and nonresponse. Respondents could have been licensed in one state and exempt in another.

U.S. Fish and Wildlife Service and U.S. Census Bureau 2011 National Survey of Fishing, Hunting, and Wildlife-Associated Recreation 79
Table 24. Selected Characteristics of Anglers and Hunters Who Purchased Licenses: 2011(Population 16 years old and older. Numbers in thousands)
Characteristic
Anglers Hunters
Total Purchased a license1
Did not purchase a license2 Total Purchased
a license1Did not purchase
a license2
Number Percent Number Percent Number Percent Number Percent Number Percent Number PercentTotal persons . . . . . . . . . . . . . . . . . . . . . . . . . . . 33,112 100 21,473 65 11,639 35 13,674 100 10,626 78 3,049 22
Population Density of Residence Urban . . . . . . . . . . . . . . . . . . . . . . . . . . . . . . . . 20,216 100 13,243 66 6,973 34 5,797 100 4,585 79 1,212 21 Rural . . . . . . . . . . . . . . . . . . . . . . . . . . . . . . . . 12,896 100 8,230 64 4,666 36 7,877 100 6,041 77 1,837 23
Population Size of Residence Metropolitan Statistical Area (MSA) . . . . . . . 29,442 100 19,144 65 10,298 35 10,915 100 8,515 78 2,400 22 1,000,000 or more . . . . . . . . . . . . . . . . . . . . 12,669 100 7,792 62 4,877 38 3,367 100 2,577 77 791 23 250,000 to 999,999 . . . . . . . . . . . . . . . . . . . 7,071 100 4,720 67 2,351 33 2,374 100 1,957 82 418 18 50,000 to 249,999 . . . . . . . . . . . . . . . . . . . . 9,702 100 6,632 68 3,070 32 5,174 100 3,982 77 1,192 23 Outside MSA . . . . . . . . . . . . . . . . . . . . . . . . . . 3,670 100 2,329 63 1,341 37 2,759 100 2,111 76 648 24
Census Geographic Division New England . . . . . . . . . . . . . . . . . . . . . . . . . . 1,355 100 896 66 459 34 420 100 316 75 104 25 Middle Atlantic . . . . . . . . . . . . . . . . . . . . . . . . 3,496 100 1,799 51 1,697 49 1,558 100 1,208 78 349 22 East North Central . . . . . . . . . . . . . . . . . . . . . . 5,861 100 4,339 74 1,521 26 2,688 100 2,249 84 439 16 West North Central . . . . . . . . . . . . . . . . . . . . . 3,591 100 2,793 78 798 22 1,661 100 1,395 84 265 16 South Atlantic . . . . . . . . . . . . . . . . . . . . . . . . . 6,163 100 3,191 52 2,972 48 1,870 100 1,340 72 530 28 East South Central . . . . . . . . . . . . . . . . . . . . . . 2,444 100 1,533 63 911 37 1,531 100 1,001 65 530 35 West South Central . . . . . . . . . . . . . . . . . . . . . 4,298 100 2,138 50 2,160 50 1,909 100 1,451 76 458 24 Mountain . . . . . . . . . . . . . . . . . . . . . . . . . . . . . 2,586 100 2,166 84 420 16 1,043 100 929 89 114 11 Pacific . . . . . . . . . . . . . . . . . . . . . . . . . . . . . . . 3,319 100 2,617 79 702 21 996 100 736 74 260 26
Age 16 to 17 years . . . . . . . . . . . . . . . . . . . . . . . . . 942 100 499 53 444 47 419 100 356 85 *63 *15 18 to 24 years . . . . . . . . . . . . . . . . . . . . . . . . . 2,668 100 1,874 70 794 30 1,288 100 967 75 322 25 25 to 34 years . . . . . . . . . . . . . . . . . . . . . . . . . 6,133 100 3,819 62 2,314 38 2,079 100 1,537 74 542 26 35 to 44 years . . . . . . . . . . . . . . . . . . . . . . . . . 5,962 100 4,221 71 1,740 29 2,416 100 2,021 84 395 16 45 to 54 years . . . . . . . . . . . . . . . . . . . . . . . . . 7,428 100 5,148 69 2,280 31 3,143 100 2,670 85 473 15 55 to 64 years . . . . . . . . . . . . . . . . . . . . . . . . . 5,886 100 4,074 69 1,812 31 2,842 100 2,220 78 622 22 65 years and older . . . . . . . . . . . . . . . . . . . . . . 4,093 100 1,838 45 2,256 55 1,487 100 856 58 632 42 65 to 74 years . . . . . . . . . . . . . . . . . . . . . . . 3,051 100 1,513 50 1,538 50 1,221 100 707 58 514 42 75 and older . . . . . . . . . . . . . . . . . . . . . . . . . 1,042 100 325 31 717 69 266 100 149 56 118 44
Sex Male . . . . . . . . . . . . . . . . . . . . . . . . . . . . . . . . 24,226 100 16,599 69 7,627 31 12,217 100 9,587 78 2,630 22 Female . . . . . . . . . . . . . . . . . . . . . . . . . . . . . . . 8,885 100 4,873 55 4,012 45 1,457 100 1,039 71 419 29
Ethnicity Hispanic . . . . . . . . . . . . . . . . . . . . . . . . . . . . . 1,675 100 1,052 63 623 37 271 100 154 57 *117 *43 Non-Hispanic . . . . . . . . . . . . . . . . . . . . . . . . . 31,436 100 20,421 65 11,016 35 13,403 100 10,472 78 2,932 22
Race White . . . . . . . . . . . . . . . . . . . . . . . . . . . . . . . . 28,560 100 19,060 67 9,500 33 12,852 100 10,143 79 2,710 21 African American . . . . . . . . . . . . . . . . . . . . . . 2,286 100 1,255 55 1,031 45 413 100 *246 *60 *167 *40 Asian American . . . . . . . . . . . . . . . . . . . . . . . . 733 100 318 43 414 57 *27 *100 *15 *54 ... ... All others . . . . . . . . . . . . . . . . . . . . . . . . . . . . . 1,533 100 839 55 693 45 382 100 223 58 159 42
Annual Household Income Less than $20,000 . . . . . . . . . . . . . . . . . . . . . . 3,266 100 1,808 55 1,458 45 991 100 716 72 275 28 $20,000 to $24,999 . . . . . . . . . . . . . . . . . . . . . 1,573 100 893 57 681 43 533 100 334 63 *199 *37 $25,000 to $29,999 . . . . . . . . . . . . . . . . . . . . . 1,364 100 674 49 690 51 495 100 355 72 *140 *28 $30,000 to $34,999 . . . . . . . . . . . . . . . . . . . . . 1,444 100 1,021 71 423 29 556 100 428 77 128 23 $35,000 to $39,999 . . . . . . . . . . . . . . . . . . . . . 1,521 100 885 58 636 42 606 100 481 79 125 21 $40,000 to $49,999 . . . . . . . . . . . . . . . . . . . . . 2,721 100 1,792 66 929 34 1,129 100 831 74 298 26 $50,000 to $74,999 . . . . . . . . . . . . . . . . . . . . . 5,851 100 3,832 66 2,019 34 2,610 100 2,131 82 480 18 $75,000 to $99,999 . . . . . . . . . . . . . . . . . . . . . 4,848 100 3,450 71 1,398 29 2,371 100 1,895 80 477 20 $100,000 to $149,999 . . . . . . . . . . . . . . . . . . . 4,131 100 3,050 74 1,081 26 1,932 100 1,579 82 352 18 $150,000 or more . . . . . . . . . . . . . . . . . . . . . . 2,722 100 1,845 68 877 32 861 100 731 85 130 15 Not reported . . . . . . . . . . . . . . . . . . . . . . . . . . 3,671 100 2,222 61 1,449 39 1,591 100 1,146 72 445 28
Education 11 years or less . . . . . . . . . . . . . . . . . . . . . . . . 3,705 100 2,023 55 1,682 45 1,482 100 1,104 74 379 26 12 years . . . . . . . . . . . . . . . . . . . . . . . . . . . . . . 10,503 100 6,621 63 3,882 37 4,975 100 3,839 77 1,136 23 1 to 3 years of college . . . . . . . . . . . . . . . . . . . 8,495 100 5,718 67 2,777 33 3,510 100 2,624 75 886 25 4 years of college . . . . . . . . . . . . . . . . . . . . . . 6,342 100 4,620 73 1,722 27 2,447 100 2,025 83 422 17 5 years or more of college . . . . . . . . . . . . . . . . 4,068 100 2,492 61 1,576 39 1,260 100 1,034 82 226 18
Days of Participation 1 to 5 days . . . . . . . . . . . . . . . . . . . . . . . . . . . . 14,732 100 8,387 57 6,346 43 3,730 100 2,575 69 1,155 31 6 to 10 days . . . . . . . . . . . . . . . . . . . . . . . . . . . 6,168 100 4,012 65 2,156 35 2,721 100 2,128 78 593 22 11 to 25 days . . . . . . . . . . . . . . . . . . . . . . . . . . 5,971 100 4,361 73 1,610 27 3,457 100 2,760 80 697 20 26 days or more . . . . . . . . . . . . . . . . . . . . . . . . 6,049 100 4,643 77 1,406 23 3,678 100 3,158 86 520 14* Estimate based on a sample size of 10–29. … Sample size too small (less than 10) to report data reliably.1 Includes persons who purchased a license in 2011 in any state. Respondents could have been licensed in one state and exempt in another.2 Includes those persons who did not purchase a license in any state in 2011 and those who did not specify a license purchase in 2011.

80 2011 National Survey of Fishing, Hunting, and Wildlife-Associated Recreation U.S. Fish and Wildlife Service and U.S. Census Bureau
Table 25. Freshwater Anglers and Days of Fishing by Type of Water: 2011(Population 16 years old and older. Numbers in thousands. Excludes Great Lakes fishing)
Type of waterAnglers Days of fishing
Number Percent Number PercentTotal, all types of water . . . . . . . . . . . . . . . . . . . . . . . . . . . . . . . . . . . . . . 27,060 100 443,223 100 Lakes, reservoirs, and ponds . . . . . . . . . . . . . . . . . . . . . . . . . . . . . . . . . 22,791 84 335,732 76 Rivers or streams . . . . . . . . . . . . . . . . . . . . . . . . . . . . . . . . . . . . . . . . . . 11,888 44 148,218 33Note: Detail does not add to total because of multiple responses and nonresponse.
Table 26. Great Lakes Anglers and Days of Fishing by Great Lake: 2011(Population 16 years old and older. Numbers in thousands)
Great LakeAnglers Days of fishing
Number Percent Number PercentTotal, all Great Lakes . . . . . . . . . . . . . . . . . . . . . . . . . . . . . . . . . . . . . 1,665 100 19,661 100 Lake Ontario, including the Niagara River . . . . . . . . . . . . . . . . . . . . *143 *9 *2,214 *11 Lake Erie, including the Detroit River . . . . . . . . . . . . . . . . . . . . . . . 639 38 8,451 43 Lake Huron, including St. Mary’s River System . . . . . . . . . . . . . . . *262 *16 *4,410 *22 Lake Michigan . . . . . . . . . . . . . . . . . . . . . . . . . . . . . . . . . . . . . . . . . 413 25 2,585 13 Lake Superior . . . . . . . . . . . . . . . . . . . . . . . . . . . . . . . . . . . . . . . . . . *147 *9 *1,527 *8 Lake St. Clair, including the St. Clair River . . . . . . . . . . . . . . . . . . . ... ... ... ... St Lawrence River . . . . . . . . . . . . . . . . . . . . . . . . . . . . . . . . . . . . . . . ... ... ... ... Tributaries to the Great Lakes . . . . . . . . . . . . . . . . . . . . . . . . . . . . . . *159 *10 *1,254 *6* Estimate based on a sample size of 10–29. … Sample size too small (less than 10) to report data reliably.
Note: Detail does not add to total because of multiple responses and nonresponse.
Table 27. Hunters and Days of Hunting on Public and Private Land by Type of Hunting: 2011(Population 16 years old and older. Numbers in thousands)
Hunters and days of huntingTotal, all hunting Big game Small game Migratory birds Other animalsNumber Percent Number Percent Number Percent Number Percent Number Percent
HUNTERS
Total, all land . . . . . . . . . . . . . . . . . . 13,674 100 11,570 100 4,506 100 2,583 100 2,168 100 Public land, total . . . . . . . . . . . . . 4,918 36 3,767 33 1,410 31 923 36 523 24 Public land only . . . . . . . . . . . . 1,733 13 1,578 14 606 13 526 20 250 12 Public and private land . . . . . . . 3,185 23 2,189 19 805 18 397 15 273 13
Private land, total . . . . . . . . . . . . 11,537 84 9,696 84 3,756 83 1,999 77 1,886 87 Private land only . . . . . . . . . . . . 8,352 61 7,507 65 2,951 65 1,602 62 1,614 74 Private and public land . . . . . . . 3,185 23 2,189 19 805 18 397 15 273 13
DAYS OF HUNTING
Total, all land . . . . . . . . . . . . . . . . . . 281,884 100 212,116 100 50,884 100 23,263 100 34,434 100 Public land1 . . . . . . . . . . . . . . . . . . 61,486 22 39,149 18 13,915 27 8,467 36 5,452 16 Private land2 . . . . . . . . . . . . . . . . . 218,839 78 167,271 79 36,951 73 13,292 57 27,161 791 Days of hunting on public land include both days spent solely on public land and those spent on public and private land.2 Days of hunting on private land include both days spent solely on private land and those spent on private and public land.
Note: Detail does not add to total because of multiple responses and nonresponse.

U.S. Fish and Wildlife Service and U.S. Census Bureau 2011 National Survey of Fishing, Hunting, and Wildlife-Associated Recreation 81
Table 28. Hunters and Days of Hunting on Public Land by Selected Characteristic: 2011(Population 16 years old and older. Numbers in thousands)
Characteristic
Hunters Days of hunting
Total hunters,
public and private land
Hunters on public land1
Total days, public and
private land
Days on public land2
NumberPercent of
total hunters
Percent of hunters using
public land NumberPercent of total days
Percent of days on
public landTotal persons . . . . . . . . . . . . . . . . . . . . . . . . . . . 13,674 4,918 36 100 281,884 61,486 22 100
Population Density of Residence Urban . . . . . . . . . . . . . . . . . . . . . . . . . . . . . . . . 5,797 2,390 41 49 97,899 29,594 30 48 Rural . . . . . . . . . . . . . . . . . . . . . . . . . . . . . . . . 7,877 2,529 32 51 183,986 31,892 17 52
Population Size of Residence Metropolitan Statistical Area (MSA) . . . . . . . 10,915 3,977 36 81 216,150 50,269 23 82 1,000,000 or more . . . . . . . . . . . . . . . . . . . . 3,367 1,207 36 25 58,011 13,352 23 22 250,000 to 999,999 . . . . . . . . . . . . . . . . . . . 2,374 938 39 19 46,830 13,578 29 22 50,000 to 249,999 . . . . . . . . . . . . . . . . . . . . 5,174 1,832 35 37 111,309 23,339 21 38 Outside MSA . . . . . . . . . . . . . . . . . . . . . . . . . . 2,759 941 34 19 65,734 11,217 17 18
Census Geographic Division New England . . . . . . . . . . . . . . . . . . . . . . . . . . 420 150 36 3 8,416 2,216 26 4 Middle Atlantic . . . . . . . . . . . . . . . . . . . . . . . . 1,558 694 45 14 38,487 7,743 20 13 East North Central . . . . . . . . . . . . . . . . . . . . . . 2,688 915 34 19 49,089 9,140 19 15 West North Central . . . . . . . . . . . . . . . . . . . . . 1,661 702 42 14 30,715 7,951 26 13 South Atlantic . . . . . . . . . . . . . . . . . . . . . . . . . 1,870 442 24 9 42,430 7,730 18 13 East South Central . . . . . . . . . . . . . . . . . . . . . . 1,531 253 17 5 40,701 3,048 7 5 West South Central . . . . . . . . . . . . . . . . . . . . . 1,909 307 16 6 42,409 4,207 10 7 Mountain . . . . . . . . . . . . . . . . . . . . . . . . . . . . . 1,043 803 77 16 14,723 10,564 72 17 Pacific . . . . . . . . . . . . . . . . . . . . . . . . . . . . . . . 996 653 66 13 14,913 8,886 60 14
Age 16 to 17 years . . . . . . . . . . . . . . . . . . . . . . . . . 419 181 43 4 7,379 1,777 24 3 18 to 24 years . . . . . . . . . . . . . . . . . . . . . . . . . 1,288 344 27 7 24,253 4,596 19 7 25 to 34 years . . . . . . . . . . . . . . . . . . . . . . . . . 2,079 703 34 14 51,074 6,236 12 10 35 to 44 years . . . . . . . . . . . . . . . . . . . . . . . . . 2,416 907 38 18 52,209 12,111 23 20 45 to 54 years . . . . . . . . . . . . . . . . . . . . . . . . . 3,143 1,202 38 24 59,345 16,771 28 27 55 to 64 years . . . . . . . . . . . . . . . . . . . . . . . . . 2,842 1,137 40 23 60,259 13,568 23 22 65 years and older . . . . . . . . . . . . . . . . . . . . . . 1,487 445 30 9 27,364 6,428 23 10 65 to 74 years . . . . . . . . . . . . . . . . . . . . . . . 1,221 356 29 7 23,144 5,240 23 9 75 and older . . . . . . . . . . . . . . . . . . . . . . . . . 266 89 33 2 4,220 1,188 28 2
Sex Male . . . . . . . . . . . . . . . . . . . . . . . . . . . . . . . . 12,217 4,523 37 92 263,059 57,722 22 94 Female . . . . . . . . . . . . . . . . . . . . . . . . . . . . . . . 1,457 395 27 8 18,826 3,764 20 6
Ethnicity Hispanic . . . . . . . . . . . . . . . . . . . . . . . . . . . . . 271 125 46 3 3,846 1,126 29 2 Non-Hispanic . . . . . . . . . . . . . . . . . . . . . . . . . 13,403 4,793 36 97 278,038 60,360 22 98
Race White . . . . . . . . . . . . . . . . . . . . . . . . . . . . . . . . 12,852 4,709 37 96 265,100 58,343 22 95 African American . . . . . . . . . . . . . . . . . . . . . . 413 ... ... ... 6,368 ... ... ... Asian American . . . . . . . . . . . . . . . . . . . . . . . . *27 *21 *79 *(Z) *680 *449 *66 *1 All others . . . . . . . . . . . . . . . . . . . . . . . . . . . . . 382 145 38 3 9,737 2,184 22 4
Annual Household Income Less than $20,000 . . . . . . . . . . . . . . . . . . . . . . 991 249 25 5 19,844 3,549 18 6 $20,000 to $24,999 . . . . . . . . . . . . . . . . . . . . . 533 133 25 3 6,500 1,260 19 2 $25,000 to $29,999 . . . . . . . . . . . . . . . . . . . . . 495 115 23 2 9,289 1,688 18 3 $30,000 to $34,999 . . . . . . . . . . . . . . . . . . . . . 556 233 42 5 12,144 3,379 28 5 $35,000 to $39,999 . . . . . . . . . . . . . . . . . . . . . 606 182 30 4 11,984 1,732 14 3 $40,000 to $49,999 . . . . . . . . . . . . . . . . . . . . . 1,129 393 35 8 24,242 5,455 23 9 $50,000 to $74,999 . . . . . . . . . . . . . . . . . . . . . 2,610 1,014 39 21 55,666 13,386 24 22 $75,000 to $99,999 . . . . . . . . . . . . . . . . . . . . . 2,371 1,133 48 23 52,926 14,419 27 23 $100,000 to $149,999 . . . . . . . . . . . . . . . . . . . 1,932 739 38 15 37,706 8,829 23 14 $150,000 or more . . . . . . . . . . . . . . . . . . . . . . 861 168 20 3 13,949 1,718 12 3 Not reported . . . . . . . . . . . . . . . . . . . . . . . . . . 1,591 561 35 11 37,636 6,072 16 10
Education 11 years or less . . . . . . . . . . . . . . . . . . . . . . . . 1,482 446 30 9 31,409 5,699 18 9 12 years . . . . . . . . . . . . . . . . . . . . . . . . . . . . . . 4,975 1,983 40 40 112,076 27,685 25 45 1 to 3 years of college . . . . . . . . . . . . . . . . . . . 3,510 1,274 36 26 75,816 15,799 21 26 4 years of college . . . . . . . . . . . . . . . . . . . . . . 2,447 881 36 18 39,414 7,997 20 13 5 years or more of college . . . . . . . . . . . . . . . . 1,260 335 27 7 23,169 4,306 19 7* Estimate based on a sample size of 10–29. … Sample size too small (less than 10) to report data reliably. (Z) Less than 0.5 percent.1 Hunters on public land include those who hunted on both public and private land.2 Days of hunting on public land includes both days spent solely on public land and those spent on public and private land.
Note: Percent of total hunters and percent of total days are based on the total hunters and total days columns for each row. Percent of hunters using public land and percent of days on public land are based on the total numbers of hunters on public land and total numbers of days on public land, respectively.

82 2011 National Survey of Fishing, Hunting, and Wildlife-Associated Recreation U.S. Fish and Wildlife Service and U.S. Census Bureau
Table 29. Hunters and Days of Hunting on Private Land by Selected Characteristic: 2011(Population 16 years old and older. Numbers in thousands)
Characteristic
Hunters Days of hunting
Total hunters,
public and private land
Hunters on private land1
Total days, public and
private land
Days on private land2
NumberPercent of
total hunters
Percent of hunters using
private land NumberPercent of total days
Percent of days on
private landTotal persons . . . . . . . . . . . . . . . . . . . . . . . . . . 13,674 11,537 84 100 281,884 218,839 78 100
Population Density of Residence . . . . . . . . . . Urban . . . . . . . . . . . . . . . . . . . . . . . . . . . . . . . 5,797 4,641 80 40 97,899 68,734 70 31 Rural . . . . . . . . . . . . . . . . . . . . . . . . . . . . . . . 7,877 6,896 88 60 183,986 150,105 82 69
Population Size of Residence . . . . . . . . . . . . . Metropolitan Statistical Area (MSA) . . . . . . 10,915 9,066 83 79 216,150 164,493 76 75 1,000,000 or more . . . . . . . . . . . . . . . . . . . 3,367 2,788 83 24 58,011 46,824 81 21 250,000 to 999,999 . . . . . . . . . . . . . . . . . . 2,374 1,824 77 16 46,830 32,155 69 15 50,000 to 249,999 . . . . . . . . . . . . . . . . . . . 5,174 4,454 86 39 111,309 85,513 77 39 Outside MSA . . . . . . . . . . . . . . . . . . . . . . . . . 2,759 2,471 90 21 65,734 54,346 83 25
Census Geographic Division . . . . . . . . . . . . . New England . . . . . . . . . . . . . . . . . . . . . . . . . 420 368 88 3 8,416 6,186 74 3 Middle Atlantic . . . . . . . . . . . . . . . . . . . . . . . 1,558 1,377 88 12 38,487 31,714 82 14 East North Central . . . . . . . . . . . . . . . . . . . . . 2,688 2,432 90 21 49,089 38,347 78 18 West North Central . . . . . . . . . . . . . . . . . . . . 1,661 1,514 91 13 30,715 22,949 75 10 South Atlantic . . . . . . . . . . . . . . . . . . . . . . . . 1,870 1,699 91 15 42,430 34,591 82 16 East South Central . . . . . . . . . . . . . . . . . . . . . 1,531 1,419 93 12 40,701 35,605 87 16 West South Central . . . . . . . . . . . . . . . . . . . . 1,909 1,723 90 15 42,409 38,077 90 17 Mountain . . . . . . . . . . . . . . . . . . . . . . . . . . . . 1,043 444 43 4 14,723 4,771 32 2 Pacific . . . . . . . . . . . . . . . . . . . . . . . . . . . . . . 996 560 56 5 14,913 6,599 44 3
Age 16 to 17 years . . . . . . . . . . . . . . . . . . . . . . . . 419 365 87 3 7,379 6,090 83 3 18 to 24 years . . . . . . . . . . . . . . . . . . . . . . . . 1,288 1,142 89 10 24,253 19,266 79 9 25 to 34 years . . . . . . . . . . . . . . . . . . . . . . . . 2,079 1,766 85 15 51,074 42,296 83 19 35 to 44 years . . . . . . . . . . . . . . . . . . . . . . . . 2,416 2,119 88 18 52,209 38,871 74 18 45 to 54 years . . . . . . . . . . . . . . . . . . . . . . . . 3,143 2,568 82 22 59,345 43,001 72 20 55 to 64 years . . . . . . . . . . . . . . . . . . . . . . . . 2,842 2,343 82 20 60,259 48,638 81 22 65 years and older . . . . . . . . . . . . . . . . . . . . . 1,487 1,233 83 11 27,364 20,675 76 9 65 to 74 years . . . . . . . . . . . . . . . . . . . . . . 1,221 1,014 83 9 23,144 17,743 77 8 75 and older . . . . . . . . . . . . . . . . . . . . . . . . 266 220 82 2 4,220 2,933 70 1
Sex Male . . . . . . . . . . . . . . . . . . . . . . . . . . . . . . . 12,217 10,303 84 89 263,059 204,724 78 94 Female . . . . . . . . . . . . . . . . . . . . . . . . . . . . . . 1,457 1,233 85 11 18,826 14,115 75 6
Ethnicity Hispanic . . . . . . . . . . . . . . . . . . . . . . . . . . . . 271 *168 *62 *1 3,846 *2,524 *66 *1 Non-Hispanic . . . . . . . . . . . . . . . . . . . . . . . . 13,403 11,369 85 99 278,038 216,315 78 99
Race . . . . . . . . . . . . . . . . . . . . . . . . . . . . . . . . . White . . . . . . . . . . . . . . . . . . . . . . . . . . . . . . . 12,852 10,873 85 94 265,100 205,368 77 94 African American . . . . . . . . . . . . . . . . . . . . . 413 365 88 3 6,368 5,856 92 3 Asian American . . . . . . . . . . . . . . . . . . . . . . . *27 ... ... ... *680 ... ... ... All others . . . . . . . . . . . . . . . . . . . . . . . . . . . . 382 288 75 2 9,737 7,377 76 3
Annual Household Income Less than $20,000 . . . . . . . . . . . . . . . . . . . . . 991 893 90 8 19,844 15,618 79 7 $20,000 to $24,999 . . . . . . . . . . . . . . . . . . . . 533 416 78 4 6,500 5,171 80 2 $25,000 to $29,999 . . . . . . . . . . . . . . . . . . . . 495 460 93 4 9,289 7,869 85 4 $30,000 to $34,999 . . . . . . . . . . . . . . . . . . . . 556 447 80 4 12,144 9,475 78 4 $35,000 to $39,999 . . . . . . . . . . . . . . . . . . . . 606 481 79 4 11,984 9,448 79 4 $40,000 to $49,999 . . . . . . . . . . . . . . . . . . . . 1,129 952 84 8 24,242 18,730 77 9 $50,000 to $74,999 . . . . . . . . . . . . . . . . . . . . 2,610 2,164 83 19 55,666 41,085 74 19 $75,000 to $99,999 . . . . . . . . . . . . . . . . . . . . 2,371 2,051 87 18 52,926 40,929 77 19 $100,000 to $149,999 . . . . . . . . . . . . . . . . . . 1,932 1,541 80 13 37,706 28,559 76 13 $150,000 or more . . . . . . . . . . . . . . . . . . . . . 861 768 89 7 13,949 11,593 83 5 Not reported . . . . . . . . . . . . . . . . . . . . . . . . . 1,591 1,362 86 12 37,636 30,362 81 14
Education 11 years or less . . . . . . . . . . . . . . . . . . . . . . . 1,482 1,306 88 11 31,409 26,387 84 12 12 years . . . . . . . . . . . . . . . . . . . . . . . . . . . . . 4,975 3,989 80 35 112,076 81,891 73 37 1 to 3 years of college . . . . . . . . . . . . . . . . . . 3,510 3,063 87 27 75,816 60,480 80 28 4 years of college . . . . . . . . . . . . . . . . . . . . . 2,447 2,093 86 18 39,414 30,885 78 14 5 years or more of college . . . . . . . . . . . . . . . 1,260 1,086 86 9 23,169 19,195 83 9* Estimate based on a sample size of 10–29. … Sample size too small (less than 10) to report data reliably.1 Hunters on private land include those who hunted on both private and public land.2 Days of hunting on private land includes both days spent solely on private land and those spent on private and public land.
Note: Percent of total hunters and percent of total days are based on the total hunters and total days columns for each row. Percent of hunters using private land and percent of days on private land are based on the total Numbers of hunters on private land and total Numbers of days on private land, respectively.

U.S. Fish and Wildlife Service and U.S. Census Bureau 2011 National Survey of Fishing, Hunting, and Wildlife-Associated Recreation 83
Table 30. Anglers Fishing From Boats and Days of Participation by Type of Fishing: 2011(Population 16 years old and older. Numbers in thousands)
Participants and days of fishingTotal, all fishing Freshwater, excludes
Great Lakes Great Lakes Saltwater
Number Percent Number Percent Number Percent Number PercentTotal anglers . . . . . . . . . . . . . . . . . . . . . . . . . . . . . . 33,112 100 27,060 100 1,665 100 8,889 100 Anglers fishing from boats . . . . . . . . . . . . . . . . . . 18,017 54 13,683 51 1,141 69 5,814 65
Total days of fishing . . . . . . . . . . . . . . . . . . . . . . . . 553,841 100 443,223 100 19,661 100 99,474 100 Days fishing from boats . . . . . . . . . . . . . . . . . . . . 257,444 46 190,518 43 10,799 55 56,127 56Note: Detail does not add to total because of multiple responses and nonresponse.
Table 31. Participation in Ice Fishing and Fly-Fishing: 2011(Population 16 years old and older. Numbers in thousands)
Anglers and days Number PercentTotal anglers . . . . . . . . . . . . . . . . . . . . . . . . . . . . . . . . . . . . . . . . . . . . . . . . . . . . . . . . . . . . . . . . . . . . . . . 33,112 100 Ice anglers . . . . . . . . . . . . . . . . . . . . . . . . . . . . . . . . . . . . . . . . . . . . . . . . . . . . . . . . . . . . . . . . . . . . . . . . 1,930 6 Fly-anglers . . . . . . . . . . . . . . . . . . . . . . . . . . . . . . . . . . . . . . . . . . . . . . . . . . . . . . . . . . . . . . . . . . . . . . . 4,260 13
Total days of fishing . . . . . . . . . . . . . . . . . . . . . . . . . . . . . . . . . . . . . . . . . . . . . . . . . . . . . . . . . . . . . . . . . 553,841 100 Days of ice fishing . . . . . . . . . . . . . . . . . . . . . . . . . . . . . . . . . . . . . . . . . . . . . . . . . . . . . . . . . . . . . . . . . 19,369 3 Days of fly-fishing . . . . . . . . . . . . . . . . . . . . . . . . . . . . . . . . . . . . . . . . . . . . . . . . . . . . . . . . . . . . . . . . . 37,872 7Note: Detail does not add to total because of multiple responses.
Table 32. Hunters Using Bows and Arrows, Muzzleloaders, or Other Firearms: 2011(Population 16 years old and older. Numbers in thousands)
Hunters Number PercentTotal hunters . . . . . . . . . . . . . . . . . . . . . . . . . . . . . . . . . . . . . . . . . . . . . . . . . . . . . . . . . . . . . . . . . . . . . . . 13,674 100 Hunters using bow and arrow . . . . . . . . . . . . . . . . . . . . . . . . . . . . . . . . . . . . . . . . . . . . . . . . . . . . . . . . . 4,472 33 Hunters using muzzleloader . . . . . . . . . . . . . . . . . . . . . . . . . . . . . . . . . . . . . . . . . . . . . . . . . . . . . . . . . . 2,981 22 Hunters using other firearm (e.g., shotgun, rifle) . . . . . . . . . . . . . . . . . . . . . . . . . . . . . . . . . . . . . . . . . . 12,730 93
Total days of hunting . . . . . . . . . . . . . . . . . . . . . . . . . . . . . . . . . . . . . . . . . . . . . . . . . . . . . . . . . . . . . . . . 281,884 100 With bow and arrow . . . . . . . . . . . . . . . . . . . . . . . . . . . . . . . . . . . . . . . . . . . . . . . . . . . . . . . . . . . . . . . . 69,103 25 With muzzleloader . . . . . . . . . . . . . . . . . . . . . . . . . . . . . . . . . . . . . . . . . . . . . . . . . . . . . . . . . . . . . . . . . 23,167 8 With other firearm (e.g., shotgun, rifle) . . . . . . . . . . . . . . . . . . . . . . . . . . . . . . . . . . . . . . . . . . . . . . . . . 183,044 65Note: Detail does not add to total because of multiple responses and nonresponse.

84 2011 National Survey of Fishing, Hunting, and Wildlife-Associated Recreation U.S. Fish and Wildlife Service and U.S. Census Bureau
Table 33. Hunters Preparing for Hunting by Target Shooting: 2011(Population 16 years old and older. Numbers in thousands)
HuntersTotal
Number PercentTotal hunters . . . . . . . . . . . . . . . . . . . . . . . . . . . . . . . . . . . . . . . . . . . . . . . . . . . . . . . . . . . . . . . . . . . . . . . . . . . . . . . . . . . . . 13,674 100 Target shooting in preparation for hunting . . . . . . . . . . . . . . . . . . . . . . . . . . . . . . . . . . . . . . . . . . . . . . . . . . . . . . . . . . . . . 7,178 52 Used shooting ranges . . . . . . . . . . . . . . . . . . . . . . . . . . . . . . . . . . . . . . . . . . . . . . . . . . . . . . . . . . . . . . . . . . . . . . . . . . . . . 2,943 22 With muzzleloader . . . . . . . . . . . . . . . . . . . . . . . . . . . . . . . . . . . . . . . . . . . . . . . . . . . . . . . . . . . . . . . . . . . . . . . . . . . . . 420 3 With handgun . . . . . . . . . . . . . . . . . . . . . . . . . . . . . . . . . . . . . . . . . . . . . . . . . . . . . . . . . . . . . . . . . . . . . . . . . . . . . . . . . 1,110 8 With other firearm (e.g., shotgun, rifle) . . . . . . . . . . . . . . . . . . . . . . . . . . . . . . . . . . . . . . . . . . . . . . . . . . . . . . . . . . . . . 2,322 17 With airgun . . . . . . . . . . . . . . . . . . . . . . . . . . . . . . . . . . . . . . . . . . . . . . . . . . . . . . . . . . . . . . . . . . . . . . . . . . . . . . . . . . . 406 3 With bow and arrow . . . . . . . . . . . . . . . . . . . . . . . . . . . . . . . . . . . . . . . . . . . . . . . . . . . . . . . . . . . . . . . . . . . . . . . . . . . . *93 *1 With crossbow . . . . . . . . . . . . . . . . . . . . . . . . . . . . . . . . . . . . . . . . . . . . . . . . . . . . . . . . . . . . . . . . . . . . . . . . . . . . . . . . . 564 4* Estimate based on a sample size of 10–29.
Note: Detail does not add to total because of multiple responses.
Table 34. Land Owned or Leased for the Primary Purpose of Fishing or Hunting: 2011(Population 16 years old and older. Numbers in thousands)
Fishing and hunting Number PercentLAND OWNERSHIP
Sportspersons Owning Land
Total sportspersons . . . . . . . . . . . . . . . . . . . . . . . . . . . . . . . . . . . . . . . . . . . . . . . . . . . . . . . . . . . . . . . . . . . . . . . . . . . . . . . . 1,994 100 Anglers . . . . . . . . . . . . . . . . . . . . . . . . . . . . . . . . . . . . . . . . . . . . . . . . . . . . . . . . . . . . . . . . . . . . . . . . . . . . . . . . . . . . . . . . 807 40 Hunters . . . . . . . . . . . . . . . . . . . . . . . . . . . . . . . . . . . . . . . . . . . . . . . . . . . . . . . . . . . . . . . . . . . . . . . . . . . . . . . . . . . . . . . . 1,408 71
Acres Owned
Total acres owned . . . . . . . . . . . . . . . . . . . . . . . . . . . . . . . . . . . . . . . . . . . . . . . . . . . . . . . . . . . . . . . . . . . . . . . . . . . . . . . . . 180,392 100 Acres for fishing . . . . . . . . . . . . . . . . . . . . . . . . . . . . . . . . . . . . . . . . . . . . . . . . . . . . . . . . . . . . . . . . . . . . . . . . . . . . . . . . . 25,208 14 Acres for hunting . . . . . . . . . . . . . . . . . . . . . . . . . . . . . . . . . . . . . . . . . . . . . . . . . . . . . . . . . . . . . . . . . . . . . . . . . . . . . . . . . 155,184 86
Expenditures for Land Owned
Total expenditures . . . . . . . . . . . . . . . . . . . . . . . . . . . . . . . . . . . . . . . . . . . . . . . . . . . . . . . . . . . . . . . . . . . . . . . . . . . . . . . . . 9,155,543 100 For fishing . . . . . . . . . . . . . . . . . . . . . . . . . . . . . . . . . . . . . . . . . . . . . . . . . . . . . . . . . . . . . . . . . . . . . . . . . . . . . . . . . . . . . . 3,143,921 34 For hunting . . . . . . . . . . . . . . . . . . . . . . . . . . . . . . . . . . . . . . . . . . . . . . . . . . . . . . . . . . . . . . . . . . . . . . . . . . . . . . . . . . . . . 6,011,622 66
LAND LEASING
Sportspersons Leasing Land
Total sportspersons . . . . . . . . . . . . . . . . . . . . . . . . . . . . . . . . . . . . . . . . . . . . . . . . . . . . . . . . . . . . . . . . . . . . . . . . . . . . . . . . 1,451 100 Anglers . . . . . . . . . . . . . . . . . . . . . . . . . . . . . . . . . . . . . . . . . . . . . . . . . . . . . . . . . . . . . . . . . . . . . . . . . . . . . . . . . . . . . . . . 207 14 Hunters . . . . . . . . . . . . . . . . . . . . . . . . . . . . . . . . . . . . . . . . . . . . . . . . . . . . . . . . . . . . . . . . . . . . . . . . . . . . . . . . . . . . . . . . 1,270 87
Acres Leased
Total acres leased . . . . . . . . . . . . . . . . . . . . . . . . . . . . . . . . . . . . . . . . . . . . . . . . . . . . . . . . . . . . . . . . . . . . . . . . . . . . . . . . . . 430,030 100 Acres for fishing . . . . . . . . . . . . . . . . . . . . . . . . . . . . . . . . . . . . . . . . . . . . . . . . . . . . . . . . . . . . . . . . . . . . . . . . . . . . . . . . . 9,984 2 Acres for hunting . . . . . . . . . . . . . . . . . . . . . . . . . . . . . . . . . . . . . . . . . . . . . . . . . . . . . . . . . . . . . . . . . . . . . . . . . . . . . . . . . 420,046 98
Expenditures for Land Leased
Total expenditures . . . . . . . . . . . . . . . . . . . . . . . . . . . . . . . . . . . . . . . . . . . . . . . . . . . . . . . . . . . . . . . . . . . . . . . . . . . . . . . . . 1,407,820 100 For fishing . . . . . . . . . . . . . . . . . . . . . . . . . . . . . . . . . . . . . . . . . . . . . . . . . . . . . . . . . . . . . . . . . . . . . . . . . . . . . . . . . . . . . . 290,176 21 For hunting . . . . . . . . . . . . . . . . . . . . . . . . . . . . . . . . . . . . . . . . . . . . . . . . . . . . . . . . . . . . . . . . . . . . . . . . . . . . . . . . . . . . . 1,117,643 79Note: Detail does not add to total because of multiple responses.

U.S. Fish and Wildlife Service and U.S. Census Bureau 2011 National Survey of Fishing, Hunting, and Wildlife-Associated Recreation 85
Table 35. Wildlife-Watching Participants by Type of Activity: 2011(Population 16 years old and older. Numbers in thousands)
Activity Number PercentTotal participants . . . . . . . . . . . . . . . . . . . . . . . . . . . . . . . . . . . . . . . . . . . . . . . . . . . . . . . . . . . . . . . . . . . . . . . . . . . . . . . . . . 71,776 100
Away from home . . . . . . . . . . . . . . . . . . . . . . . . . . . . . . . . . . . . . . . . . . . . . . . . . . . . . . . . . . . . . . . . . . . . . . . . . . . . . . . . . . 22,496 31 Observe wildlife . . . . . . . . . . . . . . . . . . . . . . . . . . . . . . . . . . . . . . . . . . . . . . . . . . . . . . . . . . . . . . . . . . . . . . . . . . . . . . . . 19,808 28 Photograph wildlife . . . . . . . . . . . . . . . . . . . . . . . . . . . . . . . . . . . . . . . . . . . . . . . . . . . . . . . . . . . . . . . . . . . . . . . . . . . . . . 12,354 17 Feed wildlife . . . . . . . . . . . . . . . . . . . . . . . . . . . . . . . . . . . . . . . . . . . . . . . . . . . . . . . . . . . . . . . . . . . . . . . . . . . . . . . . . . . 5,399 8
Around the home . . . . . . . . . . . . . . . . . . . . . . . . . . . . . . . . . . . . . . . . . . . . . . . . . . . . . . . . . . . . . . . . . . . . . . . . . . . . . . . . . . 68,598 96 Observe wildlife . . . . . . . . . . . . . . . . . . . . . . . . . . . . . . . . . . . . . . . . . . . . . . . . . . . . . . . . . . . . . . . . . . . . . . . . . . . . . . . . 45,046 63 Photograph wildlife . . . . . . . . . . . . . . . . . . . . . . . . . . . . . . . . . . . . . . . . . . . . . . . . . . . . . . . . . . . . . . . . . . . . . . . . . . . . . . 25,370 35 Feed wildlife . . . . . . . . . . . . . . . . . . . . . . . . . . . . . . . . . . . . . . . . . . . . . . . . . . . . . . . . . . . . . . . . . . . . . . . . . . . . . . . . . . . 52,817 74 Visit parks or natural areas1 . . . . . . . . . . . . . . . . . . . . . . . . . . . . . . . . . . . . . . . . . . . . . . . . . . . . . . . . . . . . . . . . . . . . . . . . 12,311 17 Maintain plantings or natural areas . . . . . . . . . . . . . . . . . . . . . . . . . . . . . . . . . . . . . . . . . . . . . . . . . . . . . . . . . . . . . . . . . . 13,399 191 Includes visits only to parks or natural areas within one mile of home.
Note: Detail does not add to total because of multiple responses.
Table 36. Participants, Area Visited, Trips, and Days of Participation in Wildlife Watching Away From Home: 2011
(Population 16 years old and older. Numbers in thousands)
Participants, area visited, trips, and days of participation Number PercentPARTICIPANTS
Total participants . . . . . . . . . . . . . . . . . . . . . . . . . . . . . . . . . . . . . . . . . . . . . . . . . . . . . . . . . . . . . . . . . . . . . . . . . . . . . . . . . . . 22,496 100 Observe wildlife . . . . . . . . . . . . . . . . . . . . . . . . . . . . . . . . . . . . . . . . . . . . . . . . . . . . . . . . . . . . . . . . . . . . . . . . . . . . . . . . . 19,808 88 Photograph wildlife . . . . . . . . . . . . . . . . . . . . . . . . . . . . . . . . . . . . . . . . . . . . . . . . . . . . . . . . . . . . . . . . . . . . . . . . . . . . . . . 12,354 55 Feed wildlife . . . . . . . . . . . . . . . . . . . . . . . . . . . . . . . . . . . . . . . . . . . . . . . . . . . . . . . . . . . . . . . . . . . . . . . . . . . . . . . . . . . . 5,399 24
AREA VISITED
Total, all areas . . . . . . . . . . . . . . . . . . . . . . . . . . . . . . . . . . . . . . . . . . . . . . . . . . . . . . . . . . . . . . . . . . . . . . . . . . . . . . . . . . . . . . 22,496 100 Public only . . . . . . . . . . . . . . . . . . . . . . . . . . . . . . . . . . . . . . . . . . . . . . . . . . . . . . . . . . . . . . . . . . . . . . . . . . . . . . . . . . . . . . . 12,830 57 Private only . . . . . . . . . . . . . . . . . . . . . . . . . . . . . . . . . . . . . . . . . . . . . . . . . . . . . . . . . . . . . . . . . . . . . . . . . . . . . . . . . . . . . . . 2,105 9 Public and private . . . . . . . . . . . . . . . . . . . . . . . . . . . . . . . . . . . . . . . . . . . . . . . . . . . . . . . . . . . . . . . . . . . . . . . . . . . . . . . . . . 5,545 25 Not reported . . . . . . . . . . . . . . . . . . . . . . . . . . . . . . . . . . . . . . . . . . . . . . . . . . . . . . . . . . . . . . . . . . . . . . . . . . . . . . . . . . . . . . 2,017 9
TRIPS
Total trips . . . . . . . . . . . . . . . . . . . . . . . . . . . . . . . . . . . . . . . . . . . . . . . . . . . . . . . . . . . . . . . . . . . . . . . . . . . . . . . . . . . . . . . . . . 242,838 100 Average days per trip. . . . . . . . . . . . . . . . . . . . . . . . . . . . . . . . . . . . . . . . . . . . . . . . . . . . . . . . . . . . . . . . . . . . . . . . . . . . . . . . 1 (X)
DAYS
Total days . . . . . . . . . . . . . . . . . . . . . . . . . . . . . . . . . . . . . . . . . . . . . . . . . . . . . . . . . . . . . . . . . . . . . . . . . . . . . . . . . . . . . . . . . . 335,625 100 Observing wildlife . . . . . . . . . . . . . . . . . . . . . . . . . . . . . . . . . . . . . . . . . . . . . . . . . . . . . . . . . . . . . . . . . . . . . . . . . . . . . . . . . 268,798 80 Photographing wildlife . . . . . . . . . . . . . . . . . . . . . . . . . . . . . . . . . . . . . . . . . . . . . . . . . . . . . . . . . . . . . . . . . . . . . . . . . . . . . . 110,459 33 Feeding wildlife . . . . . . . . . . . . . . . . . . . . . . . . . . . . . . . . . . . . . . . . . . . . . . . . . . . . . . . . . . . . . . . . . . . . . . . . . . . . . . . . . . . 59,255 18
Average days per participant . . . . . . . . . . . . . . . . . . . . . . . . . . . . . . . . . . . . . . . . . . . . . . . . . . . . . . . . . . . . . . . . . . . . . . . . . . 15 (X) Observing wildlife . . . . . . . . . . . . . . . . . . . . . . . . . . . . . . . . . . . . . . . . . . . . . . . . . . . . . . . . . . . . . . . . . . . . . . . . . . . . . . . . . 14 (X) Photographing wildlife . . . . . . . . . . . . . . . . . . . . . . . . . . . . . . . . . . . . . . . . . . . . . . . . . . . . . . . . . . . . . . . . . . . . . . . . . . . . . . 9 (X) Feeding wildlife . . . . . . . . . . . . . . . . . . . . . . . . . . . . . . . . . . . . . . . . . . . . . . . . . . . . . . . . . . . . . . . . . . . . . . . . . . . . . . . . . . . 11 (X)(X) Not applicable.
Note: Detail does not add to total because of multiple responses.

86 2011 National Survey of Fishing, Hunting, and Wildlife-Associated Recreation U.S. Fish and Wildlife Service and U.S. Census Bureau
Table 37. Participation in Wildlife-Watching Activities Around the Home: 2011(Population 16 years old and older. Numbers in thousands)
Activity Number Percent Activity Number PercentTotal around the home . . . . . . . . . . . . . . . . . . . . . . . . 68,598 100 PHOTOGRAPH WILDLIFE Observe wildlife . . . . . . . . . . . . . . . . . . . . . . . . . . . . 45,046 66 Photograph wildlife . . . . . . . . . . . . . . . . . . . . . . . . . . 25,370 37 Participants photographing: Feed wildlife . . . . . . . . . . . . . . . . . . . . . . . . . . . . . . . 52,817 77 Total, 1 day or more . . . . . . . . . . . . . . . . . . . . . . . . 25,370 100 Visit parks or natural areas1 . . . . . . . . . . . . . . . . . . . . 12,311 18 1 day . . . . . . . . . . . . . . . . . . . . . . . . . . . . . . . . . . . 4,289 17 Maintain natural areas . . . . . . . . . . . . . . . . . . . . . . . . 8,012 12 2 to 3 days . . . . . . . . . . . . . . . . . . . . . . . . . . . . . . . 5,816 23 Maintain plantings . . . . . . . . . . . . . . . . . . . . . . . . . . 9,214 13 4 to 5 days . . . . . . . . . . . . . . . . . . . . . . . . . . . . . . . 3,732 15
6 to 10 days . . . . . . . . . . . . . . . . . . . . . . . . . . . . . . 4,343 17OBSERVE WILDLIFE 11 to 20 days . . . . . . . . . . . . . . . . . . . . . . . . . . . . . 2,961 12
21 days or more . . . . . . . . . . . . . . . . . . . . . . . . . . . 3,689 15Participants observing: Total, all wildlife . . . . . . . . . . . . . . . . . . . . . . . . . . . 45,046 100 FEED WILDLIFE Birds . . . . . . . . . . . . . . . . . . . . . . . . . . . . . . . . . . . 41,346 92 Land mammals, all . . . . . . . . . . . . . . . . . . . . . . . . 35,884 80 Participants feeding: Large mammals . . . . . . . . . . . . . . . . . . . . . . . . . 22,056 49 Total, all wildlife . . . . . . . . . . . . . . . . . . . . . . . . . . . 52,817 100 Small mammals . . . . . . . . . . . . . . . . . . . . . . . . . 31,629 70 Wild birds . . . . . . . . . . . . . . . . . . . . . . . . . . . . . . . 50,217 95 Amphibians or reptiles . . . . . . . . . . . . . . . . . . . . . 14,132 31 Other wildlife . . . . . . . . . . . . . . . . . . . . . . . . . . . . 14,820 28 Insects or spiders . . . . . . . . . . . . . . . . . . . . . . . . . . 16,589 37 Fish or other wildlife . . . . . . . . . . . . . . . . . . . . . . . 8,388 19 MAINTAIN NATURAL AREAS
Participants observing: Participants maintaining: Total, 1 day or more . . . . . . . . . . . . . . . . . . . . . . . . 45,046 100 Total, all acreages . . . . . . . . . . . . . . . . . . . . . . . . . . 8,012 100 1 to 10 days . . . . . . . . . . . . . . . . . . . . . . . . . . . . . . 9,596 21 1 acre or less . . . . . . . . . . . . . . . . . . . . . . . . . . . . . 4,369 55 11 to 20 days . . . . . . . . . . . . . . . . . . . . . . . . . . . . . 3,916 9 2 to 10 acres . . . . . . . . . . . . . . . . . . . . . . . . . . . . . 2,621 33 21 to 50 days . . . . . . . . . . . . . . . . . . . . . . . . . . . . . 5,791 13 11 to 50 acres . . . . . . . . . . . . . . . . . . . . . . . . . . . . 701 9 51 to 100 days . . . . . . . . . . . . . . . . . . . . . . . . . . . . 5,091 11 More than 50 acres . . . . . . . . . . . . . . . . . . . . . . . . 271 3 101 to 200 days . . . . . . . . . . . . . . . . . . . . . . . . . . . 6,302 14 201 days or more . . . . . . . . . . . . . . . . . . . . . . . . . . 13,123 29 MAINTAIN PLANTINGS
VISIT PARKS OR NATURAL AREAS1 Participants maintaining plantings . . . . . . . . . . . . . . 9,214 100
Participants visiting: Participants spending: Total, 1 day or more . . . . . . . . . . . . . . . . . . . . . . . . 12,311 100 Less than $25 . . . . . . . . . . . . . . . . . . . . . . . . . . . . . . 3,553 39 1 to 5 days . . . . . . . . . . . . . . . . . . . . . . . . . . . . . . . 5,517 45 $25 to $75 . . . . . . . . . . . . . . . . . . . . . . . . . . . . . . . . . 1,880 20 6 to 10 days . . . . . . . . . . . . . . . . . . . . . . . . . . . . . . 2,048 17 More than $75 . . . . . . . . . . . . . . . . . . . . . . . . . . . . . . 3,385 37 11 days or more . . . . . . . . . . . . . . . . . . . . . . . . . . . 4,438 36 Average expenditure per participant for plantings2 . . . . 239 (X)
(X) Not applicable.1 Includes visits only to parks or natural areas within one mile of home.2 Average expenditures are annual estimates.
Note: Detail does not add to total because of multiple responses and nonresponse.

U.S. Fish and Wildlife Service and U.S. Census Bureau 2011 National Survey of Fishing, Hunting, and Wildlife-Associated Recreation 87
Table 38. Away-From-Home Wildlife Watchers by Wildlife Observed, Photographed, or Fed and Place: 2011
(Population 16 years old and older. Numbers in thousands)
Wildlife observed, photographed, or fedTotal participants
Participation by placeTotal In state of residence In other states
Number Percent Number Percent Number Percent Number PercentTotal, all wildlife . . . . . . . . . . . . . . . . . . . . . . . . . . . . . . . . . . . . . . 22,496 100 22,496 100 18,529 82 6,769 30
Total birds . . . . . . . . . . . . . . . . . . . . . . . . . . . . . . . . . . . . . . . . . . . 18,924 84 18,924 100 16,037 85 6,257 33 Songbirds (cardinals, robins, etc.) . . . . . . . . . . . . . . . . . . . . . . . . 12,120 54 12,120 100 10,616 88 3,356 28 Birds of prey (hawks, eagles, etc.) . . . . . . . . . . . . . . . . . . . . . . . 12,890 57 12,890 100 10,990 85 3,917 30 Waterfowl (ducks, geese, etc.) . . . . . . . . . . . . . . . . . . . . . . . . . . 13,333 59 13,333 100 11,081 83 4,231 32 Other water birds (shorebirds, herons, cranes, etc.) . . . . . . . . . . 10,606 47 10,606 100 8,509 80 3,483 33 Other birds (pheasants, turkeys, road runners, etc.) . . . . . . . . . . 6,857 30 6,857 100 5,770 84 1,790 26
Total land mammals . . . . . . . . . . . . . . . . . . . . . . . . . . . . . . . . . . . 13,653 61 13,653 100 11,743 86 4,180 31 Large land mammals (deer, bear, etc.) . . . . . . . . . . . . . . . . . . . . 10,369 46 10,369 100 8,702 84 3,045 29 Small land mammals (squirrel, prairie dog, etc.) . . . . . . . . . . . . 10,299 46 10,299 100 8,758 85 3,299 32
Fish (salmon, shark, etc.) . . . . . . . . . . . . . . . . . . . . . . . . . . . . . . . . 6,358 28 6,358 100 4,964 78 2,075 33Marine mammals (whales, dolphins, etc.) . . . . . . . . . . . . . . . . . . . 4,008 18 4,008 100 2,325 58 1,864 47Other wildlife (turtles, butterflies, etc.) . . . . . . . . . . . . . . . . . . . . . 10,113 45 10,113 100 8,602 85 2,865 28Note: Detail does not add to total because of multiple responses. Column showing percent of total participants is based on the “Total, all wildlife” numbers. “Participation by
place” percent columns are based on the total numbers of participants for each type of wildlife.
Table 39. Wild Bird Observers and Days of Observation: 2011(Population 16 years old and older. Numbers in thousands)
Observers and days of observation Number PercentOBSERVERS
Total bird observers . . . . . . . . . . . . . . . . . . . . . . . . . . . . . . . . . . . . . . . . . . . . . . . . . . . . . . . . . . . . . . . . . 46,741 100 Around-the-home observers . . . . . . . . . . . . . . . . . . . . . . . . . . . . . . . . . . . . . . . . . . . . . . . . . . . . . . . . . . 41,346 88 Away-from-home observers . . . . . . . . . . . . . . . . . . . . . . . . . . . . . . . . . . . . . . . . . . . . . . . . . . . . . . . . . . 17,818 38
DAYS
Total days observing birds . . . . . . . . . . . . . . . . . . . . . . . . . . . . . . . . . . . . . . . . . . . . . . . . . . . . . . . . . . . . 5,161,909 100 Around the home . . . . . . . . . . . . . . . . . . . . . . . . . . . . . . . . . . . . . . . . . . . . . . . . . . . . . . . . . . . . . . . . . . . 4,923,873 95 Away from home . . . . . . . . . . . . . . . . . . . . . . . . . . . . . . . . . . . . . . . . . . . . . . . . . . . . . . . . . . . . . . . . . . . 238,036 5Note: Detail does not add to total because of multiple responses.
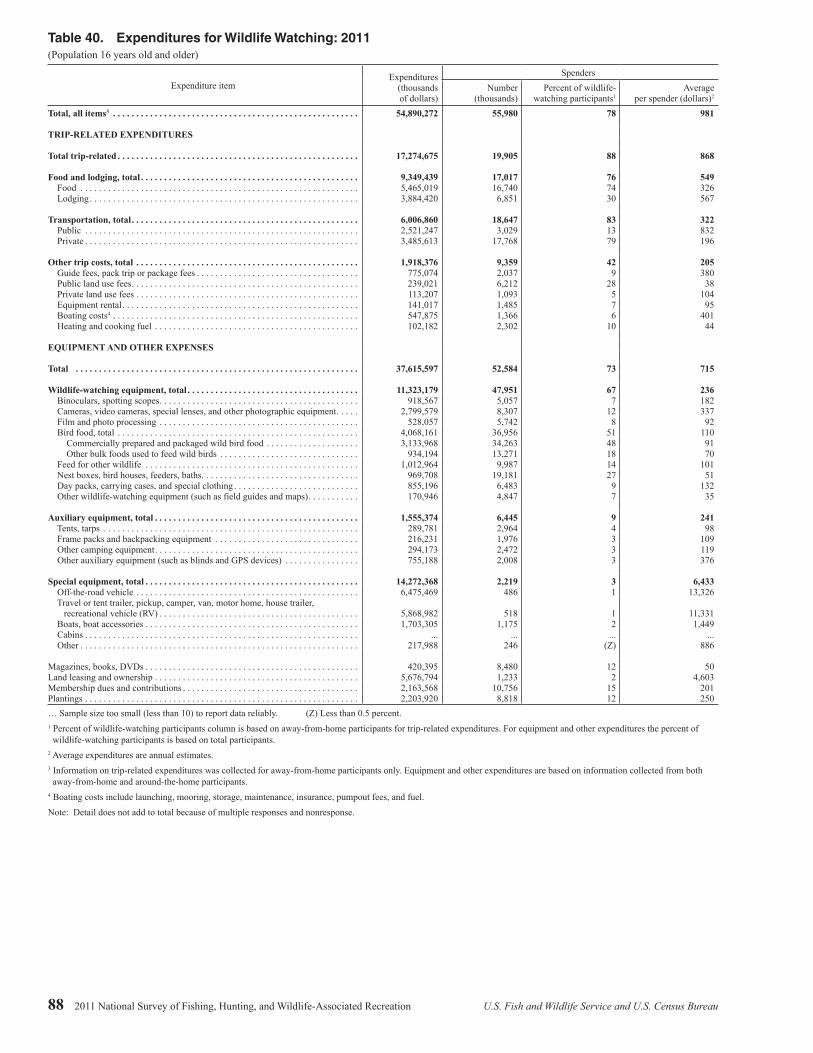
88 2011 National Survey of Fishing, Hunting, and Wildlife-Associated Recreation U.S. Fish and Wildlife Service and U.S. Census Bureau
Table 40. Expenditures for Wildlife Watching: 2011(Population 16 years old and older)
Expenditure itemExpenditures
(thousandsof dollars)
SpendersNumber
(thousands)Percent of wildlife-
watching participants1Average
per spender (dollars)2
Total, all items3 . . . . . . . . . . . . . . . . . . . . . . . . . . . . . . . . . . . . . . . . . . . . . . . . . . . . . 54,890,272 55,980 78 981
TRIP-RELATED EXPENDITURES
Total trip-related . . . . . . . . . . . . . . . . . . . . . . . . . . . . . . . . . . . . . . . . . . . . . . . . . . . . 17,274,675 19,905 88 868
Food and lodging, total . . . . . . . . . . . . . . . . . . . . . . . . . . . . . . . . . . . . . . . . . . . . . . . 9,349,439 17,017 76 549 Food . . . . . . . . . . . . . . . . . . . . . . . . . . . . . . . . . . . . . . . . . . . . . . . . . . . . . . . . . . . . 5,465,019 16,740 74 326 Lodging . . . . . . . . . . . . . . . . . . . . . . . . . . . . . . . . . . . . . . . . . . . . . . . . . . . . . . . . . . 3,884,420 6,851 30 567
Transportation, total . . . . . . . . . . . . . . . . . . . . . . . . . . . . . . . . . . . . . . . . . . . . . . . . . 6,006,860 18,647 83 322 Public . . . . . . . . . . . . . . . . . . . . . . . . . . . . . . . . . . . . . . . . . . . . . . . . . . . . . . . . . . . 2,521,247 3,029 13 832 Private . . . . . . . . . . . . . . . . . . . . . . . . . . . . . . . . . . . . . . . . . . . . . . . . . . . . . . . . . . . 3,485,613 17,768 79 196
Other trip costs, total . . . . . . . . . . . . . . . . . . . . . . . . . . . . . . . . . . . . . . . . . . . . . . . . 1,918,376 9,359 42 205 Guide fees, pack trip or package fees . . . . . . . . . . . . . . . . . . . . . . . . . . . . . . . . . . . 775,074 2,037 9 380 Public land use fees . . . . . . . . . . . . . . . . . . . . . . . . . . . . . . . . . . . . . . . . . . . . . . . . . 239,021 6,212 28 38 Private land use fees . . . . . . . . . . . . . . . . . . . . . . . . . . . . . . . . . . . . . . . . . . . . . . . . 113,207 1,093 5 104 Equipment rental . . . . . . . . . . . . . . . . . . . . . . . . . . . . . . . . . . . . . . . . . . . . . . . . . . . 141,017 1,485 7 95 Boating costs4 . . . . . . . . . . . . . . . . . . . . . . . . . . . . . . . . . . . . . . . . . . . . . . . . . . . . . 547,875 1,366 6 401 Heating and cooking fuel . . . . . . . . . . . . . . . . . . . . . . . . . . . . . . . . . . . . . . . . . . . . 102,182 2,302 10 44
EQUIPMENT AND OTHER EXPENSES
Total . . . . . . . . . . . . . . . . . . . . . . . . . . . . . . . . . . . . . . . . . . . . . . . . . . . . . . . . . . . . . 37,615,597 52,584 73 715
Wildlife-watching equipment, total . . . . . . . . . . . . . . . . . . . . . . . . . . . . . . . . . . . . . 11,323,179 47,951 67 236 Binoculars, spotting scopes . . . . . . . . . . . . . . . . . . . . . . . . . . . . . . . . . . . . . . . . . . . 918,567 5,057 7 182 Cameras, video cameras, special lenses, and other photographic equipment . . . . . 2,799,579 8,307 12 337 Film and photo processing . . . . . . . . . . . . . . . . . . . . . . . . . . . . . . . . . . . . . . . . . . . 528,057 5,742 8 92 Bird food, total . . . . . . . . . . . . . . . . . . . . . . . . . . . . . . . . . . . . . . . . . . . . . . . . . . . . 4,068,161 36,956 51 110 Commercially prepared and packaged wild bird food . . . . . . . . . . . . . . . . . . . . 3,133,968 34,263 48 91 Other bulk foods used to feed wild birds . . . . . . . . . . . . . . . . . . . . . . . . . . . . . . 934,194 13,271 18 70 Feed for other wildlife . . . . . . . . . . . . . . . . . . . . . . . . . . . . . . . . . . . . . . . . . . . . . . 1,012,964 9,987 14 101 Nest boxes, bird houses, feeders, baths . . . . . . . . . . . . . . . . . . . . . . . . . . . . . . . . . . 969,708 19,181 27 51 Day packs, carrying cases, and special clothing . . . . . . . . . . . . . . . . . . . . . . . . . . . 855,196 6,483 9 132 Other wildlife-watching equipment (such as field guides and maps) . . . . . . . . . . . 170,946 4,847 7 35
Auxiliary equipment, total . . . . . . . . . . . . . . . . . . . . . . . . . . . . . . . . . . . . . . . . . . . . 1,555,374 6,445 9 241 Tents, tarps . . . . . . . . . . . . . . . . . . . . . . . . . . . . . . . . . . . . . . . . . . . . . . . . . . . . . . . 289,781 2,964 4 98 Frame packs and backpacking equipment . . . . . . . . . . . . . . . . . . . . . . . . . . . . . . . 216,231 1,976 3 109 Other camping equipment . . . . . . . . . . . . . . . . . . . . . . . . . . . . . . . . . . . . . . . . . . . . 294,173 2,472 3 119 Other auxiliary equipment (such as blinds and GPS devices) . . . . . . . . . . . . . . . . 755,188 2,008 3 376
Special equipment, total . . . . . . . . . . . . . . . . . . . . . . . . . . . . . . . . . . . . . . . . . . . . . . 14,272,368 2,219 3 6,433 Off-the-road vehicle . . . . . . . . . . . . . . . . . . . . . . . . . . . . . . . . . . . . . . . . . . . . . . . . 6,475,469 486 1 13,326 Travel or tent trailer, pickup, camper, van, motor home, house trailer,
recreational vehicle (RV) . . . . . . . . . . . . . . . . . . . . . . . . . . . . . . . . . . . . . . . . . . . 5,868,982 518 1 11,331 Boats, boat accessories . . . . . . . . . . . . . . . . . . . . . . . . . . . . . . . . . . . . . . . . . . . . . . 1,703,305 1,175 2 1,449 Cabins . . . . . . . . . . . . . . . . . . . . . . . . . . . . . . . . . . . . . . . . . . . . . . . . . . . . . . . . . . . ... ... ... ... Other . . . . . . . . . . . . . . . . . . . . . . . . . . . . . . . . . . . . . . . . . . . . . . . . . . . . . . . . . . . . 217,988 246 (Z) 886
Magazines, books, DVDs . . . . . . . . . . . . . . . . . . . . . . . . . . . . . . . . . . . . . . . . . . . . . . 420,395 8,480 12 50Land leasing and ownership . . . . . . . . . . . . . . . . . . . . . . . . . . . . . . . . . . . . . . . . . . . . 5,676,794 1,233 2 4,603Membership dues and contributions . . . . . . . . . . . . . . . . . . . . . . . . . . . . . . . . . . . . . . 2,163,568 10,756 15 201Plantings . . . . . . . . . . . . . . . . . . . . . . . . . . . . . . . . . . . . . . . . . . . . . . . . . . . . . . . . . . . 2,203,920 8,818 12 250… Sample size too small (less than 10) to report data reliably. (Z) Less than 0.5 percent.1 Percent of wildlife-watching participants column is based on away-from-home participants for trip-related expenditures. For equipment and other expenditures the percent of wildlife-watching participants is based on total participants.2 Average expenditures are annual estimates.3 Information on trip-related expenditures was collected for away-from-home participants only. Equipment and other expenditures are based on information collected from both away-from-home and around-the-home participants.4 Boating costs include launching, mooring, storage, maintenance, insurance, pumpout fees, and fuel.
Note: Detail does not add to total because of multiple responses and nonresponse.

U.S. Fish and Wildlife Service and U.S. Census Bureau 2011 National Survey of Fishing, Hunting, and Wildlife-Associated Recreation 89
Table 41. Selected Characteristics of Participants of Wildlife-Watching Activities Away From Home: 2011(Population 16 years old and older. Numbers in thousands)
CharacteristicU.S. population Total wildlife-watching
participantsTotal away-from-home
participants
Number Percent NumberPercent who participated Percent Number
Percent who participated Percent
Total persons . . . . . . . . . . . . . . . . . . . . . . . . . . . . . . . . . . . . 239,313 100 71,776 30 100 22,496 9 100Population Density of Residence Urban . . . . . . . . . . . . . . . . . . . . . . . . . . . . . . . . . . . . . . . . . 180,723 76 46,973 26 65 15,974 9 71 Rural . . . . . . . . . . . . . . . . . . . . . . . . . . . . . . . . . . . . . . . . . 58,589 24 24,803 42 35 6,523 11 29Population Size of Residence Metropolitan Statistical Area (MSA) . . . . . . . . . . . . . . . . 224,025 94 65,664 29 91 20,651 9 92 1,000,000 or more . . . . . . . . . . . . . . . . . . . . . . . . . . . . . 127,462 53 33,070 26 46 10,672 8 47 250,000 to 999,999 . . . . . . . . . . . . . . . . . . . . . . . . . . . . 48,157 20 16,436 34 23 4,634 10 21 50,000 to 249,999 . . . . . . . . . . . . . . . . . . . . . . . . . . . . . 48,406 20 16,159 33 23 5,346 11 24 Outside MSA . . . . . . . . . . . . . . . . . . . . . . . . . . . . . . . . . . . 15,288 6 6,111 40 9 1,845 12 8Census Geographic Division New England . . . . . . . . . . . . . . . . . . . . . . . . . . . . . . . . . . . 11,593 5 3,954 34 6 1,187 10 5 Middle Atlantic . . . . . . . . . . . . . . . . . . . . . . . . . . . . . . . . . 32,392 14 9,118 28 13 2,561 8 11 East North Central . . . . . . . . . . . . . . . . . . . . . . . . . . . . . . . 36,199 15 12,840 35 18 3,168 9 14 West North Central . . . . . . . . . . . . . . . . . . . . . . . . . . . . . . 15,860 7 5,479 35 8 1,783 11 8 South Atlantic . . . . . . . . . . . . . . . . . . . . . . . . . . . . . . . . . . 46,417 19 13,315 29 19 4,393 9 20 East South Central . . . . . . . . . . . . . . . . . . . . . . . . . . . . . . . 14,206 6 4,663 33 6 1,456 10 6 West South Central . . . . . . . . . . . . . . . . . . . . . . . . . . . . . . 27,195 11 7,164 26 10 1,728 6 8 Mountain . . . . . . . . . . . . . . . . . . . . . . . . . . . . . . . . . . . . . . 17,013 7 5,189 30 7 2,230 13 10 Pacific . . . . . . . . . . . . . . . . . . . . . . . . . . . . . . . . . . . . . . . . 38,438 16 10,054 26 14 3,990 10 18Age 16 to 17 years . . . . . . . . . . . . . . . . . . . . . . . . . . . . . . . . . . 7,652 3 964 13 1 339 4 2 18 to 24 years . . . . . . . . . . . . . . . . . . . . . . . . . . . . . . . . . . 26,517 11 2,580 10 4 773 3 3 25 to 34 years . . . . . . . . . . . . . . . . . . . . . . . . . . . . . . . . . . 41,613 17 7,969 19 11 3,117 7 14 35 to 44 years . . . . . . . . . . . . . . . . . . . . . . . . . . . . . . . . . . 40,779 17 10,163 25 14 4,326 11 19 45 to 54 years . . . . . . . . . . . . . . . . . . . . . . . . . . . . . . . . . . 46,167 19 15,594 34 22 5,768 12 26 55 to 64 years . . . . . . . . . . . . . . . . . . . . . . . . . . . . . . . . . . 38,469 16 16,155 42 23 4,740 12 21 65 years and older . . . . . . . . . . . . . . . . . . . . . . . . . . . . . . . 38,117 16 18,351 48 26 3,433 9 15 65 to 74 years . . . . . . . . . . . . . . . . . . . . . . . . . . . . . . . . 22,655 9 12,044 53 17 2,722 12 12 75 and older . . . . . . . . . . . . . . . . . . . . . . . . . . . . . . . . . . 15,461 6 6,307 41 9 711 5 3Sex Male, total . . . . . . . . . . . . . . . . . . . . . . . . . . . . . . . . . . . . . 114,705 48 33,176 29 46 11,472 10 51 16 to 17 years . . . . . . . . . . . . . . . . . . . . . . . . . . . . . . . . 3,922 2 535 14 1 *162 *4 *1 18 to 24 years . . . . . . . . . . . . . . . . . . . . . . . . . . . . . . . . 12,909 5 1,281 10 2 490 4 2 25 to 34 years . . . . . . . . . . . . . . . . . . . . . . . . . . . . . . . . 20,350 9 3,590 18 5 1,500 7 7 35 to 44 years . . . . . . . . . . . . . . . . . . . . . . . . . . . . . . . . 19,738 8 5,269 27 7 2,455 12 11 45 to 54 years . . . . . . . . . . . . . . . . . . . . . . . . . . . . . . . . 22,426 9 7,228 32 10 2,797 12 12 55 to 64 years . . . . . . . . . . . . . . . . . . . . . . . . . . . . . . . . 18,252 8 7,361 40 10 2,340 13 10 65 years and older . . . . . . . . . . . . . . . . . . . . . . . . . . . . . 17,108 7 7,912 46 11 1,727 10 8 65 to 74 years . . . . . . . . . . . . . . . . . . . . . . . . . . . . . . 10,832 5 5,406 50 8 1,428 13 6 75 and older . . . . . . . . . . . . . . . . . . . . . . . . . . . . . . . . 6,276 3 2,505 40 3 299 5 1 Female, total . . . . . . . . . . . . . . . . . . . . . . . . . . . . . . . . . . . 124,608 52 38,600 31 54 11,025 9 49 16 to 17 years . . . . . . . . . . . . . . . . . . . . . . . . . . . . . . . . 3,730 2 429 12 1 *176 *5 *1 18 to 24 years . . . . . . . . . . . . . . . . . . . . . . . . . . . . . . . . 13,608 6 1,299 10 2 284 2 1 25 to 34 years . . . . . . . . . . . . . . . . . . . . . . . . . . . . . . . . 21,263 9 4,379 21 6 1,617 8 7 35 to 44 years . . . . . . . . . . . . . . . . . . . . . . . . . . . . . . . . 21,041 9 4,893 23 7 1,871 9 8 45 to 54 years . . . . . . . . . . . . . . . . . . . . . . . . . . . . . . . . 23,741 10 8,366 35 12 2,971 13 13 55 to 64 years . . . . . . . . . . . . . . . . . . . . . . . . . . . . . . . . 20,216 8 8,794 44 12 2,400 12 11 65 years and older . . . . . . . . . . . . . . . . . . . . . . . . . . . . . 21,008 9 10,439 50 15 1,706 8 8 65 to 74 years . . . . . . . . . . . . . . . . . . . . . . . . . . . . . . 11,824 5 6,638 56 9 1,294 11 6 75 and older . . . . . . . . . . . . . . . . . . . . . . . . . . . . . . . . 9,185 4 3,802 41 5 412 4 2Ethnicity Hispanic . . . . . . . . . . . . . . . . . . . . . . . . . . . . . . . . . . . . . . 32,557 14 3,723 11 5 1,442 4 6 Non-Hispanic . . . . . . . . . . . . . . . . . . . . . . . . . . . . . . . . . . 206,756 86 68,053 33 95 21,054 10 94Race White . . . . . . . . . . . . . . . . . . . . . . . . . . . . . . . . . . . . . . . . . 182,872 76 65,385 36 91 20,644 11 92 African American . . . . . . . . . . . . . . . . . . . . . . . . . . . . . . . 23,402 10 2,590 11 4 610 3 3 Asian American . . . . . . . . . . . . . . . . . . . . . . . . . . . . . . . . . 11,647 5 1,049 9 1 253 2 1 All others . . . . . . . . . . . . . . . . . . . . . . . . . . . . . . . . . . . . . . 21,392 9 2,752 13 4 989 5 4Annual Household Income Less than $20,000 . . . . . . . . . . . . . . . . . . . . . . . . . . . . . . . 30,550 13 6,768 22 9 1,622 5 7 $20,000 to $24,999 . . . . . . . . . . . . . . . . . . . . . . . . . . . . . . 12,713 5 3,564 28 5 838 7 4 $25,000 to $29,999 . . . . . . . . . . . . . . . . . . . . . . . . . . . . . . 10,441 4 2,385 23 3 663 6 3 $30,000 to $34,999 . . . . . . . . . . . . . . . . . . . . . . . . . . . . . . 11,504 5 4,046 35 6 756 7 3 $35,000 to $39,999 . . . . . . . . . . . . . . . . . . . . . . . . . . . . . . 11,441 5 3,326 29 5 1,018 9 5 $40,000 to $49,999 . . . . . . . . . . . . . . . . . . . . . . . . . . . . . . 17,091 7 5,166 30 7 1,691 10 8 $50,000 to $74,999 . . . . . . . . . . . . . . . . . . . . . . . . . . . . . . 33,850 14 12,685 37 18 4,773 14 21 $75,000 to $99,999 . . . . . . . . . . . . . . . . . . . . . . . . . . . . . . 25,236 11 8,950 35 12 3,769 15 17 $100,000 to $149,999 . . . . . . . . . . . . . . . . . . . . . . . . . . . . 23,790 10 8,700 37 12 2,775 12 12 $150,000 or more . . . . . . . . . . . . . . . . . . . . . . . . . . . . . . . 17,151 7 6,298 37 9 2,088 12 9 Not reported . . . . . . . . . . . . . . . . . . . . . . . . . . . . . . . . . . . 45,545 19 9,888 22 14 2,502 5 11Education 11 years or less . . . . . . . . . . . . . . . . . . . . . . . . . . . . . . . . . 31,574 13 5,575 18 8 1,237 4 5 12 years . . . . . . . . . . . . . . . . . . . . . . . . . . . . . . . . . . . . . . . 81,984 34 21,098 26 29 5,224 6 23 1 to 3 years of college . . . . . . . . . . . . . . . . . . . . . . . . . . . . 55,014 23 16,135 29 22 5,337 10 24 4 years of college . . . . . . . . . . . . . . . . . . . . . . . . . . . . . . . 42,552 18 16,066 38 22 5,436 13 24 5 years or more of college . . . . . . . . . . . . . . . . . . . . . . . . . 28,188 12 12,901 46 18 5,263 19 23See footnotes at end of table.

90 2011 National Survey of Fishing, Hunting, and Wildlife-Associated Recreation U.S. Fish and Wildlife Service and U.S. Census Bureau
Table 41. Selected Characteristics of Participants of Wildlife-Watching Activities Away From Home: 2011—Continued
(Population 16 years old and older. Numbers in thousands)
Characteristic
Away-from-home participantsObserve Photograph Feed
NumberPercent who participated Percent Number
Percent who participated Percent Number
Percent who participated Percent
Total persons . . . . . . . . . . . . . . . . . . . . . . . . . . . . . . 19,808 8 100 12,354 5 100 5,399 2 100
Population Density of Residence Urban . . . . . . . . . . . . . . . . . . . . . . . . . . . . . . . . . . . 14,100 8 71 9,302 5 75 3,675 2 68 Rural . . . . . . . . . . . . . . . . . . . . . . . . . . . . . . . . . . . 5,708 10 29 3,052 5 25 1,724 3 32
Population Size of Residence Metropolitan Statistical Area (MSA) . . . . . . . . . . 18,335 8 93 11,551 5 93 5,043 2 93 1,000,000 or more . . . . . . . . . . . . . . . . . . . . . . . 9,523 7 48 6,284 5 51 2,775 2 51 250,000 to 999,999 . . . . . . . . . . . . . . . . . . . . . . 4,059 8 20 2,646 5 21 782 2 14 50,000 to 249,999 . . . . . . . . . . . . . . . . . . . . . . . 4,753 10 24 2,621 5 21 1,487 3 28 Outside MSA . . . . . . . . . . . . . . . . . . . . . . . . . . . . . 1,473 10 7 803 5 7 356 2 7
Census Geographic Division New England . . . . . . . . . . . . . . . . . . . . . . . . . . . . . 1,126 10 6 761 7 6 178 2 3 Middle Atlantic . . . . . . . . . . . . . . . . . . . . . . . . . . . 2,200 7 11 1,182 4 10 *379 *1 *7 East North Central . . . . . . . . . . . . . . . . . . . . . . . . . 2,644 7 13 1,499 4 12 829 2 15 West North Central . . . . . . . . . . . . . . . . . . . . . . . . 1,589 10 8 999 6 8 411 3 8 South Atlantic . . . . . . . . . . . . . . . . . . . . . . . . . . . . 3,962 9 20 2,577 6 21 1,318 3 24 East South Central . . . . . . . . . . . . . . . . . . . . . . . . . 1,234 9 6 751 5 6 395 3 7 West South Central . . . . . . . . . . . . . . . . . . . . . . . . 1,615 6 8 874 3 7 888 3 16 Mountain . . . . . . . . . . . . . . . . . . . . . . . . . . . . . . . . 2,021 12 10 1,415 8 11 384 2 7 Pacific . . . . . . . . . . . . . . . . . . . . . . . . . . . . . . . . . . 3,417 9 17 2,295 6 19 616 2 11
Age 16 to 17 years . . . . . . . . . . . . . . . . . . . . . . . . . . . . *300 *4 *2 *228 *3 *2 ... ... ... 18 to 24 years . . . . . . . . . . . . . . . . . . . . . . . . . . . . 522 2 3 388 1 3 *257 *1 *5 25 to 34 years . . . . . . . . . . . . . . . . . . . . . . . . . . . . 2,825 7 14 1,704 4 14 960 2 18 35 to 44 years . . . . . . . . . . . . . . . . . . . . . . . . . . . . 3,586 9 18 2,045 5 17 900 2 17 45 to 54 years . . . . . . . . . . . . . . . . . . . . . . . . . . . . 5,041 11 25 3,641 8 29 1,501 3 28 55 to 64 years . . . . . . . . . . . . . . . . . . . . . . . . . . . . 4,363 11 22 2,525 7 20 949 2 18 65 years and older . . . . . . . . . . . . . . . . . . . . . . . . . 3,170 8 16 1,822 5 15 693 2 13 65 to 74 years . . . . . . . . . . . . . . . . . . . . . . . . . . 2,485 11 13 1,482 7 12 634 3 12 75 and older . . . . . . . . . . . . . . . . . . . . . . . . . . . . 685 4 3 340 2 3 *60 *(Z) *1
Sex Male, total . . . . . . . . . . . . . . . . . . . . . . . . . . . . . . . 9,716 8 49 5,920 5 48 2,602 2 48 16 to 17 years . . . . . . . . . . . . . . . . . . . . . . . . . . *126 *3 *1 ... ... ... ... ... ... 18 to 24 years . . . . . . . . . . . . . . . . . . . . . . . . . . 266 2 1 *228 *2 *2 ... ... ... 25 to 34 years . . . . . . . . . . . . . . . . . . . . . . . . . . 1,319 6 7 565 3 5 *493 *2 *9 35 to 44 years . . . . . . . . . . . . . . . . . . . . . . . . . . 2,008 10 10 998 5 8 435 2 8 45 to 54 years . . . . . . . . . . . . . . . . . . . . . . . . . . 2,337 10 12 1,828 8 15 650 3 12 55 to 64 years . . . . . . . . . . . . . . . . . . . . . . . . . . 2,121 12 11 1,246 7 10 483 3 9 65 years and older . . . . . . . . . . . . . . . . . . . . . . . 1,539 9 8 950 6 8 342 2 6 65 to 74 years . . . . . . . . . . . . . . . . . . . . . . . . 1,245 11 6 754 7 6 304 3 6 75 and older . . . . . . . . . . . . . . . . . . . . . . . . . . 294 5 1 *196 *3 *2 ... ... ... Female, total . . . . . . . . . . . . . . . . . . . . . . . . . . . . . 10,092 8 51 6,433 5 52 2,796 2 52 16 to 17 years . . . . . . . . . . . . . . . . . . . . . . . . . . *175 *5 *1 ... ... ... ... ... ... 18 to 24 years . . . . . . . . . . . . . . . . . . . . . . . . . . 256 2 1 *159 *1 *1 *98 *1 *2 25 to 34 years . . . . . . . . . . . . . . . . . . . . . . . . . . 1,506 7 8 1,139 5 9 467 2 9 35 to 44 years . . . . . . . . . . . . . . . . . . . . . . . . . . 1,579 8 8 1,046 5 8 465 2 9 45 to 54 years . . . . . . . . . . . . . . . . . . . . . . . . . . 2,704 11 14 1,814 8 15 851 4 16 55 to 64 years . . . . . . . . . . . . . . . . . . . . . . . . . . 2,242 11 11 1,279 6 10 466 2 9 65 years and older . . . . . . . . . . . . . . . . . . . . . . . 1,631 8 8 872 4 7 351 2 7 65 to 74 years . . . . . . . . . . . . . . . . . . . . . . . . 1,240 10 6 728 6 6 330 3 6 75 and older . . . . . . . . . . . . . . . . . . . . . . . . . . 391 4 2 *144 *2 *1 ... ... ...
Ethnicity Hispanic . . . . . . . . . . . . . . . . . . . . . . . . . . . . . . . . 1,207 4 6 932 3 8 *198 *1 *4 Non-Hispanic . . . . . . . . . . . . . . . . . . . . . . . . . . . . 18,602 9 94 11,422 6 92 5,201 3 96
Race White . . . . . . . . . . . . . . . . . . . . . . . . . . . . . . . . . . . 18,318 10 92 11,351 6 92 4,715 3 87 African American . . . . . . . . . . . . . . . . . . . . . . . . . 449 2 2 289 1 2 *318 *1 *6 Asian American . . . . . . . . . . . . . . . . . . . . . . . . . . . 193 2 1 *134 *1 *1 ... ... ... All others . . . . . . . . . . . . . . . . . . . . . . . . . . . . . . . . 848 4 4 580 3 5 301 1 6
Annual Household Income Less than $20,000 . . . . . . . . . . . . . . . . . . . . . . . . . 1,367 4 7 734 2 6 589 2 11 $20,000 to $24,999 . . . . . . . . . . . . . . . . . . . . . . . . 700 6 4 437 3 4 *194 *2 *4 $25,000 to $29,999 . . . . . . . . . . . . . . . . . . . . . . . . 630 6 3 508 5 4 *126 *1 *2 $30,000 to $34,999 . . . . . . . . . . . . . . . . . . . . . . . . 628 5 3 450 4 4 184 2 3 $35,000 to $39,999 . . . . . . . . . . . . . . . . . . . . . . . . 852 7 4 474 4 4 *282 *2 *5 $40,000 to $49,999 . . . . . . . . . . . . . . . . . . . . . . . . 1,496 9 8 856 5 7 445 3 8 $50,000 to $74,999 . . . . . . . . . . . . . . . . . . . . . . . . 3,994 12 20 2,410 7 20 1,146 3 21 $75,000 to $99,999 . . . . . . . . . . . . . . . . . . . . . . . . 3,408 14 17 2,124 8 17 1,130 4 21 $100,000 to $149,999 . . . . . . . . . . . . . . . . . . . . . . 2,544 11 13 1,644 7 13 395 2 7 $150,000 or more . . . . . . . . . . . . . . . . . . . . . . . . . 1,974 12 10 1,331 8 11 392 2 7 Not reported . . . . . . . . . . . . . . . . . . . . . . . . . . . . . 2,214 5 11 1,386 3 11 516 1 10
Education 11 years or less . . . . . . . . . . . . . . . . . . . . . . . . . . . 1,065 3 5 581 2 5 564 2 10 12 years . . . . . . . . . . . . . . . . . . . . . . . . . . . . . . . . . 4,149 5 21 2,514 3 20 1,518 2 28 1 to 3 years of college . . . . . . . . . . . . . . . . . . . . . . 4,712 9 24 2,753 5 22 1,375 2 25 4 years of college . . . . . . . . . . . . . . . . . . . . . . . . . 4,950 12 25 3,369 8 27 1,260 3 23 5 years or more of college . . . . . . . . . . . . . . . . . . . 4,933 18 25 3,136 11 25 681 2 13* Estimate based on a sample size of 10–29. … Sample size too small (less than 10) to report data reliably. (Z) Less than 0.5 percent.
Note: Detail does not add to total because of multiple responses. Percent who participated columns show the percent of each row’s population who participated in the activity named by the column. Percent columns show the percent of each column’s participants who are described by the row heading.
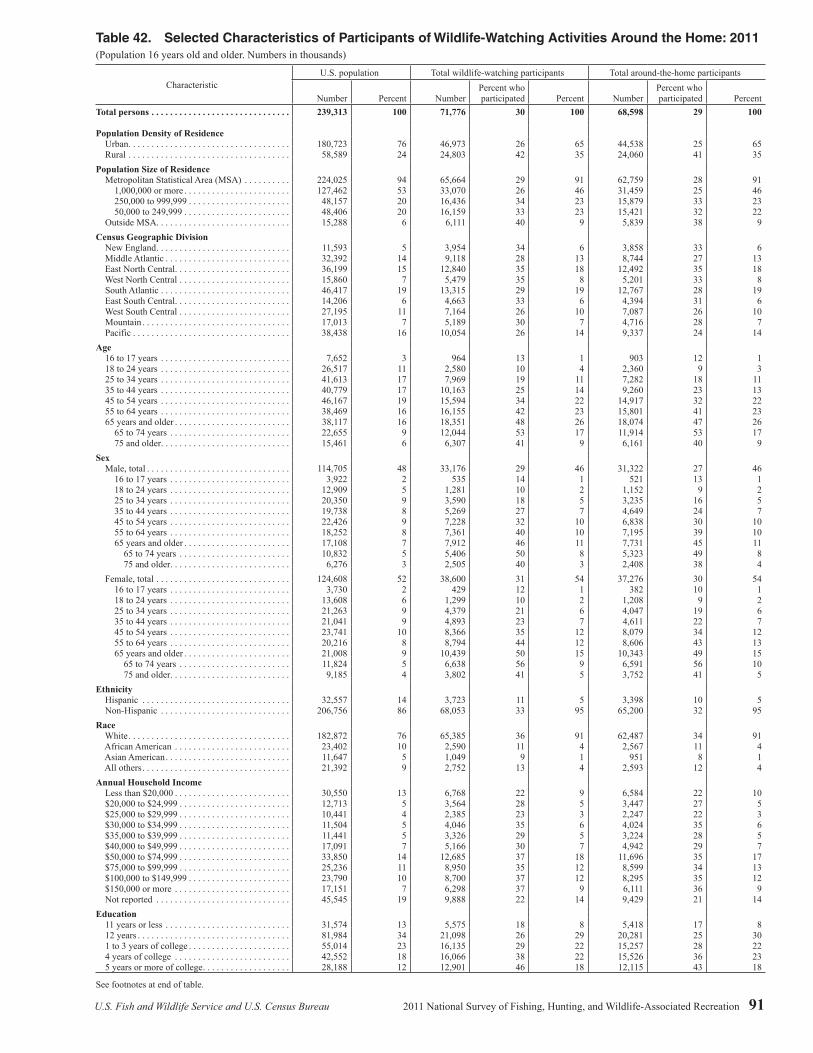
U.S. Fish and Wildlife Service and U.S. Census Bureau 2011 National Survey of Fishing, Hunting, and Wildlife-Associated Recreation 91
Table 42. Selected Characteristics of Participants of Wildlife-Watching Activities Around the Home: 2011(Population 16 years old and older. Numbers in thousands)
CharacteristicU.S. population Total wildlife-watching participants Total around-the-home participants
Number Percent NumberPercent who participated Percent Number
Percent who participated Percent
Total persons . . . . . . . . . . . . . . . . . . . . . . . . . . . . . . 239,313 100 71,776 30 100 68,598 29 100
Population Density of Residence Urban . . . . . . . . . . . . . . . . . . . . . . . . . . . . . . . . . . . 180,723 76 46,973 26 65 44,538 25 65 Rural . . . . . . . . . . . . . . . . . . . . . . . . . . . . . . . . . . . 58,589 24 24,803 42 35 24,060 41 35Population Size of Residence Metropolitan Statistical Area (MSA) . . . . . . . . . . 224,025 94 65,664 29 91 62,759 28 91 1,000,000 or more . . . . . . . . . . . . . . . . . . . . . . . 127,462 53 33,070 26 46 31,459 25 46 250,000 to 999,999 . . . . . . . . . . . . . . . . . . . . . . 48,157 20 16,436 34 23 15,879 33 23 50,000 to 249,999 . . . . . . . . . . . . . . . . . . . . . . . 48,406 20 16,159 33 23 15,421 32 22 Outside MSA . . . . . . . . . . . . . . . . . . . . . . . . . . . . . 15,288 6 6,111 40 9 5,839 38 9Census Geographic Division New England . . . . . . . . . . . . . . . . . . . . . . . . . . . . . 11,593 5 3,954 34 6 3,858 33 6 Middle Atlantic . . . . . . . . . . . . . . . . . . . . . . . . . . . 32,392 14 9,118 28 13 8,744 27 13 East North Central . . . . . . . . . . . . . . . . . . . . . . . . . 36,199 15 12,840 35 18 12,492 35 18 West North Central . . . . . . . . . . . . . . . . . . . . . . . . 15,860 7 5,479 35 8 5,201 33 8 South Atlantic . . . . . . . . . . . . . . . . . . . . . . . . . . . . 46,417 19 13,315 29 19 12,767 28 19 East South Central . . . . . . . . . . . . . . . . . . . . . . . . . 14,206 6 4,663 33 6 4,394 31 6 West South Central . . . . . . . . . . . . . . . . . . . . . . . . 27,195 11 7,164 26 10 7,087 26 10 Mountain . . . . . . . . . . . . . . . . . . . . . . . . . . . . . . . . 17,013 7 5,189 30 7 4,716 28 7 Pacific . . . . . . . . . . . . . . . . . . . . . . . . . . . . . . . . . . 38,438 16 10,054 26 14 9,337 24 14Age 16 to 17 years . . . . . . . . . . . . . . . . . . . . . . . . . . . . 7,652 3 964 13 1 903 12 1 18 to 24 years . . . . . . . . . . . . . . . . . . . . . . . . . . . . 26,517 11 2,580 10 4 2,360 9 3 25 to 34 years . . . . . . . . . . . . . . . . . . . . . . . . . . . . 41,613 17 7,969 19 11 7,282 18 11 35 to 44 years . . . . . . . . . . . . . . . . . . . . . . . . . . . . 40,779 17 10,163 25 14 9,260 23 13 45 to 54 years . . . . . . . . . . . . . . . . . . . . . . . . . . . . 46,167 19 15,594 34 22 14,917 32 22 55 to 64 years . . . . . . . . . . . . . . . . . . . . . . . . . . . . 38,469 16 16,155 42 23 15,801 41 23 65 years and older . . . . . . . . . . . . . . . . . . . . . . . . . 38,117 16 18,351 48 26 18,074 47 26 65 to 74 years . . . . . . . . . . . . . . . . . . . . . . . . . . 22,655 9 12,044 53 17 11,914 53 17 75 and older . . . . . . . . . . . . . . . . . . . . . . . . . . . . 15,461 6 6,307 41 9 6,161 40 9Sex Male, total . . . . . . . . . . . . . . . . . . . . . . . . . . . . . . . 114,705 48 33,176 29 46 31,322 27 46 16 to 17 years . . . . . . . . . . . . . . . . . . . . . . . . . . 3,922 2 535 14 1 521 13 1 18 to 24 years . . . . . . . . . . . . . . . . . . . . . . . . . . 12,909 5 1,281 10 2 1,152 9 2 25 to 34 years . . . . . . . . . . . . . . . . . . . . . . . . . . 20,350 9 3,590 18 5 3,235 16 5 35 to 44 years . . . . . . . . . . . . . . . . . . . . . . . . . . 19,738 8 5,269 27 7 4,649 24 7 45 to 54 years . . . . . . . . . . . . . . . . . . . . . . . . . . 22,426 9 7,228 32 10 6,838 30 10 55 to 64 years . . . . . . . . . . . . . . . . . . . . . . . . . . 18,252 8 7,361 40 10 7,195 39 10 65 years and older . . . . . . . . . . . . . . . . . . . . . . . 17,108 7 7,912 46 11 7,731 45 11 65 to 74 years . . . . . . . . . . . . . . . . . . . . . . . . 10,832 5 5,406 50 8 5,323 49 8 75 and older . . . . . . . . . . . . . . . . . . . . . . . . . . 6,276 3 2,505 40 3 2,408 38 4 Female, total . . . . . . . . . . . . . . . . . . . . . . . . . . . . . 124,608 52 38,600 31 54 37,276 30 54 16 to 17 years . . . . . . . . . . . . . . . . . . . . . . . . . . 3,730 2 429 12 1 382 10 1 18 to 24 years . . . . . . . . . . . . . . . . . . . . . . . . . . 13,608 6 1,299 10 2 1,208 9 2 25 to 34 years . . . . . . . . . . . . . . . . . . . . . . . . . . 21,263 9 4,379 21 6 4,047 19 6 35 to 44 years . . . . . . . . . . . . . . . . . . . . . . . . . . 21,041 9 4,893 23 7 4,611 22 7 45 to 54 years . . . . . . . . . . . . . . . . . . . . . . . . . . 23,741 10 8,366 35 12 8,079 34 12 55 to 64 years . . . . . . . . . . . . . . . . . . . . . . . . . . 20,216 8 8,794 44 12 8,606 43 13 65 years and older . . . . . . . . . . . . . . . . . . . . . . . 21,008 9 10,439 50 15 10,343 49 15 65 to 74 years . . . . . . . . . . . . . . . . . . . . . . . . 11,824 5 6,638 56 9 6,591 56 10 75 and older . . . . . . . . . . . . . . . . . . . . . . . . . . 9,185 4 3,802 41 5 3,752 41 5Ethnicity Hispanic . . . . . . . . . . . . . . . . . . . . . . . . . . . . . . . . 32,557 14 3,723 11 5 3,398 10 5 Non-Hispanic . . . . . . . . . . . . . . . . . . . . . . . . . . . . 206,756 86 68,053 33 95 65,200 32 95Race White . . . . . . . . . . . . . . . . . . . . . . . . . . . . . . . . . . . 182,872 76 65,385 36 91 62,487 34 91 African American . . . . . . . . . . . . . . . . . . . . . . . . . 23,402 10 2,590 11 4 2,567 11 4 Asian American . . . . . . . . . . . . . . . . . . . . . . . . . . . 11,647 5 1,049 9 1 951 8 1 All others . . . . . . . . . . . . . . . . . . . . . . . . . . . . . . . . 21,392 9 2,752 13 4 2,593 12 4Annual Household Income Less than $20,000 . . . . . . . . . . . . . . . . . . . . . . . . . 30,550 13 6,768 22 9 6,584 22 10 $20,000 to $24,999 . . . . . . . . . . . . . . . . . . . . . . . . 12,713 5 3,564 28 5 3,447 27 5 $25,000 to $29,999 . . . . . . . . . . . . . . . . . . . . . . . . 10,441 4 2,385 23 3 2,247 22 3 $30,000 to $34,999 . . . . . . . . . . . . . . . . . . . . . . . . 11,504 5 4,046 35 6 4,024 35 6 $35,000 to $39,999 . . . . . . . . . . . . . . . . . . . . . . . . 11,441 5 3,326 29 5 3,224 28 5 $40,000 to $49,999 . . . . . . . . . . . . . . . . . . . . . . . . 17,091 7 5,166 30 7 4,942 29 7 $50,000 to $74,999 . . . . . . . . . . . . . . . . . . . . . . . . 33,850 14 12,685 37 18 11,696 35 17 $75,000 to $99,999 . . . . . . . . . . . . . . . . . . . . . . . . 25,236 11 8,950 35 12 8,599 34 13 $100,000 to $149,999 . . . . . . . . . . . . . . . . . . . . . . 23,790 10 8,700 37 12 8,295 35 12 $150,000 or more . . . . . . . . . . . . . . . . . . . . . . . . . 17,151 7 6,298 37 9 6,111 36 9 Not reported . . . . . . . . . . . . . . . . . . . . . . . . . . . . . 45,545 19 9,888 22 14 9,429 21 14Education 11 years or less . . . . . . . . . . . . . . . . . . . . . . . . . . . 31,574 13 5,575 18 8 5,418 17 8 12 years . . . . . . . . . . . . . . . . . . . . . . . . . . . . . . . . . 81,984 34 21,098 26 29 20,281 25 30 1 to 3 years of college . . . . . . . . . . . . . . . . . . . . . . 55,014 23 16,135 29 22 15,257 28 22 4 years of college . . . . . . . . . . . . . . . . . . . . . . . . . 42,552 18 16,066 38 22 15,526 36 23 5 years or more of college . . . . . . . . . . . . . . . . . . . 28,188 12 12,901 46 18 12,115 43 18
See footnotes at end of table.

92 2011 National Survey of Fishing, Hunting, and Wildlife-Associated Recreation U.S. Fish and Wildlife Service and U.S. Census Bureau
Table 42. Selected Characteristics of Participants of Wildlife-Watching Activities Around the Home: 2011—Continued
(Population 16 years old and older. Numbers in thousands)
Characteristic
Around-the-home participantsObserve Photograph Feed wild birds
NumberPercent who participated Percent Number
Percent who participated Percent Number
Percent who participated Percent
Total persons . . . . . . . . . . . . . . . . . . . . . . . . . . . . . . . . . . . . . 45,046 19 100 25,370 11 100 50,217 21 100
Population Density of Residence Urban . . . . . . . . . . . . . . . . . . . . . . . . . . . . . . . . . . . . . . . . . . 28,670 16 64 16,895 9 67 31,106 17 62 Rural . . . . . . . . . . . . . . . . . . . . . . . . . . . . . . . . . . . . . . . . . . 16,376 28 36 8,475 14 33 19,111 33 38
Population Size of Residence Metropolitan Statistical Area (MSA) . . . . . . . . . . . . . . . . . 41,168 18 91 23,126 10 91 45,739 20 91 1,000,000 or more . . . . . . . . . . . . . . . . . . . . . . . . . . . . . . 20,309 16 45 11,867 9 47 22,417 18 45 250,000 to 999,999 . . . . . . . . . . . . . . . . . . . . . . . . . . . . . 10,220 21 23 5,575 12 22 11,656 24 23 50,000 to 249,999 . . . . . . . . . . . . . . . . . . . . . . . . . . . . . . 10,640 22 24 5,684 12 22 11,666 24 23 Outside MSA . . . . . . . . . . . . . . . . . . . . . . . . . . . . . . . . . . . . 3,878 25 9 2,243 15 9 4,478 29 9
Census Geographic Division New England . . . . . . . . . . . . . . . . . . . . . . . . . . . . . . . . . . . . 2,630 23 6 1,688 15 7 2,938 25 6 Middle Atlantic . . . . . . . . . . . . . . . . . . . . . . . . . . . . . . . . . . 6,231 19 14 3,269 10 13 6,089 19 12 East North Central . . . . . . . . . . . . . . . . . . . . . . . . . . . . . . . . 7,530 21 17 4,599 13 18 9,874 27 20 West North Central . . . . . . . . . . . . . . . . . . . . . . . . . . . . . . . 3,328 21 7 1,848 12 7 3,992 25 8 South Atlantic . . . . . . . . . . . . . . . . . . . . . . . . . . . . . . . . . . . 7,863 17 17 4,346 9 17 9,493 20 19 East South Central . . . . . . . . . . . . . . . . . . . . . . . . . . . . . . . . 2,765 19 6 1,292 9 5 3,560 25 7 West South Central . . . . . . . . . . . . . . . . . . . . . . . . . . . . . . . 4,979 18 11 2,412 9 10 5,545 20 11 Mountain . . . . . . . . . . . . . . . . . . . . . . . . . . . . . . . . . . . . . . . 3,346 20 7 2,057 12 8 3,049 18 6 Pacific . . . . . . . . . . . . . . . . . . . . . . . . . . . . . . . . . . . . . . . . . 6,374 17 14 3,858 10 15 5,677 15 11
Age 16 to 17 years . . . . . . . . . . . . . . . . . . . . . . . . . . . . . . . . . . . 399 5 1 452 6 2 453 6 1 18 to 24 years . . . . . . . . . . . . . . . . . . . . . . . . . . . . . . . . . . . 1398 5 3 748 3 3 1287 5 3 25 to 34 years . . . . . . . . . . . . . . . . . . . . . . . . . . . . . . . . . . . 4087 10 9 3181 8 13 4511 11 9 35 to 44 years . . . . . . . . . . . . . . . . . . . . . . . . . . . . . . . . . . . 6014 15 13 3969 10 16 5802 14 12 45 to 54 years . . . . . . . . . . . . . . . . . . . . . . . . . . . . . . . . . . . 9608 21 21 6212 13 24 10642 23 21 55 to 64 years . . . . . . . . . . . . . . . . . . . . . . . . . . . . . . . . . . . 10757 28 24 6174 16 24 12222 32 24 65 years and older . . . . . . . . . . . . . . . . . . . . . . . . . . . . . . . . 12783 34 28 4635 12 18 15300 40 30 65 to 74 years . . . . . . . . . . . . . . . . . . . . . . . . . . . . . . . . . 8734 39 19 3714 16 15 9946 44 20 75 and older . . . . . . . . . . . . . . . . . . . . . . . . . . . . . . . . . . . 4048 26 9 921 6 4 5354 35 11
Sex Male, total . . . . . . . . . . . . . . . . . . . . . . . . . . . . . . . . . . . . . . 19,525 17 43 11,995 10 47 21,404 19 43 16 to 17 years . . . . . . . . . . . . . . . . . . . . . . . . . . . . . . . . . *250 *6 *1 *273 *7 *1 *204 *5 *(Z) 18 to 24 years . . . . . . . . . . . . . . . . . . . . . . . . . . . . . . . . . 658 5 1 458 4 2 361 3 1 25 to 34 years . . . . . . . . . . . . . . . . . . . . . . . . . . . . . . . . . 1,752 9 4 1,282 6 5 2,002 10 4 35 to 44 years . . . . . . . . . . . . . . . . . . . . . . . . . . . . . . . . . 2,852 14 6 1,851 9 7 2,513 13 5 45 to 54 years . . . . . . . . . . . . . . . . . . . . . . . . . . . . . . . . . 3,947 18 9 3,086 14 12 4,594 20 9 55 to 64 years . . . . . . . . . . . . . . . . . . . . . . . . . . . . . . . . . 4,959 27 11 2,718 15 11 5,374 29 11 65 years and older . . . . . . . . . . . . . . . . . . . . . . . . . . . . . . 5,106 30 11 2,328 14 9 6,356 37 13 65 to 74 years . . . . . . . . . . . . . . . . . . . . . . . . . . . . . . . 3,697 34 8 1,826 17 7 4,178 39 8 75 and older . . . . . . . . . . . . . . . . . . . . . . . . . . . . . . . . . 1,409 22 3 502 8 2 2,178 35 4 Female, total . . . . . . . . . . . . . . . . . . . . . . . . . . . . . . . . . . . . 25,521 20 57 13,374 11 53 28,813 23 57 16 to 17 years . . . . . . . . . . . . . . . . . . . . . . . . . . . . . . . . . *149 *4 *(Z) *179 *5 *1 *249 *7 *(Z) 18 to 24 years . . . . . . . . . . . . . . . . . . . . . . . . . . . . . . . . . 739 5 2 290 2 1 926 7 2 25 to 34 years . . . . . . . . . . . . . . . . . . . . . . . . . . . . . . . . . 2,336 11 5 1,898 9 7 2,508 12 5 35 to 44 years . . . . . . . . . . . . . . . . . . . . . . . . . . . . . . . . . 3,162 15 7 2,118 10 8 3,289 16 7 45 to 54 years . . . . . . . . . . . . . . . . . . . . . . . . . . . . . . . . . 5,661 24 13 3,126 13 12 6,049 25 12 55 to 64 years . . . . . . . . . . . . . . . . . . . . . . . . . . . . . . . . . 5,798 29 13 3,456 17 14 6,848 34 14 65 years and older . . . . . . . . . . . . . . . . . . . . . . . . . . . . . . 7,677 37 17 2,307 11 9 8,944 43 18 65 to 74 years . . . . . . . . . . . . . . . . . . . . . . . . . . . . . . . 5,038 43 11 1,888 16 7 5,767 49 11 75 and older . . . . . . . . . . . . . . . . . . . . . . . . . . . . . . . . . 2,639 29 6 419 5 2 3,176 35 6
Ethnicity Hispanic . . . . . . . . . . . . . . . . . . . . . . . . . . . . . . . . . . . . . . . 2,223 7 5 1,276 4 5 2,640 8 5 Non-Hispanic . . . . . . . . . . . . . . . . . . . . . . . . . . . . . . . . . . . 42,823 21 95 24,094 12 95 47,576 23 95
Race White . . . . . . . . . . . . . . . . . . . . . . . . . . . . . . . . . . . . . . . . . . 41,269 23 92 23,396 13 92 46,225 25 92 African American . . . . . . . . . . . . . . . . . . . . . . . . . . . . . . . . 1,750 7 4 716 3 3 1,518 6 3 Asian American . . . . . . . . . . . . . . . . . . . . . . . . . . . . . . . . . . 323 3 1 368 3 1 620 5 1 All others . . . . . . . . . . . . . . . . . . . . . . . . . . . . . . . . . . . . . . . 1,704 8 4 890 4 4 1,854 9 4
Annual Household Income Less than $20,000 . . . . . . . . . . . . . . . . . . . . . . . . . . . . . . . . 4,414 14 10 1,656 5 7 4,603 15 9 $20,000 to $24,999 . . . . . . . . . . . . . . . . . . . . . . . . . . . . . . . 2,113 17 5 1,032 8 4 2,835 22 6 $25,000 to $29,999 . . . . . . . . . . . . . . . . . . . . . . . . . . . . . . . 1,370 13 3 598 6 2 1,805 17 4 $30,000 to $34,999 . . . . . . . . . . . . . . . . . . . . . . . . . . . . . . . 2,791 24 6 893 8 4 3,162 27 6 $35,000 to $39,999 . . . . . . . . . . . . . . . . . . . . . . . . . . . . . . . 2,102 18 5 1,157 10 5 2,293 20 5 $40,000 to $49,999 . . . . . . . . . . . . . . . . . . . . . . . . . . . . . . . 3,562 21 8 1,916 11 8 3,596 21 7 $50,000 to $74,999 . . . . . . . . . . . . . . . . . . . . . . . . . . . . . . . 7,544 22 17 5,063 15 20 8,345 25 17 $75,000 to $99,999 . . . . . . . . . . . . . . . . . . . . . . . . . . . . . . . 5,788 23 13 3,674 15 14 6,362 25 13 $100,000 to $149,999 . . . . . . . . . . . . . . . . . . . . . . . . . . . . . 5,488 23 12 3,728 16 15 5,620 24 11 $150,000 or more . . . . . . . . . . . . . . . . . . . . . . . . . . . . . . . . 3,683 21 8 2,792 16 11 4,223 25 8 Not reported . . . . . . . . . . . . . . . . . . . . . . . . . . . . . . . . . . . . 6,192 14 14 2,862 6 11 7,374 16 15
Education 11 years or less . . . . . . . . . . . . . . . . . . . . . . . . . . . . . . . . . . 3,414 11 8 1,228 4 5 4,011 13 8 12 years . . . . . . . . . . . . . . . . . . . . . . . . . . . . . . . . . . . . . . . . 12,933 16 29 6,225 8 25 16,061 20 32 1 to 3 years of college . . . . . . . . . . . . . . . . . . . . . . . . . . . . . 10,026 18 22 6,002 11 24 10,963 20 22 4 years of college . . . . . . . . . . . . . . . . . . . . . . . . . . . . . . . . 10,211 24 23 6,345 15 25 11,479 27 23 5 years or more of college . . . . . . . . . . . . . . . . . . . . . . . . . . 8,462 30 19 5,569 20 22 7,701 27 15
* Estimate based on a sample size of 10–29. (Z) Less than 0.5 percent.
Note: Detail does not add to total because of multiple responses and nonresponse. Percent who participated columns show the percent of each row’s population who participated in the activity named by the column. Percent columns show the percent of each column’s participants who are described by the row heading.
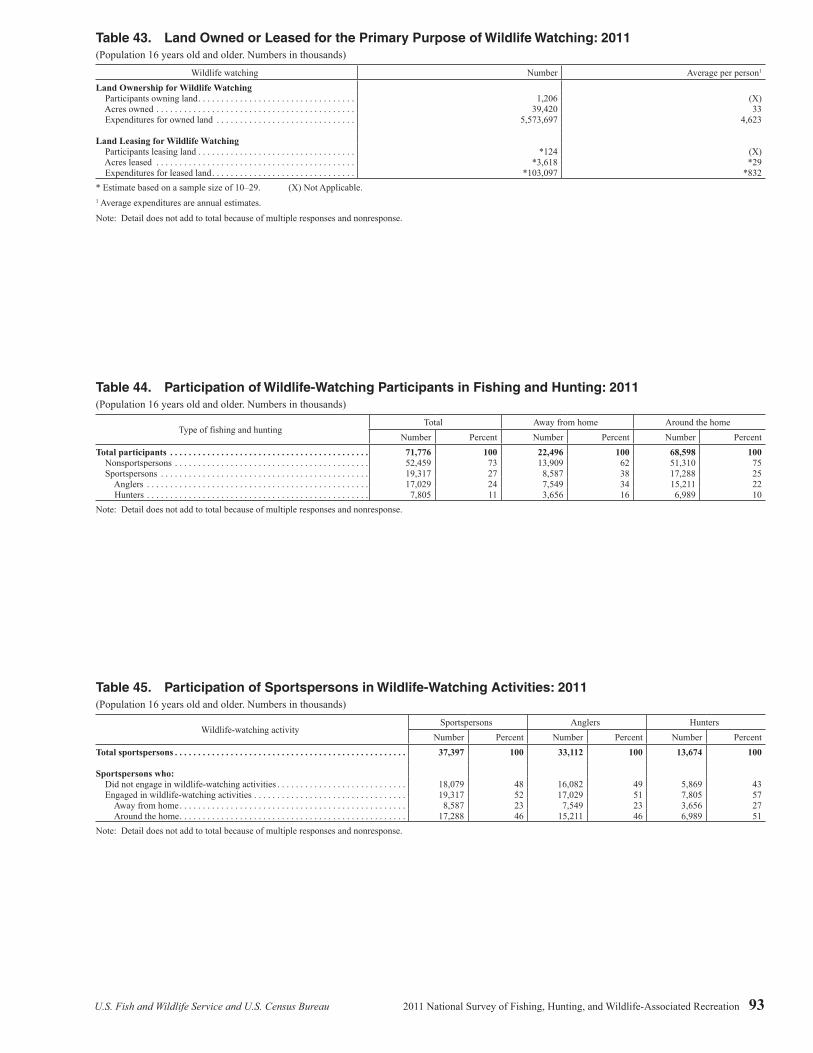
U.S. Fish and Wildlife Service and U.S. Census Bureau 2011 National Survey of Fishing, Hunting, and Wildlife-Associated Recreation 93
Table 43. Land Owned or Leased for the Primary Purpose of Wildlife Watching: 2011(Population 16 years old and older. Numbers in thousands)
Wildlife watching Number Average per person1
Land Ownership for Wildlife Watching Participants owning land . . . . . . . . . . . . . . . . . . . . . . . . . . . . . . . . . . 1,206 (X) Acres owned . . . . . . . . . . . . . . . . . . . . . . . . . . . . . . . . . . . . . . . . . . . 39,420 33 Expenditures for owned land . . . . . . . . . . . . . . . . . . . . . . . . . . . . . . 5,573,697 4,623
Land Leasing for Wildlife Watching Participants leasing land . . . . . . . . . . . . . . . . . . . . . . . . . . . . . . . . . . *124 (X) Acres leased . . . . . . . . . . . . . . . . . . . . . . . . . . . . . . . . . . . . . . . . . . . *3,618 *29 Expenditures for leased land . . . . . . . . . . . . . . . . . . . . . . . . . . . . . . . *103,097 *832* Estimate based on a sample size of 10–29. (X) Not Applicable.1 Average expenditures are annual estimates.
Note: Detail does not add to total because of multiple responses and nonresponse.
Table 44. Participation of Wildlife-Watching Participants in Fishing and Hunting: 2011(Population 16 years old and older. Numbers in thousands)
Type of fishing and huntingTotal Away from home Around the home
Number Percent Number Percent Number PercentTotal participants . . . . . . . . . . . . . . . . . . . . . . . . . . . . . . . . . . . . . . . . . . . 71,776 100 22,496 100 68,598 100 Nonsportspersons . . . . . . . . . . . . . . . . . . . . . . . . . . . . . . . . . . . . . . . . . . 52,459 73 13,909 62 51,310 75 Sportspersons . . . . . . . . . . . . . . . . . . . . . . . . . . . . . . . . . . . . . . . . . . . . . 19,317 27 8,587 38 17,288 25 Anglers . . . . . . . . . . . . . . . . . . . . . . . . . . . . . . . . . . . . . . . . . . . . . . . . 17,029 24 7,549 34 15,211 22 Hunters . . . . . . . . . . . . . . . . . . . . . . . . . . . . . . . . . . . . . . . . . . . . . . . . 7,805 11 3,656 16 6,989 10 Note: Detail does not add to total because of multiple responses and nonresponse.
Table 45. Participation of Sportspersons in Wildlife-Watching Activities: 2011(Population 16 years old and older. Numbers in thousands)
Wildlife-watching activitySportspersons Anglers Hunters
Number Percent Number Percent Number PercentTotal sportspersons . . . . . . . . . . . . . . . . . . . . . . . . . . . . . . . . . . . . . . . . . . . . . . . . . . 37,397 100 33,112 100 13,674 100
Sportspersons who: Did not engage in wildlife-watching activities . . . . . . . . . . . . . . . . . . . . . . . . . . . . 18,079 48 16,082 49 5,869 43 Engaged in wildlife-watching activities . . . . . . . . . . . . . . . . . . . . . . . . . . . . . . . . . 19,317 52 17,029 51 7,805 57 Away from home . . . . . . . . . . . . . . . . . . . . . . . . . . . . . . . . . . . . . . . . . . . . . . . . . 8,587 23 7,549 23 3,656 27 Around the home . . . . . . . . . . . . . . . . . . . . . . . . . . . . . . . . . . . . . . . . . . . . . . . . . 17,288 46 15,211 46 6,989 51Note: Detail does not add to total because of multiple responses and nonresponse.

94 2011 National Survey of Fishing, Hunting, and Wildlife-Associated Recreation U.S. Fish and Wildlife Service and U.S. Census Bureau
Table 46. Participation in Wildlife-Related Recreation by State Residents Both Inside and Outside Their Resident State: 2011
(Population 16 years old and older. Numbers in thousands)
Participant’s state of residence
Population
Total participants Sportspersons Wildlife-watching participation
NumberPercent of population Number
Percent of population Number
Percent of population
United States, total . . . . . . . . . . . . . . . . 239,313 90,108 38 37,397 16 71,776 30
Alabama . . . . . . . . . . . . . . . . . . . . . . . 3,664 1,490 41 744 20 1,079 29 Alaska . . . . . . . . . . . . . . . . . . . . . . . . . 526 337 64 235 45 247 47 Arizona . . . . . . . . . . . . . . . . . . . . . . . . 5,084 1,660 33 721 14 1,281 25 Arkansas . . . . . . . . . . . . . . . . . . . . . . . 2,238 1,119 50 572 26 828 37 California . . . . . . . . . . . . . . . . . . . . . . 28,562 7,360 26 1,898 7 6,475 23
Colorado . . . . . . . . . . . . . . . . . . . . . . . 3,946 1,854 47 727 18 1,456 37 Connecticut . . . . . . . . . . . . . . . . . . . . . 2,781 1,204 43 347 12 1,093 39 Delaware . . . . . . . . . . . . . . . . . . . . . . . 699 260 37 101 14 209 30 Florida . . . . . . . . . . . . . . . . . . . . . . . . . 14,855 4,652 31 2,068 14 3,598 24 Georgia . . . . . . . . . . . . . . . . . . . . . . . . 7,459 2,752 37 981 13 2,206 30
Hawaii . . . . . . . . . . . . . . . . . . . . . . . . . 995 222 22 108 11 161 16 Idaho . . . . . . . . . . . . . . . . . . . . . . . . . . 1,172 638 54 331 28 464 40 Illinois . . . . . . . . . . . . . . . . . . . . . . . . . 9,988 3,493 35 1,487 15 2,784 28 Indiana . . . . . . . . . . . . . . . . . . . . . . . . . 4,965 2,131 43 842 17 1,681 34 Iowa . . . . . . . . . . . . . . . . . . . . . . . . . . . 2,363 1,097 46 586 25 780 33
Kansas . . . . . . . . . . . . . . . . . . . . . . . . . 2,163 1,011 47 453 21 776 36 Kentucky . . . . . . . . . . . . . . . . . . . . . . . 3,376 1,470 44 643 19 1,221 36 Louisiana . . . . . . . . . . . . . . . . . . . . . . . 3,449 1,380 40 802 23 840 24 Maine . . . . . . . . . . . . . . . . . . . . . . . . . 1,066 520 49 233 22 401 38 Maryland . . . . . . . . . . . . . . . . . . . . . . . 4,480 1,396 31 426 9 1,224 27
Massachusetts . . . . . . . . . . . . . . . . . . . 5,320 1,779 33 464 9 1,530 29 Michigan . . . . . . . . . . . . . . . . . . . . . . . 7,787 3,709 48 1,636 21 3,067 39 Minnesota . . . . . . . . . . . . . . . . . . . . . . 4,133 2,107 51 1,400 34 1,498 36 Mississippi . . . . . . . . . . . . . . . . . . . . . 2,220 1,017 46 700 32 630 28 Missouri . . . . . . . . . . . . . . . . . . . . . . . 4,667 2,105 45 1,001 21 1,645 35
Montana . . . . . . . . . . . . . . . . . . . . . . . 777 334 43 223 29 258 33 Nebraska . . . . . . . . . . . . . . . . . . . . . . . 1,387 499 36 258 19 362 26 Nevada . . . . . . . . . . . . . . . . . . . . . . . . 2,024 594 29 171 8 504 25 New Hampshire . . . . . . . . . . . . . . . . . 1,066 470 44 168 16 388 36 New Jersey . . . . . . . . . . . . . . . . . . . . . 6,852 2,057 30 709 10 1,708 25
New Mexico . . . . . . . . . . . . . . . . . . . . 1,551 592 38 252 16 486 31 New York . . . . . . . . . . . . . . . . . . . . . . 15,503 5,143 33 1,980 13 4,081 26 North Carolina . . . . . . . . . . . . . . . . . . 7,264 2,717 37 1,394 19 2,124 29 North Dakota . . . . . . . . . . . . . . . . . . . . (NA) (NA) (NA) (NA) (NA) (NA) (NA) Ohio. . . . . . . . . . . . . . . . . . . . . . . . . . . 8,999 4,078 45 1,603 18 3,155 35
Oklahoma . . . . . . . . . . . . . . . . . . . . . . 2,828 1,549 55 770 27 1,233 44 Oregon . . . . . . . . . . . . . . . . . . . . . . . . . 3,061 1,396 46 444 15 1,239 40 Pennsylvania . . . . . . . . . . . . . . . . . . . . 10,036 4,063 40 1,277 13 3,329 33 Rhode Island . . . . . . . . . . . . . . . . . . . . 848 309 36 94 11 270 32 South Carolina . . . . . . . . . . . . . . . . . . 3,555 1,299 37 615 17 944 27
South Dakota . . . . . . . . . . . . . . . . . . . . 631 371 59 190 30 267 42 Tennessee . . . . . . . . . . . . . . . . . . . . . . 4,945 2,121 43 923 19 1,733 35 Texas . . . . . . . . . . . . . . . . . . . . . . . . . . 18,681 5,888 32 2,711 15 4,263 23 Utah . . . . . . . . . . . . . . . . . . . . . . . . . . . 2,036 784 39 406 20 558 27 Vermont . . . . . . . . . . . . . . . . . . . . . . . . 512 316 62 134 26 273 53
Virginia . . . . . . . . . . . . . . . . . . . . . . . . 6,136 2,580 42 842 14 2,212 36 Washington . . . . . . . . . . . . . . . . . . . . . 5,293 2,311 44 968 18 1,932 37 West Virginia . . . . . . . . . . . . . . . . . . . . 1,464 868 59 322 22 751 51 Wisconsin . . . . . . . . . . . . . . . . . . . . . . 4,460 2,499 56 1,198 27 2,152 48 Wyoming . . . . . . . . . . . . . . . . . . . . . . . 424 250 59 145 34 182 43(NA) Not available.
Note: Detail does not add to total because of multiple responses. U.S. totals include responses from participants residing in the District of Columbia, as described in Appendix D.

U.S. Fish and Wildlife Service and U.S. Census Bureau 2011 National Survey of Fishing, Hunting, and Wildlife-Associated Recreation 95
Table 47. Participation in Wildlife-Related Recreation in Each State by Both Residents and Nonresidents of the State: 2011
(Population 16 years old and older. Numbers in thousands)
State where activity took placeTotal participants Sportspersons Wildlife-watching participantsNumber Percent Number Percent Number Percent
United States, total . . . . . . . . . . . . . . . . . . . . . . . . . . . . 90,108 100 37,397 42 71,776 80
Alabama . . . . . . . . . . . . . . . . . . . . . . . . . . . . . . . . . . . 1,732 100 948 55 1,114 64 Alaska . . . . . . . . . . . . . . . . . . . . . . . . . . . . . . . . . . . . . 1,014 100 563 55 640 63 Arizona . . . . . . . . . . . . . . . . . . . . . . . . . . . . . . . . . . . . 2,136 100 786 37 1,566 73 Arkansas . . . . . . . . . . . . . . . . . . . . . . . . . . . . . . . . . . . 1,323 100 696 53 852 64 California . . . . . . . . . . . . . . . . . . . . . . . . . . . . . . . . . . 7,849 100 1,820 23 6,733 86
Colorado . . . . . . . . . . . . . . . . . . . . . . . . . . . . . . . . . . . 2,315 100 919 40 1,782 77 Connecticut . . . . . . . . . . . . . . . . . . . . . . . . . . . . . . . . . 1,361 100 350 26 1,178 87 Delaware . . . . . . . . . . . . . . . . . . . . . . . . . . . . . . . . . . . 344 100 177 52 243 71 Florida . . . . . . . . . . . . . . . . . . . . . . . . . . . . . . . . . . . . . 6,354 100 3,152 50 4,308 68 Georgia . . . . . . . . . . . . . . . . . . . . . . . . . . . . . . . . . . . . 3,058 100 1,059 35 2,393 78
Hawaii . . . . . . . . . . . . . . . . . . . . . . . . . . . . . . . . . . . . . 465 100 158 34 358 77 Idaho . . . . . . . . . . . . . . . . . . . . . . . . . . . . . . . . . . . . . . 838 100 534 64 558 67 Illinois . . . . . . . . . . . . . . . . . . . . . . . . . . . . . . . . . . . . . 3,799 100 1,309 34 3,019 79 Indiana . . . . . . . . . . . . . . . . . . . . . . . . . . . . . . . . . . . . . 2,308 100 867 38 1,719 74 Iowa . . . . . . . . . . . . . . . . . . . . . . . . . . . . . . . . . . . . . . . 1,255 100 598 48 837 67
Kansas . . . . . . . . . . . . . . . . . . . . . . . . . . . . . . . . . . . . . 1,156 100 527 46 792 69 Kentucky . . . . . . . . . . . . . . . . . . . . . . . . . . . . . . . . . . . 1,710 100 713 42 1,319 77 Louisiana . . . . . . . . . . . . . . . . . . . . . . . . . . . . . . . . . . . 1,709 100 904 53 1,010 59 Maine . . . . . . . . . . . . . . . . . . . . . . . . . . . . . . . . . . . . . 1,117 100 413 37 838 75 Maryland . . . . . . . . . . . . . . . . . . . . . . . . . . . . . . . . . . . 1,613 100 445 28 1,362 84
Massachusetts . . . . . . . . . . . . . . . . . . . . . . . . . . . . . . . 2,199 100 538 24 1,828 83 Michigan . . . . . . . . . . . . . . . . . . . . . . . . . . . . . . . . . . . 4,397 100 1,938 44 3,199 73 Minnesota . . . . . . . . . . . . . . . . . . . . . . . . . . . . . . . . . . 2,518 100 1,649 65 1,577 63 Mississippi . . . . . . . . . . . . . . . . . . . . . . . . . . . . . . . . . 1,350 100 782 58 781 58 Missouri . . . . . . . . . . . . . . . . . . . . . . . . . . . . . . . . . . . 2,494 100 1,277 51 1,716 69
Montana . . . . . . . . . . . . . . . . . . . . . . . . . . . . . . . . . . . 570 100 335 59 402 71 Nebraska . . . . . . . . . . . . . . . . . . . . . . . . . . . . . . . . . . . 558 100 289 52 384 69 Nevada . . . . . . . . . . . . . . . . . . . . . . . . . . . . . . . . . . . . 734 100 163 22 643 88 New Hampshire . . . . . . . . . . . . . . . . . . . . . . . . . . . . . 786 100 247 31 630 80 New Jersey . . . . . . . . . . . . . . . . . . . . . . . . . . . . . . . . . 2,438 100 794 33 1,875 77
New Mexico . . . . . . . . . . . . . . . . . . . . . . . . . . . . . . . . 783 100 304 39 566 72 New York . . . . . . . . . . . . . . . . . . . . . . . . . . . . . . . . . . 5,536 100 2,109 38 4,239 77 North Carolina . . . . . . . . . . . . . . . . . . . . . . . . . . . . . . 3,497 100 1,631 47 2,432 70 North Dakota . . . . . . . . . . . . . . . . . . . . . . . . . . . . . . . . (NA) (NA) (NA) (NA) (NA) (NA) Ohio. . . . . . . . . . . . . . . . . . . . . . . . . . . . . . . . . . . . . . . 4,344 100 1,561 36 3,197 74
Oklahoma . . . . . . . . . . . . . . . . . . . . . . . . . . . . . . . . . . 1,727 100 779 45 1,263 73 Oregon . . . . . . . . . . . . . . . . . . . . . . . . . . . . . . . . . . . . . 1,786 100 703 39 1,440 81 Pennsylvania . . . . . . . . . . . . . . . . . . . . . . . . . . . . . . . . 4,564 100 1,424 31 3,598 79 Rhode Island . . . . . . . . . . . . . . . . . . . . . . . . . . . . . . . . 402 100 179 45 308 77 South Carolina . . . . . . . . . . . . . . . . . . . . . . . . . . . . . . 1,729 100 847 49 1,103 64
South Dakota . . . . . . . . . . . . . . . . . . . . . . . . . . . . . . . . 662 100 430 65 384 58 Tennessee . . . . . . . . . . . . . . . . . . . . . . . . . . . . . . . . . . 2,584 100 994 38 1,955 76 Texas . . . . . . . . . . . . . . . . . . . . . . . . . . . . . . . . . . . . . . 6,305 100 2,713 43 4,376 69 Utah . . . . . . . . . . . . . . . . . . . . . . . . . . . . . . . . . . . . . . . 1,015 100 493 49 717 71 Vermont . . . . . . . . . . . . . . . . . . . . . . . . . . . . . . . . . . . . 512 100 254 50 370 72
Virginia . . . . . . . . . . . . . . . . . . . . . . . . . . . . . . . . . . . . 3,269 100 1,068 33 2,509 77 Washington . . . . . . . . . . . . . . . . . . . . . . . . . . . . . . . . . 2,756 100 1,005 36 2,168 79 West Virginia . . . . . . . . . . . . . . . . . . . . . . . . . . . . . . . . 1,176 100 447 38 850 72 Wisconsin . . . . . . . . . . . . . . . . . . . . . . . . . . . . . . . . . . 3,500 100 1,554 44 2,359 67 Wyoming . . . . . . . . . . . . . . . . . . . . . . . . . . . . . . . . . . . 775 100 390 50 518 67* Estimate based on a sample size of 10–29. (NA) Not available.
Note: Detail does not add to total because of multiple responses. U.S. totals include responses from participants residing in the District of Columbia, as described in Appendix D.

96 2011 National Survey of Fishing, Hunting, and Wildlife-Associated Recreation U.S. Fish and Wildlife Service and U.S. Census Bureau
Table 48. Expenditures for Wildlife-Related Recreation by State Where Spending Took Place: 2011(Population 16 years old and older. Expenditures in thousands of dollars)
State where spending took placeTotal, wildlife-related expenditures Fishing and hunting expenditures
Total Trip-related Equipment Other Total Trip-related Equipment OtherUnited States, total . . . . . . . . . . . . . . . . 144,651,796 49,485,328 80,843,000 24,788,145 89,761,524 32,210,653 43,227,403 14,323,468
Alabama . . . . . . . . . . . . . . . . . . . . . . . 2,665,172 763,220 1,711,316 190,636 1,930,968 722,029 1,043,040 165,898 Alaska . . . . . . . . . . . . . . . . . . . . . . . . . 3,339,913 2,666,145 630,715 43,053 1,281,558 695,800 551,230 34,528 Arizona . . . . . . . . . . . . . . . . . . . . . . . . 2,367,995 897,293 1,144,520 326,181 1,432,115 506,095 808,438 117,582 Arkansas . . . . . . . . . . . . . . . . . . . . . . . 1,775,635 691,310 810,190 274,135 1,559,561 656,790 653,616 249,155 California . . . . . . . . . . . . . . . . . . . . . . 7,496,449 3,903,886 2,917,174 675,389 3,718,773 2,122,206 1,431,197 165,370
Colorado . . . . . . . . . . . . . . . . . . . . . . . 2,975,305 1,239,959 1,549,645 185,701 1,543,221 624,323 827,397 91,501 Connecticut . . . . . . . . . . . . . . . . . . . . . 1,701,961 514,304 833,076 354,581 767,258 286,924 345,695 134,639 Delaware . . . . . . . . . . . . . . . . . . . . . . . 325,374 90,245 146,729 88,400 155,586 54,176 43,460 57,950 Florida . . . . . . . . . . . . . . . . . . . . . . . . . 9,036,766 4,815,253 2,733,398 1,488,115 5,995,434 3,082,600 1,944,968 967,865 Georgia . . . . . . . . . . . . . . . . . . . . . . . . 4,556,286 1,727,674 2,558,603 270,009 2,753,862 888,638 1,669,103 196,122
Hawaii . . . . . . . . . . . . . . . . . . . . . . . . . 993,025 752,407 212,240 28,378 324,522 124,708 197,638 2,177 Idaho . . . . . . . . . . . . . . . . . . . . . . . . . . 1,582,416 628,991 780,265 173,161 1,150,375 546,512 488,083 115,780 Illinois . . . . . . . . . . . . . . . . . . . . . . . . . 3,829,506 812,263 1,871,628 1,145,615 2,523,249 646,140 1,086,006 791,103 Indiana . . . . . . . . . . . . . . . . . . . . . . . . . 1,692,628 698,567 785,849 208,212 941,286 492,210 307,649 141,427 Iowa . . . . . . . . . . . . . . . . . . . . . . . . . . . 1,540,021 286,130 982,005 271,886 828,853 222,073 446,164 160,616
Kansas . . . . . . . . . . . . . . . . . . . . . . . . . 906,039 293,551 236,355 376,132 697,624 247,952 179,430 270,242 Kentucky . . . . . . . . . . . . . . . . . . . . . . . 2,946,272 626,124 1,546,698 773,451 2,173,052 500,766 1,379,622 292,663 Louisiana . . . . . . . . . . . . . . . . . . . . . . . 2,238,502 1,000,985 1,014,000 223,516 1,695,750 778,840 736,916 179,993 Maine . . . . . . . . . . . . . . . . . . . . . . . . . 1,417,258 830,869 416,881 169,508 618,404 316,723 244,768 56,912 Maryland . . . . . . . . . . . . . . . . . . . . . . . 1,303,595 350,179 806,654 146,762 820,174 245,757 472,892 101,525
Massachusetts . . . . . . . . . . . . . . . . . . . 1,961,405 556,738 709,183 695,484 683,507 270,646 383,216 29,646 Michigan . . . . . . . . . . . . . . . . . . . . . . . 6,090,451 1,780,639 3,193,893 1,115,919 4,869,636 1,364,077 2,531,190 974,369 Minnesota . . . . . . . . . . . . . . . . . . . . . . 3,885,325 1,387,813 2,132,200 365,311 3,264,034 1,159,597 1,962,218 142,219 Mississippi . . . . . . . . . . . . . . . . . . . . . 2,629,194 650,396 1,710,722 268,076 2,286,772 559,903 1,472,411 254,458 Missouri . . . . . . . . . . . . . . . . . . . . . . . 2,681,426 893,867 1,398,330 389,229 1,740,608 682,933 791,728 265,947
Montana . . . . . . . . . . . . . . . . . . . . . . . 1,408,180 666,395 568,822 172,963 1,007,383 374,484 464,613 168,286 Nebraska . . . . . . . . . . . . . . . . . . . . . . . 1,309,521 233,081 867,358 209,082 796,225 146,362 457,559 192,304 Nevada . . . . . . . . . . . . . . . . . . . . . . . . 1,182,878 284,367 511,929 386,583 500,850 170,000 236,043 94,807 New Hampshire . . . . . . . . . . . . . . . . . 553,507 287,092 188,907 77,508 272,317 185,279 77,587 9,451 New Jersey . . . . . . . . . . . . . . . . . . . . . 2,294,691 749,520 864,754 680,417 1,308,413 521,397 457,200 329,816
New Mexico . . . . . . . . . . . . . . . . . . . . 936,549 446,916 410,204 79,429 609,433 299,979 273,607 35,847 New York . . . . . . . . . . . . . . . . . . . . . . 9,166,012 2,527,906 5,098,727 1,539,380 5,014,223 1,868,034 2,674,940 471,249 North Carolina . . . . . . . . . . . . . . . . . . 3,294,423 1,612,019 1,418,915 263,489 2,364,762 1,244,710 969,655 150,397 North Dakota . . . . . . . . . . . . . . . . . . . . (NA) (NA) (NA) (NA) (NA) (NA) (NA) (NA) Ohio. . . . . . . . . . . . . . . . . . . . . . . . . . . 3,510,736 1,002,362 1,412,777 1,095,597 2,771,930 915,296 955,751 900,883
Oklahoma . . . . . . . . . . . . . . . . . . . . . . 1,775,835 392,794 903,428 479,613 1,301,173 284,875 622,201 394,097 Oregon . . . . . . . . . . . . . . . . . . . . . . . . . 2,653,246 924,413 1,460,670 268,163 956,024 442,172 441,703 72,149 Pennsylvania . . . . . . . . . . . . . . . . . . . . 2,793,977 667,890 1,599,038 527,050 1,523,089 401,221 810,451 311,417 Rhode Island . . . . . . . . . . . . . . . . . . . . 360,420 167,465 156,775 36,180 159,940 88,545 64,637 6,757 South Carolina . . . . . . . . . . . . . . . . . . 2,019,749 850,232 1,046,902 122,615 1,552,496 589,394 855,615 107,487
South Dakota . . . . . . . . . . . . . . . . . . . . 1,230,541 605,390 472,350 152,801 1,063,546 471,308 441,898 150,340 Tennessee . . . . . . . . . . . . . . . . . . . . . . 2,868,103 991,489 1,701,509 175,106 1,925,532 493,049 1,310,767 121,716 Texas . . . . . . . . . . . . . . . . . . . . . . . . . . 6,222,843 2,360,889 2,867,946 994,008 4,399,085 1,882,809 1,947,975 568,300 Utah . . . . . . . . . . . . . . . . . . . . . . . . . . . 1,749,270 708,740 879,698 160,833 1,163,865 413,017 641,686 109,162 Vermont . . . . . . . . . . . . . . . . . . . . . . . . 744,040 179,223 360,957 203,860 455,533 129,717 247,540 78,275
Virginia . . . . . . . . . . . . . . . . . . . . . . . . 3,542,179 1,066,100 1,718,530 757,549 2,583,572 766,337 1,225,209 592,025 Washington . . . . . . . . . . . . . . . . . . . . . 4,894,639 1,209,116 3,306,250 379,274 1,721,268 702,458 919,896 98,914 West Virginia . . . . . . . . . . . . . . . . . . . . 1,200,485 495,132 617,953 87,400 874,707 394,806 434,257 45,644 Wisconsin . . . . . . . . . . . . . . . . . . . . . . 5,522,195 1,200,307 3,081,200 1,240,688 4,033,338 965,547 2,000,568 1,067,223 Wyoming . . . . . . . . . . . . . . . . . . . . . . . 1,137,200 874,268 180,927 82,005 786,944 553,099 158,761 75,085
See footnotes at end of table.

U.S. Fish and Wildlife Service and U.S. Census Bureau 2011 National Survey of Fishing, Hunting, and Wildlife-Associated Recreation 97
Table 48. Expenditures for Wildlife-Related Recreation by State Where Spending Took Place: 2011—Continued
(Population 16 years old and older. Numbers in thousands)
State where spending took placeWildlife-watching expenditures
Total Trip-related Equipment OtherUnited States, total . . . . . . . . . . . . . . . . . . . . . . . . . . . . . . 54,890,272 17,274,675 27,150,921 10,464,677
Alabama . . . . . . . . . . . . . . . . . . . . . . . . . . . . . . . . . . . . . 734,204 *41,191 668,276 *24,738 Alaska . . . . . . . . . . . . . . . . . . . . . . . . . . . . . . . . . . . . . . . 2,058,355 1,970,345 79,485 *8,524 Arizona . . . . . . . . . . . . . . . . . . . . . . . . . . . . . . . . . . . . . . 935,880 391,198 336,081 208,600 Arkansas . . . . . . . . . . . . . . . . . . . . . . . . . . . . . . . . . . . . . 216,074 *34,520 156,574 ... California . . . . . . . . . . . . . . . . . . . . . . . . . . . . . . . . . . . . 3,777,677 1,781,680 1,485,977 510,019
Colorado . . . . . . . . . . . . . . . . . . . . . . . . . . . . . . . . . . . . . 1,432,084 615,636 722,249 94,199 Connecticut . . . . . . . . . . . . . . . . . . . . . . . . . . . . . . . . . . . 934,703 227,380 487,381 219,942 Delaware . . . . . . . . . . . . . . . . . . . . . . . . . . . . . . . . . . . . . 169,788 36,069 103,269 30,450 Florida . . . . . . . . . . . . . . . . . . . . . . . . . . . . . . . . . . . . . . . 3,041,333 1,732,652 788,430 520,250 Georgia . . . . . . . . . . . . . . . . . . . . . . . . . . . . . . . . . . . . . . 1,802,423 839,036 889,500 *73,887
Hawaii . . . . . . . . . . . . . . . . . . . . . . . . . . . . . . . . . . . . . . . 668,504 627,700 14,603 26,201 Idaho . . . . . . . . . . . . . . . . . . . . . . . . . . . . . . . . . . . . . . . . 432,041 82,479 292,182 *57,380 Illinois . . . . . . . . . . . . . . . . . . . . . . . . . . . . . . . . . . . . . . . 1,306,258 166,123 785,622 354,513 Indiana . . . . . . . . . . . . . . . . . . . . . . . . . . . . . . . . . . . . . . . 751,343 *206,357 478,201 66,785 Iowa . . . . . . . . . . . . . . . . . . . . . . . . . . . . . . . . . . . . . . . . . 711,168 64,058 535,840 111,270
Kansas . . . . . . . . . . . . . . . . . . . . . . . . . . . . . . . . . . . . . . . 208,415 *45,599 56,925 105,891 Kentucky . . . . . . . . . . . . . . . . . . . . . . . . . . . . . . . . . . . . . 773,221 125,358 167,075 480,788 Louisiana . . . . . . . . . . . . . . . . . . . . . . . . . . . . . . . . . . . . . 542,752 *222,145 277,084 *43,523 Maine . . . . . . . . . . . . . . . . . . . . . . . . . . . . . . . . . . . . . . . 798,854 514,145 172,113 112,596 Maryland . . . . . . . . . . . . . . . . . . . . . . . . . . . . . . . . . . . . . 483,421 104,421 333,762 45,237
Massachusetts . . . . . . . . . . . . . . . . . . . . . . . . . . . . . . . . . 1,277,898 286,092 325,967 665,838 Michigan . . . . . . . . . . . . . . . . . . . . . . . . . . . . . . . . . . . . . 1,220,815 416,562 662,703 141,550 Minnesota . . . . . . . . . . . . . . . . . . . . . . . . . . . . . . . . . . . . 621,290 228,217 169,982 223,092 Mississippi . . . . . . . . . . . . . . . . . . . . . . . . . . . . . . . . . . . 342,422 *90,493 238,311 *13,617 Missouri . . . . . . . . . . . . . . . . . . . . . . . . . . . . . . . . . . . . . 940,818 210,934 606,603 123,282
Montana . . . . . . . . . . . . . . . . . . . . . . . . . . . . . . . . . . . . . 400,797 291,910 104,210 *4,677 Nebraska . . . . . . . . . . . . . . . . . . . . . . . . . . . . . . . . . . . . . 513,297 86,719 409,799 16,778 Nevada . . . . . . . . . . . . . . . . . . . . . . . . . . . . . . . . . . . . . . 682,028 114,366 275,886 291,776 New Hampshire . . . . . . . . . . . . . . . . . . . . . . . . . . . . . . . 281,190 101,813 111,320 68,057 New Jersey . . . . . . . . . . . . . . . . . . . . . . . . . . . . . . . . . . . 986,278 228,123 407,554 350,601
New Mexico . . . . . . . . . . . . . . . . . . . . . . . . . . . . . . . . . . 327,117 146,937 136,597 43,583 New York . . . . . . . . . . . . . . . . . . . . . . . . . . . . . . . . . . . . 4,151,789 659,871 2,423,787 1,068,131 North Carolina . . . . . . . . . . . . . . . . . . . . . . . . . . . . . . . . 929,661 367,309 449,260 113,092 North Dakota . . . . . . . . . . . . . . . . . . . . . . . . . . . . . . . . . . (NA) (NA) (NA) (NA) Ohio. . . . . . . . . . . . . . . . . . . . . . . . . . . . . . . . . . . . . . . . . 738,806 87,066 457,027 194,714
Oklahoma . . . . . . . . . . . . . . . . . . . . . . . . . . . . . . . . . . . . 474,662 *107,919 281,227 *85,516 Oregon . . . . . . . . . . . . . . . . . . . . . . . . . . . . . . . . . . . . . . . 1,697,222 482,241 1,018,967 196,014 Pennsylvania . . . . . . . . . . . . . . . . . . . . . . . . . . . . . . . . . . 1,270,888 266,669 788,587 215,632 Rhode Island . . . . . . . . . . . . . . . . . . . . . . . . . . . . . . . . . . 200,480 78,920 92,137 29,423 South Carolina . . . . . . . . . . . . . . . . . . . . . . . . . . . . . . . . 467,253 260,838 191,288 *15,127
South Dakota . . . . . . . . . . . . . . . . . . . . . . . . . . . . . . . . . . 166,995 134,082 30,452 *2,461 Tennessee . . . . . . . . . . . . . . . . . . . . . . . . . . . . . . . . . . . . 942,572 498,440 390,742 53,390 Texas . . . . . . . . . . . . . . . . . . . . . . . . . . . . . . . . . . . . . . . . 1,823,758 478,080 919,971 425,708 Utah . . . . . . . . . . . . . . . . . . . . . . . . . . . . . . . . . . . . . . . . . 585,405 295,723 238,012 *51,671 Vermont . . . . . . . . . . . . . . . . . . . . . . . . . . . . . . . . . . . . . . 288,507 49,506 113,416 125,585
Virginia . . . . . . . . . . . . . . . . . . . . . . . . . . . . . . . . . . . . . . 958,607 299,762 493,321 165,524 Washington . . . . . . . . . . . . . . . . . . . . . . . . . . . . . . . . . . . 3,173,371 506,658 2,386,353 280,360 West Virginia . . . . . . . . . . . . . . . . . . . . . . . . . . . . . . . . . . 325,778 100,326 183,696 *41,756 Wisconsin . . . . . . . . . . . . . . . . . . . . . . . . . . . . . . . . . . . . 1,488,857 234,760 1,080,632 173,464 Wyoming . . . . . . . . . . . . . . . . . . . . . . . . . . . . . . . . . . . . . 350,256 321,169 22,166 *6,920 * Estimate based on a sample size of 10–29. … Sample size too small (less than 10) to report data reliably. (NA) Not available.
Note: U.S. totals include responses from participants residing in the District of Columbia, as described in Appendix D.

98 2011 National Survey of Fishing, Hunting, and Wildlife-Associated Recreation U.S. Fish and Wildlife Service and U.S. Census Bureau
Table 49. Expenditures for Wildlife-Related Recreation in the United States by State Residents Both Inside and Outside Their Resident State: 2011
(Population 16 years old and older. Numbers in thousands)
Participant’s state of residence
Total, wildlife-related expenditures Fishing and hunting expendituresTotal Trip-related Equipment Other Total Trip-related Equipment Other
United States, total . . . . . . . . . . . . . . . . . . . . 144,651,796 49,485,328 80,843,000 24,788,145 89,761,524 32,210,653 43,227,403 14,323,468
Alabama . . . . . . . . . . . . . . . . . . . . . . . . . . . 2,580,330 710,864 1,692,392 177,074 1,767,160 617,679 998,359 151,122 Alaska . . . . . . . . . . . . . . . . . . . . . . . . . . . . . 1,014,001 365,578 621,150 27,273 869,773 313,999 536,453 19,321 Arizona . . . . . . . . . . . . . . . . . . . . . . . . . . . . 2,553,755 941,641 1,283,558 328,556 1,546,497 507,957 937,457 101,083 Arkansas . . . . . . . . . . . . . . . . . . . . . . . . . . . 1,717,671 638,207 824,044 255,420 1,498,616 613,342 662,679 222,596 California . . . . . . . . . . . . . . . . . . . . . . . . . . 8,904,405 4,928,288 3,189,756 786,361 4,427,335 2,596,721 1,596,696 233,918
Colorado . . . . . . . . . . . . . . . . . . . . . . . . . . . 2,444,637 1,019,057 1,281,295 144,285 1,441,355 512,345 866,761 62,250 Connecticut . . . . . . . . . . . . . . . . . . . . . . . . . 2,385,182 986,943 960,807 437,432 1,059,979 492,315 426,145 141,518 Delaware . . . . . . . . . . . . . . . . . . . . . . . . . . . 511,995 142,197 296,620 73,177 151,054 46,336 62,050 42,667 Florida . . . . . . . . . . . . . . . . . . . . . . . . . . . . . 8,091,232 3,820,030 2,697,940 1,573,261 5,476,780 2,613,804 1,846,212 1,016,764 Georgia . . . . . . . . . . . . . . . . . . . . . . . . . . . . 5,060,457 2,462,015 2,354,755 243,687 2,482,983 856,617 1,462,415 163,950
Hawaii . . . . . . . . . . . . . . . . . . . . . . . . . . . . . 442,305 154,484 221,880 65,940 309,694 102,723 204,591 2,380 Idaho . . . . . . . . . . . . . . . . . . . . . . . . . . . . . . 1,035,849 278,400 669,734 87,716 610,771 196,598 385,618 28,555 Illinois . . . . . . . . . . . . . . . . . . . . . . . . . . . . . 5,091,826 1,445,339 2,229,211 1,417,276 3,133,455 918,369 1,162,720 1,052,366 Indiana . . . . . . . . . . . . . . . . . . . . . . . . . . . . . 1,966,673 935,484 800,178 231,011 963,370 531,352 304,547 127,471 Iowa . . . . . . . . . . . . . . . . . . . . . . . . . . . . . . . 1,882,200 616,181 992,194 273,824 1,013,538 388,268 460,246 165,024
Kansas . . . . . . . . . . . . . . . . . . . . . . . . . . . . . 900,397 262,694 276,533 361,169 643,300 214,658 211,820 216,823 Kentucky . . . . . . . . . . . . . . . . . . . . . . . . . . . 2,924,946 579,125 1,627,013 718,808 2,112,626 485,558 1,394,306 232,761 Louisiana . . . . . . . . . . . . . . . . . . . . . . . . . . . 2,470,997 1,198,064 984,961 287,972 1,699,110 755,747 699,953 243,410 Maine . . . . . . . . . . . . . . . . . . . . . . . . . . . . . 622,529 217,143 328,944 76,442 387,872 168,129 173,050 46,693 Maryland . . . . . . . . . . . . . . . . . . . . . . . . . . . 1,730,084 652,348 854,361 223,375 1,106,794 358,666 610,726 137,401
Massachusetts . . . . . . . . . . . . . . . . . . . . . . . 1,939,377 607,740 827,332 504,306 774,231 335,517 371,711 67,004 Michigan . . . . . . . . . . . . . . . . . . . . . . . . . . . 6,150,417 1,742,178 3,284,436 1,123,803 4,919,017 1,351,218 2,578,221 989,578 Minnesota . . . . . . . . . . . . . . . . . . . . . . . . . . 4,371,217 1,761,329 1,990,741 619,147 3,499,788 1,293,168 1,817,156 389,463 Mississippi . . . . . . . . . . . . . . . . . . . . . . . . . 2,524,916 556,106 1,713,495 255,315 2,173,769 487,354 1,447,246 239,169 Missouri . . . . . . . . . . . . . . . . . . . . . . . . . . . 2,765,273 1,034,244 1,306,487 424,541 1,582,437 606,378 698,530 277,528
Montana . . . . . . . . . . . . . . . . . . . . . . . . . . . 1,277,677 577,844 545,920 153,913 1,051,377 434,401 467,035 149,941 Nebraska . . . . . . . . . . . . . . . . . . . . . . . . . . . 1,445,193 323,928 796,405 324,860 858,584 178,484 394,386 285,714 Nevada . . . . . . . . . . . . . . . . . . . . . . . . . . . . 1,282,868 407,053 535,633 340,182 485,601 233,524 204,670 47,407 New Hampshire . . . . . . . . . . . . . . . . . . . . . 506,690 256,534 201,908 48,248 341,541 197,176 132,719 11,646 New Jersey . . . . . . . . . . . . . . . . . . . . . . . . . 2,992,311 1,256,192 915,432 820,687 1,648,405 679,364 527,251 441,790
New Mexico . . . . . . . . . . . . . . . . . . . . . . . . 906,190 392,074 427,509 86,608 585,688 260,497 285,114 40,076 New York . . . . . . . . . . . . . . . . . . . . . . . . . . 10,665,327 3,600,610 5,130,402 1,934,315 5,309,319 2,086,496 2,668,628 554,194 North Carolina . . . . . . . . . . . . . . . . . . . . . . 3,742,754 1,863,117 1,545,115 334,522 2,496,929 1,247,168 1,040,438 209,323 North Dakota . . . . . . . . . . . . . . . . . . . . . . . . (NA) (NA) (NA) (NA) (NA) (NA) (NA) (NA) Ohio. . . . . . . . . . . . . . . . . . . . . . . . . . . . . . . 4,086,277 1,525,835 1,448,588 1,111,854 3,242,586 1,337,160 990,466 914,960
Oklahoma . . . . . . . . . . . . . . . . . . . . . . . . . . 1,905,525 512,273 914,697 478,554 1,414,920 391,940 631,095 391,885 Oregon . . . . . . . . . . . . . . . . . . . . . . . . . . . . . 2,445,732 764,576 1,433,103 248,053 733,240 256,927 411,066 65,248 Pennsylvania . . . . . . . . . . . . . . . . . . . . . . . . 2,475,374 507,790 1,530,270 437,314 1,472,760 421,023 793,380 258,357 Rhode Island . . . . . . . . . . . . . . . . . . . . . . . . 330,687 151,989 140,715 37,982 168,733 63,931 98,201 6,601 South Carolina . . . . . . . . . . . . . . . . . . . . . . 2,149,460 767,251 1,261,311 120,898 1,838,305 621,493 1,113,809 103,003
South Dakota . . . . . . . . . . . . . . . . . . . . . . . . 722,526 237,321 436,656 48,549 660,736 201,487 413,928 45,321 Tennessee . . . . . . . . . . . . . . . . . . . . . . . . . . 2,871,608 897,275 1,821,155 153,178 2,137,741 590,473 1,448,405 98,862 Texas . . . . . . . . . . . . . . . . . . . . . . . . . . . . . . 6,237,199 2,414,822 2,838,198 984,180 4,559,419 2,079,809 1,925,507 554,103 Utah . . . . . . . . . . . . . . . . . . . . . . . . . . . . . . . 1,326,803 452,085 776,883 97,835 946,736 322,728 575,859 48,149 Vermont . . . . . . . . . . . . . . . . . . . . . . . . . . . . 624,724 150,041 374,085 100,598 443,690 125,292 250,839 67,559
Virginia . . . . . . . . . . . . . . . . . . . . . . . . . . . . 3,467,271 1,108,672 1,575,251 783,347 2,418,819 754,336 1,074,714 589,768 Washington . . . . . . . . . . . . . . . . . . . . . . . . . 5,275,143 1,332,774 3,477,820 464,549 2,195,318 916,795 1,085,454 193,068 West Virginia . . . . . . . . . . . . . . . . . . . . . . . . 1,285,342 550,452 665,620 69,270 953,839 417,965 484,767 51,107 Wisconsin . . . . . . . . . . . . . . . . . . . . . . . . . . 4,906,805 1,078,953 3,026,952 800,900 3,415,396 810,087 1,980,609 624,699 Wyoming . . . . . . . . . . . . . . . . . . . . . . . . . . . 462,645 186,799 229,934 45,912 334,306 134,941 159,516 39,849 See footnotes at end of table.

U.S. Fish and Wildlife Service and U.S. Census Bureau 2011 National Survey of Fishing, Hunting, and Wildlife-Associated Recreation 99
Table 49. Expenditures for Wildlife-Related Recreation in the United States by State Residents Both Inside and Outside Their Resident State: 2011—Continued
(Population 16 years old and older. Numbers in thousands)
Participant’s state of residence
Wildlife-watching expendituresTotal Trip-related Equipment Other
United States, total . . . . . . . . . . . . . . . . . . . . . . . . . . . . . . . . . 54,890,272 17,274,675 27,150,921 10,464,677
Alabama . . . . . . . . . . . . . . . . . . . . . . . . . . . . . . . . . . . . . . . . 813,170 *93,185 694,033 *25,952 Alaska . . . . . . . . . . . . . . . . . . . . . . . . . . . . . . . . . . . . . . . . . . 144,228 51,579 84,697 *7,952 Arizona . . . . . . . . . . . . . . . . . . . . . . . . . . . . . . . . . . . . . . . . . 1,007,258 433,685 346,100 227,474 Arkansas . . . . . . . . . . . . . . . . . . . . . . . . . . . . . . . . . . . . . . . . 219,055 *24,866 161,365 *32,824 California . . . . . . . . . . . . . . . . . . . . . . . . . . . . . . . . . . . . . . . 4,477,069 2,331,567 1,593,060 552,443
Colorado . . . . . . . . . . . . . . . . . . . . . . . . . . . . . . . . . . . . . . . . 1,003,282 506,713 414,534 82,035 Connecticut . . . . . . . . . . . . . . . . . . . . . . . . . . . . . . . . . . . . . . 1,325,203 494,628 534,661 295,914 Delaware . . . . . . . . . . . . . . . . . . . . . . . . . . . . . . . . . . . . . . . . 360,941 95,861 234,570 30,510 Florida . . . . . . . . . . . . . . . . . . . . . . . . . . . . . . . . . . . . . . . . . . 2,614,452 1,206,226 851,728 556,497 Georgia . . . . . . . . . . . . . . . . . . . . . . . . . . . . . . . . . . . . . . . . . 2,577,474 *1,605,397 892,339 *79,737
Hawaii . . . . . . . . . . . . . . . . . . . . . . . . . . . . . . . . . . . . . . . . . . 132,611 51,761 17,289 63,560 Idaho . . . . . . . . . . . . . . . . . . . . . . . . . . . . . . . . . . . . . . . . . . . 425,078 *81,801 284,115 *59,161 Illinois . . . . . . . . . . . . . . . . . . . . . . . . . . . . . . . . . . . . . . . . . . 1,958,371 526,970 1,066,491 364,911 Indiana . . . . . . . . . . . . . . . . . . . . . . . . . . . . . . . . . . . . . . . . . . 1,003,303 *404,132 495,630 103,540 Iowa . . . . . . . . . . . . . . . . . . . . . . . . . . . . . . . . . . . . . . . . . . . . 868,662 227,914 531,948 108,800
Kansas . . . . . . . . . . . . . . . . . . . . . . . . . . . . . . . . . . . . . . . . . . 257,096 48,036 64,713 144,347 Kentucky . . . . . . . . . . . . . . . . . . . . . . . . . . . . . . . . . . . . . . . . 812,320 *93,567 232,707 486,047 Louisiana . . . . . . . . . . . . . . . . . . . . . . . . . . . . . . . . . . . . . . . . 771,887 *442,317 285,008 *44,562 Maine . . . . . . . . . . . . . . . . . . . . . . . . . . . . . . . . . . . . . . . . . . 234,657 *49,014 155,894 29,749 Maryland . . . . . . . . . . . . . . . . . . . . . . . . . . . . . . . . . . . . . . . . 623,290 293,681 243,635 85,974
Massachusetts . . . . . . . . . . . . . . . . . . . . . . . . . . . . . . . . . . . . 1,165,146 272,223 455,621 437,302 Michigan . . . . . . . . . . . . . . . . . . . . . . . . . . . . . . . . . . . . . . . . 1,231,400 *390,960 706,215 134,225 Minnesota . . . . . . . . . . . . . . . . . . . . . . . . . . . . . . . . . . . . . . . 871,430 *468,161 173,584 229,684 Mississippi . . . . . . . . . . . . . . . . . . . . . . . . . . . . . . . . . . . . . . 351,147 *68,752 266,249 *16,146 Missouri . . . . . . . . . . . . . . . . . . . . . . . . . . . . . . . . . . . . . . . . 1,182,836 427,866 607,957 147,013
Montana . . . . . . . . . . . . . . . . . . . . . . . . . . . . . . . . . . . . . . . . 226,300 *143,443 78,885 *3,972 Nebraska . . . . . . . . . . . . . . . . . . . . . . . . . . . . . . . . . . . . . . . . 586,609 145,444 402,020 39,146 Nevada . . . . . . . . . . . . . . . . . . . . . . . . . . . . . . . . . . . . . . . . . 797,267 173,529 330,964 292,775 New Hampshire . . . . . . . . . . . . . . . . . . . . . . . . . . . . . . . . . . 165,149 59,358 69,189 36,602 New Jersey . . . . . . . . . . . . . . . . . . . . . . . . . . . . . . . . . . . . . . 1,343,906 576,828 388,181 378,897
New Mexico . . . . . . . . . . . . . . . . . . . . . . . . . . . . . . . . . . . . . 320,502 131,576 142,394 46,531 New York . . . . . . . . . . . . . . . . . . . . . . . . . . . . . . . . . . . . . . . 5,356,008 1,514,114 2,461,773 1,380,121 North Carolina . . . . . . . . . . . . . . . . . . . . . . . . . . . . . . . . . . . 1,245,825 615,949 504,677 125,199 North Dakota . . . . . . . . . . . . . . . . . . . . . . . . . . . . . . . . . . . . . (NA) (NA) (NA) (NA) Ohio. . . . . . . . . . . . . . . . . . . . . . . . . . . . . . . . . . . . . . . . . . . . 843,691 188,675 458,123 196,894
Oklahoma . . . . . . . . . . . . . . . . . . . . . . . . . . . . . . . . . . . . . . . 490,605 *120,334 283,602 *86,669 Oregon . . . . . . . . . . . . . . . . . . . . . . . . . . . . . . . . . . . . . . . . . . 1,712,492 507,648 1,022,037 182,806 Pennsylvania . . . . . . . . . . . . . . . . . . . . . . . . . . . . . . . . . . . . . 1,002,614 *86,767 736,890 178,957 Rhode Island . . . . . . . . . . . . . . . . . . . . . . . . . . . . . . . . . . . . . 161,954 88,059 42,514 31,381 South Carolina . . . . . . . . . . . . . . . . . . . . . . . . . . . . . . . . . . . 311,155 *145,758 147,503 *17,895
South Dakota . . . . . . . . . . . . . . . . . . . . . . . . . . . . . . . . . . . . . 61,790 *35,834 22,728 *3,228 Tennessee . . . . . . . . . . . . . . . . . . . . . . . . . . . . . . . . . . . . . . . 733,867 306,802 372,750 54,315 Texas . . . . . . . . . . . . . . . . . . . . . . . . . . . . . . . . . . . . . . . . . . . 1,677,780 *335,013 912,691 430,076 Utah . . . . . . . . . . . . . . . . . . . . . . . . . . . . . . . . . . . . . . . . . . . . 380,067 129,357 201,024 *49,686 Vermont . . . . . . . . . . . . . . . . . . . . . . . . . . . . . . . . . . . . . . . . . 181,034 24,749 123,247 33,039
Virginia . . . . . . . . . . . . . . . . . . . . . . . . . . . . . . . . . . . . . . . . . 1,048,452 354,336 500,537 193,579 Washington . . . . . . . . . . . . . . . . . . . . . . . . . . . . . . . . . . . . . . 3,079,826 415,979 2,392,366 271,481 West Virginia . . . . . . . . . . . . . . . . . . . . . . . . . . . . . . . . . . . . . 331,503 *132,487 180,852 *18,163 Wisconsin . . . . . . . . . . . . . . . . . . . . . . . . . . . . . . . . . . . . . . . 1,491,409 *268,866 1,046,342 176,201 Wyoming . . . . . . . . . . . . . . . . . . . . . . . . . . . . . . . . . . . . . . . . 128,338 51,858 70,417 *6,062 * Estimate based on a sample size of 10–29. (NA) Not available.
Note: U.S. totals include responses from participants residing in the District of Columbia, as described in Appendix D.

100 2011 National Survey of Fishing, Hunting, and Wildlife-Associated Recreation U.S. Fish and Wildlife Service and U.S. Census Bureau
Table 50. Anglers and Hunters by Sportsperson’s State of Residence: 2011(Population 16 years old and older. Numbers in thousands)
Sportsperson’s state of residence
Population
Fished or hunted Fished only Hunted only Fished and hunted
NumberPercent of population Number
Percent of population Number
Percent of population Number
Percent of population
United States, total . . . . . . . . 239,313 37,397 16 23,714 10 4,285 2 9,389 4
Alabama . . . . . . . . . . . . . . . 3,664 744 20 252 7 *228 *6 264 7 Alaska . . . . . . . . . . . . . . . . . 526 235 45 129 25 *24 *5 82 16 Arizona . . . . . . . . . . . . . . . . 5,084 721 14 462 9 *135 *3 *124 *2 Arkansas . . . . . . . . . . . . . . . 2,238 572 26 252 11 *105 *5 214 10 California . . . . . . . . . . . . . . 28,562 1,898 7 1,431 5 198 1 269 1
Colorado . . . . . . . . . . . . . . . 3,946 727 18 567 14 *60 *2 99 3 Connecticut . . . . . . . . . . . . . 2,781 347 12 265 10 ... ... 76 3 Delaware . . . . . . . . . . . . . . . 699 101 14 78 11 *9 *1 *14 *2 Florida . . . . . . . . . . . . . . . . . 14,855 2,068 14 1,731 12 *78 *1 252 2 Georgia . . . . . . . . . . . . . . . . 7,459 981 13 672 9 *138 *2 171 2
Hawaii . . . . . . . . . . . . . . . . . 995 108 11 85 9 ... ... *21 *2 Idaho . . . . . . . . . . . . . . . . . . 1,172 331 28 169 14 ... ... *119 *10 Illinois . . . . . . . . . . . . . . . . . 9,988 1,487 15 976 10 *252 *3 260 3 Indiana . . . . . . . . . . . . . . . . . 4,965 842 17 465 9 *56 *1 322 6 Iowa . . . . . . . . . . . . . . . . . . . 2,363 586 25 369 16 *64 *3 152 6
Kansas . . . . . . . . . . . . . . . . . 2,163 453 21 275 13 *18 *1 159 7 Kentucky . . . . . . . . . . . . . . . 3,376 643 19 327 10 *151 *4 165 5 Louisiana . . . . . . . . . . . . . . . 3,449 802 23 511 15 *69 *2 222 6 Maine . . . . . . . . . . . . . . . . . 1,066 233 22 92 9 *37 *3 104 10 Maryland . . . . . . . . . . . . . . . 4,480 426 9 337 8 ... ... *72 *2
Massachusetts . . . . . . . . . . . 5,320 464 9 398 7 ... ... 59 1 Michigan . . . . . . . . . . . . . . . 7,787 1,636 21 1,128 14 *170 *2 337 4 Minnesota . . . . . . . . . . . . . . 4,133 1,400 34 925 22 *71 *2 403 10 Mississippi . . . . . . . . . . . . . 2,220 700 32 263 12 *96 *4 340 15 Missouri . . . . . . . . . . . . . . . 4,667 1,001 21 507 11 132 3 363 8
Montana . . . . . . . . . . . . . . . 777 223 29 114 15 *30 *4 78 10 Nebraska . . . . . . . . . . . . . . . 1,387 258 19 143 10 *61 *4 54 4 Nevada . . . . . . . . . . . . . . . . 2,024 171 8 122 6 *15 *1 *34 *2 New Hampshire . . . . . . . . . 1,066 168 16 125 12 ... ... *39 *4 New Jersey . . . . . . . . . . . . . 6,852 709 10 593 9 *30 *(Z) 86 1
New Mexico . . . . . . . . . . . . 1,551 252 16 185 12 *21 *1 *47 *3 New York . . . . . . . . . . . . . . 15,503 1,980 13 1,241 8 *172 *1 567 4 North Carolina . . . . . . . . . . 7,264 1,394 19 1,077 15 *88 *1 230 3 North Dakota . . . . . . . . . . . . (NA) (NA) (NA) (NA) (NA) (NA) (NA) (NA) (NA) Ohio. . . . . . . . . . . . . . . . . . . 8,999 1,603 18 1,075 12 *168 *2 360 4
Oklahoma . . . . . . . . . . . . . . 2,828 770 27 551 19 ... ... *193 *7 Oregon . . . . . . . . . . . . . . . . . 3,061 444 15 263 9 *58 *2 *123 *4 Pennsylvania . . . . . . . . . . . . 10,036 1,277 13 574 6 269 3 434 4 Rhode Island . . . . . . . . . . . . 848 94 11 77 9 ... ... 16 2 South Carolina . . . . . . . . . . 3,555 615 17 377 11 *42 *1 196 6
South Dakota . . . . . . . . . . . . 631 190 30 *58 *9 *27 *4 106 17 Tennessee . . . . . . . . . . . . . . 4,945 923 19 637 13 *91 *2 196 4 Texas . . . . . . . . . . . . . . . . . . 18,681 2,711 15 1,631 9 *356 *2 724 4 Utah . . . . . . . . . . . . . . . . . . . 2,036 406 20 245 12 *55 *3 106 5 Vermont . . . . . . . . . . . . . . . . 512 134 26 64 12 30 6 41 8
Virginia . . . . . . . . . . . . . . . . 6,136 842 14 488 8 135 2 219 4 Washington . . . . . . . . . . . . . 5,293 968 18 749 14 *54 *1 165 3 West Virginia . . . . . . . . . . . . 1,464 322 22 111 8 *83 *6 128 9 Wisconsin . . . . . . . . . . . . . . 4,460 1,198 27 434 10 *260 *6 504 11 Wyoming . . . . . . . . . . . . . . . 424 145 34 69 16 *30 *7 46 11* Estimate based on a sample size of 10–29. … Sample size too small (less than 10) to report data reliably. (NA) Not available. (Z) Less than 0.5 percent.
Note: U.S. totals include responses from participants residing in the District of Columbia, as described in Appendix D.

U.S. Fish and Wildlife Service and U.S. Census Bureau 2011 National Survey of Fishing, Hunting, and Wildlife-Associated Recreation 101
Table 51. Anglers and Hunters by State Where Fishing or Hunting Took Place: 2011(Population 16 years old and older. Numbers in thousands)
State where fishing or hunting took place
Anglers HuntersTotal anglers, residents and nonresidents
State residents NonresidentsTotal hunters, residents and nonresidents
State residents Nonresidents
Number Percent Number Percent Number Percent Number Percent Number Percent Number PercentUnited States, total . . . . . 33,112 100 30,037 91 6,964 21 13,674 100 12,890 94 1,942 14
Alabama . . . . . . . . . . . . 683 100 473 69 210 31 535 100 492 92 *44 *8 Alaska . . . . . . . . . . . . . . 538 100 211 39 327 61 125 100 104 83 ... ... Arizona . . . . . . . . . . . . . 637 100 533 84 *104 *16 269 100 225 83 *45 *17 Arkansas . . . . . . . . . . . . 555 100 458 83 *97 *17 363 100 316 87 ... ... California . . . . . . . . . . . 1,674 100 1,576 94 98 6 394 100 377 96 ... ...
Colorado . . . . . . . . . . . . 767 100 593 77 175 23 259 100 144 55 *115 *45 Connecticut . . . . . . . . . . 342 100 277 81 *65 *19 50 100 46 93 ... ... Delaware . . . . . . . . . . . . 166 100 59 36 *107 *64 23 100 19 84 ... ... Florida . . . . . . . . . . . . . . 3,092 100 1,895 61 1,197 39 242 100 215 89 ... ... Georgia . . . . . . . . . . . . . 829 100 764 92 *65 *8 392 100 293 75 *98 *25
Hawaii . . . . . . . . . . . . . . 157 100 104 66 ... ... *23 *100 *23 *100 ... ... Idaho . . . . . . . . . . . . . . . 447 100 238 53 208 47 246 100 *162 *66 *85 *34 Illinois . . . . . . . . . . . . . . 1,044 100 955 92 *88 *8 512 100 459 90 ... ... Indiana . . . . . . . . . . . . . . 801 100 720 90 *81 *10 392 100 377 96 ... ... Iowa . . . . . . . . . . . . . . . . 473 100 416 88 *58 *12 253 100 200 79 ... ...
Kansas . . . . . . . . . . . . . . 400 100 372 93 *28 *7 283 100 170 60 *112 *40 Kentucky . . . . . . . . . . . . 554 100 451 81 *103 *19 347 100 316 91 ... ... Louisiana . . . . . . . . . . . . 825 100 700 85 *125 *15 277 100 253 91 ... ... Maine . . . . . . . . . . . . . . 341 100 193 56 149 44 181 100 141 78 *40 *22 Maryland . . . . . . . . . . . . 426 100 347 81 80 19 88 100 *69 *78 *19 *22
Massachusetts . . . . . . . . 532 100 377 71 155 29 56 100 52 93 ... ... Michigan . . . . . . . . . . . . 1,744 100 1,397 80 347 20 529 100 501 95 ... ... Minnesota . . . . . . . . . . . 1,562 100 1,303 83 259 17 477 100 457 96 ... ... Mississippi . . . . . . . . . . 651 100 600 92 ... ... 483 100 436 90 ... ... Missouri . . . . . . . . . . . . 1,071 100 827 77 244 23 576 100 477 83 *100 *17
Montana . . . . . . . . . . . . 267 100 185 69 82 31 150 100 104 70 *46 *30 Nebraska . . . . . . . . . . . . 207 100 177 85 ... ... 128 100 110 86 ... ... Nevada . . . . . . . . . . . . . 147 100 114 78 ... ... 43 100 39 91 ... ... New Hampshire . . . . . . 228 100 153 67 75 33 56 100 42 74 *14 *26 New Jersey . . . . . . . . . . 766 100 509 66 *257 *34 94 100 93 99 ... ...
New Mexico . . . . . . . . . 278 100 213 77 *65 *23 69 100 64 93 ... ... New York . . . . . . . . . . . 1,882 100 1,585 84 297 16 823 100 739 90 *84 *10 North Carolina . . . . . . . 1,525 100 1,196 78 329 22 335 100 259 77 *76 *23 North Dakota . . . . . . . . . (NA) (NA) (NA) (NA) (NA) (NA) (NA) (NA) (NA) (NA) (NA) (NA) Ohio. . . . . . . . . . . . . . . . 1,342 100 1,257 94 *85 *6 553 100 516 93 *37 *7
Oklahoma . . . . . . . . . . . 729 100 680 93 *49 *7 244 100 219 90 ... ... Oregon . . . . . . . . . . . . . . 638 100 373 59 264 41 196 100 181 92 ... ... Pennsylvania . . . . . . . . . 1,101 100 891 81 210 19 775 100 699 90 *76 *10 Rhode Island . . . . . . . . . 175 100 79 45 96 55 20 100 15 77 ... ... South Carolina . . . . . . . 744 100 561 75 *182 *25 254 100 180 71 *74 *29
South Dakota . . . . . . . . . 268 100 156 58 *112 *42 270 100 127 47 144 53 Tennessee . . . . . . . . . . . 826 100 709 86 *117 *14 375 100 276 74 ... ... Texas . . . . . . . . . . . . . . . 2,246 100 2,133 95 *114 *5 1,147 100 1,080 94 *67 *6 Utah . . . . . . . . . . . . . . . . 414 100 343 83 *70 *17 193 100 158 82 *35 *18 Vermont . . . . . . . . . . . . . 207 100 95 46 112 54 90 100 66 74 ... ...
Virginia . . . . . . . . . . . . . 833 100 649 78 184 22 432 100 326 75 *106 *25 Washington . . . . . . . . . . 938 100 835 89 *103 *11 219 100 200 92 ... ... West Virginia . . . . . . . . . 305 100 222 73 *84 *27 247 100 184 74 ... ... Wisconsin . . . . . . . . . . . 1,247 100 910 73 337 27 895 100 763 85 *131 *15 Wyoming . . . . . . . . . . . . 303 100 110 36 *193 *64 140 100 76 54 *64 *46* Estimate based on a sample size of 10–29. … Sample size too small (less than 10) to report data reliably. (NA) Not available.
Note: For the U.S. row, detail does not add to total because of multiple responses. U.S. totals include responses from participants residing in the District of Columbia, as described in Appendix D.

102 2011 National Survey of Fishing, Hunting, and Wildlife-Associated Recreation U.S. Fish and Wildlife Service and U.S. Census Bureau
Table 52. Hunters by Type of Hunting and State Where Hunting Took Place: 2011(Population 16 years old and older. Numbers in thousands)
State where hunting took placeTotal, all hunting Big game Small game Migratory birds Other animalsNumber Percent Number Percent Number Percent Number Percent Number Percent
United States, total . . . . . . . . . . . . 13,674 100 11,570 85 4,506 33 2,583 19 2,168 16
Alabama . . . . . . . . . . . . . . . . . . . 535 100 477 89 *126 *24 ... ... *68 *13 Alaska . . . . . . . . . . . . . . . . . . . . . 125 100 110 88 *25 *20 ... ... ... ... Arizona . . . . . . . . . . . . . . . . . . . . 269 100 *127 *47 *105 *39 *75 *28 ... ... Arkansas . . . . . . . . . . . . . . . . . . . 363 100 318 88 *83 *23 *97 *27 *96 *27 California . . . . . . . . . . . . . . . . . . 394 100 154 39 201 51 221 56 *62 *16
Colorado . . . . . . . . . . . . . . . . . . . 259 100 178 69 *101 *39 ... ... *37 *14 Connecticut . . . . . . . . . . . . . . . . . 50 100 *30 *60 *31 *62 ... ... ... ... Delaware . . . . . . . . . . . . . . . . . . . 23 100 *18 *80 ... ... *9 *39 ... ... Florida . . . . . . . . . . . . . . . . . . . . . 242 100 187 77 ... ... ... ... *77 *32 Georgia . . . . . . . . . . . . . . . . . . . . 392 100 349 89 *117 *30 ... ... *65 *17
Hawaii . . . . . . . . . . . . . . . . . . . . . *23 *100 *22 *96 ... ... ... ... ... ... Idaho . . . . . . . . . . . . . . . . . . . . . . 246 100 177 72 ... ... ... ... ... ... Illinois . . . . . . . . . . . . . . . . . . . . . 512 100 351 69 *237 *46 *156 *30 *153 *30 Indiana . . . . . . . . . . . . . . . . . . . . . 392 100 266 68 *126 *32 ... ... ... ... Iowa . . . . . . . . . . . . . . . . . . . . . . . 253 100 199 79 *131 *52 ... ... ... ...
Kansas . . . . . . . . . . . . . . . . . . . . . 283 100 162 57 189 67 *68 *24 ... ... Kentucky . . . . . . . . . . . . . . . . . . . 347 100 315 91 *134 *39 ... ... ... ... Louisiana . . . . . . . . . . . . . . . . . . . 277 100 217 78 *95 *34 *110 *40 ... ... Maine . . . . . . . . . . . . . . . . . . . . . 181 100 143 79 *60 *33 ... ... *21 *12 Maryland . . . . . . . . . . . . . . . . . . . 88 100 *73 *83 *35 *40 *29 *32 ... ...
Massachusetts . . . . . . . . . . . . . . . 56 100 *41 *72 *26 *46 ... ... ... ... Michigan . . . . . . . . . . . . . . . . . . . 529 100 488 92 *114 *22 ... ... ... ... Minnesota . . . . . . . . . . . . . . . . . . 477 100 412 86 *160 *34 *68 *14 ... ... Mississippi . . . . . . . . . . . . . . . . . 483 100 469 97 *106 *22 *39 *8 ... ... Missouri . . . . . . . . . . . . . . . . . . . 576 100 464 80 146 25 *99 *17 *45 *8
Montana . . . . . . . . . . . . . . . . . . . 150 100 128 86 *55 *36 ... ... ... ... Nebraska . . . . . . . . . . . . . . . . . . . 128 100 93 72 *45 *35 *29 *22 ... ... Nevada . . . . . . . . . . . . . . . . . . . . 43 100 *30 *70 *20 *46 ... ... ... ... New Hampshire . . . . . . . . . . . . . 56 100 46 82 *17 *31 ... ... ... ... New Jersey . . . . . . . . . . . . . . . . . 94 100 89 95 *23 *24 *18 *19 ... ...
New Mexico . . . . . . . . . . . . . . . . 69 100 *44 *64 ... ... ... ... ... ... New York . . . . . . . . . . . . . . . . . . 823 100 777 94 *380 *46 ... ... ... ... North Carolina . . . . . . . . . . . . . . 335 100 281 84 *59 *17 *89 *27 ... ... North Dakota . . . . . . . . . . . . . . . . (NA) (NA) (NA) (NA) (NA) (NA) (NA) (NA) (NA) (NA) Ohio. . . . . . . . . . . . . . . . . . . . . . . 553 100 515 93 *193 *35 ... ... *72 *13
Oklahoma . . . . . . . . . . . . . . . . . . 244 100 *144 *59 *123 *50 ... ... *37 *15 Oregon . . . . . . . . . . . . . . . . . . . . . 196 100 189 96 ... ... ... ... ... ... Pennsylvania . . . . . . . . . . . . . . . . 775 100 755 97 *204 *26 ... ... ... ... Rhode Island . . . . . . . . . . . . . . . . 20 100 *9 *47 *13 *64 *8 *39 ... ... South Carolina . . . . . . . . . . . . . . 254 100 224 88 *63 *25 *63 *25 ... ...
South Dakota . . . . . . . . . . . . . . . . 270 100 122 45 212 78 *58 *21 ... ... Tennessee . . . . . . . . . . . . . . . . . . 375 100 337 90 *122 *33 *114 *30 ... ... Texas . . . . . . . . . . . . . . . . . . . . . . 1,147 100 937 82 *247 *22 *391 *34 432 38 Utah . . . . . . . . . . . . . . . . . . . . . . . 193 100 149 77 *63 *33 *30 *16 ... ... Vermont . . . . . . . . . . . . . . . . . . . . 90 100 84 93 *22 *24 *5 *6 *18 *20
Virginia . . . . . . . . . . . . . . . . . . . . 432 100 405 94 85 20 *85 *20 ... ... Washington . . . . . . . . . . . . . . . . . 219 100 189 86 ... ... ... ... ... ... West Virginia . . . . . . . . . . . . . . . . 247 100 244 99 *86 *35 ... ... ... ... Wisconsin . . . . . . . . . . . . . . . . . . 895 100 785 88 *219 *24 *105 *12 ... ... Wyoming . . . . . . . . . . . . . . . . . . . 140 100 130 93 ... ... ... ... ... ...* Estimate based on a sample size of 10–29. … Sample size too small (less than 10) to report data reliably. (NA) Not available.
Note: Detail does not add to total because of multiple responses. U.S. totals include responses from participants residing in the District of Columbia, as described in Appendix D.

U.S. Fish and Wildlife Service and U.S. Census Bureau 2011 National Survey of Fishing, Hunting, and Wildlife-Associated Recreation 103
Table 53. Days of Hunting by State Where Hunting Took Place and Hunter’s State of Residence: 2011(Population 16 years old and older. Numbers in thousands)
State
Days of hunting in state Days of hunting by state residentsTotal days,
residents and nonresidents
Days by state residents
Days by nonresidents
Total days, in state of residence and other states
Days in state of residence
Days in other states
Number Percent Number Percent Number Percent Number Percent Number Percent Number PercentUnited States, total . . . . . . . . . . . 281,884 100 263,038 93 20,291 7 281,884 100 263,038 93 20,291 7
Alabama . . . . . . . . . . . . . . . . . . 10,548 100 10,285 98 *263 *2 10,393 100 10,285 99 ... ... Alaska . . . . . . . . . . . . . . . . . . . . 1,336 100 1,044 78 ... ... 1,096 100 1,044 95 ... ... Arizona . . . . . . . . . . . . . . . . . . . 2,634 100 2,363 90 *271 *10 3,164 100 2,363 75 ... ... Arkansas . . . . . . . . . . . . . . . . . . 10,967 100 10,006 91 ... ... 10,712 100 10,006 93 ... ... California . . . . . . . . . . . . . . . . . 6,731 100 6,585 98 ... ... 8,036 100 6,585 82 *1,451 *18
Colorado . . . . . . . . . . . . . . . . . . 2,184 100 1,553 71 *630 *29 1,806 100 1,553 86 ... ... Connecticut . . . . . . . . . . . . . . . . 1,011 100 947 94 ... ... 1,348 100 947 70 *401 *30 Delaware . . . . . . . . . . . . . . . . . . 380 100 343 90 ... ... 453 100 343 76 *110 *24 Florida . . . . . . . . . . . . . . . . . . . . 5,252 100 4,969 95 ... ... 6,693 100 4,969 74 *1,724 *26 Georgia . . . . . . . . . . . . . . . . . . . 8,920 100 7,742 87 *1,177 *13 8,318 100 7,742 93 ... ...
Hawaii . . . . . . . . . . . . . . . . . . . . 774 100 *774 *100 ... ... 786 100 *774 *99 ... ... Idaho . . . . . . . . . . . . . . . . . . . . . 3,227 100 *1,983 *61 *1,243 *39 2,009 100 *1,983 *99 ... ... Illinois . . . . . . . . . . . . . . . . . . . . 7,836 100 7,354 94 ... ... 7,786 100 7,354 94 *432 *6 Indiana . . . . . . . . . . . . . . . . . . . . 10,863 100 10,814 100 ... ... 10,926 100 10,814 99 ... ... Iowa . . . . . . . . . . . . . . . . . . . . . . 4,240 100 3,988 94 ... ... 4,163 100 3,988 96 ... ...
Kansas . . . . . . . . . . . . . . . . . . . . 5,209 100 4,075 78 *1,134 *22 4,193 100 4,075 97 ... ... Kentucky . . . . . . . . . . . . . . . . . . 12,222 100 11,402 93 ... ... 11,979 100 11,402 95 ... ... Louisiana . . . . . . . . . . . . . . . . . . 5,222 100 5,044 97 ... ... 6,738 100 5,044 75 *1,694 *25 Maine . . . . . . . . . . . . . . . . . . . . 2,523 100 2,240 89 *283 *11 2,410 100 2,240 93 ... ... Maryland . . . . . . . . . . . . . . . . . . 1,032 100 *919 *89 *112 *11 1,418 100 *919 *65 ... ...
Massachusetts . . . . . . . . . . . . . . 1,062 100 1,041 98 ... ... 1,403 100 1,041 74 *363 *26 Michigan . . . . . . . . . . . . . . . . . . 11,020 100 10,840 98 ... ... 11,358 100 10,840 95 ... ... Minnesota . . . . . . . . . . . . . . . . . 5,589 100 5,502 98 ... ... 8,053 100 5,502 68 *2,551 *32 Mississippi . . . . . . . . . . . . . . . . 9,105 100 8,537 94 ... ... 8,755 100 8,537 98 ... ... Missouri . . . . . . . . . . . . . . . . . . 10,087 100 9,154 91 *932 *9 9,716 100 9,154 94 *562 *6
Montana . . . . . . . . . . . . . . . . . . 2,493 100 2,002 80 *491 *20 2,158 100 2,002 93 ... ... Nebraska . . . . . . . . . . . . . . . . . . 1,554 100 1,490 96 ... ... 1,584 100 1,490 94 ... ... Nevada . . . . . . . . . . . . . . . . . . . 748 100 699 93 ... ... 897 100 699 78 *198 *22 New Hampshire . . . . . . . . . . . . 1,359 100 1,207 89 *153 *11 1,330 100 1,207 91 ... ... New Jersey . . . . . . . . . . . . . . . . 2,400 100 2,380 99 ... ... 2,928 100 2,380 81 *547 *19
New Mexico . . . . . . . . . . . . . . . 927 100 851 92 ... ... 911 100 851 93 ... ... New York . . . . . . . . . . . . . . . . . 18,433 100 17,673 96 *760 *4 17,741 100 17,673 100 ... ... North Carolina . . . . . . . . . . . . . 7,608 100 7,314 96 *293 *4 8,177 100 7,314 89 ... ... North Dakota . . . . . . . . . . . . . . . (NA) (NA) (NA) (NA) (NA) (NA) (NA) (NA) (NA) (NA) (NA) (NA) Ohio. . . . . . . . . . . . . . . . . . . . . . 8,967 100 8,688 97 *278 *3 9,066 100 8,688 96 ... ...
Oklahoma . . . . . . . . . . . . . . . . . 4,968 100 4,790 96 ... ... 5,201 100 4,790 92 ... ... Oregon . . . . . . . . . . . . . . . . . . . . 2,205 100 2,133 97 ... ... 2,264 100 2,133 94 ... ... Pennsylvania . . . . . . . . . . . . . . . 18,247 100 17,648 97 *598 *3 17,826 100 17,648 99 ... ... Rhode Island . . . . . . . . . . . . . . . 419 100 248 59 ... ... 318 100 248 78 *70 *22 South Carolina . . . . . . . . . . . . . 4,353 100 3,882 89 *471 *11 4,255 100 3,882 91 ... ...
South Dakota . . . . . . . . . . . . . . . 3,742 100 2,811 75 930 25 2,901 100 2,811 97 ... ... Tennessee . . . . . . . . . . . . . . . . . 9,846 100 9,507 97 ... ... 9,603 100 9,507 99 ... ... Texas . . . . . . . . . . . . . . . . . . . . . 20,372 100 19,778 97 *594 *3 19,905 100 19,778 99 ... ... Utah . . . . . . . . . . . . . . . . . . . . . . 2,720 100 2,482 91 *238 *9 2,643 100 2,482 94 ... ... Vermont . . . . . . . . . . . . . . . . . . . 1,584 100 1,403 89 ... ... 1,618 100 1,403 87 *215 *13
Virginia . . . . . . . . . . . . . . . . . . . 10,060 100 9,302 92 *758 *8 10,306 100 9,302 90 *1,004 *10 Washington . . . . . . . . . . . . . . . . 2,547 100 2,445 96 ... ... 2,756 100 2,445 89 *311 *11 West Virginia . . . . . . . . . . . . . . . 3,166 100 3,035 96 ... ... 3,254 100 3,035 93 ... ... Wisconsin . . . . . . . . . . . . . . . . . 12,177 100 10,085 83 *2,092 *17 10,219 100 10,085 99 ... ... Wyoming . . . . . . . . . . . . . . . . . . 1,726 100 1,103 64 *623 *36 1,171 100 1,103 94 *68 *6* Estimate based on a sample size of 10–29. … Sample size too small (less than 10) to report data reliably. (NA) Not available.
Note: U.S. totals include responses from participants residing in the District of Columbia, as described in Appendix D.

104 2011 National Survey of Fishing, Hunting, and Wildlife-Associated Recreation U.S. Fish and Wildlife Service and U.S. Census Bureau
Table 54. Days of Hunting by Type of Hunting and State Where Hunting Took Place: 2011(Population 16 years old and older. Numbers in thousands)
State where hunting took placeTotal, all hunting Big game Small game Migratory birds Other animalsNumber Percent Number Percent Number Percent Number Percent Number Percent
United States, total . . . . . . . . . . . . . . 281,884 100 212,116 75 50,884 18 23,263 8 34,434 12
Alabama . . . . . . . . . . . . . . . . . . . . . 10,548 100 8,790 83 *1,282 *12 ... ... *862 *8 Alaska . . . . . . . . . . . . . . . . . . . . . . . 1,336 100 1,211 91 *124 *9 ... ... ... ... Arizona . . . . . . . . . . . . . . . . . . . . . . 2,634 100 *774 *29 *1,443 *55 *324 *12 ... ... Arkansas . . . . . . . . . . . . . . . . . . . . . 10,967 100 9,401 86 *1,253 *11 *2,018 *18 *1,214 *11 California . . . . . . . . . . . . . . . . . . . . 6,731 100 1,824 27 2,045 30 2,860 42 *1,058 *16
Colorado . . . . . . . . . . . . . . . . . . . . . 2,184 100 1,327 61 *730 *33 ... ... *508 *23 Connecticut . . . . . . . . . . . . . . . . . . . 1,011 100 *481 *48 *457 *45 ... ... ... ... Delaware . . . . . . . . . . . . . . . . . . . . . 380 100 *322 *85 ... ... *83 *22 ... ... Florida . . . . . . . . . . . . . . . . . . . . . . . 5,252 100 4,051 77 ... ... ... ... *1,538 *29 Georgia . . . . . . . . . . . . . . . . . . . . . . 8,920 100 8,268 93 *1,966 *22 ... ... *1,907 *21
Hawaii . . . . . . . . . . . . . . . . . . . . . . . *774 *100 *688 *89 ... ... ... ... ... ... Idaho . . . . . . . . . . . . . . . . . . . . . . . . 3,227 100 2,664 83 ... ... ... ... ... ... Illinois . . . . . . . . . . . . . . . . . . . . . . . 7,836 100 4,915 63 *1,220 *16 *1,075 *14 *1,174 *15 Indiana . . . . . . . . . . . . . . . . . . . . . . . 10,863 100 6,261 58 *1,666 *15 ... ... ... ... Iowa . . . . . . . . . . . . . . . . . . . . . . . . . 4,240 100 3,106 73 *1,169 *28 ... ... ... ...
Kansas . . . . . . . . . . . . . . . . . . . . . . . 5,209 100 3,486 67 1,644 32 *357 *7 ... ... Kentucky . . . . . . . . . . . . . . . . . . . . . 12,222 100 9,720 80 *1,742 *14 ... ... ... ... Louisiana . . . . . . . . . . . . . . . . . . . . . 5,222 100 3,697 71 *950 *18 *1,085 *21 ... ... Maine . . . . . . . . . . . . . . . . . . . . . . . 2,523 100 1,827 72 *802 *32 ... ... *237 *9 Maryland . . . . . . . . . . . . . . . . . . . . . 1,032 100 *786 *76 *136 *13 *152 *15 ... ...
Massachusetts . . . . . . . . . . . . . . . . . 1,062 100 *769 *72 *268 *25 ... ... ... ... Michigan . . . . . . . . . . . . . . . . . . . . . 11,020 100 9,584 87 *1,208 *11 ... ... ... ... Minnesota . . . . . . . . . . . . . . . . . . . . 5,589 100 3,573 64 *2,014 *36 *1,238 *22 ... ... Mississippi . . . . . . . . . . . . . . . . . . . 9,105 100 7,410 81 *1,445 *16 *231 *3 ... ... Missouri . . . . . . . . . . . . . . . . . . . . . 10,087 100 8,386 83 1,298 13 *848 *8 *629 *6
Montana . . . . . . . . . . . . . . . . . . . . . 2,493 100 2,040 82 *678 *27 ... ... ... ... Nebraska . . . . . . . . . . . . . . . . . . . . . 1,554 100 1,081 70 *332 *21 *255 *16 ... ... Nevada . . . . . . . . . . . . . . . . . . . . . . 748 100 *343 *46 *316 *42 ... ... ... ... New Hampshire . . . . . . . . . . . . . . . 1,359 100 1,057 78 *185 *14 ... ... ... ... New Jersey . . . . . . . . . . . . . . . . . . . 2,400 100 2,078 87 *270 *11 *225 *9 ... ...
New Mexico . . . . . . . . . . . . . . . . . . 927 100 *569 *61 ... ... ... ... ... ... New York . . . . . . . . . . . . . . . . . . . . 18,433 100 15,649 85 *3,620 *20 ... ... ... ... North Carolina . . . . . . . . . . . . . . . . 7,608 100 5,059 67 *1,343 *18 *1,665 *22 ... ... North Dakota . . . . . . . . . . . . . . . . . . (NA) (NA) (NA) (NA) (NA) (NA) (NA) (NA) (NA) (NA) Ohio. . . . . . . . . . . . . . . . . . . . . . . . . 8,967 100 6,747 75 *1,884 *21 ... ... *1,297 *14
Oklahoma . . . . . . . . . . . . . . . . . . . . 4,968 100 *2,776 *56 *1,399 *28 ... ... *1,679 *34 Oregon . . . . . . . . . . . . . . . . . . . . . . . 2,205 100 1,918 87 ... ... ... ... ... ... Pennsylvania . . . . . . . . . . . . . . . . . . 18,247 100 17,389 95 *1,152 *6 ... ... ... ... Rhode Island . . . . . . . . . . . . . . . . . . 419 100 *234 *56 *147 *35 *71 *17 ... ... South Carolina . . . . . . . . . . . . . . . . 4,353 100 3,559 82 *438 *10 *333 *8 ... ...
South Dakota . . . . . . . . . . . . . . . . . . 3,742 100 982 26 1,660 44 *342 *9 ... ... Tennessee . . . . . . . . . . . . . . . . . . . . 9,846 100 7,622 77 *3,061 *31 *593 *6 ... ... Texas . . . . . . . . . . . . . . . . . . . . . . . . 20,372 100 12,651 62 *3,238 *16 *1,672 *8 7,882 39 Utah . . . . . . . . . . . . . . . . . . . . . . . . . 2,720 100 1,962 72 *452 *17 *597 *22 ... ... Vermont . . . . . . . . . . . . . . . . . . . . . . 1,584 100 1,406 89 *225 *14 *35 *2 *92 *6
Virginia . . . . . . . . . . . . . . . . . . . . . . 10,060 100 9,396 93 *699 *7 *262 *3 ... ... Washington . . . . . . . . . . . . . . . . . . . 2,547 100 2,210 87 ... ... ... ... ... ... West Virginia . . . . . . . . . . . . . . . . . . 3,166 100 2,580 81 *851 *27 ... ... ... ... Wisconsin . . . . . . . . . . . . . . . . . . . . 12,177 100 8,575 70 *2,640 *22 *1,276 *10 ... ... Wyoming . . . . . . . . . . . . . . . . . . . . . 1,726 100 1,487 86 ... ... ... ... ... ...* Estimate based on a sample size of 10–29. … Sample size too small (less than 10) to report data reliably. (NA) Not available.
Note: Detail does not add to total because of multiple responses. U.S. totals include responses from participants residing in the District of Columbia, as described in Appendix D.
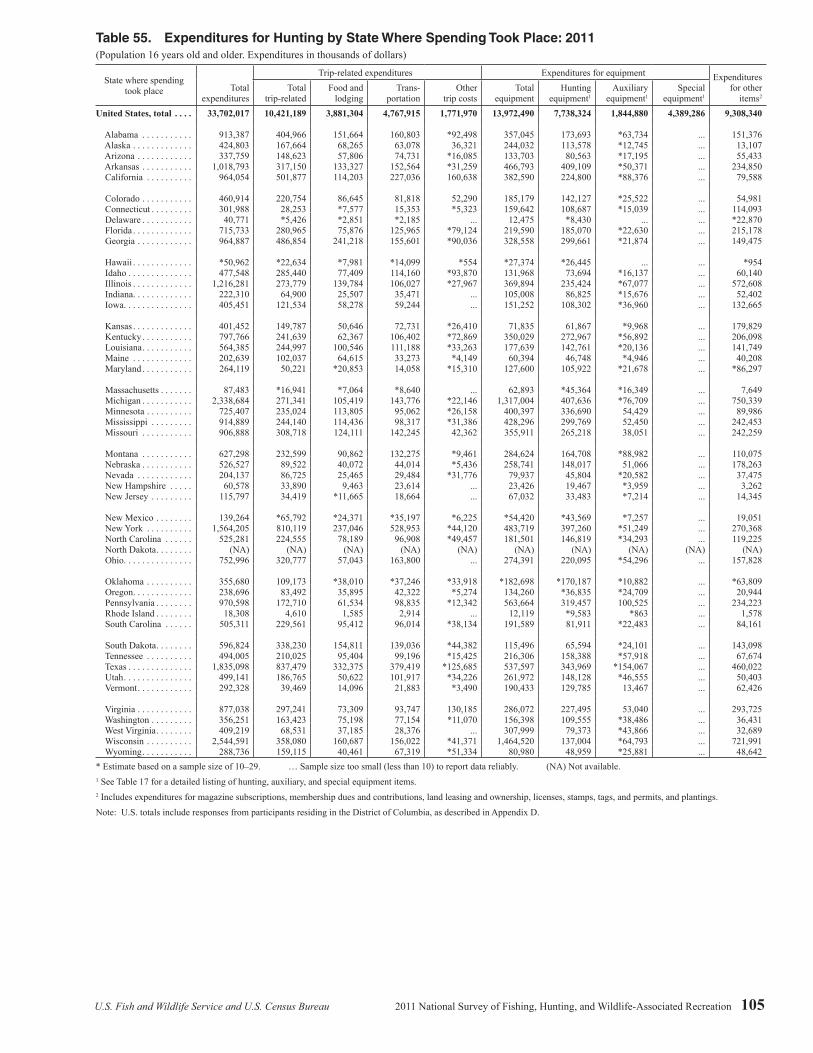
U.S. Fish and Wildlife Service and U.S. Census Bureau 2011 National Survey of Fishing, Hunting, and Wildlife-Associated Recreation 105
Table 55. Expenditures for Hunting by State Where Spending Took Place: 2011(Population 16 years old and older. Expenditures in thousands of dollars)
State where spending took place Total
expenditures
Trip-related expenditures Expenditures for equipment Expenditures for other
items2Total
trip-relatedFood and
lodgingTrans-
portationOther
trip costsTotal
equipmentHunting
equipment1Auxiliary
equipment1Special
equipment1
United States, total . . . . 33,702,017 10,421,189 3,881,304 4,767,915 1,771,970 13,972,490 7,738,324 1,844,880 4,389,286 9,308,340
Alabama . . . . . . . . . . . 913,387 404,966 151,664 160,803 *92,498 357,045 173,693 *63,734 ... 151,376 Alaska . . . . . . . . . . . . . 424,803 167,664 68,265 63,078 36,321 244,032 113,578 *12,745 ... 13,107 Arizona . . . . . . . . . . . . 337,759 148,623 57,806 74,731 *16,085 133,703 80,563 *17,195 ... 55,433 Arkansas . . . . . . . . . . . 1,018,793 317,150 133,327 152,564 *31,259 466,793 409,109 *50,371 ... 234,850 California . . . . . . . . . . 964,054 501,877 114,203 227,036 160,638 382,590 224,800 *88,376 ... 79,588
Colorado . . . . . . . . . . . 460,914 220,754 86,645 81,818 52,290 185,179 142,127 *25,522 ... 54,981 Connecticut . . . . . . . . . 301,988 28,253 *7,577 15,353 *5,323 159,642 108,687 *15,039 ... 114,093 Delaware . . . . . . . . . . . 40,771 *5,426 *2,851 *2,185 ... 12,475 *8,430 ... ... *22,870 Florida . . . . . . . . . . . . . 715,733 280,965 75,876 125,965 *79,124 219,590 185,070 *22,630 ... 215,178 Georgia . . . . . . . . . . . . 964,887 486,854 241,218 155,601 *90,036 328,558 299,661 *21,874 ... 149,475
Hawaii . . . . . . . . . . . . . *50,962 *22,634 *7,981 *14,099 *554 *27,374 *26,445 ... ... *954 Idaho . . . . . . . . . . . . . . 477,548 285,440 77,409 114,160 *93,870 131,968 73,694 *16,137 ... 60,140 Illinois . . . . . . . . . . . . . 1,216,281 273,779 139,784 106,027 *27,967 369,894 235,424 *67,077 ... 572,608 Indiana . . . . . . . . . . . . . 222,310 64,900 25,507 35,471 ... 105,008 86,825 *15,676 ... 52,402 Iowa . . . . . . . . . . . . . . . 405,451 121,534 58,278 59,244 ... 151,252 108,302 *36,960 ... 132,665
Kansas . . . . . . . . . . . . . 401,452 149,787 50,646 72,731 *26,410 71,835 61,867 *9,968 ... 179,829 Kentucky . . . . . . . . . . . 797,766 241,639 62,367 106,402 *72,869 350,029 272,967 *56,892 ... 206,098 Louisiana . . . . . . . . . . . 564,385 244,997 100,546 111,188 *33,263 177,639 142,761 *20,136 ... 141,749 Maine . . . . . . . . . . . . . 202,639 102,037 64,615 33,273 *4,149 60,394 46,748 *4,946 ... 40,208 Maryland . . . . . . . . . . . 264,119 50,221 *20,853 14,058 *15,310 127,600 105,922 *21,678 ... *86,297
Massachusetts . . . . . . . 87,483 *16,941 *7,064 *8,640 ... 62,893 *45,364 *16,349 ... 7,649 Michigan . . . . . . . . . . . 2,338,684 271,341 105,419 143,776 *22,146 1,317,004 407,636 *76,709 ... 750,339 Minnesota . . . . . . . . . . 725,407 235,024 113,805 95,062 *26,158 400,397 336,690 54,429 ... 89,986 Mississippi . . . . . . . . . 914,889 244,140 114,436 98,317 *31,386 428,296 299,769 52,450 ... 242,453 Missouri . . . . . . . . . . . 906,888 308,718 124,111 142,245 42,362 355,911 265,218 38,051 ... 242,259
Montana . . . . . . . . . . . 627,298 232,599 90,862 132,275 *9,461 284,624 164,708 *88,982 ... 110,075 Nebraska . . . . . . . . . . . 526,527 89,522 40,072 44,014 *5,436 258,741 148,017 51,066 ... 178,263 Nevada . . . . . . . . . . . . 204,137 86,725 25,465 29,484 *31,776 79,937 45,804 *20,582 ... 37,475 New Hampshire . . . . . 60,578 33,890 9,463 23,614 ... 23,426 19,467 *3,959 ... 3,262 New Jersey . . . . . . . . . 115,797 34,419 *11,665 18,664 ... 67,032 33,483 *7,214 ... 14,345
New Mexico . . . . . . . . 139,264 *65,792 *24,371 *35,197 *6,225 *54,420 *43,569 *7,257 ... 19,051 New York . . . . . . . . . . 1,564,205 810,119 237,046 528,953 *44,120 483,719 397,260 *51,249 ... 270,368 North Carolina . . . . . . 525,281 224,555 78,189 96,908 *49,457 181,501 146,819 *34,293 ... 119,225 North Dakota . . . . . . . . (NA) (NA) (NA) (NA) (NA) (NA) (NA) (NA) (NA) (NA) Ohio. . . . . . . . . . . . . . . 752,996 320,777 57,043 163,800 ... 274,391 220,095 *54,296 ... 157,828
Oklahoma . . . . . . . . . . 355,680 109,173 *38,010 *37,246 *33,918 *182,698 *170,187 *10,882 ... *63,809 Oregon . . . . . . . . . . . . . 238,696 83,492 35,895 42,322 *5,274 134,260 *36,835 *24,709 ... 20,944 Pennsylvania . . . . . . . . 970,598 172,710 61,534 98,835 *12,342 563,664 319,457 100,525 ... 234,223 Rhode Island . . . . . . . . 18,308 4,610 1,585 2,914 ... 12,119 *9,583 *863 ... 1,578 South Carolina . . . . . . 505,311 229,561 95,412 96,014 *38,134 191,589 81,911 *22,483 ... 84,161
South Dakota . . . . . . . . 596,824 338,230 154,811 139,036 *44,382 115,496 65,594 *24,101 ... 143,098 Tennessee . . . . . . . . . . 494,005 210,025 95,404 99,196 *15,425 216,306 158,388 *57,918 ... 67,674 Texas . . . . . . . . . . . . . . 1,835,098 837,479 332,375 379,419 *125,685 537,597 343,969 *154,067 ... 460,022 Utah . . . . . . . . . . . . . . . 499,141 186,765 50,622 101,917 *34,226 261,972 148,128 *46,555 ... 50,403 Vermont . . . . . . . . . . . . 292,328 39,469 14,096 21,883 *3,490 190,433 129,785 13,467 ... 62,426
Virginia . . . . . . . . . . . . 877,038 297,241 73,309 93,747 130,185 286,072 227,495 53,040 ... 293,725 Washington . . . . . . . . . 356,251 163,423 75,198 77,154 *11,070 156,398 109,555 *38,486 ... 36,431 West Virginia . . . . . . . . 409,219 68,531 37,185 28,376 ... 307,999 79,373 *43,866 ... 32,689 Wisconsin . . . . . . . . . . 2,544,591 358,080 160,687 156,022 *41,371 1,464,520 137,004 *64,793 ... 721,991 Wyoming . . . . . . . . . . . 288,736 159,115 40,461 67,319 *51,334 80,980 48,959 *25,881 ... 48,642* Estimate based on a sample size of 10–29. … Sample size too small (less than 10) to report data reliably. (NA) Not available.1 See Table 17 for a detailed listing of hunting, auxiliary, and special equipment items.2 Includes expenditures for magazine subscriptions, membership dues and contributions, land leasing and ownership, licenses, stamps, tags, and permits, and plantings.
Note: U.S. totals include responses from participants residing in the District of Columbia, as described in Appendix D.

106 2011 National Survey of Fishing, Hunting, and Wildlife-Associated Recreation U.S. Fish and Wildlife Service and U.S. Census Bureau
Table 56. Freshwater (Except Great Lakes) Anglers and Days of Fishing by State Where Fishing Took Place: 2011
(Population 16 years old and older. Numbers in thousands)
State where fishing took place
Anglers Days of fishingTotal anglers, residents and nonresidents
State residents Nonresidents Total days, residents and nonresidents
Days by state residents
Days by nonresidents
Number Percent Number Percent Number Percent Number Percent Number Percent Number PercentUnited States, total . . . . . . . . 27,060 100 24,914 92 4,540 17 443,223 100 403,207 91 42,801 10
Alabama . . . . . . . . . . . . . . . 598 100 451 75 *147 *25 9,746 100 8,999 92 *746 *8 Alaska . . . . . . . . . . . . . . . . . 302 100 166 55 *136 *45 2,995 100 2,139 71 *857 *29 Arizona . . . . . . . . . . . . . . . . 637 100 533 84 *104 *16 4,825 100 4,141 86 *684 *14 Arkansas . . . . . . . . . . . . . . . 555 100 458 83 *97 *17 15,662 100 15,055 96 *607 *4 California . . . . . . . . . . . . . . 1,352 100 1,304 96 48 4 17,382 100 17,086 98 296 2
Colorado . . . . . . . . . . . . . . . 767 100 593 77 175 23 8,433 100 7,490 89 943 11 Connecticut . . . . . . . . . . . . . 243 100 211 87 *33 *13 3,518 100 3,416 97 *102 *3 Delaware . . . . . . . . . . . . . . . 55 100 28 51 ... ... 655 100 567 87 ... ... Florida . . . . . . . . . . . . . . . . . 1,214 100 956 79 258 21 25,729 100 21,001 82 4,728 18 Georgia . . . . . . . . . . . . . . . . 763 100 725 95 ... ... 8,106 100 7,932 98 ... ...
Hawaii . . . . . . . . . . . . . . . . . ... ... ... ... ... ... ... ... ... ... ... ... Idaho . . . . . . . . . . . . . . . . . . 447 100 238 53 208 47 5,507 100 2,165 39 3,342 61 Illinois . . . . . . . . . . . . . . . . . 937 100 861 92 *76 *8 12,312 100 11,959 97 *353 *3 Indiana . . . . . . . . . . . . . . . . . 716 100 636 89 *81 *11 19,324 100 18,787 97 *537 *3 Iowa . . . . . . . . . . . . . . . . . . . 473 100 416 88 *58 *12 5,978 100 5,790 97 *187 *3
Kansas . . . . . . . . . . . . . . . . . 400 100 372 93 *28 *7 4,163 100 4,088 98 *75 *2 Kentucky . . . . . . . . . . . . . . . 554 100 451 81 *103 *19 10,245 100 9,385 92 *860 *8 Louisiana . . . . . . . . . . . . . . . 720 100 642 89 ... ... 16,665 100 16,437 99 ... ... Maine . . . . . . . . . . . . . . . . . 283 100 173 61 111 39 3,223 100 2,403 75 820 25 Maryland . . . . . . . . . . . . . . . 227 100 192 84 *36 *16 3,160 100 2,809 89 *351 *11
Massachusetts . . . . . . . . . . . 294 100 232 79 *62 *21 4,499 100 4,211 94 *288 *6 Michigan . . . . . . . . . . . . . . . 1,361 100 1,054 77 307 23 20,961 100 19,006 91 1,955 9 Minnesota . . . . . . . . . . . . . . 1,413 100 1,159 82 254 18 20,768 100 19,086 92 1,682 8 Mississippi . . . . . . . . . . . . . 609 100 562 92 ... ... 7,751 100 7,086 91 ... ... Missouri . . . . . . . . . . . . . . . 1,071 100 827 77 244 23 14,865 100 13,263 89 1,603 11
Montana . . . . . . . . . . . . . . . 267 100 185 69 82 31 2,450 100 2,091 85 358 15 Nebraska . . . . . . . . . . . . . . . 207 100 177 85 ... ... 2,595 100 2,493 96 ... ... Nevada . . . . . . . . . . . . . . . . 147 100 114 78 ... ... 1,400 100 1,295 93 ... ... New Hampshire . . . . . . . . . 209 100 140 67 69 33 3,606 100 3,121 87 485 13 New Jersey . . . . . . . . . . . . . 258 100 251 97 ... ... 2,680 100 2,597 97 ... ...
New Mexico . . . . . . . . . . . . 278 100 213 77 *65 *23 3,899 100 3,622 93 *278 *7 New York . . . . . . . . . . . . . . 1,212 100 1,056 87 156 13 19,200 100 18,257 95 942 5 North Carolina . . . . . . . . . . 1,054 100 948 90 *106 *10 15,764 100 15,446 98 *317 *2 North Dakota . . . . . . . . . . . . (NA) (NA) (NA) (NA) (NA) (NA) (NA) (NA) (NA) (NA) (NA) (NA) Ohio. . . . . . . . . . . . . . . . . . . 1,161 100 1,099 95 *62 *5 14,040 100 13,523 96 *517 *4
Oklahoma . . . . . . . . . . . . . . 729 100 680 93 *49 *7 8,499 100 7,943 93 *556 *7 Oregon . . . . . . . . . . . . . . . . . 516 100 347 67 169 33 5,201 100 4,173 80 1,029 20 Pennsylvania . . . . . . . . . . . . 874 100 695 80 179 20 8,906 100 7,335 82 1,572 18 Rhode Island . . . . . . . . . . . . 42 100 34 80 ... ... 739 100 690 93 ... ... South Carolina . . . . . . . . . . 537 100 437 81 *100 *19 9,221 100 8,843 96 *378 *4
South Dakota . . . . . . . . . . . . 268 100 156 58 *112 *42 4,069 100 3,525 87 *544 *13 Tennessee . . . . . . . . . . . . . . 826 100 709 86 *117 *14 16,957 100 16,041 95 *916 *5 Texas . . . . . . . . . . . . . . . . . . 1,758 100 1,666 95 *92 *5 22,616 100 22,099 98 *518 *2 Utah . . . . . . . . . . . . . . . . . . . 414 100 343 83 *70 *17 5,979 100 5,373 90 *606 *10 Vermont . . . . . . . . . . . . . . . . 207 100 95 46 112 54 2,215 100 1,751 79 464 21
Virginia . . . . . . . . . . . . . . . . 551 100 455 82 *97 *18 7,904 100 7,422 94 *481 *6 Washington . . . . . . . . . . . . . 743 100 660 89 *84 *11 10,940 100 10,650 97 *290 *3 West Virginia . . . . . . . . . . . . 305 100 222 73 *84 *27 4,521 100 4,271 94 *250 *6 Wisconsin . . . . . . . . . . . . . . 1,107 100 808 73 299 27 19,950 100 13,514 68 6,436 32 Wyoming . . . . . . . . . . . . . . . 303 100 110 36 *193 *64 3,123 100 2,009 64 *1,114 *36* Estimate based on a sample size of 10–29. … Sample size too small (less than 10) to report data reliably. (NA) Not available.
Note: For the U.S. row, detail does not add to total because of multiple responses. U.S. totals include responses from participants residing in the District of Columbia, as described in Appendix D.
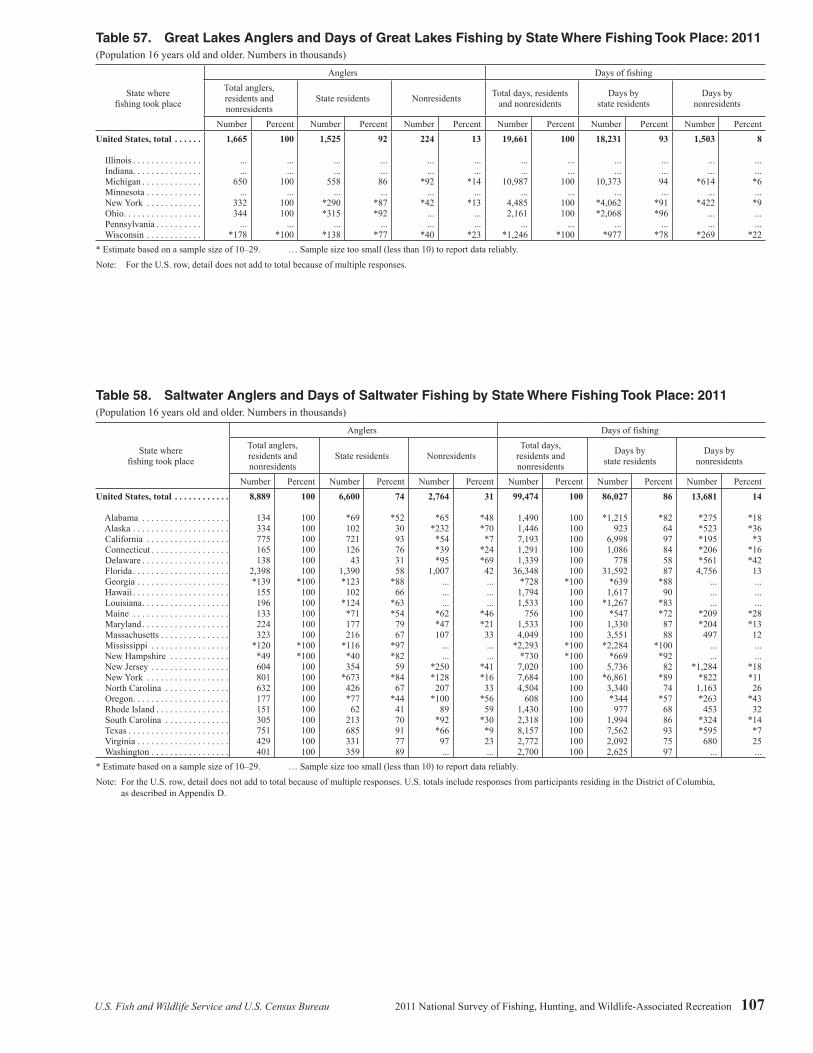
U.S. Fish and Wildlife Service and U.S. Census Bureau 2011 National Survey of Fishing, Hunting, and Wildlife-Associated Recreation 107
Table 57. Great Lakes Anglers and Days of Great Lakes Fishing by State Where Fishing Took Place: 2011(Population 16 years old and older. Numbers in thousands)
State where fishing took place
Anglers Days of fishingTotal anglers, residents and nonresidents
State residents Nonresidents Total days, residents and nonresidents
Days by state residents
Days by nonresidents
Number Percent Number Percent Number Percent Number Percent Number Percent Number PercentUnited States, total . . . . . . 1,665 100 1,525 92 224 13 19,661 100 18,231 93 1,503 8
Illinois . . . . . . . . . . . . . . . ... ... ... ... ... ... ... ... ... ... ... ... Indiana . . . . . . . . . . . . . . . ... ... ... ... ... ... ... ... ... ... ... ... Michigan . . . . . . . . . . . . . 650 100 558 86 *92 *14 10,987 100 10,373 94 *614 *6 Minnesota . . . . . . . . . . . . ... ... ... ... ... ... ... ... ... ... ... ... New York . . . . . . . . . . . . 332 100 *290 *87 *42 *13 4,485 100 *4,062 *91 *422 *9 Ohio. . . . . . . . . . . . . . . . . 344 100 *315 *92 ... ... 2,161 100 *2,068 *96 ... ... Pennsylvania . . . . . . . . . . ... ... ... ... ... ... ... ... ... ... ... ... Wisconsin . . . . . . . . . . . . *178 *100 *138 *77 *40 *23 *1,246 *100 *977 *78 *269 *22* Estimate based on a sample size of 10–29. … Sample size too small (less than 10) to report data reliably.
Note: For the U.S. row, detail does not add to total because of multiple responses.
Table 58. Saltwater Anglers and Days of Saltwater Fishing by State Where Fishing Took Place: 2011(Population 16 years old and older. Numbers in thousands)
State where fishing took place
Anglers Days of fishingTotal anglers, residents and nonresidents
State residents NonresidentsTotal days,
residents and nonresidents
Days by state residents
Days by nonresidents
Number Percent Number Percent Number Percent Number Percent Number Percent Number PercentUnited States, total . . . . . . . . . . . . 8,889 100 6,600 74 2,764 31 99,474 100 86,027 86 13,681 14
Alabama . . . . . . . . . . . . . . . . . . . 134 100 *69 *52 *65 *48 1,490 100 *1,215 *82 *275 *18 Alaska . . . . . . . . . . . . . . . . . . . . . 334 100 102 30 *232 *70 1,446 100 923 64 *523 *36 California . . . . . . . . . . . . . . . . . . 775 100 721 93 *54 *7 7,193 100 6,998 97 *195 *3 Connecticut . . . . . . . . . . . . . . . . . 165 100 126 76 *39 *24 1,291 100 1,086 84 *206 *16 Delaware . . . . . . . . . . . . . . . . . . . 138 100 43 31 *95 *69 1,339 100 778 58 *561 *42 Florida . . . . . . . . . . . . . . . . . . . . . 2,398 100 1,390 58 1,007 42 36,348 100 31,592 87 4,756 13 Georgia . . . . . . . . . . . . . . . . . . . . *139 *100 *123 *88 ... ... *728 *100 *639 *88 ... ... Hawaii . . . . . . . . . . . . . . . . . . . . . 155 100 102 66 ... ... 1,794 100 1,617 90 ... ... Louisiana . . . . . . . . . . . . . . . . . . . 196 100 *124 *63 ... ... 1,533 100 *1,267 *83 ... ... Maine . . . . . . . . . . . . . . . . . . . . . 133 100 *71 *54 *62 *46 756 100 *547 *72 *209 *28 Maryland . . . . . . . . . . . . . . . . . . . 224 100 177 79 *47 *21 1,533 100 1,330 87 *204 *13 Massachusetts . . . . . . . . . . . . . . . 323 100 216 67 107 33 4,049 100 3,551 88 497 12 Mississippi . . . . . . . . . . . . . . . . . *120 *100 *116 *97 ... ... *2,293 *100 *2,284 *100 ... ... New Hampshire . . . . . . . . . . . . . *49 *100 *40 *82 ... ... *730 *100 *669 *92 ... ... New Jersey . . . . . . . . . . . . . . . . . 604 100 354 59 *250 *41 7,020 100 5,736 82 *1,284 *18 New York . . . . . . . . . . . . . . . . . . 801 100 *673 *84 *128 *16 7,684 100 *6,861 *89 *822 *11 North Carolina . . . . . . . . . . . . . . 632 100 426 67 207 33 4,504 100 3,340 74 1,163 26 Oregon . . . . . . . . . . . . . . . . . . . . . 177 100 *77 *44 *100 *56 608 100 *344 *57 *263 *43 Rhode Island . . . . . . . . . . . . . . . . 151 100 62 41 89 59 1,430 100 977 68 453 32 South Carolina . . . . . . . . . . . . . . 305 100 213 70 *92 *30 2,318 100 1,994 86 *324 *14 Texas . . . . . . . . . . . . . . . . . . . . . . 751 100 685 91 *66 *9 8,157 100 7,562 93 *595 *7 Virginia . . . . . . . . . . . . . . . . . . . . 429 100 331 77 97 23 2,772 100 2,092 75 680 25 Washington . . . . . . . . . . . . . . . . . 401 100 359 89 ... ... 2,700 100 2,625 97 ... ...* Estimate based on a sample size of 10–29. … Sample size too small (less than 10) to report data reliably.
Note: For the U.S. row, detail does not add to total because of multiple responses. U.S. totals include responses from participants residing in the District of Columbia, as described in Appendix D.

108 2011 National Survey of Fishing, Hunting, and Wildlife-Associated Recreation U.S. Fish and Wildlife Service and U.S. Census Bureau
Table 59. Days of Fishing by State Where Fishing Took Place and Angler’s State of Residence: 2011(Population 16 years old and older. Numbers in thousands)
State
Days of fishing in state Days of fishing by state residentsTotal days,
residents and nonresidents
Days by state residents
Days by nonresidents
Total days, in state of residence and other states
Days in state of residence
Days in other states
Number Percent Number Percent Number Percent Number Percent Number Percent Number PercentUnited States, total . . . . . . . . . . . . 553,841 100 502,008 91 57,499 10 553,841 100 502,008 91 57,499 10
Alabama . . . . . . . . . . . . . . . . . . . 10,878 100 9,905 91 974 9 10,176 100 9,905 97 272 3 Alaska . . . . . . . . . . . . . . . . . . . . . 4,360 100 3,073 70 1,287 30 3,121 100 3,073 98 48 2 Arizona . . . . . . . . . . . . . . . . . . . . 4,825 100 4,141 86 *684 *14 5,283 100 4,141 78 1,143 22 Arkansas . . . . . . . . . . . . . . . . . . . 15,662 100 15,055 96 *607 *4 15,141 100 15,055 99 86 1 California . . . . . . . . . . . . . . . . . . 23,754 100 23,267 98 487 2 25,662 100 23,267 91 2,395 9
Colorado . . . . . . . . . . . . . . . . . . . 8,433 100 7,490 89 943 11 8,726 100 7,490 86 1,236 14 Connecticut . . . . . . . . . . . . . . . . . 4,705 100 4,395 93 *310 *7 5,713 100 4,395 77 1,318 23 Delaware . . . . . . . . . . . . . . . . . . . 2,052 100 1,328 65 *724 *35 1,681 100 1,328 79 353 21 Florida . . . . . . . . . . . . . . . . . . . . . 57,594 100 48,050 83 9,544 17 49,500 100 48,050 97 1,450 3 Georgia . . . . . . . . . . . . . . . . . . . . 8,729 100 8,456 97 *273 *3 9,061 100 8,456 93 605 7
Hawaii . . . . . . . . . . . . . . . . . . . . . 1,882 100 1,705 91 ... ... 1,739 100 1,705 98 34 2 Idaho . . . . . . . . . . . . . . . . . . . . . . 5,507 100 2,165 39 3,342 61 2,424 100 2,165 89 259 11 Illinois . . . . . . . . . . . . . . . . . . . . . 13,343 100 12,946 97 *397 *3 15,614 100 12,946 83 2,667 17 Indiana . . . . . . . . . . . . . . . . . . . . . 20,775 100 20,238 97 *537 *3 21,542 100 20,238 94 1,304 6 Iowa . . . . . . . . . . . . . . . . . . . . . . . 5,978 100 5,790 97 *187 *3 6,909 100 5,790 84 1,119 16
Kansas . . . . . . . . . . . . . . . . . . . . . 4,163 100 4,088 98 *75 *2 4,694 100 4,088 87 605 13 Kentucky . . . . . . . . . . . . . . . . . . . 10,245 100 9,385 92 *860 *8 10,245 100 9,385 92 860 8 Louisiana . . . . . . . . . . . . . . . . . . . 18,079 100 17,586 97 *494 *3 18,351 100 17,586 96 765 4 Maine . . . . . . . . . . . . . . . . . . . . . 3,873 100 2,897 75 976 25 2,915 100 2,897 99 18 1 Maryland . . . . . . . . . . . . . . . . . . . 4,711 100 4,160 88 550 12 5,676 100 4,160 73 1,516 27
Massachusetts . . . . . . . . . . . . . . . 8,367 100 7,589 91 779 9 9,166 100 7,589 83 1,578 17 Michigan . . . . . . . . . . . . . . . . . . . 28,177 100 26,014 92 2,164 8 26,744 100 26,014 97 730 3 Minnesota . . . . . . . . . . . . . . . . . . 21,702 100 19,959 92 1,743 8 24,903 100 19,959 80 4,944 20 Mississippi . . . . . . . . . . . . . . . . . 9,176 100 8,501 93 ... ... 8,700 100 8,501 98 199 2 Missouri . . . . . . . . . . . . . . . . . . . 14,865 100 13,263 89 1,603 11 14,448 100 13,263 92 1,185 8
Montana . . . . . . . . . . . . . . . . . . . 2,450 100 2,091 85 358 15 3,263 100 2,091 64 1,172 36 Nebraska . . . . . . . . . . . . . . . . . . . 2,595 100 2,493 96 ... ... 2,924 100 2,493 85 432 15 Nevada . . . . . . . . . . . . . . . . . . . . 1,400 100 1,295 93 ... ... 2,044 100 1,295 63 749 37 New Hampshire . . . . . . . . . . . . . 4,370 100 3,870 89 499 11 4,155 100 3,870 93 284 7 New Jersey . . . . . . . . . . . . . . . . . 9,454 100 8,087 86 *1,367 *14 9,578 100 8,087 84 1,491 16
New Mexico . . . . . . . . . . . . . . . . 3,899 100 3,622 93 *278 *7 3,868 100 3,622 94 247 6 New York . . . . . . . . . . . . . . . . . . 29,874 100 27,804 93 2,071 7 29,112 100 27,804 96 1,309 4 North Carolina . . . . . . . . . . . . . . 23,472 100 21,939 93 1,532 7 23,491 100 21,939 93 1,552 7 North Dakota . . . . . . . . . . . . . . . . (NA) (NA) (NA) (NA) (NA) (NA) (NA) (NA) (NA) (NA) (NA) (NA) Ohio. . . . . . . . . . . . . . . . . . . . . . . 16,874 100 16,264 96 *609 *4 19,116 100 16,264 85 2,851 15
Oklahoma . . . . . . . . . . . . . . . . . . 8,499 100 7,943 93 *556 *7 8,661 100 7,943 92 718 8 Oregon . . . . . . . . . . . . . . . . . . . . . 5,658 100 4,396 78 1,263 22 4,673 100 4,396 94 277 6 Pennsylvania . . . . . . . . . . . . . . . . 10,136 100 8,364 83 1,772 17 9,926 100 8,364 84 1,562 16 Rhode Island . . . . . . . . . . . . . . . . 2,080 100 1,579 76 501 24 1,764 100 1,579 90 184 10 South Carolina . . . . . . . . . . . . . . 11,189 100 10,487 94 *702 *6 11,459 100 10,487 92 973 8
South Dakota . . . . . . . . . . . . . . . . 4,069 100 3,525 87 *544 *13 3,649 100 3,525 97 124 3 Tennessee . . . . . . . . . . . . . . . . . . 16,957 100 16,041 95 *916 *5 17,834 100 16,041 90 1,793 10 Texas . . . . . . . . . . . . . . . . . . . . . . 30,667 100 29,572 96 *1,095 *4 34,735 100 29,572 85 5,163 15 Utah . . . . . . . . . . . . . . . . . . . . . . . 5,979 100 5,373 90 *606 *10 5,612 100 5,373 96 239 4 Vermont . . . . . . . . . . . . . . . . . . . . 2,215 100 1,751 79 464 21 1,885 100 1,751 93 134 7
Virginia . . . . . . . . . . . . . . . . . . . . 10,521 100 9,367 89 1,153 11 10,342 100 9,367 91 975 9 Washington . . . . . . . . . . . . . . . . . 13,449 100 13,107 97 *341 *3 17,818 100 13,107 74 4,711 26 West Virginia . . . . . . . . . . . . . . . . 4,521 100 4,271 94 *250 *6 4,767 100 4,271 90 495 10 Wisconsin . . . . . . . . . . . . . . . . . . 21,284 100 14,576 68 6,708 32 15,320 100 14,576 95 744 5 Wyoming . . . . . . . . . . . . . . . . . . . 3,123 100 2,009 64 *1,114 *36 2,170 100 2,009 93 161 7* Estimate based on a sample size of 10–29. … Sample size too small (less than 10) to report data reliably. (NA) Not available.
Note: U.S. totals include responses from participants residing in the District of Columbia, as described in Appendix D.

U.S. Fish and Wildlife Service and U.S. Census Bureau 2011 National Survey of Fishing, Hunting, and Wildlife-Associated Recreation 109
Table 60. Expenditures for Fishing by State Where Spending Took Place: 2011(Population 16 years old and older. Expenditures in thousands of dollars)
State where spending took place Total
expenditures
Trip-related expenditures Expenditures for equipment Expenditures for other
items2Total
trip-relatedFood and
lodgingTrans-
portationOther
trip costsTotal
equipmentFishing
equipment1Auxiliary
equipment1Special
equipment1
United States, total . . . . . . 41,788,936 21,789,465 7,711,318 6,261,536 7,816,610 15,506,433 6,141,895 1,106,865 8,257,673 4,493,037
Alabama . . . . . . . . . . . . . 456,442 317,064 121,973 78,970 116,120 127,616 107,492 *16,676 ... 11,762 Alaska . . . . . . . . . . . . . . . 639,356 528,135 227,663 164,152 136,321 91,228 56,246 20,338 ... 19,992 Arizona . . . . . . . . . . . . . . 755,478 357,472 123,342 95,693 138,437 337,188 62,790 *9,343 *265,056 60,818 Arkansas . . . . . . . . . . . . . 495,584 339,640 153,245 117,488 68,907 142,292 45,750 ... ... 13,651 California . . . . . . . . . . . . 2,268,610 1,620,329 576,406 462,576 581,347 577,356 320,577 141,384 *115,394 70,925
Colorado . . . . . . . . . . . . . 648,563 403,569 134,342 193,604 75,624 213,528 121,723 *32,643 ... 31,466 Connecticut . . . . . . . . . . . 436,473 258,671 66,355 46,676 145,640 163,275 58,289 32,986 ... 14,526 Delaware . . . . . . . . . . . . . 104,370 48,750 20,765 12,069 15,915 21,411 12,965 *1,100 ... 34,209 Florida . . . . . . . . . . . . . . . 4,629,202 2,801,636 900,222 563,990 1,337,423 1,085,576 600,093 76,817 *408,666 741,990 Georgia . . . . . . . . . . . . . . 872,550 401,784 166,506 152,932 82,346 430,234 111,651 ... ... 40,532
Hawaii . . . . . . . . . . . . . . . 203,492 102,074 24,985 30,283 46,806 100,236 48,734 *2,525 ... *1,182 Idaho . . . . . . . . . . . . . . . . 422,120 261,072 96,171 123,836 41,065 105,933 78,610 *6,297 ... 55,115 Illinois . . . . . . . . . . . . . . . 972,729 372,361 124,642 98,210 149,509 387,439 100,569 *15,611 *271,258 212,929 Indiana . . . . . . . . . . . . . . . 671,840 427,310 140,320 136,879 150,110 164,516 92,066 *12,805 ... 80,015 Iowa . . . . . . . . . . . . . . . . . 277,999 100,539 34,913 33,101 32,525 159,732 48,500 *7,180 *104,052 17,728
Kansas . . . . . . . . . . . . . . . 210,303 98,165 28,249 35,760 34,156 68,046 24,341 ... ... 44,092 Kentucky . . . . . . . . . . . . . 807,293 259,128 92,732 93,334 73,062 463,240 51,282 ... *399,129 84,925 Louisiana . . . . . . . . . . . . . 807,033 533,843 217,851 126,429 189,563 242,032 88,745 ... ... 31,158 Maine . . . . . . . . . . . . . . . 371,829 214,686 89,002 52,979 72,705 141,385 34,117 *11,210 *96,057 15,758 Maryland . . . . . . . . . . . . . 535,232 195,536 60,387 37,093 98,056 332,279 77,882 ... ... 7,417
Massachusetts . . . . . . . . . 455,403 253,705 62,852 52,098 138,754 188,541 77,827 *4,947 *105,767 13,157 Michigan . . . . . . . . . . . . . 2,427,110 1,092,735 373,964 344,495 374,276 1,117,911 259,043 *84,705 *774,162 216,464 Minnesota . . . . . . . . . . . . 2,414,257 924,573 372,819 269,690 282,064 1,448,648 375,809 *25,336 *1,047,503 41,036 Mississippi . . . . . . . . . . . 527,740 315,763 101,802 93,213 120,748 200,790 164,977 ... ... 11,187 Missouri . . . . . . . . . . . . . 657,024 374,215 146,842 146,217 81,157 262,939 143,930 *8,061 *110,948 19,869
Montana . . . . . . . . . . . . . 339,383 141,885 54,909 57,950 29,027 140,728 83,447 ... ... 56,770 Nebraska . . . . . . . . . . . . . 182,679 56,840 20,029 24,374 12,437 112,780 65,105 *7,839 *39,836 13,059 Nevada . . . . . . . . . . . . . . 138,800 83,275 34,026 32,323 16,926 49,130 22,165 *5,180 ... 6,395 New Hampshire . . . . . . . 208,524 151,389 39,031 38,369 73,989 51,872 30,551 *4,093 ... 5,263 New Jersey . . . . . . . . . . . 1,120,236 486,978 129,828 103,695 253,455 319,118 151,784 41,474 *125,860 314,139
New Mexico . . . . . . . . . . 418,249 234,187 93,272 114,565 26,351 169,541 42,787 *11,780 *114,974 14,521 New York . . . . . . . . . . . . 1,962,538 1,057,916 333,483 306,506 417,927 758,530 395,723 75,814 *286,993 146,092 North Carolina . . . . . . . . 1,523,131 1,020,156 443,338 239,146 337,672 480,065 269,784 *25,767 *184,514 22,910 North Dakota . . . . . . . . . . (NA) (NA) (NA) (NA) (NA) (NA) (NA) (NA) (NA) (NA) Ohio. . . . . . . . . . . . . . . . . 1,794,642 594,519 171,728 165,782 257,009 460,353 220,277 *39,299 *200,776 739,770
Oklahoma . . . . . . . . . . . . 730,503 175,701 69,820 71,458 34,423 227,980 70,531 *69,769 ... 326,822 Oregon . . . . . . . . . . . . . . . 640,855 358,680 148,761 95,820 114,099 235,384 68,013 *14,338 *153,032 46,791 Pennsylvania . . . . . . . . . . 485,490 228,510 76,705 83,154 68,651 193,879 114,099 *12,696 ... 63,100 Rhode Island . . . . . . . . . . 130,046 83,935 22,082 17,062 44,791 41,804 14,985 *813 *26,006 4,307 South Carolina . . . . . . . . 686,328 359,834 116,079 89,606 154,149 319,015 231,271 *9,818 ... 7,479
South Dakota . . . . . . . . . . 202,797 133,078 44,159 64,968 23,951 64,834 45,547 *8,359 ... 4,885 Tennessee . . . . . . . . . . . . 1,137,104 283,024 78,345 112,279 92,401 803,472 210,219 *20,154 ... 50,608 Texas . . . . . . . . . . . . . . . . 1,540,434 1,045,330 422,885 297,817 324,629 471,190 203,698 *27,174 ... 23,914 Utah . . . . . . . . . . . . . . . . . 451,259 226,251 93,714 77,555 54,983 211,585 52,178 *10,909 ... 13,423 Vermont . . . . . . . . . . . . . . 131,317 90,248 40,684 26,215 23,350 26,007 15,437 *819 ... 15,062
Virginia . . . . . . . . . . . . . . 1,142,099 469,096 215,544 113,859 139,693 379,123 133,986 *6,264 *238,872 293,880 Washington . . . . . . . . . . . 1,030,036 539,035 160,994 170,219 207,823 435,580 214,677 48,657 *172,245 55,421 West Virginia . . . . . . . . . . 428,646 326,275 158,734 77,728 89,813 97,553 56,130 ... ... 4,819 Wisconsin . . . . . . . . . . . . 1,418,591 607,467 232,140 220,905 154,422 480,273 93,996 ... *380,740 330,851 Wyoming . . . . . . . . . . . . . 463,814 393,984 34,547 91,201 268,236 44,907 30,752 ... ... 24,923* Estimate based on a sample size of 10–29. … Sample size too small (less than 10) to report data reliably. (NA) Not available.1 See Table 12 for a detailed listing of fishing, auxiliary, and special equipment items.2 Includes expenditures for magazine subscriptions, membership dues and contributions, land leasing and ownership, and licenses, stamps, tags, and permits.
Note: U.S. totals include responses from participants residing in the District of Columbia, as described in Appendix D. The Texas Parks and Wildlife Department has expressed concerns regarding the fishing expenditure estimates from the USFWS National Survey. Please contact them at [email protected] or [email protected] for department statistics.

110 2011 National Survey of Fishing, Hunting, and Wildlife-Associated Recreation U.S. Fish and Wildlife Service and U.S. Census Bureau
Table 61. Participation in Wildlife-Watching Activities by State Residents Both Inside and Outside Their Resident State: 2011
(Population 16 years old and older. Numbers in thousands)
Participant’s state of residence
Population
Total participants Away from home Around the home
NumberPercent
of population NumberPercent
of population NumberPercent
of populationUnited States, total . . . . . . . . . . . 239,313 71,776 30 22,496 9 68,598 29
Alabama . . . . . . . . . . . . . . . . . . 3,664 1,079 29 *340 *9 1,073 29 Alaska . . . . . . . . . . . . . . . . . . . . 526 247 47 118 22 229 43 Arizona . . . . . . . . . . . . . . . . . . . 5,084 1,281 25 534 11 1,222 24 Arkansas . . . . . . . . . . . . . . . . . . 2,238 828 37 *120 *5 820 37 California . . . . . . . . . . . . . . . . . 28,562 6,475 23 2,675 9 5,939 21
Colorado . . . . . . . . . . . . . . . . . . 3,946 1,456 37 621 16 1,299 33 Connecticut . . . . . . . . . . . . . . . . 2,781 1,093 39 385 14 1,053 38 Delaware . . . . . . . . . . . . . . . . . . 699 209 30 71 10 200 29 Florida . . . . . . . . . . . . . . . . . . . . 14,855 3,598 24 1,363 9 3,312 22 Georgia . . . . . . . . . . . . . . . . . . . 7,459 2,206 30 *1,008 *14 2,054 28
Hawaii . . . . . . . . . . . . . . . . . . . . 995 161 16 103 10 115 12 Idaho . . . . . . . . . . . . . . . . . . . . . 1,172 464 40 *220 *19 439 37 Illinois . . . . . . . . . . . . . . . . . . . . 9,988 2,784 28 652 7 2,752 28 Indiana . . . . . . . . . . . . . . . . . . . . 4,965 1,681 34 477 10 1,657 33 Iowa . . . . . . . . . . . . . . . . . . . . . . 2,363 780 33 215 9 758 32
Kansas . . . . . . . . . . . . . . . . . . . . 2,163 776 36 168 8 751 35 Kentucky . . . . . . . . . . . . . . . . . . 3,376 1,221 36 298 9 1,117 33 Louisiana . . . . . . . . . . . . . . . . . . 3,449 840 24 *221 *6 794 23 Maine . . . . . . . . . . . . . . . . . . . . 1,066 401 38 *110 *10 399 37 Maryland . . . . . . . . . . . . . . . . . . 4,480 1,224 27 392 9 1,203 27
Massachusetts . . . . . . . . . . . . . . 5,320 1,530 29 453 9 1,490 28 Michigan . . . . . . . . . . . . . . . . . . 7,787 3,067 39 855 11 2,865 37 Minnesota . . . . . . . . . . . . . . . . . 4,133 1,498 36 483 12 1,419 34 Mississippi . . . . . . . . . . . . . . . . 2,220 630 28 *135 *6 620 28 Missouri . . . . . . . . . . . . . . . . . . 4,667 1,645 35 622 13 1,538 33
Montana . . . . . . . . . . . . . . . . . . 777 258 33 *96 *12 235 30 Nebraska . . . . . . . . . . . . . . . . . . 1,387 362 26 150 11 325 23 Nevada . . . . . . . . . . . . . . . . . . . 2,024 504 25 191 9 465 23 New Hampshire . . . . . . . . . . . . 1,066 388 36 89 8 387 36 New Jersey . . . . . . . . . . . . . . . . 6,852 1,708 25 564 8 1,661 24
New Mexico . . . . . . . . . . . . . . . 1,551 486 31 200 13 465 30 New York . . . . . . . . . . . . . . . . . 15,503 4,081 26 1,263 8 3,856 25 North Carolina . . . . . . . . . . . . . 7,264 2,124 29 505 7 2,110 29 North Dakota . . . . . . . . . . . . . . . (NA) (NA) (NA) (NA) (NA) (NA) (NA) Ohio. . . . . . . . . . . . . . . . . . . . . . 8,999 3,155 35 730 8 3,142 35
Oklahoma . . . . . . . . . . . . . . . . . 2,828 1,233 44 *411 *15 1,225 43 Oregon . . . . . . . . . . . . . . . . . . . . 3,061 1,239 40 401 13 1,206 39 Pennsylvania . . . . . . . . . . . . . . . 10,036 3,329 33 734 7 3,228 32 Rhode Island . . . . . . . . . . . . . . . 848 270 32 66 8 260 31 South Carolina . . . . . . . . . . . . . 3,555 944 27 *219 *6 915 26
South Dakota . . . . . . . . . . . . . . . 631 267 42 *108 *17 267 42 Tennessee . . . . . . . . . . . . . . . . . 4,945 1,733 35 682 14 1,584 32 Texas . . . . . . . . . . . . . . . . . . . . . 18,681 4,263 23 *977 *5 4,249 23 Utah . . . . . . . . . . . . . . . . . . . . . . 2,036 558 27 263 13 430 21 Vermont . . . . . . . . . . . . . . . . . . . 512 273 53 85 17 270 53
Virginia . . . . . . . . . . . . . . . . . . . 6,136 2,212 36 553 9 2,185 36 Washington . . . . . . . . . . . . . . . . 5,293 1,932 37 693 13 1,849 35 West Virginia . . . . . . . . . . . . . . . 1,464 751 51 *255 *17 743 51 Wisconsin . . . . . . . . . . . . . . . . . 4,460 2,152 48 453 10 2,076 47 Wyoming . . . . . . . . . . . . . . . . . . 424 182 43 104 25 161 38* Estimate based on a sample size of 10–29. (NA) Not available.
Note: Detail does not add to total because of multiple responses. U.S. totals include responses from participants residing in the District of Columbia, as described in Appendix D.
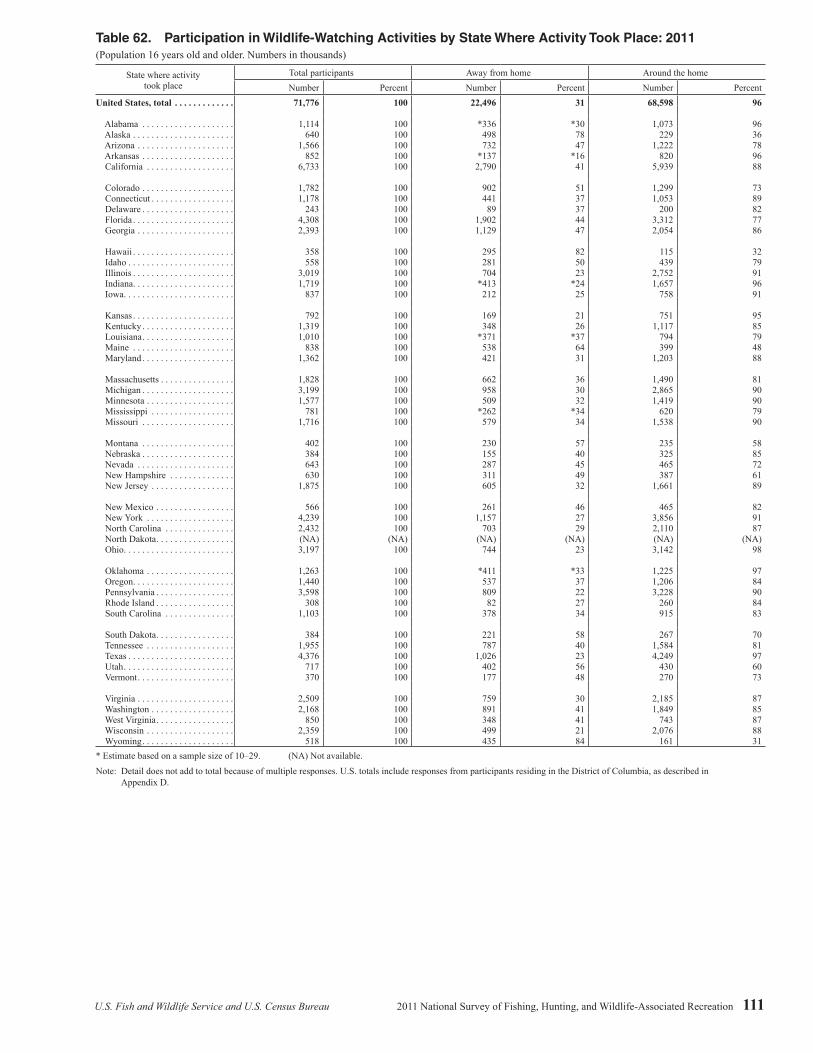
U.S. Fish and Wildlife Service and U.S. Census Bureau 2011 National Survey of Fishing, Hunting, and Wildlife-Associated Recreation 111
Table 62. Participation in Wildlife-Watching Activities by State Where Activity Took Place: 2011(Population 16 years old and older. Numbers in thousands)
State where activity took place
Total participants Away from home Around the homeNumber Percent Number Percent Number Percent
United States, total . . . . . . . . . . . . . 71,776 100 22,496 31 68,598 96
Alabama . . . . . . . . . . . . . . . . . . . . 1,114 100 *336 *30 1,073 96 Alaska . . . . . . . . . . . . . . . . . . . . . . 640 100 498 78 229 36 Arizona . . . . . . . . . . . . . . . . . . . . . 1,566 100 732 47 1,222 78 Arkansas . . . . . . . . . . . . . . . . . . . . 852 100 *137 *16 820 96 California . . . . . . . . . . . . . . . . . . . 6,733 100 2,790 41 5,939 88
Colorado . . . . . . . . . . . . . . . . . . . . 1,782 100 902 51 1,299 73 Connecticut . . . . . . . . . . . . . . . . . . 1,178 100 441 37 1,053 89 Delaware . . . . . . . . . . . . . . . . . . . . 243 100 89 37 200 82 Florida . . . . . . . . . . . . . . . . . . . . . . 4,308 100 1,902 44 3,312 77 Georgia . . . . . . . . . . . . . . . . . . . . . 2,393 100 1,129 47 2,054 86
Hawaii . . . . . . . . . . . . . . . . . . . . . . 358 100 295 82 115 32 Idaho . . . . . . . . . . . . . . . . . . . . . . . 558 100 281 50 439 79 Illinois . . . . . . . . . . . . . . . . . . . . . . 3,019 100 704 23 2,752 91 Indiana . . . . . . . . . . . . . . . . . . . . . . 1,719 100 *413 *24 1,657 96 Iowa . . . . . . . . . . . . . . . . . . . . . . . . 837 100 212 25 758 91
Kansas . . . . . . . . . . . . . . . . . . . . . . 792 100 169 21 751 95 Kentucky . . . . . . . . . . . . . . . . . . . . 1,319 100 348 26 1,117 85 Louisiana . . . . . . . . . . . . . . . . . . . . 1,010 100 *371 *37 794 79 Maine . . . . . . . . . . . . . . . . . . . . . . 838 100 538 64 399 48 Maryland . . . . . . . . . . . . . . . . . . . . 1,362 100 421 31 1,203 88
Massachusetts . . . . . . . . . . . . . . . . 1,828 100 662 36 1,490 81 Michigan . . . . . . . . . . . . . . . . . . . . 3,199 100 958 30 2,865 90 Minnesota . . . . . . . . . . . . . . . . . . . 1,577 100 509 32 1,419 90 Mississippi . . . . . . . . . . . . . . . . . . 781 100 *262 *34 620 79 Missouri . . . . . . . . . . . . . . . . . . . . 1,716 100 579 34 1,538 90
Montana . . . . . . . . . . . . . . . . . . . . 402 100 230 57 235 58 Nebraska . . . . . . . . . . . . . . . . . . . . 384 100 155 40 325 85 Nevada . . . . . . . . . . . . . . . . . . . . . 643 100 287 45 465 72 New Hampshire . . . . . . . . . . . . . . 630 100 311 49 387 61 New Jersey . . . . . . . . . . . . . . . . . . 1,875 100 605 32 1,661 89
New Mexico . . . . . . . . . . . . . . . . . 566 100 261 46 465 82 New York . . . . . . . . . . . . . . . . . . . 4,239 100 1,157 27 3,856 91 North Carolina . . . . . . . . . . . . . . . 2,432 100 703 29 2,110 87 North Dakota . . . . . . . . . . . . . . . . . (NA) (NA) (NA) (NA) (NA) (NA) Ohio. . . . . . . . . . . . . . . . . . . . . . . . 3,197 100 744 23 3,142 98
Oklahoma . . . . . . . . . . . . . . . . . . . 1,263 100 *411 *33 1,225 97 Oregon . . . . . . . . . . . . . . . . . . . . . . 1,440 100 537 37 1,206 84 Pennsylvania . . . . . . . . . . . . . . . . . 3,598 100 809 22 3,228 90 Rhode Island . . . . . . . . . . . . . . . . . 308 100 82 27 260 84 South Carolina . . . . . . . . . . . . . . . 1,103 100 378 34 915 83
South Dakota . . . . . . . . . . . . . . . . . 384 100 221 58 267 70 Tennessee . . . . . . . . . . . . . . . . . . . 1,955 100 787 40 1,584 81 Texas . . . . . . . . . . . . . . . . . . . . . . . 4,376 100 1,026 23 4,249 97 Utah . . . . . . . . . . . . . . . . . . . . . . . . 717 100 402 56 430 60 Vermont . . . . . . . . . . . . . . . . . . . . . 370 100 177 48 270 73
Virginia . . . . . . . . . . . . . . . . . . . . . 2,509 100 759 30 2,185 87 Washington . . . . . . . . . . . . . . . . . . 2,168 100 891 41 1,849 85 West Virginia . . . . . . . . . . . . . . . . . 850 100 348 41 743 87 Wisconsin . . . . . . . . . . . . . . . . . . . 2,359 100 499 21 2,076 88 Wyoming . . . . . . . . . . . . . . . . . . . . 518 100 435 84 161 31* Estimate based on a sample size of 10–29. (NA) Not available.
Note: Detail does not add to total because of multiple responses. U.S. totals include responses from participants residing in the District of Columbia, as described in Appendix D.
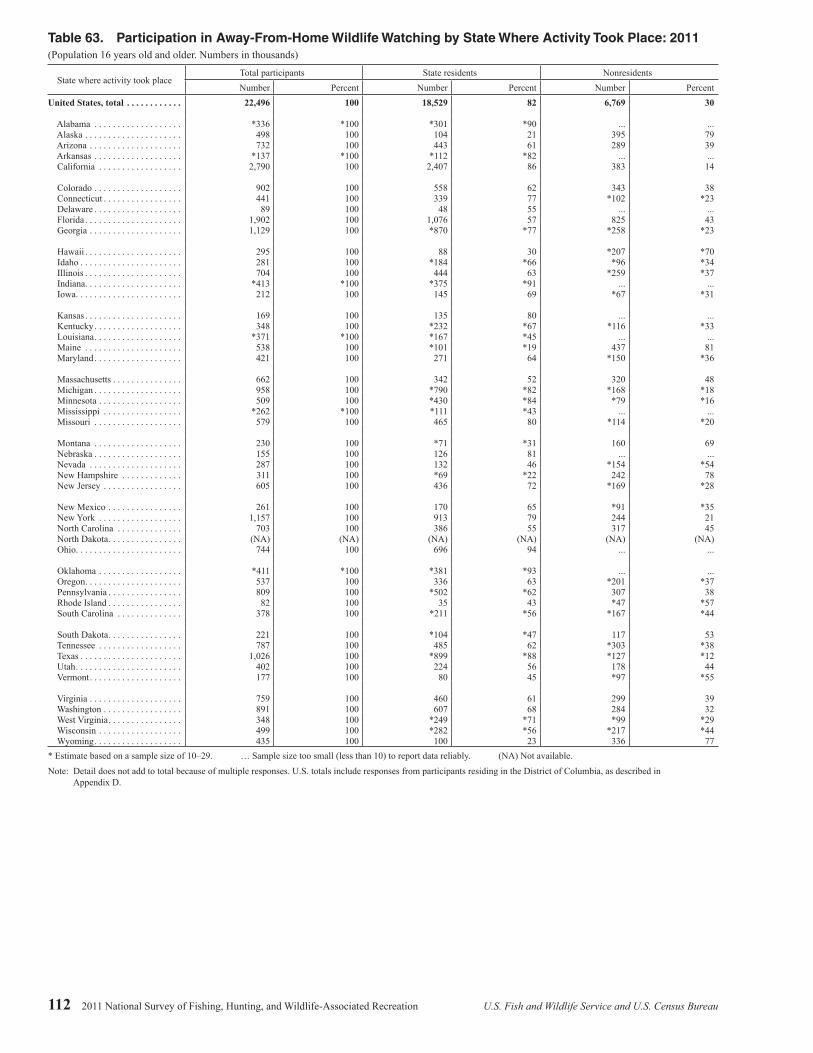
112 2011 National Survey of Fishing, Hunting, and Wildlife-Associated Recreation U.S. Fish and Wildlife Service and U.S. Census Bureau
Table 63. Participation in Away-From-Home Wildlife Watching by State Where Activity Took Place: 2011(Population 16 years old and older. Numbers in thousands)
State where activity took placeTotal participants State residents NonresidentsNumber Percent Number Percent Number Percent
United States, total . . . . . . . . . . . . 22,496 100 18,529 82 6,769 30
Alabama . . . . . . . . . . . . . . . . . . . *336 *100 *301 *90 ... ... Alaska . . . . . . . . . . . . . . . . . . . . . 498 100 104 21 395 79 Arizona . . . . . . . . . . . . . . . . . . . . 732 100 443 61 289 39 Arkansas . . . . . . . . . . . . . . . . . . . *137 *100 *112 *82 ... ... California . . . . . . . . . . . . . . . . . . 2,790 100 2,407 86 383 14
Colorado . . . . . . . . . . . . . . . . . . . 902 100 558 62 343 38 Connecticut . . . . . . . . . . . . . . . . . 441 100 339 77 *102 *23 Delaware . . . . . . . . . . . . . . . . . . . 89 100 48 55 ... ... Florida . . . . . . . . . . . . . . . . . . . . . 1,902 100 1,076 57 825 43 Georgia . . . . . . . . . . . . . . . . . . . . 1,129 100 *870 *77 *258 *23
Hawaii . . . . . . . . . . . . . . . . . . . . . 295 100 88 30 *207 *70 Idaho . . . . . . . . . . . . . . . . . . . . . . 281 100 *184 *66 *96 *34 Illinois . . . . . . . . . . . . . . . . . . . . . 704 100 444 63 *259 *37 Indiana . . . . . . . . . . . . . . . . . . . . . *413 *100 *375 *91 ... ... Iowa . . . . . . . . . . . . . . . . . . . . . . . 212 100 145 69 *67 *31
Kansas . . . . . . . . . . . . . . . . . . . . . 169 100 135 80 ... ... Kentucky . . . . . . . . . . . . . . . . . . . 348 100 *232 *67 *116 *33 Louisiana . . . . . . . . . . . . . . . . . . . *371 *100 *167 *45 ... ... Maine . . . . . . . . . . . . . . . . . . . . . 538 100 *101 *19 437 81 Maryland . . . . . . . . . . . . . . . . . . . 421 100 271 64 *150 *36
Massachusetts . . . . . . . . . . . . . . . 662 100 342 52 320 48 Michigan . . . . . . . . . . . . . . . . . . . 958 100 *790 *82 *168 *18 Minnesota . . . . . . . . . . . . . . . . . . 509 100 *430 *84 *79 *16 Mississippi . . . . . . . . . . . . . . . . . *262 *100 *111 *43 ... ... Missouri . . . . . . . . . . . . . . . . . . . 579 100 465 80 *114 *20
Montana . . . . . . . . . . . . . . . . . . . 230 100 *71 *31 160 69 Nebraska . . . . . . . . . . . . . . . . . . . 155 100 126 81 ... ... Nevada . . . . . . . . . . . . . . . . . . . . 287 100 132 46 *154 *54 New Hampshire . . . . . . . . . . . . . 311 100 *69 *22 242 78 New Jersey . . . . . . . . . . . . . . . . . 605 100 436 72 *169 *28
New Mexico . . . . . . . . . . . . . . . . 261 100 170 65 *91 *35 New York . . . . . . . . . . . . . . . . . . 1,157 100 913 79 244 21 North Carolina . . . . . . . . . . . . . . 703 100 386 55 317 45 North Dakota . . . . . . . . . . . . . . . . (NA) (NA) (NA) (NA) (NA) (NA) Ohio. . . . . . . . . . . . . . . . . . . . . . . 744 100 696 94 ... ...
Oklahoma . . . . . . . . . . . . . . . . . . *411 *100 *381 *93 ... ... Oregon . . . . . . . . . . . . . . . . . . . . . 537 100 336 63 *201 *37 Pennsylvania . . . . . . . . . . . . . . . . 809 100 *502 *62 307 38 Rhode Island . . . . . . . . . . . . . . . . 82 100 35 43 *47 *57 South Carolina . . . . . . . . . . . . . . 378 100 *211 *56 *167 *44
South Dakota . . . . . . . . . . . . . . . . 221 100 *104 *47 117 53 Tennessee . . . . . . . . . . . . . . . . . . 787 100 485 62 *303 *38 Texas . . . . . . . . . . . . . . . . . . . . . . 1,026 100 *899 *88 *127 *12 Utah . . . . . . . . . . . . . . . . . . . . . . . 402 100 224 56 178 44 Vermont . . . . . . . . . . . . . . . . . . . . 177 100 80 45 *97 *55
Virginia . . . . . . . . . . . . . . . . . . . . 759 100 460 61 299 39 Washington . . . . . . . . . . . . . . . . . 891 100 607 68 284 32 West Virginia . . . . . . . . . . . . . . . . 348 100 *249 *71 *99 *29 Wisconsin . . . . . . . . . . . . . . . . . . 499 100 *282 *56 *217 *44 Wyoming . . . . . . . . . . . . . . . . . . . 435 100 100 23 336 77* Estimate based on a sample size of 10–29. … Sample size too small (less than 10) to report data reliably. (NA) Not available.
Note: Detail does not add to total because of multiple responses. U.S. totals include responses from participants residing in the District of Columbia, as described in Appendix D.

U.S. Fish and Wildlife Service and U.S. Census Bureau 2011 National Survey of Fishing, Hunting, and Wildlife-Associated Recreation 113
Table 64. Days of Wildlife Watching Away From Home by State Where Activity Took Place and Participant’s State of Residence: 2011
(Population 16 years old and older. Numbers in thousands)
State
Days of activity in state Days of activity by state residentsTotal days,
residents and nonresidents
Days by residents
Days by nonresidents
Total days, in state of residence and other states
Days in state of residence
Days in other states
Number Percent Number Percent Number Percent Number Percent Number Percent Number PercentUnited States, total . . . . . . . . . . 335,625 100 268,412 80 67,213 20 335,625 100 268,412 80 67,213 20
Alabama . . . . . . . . . . . . . . . . . *1,525 *100 *1,269 *83 ... ... *1,831 *100 *1,269 *69 ... ... Alaska . . . . . . . . . . . . . . . . . . . 5,159 100 1,739 34 3,420 66 1,783 100 1,739 98 ... ... Arizona . . . . . . . . . . . . . . . . . . 11,907 100 7,696 65 4,210 35 9,637 100 7,696 80 *1,941 *20 Arkansas . . . . . . . . . . . . . . . . . *1,427 *100 *1,326 *93 ... ... *1,411 *100 *1,326 *94 ... ... California . . . . . . . . . . . . . . . . 27,352 100 24,683 90 2,668 10 28,574 100 24,683 86 3,890 14
Colorado . . . . . . . . . . . . . . . . . 6,937 100 4,790 69 2,147 31 5,865 100 4,790 82 *1,075 *18 Connecticut . . . . . . . . . . . . . . . 8,964 100 8,085 90 *880 *10 10,930 100 8,085 74 2,845 26 Delaware . . . . . . . . . . . . . . . . . 1,573 100 1,330 85 ... ... 1,924 100 1,330 69 595 31 Florida . . . . . . . . . . . . . . . . . . . 16,786 100 8,307 49 8,478 51 11,866 100 8,307 70 *3,558 *30 Georgia . . . . . . . . . . . . . . . . . . 34,309 100 *33,442 *97 *866 *3 *34,530 *100 *33,442 *97 ... ...
Hawaii . . . . . . . . . . . . . . . . . . . 4,660 100 2,675 57 *1,985 *43 2,830 100 2,675 95 *155 *5 Idaho . . . . . . . . . . . . . . . . . . . . 3,757 100 *3,248 *86 *509 *14 *3,639 *100 *3,248 *89 ... ... Illinois . . . . . . . . . . . . . . . . . . . 6,434 100 4,098 64 *2,336 *36 6,898 100 4,098 59 *2,800 *41 Indiana . . . . . . . . . . . . . . . . . . . *2,924 *100 *2,743 *94 ... ... *3,552 *100 *2,743 *77 *809 *23 Iowa . . . . . . . . . . . . . . . . . . . . . 2,547 100 2,235 88 *312 *12 3,391 100 2,235 66 *1,155 *34
Kansas . . . . . . . . . . . . . . . . . . . 1,019 100 780 77 ... ... 1,258 100 780 62 *478 *38 Kentucky . . . . . . . . . . . . . . . . . 2,890 100 *1,868 *65 *1,021 *35 2,974 100 *1,868 *63 *1,106 *37 Louisiana . . . . . . . . . . . . . . . . . *4,916 *100 *4,248 *86 ... ... *5,540 *100 *4,248 *77 ... ... Maine . . . . . . . . . . . . . . . . . . . 7,334 100 *4,675 *64 2,659 36 *4,824 *100 *4,675 *97 ... ... Maryland . . . . . . . . . . . . . . . . . 4,458 100 3,708 83 *750 *17 4,578 100 3,708 81 *870 *19
Massachusetts . . . . . . . . . . . . . 10,546 100 7,797 74 2,750 26 9,554 100 7,797 82 1,758 18 Michigan . . . . . . . . . . . . . . . . . 10,343 100 *9,498 *92 *845 *8 10,418 100 *9,498 *91 ... ... Minnesota . . . . . . . . . . . . . . . . 6,974 100 *6,684 *96 *290 *4 *7,780 *100 *6,684 *86 *1,097 *14 Mississippi . . . . . . . . . . . . . . . *3,946 *100 *3,608 *91 ... ... *4,411 *100 *3,608 *82 ... ... Missouri . . . . . . . . . . . . . . . . . 8,200 100 7,835 96 *365 *4 9,573 100 7,835 82 *1,737 *18
Montana . . . . . . . . . . . . . . . . . 1,395 100 *625 *45 770 55 *1,412 *100 *625 *44 ... ... Nebraska . . . . . . . . . . . . . . . . . 2,361 100 2,243 95 ... ... 2,732 100 2,243 82 *489 *18 Nevada . . . . . . . . . . . . . . . . . . 1,619 100 1,177 73 *442 *27 2,631 100 1,177 45 1,454 55 New Hampshire . . . . . . . . . . . 1,896 100 *1,074 *57 822 43 1,382 100 *1,074 *78 *308 *22 New Jersey . . . . . . . . . . . . . . . 6,210 100 5,608 90 *602 *10 8,207 100 5,608 68 2,600 32
New Mexico . . . . . . . . . . . . . . 5,962 100 4,371 73 *1,590 *27 4,733 100 4,371 92 *361 *8 New York . . . . . . . . . . . . . . . . 22,814 100 21,631 95 1,182 5 29,118 100 21,631 74 *7,487 *26 North Carolina . . . . . . . . . . . . 9,275 100 6,768 73 2,507 27 9,463 100 6,768 72 *2,695 *28 North Dakota . . . . . . . . . . . . . . (NA) (NA) (NA) (NA) (NA) (NA) (NA) (NA) (NA) (NA) (NA) (NA) Ohio. . . . . . . . . . . . . . . . . . . . . 6,251 100 6,174 99 ... ... 7,285 100 6,174 85 ... ...
Oklahoma . . . . . . . . . . . . . . . . *3,084 *100 *2,964 *96 ... ... *3,128 *100 *2,964 *95 ... ... Oregon . . . . . . . . . . . . . . . . . . . 7,268 100 5,294 73 *1,974 *27 6,673 100 5,294 79 *1,379 *21 Pennsylvania . . . . . . . . . . . . . . 9,554 100 *7,217 *76 2,337 24 *7,863 *100 *7,217 *92 ... ... Rhode Island . . . . . . . . . . . . . . 1,230 100 815 66 *416 *34 1,094 100 815 74 279 26 South Carolina . . . . . . . . . . . . 4,254 100 *2,650 *62 *1,604 *38 *3,361 *100 *2,650 *79 ... ...
South Dakota . . . . . . . . . . . . . . 1,559 100 *1,090 *70 *469 *30 *1,170 *100 *1,090 *93 ... ... Tennessee . . . . . . . . . . . . . . . . 6,424 100 4,443 69 *1,981 *31 6,521 100 4,443 68 *2,078 *32 Texas . . . . . . . . . . . . . . . . . . . . 11,840 100 *10,441 *88 *1,399 *12 *11,193 *100 *10,441 *93 ... ... Utah . . . . . . . . . . . . . . . . . . . . . 5,169 100 2,642 51 2,527 49 3,127 100 2,642 84 *485 *16 Vermont . . . . . . . . . . . . . . . . . . 2,602 100 1,908 73 *693 *27 2,092 100 1,908 91 *184 *9
Virginia . . . . . . . . . . . . . . . . . . 4,552 100 2,697 59 1,855 41 5,848 100 2,697 46 3,150 54 Washington . . . . . . . . . . . . . . . 9,641 100 8,311 86 1,330 14 13,740 100 8,311 60 *5,429 *40 West Virginia . . . . . . . . . . . . . . 3,648 100 *3,254 *89 *394 *11 *4,995 *100 *3,254 *65 ... ... Wisconsin . . . . . . . . . . . . . . . . 6,080 100 *4,999 *82 *1,082 *18 *5,773 *100 *4,999 *87 ... ... Wyoming . . . . . . . . . . . . . . . . . 3,125 100 1,119 36 2,006 64 1,676 100 1,119 67 *557 *33* Estimate based on a sample size of 10–29. … Sample size too small (less than 10) to report data reliably. (NA) Not available.
Note: Detail does not add to total because of nonresponse. U.S. totals include responses from participants residing in the District of Columbia, as described in Appendix D.

114 2011 National Survey of Fishing, Hunting, and Wildlife-Associated Recreation U.S. Fish and Wildlife Service and U.S. Census Bureau
Table 65. Expenditures for Wildlife-Watching Activities by State Where Spending Took Place: 2011(Population 16 years old and older. Expenditures in thousands of dollars)
State where spending
took place Total expenditures
Trip-related expenditures Expenditures for equipmentExpenditures
for other items2
Total trip-related
Food and lodging
Trans-portation
Other trip costs
Total equipment
Wildlife-watching
equipment1Auxiliary
equipment1Special
equipment1
United States, total . . . . . 54,890,272 17,274,675 9,349,439 6,006,860 1,918,376 27,150,920 11,323,179 1,555,374 14,272,368 10,464,677
Alabama . . . . . . . . . . . . 734,204 *41,191 *12,168 *27,359 ... 668,276 205,102 ... ... *24,738 Alaska . . . . . . . . . . . . . . 2,058,355 1,970,345 1,052,372 559,450 358,522 79,485 42,200 *30,249 ... *8,524 Arizona . . . . . . . . . . . . . 935,880 391,198 194,925 176,576 19,697 336,081 153,714 *9,624 ... 208,600 Arkansas . . . . . . . . . . . . 216,074 *34,520 *21,808 *12,384 ... 156,574 130,345 ... ... ... California . . . . . . . . . . . 3,777,677 1,781,680 933,483 663,484 184,713 1,485,977 689,999 203,591 *592,386 510,019
Colorado . . . . . . . . . . . . 1,432,084 615,636 353,088 232,716 29,832 722,249 173,569 *27,294 ... 94,199 Connecticut . . . . . . . . . . 934,703 227,380 110,505 67,546 49,328 487,381 194,705 *42,576 *250,100 219,942 Delaware . . . . . . . . . . . . 169,788 36,069 17,873 15,646 *2,550 103,269 41,391 *3,583 ... 30,450 Florida . . . . . . . . . . . . . . 3,041,333 1,732,652 890,458 619,555 222,639 788,430 475,771 *31,088 *281,572 520,250 Georgia . . . . . . . . . . . . . 1,802,423 839,036 499,054 325,328 *14,654 889,500 552,517 ... ... *73,887
Hawaii . . . . . . . . . . . . . . 668,504 627,700 291,313 161,888 *174,500 14,603 13,150 ... ... 26,201 Idaho . . . . . . . . . . . . . . . 432,041 82,479 *29,524 *52,108 ... 292,182 111,633 ... ... *57,380 Illinois . . . . . . . . . . . . . . 1,306,258 166,123 69,757 73,868 *22,497 785,622 279,555 *16,412 ... 354,513 Indiana . . . . . . . . . . . . . . 751,343 *206,357 *75,968 *105,843 *24,546 478,201 311,413 *151,057 ... 66,785 Iowa . . . . . . . . . . . . . . . . 711,168 64,058 *21,563 38,820 *3,675 535,840 136,695 *12,723 ... 111,270
Kansas . . . . . . . . . . . . . . 208,415 *45,599 *31,572 *13,199 ... 56,925 50,966 *5,855 ... 105,891 Kentucky . . . . . . . . . . . . 773,221 125,358 62,455 40,780 *22,122 167,075 127,922 ... ... 480,788 Louisiana . . . . . . . . . . . . 542,752 *222,145 *124,839 *57,122 ... 277,084 205,180 ... ... *43,523 Maine . . . . . . . . . . . . . . 798,854 514,145 347,602 122,931 43,612 172,113 102,630 *4,980 ... 112,596 Maryland . . . . . . . . . . . . 483,421 104,421 52,292 47,525 *4,605 333,762 203,752 *8,655 ... 45,237
Massachusetts . . . . . . . . 1,277,898 286,092 199,653 72,675 13,765 325,967 252,447 *22,159 ... 665,838 Michigan . . . . . . . . . . . . 1,220,815 416,562 233,162 151,611 *31,789 662,703 428,804 ... ... 141,550 Minnesota . . . . . . . . . . . 621,290 228,217 *93,443 114,518 *20,255 169,982 133,721 *8,882 ... 223,092 Mississippi . . . . . . . . . . 342,422 *90,493 *37,648 *43,128 ... 238,311 109,337 ... ... *13,617 Missouri . . . . . . . . . . . . 940,818 210,934 102,373 104,728 *3,833 606,603 385,224 *11,392 ... 123,282
Montana . . . . . . . . . . . . 400,797 291,910 78,188 72,284 *141,438 104,210 57,216 ... ... *4,677 Nebraska . . . . . . . . . . . . 513,297 86,719 37,379 26,323 *23,017 409,799 74,551 ... ... 16,778 Nevada . . . . . . . . . . . . . 682,028 114,366 62,091 47,764 *4,511 275,886 52,938 *3,594 ... 291,776 New Hampshire . . . . . . 281,190 101,813 63,685 31,262 *6,866 111,320 71,447 *7,845 ... 68,057 New Jersey . . . . . . . . . . 986,278 228,123 119,222 96,801 *12,100 407,554 255,080 *36,352 ... 350,601
New Mexico . . . . . . . . . 327,117 146,937 106,077 38,740 2,120 136,597 77,186 *7,940 ... 43,583 New York . . . . . . . . . . . 4,151,789 659,871 357,330 190,566 *111,976 2,423,787 1,072,128 *129,447 ... 1,068,131 North Carolina . . . . . . . 929,661 367,309 202,953 151,292 *13,064 449,260 366,507 *30,245 ... 113,092 North Dakota . . . . . . . . . (NA) (NA) (NA) (NA) (NA) (NA) (NA) (NA) (NA) (NA) Ohio. . . . . . . . . . . . . . . . 738,806 87,066 37,548 45,488 ... 457,027 326,560 ... ... 194,714
Oklahoma . . . . . . . . . . . 474,662 *107,919 *36,629 *43,151 ... 281,227 198,315 ... ... *85,516 Oregon . . . . . . . . . . . . . . 1,697,222 482,241 275,422 196,880 *9,939 1,018,967 253,194 *28,155 ... 196,014 Pennsylvania . . . . . . . . . 1,270,888 266,669 203,405 58,372 ... 788,587 314,038 *67,809 ... 215,632 Rhode Island . . . . . . . . . 200,480 78,920 23,731 20,728 *34,460 92,137 28,841 *1,746 ... 29,423 South Carolina . . . . . . . 467,253 260,838 196,463 54,740 *9,635 191,288 132,988 ... ... *15,127
South Dakota . . . . . . . . . 166,995 134,082 70,135 54,421 *9,526 30,452 22,878 ... ... *2,461 Tennessee . . . . . . . . . . . 942,572 498,440 397,766 85,791 *14,883 390,742 225,362 *32,497 ... 53,390 Texas . . . . . . . . . . . . . . . 1,823,758 478,080 253,565 196,653 *27,862 919,971 590,272 *25,487 ... 425,708 Utah . . . . . . . . . . . . . . . . 585,405 295,723 125,937 92,783 *77,003 238,012 92,629 *10,627 ... *51,671 Vermont . . . . . . . . . . . . . 288,507 49,506 19,845 26,257 *3,403 113,416 37,509 *4,457 *71,451 125,585
Virginia . . . . . . . . . . . . . 958,607 299,762 157,750 129,698 12,313 493,321 349,008 *27,800 ... 165,524 Washington . . . . . . . . . . 3,173,371 506,658 310,010 157,634 39,014 2,386,353 248,525 *77,929 ... 280,360 West Virginia . . . . . . . . . 325,778 100,326 *47,295 *42,747 ... 183,696 126,116 *41,168 ... *41,756 Wisconsin . . . . . . . . . . . 1,488,857 234,760 144,379 81,894 *8,488 1,080,632 419,479 ... ... 173,464 Wyoming . . . . . . . . . . . . 350,256 321,169 157,429 155,218 8,522 22,166 21,261 ... ... *6,920 * Estimate based on a sample size of 10–29. … Sample size too small (less than 10) to report data reliably. (NA) Not available.1 See Table 40 for a detailed listing of wildlife-watching, auxiliary, and special equipment items.2 Includes expenditures for magazine subscriptions, membership dues and contributions, and land leasing and ownership.
Note: U.S. totals include responses from participants residing in the District of Columbia, as described in Appendix D.

U.S. Fish and Wildlife Service and U.S. Census Bureau 2011 National Survey of Fishing, Hunting, and Wildlife-Associated Recreation 115
Appendix A

116 2011 National Survey of Fishing, Hunting, and Wildlife-Associated Recreation U.S. Fish and Wildlife Service and U.S. Census Bureau
Appendix A. Definitions
Annual household income—Total 2011 income of household members before taxes and other deductions.
Around-the-home wildlife watching—Activity within 1 mile of home with one of six primary purposes: (1) taking special interest in or trying to identify birds or other wildlife; (2) photographing wildlife; (3) feeding birds or other wildlife; (4) maintaining natural areas of at least one-quarter acre for the benefit of wildlife; (5) maintaining plantings (such as shrubs and agricultural crops) for the benefit of wildlife; and (6) visiting parks and natural areas to observe, photograph, or feed wildlife.
Auxiliary equipment—Equipment owned primarily for wildlife-associated recreation. For the sportspersons section, these include sleeping bags, packs, duffel bags, tents, binoculars and field glasses, special fishing and hunting clothing, foul weather gear, boots and waders, maintenance and repair of equipment, and processing and taxidermy costs. For the wildlife-watching section, these include tents, tarps, frame packs, backpacking and other camping equipment, and blinds. For both sportspersons and wildlife watchers, it also includes electronic auxiliary equipment such as Global Positioning Systems.
Away-from-home wildlife watching—Trips or outings at least 1 mile from home for the primary purpose of observing, photographing, or feeding wildlife. Trips to zoos, circuses, aquar-iums, and museums are not included.
Big game—Bear, deer, elk, moose, wild turkey, and similar large animals that are hunted.
Census Divisions
East North Central Illinois Indiana Michigan Ohio Wisconsin
East South Central Alabama Kentucky Mississippi Tennessee
Middle Atlantic New Jersey New York Pennsylvania
Mountain Arizona Colorado Idaho Montana Nevada New Mexico Utah Wyoming
New England Connecticut Maine Massachusetts New Hampshire Rhode Island Vermont
Pacific Alaska California Hawaii Oregon Washington
South Atlantic Delaware District of Columbia Florida
Georgia Maryland North Carolina South Carolina Virginia West Virginia
West North Central Kansas Iowa Minnesota Missouri Nebraska North Dakota South Dakota
West South Central Arkansas Louisiana Oklahoma Texas
Day—Any part of a day spent partici-pating in a given activity. For example, if someone hunted two hours one day and three hours another day, it would be reported as two days of hunting. If someone hunted two hours in the morning and three hours in the after-noon of the same day, it would be considered one day of hunting.
Education—The highest completed grade of school or year of college.
Expenditures—Money spent in 2011 for wildlife-related recreation trips in the United States, wildlife-related recreational equipment purchased in the United States, and other items. The “other items” were books, magazines, and DVDs; membership dues and contributions, land leasing or owning; hunting and fishing licenses; and plant-ings, all for the purpose of wildlife-related recreation. Expenditures included both money spent by partici-pants for themselves and the value of gifts they received.

U.S. Fish and Wildlife Service and U.S. Census Bureau 2011 National Survey of Fishing, Hunting, and Wildlife-Associated Recreation 117
Fishing—The sport of catching or attempting to catch fish with a hook and line, bow and arrow, or spear; it also includes catching or gathering shellfish (clams, crabs, etc.); and the noncommercial seining or netting of fish, unless the fish are for use as bait. For example, seining for smelt is fishing, but seining for bait minnows is not included as fishing.
Fishing equipment—Items owned primarily for fishing:
Rods, reels, poles, and rodmaking components
Lines and leaders
Artificial lures, flies, baits, and dressing for flies or lines
Hooks, sinkers, swivels, and other items attached to a line, except lures and baits
Tackle boxes
Creels, stringers, fish bags, landing nets, and gaff hooks
Minnow traps, seines, and bait containers
Depth finders, fish finders, and other electronic fishing devices
Ice fishing equipment
Other fishing equipment
Freshwater—Reservoirs, lakes, ponds, and the nontidal portions of rivers and streams.
Great Lakes fishing—Fishing in Lakes Superior, Michigan, Huron, St. Clair, Erie, and Ontario, their connecting waters such as the St. Mary’s River system, Detroit River, St. Clair River, and the Niagara River, and the St. Lawrence River south of the bridge at Cornwall, New York. Great Lakes fishing includes fishing in tributaries of the Great Lakes for smelt, steelhead, and salmon.
Home—The starting point of a wild-life-related recreational trip. It may be a permanent residence or a temporary or seasonal residence such as a cabin.
Hunting—The sport of shooting or attempting to shoot wildlife with fire-arms or archery equipment.
Hunting equipment—Items owned primarily for hunting:
Rifles, shotguns, muzzleloaders, and handguns
Archery equipment
Telescopic sights
Decoys and game calls
Ammunition
Hand loading equipment
Hunting dogs and associated costs
Other hunting equipment
Land leasing and owning—Leasing or owning land either singly or in cooperation with others for the primary purpose of fishing, hunting, or wildlife watching on it.
Maintain natural areas—To set aside 1/4 acre or more of natural environ-ment, such as wood lots or open fields, for the primary purpose of benefiting wildlife.
Maintain plantings—To introduce or encourage the growth of food and cover plants for the primary purpose of benefiting wildlife.
Metropolitan Statistical Area (MSA)—A Metropolitan Statis-tical Area is a grouping of one or more counties or equivalent entities that contain at least one urbanized area of 50,000 or more inhabitants. The “Outside MSA” classification include census-defined Micropolitan Statistical Areas (or Micro areas). A Micro area is defined as a grouping of one or more counties or equivalent entities that contain at least one urban cluster of at least 10,000 but less than 50,000 inhab-itants. Refer to <www.census.gov /population/metro/about/>, for a more detailed definition of the Metropolitan Statistical Area.
Migratory birds—Birds that regularly migrate from one region or climate to another such as ducks, geese, and doves and other birds that may be hunted.
Multiple responses—The term used to reflect the fact that individuals or their characteristics fall into more than one reporting category. An example of a big game hunter who hunted for deer and elk demonstrates the effect of multiple responses. In this case, adding the number of deer hunters (one) and elk hunters (one) would overstate the number of big game hunters (one) because deer and elk hunters are not
mutually exclusive categories. In contrast, for example, total participants is the sum of male and female partici-pants, because “male” and “female” are mutually exclusive categories.
Nonresidents—Individuals who do not live in the State being reported. For example, a person living in Texas who watches whales in California is a nonresidential wildlife-watcher in California.
Nonresponse—A term used to reflect the fact that some Survey respondents provide incomplete sets of informa-tion. For example, a Survey respondent may have been unable to identify the primary type of hunting for which a gun was bought. Total hunting expen-diture estimates will include the gun purchase, but it will not appear as spending for big game or any other type of hunting. Nonresponses result in reported totals that are greater than the sum of their parts.
Observe—To take special interest in or try to identify birds, fish or other wildlife.
Other animals—Coyotes, crows, foxes, groundhogs, prairie dogs, raccoons, alligators, and similar animals that can be legally hunted and are not classified as big game, small game, or migratory birds. They may be classified as unprotected or preda-tory animals by the State in which they are hunted. Feral pigs are classified as “other animals” in all States except Hawaii, where they are considered big game.
Participants—Individuals who engage in fishing, hunting, or a wildlife-watching activity. Unless otherwise stated, a person has to have hunted, fished, or wildlife watched in 2011 to be considered a participant.
Plantings—See “Maintain plantings.”
Primary purpose—The principal motivation for an activity, trip, or expenditure.
Private land—Land owned by a busi-ness, nongovernmental organization, private individual, or a group of indi-viduals such as an association or club.
Public land—Land that is owned by local governments (such as county parks and municipal watersheds),

118 2011 National Survey of Fishing, Hunting, and Wildlife-Associated Recreation U.S. Fish and Wildlife Service and U.S. Census Bureau
State governments (such as State parks and wildlife management areas), or the federal government (such as National Forests, Recreational Areas, and Wild-life Refuges).
Residents—Individuals who lived in the State being reported. For example, a person who lives in California and watches whales in California is a resi-dential wildlife watcher in California.
Rural—All territory, population, and housing units located outside of urban-ized areas and urban clusters, as deter-mined by the U.S. Census Bureau.
Saltwater—Oceans, tidal bays and sounds, and the tidal portions of rivers and streams.
Screening interviews—The first Survey contact with a sample house-hold. Screening interviews are conducted with a household repre-sentative to identify respondents who are eligible for in-depth interviews. Screening interviews gather data such as age and sex about individuals in the households. Further information on screening interviews is available on page vii in the “Survey Background and Method” section of this report.
Small game—Grouse, pheasants, quail, rabbits, squirrels, and similar small animals for which States have small game seasons and bag limits.
Special equipment—Big-ticket equip-ment items that are owned primarily for wildlife-related recreation:
Bass boats
Other types of motor boats
Canoes and other types of nonmotor boats
Boat motors, boat trailer/hitches, and other boat accessories
Pickups, campers, vans, travel or tent trailers, motor homes, house trailers, recreational vehicles (RVs)
Cabins
Off-the-road vehicles such as trail bikes, all terrain vehicles (ATVs), dune buggies, four-wheelers, 4x4 vehicles, and snowmobiles
Other special equipment
Spenders—Individuals who spent money on fishing, hunting, or wildlife-watching activities or equipment and also participated in those activities.
Sportspersons—Individuals who engaged in fishing, hunting, or both.
Trip—An outing involving fishing, hunting, or wildlife watching. A trip may begin from an individual’s prin-cipal residence or from another place, such as a vacation home or the home of a relative. A trip may last an hour, a day, or many days.
Type of fishing—There are three types of fishing: (1) freshwater except Great Lakes, (2) Great Lakes, and (3) saltwater.
Type of hunting—There are four types of hunting: (1) big game, (2) small game, (3) migratory bird, and (4) other animal.
Unspecified expenditure—An item that was purchased for use in both fishing and hunting, rather than primarily one or the other. Auxiliary equipment, special equipment, maga-zines and books, and membership dues and contributions are the items for which a purchase could be categorized as “unspecified.”
Urban—All territory, population, and housing units located within boundaries that encompass densely settled territory, consisting of core census block groups or blocks that have a population density of at least 1,000 people per square mile and surrounding census blocks that have an overall density of at least 500 people per square mile. Under certain conditions, less densely settled territory may be included, as determined by the Census Bureau.
Visit parks or natural areas—A visit to places accessible to the public and that are owned or leased by a govern-mental entity, nongovernmental organi-zation, business, or a private individual or group such as an association or club.
Wildlife—Animals such as birds, fish, insects, mammals, amphibians, and reptiles that are living in natural or wild environments. Wildlife does not include animals living in aquariums, zoos, and other artificial surround-ings or domestic animals such as farm animals or pets.
Wildlife observed, photographed, or fed—Examples of species that wildlife watchers observe, photograph, and/or feed are (1) Wild birds—songbirds such as cardinals, robins, warblers, jays, buntings, and sparrows; birds of prey such as hawks, owls, eagles, and falcons; waterfowl such as ducks, geese, and swans; other water birds such as shorebirds, herons, pelicans, and cranes; and other birds such as pheasants, turkeys, road runners, and woodpeckers; (2) Land mammals—large land mammals such as bears, bison, deer, moose, and elk; small land mammals such as squirrels, foxes, prairie dogs, and rabbits; (3) Fish such as salmon, sharks, and groupers; (4) Marine mammals such as whales, dolphins, and manatees; and (5) Other wildlife such as butterflies, turtles, spiders, and snakes.
Wildlife-related recreation— Recreational fishing, hunting, and wildlife watching.
Wildlife watching—There are six types of wildlife watching: (1) closely observing, (2) photographing, (3) feeding, (4) visiting parks or natural areas, (5) maintaining plantings, and (6) maintaining natural areas. These activities must be the primary purpose of the trip or the around-the-home undertaking.
Wildlife-watching equipment—Items owned primarily for observing, photo-graphing, or feeding wildlife:
Binoculars and spotting scopes
Cameras, video cameras, special lenses, and other photographic equipment
Film and developing
Commercially prepared and pack-aged wild bird food
Other bulk food used to feed wild birds
Food for other wildlife
Nest boxes, bird houses, feeders, and baths
Day packs, carrying cases, and special clothing
Other items such as field guides and maps

U.S. Fish and Wildlife Service and U.S. Census Bureau 2011 National Survey of Fishing, Hunting, and Wildlife-Associated Recreation 119
Appendix B

120 2011 National Survey of Fishing, Hunting, and Wildlife-Associated Recreation U.S. Fish and Wildlife Service and U.S. Census Bureau
Appendix B. 2010 Participation of 6- to 15-Year-Olds and Historical Participation of Sportspersons: Data From Screening Interviews
The 2011 National Survey of Fishing, Hunting, and Wildlife-Associated Recreation was carried out in two phases. The first (or screening) phase began in April 2011. The main purpose of this phase was to collect informa-tion about all persons 16 years old and older in order to develop a sample of potential sportspersons and wildlife watchers for the second (or detailed) phase. However, information was also collected on the number of persons 6 to 15 years old who participated in wildlife-related recreation activities in 2010.
It is important to emphasize that the information reported from the 2011 screen relates to activity only up to and including 2010. Also, these data are reported by one household respondent speaking for all household members rather than the actual participants. In addition, these data are based on
long-term recall (at least a 12-month recall), which has been found in Survey research (see Investigation of Possible Recall/Reference Period Bias in National Surveys of Fishing, Hunting and Wildlife-Associated Recreation, December 1989, Westat, Inc.) to add bias to the resulting estimates. In many cases, longer recall periods result in overestimating participation and expen-ditures for wildlife-related recreation.
Tables B-1 through B-4 report data on first-time participation and the most recent year of hunting and fishing for participants 6 years of age and older. Tables B-5 through B-8 report data specifically on 6- to 15-year-old participants in 2010. Detailed expendi-tures and recreational activity data were not gathered for the 6- to 15-year-old participants. Table B-9 lists the trend data for 6- to 15-year-old participants.
Because of differences in meth-odologies of the screening and the detailed phases of the 2011 Survey, the estimates of the two phases are not comparable. Only participants 16 years old and older were eligible for the detailed phase. The screening phase covered activity for 2010 or earlier; the detailed phase has estimates for only 2011. The detailed phase was a series of interviews of the actual participants conducted at 4- and 8-month intervals. The screening phase was a single inter-view of one household respondent who reported household events with one year or more recall. The shorter recall period of the detailed phase enabled better data accuracy.

U.S. Fish and Wildlife Service and U.S. Census Bureau 2011 National Survey of Fishing, Hunting, and Wildlife-Associated Recreation 121
Table B-1. Anglers and Hunters Participating for the First Time in 2010 by Age Group(Population 6 years old and older. Numbers in thousands)
Age group Total anglers in 2010
Fishing for first timeTotal hunters
in 2010
Hunting for first time
NumberPercent of anglers
in age group NumberPercent of hunters
in age groupTotal, all ages . . . . . . . . . . . . . . . . . . . . . . . . . . . . . 55,792 4,261 8 17,060 1,365 8 6 to 8 years . . . . . . . . . . . . . . . . . . . . . . . . . . . . . 3,103 938 30 174 108 62 9 to 11 years . . . . . . . . . . . . . . . . . . . . . . . . . . . . 3,825 646 17 533 154 29 12 to 15 years . . . . . . . . . . . . . . . . . . . . . . . . . . . 4,451 492 11 1,319 366 28 16 to 17 years . . . . . . . . . . . . . . . . . . . . . . . . . . . 1,750 167 10 571 *68 *12 18 to 24 years . . . . . . . . . . . . . . . . . . . . . . . . . . . 5,106 227 4 1,820 186 10 25 to 34 years . . . . . . . . . . . . . . . . . . . . . . . . . . . 8,525 633 7 2,578 160 6 35 to 44 years . . . . . . . . . . . . . . . . . . . . . . . . . . . 8,792 597 7 2,699 *156 *6 45 to 54 years . . . . . . . . . . . . . . . . . . . . . . . . . . . 9,467 323 3 3,482 *127 *4 55 to 64 years . . . . . . . . . . . . . . . . . . . . . . . . . . . 6,337 109 2 2,424 ... ... 65 years or older . . . . . . . . . . . . . . . . . . . . . . . . . 4,435 129 3 1,460 ... ...* Estimate based on a sample size of 10–29. ... Sample size too small (less than 10) to report data reliably.
Note: Data reported on this table are from screening interviews in which one adult household member responded for all household members. The screening interview required the respondent to recall 12 months worth of activity.
Table B-2. Anglers and Hunters Participating in 2009 but Not in 2010 by Age Group(Population 6 years old and older. Numbers in thousands)
Age groupAnglers Hunters
Number Percent Number PercentTotal, all ages . . . . . . . . . . . . . . . . . . . . . . . . . . . . 12,084 100 2,930 100 6 to 8 years . . . . . . . . . . . . . . . . . . . . . . . . . . . . 572 5 ... ... 9 to 11 years . . . . . . . . . . . . . . . . . . . . . . . . . . . 589 5 *86 *3 12 to 15 years . . . . . . . . . . . . . . . . . . . . . . . . . . 1,052 9 *92 *3 16 to 17 years . . . . . . . . . . . . . . . . . . . . . . . . . . 452 4 *102 *3 18 to 24 years . . . . . . . . . . . . . . . . . . . . . . . . . . 1,274 11 289 10 25 to 34 years . . . . . . . . . . . . . . . . . . . . . . . . . . 1,771 15 546 19 35 to 44 years . . . . . . . . . . . . . . . . . . . . . . . . . . 1,913 16 537 18 45 to 54 years . . . . . . . . . . . . . . . . . . . . . . . . . . 2,093 17 550 19 55 to 64 years . . . . . . . . . . . . . . . . . . . . . . . . . . 1,425 12 429 15 65 years or older . . . . . . . . . . . . . . . . . . . . . . . . 944 8 292 10* Estimate based on a sample size of 10–29. ... Sample size too small (less than 10) to report data reliably.
Note: Data reported on this table are from screening interviews in which one adult household member responded for all household members. The screening interview required the respondent to recall 12 months worth of activity.
Table B-3. Most Recent Year of Hunting by Age Group(Population 6 years old and older. Numbers in thousands)
Age group
Total, all persons who hunted in 2010
or earlier year
Most recent year of hunting
2010 2009 2008Number Percent Number Percent Number Percent Number Percent
Total, all ages . . . . . . . . . . . . . . . . . . . . . . . . . . . . . 48,941 100 17,060 35 2,945 6 1,665 3 6 to 11 years . . . . . . . . . . . . . . . . . . . . . . . . . . . . 867 100 707 82 *93 *11 ... ... 12 to 15 years . . . . . . . . . . . . . . . . . . . . . . . . . . . 1,550 100 1,319 85 *92 *6 ... ... 16 to 17 years . . . . . . . . . . . . . . . . . . . . . . . . . . . 800 100 571 71 *102 *13 *88 *11 18 to 24 years . . . . . . . . . . . . . . . . . . . . . . . . . . . 3,357 100 1,820 54 293 9 177 5 25 to 34 years . . . . . . . . . . . . . . . . . . . . . . . . . . . 6,469 100 2,578 40 546 8 298 5 35 to 44 years . . . . . . . . . . . . . . . . . . . . . . . . . . . 7,291 100 2,699 37 539 7 305 4 45 to 54 years . . . . . . . . . . . . . . . . . . . . . . . . . . . 10,215 100 3,482 34 553 5 439 4 55 to 64 years . . . . . . . . . . . . . . . . . . . . . . . . . . . 9,113 100 2,424 27 435 5 170 2 65 years or older . . . . . . . . . . . . . . . . . . . . . . . . . 9,279 100 1,460 16 293 3 157 2
Most recent year of hunting2007 2006 2005 Before 2005
Number Percent Number Percent Number Percent Number PercentTotal, all ages . . . . . . . . . . . . . . . . . . . . . . . . . . . . . 1,084 2 1,048 2 818 2 23,945 49 6 to 11 years . . . . . . . . . . . . . . . . . . . . . . . . . . . . ... ... ... ... ... ... ... ... 12 to 15 years . . . . . . . . . . . . . . . . . . . . . . . . . . . ... ... ... ... ... ... ... ... 16 to 17 years . . . . . . . . . . . . . . . . . . . . . . . . . . . ... ... ... ... ... ... ... ... 18 to 24 years . . . . . . . . . . . . . . . . . . . . . . . . . . . *152 *5 121 4 *89 *3 680 20 25 to 34 years . . . . . . . . . . . . . . . . . . . . . . . . . . . 225 3 145 2 152 2 2,496 39 35 to 44 years . . . . . . . . . . . . . . . . . . . . . . . . . . . 216 3 133 2 *132 *2 3,201 44 45 to 54 years . . . . . . . . . . . . . . . . . . . . . . . . . . . 226 2 288 3 116 1 4,970 49 55 to 64 years . . . . . . . . . . . . . . . . . . . . . . . . . . . 97 1 93 1 189 2 5,667 62 65 years or older . . . . . . . . . . . . . . . . . . . . . . . . . 132 1 226 2 104 1 6,869 74 * Estimate based on a sample size of 10–29. ... Sample size too small (less than 10) to report data reliably.
Note: Data reported on this table are from screening interviews in which one adult household member responded for all household members. The screening interview required the respondent to recall 12 months worth of activity.
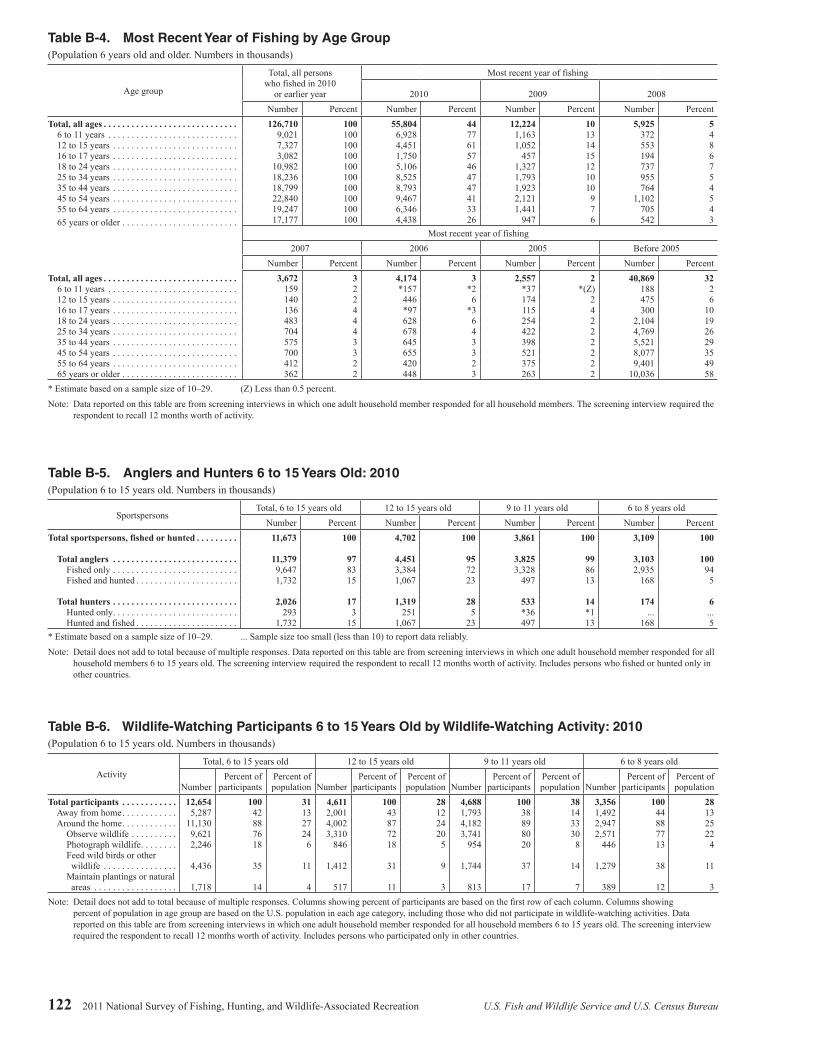
122 2011 National Survey of Fishing, Hunting, and Wildlife-Associated Recreation U.S. Fish and Wildlife Service and U.S. Census Bureau
Table B-4. Most Recent Year of Fishing by Age Group(Population 6 years old and older. Numbers in thousands)
Age group
Total, all persons who fished in 2010
or earlier year
Most recent year of fishing
2010 2009 2008Number Percent Number Percent Number Percent Number Percent
Total, all ages . . . . . . . . . . . . . . . . . . . . . . . . . . . . . 126,710 100 55,804 44 12,224 10 5,925 5 6 to 11 years . . . . . . . . . . . . . . . . . . . . . . . . . . . . 9,021 100 6,928 77 1,163 13 372 4 12 to 15 years . . . . . . . . . . . . . . . . . . . . . . . . . . . 7,327 100 4,451 61 1,052 14 553 8 16 to 17 years . . . . . . . . . . . . . . . . . . . . . . . . . . . 3,082 100 1,750 57 457 15 194 6 18 to 24 years . . . . . . . . . . . . . . . . . . . . . . . . . . . 10,982 100 5,106 46 1,327 12 737 7 25 to 34 years . . . . . . . . . . . . . . . . . . . . . . . . . . . 18,236 100 8,525 47 1,793 10 955 5 35 to 44 years . . . . . . . . . . . . . . . . . . . . . . . . . . . 18,799 100 8,793 47 1,923 10 764 4 45 to 54 years . . . . . . . . . . . . . . . . . . . . . . . . . . . 22,840 100 9,467 41 2,121 9 1,102 5 55 to 64 years . . . . . . . . . . . . . . . . . . . . . . . . . . . 19,247 100 6,346 33 1,441 7 705 4 65 years or older . . . . . . . . . . . . . . . . . . . . . . . . . 17,177 100 4,438 26 947 6 542 3
Most recent year of fishing2007 2006 2005 Before 2005
Number Percent Number Percent Number Percent Number PercentTotal, all ages . . . . . . . . . . . . . . . . . . . . . . . . . . . . . 3,672 3 4,174 3 2,557 2 40,869 32 6 to 11 years . . . . . . . . . . . . . . . . . . . . . . . . . . . . 159 2 *157 *2 *37 *(Z) 188 2 12 to 15 years . . . . . . . . . . . . . . . . . . . . . . . . . . . 140 2 446 6 174 2 475 6 16 to 17 years . . . . . . . . . . . . . . . . . . . . . . . . . . . 136 4 *97 *3 115 4 300 10 18 to 24 years . . . . . . . . . . . . . . . . . . . . . . . . . . . 483 4 628 6 254 2 2,104 19 25 to 34 years . . . . . . . . . . . . . . . . . . . . . . . . . . . 704 4 678 4 422 2 4,769 26 35 to 44 years . . . . . . . . . . . . . . . . . . . . . . . . . . . 575 3 645 3 398 2 5,521 29 45 to 54 years . . . . . . . . . . . . . . . . . . . . . . . . . . . 700 3 655 3 521 2 8,077 35 55 to 64 years . . . . . . . . . . . . . . . . . . . . . . . . . . . 412 2 420 2 375 2 9,401 49 65 years or older . . . . . . . . . . . . . . . . . . . . . . . . . 362 2 448 3 263 2 10,036 58 * Estimate based on a sample size of 10–29. (Z) Less than 0.5 percent.
Note: Data reported on this table are from screening interviews in which one adult household member responded for all household members. The screening interview required the respondent to recall 12 months worth of activity.
Table B-5. Anglers and Hunters 6 to 15 Years Old: 2010(Population 6 to 15 years old. Numbers in thousands)
SportspersonsTotal, 6 to 15 years old 12 to 15 years old 9 to 11 years old 6 to 8 years old
Number Percent Number Percent Number Percent Number PercentTotal sportspersons, fished or hunted . . . . . . . . . 11,673 100 4,702 100 3,861 100 3,109 100
Total anglers . . . . . . . . . . . . . . . . . . . . . . . . . . . 11,379 97 4,451 95 3,825 99 3,103 100 Fished only . . . . . . . . . . . . . . . . . . . . . . . . . . . 9,647 83 3,384 72 3,328 86 2,935 94 Fished and hunted . . . . . . . . . . . . . . . . . . . . . . 1,732 15 1,067 23 497 13 168 5
Total hunters . . . . . . . . . . . . . . . . . . . . . . . . . . . 2,026 17 1,319 28 533 14 174 6 Hunted only . . . . . . . . . . . . . . . . . . . . . . . . . . . 293 3 251 5 *36 *1 ... ... Hunted and fished . . . . . . . . . . . . . . . . . . . . . . 1,732 15 1,067 23 497 13 168 5 * Estimate based on a sample size of 10–29. ... Sample size too small (less than 10) to report data reliably.
Note: Detail does not add to total because of multiple responses. Data reported on this table are from screening interviews in which one adult household member responded for all household members 6 to 15 years old. The screening interview required the respondent to recall 12 months worth of activity. Includes persons who fished or hunted only in other countries.
Table B-6. Wildlife-Watching Participants 6 to 15 Years Old by Wildlife-Watching Activity: 2010(Population 6 to 15 years old. Numbers in thousands)
ActivityTotal, 6 to 15 years old 12 to 15 years old 9 to 11 years old 6 to 8 years old
NumberPercent of
participantsPercent of population Number
Percent of participants
Percent of population Number
Percent of participants
Percent of population Number
Percent of participants
Percent of population
Total participants . . . . . . . . . . . . 12,654 100 31 4,611 100 28 4,688 100 38 3,356 100 28 Away from home . . . . . . . . . . . . 5,287 42 13 2,001 43 12 1,793 38 14 1,492 44 13 Around the home . . . . . . . . . . . . 11,130 88 27 4,002 87 24 4,182 89 33 2,947 88 25 Observe wildlife . . . . . . . . . . 9,621 76 24 3,310 72 20 3,741 80 30 2,571 77 22 Photograph wildlife . . . . . . . . 2,246 18 6 846 18 5 954 20 8 446 13 4 Feed wild birds or other wildlife . . . . . . . . . . . . . . . . 4,436 35 11 1,412 31 9 1,744 37 14 1,279 38 11 Maintain plantings or natural areas . . . . . . . . . . . . . . . . . . 1,718 14 4 517 11 3 813 17 7 389 12 3 Note: Detail does not add to total because of multiple responses. Columns showing percent of participants are based on the first row of each column. Columns showing
percent of population in age group are based on the U.S. population in each age category, including those who did not participate in wildlife-watching activities. Data reported on this table are from screening interviews in which one adult household member responded for all household members 6 to 15 years old. The screening interview required the respondent to recall 12 months worth of activity. Includes persons who participated only in other countries.

U.S. Fish and Wildlife Service and U.S. Census Bureau 2011 National Survey of Fishing, Hunting, and Wildlife-Associated Recreation 123
Table B-7. Selected Characteristics of Anglers and Hunters 6 to 15 Years Old: 2010(Population 6 to 15 years old. Numbers in thousands)
CharacteristicU.S. population Sportspersons, fished or hunted Fished only
Number Percent NumberPercent who participated Percent Number
Percent who participated Percent
Total persons . . . . . . . . . . . . . . . . . . . . . . . . . . . . . 40,735 100 11,673 29 100 9,647 24 100
Population Density of Residence Urban . . . . . . . . . . . . . . . . . . . . . . . . . . . . . . . . . . 30,138 74 7,329 24 63 6,444 21 67 Rural . . . . . . . . . . . . . . . . . . . . . . . . . . . . . . . . . . 10,596 26 4,344 41 37 3,203 30 33
Population Size of Residence Metropolitan Statistical Area (MSA) . . . . . . . . . 38,520 95 10,666 28 91 8,968 23 93 1,000,000 or more . . . . . . . . . . . . . . . . . . . . . . 21,283 52 4,786 22 41 4,272 20 44 250,000 to 999,999 . . . . . . . . . . . . . . . . . . . . . 8,804 22 2,521 29 22 2,102 24 22 50,000 to 249,999 . . . . . . . . . . . . . . . . . . . . . . 8,433 21 3,358 40 29 2,595 31 27 Outside MSA . . . . . . . . . . . . . . . . . . . . . . . . . . . . 2,214 5 1,007 45 9 679 31 7
Census Geographic Division New England . . . . . . . . . . . . . . . . . . . . . . . . . . . . 1,726 4 465 27 4 441 26 5 Middle Atlantic . . . . . . . . . . . . . . . . . . . . . . . . . . 5,034 12 1,146 23 10 1,042 21 11 East North Central . . . . . . . . . . . . . . . . . . . . . . . . 6,072 15 2,315 38 20 1,842 30 19 West North Central . . . . . . . . . . . . . . . . . . . . . . . 2,645 6 1,242 47 11 924 35 10 South Atlantic . . . . . . . . . . . . . . . . . . . . . . . . . . . 7,606 19 2,212 29 19 1,875 25 19 East South Central . . . . . . . . . . . . . . . . . . . . . . . . 2,407 6 850 35 7 635 26 7 West South Central . . . . . . . . . . . . . . . . . . . . . . . 5,365 13 1,133 21 10 842 16 9 Mountain . . . . . . . . . . . . . . . . . . . . . . . . . . . . . . . 3,168 8 1,001 32 9 870 27 9 Pacific . . . . . . . . . . . . . . . . . . . . . . . . . . . . . . . . . 6,711 16 1,308 19 11 1,176 18 12
Age 6 to 8 years . . . . . . . . . . . . . . . . . . . . . . . . . . . . . 11,866 29 3,109 26 27 2,935 25 30 9 to 11 years . . . . . . . . . . . . . . . . . . . . . . . . . . . . 12,488 31 3,861 31 33 3,328 27 35 12 to 15 years . . . . . . . . . . . . . . . . . . . . . . . . . . . 16,380 40 4,702 29 40 3,384 21 35
Sex Male, total . . . . . . . . . . . . . . . . . . . . . . . . . . . . . . 21,420 53 7,202 34 62 5,634 26 58 6 to 8 years . . . . . . . . . . . . . . . . . . . . . . . . . . . 5,925 15 1,731 29 15 1,589 27 16 9 to 11 years . . . . . . . . . . . . . . . . . . . . . . . . . . 6,818 17 2,413 35 21 2,001 29 21 12 to 15 years . . . . . . . . . . . . . . . . . . . . . . . . . 8,678 21 3,058 35 26 2,044 24 21
Female, total . . . . . . . . . . . . . . . . . . . . . . . . . . . . 19,315 47 4,470 23 38 4,013 21 42 6 to 8 years . . . . . . . . . . . . . . . . . . . . . . . . . . . 5,942 15 1,378 23 12 1,346 23 14 9 to 11 years . . . . . . . . . . . . . . . . . . . . . . . . . . 5,670 14 1,448 26 12 1,327 23 14 12 to 15 years . . . . . . . . . . . . . . . . . . . . . . . . . 7,702 19 1,645 21 14 1,340 17 14
Ethnicity Hispanic . . . . . . . . . . . . . . . . . . . . . . . . . . . . . . . 7,846 19 1,173 15 10 1,137 14 12 Non-Hispanic . . . . . . . . . . . . . . . . . . . . . . . . . . . 32,889 81 10,500 32 90 8,510 26 88
Race White . . . . . . . . . . . . . . . . . . . . . . . . . . . . . . . . . . 28,458 70 9,889 35 85 8,037 28 83 African American . . . . . . . . . . . . . . . . . . . . . . . . 5,116 13 557 11 5 482 9 5 Asian American . . . . . . . . . . . . . . . . . . . . . . . . . . 2,055 5 227 11 2 209 10 2 All others . . . . . . . . . . . . . . . . . . . . . . . . . . . . . . . 5,105 13 1,000 20 9 919 18 10
Annual Household Income Less than $20,000 . . . . . . . . . . . . . . . . . . . . . . . . 4,686 12 917 20 8 796 17 8 $20,000 to $24,999 . . . . . . . . . . . . . . . . . . . . . . . 2,236 5 364 16 3 326 15 3 $25,000 to $29,999 . . . . . . . . . . . . . . . . . . . . . . . 2,073 5 364 18 3 316 15 3 $30,000 to $34,999 . . . . . . . . . . . . . . . . . . . . . . . 1,777 4 391 22 3 294 17 3 $35,000 to $39,999 . . . . . . . . . . . . . . . . . . . . . . . 2,045 5 660 32 6 519 25 5 $40,000 to $49,999 . . . . . . . . . . . . . . . . . . . . . . . 2,939 7 842 29 7 725 25 8 $50,000 to $74,999 . . . . . . . . . . . . . . . . . . . . . . . 7,146 18 2,009 28 17 1,661 23 17 $75,000 to $99,999 . . . . . . . . . . . . . . . . . . . . . . . 4,599 11 1,973 43 17 1,457 32 15 $100,000 to $149,999 . . . . . . . . . . . . . . . . . . . . . 4,452 11 2,077 47 18 1,737 39 18 $150,000 or more . . . . . . . . . . . . . . . . . . . . . . . . 3,281 8 1,058 32 9 905 28 9 Not reported . . . . . . . . . . . . . . . . . . . . . . . . . . . . 5,501 14 1,019 19 9 911 17 9 See footnotes at end of table.

124 2011 National Survey of Fishing, Hunting, and Wildlife-Associated Recreation U.S. Fish and Wildlife Service and U.S. Census Bureau
Table B-7. Selected Characteristics of Anglers and Hunters 6 to 15 Years Old: 2010—Continued(Population 6 to 15 years old. Numbers in thousands)
CharacteristicHunted only Fished and hunted
NumberPercent whoparticipated Percent Number
Percent whoparticipated Percent
Total persons . . . . . . . . . . . . . . . . . . . . . . . . . . . . . 293 1 100 1,732 4 100
Population Density of Residence Urban . . . . . . . . . . . . . . . . . . . . . . . . . . . . . . . . . . *118 *(Z) *40 767 3 44 Rural . . . . . . . . . . . . . . . . . . . . . . . . . . . . . . . . . . 176 2 60 965 9 56
Population Size of Residence Metropolitan Statistical Area (MSA) . . . . . . . . . 242 1 82 1,456 4 84 1,000,000 or more . . . . . . . . . . . . . . . . . . . . . . *53 *(Z) *18 462 2 27 250,000 to 999,999 . . . . . . . . . . . . . . . . . . . . . ... ... ... 386 4 22 50,000 to 249,999 . . . . . . . . . . . . . . . . . . . . . . *155 *2 *53 609 7 35 Outside MSA . . . . . . . . . . . . . . . . . . . . . . . . . . . . *52 *2 *18 276 12 16
Census Geographic Division New England . . . . . . . . . . . . . . . . . . . . . . . . . . . . ... ... ... *23 *1 *1 Middle Atlantic . . . . . . . . . . . . . . . . . . . . . . . . . . ... ... ... *61 *1 *4 East North Central . . . . . . . . . . . . . . . . . . . . . . . . *99 *2 *34 374 6 22 West North Central . . . . . . . . . . . . . . . . . . . . . . . ... ... ... 295 11 17 South Atlantic . . . . . . . . . . . . . . . . . . . . . . . . . . . *73 *1 *25 264 3 15 East South Central . . . . . . . . . . . . . . . . . . . . . . . . ... ... ... 200 8 12 West South Central . . . . . . . . . . . . . . . . . . . . . . . ... ... ... 274 5 16 Mountain . . . . . . . . . . . . . . . . . . . . . . . . . . . . . . . ... ... ... 122 4 7 Pacific . . . . . . . . . . . . . . . . . . . . . . . . . . . . . . . . . ... ... ... 119 2 7
Age 6 to 8 years . . . . . . . . . . . . . . . . . . . . . . . . . . . . . ... ... ... 168 1 10 9 to 11 years . . . . . . . . . . . . . . . . . . . . . . . . . . . . *36 *(Z) *12 497 4 29 12 to 15 years . . . . . . . . . . . . . . . . . . . . . . . . . . . 251 2 86 1,067 7 62
Sex Male, total . . . . . . . . . . . . . . . . . . . . . . . . . . . . . . 170 1 58 1,399 7 81 6 to 8 years . . . . . . . . . . . . . . . . . . . . . . . . . . . ... ... ... 138 2 8 9 to 11 years . . . . . . . . . . . . . . . . . . . . . . . . . . ... ... ... 398 6 23 12 to 15 years . . . . . . . . . . . . . . . . . . . . . . . . . 151 2 51 863 10 50
Female, total . . . . . . . . . . . . . . . . . . . . . . . . . . . . *124 *1 *42 333 2 19 6 to 8 years . . . . . . . . . . . . . . . . . . . . . . . . . . . ... ... ... ... ... ... 9 to 11 years . . . . . . . . . . . . . . . . . . . . . . . . . . ... ... ... 99 2 6 12 to 15 years . . . . . . . . . . . . . . . . . . . . . . . . . *101 *1 *34 204 3 12
Ethnicity Hispanic . . . . . . . . . . . . . . . . . . . . . . . . . . . . . . . ... ... ... *36 *(Z) *2 Non-Hispanic . . . . . . . . . . . . . . . . . . . . . . . . . . . 293 1 100 1,697 5 98
Race White . . . . . . . . . . . . . . . . . . . . . . . . . . . . . . . . . . 292 1 100 1,560 5 90 African American . . . . . . . . . . . . . . . . . . . . . . . . ... ... ... *75 *1 *4 Asian American . . . . . . . . . . . . . . . . . . . . . . . . . . ... ... ... ... ... ... All others . . . . . . . . . . . . . . . . . . . . . . . . . . . . . . . ... ... ... *79 *2 *5
Annual Household Income Less than $20,000 . . . . . . . . . . . . . . . . . . . . . . . . ... ... ... *110 *2 *6 $20,000 to $24,999 . . . . . . . . . . . . . . . . . . . . . . . ... ... ... ... ... ... $25,000 to $29,999 . . . . . . . . . . . . . . . . . . . . . . . ... ... ... *40 *2 *2 $30,000 to $34,999 . . . . . . . . . . . . . . . . . . . . . . . ... ... ... *72 *4 *4 $35,000 to $39,999 . . . . . . . . . . . . . . . . . . . . . . . ... ... ... *134 *7 *8 $40,000 to $49,999 . . . . . . . . . . . . . . . . . . . . . . . ... ... ... 112 4 6 $50,000 to $74,999 . . . . . . . . . . . . . . . . . . . . . . . ... ... ... 310 4 18 $75,000 to $99,999 . . . . . . . . . . . . . . . . . . . . . . . *91 *2 *31 425 9 25 $100,000 to $149,999 . . . . . . . . . . . . . . . . . . . . . *40 *1 *14 300 7 17 $150,000 or more . . . . . . . . . . . . . . . . . . . . . . . . *45 *1 *15 *108 *3 *6 Not reported . . . . . . . . . . . . . . . . . . . . . . . . . . . . ... ... ... 93 2 5 * Estimate based on a sample size of 10–29. ... Sample size too small (less than 10) to report data reliably. (Z) Less than 0.5 percent.
Note: Percent who participated columns show the percent of each row’s population who participated in the activity named by the column (the percent of those living in urban areas who fished only, etc.). Percent columns show the percent of each column’s participants who are described by the row heading (the percent of those who fished only who lived in urban areas, etc.). Data reported on this table are from screening interviews in which one adult household member responded for all household members. The screening interview required the respondent to recall 12 months worth of activity.

U.S. Fish and Wildlife Service and U.S. Census Bureau 2011 National Survey of Fishing, Hunting, and Wildlife-Associated Recreation 125
Table B-8. Selected Characteristics of Wildlife-Watching Participants 6 to 15 Years Old: 2010(Population 6 to 15 years old. Numbers in thousands)
Characteristic U.S. populationParticipants
Total Away from home Around the home
Number Percent NumberPercent who participated Percent Number
Percent who participated Percent Number
Percent who participated Percent
Total persons . . . . . . . . . . . . . . . . . . . . . . . . . 40,735 100 12,654 31 100 5,287 13 100 11,130 27 100
Population Density of Residence Urban . . . . . . . . . . . . . . . . . . . . . . . . . . . . . . 30,138 74 8,458 28 67 3,682 12 70 7,294 24 66 Rural . . . . . . . . . . . . . . . . . . . . . . . . . . . . . . 10,596 26 4,196 40 33 1,605 15 30 3,836 36 34
Population Size of Residence Metropolitan Statistical Area (MSA) . . . . . 38,520 95 11,953 31 94 5,002 13 95 10,509 27 94 1,000,000 or more . . . . . . . . . . . . . . . . . . 21,283 52 6,085 29 48 2,437 11 46 5,372 25 48 250,000 to 999,999 . . . . . . . . . . . . . . . . . 8,804 22 2,856 32 23 1,223 14 23 2,431 28 22 50,000 to 249,999 . . . . . . . . . . . . . . . . . . 8,433 21 3,012 36 24 1,342 16 25 2,707 32 24 Outside MSA . . . . . . . . . . . . . . . . . . . . . . . . 2,214 5 701 32 6 285 13 5 621 28 6
Census Geographic Division New England . . . . . . . . . . . . . . . . . . . . . . . . 1,726 4 593 34 5 274 16 5 521 30 5 Middle Atlantic . . . . . . . . . . . . . . . . . . . . . . 5,034 12 1,434 28 11 430 9 8 1,309 26 12 East North Central . . . . . . . . . . . . . . . . . . . . 6,072 15 2,204 36 17 904 15 17 2,004 33 18 West North Central . . . . . . . . . . . . . . . . . . . 2,645 6 1,003 38 8 455 17 9 846 32 8 South Atlantic . . . . . . . . . . . . . . . . . . . . . . . 7,606 19 2,392 31 19 1,012 13 19 2,079 27 19 East South Central . . . . . . . . . . . . . . . . . . . . 2,407 6 590 24 5 299 12 6 565 23 5 West South Central . . . . . . . . . . . . . . . . . . . 5,365 13 1,451 27 11 420 8 8 1,282 24 12 Mountain . . . . . . . . . . . . . . . . . . . . . . . . . . . 3,168 8 999 32 8 541 17 10 822 26 7 Pacific . . . . . . . . . . . . . . . . . . . . . . . . . . . . . 6,711 16 1,989 30 16 953 14 18 1,701 25 15
Age 6 to 8 years . . . . . . . . . . . . . . . . . . . . . . . . . 11,866 29 3,356 28 27 1,492 13 28 2,947 25 26 9 to 11 years . . . . . . . . . . . . . . . . . . . . . . . . 12,488 31 4,688 38 37 1,793 14 34 4,182 33 38 12 to 15 years . . . . . . . . . . . . . . . . . . . . . . . 16,380 40 4,611 28 36 2,001 12 38 4,002 24 36
Sex Male, total . . . . . . . . . . . . . . . . . . . . . . . . . . 21,420 53 6,690 31 53 2,808 13 53 5,819 27 52 6 to 8 years . . . . . . . . . . . . . . . . . . . . . . . 5,925 15 1,601 27 13 676 11 13 1,405 24 13 9 to 11 years . . . . . . . . . . . . . . . . . . . . . . 6,818 17 2,571 38 20 1,006 15 19 2,230 33 20 12 to 15 years . . . . . . . . . . . . . . . . . . . . . 8,678 21 2,518 29 20 1,126 13 21 2,184 25 20
Female, total . . . . . . . . . . . . . . . . . . . . . . . . 19,315 47 5,964 31 47 2,479 13 47 5,312 28 48 6 to 8 years . . . . . . . . . . . . . . . . . . . . . . . 5,942 15 1,755 30 14 816 14 15 1,542 26 14 9 to 11 years . . . . . . . . . . . . . . . . . . . . . . 5,670 14 2,117 37 17 787 14 15 1,952 34 18 12 to 15 years . . . . . . . . . . . . . . . . . . . . . 7,702 19 2,092 27 17 876 11 17 1,818 24 16
Ethnicity Hispanic . . . . . . . . . . . . . . . . . . . . . . . . . . . 7,846 19 1,430 18 11 510 6 10 1,278 16 11 Non-Hispanic . . . . . . . . . . . . . . . . . . . . . . . 32,889 81 11,224 34 89 4,777 15 90 9,852 30 89
Race White . . . . . . . . . . . . . . . . . . . . . . . . . . . . . . 28,458 70 10,346 36 82 4,226 15 80 9,178 32 82 African American . . . . . . . . . . . . . . . . . . . . 5,116 13 768 15 6 324 6 6 704 14 6 Asian American . . . . . . . . . . . . . . . . . . . . . . 2,055 5 460 22 4 258 13 5 388 19 3 All others . . . . . . . . . . . . . . . . . . . . . . . . . . . 5,105 13 1,081 21 9 480 9 9 861 17 8
Annual Household Income Less than $20,000 . . . . . . . . . . . . . . . . . . . . 4,686 12 998 21 8 392 8 7 825 18 7 $20,000 to $24,999 . . . . . . . . . . . . . . . . . . . 2,236 5 516 23 4 248 11 5 425 19 4 $25,000 to $29,999 . . . . . . . . . . . . . . . . . . . 2,073 5 574 28 5 208 10 4 518 25 5 $30,000 to $34,999 . . . . . . . . . . . . . . . . . . . 1,777 4 538 30 4 115 6 2 534 30 5 $35,000 to $39,999 . . . . . . . . . . . . . . . . . . . 2,045 5 384 19 3 198 10 4 375 18 3 $40,000 to $49,999 . . . . . . . . . . . . . . . . . . . 2,939 7 1,076 37 9 504 17 10 952 32 9 $50,000 to $74,999 . . . . . . . . . . . . . . . . . . . 7,146 18 2,687 38 21 1,046 15 20 2,316 32 21 $75,000 to $99,999 . . . . . . . . . . . . . . . . . . . 4,599 11 1,824 40 14 730 16 14 1,617 35 15 $100,000 to $149,999 . . . . . . . . . . . . . . . . . 4,452 11 1,809 41 14 816 18 15 1,567 35 14 $150,000 or more . . . . . . . . . . . . . . . . . . . . 3,281 8 1,301 40 10 663 20 13 1,140 35 10 Not reported . . . . . . . . . . . . . . . . . . . . . . . . 5,501 14 947 17 7 367 7 7 861 16 8 Note: Percent who participated columns show the percent of each row’s population who participated in the activity named by the column (the percent of those living in urban areas
who fished only, etc.). Percent columns show the percent of each column’s participants who are described by the row heading (the percent of those who fished only who lived in urban areas, etc.). Data reported on this table are from screening interviews in which one adult household member responded for all household members. The screening interview required the respondent to recall 12 months worth of activity.

126 2011 National Survey of Fishing, Hunting, and Wildlife-Associated Recreation U.S. Fish and Wildlife Service and U.S. Census Bureau
Table B-9. Participants in Wildlife-Related Recreation 6 to 15 Years Old by State Residents Both Inside and Outside Their Resident State: 2010
(Population 16 years old and older. Numbers in thousands)
Participant’s state of residence
Population
Total participants Sportspersons Wildlife-watching participants
NumberPercent of population Number
Percent of population Number
Percent of population
United States, total . . . . . . . . . . . . . . . . . . . . . . . . 40,735 17,956 44 11,673 29 12,654 31
Alabama . . . . . . . . . . . . . . . . . . . . . . . . . . . . . . . 621 219 35 182 29 134 22 Alaska . . . . . . . . . . . . . . . . . . . . . . . . . . . . . . . . . 97 60 61 48 49 42 43 Arizona . . . . . . . . . . . . . . . . . . . . . . . . . . . . . . . . 955 328 34 221 23 206 22 Arkansas . . . . . . . . . . . . . . . . . . . . . . . . . . . . . . . 393 174 44 *155 *39 *112 *29 California . . . . . . . . . . . . . . . . . . . . . . . . . . . . . . 5,127 1,886 37 902 18 1,431 28
Colorado . . . . . . . . . . . . . . . . . . . . . . . . . . . . . . . 674 303 45 200 30 219 32 Connecticut . . . . . . . . . . . . . . . . . . . . . . . . . . . . . 446 209 47 120 27 150 34 Delaware . . . . . . . . . . . . . . . . . . . . . . . . . . . . . . . 112 49 44 38 34 26 24 Florida . . . . . . . . . . . . . . . . . . . . . . . . . . . . . . . . . 2,213 990 45 672 30 646 29 Georgia . . . . . . . . . . . . . . . . . . . . . . . . . . . . . . . . 1,425 601 42 297 21 390 27
Hawaii . . . . . . . . . . . . . . . . . . . . . . . . . . . . . . . . . 155 50 32 25 16 41 26 Idaho . . . . . . . . . . . . . . . . . . . . . . . . . . . . . . . . . . 227 172 76 130 57 *113 *50 Illinois . . . . . . . . . . . . . . . . . . . . . . . . . . . . . . . . . 1,737 763 44 605 35 549 32 Indiana . . . . . . . . . . . . . . . . . . . . . . . . . . . . . . . . . 870 540 62 424 49 344 40 Iowa . . . . . . . . . . . . . . . . . . . . . . . . . . . . . . . . . . . 385 217 56 191 50 127 33
Kansas . . . . . . . . . . . . . . . . . . . . . . . . . . . . . . . . . 384 214 56 161 42 131 34 Kentucky . . . . . . . . . . . . . . . . . . . . . . . . . . . . . . . 554 222 40 206 37 116 21 Louisiana . . . . . . . . . . . . . . . . . . . . . . . . . . . . . . . 620 183 29 *97 *16 *140 *23 Maine . . . . . . . . . . . . . . . . . . . . . . . . . . . . . . . . . 145 86 59 67 46 70 48 Maryland . . . . . . . . . . . . . . . . . . . . . . . . . . . . . . . 738 271 37 161 22 217 29
Massachusetts . . . . . . . . . . . . . . . . . . . . . . . . . . . 789 320 41 172 22 249 32 Michigan . . . . . . . . . . . . . . . . . . . . . . . . . . . . . . . 1,279 600 47 449 35 413 32 Minnesota . . . . . . . . . . . . . . . . . . . . . . . . . . . . . . 677 414 61 345 51 *264 *39 Mississippi . . . . . . . . . . . . . . . . . . . . . . . . . . . . . 414 199 48 191 46 *71 *17 Missouri . . . . . . . . . . . . . . . . . . . . . . . . . . . . . . . 776 466 60 363 47 339 44
Montana . . . . . . . . . . . . . . . . . . . . . . . . . . . . . . . 116 90 78 80 69 *65 *56 Nebraska . . . . . . . . . . . . . . . . . . . . . . . . . . . . . . . 243 117 48 94 39 66 27 Nevada . . . . . . . . . . . . . . . . . . . . . . . . . . . . . . . . 367 156 43 71 19 130 35 New Hampshire . . . . . . . . . . . . . . . . . . . . . . . . . 156 74 47 52 33 52 34 New Jersey . . . . . . . . . . . . . . . . . . . . . . . . . . . . . 1,132 470 42 213 19 377 33
New Mexico . . . . . . . . . . . . . . . . . . . . . . . . . . . . 283 110 39 79 28 59 21 New York . . . . . . . . . . . . . . . . . . . . . . . . . . . . . . 2,399 722 30 523 22 479 20 North Carolina . . . . . . . . . . . . . . . . . . . . . . . . . . 1,249 721 58 490 39 513 41 North Dakota . . . . . . . . . . . . . . . . . . . . . . . . . . . . (NA) (NA) (NA) (NA) (NA) (NA) (NA) Ohio. . . . . . . . . . . . . . . . . . . . . . . . . . . . . . . . . . . 1,479 648 44 483 33 479 32
Oklahoma . . . . . . . . . . . . . . . . . . . . . . . . . . . . . . 505 226 45 209 41 87 17 Oregon . . . . . . . . . . . . . . . . . . . . . . . . . . . . . . . . . 476 201 42 119 25 164 35 Pennsylvania . . . . . . . . . . . . . . . . . . . . . . . . . . . . 1,504 810 54 410 27 578 38 Rhode Island . . . . . . . . . . . . . . . . . . . . . . . . . . . . 123 43 35 26 21 31 25 South Carolina . . . . . . . . . . . . . . . . . . . . . . . . . . 589 290 49 191 32 192 33
South Dakota . . . . . . . . . . . . . . . . . . . . . . . . . . . . 106 72 68 62 59 *55 *52 Tennessee . . . . . . . . . . . . . . . . . . . . . . . . . . . . . . 817 333 41 271 33 268 33 Texas . . . . . . . . . . . . . . . . . . . . . . . . . . . . . . . . . . 3,846 1,446 38 672 17 1,112 29 Utah . . . . . . . . . . . . . . . . . . . . . . . . . . . . . . . . . . . 476 266 56 179 38 167 35 Vermont . . . . . . . . . . . . . . . . . . . . . . . . . . . . . . . . 67 49 72 29 43 41 61
Virginia . . . . . . . . . . . . . . . . . . . . . . . . . . . . . . . . 1,009 432 43 205 20 332 33 Washington . . . . . . . . . . . . . . . . . . . . . . . . . . . . . 857 391 46 214 25 311 36 West Virginia . . . . . . . . . . . . . . . . . . . . . . . . . . . . 214 157 73 *150 *70 *45 *21 Wisconsin . . . . . . . . . . . . . . . . . . . . . . . . . . . . . . 707 483 68 353 50 419 59 Wyoming . . . . . . . . . . . . . . . . . . . . . . . . . . . . . . . 69 57 83 *41 *59 41 59 (NA) Not available.
Note: Detail does not add to total because of multiple responses. U.S. totals include responses from participants residing in the District of Columbia, as described in Appendix D. Data reported on this table are from screening interviews in which one adult household member responded for all household members 6 to 15 years old. The screening interview required the respondent to recall 12 months worth of activity. Includes persons who fished or hunted only in other countries.

U.S. Fish and Wildlife Service and U.S. Census Bureau 2011 National Survey of Fishing, Hunting, and Wildlife-Associated Recreation 127
Table B-10. Anglers and Hunters 6 to 15 Years Old by State Residents Participating Both Inside and Outside Their Resident State: 2010
(Population 6 to 15 years old. Numbers in thousands)
Sportsperson’s state of residence
Population
Fished or hunted Fished only Hunted only Fished and hunted
NumberPercent of population Number
Percent of population Number
Percent of population Number
Percent of population
United States, total . . . . . . . . . . . . . . . . . . . . . . . . 40,735 11,673 29 9,647 24 293 1 1,732 4
Alabama . . . . . . . . . . . . . . . . . . . . . . . . . . . . . . . 621 182 29 *127 *20 ... ... *55 *9 Alaska . . . . . . . . . . . . . . . . . . . . . . . . . . . . . . . . . 97 48 49 44 45 ... ... ... ... Arizona . . . . . . . . . . . . . . . . . . . . . . . . . . . . . . . . 955 221 23 196 20 ... ... ... ... Arkansas . . . . . . . . . . . . . . . . . . . . . . . . . . . . . . . 393 *155 *39 *94 *24 ... ... *60 *15 California . . . . . . . . . . . . . . . . . . . . . . . . . . . . . . 5,127 902 18 825 16 ... ... *77 *2
Colorado . . . . . . . . . . . . . . . . . . . . . . . . . . . . . . . 674 200 30 193 29 ... ... ... ... Connecticut . . . . . . . . . . . . . . . . . . . . . . . . . . . . . 446 120 27 118 27 ... ... ... ... Delaware . . . . . . . . . . . . . . . . . . . . . . . . . . . . . . . 112 38 34 35 31 ... ... ... ... Florida . . . . . . . . . . . . . . . . . . . . . . . . . . . . . . . . . 2,213 672 30 614 28 ... ... *47 *2 Georgia . . . . . . . . . . . . . . . . . . . . . . . . . . . . . . . . 1,425 297 21 *262 *18 ... ... *30 *2
Hawaii . . . . . . . . . . . . . . . . . . . . . . . . . . . . . . . . . 155 25 16 22 14 ... ... ... ... Idaho . . . . . . . . . . . . . . . . . . . . . . . . . . . . . . . . . . 227 130 57 125 55 ... ... ... ... Illinois . . . . . . . . . . . . . . . . . . . . . . . . . . . . . . . . . 1,737 605 35 574 33 ... ... ... ... Indiana . . . . . . . . . . . . . . . . . . . . . . . . . . . . . . . . . 870 424 49 387 44 ... ... ... ... Iowa . . . . . . . . . . . . . . . . . . . . . . . . . . . . . . . . . . . 385 191 50 167 43 ... ... *22 *6
Kansas . . . . . . . . . . . . . . . . . . . . . . . . . . . . . . . . . 384 161 42 105 27 ... ... *49 *13 Kentucky . . . . . . . . . . . . . . . . . . . . . . . . . . . . . . . 554 206 37 138 25 ... ... *54 *10 Louisiana . . . . . . . . . . . . . . . . . . . . . . . . . . . . . . . 620 *97 *16 ... ... ... ... *34 *5 Maine . . . . . . . . . . . . . . . . . . . . . . . . . . . . . . . . . 145 67 46 *56 *39 ... ... ... ... Maryland . . . . . . . . . . . . . . . . . . . . . . . . . . . . . . . 738 161 22 155 21 ... ... ... ...
Massachusetts . . . . . . . . . . . . . . . . . . . . . . . . . . . 789 172 22 169 21 ... ... ... ... Michigan . . . . . . . . . . . . . . . . . . . . . . . . . . . . . . . 1,279 449 35 *281 *22 ... ... ... ... Minnesota . . . . . . . . . . . . . . . . . . . . . . . . . . . . . . 677 345 51 *221 *33 ... ... *121 *18 Mississippi . . . . . . . . . . . . . . . . . . . . . . . . . . . . . 414 191 46 *148 *36 ... ... *42 *10 Missouri . . . . . . . . . . . . . . . . . . . . . . . . . . . . . . . 776 363 47 293 38 ... ... 68 9
Montana . . . . . . . . . . . . . . . . . . . . . . . . . . . . . . . 116 80 69 *45 *38 ... ... ... ... Nebraska . . . . . . . . . . . . . . . . . . . . . . . . . . . . . . . 243 94 39 77 32 ... ... ... ... Nevada . . . . . . . . . . . . . . . . . . . . . . . . . . . . . . . . 367 71 19 66 18 ... ... ... ... New Hampshire . . . . . . . . . . . . . . . . . . . . . . . . . 156 52 33 46 30 ... ... ... ... New Jersey . . . . . . . . . . . . . . . . . . . . . . . . . . . . . 1,132 213 19 210 19 ... ... ... ...
New Mexico . . . . . . . . . . . . . . . . . . . . . . . . . . . . 283 79 28 67 24 ... ... *12 *4 New York . . . . . . . . . . . . . . . . . . . . . . . . . . . . . . 2,399 523 22 489 20 ... ... ... ... North Carolina . . . . . . . . . . . . . . . . . . . . . . . . . . 1,249 490 39 396 32 ... ... ... ... North Dakota . . . . . . . . . . . . . . . . . . . . . . . . . . . . (NA) (NA) (NA) (NA) (NA) (NA) (NA) (NA) (NA) Ohio. . . . . . . . . . . . . . . . . . . . . . . . . . . . . . . . . . . 1,479 483 33 375 25 ... ... ... ...
Oklahoma . . . . . . . . . . . . . . . . . . . . . . . . . . . . . . 505 209 41 190 38 ... ... ... ... Oregon . . . . . . . . . . . . . . . . . . . . . . . . . . . . . . . . . 476 119 25 101 21 ... ... ... ... Pennsylvania . . . . . . . . . . . . . . . . . . . . . . . . . . . . 1,504 410 27 343 23 ... ... ... ... Rhode Island . . . . . . . . . . . . . . . . . . . . . . . . . . . . 123 26 21 26 21 ... ... ... ... South Carolina . . . . . . . . . . . . . . . . . . . . . . . . . . 589 191 32 *133 *23 ... ... *36 *6
South Dakota . . . . . . . . . . . . . . . . . . . . . . . . . . . . 106 62 59 *39 *36 ... ... ... ... Tennessee . . . . . . . . . . . . . . . . . . . . . . . . . . . . . . 817 271 33 222 27 ... ... *48 *6 Texas . . . . . . . . . . . . . . . . . . . . . . . . . . . . . . . . . . 3,846 672 17 504 13 ... ... *161 *4 Utah . . . . . . . . . . . . . . . . . . . . . . . . . . . . . . . . . . . 476 179 38 149 31 ... ... *30 *6 Vermont . . . . . . . . . . . . . . . . . . . . . . . . . . . . . . . . 67 29 43 25 37 ... ... ... ...
Virginia . . . . . . . . . . . . . . . . . . . . . . . . . . . . . . . . 1,009 205 20 160 16 ... ... *31 *3 Washington . . . . . . . . . . . . . . . . . . . . . . . . . . . . . 857 214 25 184 21 ... ... ... ... West Virginia . . . . . . . . . . . . . . . . . . . . . . . . . . . . 214 *150 *70 *111 *52 ... ... ... ... Wisconsin . . . . . . . . . . . . . . . . . . . . . . . . . . . . . . 707 353 50 *226 *32 ... ... ... ... Wyoming . . . . . . . . . . . . . . . . . . . . . . . . . . . . . . . 69 *41 *59 *30 *44 ... ... ... ... * Estimate based on a sample size of 10–29. ... Sample size too small (less than 10) to report data reliably. (NA) Not available.
Note: U.S. totals include responses from participants residing in the District of Columbia, as described in Appendix D. Data reported on this table are from screening interviews in which one adult household member responded for all household members 6 to 15 years old. The screening interview required the respondent to recall 12 months worth of activity. Includes persons who fished or hunted only in other countries.

128 2011 National Survey of Fishing, Hunting, and Wildlife-Associated Recreation U.S. Fish and Wildlife Service and U.S. Census Bureau
Table B-11. Participants in Wildlife-Watching Activities 6 to 15 Years Old by State Residents Participating Both Inside and Outside Their Resident State: 2010
(Population 6 to 15 years old. Numbers in thousands)
Participant’s state of residence
Population
ParticipantsTotal Away from home Around the home
NumberPercent of population Number
Percent of population Number
Percent of population
United States, total . . . . . . . . . . . . . . . . . . . . . . . . 40,735 12,654 31 5,287 13 11,130 27
Alabama . . . . . . . . . . . . . . . . . . . . . . . . . . . . . . . 621 134 22 *44 *7 132 21 Alaska . . . . . . . . . . . . . . . . . . . . . . . . . . . . . . . . . 97 42 43 *15 *15 37 38 Arizona . . . . . . . . . . . . . . . . . . . . . . . . . . . . . . . . 955 206 22 103 11 178 19 Arkansas . . . . . . . . . . . . . . . . . . . . . . . . . . . . . . . 393 *112 *29 ... ... *88 *22 California . . . . . . . . . . . . . . . . . . . . . . . . . . . . . . 5,127 1,431 28 661 13 1,232 24
Colorado . . . . . . . . . . . . . . . . . . . . . . . . . . . . . . . 674 219 32 94 14 182 27 Connecticut . . . . . . . . . . . . . . . . . . . . . . . . . . . . . 446 150 34 66 15 129 29 Delaware . . . . . . . . . . . . . . . . . . . . . . . . . . . . . . . 112 26 24 *12 *10 21 19 Florida . . . . . . . . . . . . . . . . . . . . . . . . . . . . . . . . . 2,213 646 29 271 12 520 24 Georgia . . . . . . . . . . . . . . . . . . . . . . . . . . . . . . . . 1,425 390 27 *144 *10 374 26
Hawaii . . . . . . . . . . . . . . . . . . . . . . . . . . . . . . . . . 155 41 26 *27 *18 36 23 Idaho . . . . . . . . . . . . . . . . . . . . . . . . . . . . . . . . . . 227 *113 *50 *99 *44 *90 *40 Illinois . . . . . . . . . . . . . . . . . . . . . . . . . . . . . . . . . 1,737 549 32 244 14 484 28 Indiana . . . . . . . . . . . . . . . . . . . . . . . . . . . . . . . . . 870 344 40 *96 *11 332 38 Iowa . . . . . . . . . . . . . . . . . . . . . . . . . . . . . . . . . . . 385 127 33 65 17 104 27
Kansas . . . . . . . . . . . . . . . . . . . . . . . . . . . . . . . . . 384 131 34 *49 *13 113 29 Kentucky . . . . . . . . . . . . . . . . . . . . . . . . . . . . . . . 554 116 21 *57 *10 105 19 Louisiana . . . . . . . . . . . . . . . . . . . . . . . . . . . . . . . 620 *140 *23 ... ... *136 *22 Maine . . . . . . . . . . . . . . . . . . . . . . . . . . . . . . . . . 145 70 48 *33 *22 61 42 Maryland . . . . . . . . . . . . . . . . . . . . . . . . . . . . . . . 738 217 29 123 17 197 27
Massachusetts . . . . . . . . . . . . . . . . . . . . . . . . . . . 789 249 32 114 14 219 28 Michigan . . . . . . . . . . . . . . . . . . . . . . . . . . . . . . . 1,279 413 32 *198 *15 375 29 Minnesota . . . . . . . . . . . . . . . . . . . . . . . . . . . . . . 677 *264 *39 *149 *22 *199 *29 Mississippi . . . . . . . . . . . . . . . . . . . . . . . . . . . . . 414 *71 *17 ... ... *70 *17 Missouri . . . . . . . . . . . . . . . . . . . . . . . . . . . . . . . 776 339 44 114 15 317 41
Montana . . . . . . . . . . . . . . . . . . . . . . . . . . . . . . . 116 *65 *56 *42 *36 *63 *54 Nebraska . . . . . . . . . . . . . . . . . . . . . . . . . . . . . . . 243 66 27 *36 *15 *48 *20 Nevada . . . . . . . . . . . . . . . . . . . . . . . . . . . . . . . . 367 130 35 *81 *22 81 22 New Hampshire . . . . . . . . . . . . . . . . . . . . . . . . . 156 52 34 *28 *18 50 32 New Jersey . . . . . . . . . . . . . . . . . . . . . . . . . . . . . 1,132 377 33 110 10 356 31
New Mexico . . . . . . . . . . . . . . . . . . . . . . . . . . . . 283 59 21 33 12 50 18 New York . . . . . . . . . . . . . . . . . . . . . . . . . . . . . . 2,399 479 20 *234 *10 375 16 North Carolina . . . . . . . . . . . . . . . . . . . . . . . . . . 1,249 513 41 *287 *23 390 31 North Dakota . . . . . . . . . . . . . . . . . . . . . . . . . . . . (NA) (NA) (NA) (NA) (NA) (NA) (NA) Ohio. . . . . . . . . . . . . . . . . . . . . . . . . . . . . . . . . . . 1,479 479 32 231 16 394 27
Oklahoma . . . . . . . . . . . . . . . . . . . . . . . . . . . . . . 505 87 17 *48 *9 *70 *14 Oregon . . . . . . . . . . . . . . . . . . . . . . . . . . . . . . . . . 476 164 35 *60 *13 155 33 Pennsylvania . . . . . . . . . . . . . . . . . . . . . . . . . . . . 1,504 578 38 *86 *6 578 38 Rhode Island . . . . . . . . . . . . . . . . . . . . . . . . . . . . 123 31 25 13 11 27 22 South Carolina . . . . . . . . . . . . . . . . . . . . . . . . . . 589 192 33 *30 *5 189 32
South Dakota . . . . . . . . . . . . . . . . . . . . . . . . . . . . 106 *55 *52 *40 *37 *44 *41 Tennessee . . . . . . . . . . . . . . . . . . . . . . . . . . . . . . 817 268 33 *187 *23 258 32 Texas . . . . . . . . . . . . . . . . . . . . . . . . . . . . . . . . . . 3,846 1,112 29 *318 *8 989 26 Utah . . . . . . . . . . . . . . . . . . . . . . . . . . . . . . . . . . . 476 167 35 *60 *13 145 30 Vermont . . . . . . . . . . . . . . . . . . . . . . . . . . . . . . . . 67 41 61 *20 *30 35 52
Virginia . . . . . . . . . . . . . . . . . . . . . . . . . . . . . . . . 1,009 332 33 118 12 313 31 Washington . . . . . . . . . . . . . . . . . . . . . . . . . . . . . 857 311 36 190 22 241 28 West Virginia . . . . . . . . . . . . . . . . . . . . . . . . . . . . 214 *45 *21 ... ... *45 *21 Wisconsin . . . . . . . . . . . . . . . . . . . . . . . . . . . . . . 707 419 59 *135 *19 419 59 Wyoming . . . . . . . . . . . . . . . . . . . . . . . . . . . . . . . 69 41 59 *29 *42 *33 *48 * Estimate based on a sample size of 10–29. ... Sample size too small (less than 10) to report data reliably. (NA) Not available.
Note: Detail does not add to total because of multiple responses. U.S. totals include responses from participants residing in the District of Columbia, as described in Appendix D. Data reported on this table are from screening interviews in which one adult household member responded for all household members 6 to 15 years old. The screening interview required the respondent to recall 12 months worth of activity. Includes persons who fished or hunted only in other countries.

U.S. Fish and Wildlife Service and U.S. Census Bureau 2011 National Survey of Fishing, Hunting, and Wildlife-Associated Recreation 129
Table B-12. Participation by 6-to-15-Year-Olds in 1980, 1985, 1990, 1995, 2000, 2005, and 2010(Numbers in thousands)
Participant
1980 1985 1990
Number of participants
Percent change from
previous survey
Percent of 6-to-15- year-old
populationNumber of
participants
Percent change from
previous survey
Percent of 6-to-15- year-old
populationNumber of
participants
Percent change from
previous survey
Percent of 6-to-15- year-old
populationTotal sportspersons . . . . . . . . . . . . . . . . . . . . . . . . 12,141 (NA) 34 12,558 3 36 14,011 12 39 Anglers . . . . . . . . . . . . . . . . . . . . . . . . . . . . . . . . 11,787 (NA) 33 12,243 4 35 13,790 13 39 Hunters . . . . . . . . . . . . . . . . . . . . . . . . . . . . . . . . 1,962 (NA) 6 1,799 –8 5 1,730 –4 5
Total wildlife watchers . . . . . . . . . . . . . . . . . . . . . (NA) (NA) (NA) 17,789 (NA) 51 17,136 –4 48 Around the home . . . . . . . . . . . . . . . . . . . . . . . . . (NA) (NA) (NA) 16,151 (NA) 46 15,406 –5 43 Away from home . . . . . . . . . . . . . . . . . . . . . . . . . (NA) (NA) (NA) 6,615 (NA) 19 7,311 11 21
1995 2000 2005
Number of participants
Percent change from
previous survey
Percent of 6-to-15- year-old
populationNumber of
participants
Percent change from
previous survey
Percent of 6-to-15- year-old
populationNumber of
participants
Percent change from
previous survey
Percent of 6-to-15- year-old
populationTotal sportspersons . . . . . . . . . . . . . . . . . . . . . . . . 15,019 7 39 13,369 –11 33 12,318 –8 30 Anglers . . . . . . . . . . . . . . . . . . . . . . . . . . . . . . . . 14,808 7 38 13,145 –11 32 12,110 –8 30 Hunters . . . . . . . . . . . . . . . . . . . . . . . . . . . . . . . . 1,720 –1 4 1,741 1 4 1,773 2 4
Total wildlife watchers . . . . . . . . . . . . . . . . . . . . . 17,449 2 45 15,066 –14 37 13,587 –10 34 Around the home . . . . . . . . . . . . . . . . . . . . . . . . . 15,425 (Z) 40 13,542 –12 33 12,055 –11 30 Away from home . . . . . . . . . . . . . . . . . . . . . . . . . 8,314 14 21 6,091 –27 15 5,850 –4 14
2010
Number of participants
Percent change from
previous survey
Percent of 6-to-
15-year-old population
Total sportspersons . . . . . . . . . . . . . . . . . . . . . . . . 11,673 –5 29 Anglers . . . . . . . . . . . . . . . . . . . . . . . . . . . . . . . . 11,379 –6 28 Hunters . . . . . . . . . . . . . . . . . . . . . . . . . . . . . . . . 2,026 14 5
Total wildlife watchers . . . . . . . . . . . . . . . . . . . . . 12,654 –7 31 Around the home . . . . . . . . . . . . . . . . . . . . . . . . . 11,130 –8 27 Away from home . . . . . . . . . . . . . . . . . . . . . . . . . 5,287 –11 13 (NA) Not Available. (Z) Less than 0.5 percent.


U.S. Fish and Wildlife Service and U.S. Census Bureau 2011 National Survey of Fishing, Hunting, and Wildlife-Associated Recreation 131
Appendix C

132 2011 National Survey of Fishing, Hunting, and Wildlife-Associated Recreation U.S. Fish and Wildlife Service and U.S. Census Bureau
Appendix C.Significant Methodological Changes From Previous Surveys and Regional Trends
The 2011 National Survey of Fishing, Hunting, and Wildlife-Associated Recreation (FHWAR) was designed to continue the data collection of the 1955 to 2006 Surveys. While complete comparability between any two Surveys cannot be achieved, this appendix compares major findings of all the Surveys and presents trends for the major categories of wildlife-related recreation where feasible. Differences among the Surveys are discussed in the following two sections.
The principal characteristics of the 1955 to 2011 Surveys are summarized in Table C-1. The table shows the scope and design of all 12 Surveys.
This appendix provides trend informa-tion in two sections (1991 to 2011 and 1955 to 1985). A significant change was made in 1991 in the recall period used in the detailed phase of the FHWAR Surveys. The recall period in 1991 was shortened from the 12 months used in previous Surveys to 4 months in order to improve the accu-racy of the data collected. As a result of that change, the Surveys conducted since 1991 cannot be compared with those conducted earlier.
The 1955 to 1985 Surveys required respondents to recall their recreation activities for the survey year at the beginning of the following year. The 1991 to 2011 Surveys went to the respondents two or three times during the survey year to get their activity information. The change in the recall period was due to a study1 of the effect of the respondent recall length
1 Investigation of Possible Recall/Reference Period Bias in National Surveys of Fishing, Hunting and Wildlife-Associated Recreation, December 1989, Westat, Inc.
on survey estimates. The study found significant differences in FHWAR Survey results using annual recall periods versus shorter recall periods. Longer recall periods lead to higher estimates. Even when everything else was held constant, such as question-naire content and sample design, increasing the respondent’s recall period resulted in significantly higher estimates for the same phenomenon.
The recall study also found that the extent of recall bias varied for different types of fishing and hunting participa-tion and expenditures. For example, annual recall respondents gave an estimate of average annual days of salt-water fishing that was 46 percent higher than the trimester recall estimate, while the annual recall estimate of average annual saltwater fishing trips was 30 percent higher than the trimester recall estimate. This means there is no single correction factor for all survey esti-mates when calculating trends from Surveys using different recall periods.
Reliable trends analysis needs to use data compiled from surveys in which the important elements, such as the sample design and recall period, are not significantly different.
1991 to 2011 Significant Methodological Differences
The most significant design differences in the five Surveys are as follows:
1. The 1991 Survey data was collected by interviewers filling out paper questionnaires. The data entries were keyed in a separate operation after the interview. The 1996, 2001, 2006, and 2011 Survey data were collected by the use of computer-assisted interviews. The
questionnaires were programmed into computers, and the interviewer keyed in the responses at the time of the interview.
2. The 1991 Survey screening phase was conducted in January and February of 1991, when a household member of the sample households was interviewed on behalf of the entire household. The screening interviews for the 1996, 2001, and 2006 Surveys were conducted April through June of their survey years in conjunction with the first wave of the detailed interviews. The 2011 Survey also conducted screening interviews and the first detailed interviews April through June of 2011, but further-more had an additional screening and detailed effort from February 2012 to the end of May 2012. The April–June 2011 screening effort had a high noncontact rate because of poor results using sample tele-phone numbers obtained from a private firm. Census went back to the noncontacted component of the original sample in February-May 2012 and interviewed a subsample, requiring annual recall for those respondents. The Wave 3 screen sample was 12,484 of the total 48,600 household screen sample. A modification of the 2011 sampling scheme was to oversample counties that had relatively high proportions of hunting license purchases.
The screening interviews for all five Surveys consisted primarily of demo-graphic questions and wildlife-related recreation questions concerning activity in the previous year (1990, 1995, etc.) and intentions for recreating in the survey year.

U.S. Fish and Wildlife Service and U.S. Census Bureau 2011 National Survey of Fishing, Hunting, and Wildlife-Associated Recreation 133
Table C-1. Major Characteristics of Surveys: 1955 to 2011Characteristic 1955 1960 1965 1970 1975 1980
Survey design: Screening interview
mode and population of interest . . . . . . . . . . . . . . Combined with
detailed phasePersonal interview, 12
years old and olderPersonal interview, 9
years old and olderMail questionnaire, 9
years old and olderTelephone interview, 6 years old and older
Telephone/personal interview, 6 years old
and older
Detailed interview mode and population of interest . . . . . . . . . . . . . . Personal interview, 12
years old and olderPersonal interview,
12 years old and older. Substantial
participants1
Personal interview, 12 years old and
older. Substantial participants1
Personal interview, 12 years old and
older. Substantial participants2
Mail questionnaire, 9 years old and older
Personal interview, 16 years old and older
Respondent’s recall period . . . . . . . . . . . . . . . . . 1 year 1 year 1 year 1 year 1 year 1 year
Sample sizes: Screening phase
(households) . . . . . . . . . . . . 20,000 18,000 16,000 24,000 106,294 116,025
Detailed phase (individuals):
Fishing and hunting. . . . . . 9,328 10,300 6,400 8,700 20,211 30,291 Wildlife watching3 . . . . . . . (X) (X) (X) (X) (X) 5,997
Response rates: Screening phase . . . . . . . . . . (NA) (NA) (NA) (NA) 95 percent 95 percent
Detailed phase: Fishing and hunting. . . . . . (NA) 93 percent (NA) (NA) 37 percent 90 percent
Wildlife watching3 . . . . . . . (X) (X) (X) (X) (X) 95 percent
Level of reporting . . . . . . . . . . . National National National National State andNational
State andNational
Data collection agent . . . . . . . . . Privatecontractor
U.S.Census Bureau
U.S.Census Bureau
U.S.Census Bureau
Privatecontractor
U.S.Census Bureau
See footnotes at end of table.

134 2011 National Survey of Fishing, Hunting, and Wildlife-Associated Recreation U.S. Fish and Wildlife Service and U.S. Census Bureau
Table C-1. Major Characteristics of Surveys: 1955 to 2011—ContinuedCharacteristic 1985 1991 1996 2001 2006 2011
Survey design: Screening interview
mode and population of interest . . . . . . . . . . . . . . Telephone/personal
interview, 6 years old and older
Telephone/personal interview, 6 years old
and older
Telephone/personal interview, 6 years old
and older
Telephone/personal interview, 6 years old
and older
Telephone/personal interview, 6 years old
and older
Telephone/personal interview, 6 years old
and older
Detailed interview mode and population of interest . . . . . . . . . . . . . . Personal interview,
16 years old and older
Telephone/personal interview, 16 years
old and older
Telephone/personal interview, 16 years
old and older
Telephone/personal interview, 16 years
old and older
Telephone/personal interview, 16 years
old and older
Telephone/personal interview, 16 years
old and older
Respondent’s recall period . . . . . . . . . . . . . . . . . 1 year 4 months 4–8 months 4–8 months 4–8 months 4–12 months
Sample sizes: Screening phase
(households) . . . . . . . . . . . . 102,694 102,804 44,000 52,508 66,688 30,400
Detailed phase (individuals):
Fishing and hunting. . . . . . 28,011 23,179 13,222 25,070 21,938 11,330 Wildlife watching3 . . . . . . . 26,671 22,723 9,802 15,303 11,279 9,329
Response rates: Screening phase . . . . . . . . . . 93 percent 95 percent 71 percent 75 percent 90 percent 77 percent
Detailed phase: Fishing and hunting. . . . . . 92 percent 95 percent 80 percent 88 percent 77 percent 67 percent
Wildlife watching3 . . . . . . . 94 percent 95 percent 82 percent 90 percent 78 percent 66 percent
Level of reporting . . . . . . . . . . . State and National
State andNational
State andNational
State andNational
State andNational
State andNational
Data collection agent . . . . . . . . . U.S.Census Bureau
U.S.Census Bureau
U.S.Census Bureau
U.S.Census Bureau
U.S.Census Bureau
U.S.Census Bureau
(NA) Not available. (X) Not applicable; wildlife-watching (nonconsumptive) interviews were not conducted prior to 1980.1 Spent $5.00 or more or participated 3 days or more during the year.2 Spent $7.50 or more or participated 3 days or more during the year.3 Termed “nonconsumptive” in 1980, 1985, and 1991 Surveys.
U.S. Fish and Wildlife Service and U.S. Census Bureau 2011 National Survey of Fishing, Hunting, and Wildlife-Associated Recreation 135
In the 1991 Survey, an attempt was made to contact every sample person in all three detailed interview waves. In 1996, 2001, 2006, and 2011 respondents who were interviewed in the first detailed interview wave were not contacted again until the third wave (unless they were part of the other subsample, i.e., a respondent in both the sportsperson and wildlife watching subsamples could be in the first and third wave of sportsperson interviewing and the second and third wave of wildlife watching inter-viewing). Also, all interviews in the second wave were conducted only by telephone. In-person interviews were only conducted in the first and third waves. The 2011 wave 3 screen phase was composed of both telephone and in-person interviews.
Section I. Important Instrument Changes in the 1996 Survey
1. The 1991 Survey collected information on all wildlife-related recreation purchases made by participants without reference to where the purchase was made. The 1996 Survey asked in which state the purchase was made.
2. In 1991, respondents were asked what kind of fishing they did, i.e., Great Lakes, other freshwater, or saltwater, and then were asked in what states they fished. In 1996, respondents were asked in which states they fished and then were asked what kind of fishing they did. This method had the advantage of not asking about, for example, saltwater fishing when they only fished in a noncoastal state.
3. In 1991, respondents were asked how many days they “actually” hunted or fished for a particular type of game or fish and then how many days they “chiefly” hunted or fished for the same type of game or fish rather than another type of game or fish. To get total days of hunting or fishing for a particular type of game or fish, the “actually” day response was used, while to get the sum of all days of hunting or fishing, the “chiefly” days were summed. In 1996, respondents were asked their total days of hunting or fishing in the country and each state, then how
many days they hunted or fished for a particular type of game or fish.
4. Trip-related and equipment expen-diture categories were not the same for all Surveys. “Guide fee” and “Pack trip or package fee” were two separate trip-related expendi-ture items in 1991, while they were combined into one category in the 1996 Survey. “Boating costs” was added to the 1996 hunting and wildlife-watching trip-related expenditure sections. “Heating and cooking fuel” was added to all of the trip-related expenditure sections. “Spearfishing equip-ment” was moved from a separate category to the “other” list. “Rods” and “Reels” were two separate categories in 1991 but were combined in 1996. “Lines, hooks, sinkers, etc.” was one category in 1991 but split into “Lines” and “Hooks, sinkers, etc.” in 1996. “Food used to feed other wildlife” was added to the wildlife-watching equipment section, “Boats” and “Cabins” were added to the wildlife-watching special equip-ment section, and “Land leasing and ownership” was added to the wildlife-watching expenditures section.
5. Questions asking sportspersons if they participated as much as they wanted were added in 1996. If the sportspersons said no, they were asked why not.
6. The 1991 Survey included questions about participation in organized fishing competitions; anglers using bows and arrows, nets or seines, or spearfishing; hunters using pistols or handguns and target shooting in preparation for hunting. These questions were not asked in 1996.
7. The 1996 Survey included ques-tions about catch and release fishing and persons with disabili-ties participating in wildlife-related recreation. These questions were not part of the 1991 Survey.
8. The 1991 Survey included ques-tions about average distance traveled to recreation sites. These questions were not included in the 1996 Survey.
9. The 1996 Survey included questions about the last trip the respondent took. Included were questions about the type of trip, where the activity took place, and the distance and direction to the site visited. These questions were not asked in 1991.
10. The 1991 Survey collected data on hunting, fishing, and wild-life watching by U.S. residents in Canada. The 1996 Survey collected data on fishing and wild-life-watching by U.S. residents in Canada.
Section II. Important instrument changes in the 2001 Survey
1. The 1991 and 1996 single race category “Asian or Pacific Islander” was changed to two categories “Asian” and “Native Hawaiian or Other Pacific Islander”. In 1991 and 1996, the respondent was required to pick only one category, while in 2001 the respondent could pick any combination of categories. The next question stipulated that the respondent could only be identified with one category and then asked what that category was.
2. The 1991 and 1996 land leasing and ownership sections asked the respondent to combine the two types of land use into one and give total acreage and expenditures. In 2001, the two types of land use were explored separately.
3. The 1991 and 1996 wildlife-watching sections included ques-tions on birdwatching for around-the-home participants only. The 2001 Survey added a question on birdwatching for away-from-home participants. Also, questions on the use of birding life lists and how many species the respondent can identify were added.
4. “Recreational vehicles” was added to the sportspersons and wildlife-watchers special equipment section. “House trailer” was added to the sportspersons special equip-ment section.
5. Total personal income was asked in the detailed phase of the 1996 Survey. This was changed to total

136 2011 National Survey of Fishing, Hunting, and Wildlife-Associated Recreation U.S. Fish and Wildlife Service and U.S. Census Bureau
Table C-2. Anglers and Hunters by Census Division: 1991, 1996, 2001, 2006, and 2011(U.S. population 16 years old and older. Numbers in thousands)
Area and sportsperson1991 1996 2001 2006 2011
Number Percent Number Percent Number Percent Number Percent Number PercentUNITED STATES . . . . . . . . . . . . . . . . . . . . . . . . . .
Total population . . . . . . . . . . . . . . . . . . . . . . . . . . . 189,964 100 201,472 100 212,298 100 229,245 100 239,313 100Sportspersons . . . . . . . . . . . . . . . . . . . . . . . . . . . . . 39,979 21 39,694 20 37,805 18 33,916 15 37,397 16 Anglers . . . . . . . . . . . . . . . . . . . . . . . . . . . . . . . . . 35,578 19 35,246 17 34,067 16 29,952 13 33,112 14 Hunters . . . . . . . . . . . . . . . . . . . . . . . . . . . . . . . . . 14,063 7 13,975 7 13,034 6 12,510 5 13,674 6
New England . . . . . . . . . . . . . . . . . . . . . . . . . . . . . .
Total population . . . . . . . . . . . . . . . . . . . . . . . . . . . 10,180 100 10,306 100 10,575 100 11,233 100 11,593 100Sportspersons . . . . . . . . . . . . . . . . . . . . . . . . . . . . . 1,658 16 1,673 16 1,504 14 1,353 12 1,441 12 Anglers . . . . . . . . . . . . . . . . . . . . . . . . . . . . . . . . . 1,545 15 1,520 15 1,402 13 1,246 11 1,355 12 Hunters . . . . . . . . . . . . . . . . . . . . . . . . . . . . . . . . . 444 4 465 5 386 4 374 3 420 4
Middle Atlantic . . . . . . . . . . . . . . . . . . . . . . . . . . . .
Total population . . . . . . . . . . . . . . . . . . . . . . . . . . . 29,216 100 29,371 100 29,806 100 31,518 100 32,392 100Sportspersons . . . . . . . . . . . . . . . . . . . . . . . . . . . . . 4,508 15 4,192 14 3,810 13 3,214 10 3,966 12 Anglers . . . . . . . . . . . . . . . . . . . . . . . . . . . . . . . . . 3,871 13 3,627 12 3,250 11 2,550 8 3,496 11 Hunters . . . . . . . . . . . . . . . . . . . . . . . . . . . . . . . . . 1,746 6 1,453 5 1,633 5 1,520 5 1,558 5
East North Central . . . . . . . . . . . . . . . . . . . . . . . . . .
Total population . . . . . . . . . . . . . . . . . . . . . . . . . . . 32,188 100 33,121 100 34,082 100 35,609 100 36,199 100Sportspersons . . . . . . . . . . . . . . . . . . . . . . . . . . . . . 7,202 22 6,912 21 6,400 19 5,975 17 6,766 19 Anglers . . . . . . . . . . . . . . . . . . . . . . . . . . . . . . . . . 6,264 19 6,006 18 5,655 17 5,190 15 5,861 16 Hunters . . . . . . . . . . . . . . . . . . . . . . . . . . . . . . . . . 2,789 9 2,712 8 2,421 7 2,376 7 2,688 7
West North Central . . . . . . . . . . . . . . . . . . . . . . . . .
Total population . . . . . . . . . . . . . . . . . . . . . . . . . . . 13,504 100 13,875 100 14,430 100 15,458 100 15,860 100Sportspersons . . . . . . . . . . . . . . . . . . . . . . . . . . . . . 4,143 31 3,977 29 4,239 29 3,836 25 3,980 25 Anglers . . . . . . . . . . . . . . . . . . . . . . . . . . . . . . . . . 3,647 27 3,416 25 3,836 27 3,284 21 3,591 23 Hunters . . . . . . . . . . . . . . . . . . . . . . . . . . . . . . . . . 1,709 13 1,917 14 1,710 12 1,779 12 1,661 10
South Atlantic . . . . . . . . . . . . . . . . . . . . . . . . . . . . .
Total population . . . . . . . . . . . . . . . . . . . . . . . . . . . 33,682 100 36,776 100 39,286 100 43,965 100 46,417 100Sportspersons . . . . . . . . . . . . . . . . . . . . . . . . . . . . . 6,996 21 7,282 20 6,957 18 6,633 15 6,749 15 Anglers . . . . . . . . . . . . . . . . . . . . . . . . . . . . . . . . . 6,441 19 6,636 18 6,451 16 6,116 14 6,163 13 Hunters . . . . . . . . . . . . . . . . . . . . . . . . . . . . . . . . . 2,083 6 2,050 6 1,875 5 1,884 4 1,870 4
East South Central . . . . . . . . . . . . . . . . . . . . . . . . . .
Total population . . . . . . . . . . . . . . . . . . . . . . . . . . . 11,667 100 12,459 100 12,976 100 13,722 100 14,206 100Sportspersons . . . . . . . . . . . . . . . . . . . . . . . . . . . . . 2,984 26 2,907 23 2,865 22 2,689 20 3,010 21 Anglers . . . . . . . . . . . . . . . . . . . . . . . . . . . . . . . . . 2,635 23 2,514 20 2,543 20 2,436 18 2,444 17 Hunters . . . . . . . . . . . . . . . . . . . . . . . . . . . . . . . . . 1,279 11 1,301 10 1,164 9 1,101 8 1,531 11
West South Central . . . . . . . . . . . . . . . . . . . . . . . . .
Total population . . . . . . . . . . . . . . . . . . . . . . . . . . . 19,926 100 21,811 100 23,337 100 25,407 100 27,195 100Sportspersons . . . . . . . . . . . . . . . . . . . . . . . . . . . . . 5,125 26 5,093 23 4,924 21 4,499 18 4,855 18 Anglers . . . . . . . . . . . . . . . . . . . . . . . . . . . . . . . . . 4,592 23 4,616 21 4,375 19 3,952 16 4,298 16 Hunters . . . . . . . . . . . . . . . . . . . . . . . . . . . . . . . . . 1,843 9 1,812 8 1,988 9 1,810 7 1,909 7
Mountain . . . . . . . . . . . . . . . . . . . . . . . . . . . . . . . . .
Total population . . . . . . . . . . . . . . . . . . . . . . . . . . . 10,092 100 11,966 100 13,308 100 15,651 100 17,013 100Sportspersons . . . . . . . . . . . . . . . . . . . . . . . . . . . . . 2,488 25 2,761 23 2,757 21 2,372 15 2,976 17 Anglers . . . . . . . . . . . . . . . . . . . . . . . . . . . . . . . . . 2,079 21 2,411 20 2,443 18 2,084 13 2,586 15 Hunters . . . . . . . . . . . . . . . . . . . . . . . . . . . . . . . . . 1,069 11 1,061 9 1,020 8 868 6 1,043 6
Pacific . . . . . . . . . . . . . . . . . . . . . . . . . . . . . . . . . . .
Total population . . . . . . . . . . . . . . . . . . . . . . . . . . . 29,508 100 31,787 100 34,498 100 36,681 100 38,438 100Sportspersons . . . . . . . . . . . . . . . . . . . . . . . . . . . . . 4,875 17 4,897 15 4,349 13 3,345 9 3,654 10 Anglers . . . . . . . . . . . . . . . . . . . . . . . . . . . . . . . . . 4,505 15 4,501 14 4,111 12 3,094 8 3,319 9 Hunters . . . . . . . . . . . . . . . . . . . . . . . . . . . . . . . . . 1,101 4 1,203 4 837 2 798 2 996 3
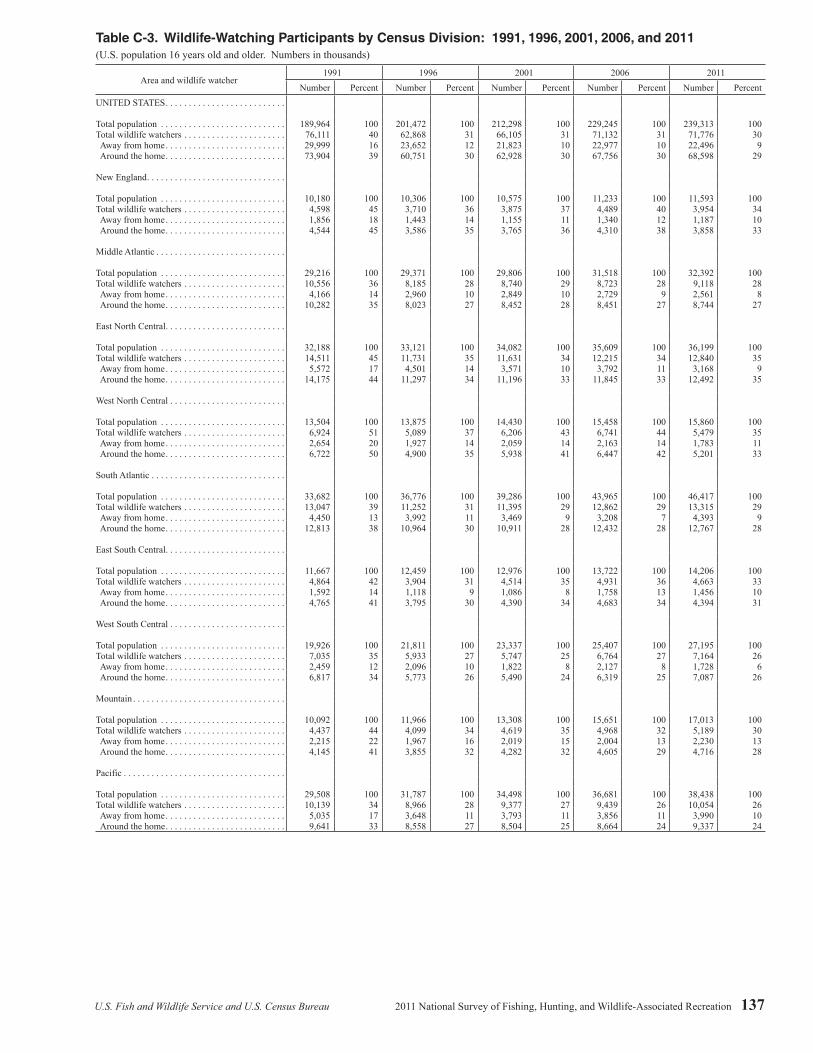
U.S. Fish and Wildlife Service and U.S. Census Bureau 2011 National Survey of Fishing, Hunting, and Wildlife-Associated Recreation 137
Table C-3. Wildlife-Watching Participants by Census Division: 1991, 1996, 2001, 2006, and 2011(U.S. population 16 years old and older. Numbers in thousands)
Area and wildlife watcher1991 1996 2001 2006 2011
Number Percent Number Percent Number Percent Number Percent Number PercentUNITED STATES . . . . . . . . . . . . . . . . . . . . . . . . . .
Total population . . . . . . . . . . . . . . . . . . . . . . . . . . . 189,964 100 201,472 100 212,298 100 229,245 100 239,313 100Total wildlife watchers . . . . . . . . . . . . . . . . . . . . . . 76,111 40 62,868 31 66,105 31 71,132 31 71,776 30 Away from home . . . . . . . . . . . . . . . . . . . . . . . . . . 29,999 16 23,652 12 21,823 10 22,977 10 22,496 9 Around the home . . . . . . . . . . . . . . . . . . . . . . . . . . 73,904 39 60,751 30 62,928 30 67,756 30 68,598 29
New England . . . . . . . . . . . . . . . . . . . . . . . . . . . . . .
Total population . . . . . . . . . . . . . . . . . . . . . . . . . . . 10,180 100 10,306 100 10,575 100 11,233 100 11,593 100Total wildlife watchers . . . . . . . . . . . . . . . . . . . . . . 4,598 45 3,710 36 3,875 37 4,489 40 3,954 34 Away from home . . . . . . . . . . . . . . . . . . . . . . . . . . 1,856 18 1,443 14 1,155 11 1,340 12 1,187 10 Around the home . . . . . . . . . . . . . . . . . . . . . . . . . . 4,544 45 3,586 35 3,765 36 4,310 38 3,858 33
Middle Atlantic . . . . . . . . . . . . . . . . . . . . . . . . . . . .
Total population . . . . . . . . . . . . . . . . . . . . . . . . . . . 29,216 100 29,371 100 29,806 100 31,518 100 32,392 100Total wildlife watchers . . . . . . . . . . . . . . . . . . . . . . 10,556 36 8,185 28 8,740 29 8,723 28 9,118 28 Away from home . . . . . . . . . . . . . . . . . . . . . . . . . . 4,166 14 2,960 10 2,849 10 2,729 9 2,561 8 Around the home . . . . . . . . . . . . . . . . . . . . . . . . . . 10,282 35 8,023 27 8,452 28 8,451 27 8,744 27
East North Central . . . . . . . . . . . . . . . . . . . . . . . . . .
Total population . . . . . . . . . . . . . . . . . . . . . . . . . . . 32,188 100 33,121 100 34,082 100 35,609 100 36,199 100Total wildlife watchers . . . . . . . . . . . . . . . . . . . . . . 14,511 45 11,731 35 11,631 34 12,215 34 12,840 35 Away from home . . . . . . . . . . . . . . . . . . . . . . . . . . 5,572 17 4,501 14 3,571 10 3,792 11 3,168 9 Around the home . . . . . . . . . . . . . . . . . . . . . . . . . . 14,175 44 11,297 34 11,196 33 11,845 33 12,492 35
West North Central . . . . . . . . . . . . . . . . . . . . . . . . .
Total population . . . . . . . . . . . . . . . . . . . . . . . . . . . 13,504 100 13,875 100 14,430 100 15,458 100 15,860 100Total wildlife watchers . . . . . . . . . . . . . . . . . . . . . . 6,924 51 5,089 37 6,206 43 6,741 44 5,479 35 Away from home . . . . . . . . . . . . . . . . . . . . . . . . . . 2,654 20 1,927 14 2,059 14 2,163 14 1,783 11 Around the home . . . . . . . . . . . . . . . . . . . . . . . . . . 6,722 50 4,900 35 5,938 41 6,447 42 5,201 33
South Atlantic . . . . . . . . . . . . . . . . . . . . . . . . . . . . .
Total population . . . . . . . . . . . . . . . . . . . . . . . . . . . 33,682 100 36,776 100 39,286 100 43,965 100 46,417 100Total wildlife watchers . . . . . . . . . . . . . . . . . . . . . . 13,047 39 11,252 31 11,395 29 12,862 29 13,315 29 Away from home . . . . . . . . . . . . . . . . . . . . . . . . . . 4,450 13 3,992 11 3,469 9 3,208 7 4,393 9 Around the home . . . . . . . . . . . . . . . . . . . . . . . . . . 12,813 38 10,964 30 10,911 28 12,432 28 12,767 28
East South Central . . . . . . . . . . . . . . . . . . . . . . . . . .
Total population . . . . . . . . . . . . . . . . . . . . . . . . . . . 11,667 100 12,459 100 12,976 100 13,722 100 14,206 100Total wildlife watchers . . . . . . . . . . . . . . . . . . . . . . 4,864 42 3,904 31 4,514 35 4,931 36 4,663 33 Away from home . . . . . . . . . . . . . . . . . . . . . . . . . . 1,592 14 1,118 9 1,086 8 1,758 13 1,456 10 Around the home . . . . . . . . . . . . . . . . . . . . . . . . . . 4,765 41 3,795 30 4,390 34 4,683 34 4,394 31
West South Central . . . . . . . . . . . . . . . . . . . . . . . . .
Total population . . . . . . . . . . . . . . . . . . . . . . . . . . . 19,926 100 21,811 100 23,337 100 25,407 100 27,195 100Total wildlife watchers . . . . . . . . . . . . . . . . . . . . . . 7,035 35 5,933 27 5,747 25 6,764 27 7,164 26 Away from home . . . . . . . . . . . . . . . . . . . . . . . . . . 2,459 12 2,096 10 1,822 8 2,127 8 1,728 6 Around the home . . . . . . . . . . . . . . . . . . . . . . . . . . 6,817 34 5,773 26 5,490 24 6,319 25 7,087 26
Mountain . . . . . . . . . . . . . . . . . . . . . . . . . . . . . . . . .
Total population . . . . . . . . . . . . . . . . . . . . . . . . . . . 10,092 100 11,966 100 13,308 100 15,651 100 17,013 100Total wildlife watchers . . . . . . . . . . . . . . . . . . . . . . 4,437 44 4,099 34 4,619 35 4,968 32 5,189 30 Away from home . . . . . . . . . . . . . . . . . . . . . . . . . . 2,215 22 1,967 16 2,019 15 2,004 13 2,230 13 Around the home . . . . . . . . . . . . . . . . . . . . . . . . . . 4,145 41 3,855 32 4,282 32 4,605 29 4,716 28
Pacific . . . . . . . . . . . . . . . . . . . . . . . . . . . . . . . . . . .
Total population . . . . . . . . . . . . . . . . . . . . . . . . . . . 29,508 100 31,787 100 34,498 100 36,681 100 38,438 100Total wildlife watchers . . . . . . . . . . . . . . . . . . . . . . 10,139 34 8,966 28 9,377 27 9,439 26 10,054 26 Away from home . . . . . . . . . . . . . . . . . . . . . . . . . . 5,035 17 3,648 11 3,793 11 3,856 11 3,990 10 Around the home . . . . . . . . . . . . . . . . . . . . . . . . . . 9,641 33 8,558 27 8,504 25 8,664 24 9,337 24
138 2011 National Survey of Fishing, Hunting, and Wildlife-Associated Recreation U.S. Fish and Wildlife Service and U.S. Census Bureau
household income in the 2001 Survey.
6. A question was added to the trip-related expenditures section to ascertain how much of the total was spent in the respondent’s state of residence when the respondent participated in hunting, fishing, or wildlife watching out-of-state.
7. Boating questions were added to the fishing section. The respondent was asked about the extent of boat usage for the three types of fishing.
8. The 1996 Survey included ques-tions about the months around-the-home wildlife watchers fed birds. These questions were not repeated in the 2001 Survey.
9. The contingent valuation sections of the three types of wildlife-related recreation were altered, using an open-ended question format instead of 1996’s dichotomous choice format.
Section III. Important instrument changes in the 2006 Survey
1. A series of boating questions was added. The new questions dealt with anglers using motorboats and/or nonmotorboats, length of boat used most often, distance to boat launch used most often, needed improvements to facilities at the launch, whether or not the respon-dent completed a boating safety course, who the boater fished with most often, and the source and type of information the boater used for his or her fishing.
2. Questions regarding catch and release fishing were added. They were whether or not the respondent caught and released fish and, if so, the percent of fish released.
3. The proportion of hunting done with a rifle or shotgun, as contrasted with muzzleloader or archery equipment, was asked.
4. In the contingent valuation section, where the value of wildlife-related recreation was determined, two quality-variable questions were added: the average length of certain fish caught and whether a deer, elk, or moose was killed. Plus the
economic evaluation bid questions were rephrased, from “What is the most your [species] hunting in [State name] could have cost you per trip last year before you would NOT have gone [species] hunting at all in 2001, not even one trip, because it would have been too expensive?”, for the hunters, for example, to “What is the cost that would have prevented you from taking even one such trip in 2006? In other words, if the trip cost was below this amount, you would have gone [species] hunting in [State name], but if the trip cost was above this amount, you would not have gone.”
5. Questions concerning hunting, fishing, or wildlife watching in other countries were taken out of the Survey.
6. Questions about the reasons for not going hunting or fishing, or not going as much as expected, were deleted.
7. Disability of participants questions were taken out.
8. Determination of the types of sites for wildlife watching was discontinued.
9. The birding questions regarding the use of birding life lists and the ability to identify birds based on their sight or sounds were deleted.
10. Public transportation costs were divided into two sections, “public transportation by airplane” and “other public transportation, including trains, buses, and car rentals, etc.”.
Section IV. Important instrument changes in the 2011 Survey
1. The series of boating questions added in 2006 was deleted.
2. Questions about target shooting and the usage of a shooting range in preparation for hunting were added. The types of weapon used at the shooting range were quantified.
3. Questions about plantings expen-ditures for the purpose of hunting were added.
4. “Feral pig” was recategorized from big game to other animals for all states except Hawaii.
5. “Ptarmigan” was included as its own small game category, instead of lumped in “other.”
6. In previous Surveys, “Moose” was included as its own category only for Alaska. For 2011, “Moose” was included as its own big game category, instead of lumped in “other,” for all fifty states.
7. In previous Surveys, “Wolf” was included as its own category only for Alaska. For 2011, “Wolf” was included as its own other animal category, instead of lumped in “other,” for all fifty states.
8. The household income categories were modified. The top categories were changed from “$100,000 or more” to “$100,000 to $149,999” and “$150,000 or more.”
9. The “Steelhead” category was deleted from the saltwater fish species section, with the idea that it would be included in “other.”
10. The 2006 around-the-home wildlife-watching category that quantified visitors of ”public parks or areas” was rewritten to wild-life watching at “parks or natural areas.” This change was to make clear that respondents should include recreating at quasi-govern-mental and private areas.
11. The 2006 wildlife watching equip-ment category “Film and devel-oping” was rewritten to “Film and photo processing.”
1955 to 1985 Significant Methodological Differences
1955 to 1970 Surveys
The 1955 to 1970 Surveys included only substantial participants. Substan-tial participants were defined as people who participated at least three days and/or spent at least $5 (the 1955–1965 Surveys) or $7.50 (the 1970 Survey) during the surveyed year. Under most circumstances, the Surveys may be compared for totals, but the effects of differences should be considered when comparing the details of the Surveys.

U.S. Fish and Wildlife Service and U.S. Census Bureau 2011 National Survey of Fishing, Hunting, and Wildlife-Associated Recreation 139
The 1960, 1965, and 1970 Surveys differed from the 1955 National Survey in classification of expenditures as outlined below:
1. Alaska and Hawaii were not included in the 1955 Survey.
2. Expenditure categories were more detailed in 1970 than in earlier Surveys.
3. The 1960 to 1970 classification of some expenditures differs from the 1955 Survey in the following respects:
a. “Boats and boat motors” shown under “auxiliary equipment” were included in “equipment, other” in 1955.
b. “Entrance and other privilege fees” asked separately were included in “trip expenditures, other” in 1955.
c. “Snacks and refreshments” not included with “food” expendi-tures in the 1960 to 1970 reports were under “trip expenditures, other” in 1955.
d. Starting in 1960, expenditures on equipment, magazines, club dues, licenses, and similar items were classified by the one sport activity for which expenditures were chiefly made. In 1955, these expenditures were evenly divided among all the activities in which the sportsperson took part.
e. Compared with 1955, the 1960 to 1970 Surveys reported fewer expenditures within the “other” category because selected items were transferred to more appro-priate categories.
f. Expenditures on alcoholic beverages were reported sepa-rately in the 1970 Survey.
4. The number of waterfowl hunters in the 1970 Survey is not compa-rable with those reported in the 1960 and 1965 Surveys. In 1960 and 1965, respondent sportspersons were not included in the waterfowl hunter total if they reported that they went waterfowl hunting but
did not take the trip chiefly to hunt waterfowl. In 1970, all respondents who reported that they had hunted waterfowl during 1970, regardless of trip purpose, were included in the total. The number of hunters who did not take trips chiefly to hunt waterfowl in 1970 was 1,054,000.
1975 Survey
In contrast to previous Surveys which covered substantial participants 12 years old and older, the 1975 Survey based all the estimates on responses from individuals 9 years of age and older and did not select respondents based upon substantial participation as defined above. As a result, individuals who participated fewer than three days or spent less than $7.50 on hunting or fishing were included in the estimates of participants, days of activity, and expenditures.
Categories of hunting and fishing expenditures differed from the previous four Surveys in that only major categories were reported. For example, hunting equipment expenditures were not further delineated by subcategory. Similarly, no detail was provided within the category of fishing equip-ment expenditures. Expenses for items such as daily entrance fees, magazines, club dues, and dogs were categorized as “other” in the 1975 report.
In addition to the above differences, the 1975 Survey gathered data on species sought for the favorite hunting and fishing activity. This data replaced the “chiefly” category where hunting or fishing was the primary purpose of the trip or day of activity. Data omitted in the 1975 Survey that were included in previous Surveys include the respon-dents’ population density of residence, occupation, and level of education.
1980 to 1985 Surveys
The 1980 and 1985 Surveys were similar. Each measured participants, rather than substantial participants. Questions were incorporated into the 1980 and 1985 Survey question-naires to facilitate the construction of categories of data for comparisons with earlier Surveys. The use of “chiefly” to delimit primary purpose appeared in the 1970 and prior Surveys, and its use was continued in the 1980 and 1985
Surveys. The expenditure categories in 1980 and 1985 are similar to the 1970 categories with the addition of fish finders, motor homes, and camper trucks as separate categories. The definition of fishing included the use of nets or seines and spearfishing. An extensive wildlife watching section was added in 1980, necessitating a separate detailed phase subsample.
As in the 1970 and 1975 Surveys, the 1980 and 1985 Surveys used a two-phase process to gather information from households and individuals. In the first phase, household respondents were asked to identify each participant six years of age and older who resided in their household. In comparison, the 1975 and 1970 Surveys screened households for participants who were nine years of age and older. In the second phase, the detailed interview phase, interviews were conducted in person for the 1985, 1980, and 1970 Surveys and were conducted by mail for the 1975 Survey. Participants were included in the detailed phase of the Survey if they were at least 12 years old in 1970, 9 years old in 1975, and 16 years old in 1980 and 1985. As a result, the population of hunters and anglers was more narrowly defined in 1980 and 1985. However, estimates of sportsper-sons 6 years old and older, 9 years old and older, and 12 years old and older, derived from the screening phase, are available for comparison with past Surveys.
Regional Trends
Section I. Most recent trends
This trends section covers the period from 1991 to 2011. The 1991, 1996, 2001, 2006, and 2011 Surveys used similar methodologies, making all published information for the five Surveys directly comparable.
Section II. Historical trends
This trends section covers the period from 1955 to 1985. The methodology of these Surveys differed (see above), but approximate correction factors were estimated.

140 2011 National Survey of Fishing, Hunting, and Wildlife-Associated Recreation U.S. Fish and Wildlife Service and U.S. Census Bureau
Table C-4. Comparison of Major Findings of the National Surveys: 1955 to 1985(U.S. population 12 years old and older. Numbers in thousands)
Sportspersons 1955 1960 1965 1970 1975 1980 1985Total sportspersons . . . . . . . . . . . . . . . . . . . . . . . . . 24,917 30,435 32,881 36,277 45,773 46,966 49,827 Anglers . . . . . . . . . . . . . . . . . . . . . . . . . . . . . . . . . 20,813 25,323 28,348 33,158 41,299 41,873 45,345 Freshwater . . . . . . . . . . . . . . . . . . . . . . . . . . . . . . 18,420 21,677 23,962 29,363 36,599 35,782 39,122 Saltwater . . . . . . . . . . . . . . . . . . . . . . . . . . . . . . . 4,557 6,292 8,305 9,460 13,738 11,972 12,893
Hunters . . . . . . . . . . . . . . . . . . . . . . . . . . . . . . . . . 11,784 14,637 13,583 14,336 17,094 16,758 16,340 Small game . . . . . . . . . . . . . . . . . . . . . . . . . . . . . 9,822 12,105 10,576 11,671 14,182 12,496 11,130 Big game . . . . . . . . . . . . . . . . . . . . . . . . . . . . . . . 4,414 6,277 6,566 7,774 11,037 11,047 12,576 Waterfowl . . . . . . . . . . . . . . . . . . . . . . . . . . . . . . 1,986 1,955 1,650 2,894 4,284 3,177 3,201
Expenditures1 . . . . . . . . . . . . . . . . . . . . . . . . . . . . . 11,401,464 13,948,974 14,991,502 19,618,548 33,398,677 34,517,421 42,058,860 Anglers . . . . . . . . . . . . . . . . . . . . . . . . . . . . . . . . . 7,655,522 9,743,971 9,952,411 13,699,311 23,498,506 23,387,469 28,585,686 Freshwater . . . . . . . . . . . . . . . . . . . . . . . . . . . . . . 5,700,187 7,476,454 7,231,851 10,315,966 17,333,212 16,663,239 18,942,060 Saltwater . . . . . . . . . . . . . . . . . . . . . . . . . . . . . . . 1,955,336 2,267,512 2,720,574 3,383,345 6,165,294 5,581,976 7,191,387
Hunters . . . . . . . . . . . . . . . . . . . . . . . . . . . . . . . . . 3,745,942 4,204,997 3,814,303 5,919,236 9,900,171 10,812,058 10,256,668 Small game . . . . . . . . . . . . . . . . . . . . . . . . . . . . . 1,975,707 2,629,360 2,093,137 2,612,390 4,525,942 3,335,852 2,342,860 Big game . . . . . . . . . . . . . . . . . . . . . . . . . . . . . . . 1,295,357 1,251,800 1,424,711 2,631,532 4,238,341 5,638,395 5,345,606 Waterfowl . . . . . . . . . . . . . . . . . . . . . . . . . . . . . . 474,878 323,840 296,452 675,315 1,135,889 766,033 783,315
Days . . . . . . . . . . . . . . . . . . . . . . . . . . . . . . . . . . . . 566,870 658,308 708,578 909,876 1,459,551 1,300,983 1,415,379 Fishing. . . . . . . . . . . . . . . . . . . . . . . . . . . . . . . . . . 397,447 465,769 522,759 706,187 1,058,075 952,420 1,064,986 Freshwater . . . . . . . . . . . . . . . . . . . . . . . . . . . . . . 338,826 385,167 426,922 592,494 890,576 788,392 895,027 Saltwater . . . . . . . . . . . . . . . . . . . . . . . . . . . . . . . 58,621 80,602 95,837 113,694 167,499 164,040 171,055
Hunting . . . . . . . . . . . . . . . . . . . . . . . . . . . . . . . . . 169,423 192,539 185,819 203,689 401,476 348,543 350,393 Small game . . . . . . . . . . . . . . . . . . . . . . . . . . . . . 118,630 138,192 128,448 124,041 269,653 225,793 214,544 Big game . . . . . . . . . . . . . . . . . . . . . . . . . . . . . . . 30,834 39,190 43,845 54,536 100,600 117,406 135,447 Waterfowl . . . . . . . . . . . . . . . . . . . . . . . . . . . . . . 19,959 15,158 13,526 25,113 31,223 26,179 25,933 1 In 1985 dollars.
Note: Methodological differences described in the text make the estimates in this table not comparable with the estimates in Tables C-2 and C-3.

U.S. Fish and Wildlife Service and U.S. Census Bureau 2011 National Survey of Fishing, Hunting, and Wildlife-Associated Recreation 141
Table C-5. Anglers and Hunters by Census Division: 1955 to 1985(U.S. population 12 years old and older. Numbers in thousands)
Year Population Sportsperson, fished or
hunted Anglers Hunters
Number Percent Number Percent Number Percent Number Percent UNITED STATES . . . . . . . . . . . . . . . . . . . . . . . . . .1955. . . . . . . . . . . . . . . . . . . . . . . . . . . . . . . . . . . . . 118,366 100 24,917 21.1 20,813 17.6 11,784 10.0 1960. . . . . . . . . . . . . . . . . . . . . . . . . . . . . . . . . . . . . 131,226 100 30,435 23.2 25,323 19.3 14,637 11.2 1965. . . . . . . . . . . . . . . . . . . . . . . . . . . . . . . . . . . . . 141,928 100 32,881 23.2 28,348 20.0 13,585 9.6 1970. . . . . . . . . . . . . . . . . . . . . . . . . . . . . . . . . . . . . 155,230 100 36,277 23.4 33,158 21.4 14,336 9.2 1975. . . . . . . . . . . . . . . . . . . . . . . . . . . . . . . . . . . . . 171,860 100 45,773 26.6 41,299 24.0 17,094 9.9 1980. . . . . . . . . . . . . . . . . . . . . . . . . . . . . . . . . . . . . 184,691 100 46,966 25.4 41,873 22.7 16,758 9.1 1985. . . . . . . . . . . . . . . . . . . . . . . . . . . . . . . . . . . . . 195,659 100 49,827 25.5 45,345 23.2 16,340 8.4
New England . . . . . . . . . . . . . . . . . . . . . . . . . . . . . .1955. . . . . . . . . . . . . . . . . . . . . . . . . . . . . . . . . . . . . 7,919 100 1,224 15.4 1,002 12.7 589 7.4 1960. . . . . . . . . . . . . . . . . . . . . . . . . . . . . . . . . . . . . 8,349 100 1,368 16.4 1,205 14.4 517 6.2 1965. . . . . . . . . . . . . . . . . . . . . . . . . . . . . . . . . . . . . 9,256 100 1,650 17.8 1,488 16.0 583 6.3 1970. . . . . . . . . . . . . . . . . . . . . . . . . . . . . . . . . . . . . 8,652 100 1,579 18.3 1,430 16.5 582 6.7 1975. . . . . . . . . . . . . . . . . . . . . . . . . . . . . . . . . . . . . 9,910 100 2,004 20.2 1,861 18.8 566 5.7 1980. . . . . . . . . . . . . . . . . . . . . . . . . . . . . . . . . . . . . 10,205 100 1,974 19.3 1,788 17.5 572 5.6 1985. . . . . . . . . . . . . . . . . . . . . . . . . . . . . . . . . . . . . 10,554 100 2,058 19.5 1,914 18.1 552 5.2
Middle Atlantic . . . . . . . . . . . . . . . . . . . . . . . . . . . .1955. . . . . . . . . . . . . . . . . . . . . . . . . . . . . . . . . . . . . 24,869 100 3,539 14.2 2,811 11.3 1,608 6.5 1960. . . . . . . . . . . . . . . . . . . . . . . . . . . . . . . . . . . . . 26,493 100 3,432 13.0 2,569 9.7 1,723 6.5 1965. . . . . . . . . . . . . . . . . . . . . . . . . . . . . . . . . . . . . 27,346 100 3,602 13.2 2,760 10.1 1,631 6.0 1970. . . . . . . . . . . . . . . . . . . . . . . . . . . . . . . . . . . . . 28,244 100 4,539 16.1 4,504 14.4 1,731 6.1 1975. . . . . . . . . . . . . . . . . . . . . . . . . . . . . . . . . . . . . 30,449 100 5,919 19.4 5,097 16.7 2,096 6.9 1980. . . . . . . . . . . . . . . . . . . . . . . . . . . . . . . . . . . . . 30,256 100 5,181 17.1 4,332 14.3 2,001 6.6 1985. . . . . . . . . . . . . . . . . . . . . . . . . . . . . . . . . . . . . 31,099 100 5,565 17.9 4,820 15.5 1,972 6.3
East North Central . . . . . . . . . . . . . . . . . . . . . . . . . .1955. . . . . . . . . . . . . . . . . . . . . . . . . . . . . . . . . . . . . 25,733 100 5,489 21.3 4,583 17.8 2,538 9.9 1960. . . . . . . . . . . . . . . . . . . . . . . . . . . . . . . . . . . . . 26,833 100 6,316 32.5 5,317 19.8 2,985 11.1 1965. . . . . . . . . . . . . . . . . . . . . . . . . . . . . . . . . . . . . 28,124 100 6,214 22.1 5,336 19.0 2,563 9.1 1970. . . . . . . . . . . . . . . . . . . . . . . . . . . . . . . . . . . . . 31,550 100 7,284 23.1 6,699 21.2 2,812 8.9 1975. . . . . . . . . . . . . . . . . . . . . . . . . . . . . . . . . . . . . 32,796 100 9,049 27.6 8,181 24.9 3,392 10.3 1980. . . . . . . . . . . . . . . . . . . . . . . . . . . . . . . . . . . . . 33,526 100 8,725 26.0 7,891 23.5 2,955 8.8 1985. . . . . . . . . . . . . . . . . . . . . . . . . . . . . . . . . . . . . 33,747 100 8,973 26.6 8,270 24.5 2,814 8.3
West North Central . . . . . . . . . . . . . . . . . . . . . . . . .1955. . . . . . . . . . . . . . . . . . . . . . . . . . . . . . . . . . . . . 9,201 100 2,913 31.7 2,346 25.5 1,534 16.7 1960. . . . . . . . . . . . . . . . . . . . . . . . . . . . . . . . . . . . . 10,149 100 3,383 33.3 2,855 28.1 1,709 16.8 1965. . . . . . . . . . . . . . . . . . . . . . . . . . . . . . . . . . . . . 11,681 100 3,678 31.5 3,226 27.6 1,620 13.9 1970. . . . . . . . . . . . . . . . . . . . . . . . . . . . . . . . . . . . . 12,904 100 4,000 31.0 3,579 27.7 1,783 13.8 1975. . . . . . . . . . . . . . . . . . . . . . . . . . . . . . . . . . . . . 13,564 100 4,524 33.3 4,089 30.1 1,863 13.7 1980. . . . . . . . . . . . . . . . . . . . . . . . . . . . . . . . . . . . . 13,826 100 4,770 34.5 4,220 30.5 1,965 14.2 1985. . . . . . . . . . . . . . . . . . . . . . . . . . . . . . . . . . . . . 14,137 100 5,140 36.4 4,681 33.1 1,971 13.9
South Atlantic . . . . . . . . . . . . . . . . . . . . . . . . . . . . .1955. . . . . . . . . . . . . . . . . . . . . . . . . . . . . . . . . . . . . 14,336 100 3,223 22.5 2,805 19.6 1,449 10.1 1960. . . . . . . . . . . . . . . . . . . . . . . . . . . . . . . . . . . . . 17,798 100 4,423 24.9 3,695 20.8 2,045 11.5 1965. . . . . . . . . . . . . . . . . . . . . . . . . . . . . . . . . . . . . 20,593 100 5,626 27.3 5,054 24.5 1,900 9.2 1970. . . . . . . . . . . . . . . . . . . . . . . . . . . . . . . . . . . . . 23,539 100 5,461 23.2 5,129 21.8 1,904 8.1 1975. . . . . . . . . . . . . . . . . . . . . . . . . . . . . . . . . . . . . 27,127 100 7,110 26.2 6,479 23.9 2,494 9.2 1980. . . . . . . . . . . . . . . . . . . . . . . . . . . . . . . . . . . . . 30,512 100 7,769 25.5 7,086 23.2 2,444 8.0 1985. . . . . . . . . . . . . . . . . . . . . . . . . . . . . . . . . . . . . 33,636 100 8,721 25.9 8,056 24.0 2,467 7.3
East South Central . . . . . . . . . . . . . . . . . . . . . . . . . .1955. . . . . . . . . . . . . . . . . . . . . . . . . . . . . . . . . . . . . 7,959 100 1,963 24.7 1,665 20.9 989 12.4 1960. . . . . . . . . . . . . . . . . . . . . . . . . . . . . . . . . . . . . 9,277 100 2,778 29.9 2,207 23.8 1,510 16.3 1965. . . . . . . . . . . . . . . . . . . . . . . . . . . . . . . . . . . . . 9,652 100 2,587 26.8 2,201 22.8 1,294 13.4 1970. . . . . . . . . . . . . . . . . . . . . . . . . . . . . . . . . . . . . 9,862 100 2,660 27.0 2,464 25.0 1,162 11.8 1975. . . . . . . . . . . . . . . . . . . . . . . . . . . . . . . . . . . . . 10,798 100 3,007 27.8 2,689 24.9 1,355 12.5 1980. . . . . . . . . . . . . . . . . . . . . . . . . . . . . . . . . . . . . 11,771 100 3,614 30.7 3,173 27.0 1,567 13.3 1985. . . . . . . . . . . . . . . . . . . . . . . . . . . . . . . . . . . . . 12,364 100 3,671 29.7 3,308 26.8 1,441 11.7 See footnote at end of table.

142 2011 National Survey of Fishing, Hunting, and Wildlife-Associated Recreation U.S. Fish and Wildlife Service and U.S. Census Bureau
Table C-5. Anglers and Hunters by Census Division: 1955 to 1985—Continued(U.S. population 12 years old and older. Numbers in thousands)
YearPopulation Sportsperson, fished or hunted Anglers Hunters
Number Percent Number Percent Number Percent Number PercentWest South Central1955. . . . . . . . . . . . . . . . . . . . . . . . . . . . . . . . . . . . . 10,250 100 2,560 25.0 2,237 21.8 1,165 11.41960. . . . . . . . . . . . . . . . . . . . . . . . . . . . . . . . . . . . . 11,837 100 3,666 31.0 3,133 26.5 1,750 14.81965. . . . . . . . . . . . . . . . . . . . . . . . . . . . . . . . . . . . . 12,724 100 3,713 29.2 3,278 25.8 1,571 12.31970. . . . . . . . . . . . . . . . . . . . . . . . . . . . . . . . . . . . . 14,624 100 4,380 30.0 4,006 27.4 1,918 13.11975. . . . . . . . . . . . . . . . . . . . . . . . . . . . . . . . . . . . . 16,628 100 5,781 34.8 5,267 31.7 2,563 15.41980. . . . . . . . . . . . . . . . . . . . . . . . . . . . . . . . . . . . . 19,136 100 5,862 30.6 5,136 26.8 2,456 12.81985. . . . . . . . . . . . . . . . . . . . . . . . . . . . . . . . . . . . . 21,184 100 6,418 30.3 5,704 26.9 2,572 12.1
Mountain1955. . . . . . . . . . . . . . . . . . . . . . . . . . . . . . . . . . . . . 4,529 100 1,369 30.2 1,112 24.6 796 17.61960. . . . . . . . . . . . . . . . . . . . . . . . . . . . . . . . . . . . . 5,222 100 1,646 31.5 1,372 26.3 1,120 21.41965. . . . . . . . . . . . . . . . . . . . . . . . . . . . . . . . . . . . . 5,029 100 1,565 31.1 1,261 25.1 988 19.61970. . . . . . . . . . . . . . . . . . . . . . . . . . . . . . . . . . . . . 5,656 100 2,044 36.1 1,769 31.3 980 17.31975. . . . . . . . . . . . . . . . . . . . . . . . . . . . . . . . . . . . . 7,576 100 2,570 33.9 2,252 29.7 1,159 15.31980. . . . . . . . . . . . . . . . . . . . . . . . . . . . . . . . . . . . . 9,160 100 2,903 31.7 2,500 27.3 1,268 13.81985. . . . . . . . . . . . . . . . . . . . . . . . . . . . . . . . . . . . . 10,215 100 3,128 30.6 2,765 27.1 1,241 12.1
Pacific1955. . . . . . . . . . . . . . . . . . . . . . . . . . . . . . . . . . . . . 13,570 100 2,637 19.4 2,252 16.6 1,116 8.21960. . . . . . . . . . . . . . . . . . . . . . . . . . . . . . . . . . . . . 15,268 100 3,422 22.4 2,971 19.5 1,279 8.41965. . . . . . . . . . . . . . . . . . . . . . . . . . . . . . . . . . . . . 17,523 100 4,246 24.2 3,744 21.4 1,433 8.21970. . . . . . . . . . . . . . . . . . . . . . . . . . . . . . . . . . . . . 20,199 100 4,332 21.4 4,030 20.0 1,466 7.31975. . . . . . . . . . . . . . . . . . . . . . . . . . . . . . . . . . . . . 23,012 100 5,811 25.2 5,386 23.4 1,607 7.01980. . . . . . . . . . . . . . . . . . . . . . . . . . . . . . . . . . . . . 26,299 100 6,168 23.5 5,747 21.9 1,531 5.01985. . . . . . . . . . . . . . . . . . . . . . . . . . . . . . . . . . . . . 38,725 100 6,154 21.4 5,829 20.3 1,310 4.6Note: Methodological differences described in the text make the estimates in this table not comparable with the estimates in Tables C-2 and C-3.

U.S. Fish and Wildlife Service and U.S. Census Bureau 2011 National Survey of Fishing, Hunting, and Wildlife-Associated Recreation 143
Appendix D
144 2011 National Survey of Fishing, Hunting, and Wildlife-Associated Recreation U.S. Fish and Wildlife Service and U.S. Census Bureau
Appendix D.Sample Design and Statistical Accuracy
This appendix is presented in two parts. The first part is the U.S. Census Bureau Source and Accuracy Statement. This statement describes the sampling design for the 2011 Survey and highlights the steps taken to produce estimates from the completed question-naires. The statement explains the use of standard errors and confidence inter-vals. It also provides comprehensive information about errors characteristic of surveys and formulas and parameters to calculate an approximate standard error or confidence interval for each number published in this report. The second part, Tables D-1 through D-11, reports approximate standard errors and 95-percent confidence intervals for selected measures of participation and expenditures for wildlife-related recreation.
Source and Accuracy Statement for the 2011 National Survey of Fishing, Hunting, and Wildlife-Associated Recreation
SOURCE OF DATA
The estimates in this report are based on data collected in the 2011 National Survey of Fishing, Hunting, and Wild-life-Associated Recreation (FHWAR) conducted by the Census Bureau and sponsored by the U.S. Fish and Wildlife Service.
The eligible universe for the FHWAR is the civilian noninstitutionalized and nonbarrack military population living in the United States. The institutional-ized population, which is excluded from the population universe, is composed primarily of the population in correctional institutions and nursing homes (98 percent of the 4 million institutionalized people in Census 2010).
The 2011 FHWAR was designed to provide state-level estimates of the
number of participants in recreational hunting and fishing and in wildlife watching activities (e.g., wildlife obser-vation). Information was collected on the number of participants, where and how often they participated, the type of wildlife encountered, and the amounts of money spent on wildlife-related recreation.
The FHWAR was conducted in two stages: an initial screening of house-holds to identify likely sportspersons and wildlife-watching participants and a series of follow-up interviews of selected persons to collect detailed data about their wildlife-related recreation during 2011.
SAMPLE DESIGN
The 2011 FHWAR sample was selected from the Census Bureau’s master address file (MAF).
The FHWAR is a multistage prob-ability sample, with coverage in all 50 states and the District of Columbia. In the first stage of the sampling process, primary sampling units (PSUs) are selected for sample. The PSUs are defined to correspond to the Office of Management and Budget definitions of Core Based Statistical Area defini-tions and to improve efficiency in field operations. The United States is divided into 2,025 PSUs. These PSUs are grouped into 824 strata. Within each stratum, a single PSU is chosen for the sample, with its probability of selection proportional to its population as of the 2000 decennial census. This PSU represents the entire stratum from which it was selected. In the case of strata consisting of only one PSU, the PSU is chosen with certainty.
Within the selected PSUs, the FHWAR sample was selected from the MAF.
FHWAR Screening Sample
The total screening sample in the United States consisted of 48,600 households. Interviewing for the screen was conducted during April, May, and June 2011. Due to a high noncon-tact rate, an additional personal visit screening interview, for a subsample of noncontact cases, occurred again in February, March, April, or May 2012. Of all housing units in sample, about 42,800 were determined to be eligible for interview. Interviewers obtained interviews at 30,400 of these units for a national response rate of 71 percent.1 The national weighted response rate was 77 percent. The interviewers asked screening questions for all household members 6 years old and older. Nonin-terviews occur when the occupants are not found at home after repeated calls or are unavailable for some other reason.
Data for the FHWAR sportspersons sample and wildlife-watchers sample were collected in three waves.2 The first wave started in April 2011, the second in September 2011, and the third in January 2012. In the sportsper-sons sample, all persons who hunted or fished in 2011 by the time of the screening interview were interviewed in the first wave. The remaining sportsper-sons in sample were interviewed in the second wave. The reference period was the preceding 4 months for waves 1 and 2. In wave 3, the reference period was either 4, 8, or 12 months depending on when the sample person was first interviewed.
1 Response rates are calculated by using APPOR’s RR2 formula.2 The sample cases selected due to high noncontact rates were only interviewed once. They received a screener and, if they had some form of participation, a detailed questionnaire. These participants did not get three waves of interviewing. The reference period for these sampled cases was between 13 and 16 months.

U.S. Fish and Wildlife Service and U.S. Census Bureau 2011 National Survey of Fishing, Hunting, and Wildlife-Associated Recreation 145
Detailed Samples
Two independent detailed samples were chosen from the FHWAR screening sample. One consisted of sportsper-sons (people who hunt or fish) and the other of wildlife watchers (people who observe, photograph, or feed wildlife).
A. Sportspersons
The Census Bureau selected the detailed samples based on informa-tion reported during the screening phase. Based on information collected from the household respondent, every person 16 years old and older in the FHWAR screening sample was assigned to a sportspersons stratum. The criteria for the strata included time devoted to hunting or fishing in previous years, participation in hunting or fishing in 2011 by the time of the screening interview, and intentions to participate in hunting and fishing activities during the remainder of 2011.3 The four sportspersons categories were:
1. Active—a person who had already participated in hunting or fishing in 2011 at the time of the screener interview.
2. Likely—a person who had not participated in 2011 at the time of the screener, but had partici-pated in 2010 OR was likely to participate in 2011.
3. Inactive—a person who had not participated in 2010 or 2011 AND was somewhat unlikely to participate in 2011.
4. Nonparticipant—a person who had not participated in 2010 or 2011 AND was very unlikely to participate in 2011.
Due to the high noncontact rates in wave 1, all persons in the active, likely, and inactive groups were selected with certainty.
Active sportspersons were given the detailed interview twice—at the time of the screening interview (in April, May, or June 2011) and
3The sample cases selected due to high noncontact rates were not assigned a sportsperson stratum.
again in January or February 2012.4 Likely sportspersons and inactive sportspersons were also inter-viewed twice—first in September or October 2011, then in January or February 2012. Persons in the nonparticipant group were not eligible for a detailed interview. About 16,400 persons were desig-nated for interviews in the United States. The detailed sportspersons sample sizes varied by state to get reliable state-level estimates. During each interview period, about 31 percent of the designated persons were not found at home or were unavailable for some other reason. Overall, about 11,300 detailed sportspersons interviews were completed at a response rate of 69 percent.
B. Wildlife Watchers
The wildlife-watching detailed sample was also selected based on information reported during the screening phase. Based on informa-tion collected from the household respondent, every person 16 years old and older was assigned to a stratum. The criteria for the strata included time devoted to wildlife-watching activities in previous years, participation in wildlife-watching activities in 2011 by the time of the screening interview, and intentions to participate in wildlife-watching activities during the remainder of 2011. The five wildlife-watching categories were:
1. Active—a person who had already participated in 2011 at the time of the screening interview.
2. Avid—a person who had not yet participated in 2011, but in 2010 had taken trips to participate in wildlife-watching activities for 21 or more days or had spent $300 or more.
3. Average—a person who had not yet participated in 2011, but in 2010 had taken trips to wildlife watch for less than 21 days and had spent less than $300 OR had not participated in wildlife-watching activities but was very
4 The sample cases selected due to high noncontact rates were given the detailed sportsperson interview once.
likely to in the remainder of 2011.
4. Infrequent—a person who had not participated in 2010 or 2011, but was somewhat likely or somewhat unlikely to partici-pate in the remainder of 2011.
5. Nonparticipant—a person who had not participated in 2010 or 2011 AND was very unlikely to participate during the remainder of 2011.
Persons were selected for the detailed sample based on these groupings, but persons in the nonparticipant group were not eligible for a detailed interview.
A subsample of each of the other groups was selected to receive a detailed interview with the chance of selection diminishing as the likelihood of participation diminished. Wildlife-watching participants were given the detailed interview twice.5 Some received their first detailed interview at the same time as the screening interview (in April, May, or June 2011). The rest received their first detailed interview in September or October 2011. All wildlife-watching participants received their second interview in January or February 2012. Some respon-dents were given the screener and detailed interview in February, March, April, or May 2012. About 13,900 persons were designated for interviews in the United States. The detailed wildlife-watching sample sizes varied by state to get reliable state-level estimates. During each interview period, about 33 percent of the designated persons were not found at home or were unavailable for some other reason. Overall, about 9,300 detailed wildlife watcher interviews were completed at a response rate of 67 percent.
ESTIMATION PROCEDURE
Several stages of adjustments were used to derive the final 2011 FHWAR person weights. A brief description of the major components of the weights is given below. All statistics for the popu-5The sample cases selected due to high noncontact rates were given the detailed wildlife-watching interview once.

146 2011 National Survey of Fishing, Hunting, and Wildlife-Associated Recreation U.S. Fish and Wildlife Service and U.S. Census Bureau
lation 6 to 15 years of age were derived from the screening interview. Statistics for the population 16 years old and older come from both the screening and detailed interviews. Estimates that come from the screening sample are presented in Appendix B.
A. Screening Sample
Every interviewed person in the screening sample received a screening weight that was the product of the following factors:
1. Base Weight. The base weight is the inverse of the household’s probability of selection.
2. Household Noninterview Adjustment. The noninterview adjustment inflates the weight assigned to interviewed house-holds to account for house-holds eligible for interview but for which no interview was obtained.
3. First-Stage Adjustment. The 824 areas designated for our samples were selected from 2,025 such areas of the United States. Some sample areas represent only themselves and are referred to as self-repre-senting. The remaining areas represent other areas similar in selected characteristics and are thus designated non-self-representing. The first-stage factor reduces the component of variation arising from sampling the non-self-representing areas.
4. Second-Stage Adjustment. This adjustment brings the estimates of the total population into agreement with census-based estimates of the civilian nonin-stitutionalized and nonbarrack military populations for each state.
B. Sportspersons Sample
Every interviewed person in the sportspersons detailed sample received a weight that was the product of the following factors:
1. Screening Weight. This is the person’s final weight from the screening sample.
2. Sportspersons Stratum Adjust-ment. This factor inflates the weights of persons selected for the detailed sample to account for the subsampling done within each sportsperson stratum.
3. Sportspersons Noninterview Adjustment. This factor adjusts the weights of the interviewed sportspersons to account for sportspersons selected for the detailed sample for whom no interview was obtained. A person was considered a nonin-terview if he or she was not interviewed in the third wave of interviewing.
4. Sportspersons Ratio Adjustment Factor. This is a ratio adjust-ment of the detailed sample to the screening sample within the sportspersons sampling strata. This adjustment brings the population estimates of persons aged 16 years old and older from the detailed sample into agreement with the same estimates from the screening sample, which was a much larger sample.
C. Wildlife-Watchers Sample
Every interviewed person in the wildlife-watchers detailed sample received a weight that was the product of the following factors:
1. Screening Weight. This is the person’s final weight from the screening sample.
2. Wildlife-Watchers Stratum Adjustment. This factor inflates the weights of persons selected for the detailed sample to account for the subsampling done within each wildlife watcher stratum.
3. Wildlife-Watchers Noninterview Adjustment. This factor adjusts the weights of the interviewed wildlife-watching participants to account for wildlife watchers
selected for the detailed sample for whom no interview was obtained. A person was consid-ered a noninterview if he or she was not interviewed in the third wave of interviewing.
4. Wildlife-Watchers Ratio Adjust-ment Factor. This is a ratio adjustment of the detailed sample to the screening sample within the wildlife-watchers sampling strata. This adjustment brings the population estimates of persons aged 16 years old and older from the detailed sample into agreement with the same estimates from the screening sample, which was a much larger sample.
ACCURACY OF THE ESTIMATES
A sample survey estimate has two types of error: sampling and nonsampling. The accuracy of an estimate depends on both types of error. The nature of the sampling error is known given the survey design; the full extent of the nonsampling error is unknown.
NONSAMPLING ERROR
For a given estimator, the difference between the estimate that would result if the sample were to include the entire population and the true population value being estimated is known as nonsampling error. There are several sources of nonsampling error that may occur during the development or execution of the survey. It can occur because of circumstances created by the interviewer, the respondent, the survey instrument, or the way the data are collected and processed. For example, errors could occur because:
• The interviewer records the wrong answer, the respondent provides incorrect information, the respon-dent estimates the requested information, or an unclear survey question is misunderstood by the respondent (measurement error).
• Some individuals who should have been included in the survey frame were missed (coverage error).

U.S. Fish and Wildlife Service and U.S. Census Bureau 2011 National Survey of Fishing, Hunting, and Wildlife-Associated Recreation 147
• Responses are not collected from all those in the sample or the respondent is unwilling to provide information (nonresponse error).
• Values are estimated imprecisely for missing data (imputation error).
• Forms may be lost; data may be incorrectly keyed, coded, or recoded, etc. (processing error).
The Census Bureau employs quality control procedures throughout the production process, including the overall design of surveys, the wording of questions, and the review of the work of interviewers and coders to minimize these errors. Two types of nonsampling error that can be exam-ined to a limited extent are nonresponse and undercoverage.
Nonresponse. The effect of nonre-sponse cannot be measured directly, but one indication of its potential effect is the nonresponse rate. For the FHWAR screener interview in the United States, the household-level nonresponse rate was 29 percent. The person-level nonresponse rate for the detailed sportsperson interview in the United States was an additional 31 percent and for the wildlife watchers it was 33 percent. Since the screener nonre-sponse rate is a household-level rate and the detailed interview nonresponse rate is a person-level rate, we cannot combine these rates to derive an overall nonresponse rate. Since it is unlikely the nonresponding households to the FHWAR have the same number of persons as the households successfully interviewed, combining these rates would result in an overestimate of the “true” person-level overall nonresponse rate for the detailed interviews.
Coverage. Overall screener under-coverage is estimated to be about 13 percent. Ratio estimation to indepen-dent population controls, as described previously, partially corrects for the bias due to survey undercoverage. However, biases exist in the estimates to the extent that missed persons in missed households or missed persons in interviewed households have different characteristics from those of inter-viewed persons in the same age group.
Comparability of Data. Data obtained from the 2011 FHWAR and other
sources are not entirely comparable. This results from differences in inter-viewer training and experience and in differing survey processes. This is an example of nonsampling variability not reflected in the standard errors. Therefore, caution should be used when comparing results from different sources. (See Appendix C.)
A Nonsampling Error Warning. Since the full extent of the nonsampling error is unknown, one should be particularly careful when interpreting results based on small differences between estimates. The Census Bureau recommends that data users incorporate information about nonsampling errors into their analyses, as nonsampling error could impact the conclusions drawn from the results. Caution should also be used when interpreting results based on a relatively small number of cases. Summary measures (such as medians and percentage distributions) probably do not reveal useful information when computed on a subpopulation smaller than 90,000 for screener data, 100,000 for the detailed sportsperson data, and 235,000 for the wildlife-watchers data.
SAMPLING ERROR
Since the FHWAR estimates come from a sample, they may differ from figures from an enumeration of the entire population using the same ques-tionnaires, instructions, and enumera-tors. For a given estimator, the differ-ence between an estimate based on a sample and the estimate that would result if the sample were to include the entire population is known as sampling error. Standard errors, as calculated by methods described in “Standard Errors and Their Use,” are primarily measures of the magnitude of sampling error. However, they may include some nons-ampling error.
Standard Errors and Their Use. The sample estimate and its standard error enable one to construct a confidence interval. A confidence interval is a range that has a known probability of including the average result of all possible samples. For example, if all possible samples were surveyed under essentially the same general conditions and using the same sample design, and if an estimate and its standard error were calculated from each sample, then approximately 95 percent of the inter-vals from 1.96 standard errors below
the estimate to 1.96 standard errors above the estimate would include the average result of all possible samples. A particular confidence interval may or may not contain the average estimate derived from all possible samples. However, one can say with specified confidence that the interval includes the average estimate calculated from all possible samples. Standard errors may also be used to perform hypothesis testing, a procedure for distinguishing between population parameters using sample estimates. The most common type of hypothesis is that the population parameters are different. An example would be comparing the proportion of anglers to the proportion of hunters. Tests may be performed at various levels of significance. A significance level is the probability of concluding that the characteristics are different when, in fact, they are the same. For example, to conclude that two charac-teristics are different at the 0.05 level of significance, the absolute value of the estimated difference between charac-teristics must be greater than or equal to 1.96 times the standard error of the difference. This report uses 95-percent confidence intervals and 0.05 level of significance to determine statistical validity. Consult standard statistical textbooks for alternative criteria.
Estimating Standard Errors. The Census Bureau uses replication methods to estimate the standard errors of FHWAR estimates. These methods primarily measure the magnitude of sampling error. However, they do measure some effects of nonsampling error as well. They do not measure systematic biases in the data associ-ated with nonsampling error. Bias is the average over all possible samples of the differences between the sample estimates and the true value.
Generalized Variance Parameters. While it is possible to compute and present an estimate of the standard error based on the survey data for each estimate in a report, there are a number of reasons why this is not done. A presentation of the individual standard errors would be of limited use, since one could not possibly predict all of the combinations of results that may be of interest to data users. Addition-ally, data users have access to FHWAR microdata files, and it is impossible to

148 2011 National Survey of Fishing, Hunting, and Wildlife-Associated Recreation U.S. Fish and Wildlife Service and U.S. Census Bureau
compute in advance the standard error for every estimate one might obtain from those data sets. Moreover, variance estimates are based on sample data and have variances of their own. Therefore, some methods of stabilizing these estimates of variance, for example, by generalizing or averaging over time, may be used to improve their reliability. Experience has shown that certain groups of estimates have similar relationships between their variances and expected values. Modeling or generalizing may provide more stable variance estimates by taking advantage of these similarities. The generalized variance function is a simple model that expresses the variance as a function of the expected value of the survey estimate. The parameters of the generalized variance function are estimated using direct replicate variances. These generalized variance parameters provide a relatively easy method to obtain approximate standard errors for numerous characteristics. Table D-5 provides the generalized variance parameters for FHWAR data. Methods for using the parameters to calculate standard errors of various estimates are given in the next sections.
Standard Errors of Estimated Numbers. The approximate standard error, sx, of an estimated number shown in this report can be obtained using the following formulas. Formula (1) is used to calculate the standard errors of levels of sportspersons, anglers, and wildlife watchers.
(1)s ax bxx = +2
Here, x is the size of the estimate and a and b are the parameters in the tables associated with the particular characteristic.
Formula (2) is used for standard errors of aggregates, i.e., trips, days, and expenditures.
(2)s ax bx cxyx = + +22
Here, x is again the size of the estimate; y is the base of the estimate; and a, b, and c are the parameters in the tables associ-ated with the particular characteristic.
Illustration of the Computation of the Standard Error of an Estimated Number
Suppose there were an estimated 37,397,000 persons age 16 years old and older who either fished or hunted in the United States in 2011. Using formula (1) with the parameters a = –0.000070 and b = 16,823 from table D-5, the approximate stan-dard error of the estimated number of 37,397,000 sportspersons age 16 years old and older is
The 95-percent confidence interval for the estimated number of sportspersons 16 years old and older is from 35,968,000 to 38,826,000, i.e., 37,397,000 ± 1.96 x 728,857. Therefore, a conclusion that the average estimate derived from all possible samples lies within a range computed in this way would be correct for roughly 95 percent of all possible samples.
Suppose there were an estimated 13,674,000 hunters age 16 years old and older who engaged in 281,884,000 days of partici-pation in 2011. Using formula (2) with the parameters a = –0.000284, b = –127,863, and c = 46,699 from table D-5, the approximate standard error on 281,884,000 estimated days on an estimated base of 13,674,000 hunters is
The 95-percent confidence interval on the estimate of 281,884,000 days is from 253,295,000 to 310,473,000, i.e., 281,884,000 ± 1.96 x 14,586,000. Again, a conclusion that the average estimate derived from all possible samples lies within a range computed in this way would be correct for roughly 95 percent of all possible samples.
Standard Errors of Estimated Percentages. The reliability of an estimated percentage, computed using sample data for both numerator and denominator, depends on the size of the percentage and its base. Estimated percentages are relatively more reliable than the corresponding estimates of the numerators of the percentages, particularly if the percentages are 50 percent or more. When the numerator and the denominator of the percentage are in different categories, use the parameter in the tables indicated by the numerator.
150 2006 National Survey of Fishing, Hunting, and Wildlife-Associated Recreation U.S. Fish & Wildlife Service
Standard Errors of Estimated Numbers. The approximate standard error, sx
, of an estimated number shown in this report can be obtained using the following formulas. Formula (1) is used to calculate the standard errors of levels of sportspersons, anglers, and wildlife-watchers.
Here, x is the size of the estimate and a and b are the parameters in the tables associated with the particular characteristic.
Formula (2) is used for standard errors of aggregates, i.e., trips, days, and expenditures.
Here, x is again the size of the estimate; y is the base of the estimate; and a, b, and c are the parameters in the tables associ-ated with the particular characteristic.
Illustration of the Computation of the Standard Error of an Estimated Number
Table 1 in this report shows that 33,916,000 persons 16 years old and older either fi shed or hunted in the United States in 2006. Using formula (1) with the parameters a = -0.000027 and b = 6,125 from table D-7, the approximate standard error of the estimate number of 33,916,000 sportspersons 16 years old and older is
The 95-percent confi dence interval for the estimate number of sportspersons 16 years old and older is from 33,092,000 to 34,740,000, ie., 33,916,000 ± 1.96 x 420,330. Therefore, a conclusion that the average estimate derived from all possible samples lies within a range computed in this way would be correct for roughly 95 percent of all possible samples.
Table 1 shows that 12,510,000 hunters 16 years old and older engaged in 219,925,000 days of participation in 2006. Using formula (2) with the parameters a = -0.000235, b = -85,241, and c = 22,698 from table D-9, the approximate standard error on 219,925,000 estimated days on an estimated base of 12,510,000 hunters is
The 95-percent confi dence interval on the estimate of 219,925,000 days is from 205,044,000 to 234,806,000, ie., 219,925,000 ± 1.96 x 7,592,000. Again, a conclusion that the average estimate derived from all possible samples lies within a range computed in this way would be correct for roughly 95 percent of all possible samples.
Standard Errors of Estimated Percentages. The reliability of an estimated percentage, computed using sample data for both numerator and denominator, depends on the size of the percentage and its base. Estimated percentages are relatively more reliable than the corresponding estimates of the numerators of the percentages, particularly if the percentages are 50 percent or more. When the numerator and the denominator of the percentage are in different categories, use the parameter in the tables indicated by the numerator.
The approximate standard error, sx,p,
can be obtained by use of the formula
Here, x is the total number of sportspersons, hunters, etc., which is the base of the percentage; p is the percentage (0 ≤ p ≤ 100); and b is the parameter in the tables associated with the characteristic in the numerator of the percentage.
Illustration of the Computation of the Standard Error of an Estimated Percentage
Table 1 shows that of the 12,510,000 hunters 16 years old and older, 18.3 percent hunted migratory birds. From table D-7, the appropriate b parameter is 5,756. Using formula (3), the approximate standard error on the estimate of 18.3 percent is
(1)
(2)s ax bx cxyx = + +22
sx = − × + × =0000027 33 916 000 6125 33 916 000 420 3302. , , , , , ,
sx = − × − × +×
=0000235 219 925 000 85 241 219 925 00022 698 219 925 000
12 510 0007 592 0002
2
. , , , , ,, , ,
, ,, ,
(3)
,p
s bp pxx p,
( )=
−100
150 2006 National Survey of Fishing, Hunting, and Wildlife-Associated Recreation U.S. Fish & Wildlife Service
Standard Errors of Estimated Numbers. The approximate standard error, sx
, of an estimated number shown in this report can be obtained using the following formulas. Formula (1) is used to calculate the standard errors of levels of sportspersons, anglers, and wildlife-watchers.
Here, x is the size of the estimate and a and b are the parameters in the tables associated with the particular characteristic.
Formula (2) is used for standard errors of aggregates, i.e., trips, days, and expenditures.
Here, x is again the size of the estimate; y is the base of the estimate; and a, b, and c are the parameters in the tables associ-ated with the particular characteristic.
Illustration of the Computation of the Standard Error of an Estimated Number
Table 1 in this report shows that 33,916,000 persons 16 years old and older either fi shed or hunted in the United States in 2006. Using formula (1) with the parameters a = -0.000027 and b = 6,125 from table D-7, the approximate standard error of the estimate number of 33,916,000 sportspersons 16 years old and older is
The 95-percent confi dence interval for the estimate number of sportspersons 16 years old and older is from 33,092,000 to 34,740,000, ie., 33,916,000 ± 1.96 x 420,330. Therefore, a conclusion that the average estimate derived from all possible samples lies within a range computed in this way would be correct for roughly 95 percent of all possible samples.
Table 1 shows that 12,510,000 hunters 16 years old and older engaged in 219,925,000 days of participation in 2006. Using formula (2) with the parameters a = -0.000235, b = -85,241, and c = 22,698 from table D-9, the approximate standard error on 219,925,000 estimated days on an estimated base of 12,510,000 hunters is
The 95-percent confi dence interval on the estimate of 219,925,000 days is from 205,044,000 to 234,806,000, ie., 219,925,000 ± 1.96 x 7,592,000. Again, a conclusion that the average estimate derived from all possible samples lies within a range computed in this way would be correct for roughly 95 percent of all possible samples.
Standard Errors of Estimated Percentages. The reliability of an estimated percentage, computed using sample data for both numerator and denominator, depends on the size of the percentage and its base. Estimated percentages are relatively more reliable than the corresponding estimates of the numerators of the percentages, particularly if the percentages are 50 percent or more. When the numerator and the denominator of the percentage are in different categories, use the parameter in the tables indicated by the numerator.
The approximate standard error, sx,p,
can be obtained by use of the formula
Here, x is the total number of sportspersons, hunters, etc., which is the base of the percentage; p is the percentage (0 ≤ p ≤ 100); and b is the parameter in the tables associated with the characteristic in the numerator of the percentage.
Illustration of the Computation of the Standard Error of an Estimated Percentage
Table 1 shows that of the 12,510,000 hunters 16 years old and older, 18.3 percent hunted migratory birds. From table D-7, the appropriate b parameter is 5,756. Using formula (3), the approximate standard error on the estimate of 18.3 percent is
(1)s ax bxx = +2
(2)
sx = − × + × =0000027 33 916 000 6125 33 916 000 420 3302. , , , , , ,
sx = − × − × +×
=0000235 219 925 000 85 241 219 925 00022 698 219 925 000
12 510 0007 592 0002
2
. , , , , ,, , ,
, ,, ,
(3)
,p
s bp pxx p,
( )=
−100
15.8 to 17.6, i.e., 16.7 ± 1.96 x 0.45.
15.8 to 17.6, i.e., 16.7 ± 1.96 x 0.45.

U.S. Fish and Wildlife Service and U.S. Census Bureau 2011 National Survey of Fishing, Hunting, and Wildlife-Associated Recreation 149
The approximate standard error, sx,p, can be obtained by use of the formula
(3)
,p
s bp pxx p,
( )=
−100
Here, x is the total number of sportspersons, hunters, etc., which is the base of the percentage; p is the percentage ; and b is the parameter in the tables associated with the characteristic in the numerator of the percentage.
Illustration of the Computation of the Standard Error of an Estimated Percentage
Suppose there were an estimated 13,674,000 hunters age 16 years old and older of whom 18.9 percent hunted migratory birds. From table D-5, the appropriate b parameter is 15,798. Using formula (3), the approximate standard error on the esti-mate of 18.9 percent is
Consequently, the 95-percent confidence interval for the estimate percentage of migratory bird hunters 16 years old and older is from 16.3 percent to 21.5 percent, i.e., 18.9 ± 1.96 x 1.33.
Standard Error of a Difference. The standard error of the difference between two sample estimates is approximately equal to (4)
s s sx y x y− = +2 2
where sx and sy are the standard errors of the estimates x and y. The estimates can be numbers, percentages, ratios, etc. This will represent the actual standard error quite accurately for the difference between estimates of the same characteristic in two different areas, or for the difference between separate and uncorrelated characteristics in the same area. However, if there is a high positive (negative) correlation between the two characteristics, the formula will overestimate (underestimate) the true standard error.
Illustration of the Computation of the Standard Error of a Difference
Suppose there were an estimated 13,608,000 females in the age range of 18-24 of whom 726,000 or 5.3 percent were sportspersons. Similarly, suppose there were an estimated 12,909,000 males in the same age range of whom 2,160,000 or 16.7 percent were sportspersons. The apparent difference between the percentage of female and male sportspersons is 11.4 percent. Using formula (3) and the appropriate b parameter from table D-5, the approximate standard errors of 5.3 percent and 16.7 percent are 0.79 and 1.35, respectively. Using formula (4), the approximate standard error of the estimated differ-ence of 11.4 percent is
The 95-percent confidence interval on the difference between 18- to 24-year-old female and male sportspersons is from 8.3 to 14.5, i.e., 11.4 ± 1.96 x 1.56. Since the interval does not contain zero, we can conclude with 95 percent confidence that the percentage of 18- to 24-year-old female sportspersons is less than the percentage of 18- to 24-year-old male sportspersons.
Standard Errors of Estimated Averages. Certain mean values for sportspersons, anglers, etc., shown in the report were calcu-lated as the ratio of two numbers. For example, average days per angler is calculated as:
xy
total daystotal anglers
=
Standard errors for these averages may be approximated by the use of formula (5) below.
(5)s x
ysx
sy
rs sxyx y
x y x y=
+
−
2 2
2
In formula (5), r represents the correlation coefficient between the numerator and the denominator of the estimate. In the above formula, use 0.7 as an estimate of r.
150 2006 National Survey of Fishing, Hunting, and Wildlife-Associated Recreation U.S. Fish & Wildlife Service
Standard Errors of Estimated Numbers. The approximate standard error, sx
, of an estimated number shown in this report can be obtained using the following formulas. Formula (1) is used to calculate the standard errors of levels of sportspersons, anglers, and wildlife-watchers.
Here, x is the size of the estimate and a and b are the parameters in the tables associated with the particular characteristic.
Formula (2) is used for standard errors of aggregates, i.e., trips, days, and expenditures.
Here, x is again the size of the estimate; y is the base of the estimate; and a, b, and c are the parameters in the tables associ-ated with the particular characteristic.
Illustration of the Computation of the Standard Error of an Estimated Number
Table 1 in this report shows that 33,916,000 persons 16 years old and older either fi shed or hunted in the United States in 2006. Using formula (1) with the parameters a = -0.000027 and b = 6,125 from table D-7, the approximate standard error of the estimate number of 33,916,000 sportspersons 16 years old and older is
The 95-percent confi dence interval for the estimate number of sportspersons 16 years old and older is from 33,092,000 to 34,740,000, ie., 33,916,000 ± 1.96 x 420,330. Therefore, a conclusion that the average estimate derived from all possible samples lies within a range computed in this way would be correct for roughly 95 percent of all possible samples.
Table 1 shows that 12,510,000 hunters 16 years old and older engaged in 219,925,000 days of participation in 2006. Using formula (2) with the parameters a = -0.000235, b = -85,241, and c = 22,698 from table D-9, the approximate standard error on 219,925,000 estimated days on an estimated base of 12,510,000 hunters is
The 95-percent confi dence interval on the estimate of 219,925,000 days is from 205,044,000 to 234,806,000, ie., 219,925,000 ± 1.96 x 7,592,000. Again, a conclusion that the average estimate derived from all possible samples lies within a range computed in this way would be correct for roughly 95 percent of all possible samples.
Standard Errors of Estimated Percentages. The reliability of an estimated percentage, computed using sample data for both numerator and denominator, depends on the size of the percentage and its base. Estimated percentages are relatively more reliable than the corresponding estimates of the numerators of the percentages, particularly if the percentages are 50 percent or more. When the numerator and the denominator of the percentage are in different categories, use the parameter in the tables indicated by the numerator.
The approximate standard error, sx,p,
can be obtained by use of the formula
Here, x is the total number of sportspersons, hunters, etc., which is the base of the percentage; p is the percentage (0 ≤ p ≤ 100); and b is the parameter in the tables associated with the characteristic in the numerator of the percentage.
Illustration of the Computation of the Standard Error of an Estimated Percentage
Table 1 shows that of the 12,510,000 hunters 16 years old and older, 18.3 percent hunted migratory birds. From table D-7, the appropriate b parameter is 5,756. Using formula (3), the approximate standard error on the estimate of 18.3 percent is
(1)s ax bxx = +2
(2)s ax bx cxyx = + +22
sx = − × + × =0000027 33 916 000 6125 33 916 000 420 3302. , , , , , ,
sx = − × − × +×
=0000235 219 925 000 85 241 219 925 00022 698 219 925 000
12 510 0007 592 0002
2
. , , , , ,, , ,
, ,, ,
(3)
15.8 to 17.6, i.e., 16.7 ± 1.96 x 0.45.
U.S. Fish & Wildlife Service 2006 National Survey of Fishing, Hunting, and Wildlife-Associated Recreation 151
Consequently, the 95-percent confi dence interval for the estimate percentage of migratory bird hunters 16 years old and older is from 16.7 percent to 19.9 percent, ie. 18.3 ± 1.96 x 0.83.
Standard Error of a Difference. The standard error of the difference between two sample estimates is approximately equal to
where sx
and sy
are the standard errors of the estimates x and y. The estimates can be numbers, percentages, ratios, etc. This will represent the actual standard error quite accurately for the difference between estimates of the same characteristic in two different areas, or for the difference between separate and uncorrelated characteristics in the same area. However, if there is a high positive (negative) correlation between the two characteristics, the formula will overestimate (underestimate) the true standard error.
Illustration of the Computation of the Standard Error of a Difference
In Table 8, of the 11,655,000 females in the age range of 18-24, 726,000 or 6.2 percent are sportspersons. Similarly, of the 11,638,000 males in the same age range, 1,929,000 or 16.6 percent are sportspersons. The apparent difference between the percent of female and male participants is 10.4 percent. Using formula (3) and the appropriate b parameter from table D-7, the approximate standard errors of 6.2 percent and 16.6 percent are 0.55 and 0.85, respectively. Using formula (4), the approximate standard error of the estimated difference of 10.4 percent is
The 95-percent confi dence interval on the difference between 18-24 year old female and male sportspersons is from 8.4 to 12.4, i.e., 10.4 ± 1.96 x 1.02. Since the interval does not contain zero, we can conclude with 95 percent confi dence that the percentage of 18-24 year old female sportspersons is less than the percentage of 18-24 year old male sportspersons.
Standard Errors of Estimated Averages. Certain mean values for sportspersons, anglers, etc., shown in the report were calcu-lated as the ratio of two numbers. For example, average days per angler is calculated as:
Standard errors for these averages may be approximated by the use of formula (5) below.
In formula (5), r represents the correlation coeffi cient between the numerator and the denominator of the estimate. In the above formula, use 0.7 as an estimate of r.
Illustration of the Computation of the Standard Error of an Estimated Average
Table 2 shows that the average days per angler 16 years old and older for all fi shing was 17.3 days. Using formulas (1) and (2) above, we compute the standard error on total days, 516,781,000, and total anglers, 29,952,000, to be 15,828,079 and 399,342, respectively. The approximate standard error on the estimated average of 17.3 days is
Therefore, the 95-percent confi dence interval on the estimated average of 17.3 days is from 16.5 to 18.0, i.e., 17.3 ± 1.96 x 0.40.
( )sx p,
, . ., ,
.=× × −
=5 756 183 100 183
12 510 000083
(4)
sx y− = + =055 085 1022 2. . .
xy
total daystotal anglers
=
(5)s xy
sx
sy
rs sxyx y
x y x y=
+
−
2 2
2
sx y =
+
− ×
××
=516 78100029 952 000
158 280 079516 781000
399 34229 952 000
2 0715828 079 399 342
516 781000 29 952 000040
2 2, ,, ,
, ,, ,
,, ,
., , ,, , , ,
.
15.8 to 17.6, i.e., 16.7 ± 1.96 x 0.45.
U.S. Fish & Wildlife Service 2006 National Survey of Fishing, Hunting, and Wildlife-Associated Recreation 151
Consequently, the 95-percent confi dence interval for the estimate percentage of migratory bird hunters 16 years old and older is from 16.7 percent to 19.9 percent, ie. 18.3 ± 1.96 x 0.83.
Standard Error of a Difference. The standard error of the difference between two sample estimates is approximately equal to
where sx
and sy
are the standard errors of the estimates x and y. The estimates can be numbers, percentages, ratios, etc. This will represent the actual standard error quite accurately for the difference between estimates of the same characteristic in two different areas, or for the difference between separate and uncorrelated characteristics in the same area. However, if there is a high positive (negative) correlation between the two characteristics, the formula will overestimate (underestimate) the true standard error.
Illustration of the Computation of the Standard Error of a Difference
In Table 8, of the 11,655,000 females in the age range of 18-24, 726,000 or 6.2 percent are sportspersons. Similarly, of the 11,638,000 males in the same age range, 1,929,000 or 16.6 percent are sportspersons. The apparent difference between the percent of female and male participants is 10.4 percent. Using formula (3) and the appropriate b parameter from table D-7, the approximate standard errors of 6.2 percent and 16.6 percent are 0.55 and 0.85, respectively. Using formula (4), the approximate standard error of the estimated difference of 10.4 percent is
The 95-percent confi dence interval on the difference between 18-24 year old female and male sportspersons is from 8.4 to 12.4, i.e., 10.4 ± 1.96 x 1.02. Since the interval does not contain zero, we can conclude with 95 percent confi dence that the percentage of 18-24 year old female sportspersons is less than the percentage of 18-24 year old male sportspersons.
Standard Errors of Estimated Averages. Certain mean values for sportspersons, anglers, etc., shown in the report were calcu-lated as the ratio of two numbers. For example, average days per angler is calculated as:
Standard errors for these averages may be approximated by the use of formula (5) below.
In formula (5), r represents the correlation coeffi cient between the numerator and the denominator of the estimate. In the above formula, use 0.7 as an estimate of r.
Illustration of the Computation of the Standard Error of an Estimated Average
Table 2 shows that the average days per angler 16 years old and older for all fi shing was 17.3 days. Using formulas (1) and (2) above, we compute the standard error on total days, 516,781,000, and total anglers, 29,952,000, to be 15,828,079 and 399,342, respectively. The approximate standard error on the estimated average of 17.3 days is
Therefore, the 95-percent confi dence interval on the estimated average of 17.3 days is from 16.5 to 18.0, i.e., 17.3 ± 1.96 x 0.40.
( )sx p,
, . ., ,
.=× × −
=5 756 183 100 183
12 510 000083
(4)s s sx y x y− = +2 2
sx y− = + =055 085 1022 2. . .
(5)s xy
sx
sy
rs sxyx y
x y x y=
+
−
2 2
2
sx y =
+
− ×
××
=516 78100029 952 000
158 280 079516 781000
399 34229 952 000
2 0715828 079 399 342
516 781000 29 952 000040
2 2, ,, ,
, ,, ,
,, ,
., , ,, , , ,
.
U.S. Fish & Wildlife Service 2006 National Survey of Fishing, Hunting, and Wildlife-Associated Recreation 151
Consequently, the 95-percent confi dence interval for the estimate percentage of migratory bird hunters 16 years old and older is from 16.7 percent to 19.9 percent, ie. 18.3 ± 1.96 x 0.83.
Standard Error of a Difference. The standard error of the difference between two sample estimates is approximately equal to
where sx
and sy
are the standard errors of the estimates x and y. The estimates can be numbers, percentages, ratios, etc. This will represent the actual standard error quite accurately for the difference between estimates of the same characteristic in two different areas, or for the difference between separate and uncorrelated characteristics in the same area. However, if there is a high positive (negative) correlation between the two characteristics, the formula will overestimate (underestimate) the true standard error.
Illustration of the Computation of the Standard Error of a Difference
In Table 8, of the 11,655,000 females in the age range of 18-24, 726,000 or 6.2 percent are sportspersons. Similarly, of the 11,638,000 males in the same age range, 1,929,000 or 16.6 percent are sportspersons. The apparent difference between the percent of female and male participants is 10.4 percent. Using formula (3) and the appropriate b parameter from table D-7, the approximate standard errors of 6.2 percent and 16.6 percent are 0.55 and 0.85, respectively. Using formula (4), the approximate standard error of the estimated difference of 10.4 percent is
The 95-percent confi dence interval on the difference between 18-24 year old female and male sportspersons is from 8.4 to 12.4, i.e., 10.4 ± 1.96 x 1.02. Since the interval does not contain zero, we can conclude with 95 percent confi dence that the percentage of 18-24 year old female sportspersons is less than the percentage of 18-24 year old male sportspersons.
Standard Errors of Estimated Averages. Certain mean values for sportspersons, anglers, etc., shown in the report were calcu-lated as the ratio of two numbers. For example, average days per angler is calculated as:
Standard errors for these averages may be approximated by the use of formula (5) below.
In formula (5), r represents the correlation coeffi cient between the numerator and the denominator of the estimate. In the above formula, use 0.7 as an estimate of r.
Illustration of the Computation of the Standard Error of an Estimated Average
Table 2 shows that the average days per angler 16 years old and older for all fi shing was 17.3 days. Using formulas (1) and (2) above, we compute the standard error on total days, 516,781,000, and total anglers, 29,952,000, to be 15,828,079 and 399,342, respectively. The approximate standard error on the estimated average of 17.3 days is
Therefore, the 95-percent confi dence interval on the estimated average of 17.3 days is from 16.5 to 18.0, i.e., 17.3 ± 1.96 x 0.40.
( )sx p,
, . ., ,
.=× × −
=5 756 183 100 183
12 510 000083
(4)s s sx y x y− = +2 2
sx y− = + =055 085 1022 2. . .
xy
total daystotal anglers
=
(5)
sx y =
+
− ×
××
=516 78100029 952 000
158 280 079516 781000
399 34229 952 000
2 0715828 079 399 342
516 781000 29 952 000040
2 2, ,, ,
, ,, ,
,, ,
., , ,, , , ,
.

150 2011 National Survey of Fishing, Hunting, and Wildlife-Associated Recreation U.S. Fish and Wildlife Service and U.S. Census Bureau
Illustration of the Computation of the Standard Error of an Estimated Average
Suppose that the estimated number of the average days per angler age 16 years old and older for all fishing was 16.7 days. Using formulas (1) and (2) above, we compute the standard error on total days, 553,841,000, and total anglers, 33,112,000, to be 20,329,124 and 693,033, respectively. The approximate standard error on the estimated average of 16.7 days is
15.8 to 17.6, i.e., 16.7 ± 1.96 x 0.45.
Therefore, the 95-percent confidence interval on the estimated average of 16.7 days is from 15.8 to 17.6, i.e., 16.7 ± 1.96 x 0.45.

U.S. Fish and Wildlife Service and U.S. Census Bureau 2011 National Survey of Fishing, Hunting, and Wildlife-Associated Recreation 151
Table D–1.
Approximate Standard Errors and 95-Percent Confidence Intervals for Selected Fishing Estimates: 2011
Anglers, days, and expenditures Estimate Standard error Lower 95 percent Upper 95 percent
ANGLERS (thousands)
Total . . . . . . . . . . . . . . . . . . . . . . . . . . . . . . . . . . . . . . . . . . . . . . . 33,112 693 31,754 34,470 Freshwater . . . . . . . . . . . . . . . . . . . . . . . . . . . . . . . . . . . . . . . . 27,547 640 26,292 28,802 Freshwater, except Great Lakes. . . . . . . . . . . . . . . . . . . . . . . 27,060 635 25,815 28,305 Great Lakes . . . . . . . . . . . . . . . . . . . . . . . . . . . . . . . . . . . . . . 1,665 167 1,338 1,992 Saltwater . . . . . . . . . . . . . . . . . . . . . . . . . . . . . . . . . . . . . . . . . .
DAYS OF FISHING (thousands)
8,889 379 8,145 9,633
Total . . . . . . . . . . . . . . . . . . . . . . . . . . . . . . . . . . . . . . . . . . . . . . . 553,841 20,329 513,996 593,686 Freshwater . . . . . . . . . . . . . . . . . . . . . . . . . . . . . . . . . . . . . . . . . 455,862 18,246 420,100 491,624 Freshwater, except Great Lakes . . . . . . . . . . . . . . . . . . . . . . 443,223 17,872 408,194 478,252 Great Lakes . . . . . . . . . . . . . . . . . . . . . . . . . . . . . . . . . . . . . . 19,661 2,989 13,803 25,519 Saltwater . . . . . . . . . . . . . . . . . . . . . . . . . . . . . . . . . . . . . . . . . .
Average Days Per Angler
99,474 6,523 86,689 112,259
Total . . . . . . . . . . . . . . . . . . . . . . . . . . . . . . . . . . . . . . . . . . . . . . . 16.7 0.4 15.9 17.6 Freshwater . . . . . . . . . . . . . . . . . . . . . . . . . . . . . . . . . . . . . . . . . 16.5 0.5 15.6 17.5 Freshwater, except Great Lakes . . . . . . . . . . . . . . . . . . . . . . 16.4 0.5 15.4 17.3 Great Lakes . . . . . . . . . . . . . . . . . . . . . . . . . . . . . . . . . . . . . . 11.8 1.3 9.3 14.3 Saltwater . . . . . . . . . . . . . . . . . . . . . . . . . . . . . . . . . . . . . . . . . .
FISHING EXPENDITURES (thousands of dollars)
11.2 0.5 10.2 12.2
Total . . . . . . . . . . . . . . . . . . . . . . . . . . . . . . . . . . . . . . . . . . . . . . . 41,788,936 2,152,483 37,570,069 46,007,803 Freshwater . . . . . . . . . . . . . . . . . . . . . . . . . . . . . . . . . . . . . . . . . 25,732,493 1,392,372 23,003,444 28,461,542 Freshwater, except Great Lakes . . . . . . . . . . . . . . . . . . . . . . 23,782,678 1,294,461 21,245,535 26,319,821 Great Lakes . . . . . . . . . . . . . . . . . . . . . . . . . . . . . . . . . . . . . . 1,867,098 321,774 1,236,420 2,497,776 Saltwater . . . . . . . . . . . . . . . . . . . . . . . . . . . . . . . . . . . . . . . . . .
Average Expenditure Per Angler (dollars)
10,266,904 842,314 8,615,969 11,917,839
Total . . . . . . . . . . . . . . . . . . . . . . . . . . . . . . . . . . . . . . . . . . . . . . . 1,262 50 1,164 1,360 Freshwater . . . . . . . . . . . . . . . . . . . . . . . . . . . . . . . . . . . . . . . . 934 39 858 1,010 Freshwater, except Great Lakes . . . . . . . . . . . . . . . . . . . . . . 879 36 807 950 Great Lakes . . . . . . . . . . . . . . . . . . . . . . . . . . . . . . . . . . . . . . 1,121 140 847 1,396 Saltwater . . . . . . . . . . . . . . . . . . . . . . . . . . . . . . . . . . . . . . . . . . 1,155 70 1,018 1,292

152 2011 National Survey of Fishing, Hunting, and Wildlife-Associated Recreation U.S. Fish and Wildlife Service and U.S. Census Bureau
Table D–2.
Approximate Standard Errors and 95-Percent Confidence Intervals for Selected Hunting Estimates: 2011
Hunters, days, and expenditures Estimate Standard error Lower 95 percent Upper 95 percent
HUNTERS (thousands)
Total . . . . . . . . . . . . . . . . . . . . . . . . . . . . . . . . . . . . . . . . . . . . . . . . . . . . Big game . . . . . . . . . . . . . . . . . . . . . . . . . . . . . . . . . . . . . . . . . . . . . . Small game . . . . . . . . . . . . . . . . . . . . . . . . . . . . . . . . . . . . . . . . . . . . . Migratory birds . . . . . . . . . . . . . . . . . . . . . . . . . . . . . . . . . . . . . . . . . . Other animals . . . . . . . . . . . . . . . . . . . . . . . . . . . . . . . . . . . . . . . . . . .
DAYS OF HUNTING (thousands)
Total . . . . . . . . . . . . . . . . . . . . . . . . . . . . . . . . . . . . . . . . . . . . . . . . . . . . Big game . . . . . . . . . . . . . . . . . . . . . . . . . . . . . . . . . . . . . . . . . . . . . . . Small game . . . . . . . . . . . . . . . . . . . . . . . . . . . . . . . . . . . . . . . . . . . . . Migratory birds . . . . . . . . . . . . . . . . . . . . . . . . . . . . . . . . . . . . . . . . . . Other animals . . . . . . . . . . . . . . . . . . . . . . . . . . . . . . . . . . . . . . . . . . .
Average Days Per Hunter
Total . . . . . . . . . . . . . . . . . . . . . . . . . . . . . . . . . . . . . . . . . . . . . . . . . . . . Big game . . . . . . . . . . . . . . . . . . . . . . . . . . . . . . . . . . . . . . . . . . . . . . . Small game . . . . . . . . . . . . . . . . . . . . . . . . . . . . . . . . . . . . . . . . . . . . . Migratory birds . . . . . . . . . . . . . . . . . . . . . . . . . . . . . . . . . . . . . . . . . . Other animals . . . . . . . . . . . . . . . . . . . . . . . . . . . . . . . . . . . . . . . . . . .
HUNTING EXPENDITURES (thousands of dollars)
Total . . . . . . . . . . . . . . . . . . . . . . . . . . . . . . . . . . . . . . . . . . . . . . . . . . . . Big game . . . . . . . . . . . . . . . . . . . . . . . . . . . . . . . . . . . . . . . . . . . . . . . Small game . . . . . . . . . . . . . . . . . . . . . . . . . . . . . . . . . . . . . . . . . . . . . Migratory birds . . . . . . . . . . . . . . . . . . . . . . . . . . . . . . . . . . . . . . . . . . Other animals . . . . . . . . . . . . . . . . . . . . . . . . . . . . . . . . . . . . . . . . . . .
Average Expenditure Per Hunter (dollars)
Total . . . . . . . . . . . . . . . . . . . . . . . . . . . . . . . . . . . . . . . . . . . . . . . . . . . . Big game . . . . . . . . . . . . . . . . . . . . . . . . . . . . . . . . . . . . . . . . . . . . . . Small game . . . . . . . . . . . . . . . . . . . . . . . . . . . . . . . . . . . . . . . . . . . . . Migratory birds . . . . . . . . . . . . . . . . . . . . . . . . . . . . . . . . . . . . . . . . . Other animals . . . . . . . . . . . . . . . . . . . . . . . . . . . . . . . . . . . . . . . . . . .
13,67411,5704,5062,5832,168
281,884212,11650,88423,26334,434
20.618.311.39.0
15.9
33,702,01716,853,6542,560,8591,808,030
857,607
2,4651,457
568700396
451417264201184
14,58711,9054,4262,5804,561
0.80.70.70.71.5
2,434,3621,301,699
294,923258,986145,374
13485487350
12,78910,7533,9882,1891,807
253,293188,78342,20818,20625,495
19.116.99.97.6
12.9
28,930,66814,302,3241,982,8101,300,418
572,674
2,2011,291
473556298
14,55912,3875,0242,9772,529
310,475235,44959,56028,32043,373
22.119.812.710.418.8
38,473,36619,404,9843,138,9082,315,6421,142,540
2,7281,622
663844493

U.S. Fish and Wildlife Service and U.S. Census Bureau 2011 National Survey of Fishing, Hunting, and Wildlife-Associated Recreation 153
Table D–3. Approximate Standard Errors and 95-Percent Confidence Intervals for Selected Fishing and Hunting Expenditure Estimates: 2011 (Thousands of dollars)
Expenditures Estimate Standard error Lower 95 percent Upper 95 percent
FISHING AND HUNTING EXPENDITURES
Total . . . . . . . . . . . . . . . . . . . . . . . . . . . . . . . . . . . . . . . . . . . . . . . 89,761,524 4,417,179 81,103,853 98,419,195 Trip-related, total . . . . . . . . . . . . . . . . . . . . . . . . . . . . . . . . . . . . 32,210,653 1,611,890 29,051,348 35,369,958 Food and lodging . . . . . . . . . . . . . . . . . . . . . . . . . . . . . . . . . 11,592,622 600,321 10,415,993 12,769,251 Transportation . . . . . . . . . . . . . . . . . . . . . . . . . . . . . . . . . . . . 11,029,451 567,248 9,917,645 12,141,257 Other trip costs . . . . . . . . . . . . . . . . . . . . . . . . . . . . . . . . . . . 9,588,580 507,643 8,593,600 10,583,560
Equipment, total . . . . . . . . . . . . . . . . . . . . . . . . . . . . . . . . . . . . 43,227,403 1,973,222 39,359,887 47,094,919 Fishing. . . . . . . . . . . . . . . . . . . . . . . . . . . . . . . . . . . . . . . . . . 6,179,132 346,771 5,499,462 6,858,802 Hunting . . . . . . . . . . . . . . . . . . . . . . . . . . . . . . . . . . . . . . . . . 8,182,297 580,360 7,044,792 9,319,802 Auxiliary . . . . . . . . . . . . . . . . . . . . . . . . . . . . . . . . . . . . . . . . 3,736,648 266,416 3,214,473 4,258,823 Special . . . . . . . . . . . . . . . . . . . . . . . . . . . . . . . . . . . . . . . . . . 25,129,326 2,818,767 19,604,543 30,654,109
Other, total. . . . . . . . . . . . . . . . . . . . . . . . . . . . . . . . . . . . . . . . . 13,620,867 653,752 12,339,513 14,902,221 Magazines, books, DVDs . . . . . . . . . . . . . . . . . . . . . . . . . . . 319,781 26,571 267,702 371,860 Membership dues and contributions . . . . . . . . . . . . . . . . . . . 1,122,787 107,185 912,705 1,332,869 Land leasing and ownership . . . . . . . . . . . . . . . . . . . . . . . . . 10,563,362 1,363,654 7,890,601 13,236,123 Licenses, stamps, tags, and permits . . . . . . . . . . . . . . . . . . . 1,614,937 83,880 1,450,533 1,779,341
Fishing Expenditures
Total . . . . . . . . . . . . . . . . . . . . . . . . . . . . . . . . . . . . . . . . . . . . . . . 41,788,936 2,152,483 37,570,069 46,007,803 Trip-related, total . . . . . . . . . . . . . . . . . . . . . . . . . . . . . . . . . . . . 21,789,465 1,130,303 19,574,071 24,004,859 Food and lodging . . . . . . . . . . . . . . . . . . . . . . . . . . . . . . . . . 7,711,318 415,250 6,897,427 8,525,209 Transportation . . . . . . . . . . . . . . . . . . . . . . . . . . . . . . . . . . . . 6,261,536 335,609 5,603,743 6,919,329 Other trip costs . . . . . . . . . . . . . . . . . . . . . . . . . . . . . . . . . . . 7,816,610 421,072 6,991,309 8,641,911
Equipment, total . . . . . . . . . . . . . . . . . . . . . . . . . . . . . . . . . . . . 15,506,433 811,537 13,915,821 17,097,045 Fishing . . . . . . . . . . . . . . . . . . . . . . . . . . . . . . . . . . . . . . . . . 6,141,895 346,725 5,462,314 6,821,476 Auxiliary . . . . . . . . . . . . . . . . . . . . . . . . . . . . . . . . . . . . . . . . 1,106,865 115,939 879,625 1,334,105 Special . . . . . . . . . . . . . . . . . . . . . . . . . . . . . . . . . . . . . . . . . 8,257,673 1,196,090 5,913,337 10,602,009
Other, total. . . . . . . . . . . . . . . . . . . . . . . . . . . . . . . . . . . . . . . . . 4,493,037 249,307 4,004,395 4,981,679 Magazines, books, DVDs . . . . . . . . . . . . . . . . . . . . . . . . . . . 108,308 12,923 82,978 133,638 Membership dues and contributions . . . . . . . . . . . . . . . . . . . 321,990 51,720 220,619 423,361 Land leasing and ownership . . . . . . . . . . . . . . . . . . . . . . . . . 3,434,097 771,086 1,922,768 4,945,426 Licenses, stamps, tags, and permits . . . . . . . . . . . . . . . . . . . 628,642 33,876 562,245 695,039
Hunting Expenditures
Total . . . . . . . . . . . . . . . . . . . . . . . . . . . . . . . . . . . . . . . . . . . . . . . 33,702,017 2,434,362 28,930,668 38,473,366 Trip-related, total . . . . . . . . . . . . . . . . . . . . . . . . . . . . . . . . . . . 10,427,189 777,308 8,903,666 11,950,712 Food and lodging . . . . . . . . . . . . . . . . . . . . . . . . . . . . . . . . . 3,881,304 300,335 3,292,647 4,469,961 Transportation . . . . . . . . . . . . . . . . . . . . . . . . . . . . . . . . . . . . 4,767,915 361,834 4,058,720 5,477,110 Other trip costs . . . . . . . . . . . . . . . . . . . . . . . . . . . . . . . . . . . 1,771,970 212,437 1,355,593 2,188,347
Equipment, total . . . . . . . . . . . . . . . . . . . . . . . . . . . . . . . . . . . . 13,972,490 948,614 12,113,206 15,831,774 Hunting . . . . . . . . . . . . . . . . . . . . . . . . . . . . . . . . . . . . . . . . . 7,738,324 602,758 6,556,919 8,919,729 Auxiliary . . . . . . . . . . . . . . . . . . . . . . . . . . . . . . . . . . . . . . . . 1,844,880 185,407 1,481,483 2,208,277 Special . . . . . . . . . . . . . . . . . . . . . . . . . . . . . . . . . . . . . . . . . . 4,389,286 1,195,275 2,046,546 6,732,026
Other, total. . . . . . . . . . . . . . . . . . . . . . . . . . . . . . . . . . . . . . . . . 9,308,340 613,476 8,105,927 10,510,753 Magazines, books, DVDs . . . . . . . . . . . . . . . . . . . . . . . . . . . 107,272 13,470 80,871 133,673 Membership dues and contributions . . . . . . . . . . . . . . . . . . . 382,817 57,968 269,199 496,435 Land leasing and ownership . . . . . . . . . . . . . . . . . . . . . . . . . 7,129,265 1,039,867 5,091,126 9,167,404 Licenses, stamps, tags, and permits . . . . . . . . . . . . . . . . . . . 986,385 71,671 845,910 1,126,860

154 2011 National Survey of Fishing, Hunting, and Wildlife-Associated Recreation U.S. Fish and Wildlife Service and U.S. Census Bureau
Table D–4.
Approximate Standard Errors and 95-Percent Confidence Intervals for Selected Wildlife-Watching Estimates: 2011
Participants and expenditures Estimate Standard error Lower 95 percent Upper 95 percent
WILDLIFE–WATCHING PARTICIPANTS (thousands)
Total . . . . . . . . . . . . . . . . . . . . . . . . . . . . . . . . . . . . . . . . . . . . . . . . . . 71,776 1,196 69,431 74,121 Away from home . . . . . . . . . . . . . . . . . . . . . . . . . . . . . . . . . . . . . . . 22,496 762 21,003 23,989 Observe wildlife . . . . . . . . . . . . . . . . . . . . . . . . . . . . . . . . . . . . . 19,808 719 18,398 21,218 Photograph wildlife . . . . . . . . . . . . . . . . . . . . . . . . . . . . . . . . . . . 12,354 578 11,222 13,486 Feed wildlife . . . . . . . . . . . . . . . . . . . . . . . . . . . . . . . . . . . . . . . . 5,399 388 4,639 6,159
Around the home . . . . . . . . . . . . . . . . . . . . . . . . . . . . . . . . . . . . . . . 68,598 1,180 66,284 70,912 Observe wildlife . . . . . . . . . . . . . . . . . . . . . . . . . . . . . . . . . . . . . 45,046 1,020 43,046 47,046 Photograph wildlife . . . . . . . . . . . . . . . . . . . . . . . . . . . . . . . . . . . 25,370 804 23,795 26,945 Feed wildlife . . . . . . . . . . . . . . . . . . . . . . . . . . . . . . . . . . . . . . . . 52,817 1,083 50,695 54,939 Visit public parks or natural areas . . . . . . . . . . . . . . . . . . . . . . . . 12,311 577 11,181 13,441 Maintain plantings or natural areas . . . . . . . . . . . . . . . . . . . . . . .
DAYS OF PARTICIPATION IN AWAY-FROM-HOME ACTIVITIES (thousands)
13,399 600 12,223 14,575
Total . . . . . . . . . . . . . . . . . . . . . . . . . . . . . . . . . . . . . . . . . . . . . . . . . . 335,625 28,425 279,911 391,339 Observe wildlife . . . . . . . . . . . . . . . . . . . . . . . . . . . . . . . . . . . . . . . 268,798 24,209 221,349 316,247 Photograph wildlife . . . . . . . . . . . . . . . . . . . . . . . . . . . . . . . . . . . . . 110,459 13,146 84,693 136,225 Feed wildlife . . . . . . . . . . . . . . . . . . . . . . . . . . . . . . . . . . . . . . . . . .
Average Days of Participation in Away-From-Home Activities
59,255 9,604 40,432 78,078
Total . . . . . . . . . . . . . . . . . . . . . . . . . . . . . . . . . . . . . . . . . . . . . . . . . . 14.9 0.98 13.0 16.8 Observe wildlife . . . . . . . . . . . . . . . . . . . . . . . . . . . . . . . . . . . . . . . 13.6 0.95 11.7 15.4 Photograph wildlife . . . . . . . . . . . . . . . . . . . . . . . . . . . . . . . . . . . . . 8.9 0.83 7.3 10.6 Feed wildlife . . . . . . . . . . . . . . . . . . . . . . . . . . . . . . . . . . . . . . . . . .
EXPENDITURES (thousands)
11.0 1.35 8.3 13.6
Total . . . . . . . . . . . . . . . . . . . . . . . . . . . . . . . . . . . . . . . . . . . . . . . . . . 54,890,272 3,146,979 48,722,193 61,058,351 Trip–related, total . . . . . . . . . . . . . . . . . . . . . . . . . . . . . . . . . . . . . . 17,274,675 1,431,121 14,469,677 20,079,673 Food and lodging . . . . . . . . . . . . . . . . . . . . . . . . . . . . . . . . . . . . 9,349,439 822,822 7,736,707 10,962,171 Transportation . . . . . . . . . . . . . . . . . . . . . . . . . . . . . . . . . . . . . . . 6,006,860 505,292 5,016,488 6,997,232 Other trip costs . . . . . . . . . . . . . . . . . . . . . . . . . . . . . . . . . . . . . . 1,918,376 214,540 1,497,879 2,338,873
Equipment and other, total . . . . . . . . . . . . . . . . . . . . . . . . . . . . . . . 37,615,597 2,194,526 33,314,326 41,916,868 Equipment, total . . . . . . . . . . . . . . . . . . . . . . . . . . . . . . . . . . . . . 27,150,921 1,544,420 24,123,857 30,177,985 Wildlife watching equipment . . . . . . . . . . . . . . . . . . . . . . . . . 11,323,179 671,280 10,007,471 12,638,887 Auxiliary equipment . . . . . . . . . . . . . . . . . . . . . . . . . . . . . . . . 1,555,374 207,202 1,149,258 1,961,490 Special equipment . . . . . . . . . . . . . . . . . . . . . . . . . . . . . . . . . . 14,272,368 3,249,460 7,903,427 20,641,309
Other, total. . . . . . . . . . . . . . . . . . . . . . . . . . . . . . . . . . . . . . . . . . 10,464,677 739,717 9,014,832 11,914,522 Magazines, books, DVDs . . . . . . . . . . . . . . . . . . . . . . . . . . . . 420,395 43,842 334,465 506,325 Membership dues and contributions . . . . . . . . . . . . . . . . . . . . 2,163,568 227,318 1,718,024 2,609,112 Land leasing and ownership . . . . . . . . . . . . . . . . . . . . . . . . . . 5,676,794 1,723,393 2,298,943 9,054,645 Plantings . . . . . . . . . . . . . . . . . . . . . . . . . . . . . . . . . . . . . . . . . 2,203,920 254,626 1,704,853 2,702,987

U.S. Fish and Wildlife Service and U.S. Census Bureau 2011 National Survey of Fishing, Hunting, and Wildlife-Associated Recreation 155
Table D–5. Approximate Standard Errors and 95-Percent Confidence Interval for Participants in Wildlife-Related Recreation by Participant’s State of Residence: 2011(Numbers in thousands)
Participant’s state of residence Total participants Standard error Lower 95 percent Upper 95 percent
United States, total . . . . . . . . . . . . . . . . . . . . . . . . . . . . . . . . . . . . . . 90,108 1,310 87,541 92,675
Alabama . . . . . . . . . . . . . . . . . . . . . . . . . . . . . . . . . . . . . . . . . . . . . 1,490 174 1,149 1,831 Alaska . . . . . . . . . . . . . . . . . . . . . . . . . . . . . . . . . . . . . . . . . . . . . . . 337 23 292 382 Arizona . . . . . . . . . . . . . . . . . . . . . . . . . . . . . . . . . . . . . . . . . . . . . . 1,660 113 1,438 1,882 Arkansas . . . . . . . . . . . . . . . . . . . . . . . . . . . . . . . . . . . . . . . . . . . . . 1,119 91 941 1,297 California . . . . . . . . . . . . . . . . . . . . . . . . . . . . . . . . . . . . . . . . . . . . 7,360 378 6,620 8,100
Colorado . . . . . . . . . . . . . . . . . . . . . . . . . . . . . . . . . . . . . . . . . . . . . 1,854 118 1,622 2,086 Connecticut . . . . . . . . . . . . . . . . . . . . . . . . . . . . . . . . . . . . . . . . . . . 1,204 73 1,062 1,346 Delaware . . . . . . . . . . . . . . . . . . . . . . . . . . . . . . . . . . . . . . . . . . . . . 260 18 225 295 Florida . . . . . . . . . . . . . . . . . . . . . . . . . . . . . . . . . . . . . . . . . . . . . . . 4,652 274 4,115 5,189 Georgia . . . . . . . . . . . . . . . . . . . . . . . . . . . . . . . . . . . . . . . . . . . . . . 2,752 310 2,145 3,359
Hawaii . . . . . . . . . . . . . . . . . . . . . . . . . . . . . . . . . . . . . . . . . . . . . . . 222 18 188 256 Idaho . . . . . . . . . . . . . . . . . . . . . . . . . . . . . . . . . . . . . . . . . . . . . . . . 638 68 505 771 Illinois . . . . . . . . . . . . . . . . . . . . . . . . . . . . . . . . . . . . . . . . . . . . . . . 3,493 226 3,050 3,936 Indiana . . . . . . . . . . . . . . . . . . . . . . . . . . . . . . . . . . . . . . . . . . . . . . . 2,131 204 1,732 2,530 Iowa . . . . . . . . . . . . . . . . . . . . . . . . . . . . . . . . . . . . . . . . . . . . . . . . . 1,097 73 954 1,240
Kansas . . . . . . . . . . . . . . . . . . . . . . . . . . . . . . . . . . . . . . . . . . . . . . . 1,011 69 875 1,147 Kentucky . . . . . . . . . . . . . . . . . . . . . . . . . . . . . . . . . . . . . . . . . . . . . 1,470 130 1,216 1,724 Louisiana . . . . . . . . . . . . . . . . . . . . . . . . . . . . . . . . . . . . . . . . . . . . . 1,380 164 1,059 1,701 Maine . . . . . . . . . . . . . . . . . . . . . . . . . . . . . . . . . . . . . . . . . . . . . . . 520 45 431 609 Maryland . . . . . . . . . . . . . . . . . . . . . . . . . . . . . . . . . . . . . . . . . . . . . 1,396 93 1,213 1,579
Massachusetts . . . . . . . . . . . . . . . . . . . . . . . . . . . . . . . . . . . . . . . . . 1,779 106 1,571 1,987 Michigan . . . . . . . . . . . . . . . . . . . . . . . . . . . . . . . . . . . . . . . . . . . . 3,709 245 3,228 4,190 Minnesota . . . . . . . . . . . . . . . . . . . . . . . . . . . . . . . . . . . . . . . . . . . . 2,107 186 1,742 2,472 Mississippi . . . . . . . . . . . . . . . . . . . . . . . . . . . . . . . . . . . . . . . . . . . 1,017 101 819 1,215 Missouri . . . . . . . . . . . . . . . . . . . . . . . . . . . . . . . . . . . . . . . . . . . . . 2,105 135 1,841 2,369
Montana . . . . . . . . . . . . . . . . . . . . . . . . . . . . . . . . . . . . . . . . . . . . . 334 31 272 396 Nebraska . . . . . . . . . . . . . . . . . . . . . . . . . . . . . . . . . . . . . . . . . . . . . 499 42 416 582 Nevada . . . . . . . . . . . . . . . . . . . . . . . . . . . . . . . . . . . . . . . . . . . . . . 594 58 481 707 New Hampshire . . . . . . . . . . . . . . . . . . . . . . . . . . . . . . . . . . . . . . . 470 30 412 528 New Jersey . . . . . . . . . . . . . . . . . . . . . . . . . . . . . . . . . . . . . . . . . . . 2,057 113 1,835 2,279
New Mexico . . . . . . . . . . . . . . . . . . . . . . . . . . . . . . . . . . . . . . . . . . 592 53 487 697 New York . . . . . . . . . . . . . . . . . . . . . . . . . . . . . . . . . . . . . . . . . . . . 5,143 390 4,378 5,908 North Carolina . . . . . . . . . . . . . . . . . . . . . . . . . . . . . . . . . . . . . . . . 2,717 223 2,280 3,154 North Dakota . . . . . . . . . . . . . . . . . . . . . . . . . . . . . . . . . . . . . . . . . . (NA) (NA) (NA) (NA) Ohio. . . . . . . . . . . . . . . . . . . . . . . . . . . . . . . . . . . . . . . . . . . . . . . . . 4,078 261 3,567 4,589
Oklahoma . . . . . . . . . . . . . . . . . . . . . . . . . . . . . . . . . . . . . . . . . . . . 1,549 119 1,317 1,781 Oregon . . . . . . . . . . . . . . . . . . . . . . . . . . . . . . . . . . . . . . . . . . . . . . . 1,396 106 1,187 1,605 Pennsylvania . . . . . . . . . . . . . . . . . . . . . . . . . . . . . . . . . . . . . . . . . . 4,063 348 3,381 4,745 Rhode Island . . . . . . . . . . . . . . . . . . . . . . . . . . . . . . . . . . . . . . . . . . 309 18 274 344 South Carolina . . . . . . . . . . . . . . . . . . . . . . . . . . . . . . . . . . . . . . . . 1,299 123 1,059 1,539
South Dakota . . . . . . . . . . . . . . . . . . . . . . . . . . . . . . . . . . . . . . . . . . 371 43 287 455 Tennessee . . . . . . . . . . . . . . . . . . . . . . . . . . . . . . . . . . . . . . . . . . . . 2,121 162 1,803 2,439 Texas . . . . . . . . . . . . . . . . . . . . . . . . . . . . . . . . . . . . . . . . . . . . . . . . 5,888 404 5,097 6,679 Utah . . . . . . . . . . . . . . . . . . . . . . . . . . . . . . . . . . . . . . . . . . . . . . . . . 784 52 682 886 Vermont . . . . . . . . . . . . . . . . . . . . . . . . . . . . . . . . . . . . . . . . . . . . . . 316 22 273 359
Virginia . . . . . . . . . . . . . . . . . . . . . . . . . . . . . . . . . . . . . . . . . . . . . . 2,580 161 2,265 2,895 Washington . . . . . . . . . . . . . . . . . . . . . . . . . . . . . . . . . . . . . . . . . . . 2,311 156 2,005 2,617 West Virginia . . . . . . . . . . . . . . . . . . . . . . . . . . . . . . . . . . . . . . . . . . 868 95 683 1,053 Wisconsin . . . . . . . . . . . . . . . . . . . . . . . . . . . . . . . . . . . . . . . . . . . . 2,499 172 2,161 2,837 Wyoming . . . . . . . . . . . . . . . . . . . . . . . . . . . . . . . . . . . . . . . . . . . . . 250 18 215 285
(NA) Not available.

156 2011 National Survey of Fishing, Hunting, and Wildlife-Associated Recreation U.S. Fish and Wildlife Service and U.S. Census Bureau
Table D–6. Parameters a and b for Calculating Approximate Standard Errors of Sportspersons, Anglers, Hunters, and Wildlife-Watching Participants(These parameters are to be used only to calculate estimates of standard error s for characteristics developed from the screening sample)
State6 years old and older 6 to 15 years old only
a b a bUnited States, total . . . . . . . . . . . . . . . . . . . . . . . .
Alabama . . . . . . . . . . . . . . . . . . . . . . . . . . . . . . . Alaska . . . . . . . . . . . . . . . . . . . . . . . . . . . . . . . . . Arizona . . . . . . . . . . . . . . . . . . . . . . . . . . . . . . . . Arkansas . . . . . . . . . . . . . . . . . . . . . . . . . . . . . . . California . . . . . . . . . . . . . . . . . . . . . . . . . . . . . .
Colorado . . . . . . . . . . . . . . . . . . . . . . . . . . . . . . . Connecticut . . . . . . . . . . . . . . . . . . . . . . . . . . . . . Delaware . . . . . . . . . . . . . . . . . . . . . . . . . . . . . . . Florida . . . . . . . . . . . . . . . . . . . . . . . . . . . . . . . . . Georgia . . . . . . . . . . . . . . . . . . . . . . . . . . . . . . . .
Hawaii . . . . . . . . . . . . . . . . . . . . . . . . . . . . . . . . . Idaho . . . . . . . . . . . . . . . . . . . . . . . . . . . . . . . . . . Illinois . . . . . . . . . . . . . . . . . . . . . . . . . . . . . . . . . Indiana . . . . . . . . . . . . . . . . . . . . . . . . . . . . . . . . . Iowa . . . . . . . . . . . . . . . . . . . . . . . . . . . . . . . . . . .
Kansas . . . . . . . . . . . . . . . . . . . . . . . . . . . . . . . . . Kentucky . . . . . . . . . . . . . . . . . . . . . . . . . . . . . . . Louisiana . . . . . . . . . . . . . . . . . . . . . . . . . . . . . . . Maine . . . . . . . . . . . . . . . . . . . . . . . . . . . . . . . . . Maryland . . . . . . . . . . . . . . . . . . . . . . . . . . . . . . .
Massachusetts . . . . . . . . . . . . . . . . . . . . . . . . . . . Michigan . . . . . . . . . . . . . . . . . . . . . . . . . . . . . . . Minnesota . . . . . . . . . . . . . . . . . . . . . . . . . . . . . . Mississippi . . . . . . . . . . . . . . . . . . . . . . . . . . . . . Missouri . . . . . . . . . . . . . . . . . . . . . . . . . . . . . . .
Montana . . . . . . . . . . . . . . . . . . . . . . . . . . . . . . . Nebraska . . . . . . . . . . . . . . . . . . . . . . . . . . . . . . . Nevada . . . . . . . . . . . . . . . . . . . . . . . . . . . . . . . . New Hampshire . . . . . . . . . . . . . . . . . . . . . . . . . New Jersey . . . . . . . . . . . . . . . . . . . . . . . . . . . . .
New Mexico . . . . . . . . . . . . . . . . . . . . . . . . . . . . New York . . . . . . . . . . . . . . . . . . . . . . . . . . . . . . North Carolina . . . . . . . . . . . . . . . . . . . . . . . . . . North Dakota . . . . . . . . . . . . . . . . . . . . . . . . . . . . Ohio. . . . . . . . . . . . . . . . . . . . . . . . . . . . . . . . . . .
Oklahoma . . . . . . . . . . . . . . . . . . . . . . . . . . . . . . Oregon . . . . . . . . . . . . . . . . . . . . . . . . . . . . . . . . . Pennsylvania . . . . . . . . . . . . . . . . . . . . . . . . . . . . Rhode Island . . . . . . . . . . . . . . . . . . . . . . . . . . . . South Carolina . . . . . . . . . . . . . . . . . . . . . . . . . .
South Dakota . . . . . . . . . . . . . . . . . . . . . . . . . . . . Tennessee . . . . . . . . . . . . . . . . . . . . . . . . . . . . . . Texas . . . . . . . . . . . . . . . . . . . . . . . . . . . . . . . . . . Utah . . . . . . . . . . . . . . . . . . . . . . . . . . . . . . . . . . . Vermont . . . . . . . . . . . . . . . . . . . . . . . . . . . . . . . .
Virginia . . . . . . . . . . . . . . . . . . . . . . . . . . . . . . . . Washington . . . . . . . . . . . . . . . . . . . . . . . . . . . . . West Virginia . . . . . . . . . . . . . . . . . . . . . . . . . . . . Wisconsin . . . . . . . . . . . . . . . . . . . . . . . . . . . . . . Wyoming . . . . . . . . . . . . . . . . . . . . . . . . . . . . . . .
–0.000043
–0.001517–0.001275–0.000765–0.001766–0.000236
–0.000805–0.000429–0.000758–0.000354–0.000756
–0.000603–0.001708–0.000633–0.000849–0.000988
–0.001014–0.001476–0.000840–0.001824–0.000570
–0.000394–0.001153–0.001905–0.001191–0.000858
–0.001690–0.001546–0.000431–0.000920–0.000359
–0.000706–0.000416–0.000905
(NA)–0.000807
–0.001132–0.001359–0.000593–0.000308–0.000739
–0.001620–0.000730–0.000807–0.001050–0.001401
–0.000533–0.000640–0.001618–0.002449–0.002057
12,272
6,503795
4,6224,6477,936
3,7191,384
6146,0406,717
694
2,3897,4254,9512,714
2,5845,8023,4182,2102,976
2,406
10,4589,1663,1374,672
1,4182,5191,0291,1252,868
1,2947,4447,706 (NA)8,454
3,7724,8066,843
3003,060
1,1944,204
18,1782,638
811
3,8053,9382,714
12,6561,013
–0.000387
–0.009621–0.010120–0.003646–0.014655–0.002632
–0.006685–0.004817–0.009410–0.004700–0.003496
–0.007618–0.017208–0.005382–0.012557–0.008723
–0.009102–0.009316–0.014093–0.016808–0.008290
–0.003000–0.009872–0.015878–0.012208–0.004859
–0.015626–0.015670–0.007455–0.015100–0.003386
–0.006025–0.005818–0.008882
(NA)–0.006870
–0.008501–0.010991–0.005995–0.003287–0.005611
–0.034414–0.003532–0.004712–0.008515–0.014942
–0.004771–0.006644–0.015297–0.016762–0.029622
15,783
5,974986
3,4845,761
13,492
4,5082,1491,051
10,4004,981
1,1843,9049,348
10,9253,356
3,4995,1658,7442,4416,120
2,36512,62610,7495,0533,768
1,8163,8052,7392,3563,831
1,70313,95611,091 (NA)
10,159
4,2975,2269,017
4053,303
3,6432,887
18,1204,0561,003
4,8165,6913,266
11,8552,038
(NA) Not available.
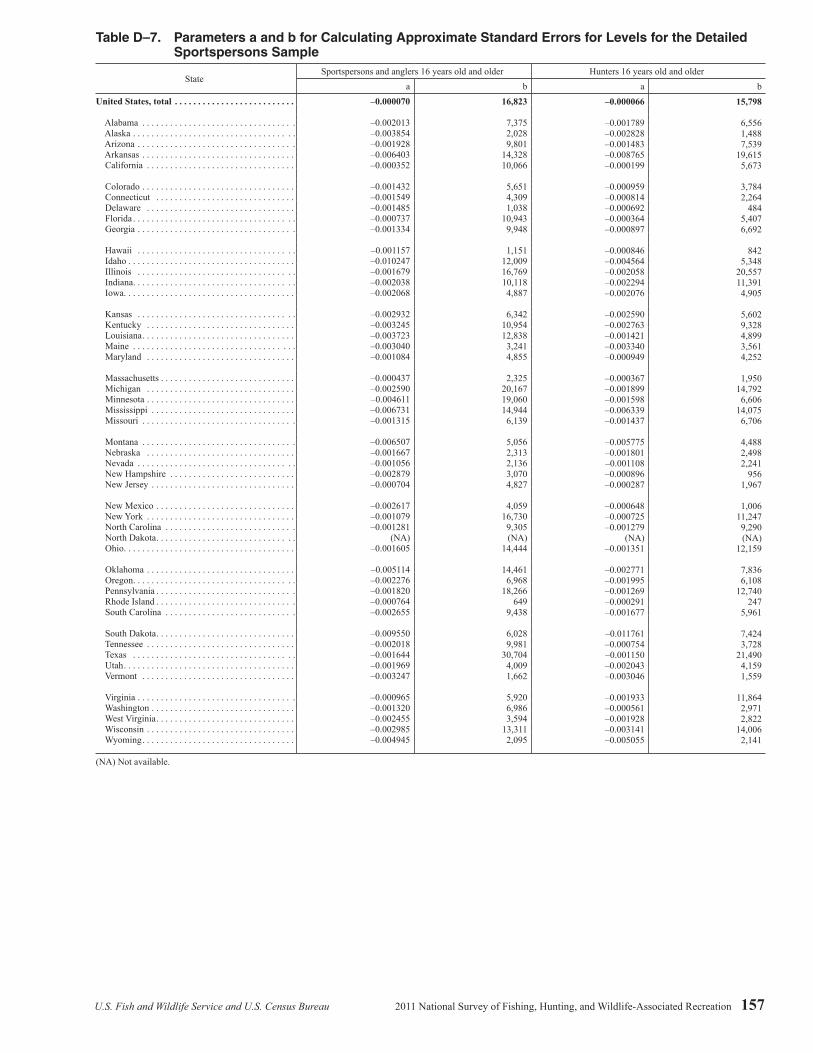
U.S. Fish and Wildlife Service and U.S. Census Bureau 2011 National Survey of Fishing, Hunting, and Wildlife-Associated Recreation 157
Table D–7.
Parameters a and b for Calculating Approximate Standard Errors for Levels for the Detailed Sportspersons Sample
StateSportspersons and anglers 16 years old and older Hunters 16 years old and older
a b a bUnited States, total . . . . . . . . . . . . . . . . . . . . . . . . . .
Alabama . . . . . . . . . . . . . . . . . . . . . . . . . . . . . . . . . Alaska . . . . . . . . . . . . . . . . . . . . . . . . . . . . . . . . . . . Arizona . . . . . . . . . . . . . . . . . . . . . . . . . . . . . . . . . . Arkansas . . . . . . . . . . . . . . . . . . . . . . . . . . . . . . . . . California . . . . . . . . . . . . . . . . . . . . . . . . . . . . . . . .
Colorado . . . . . . . . . . . . . . . . . . . . . . . . . . . . . . . . . Connecticut . . . . . . . . . . . . . . . . . . . . . . . . . . . . . . Delaware . . . . . . . . . . . . . . . . . . . . . . . . . . . . . . . . Florida . . . . . . . . . . . . . . . . . . . . . . . . . . . . . . . . . . . Georgia . . . . . . . . . . . . . . . . . . . . . . . . . . . . . . . . . .
Hawaii . . . . . . . . . . . . . . . . . . . . . . . . . . . . . . . . . . Idaho . . . . . . . . . . . . . . . . . . . . . . . . . . . . . . . . . . . . Illinois . . . . . . . . . . . . . . . . . . . . . . . . . . . . . . . . . . Indiana . . . . . . . . . . . . . . . . . . . . . . . . . . . . . . . . . . . Iowa . . . . . . . . . . . . . . . . . . . . . . . . . . . . . . . . . . . . .
Kansas . . . . . . . . . . . . . . . . . . . . . . . . . . . . . . . . . . Kentucky . . . . . . . . . . . . . . . . . . . . . . . . . . . . . . . . Louisiana . . . . . . . . . . . . . . . . . . . . . . . . . . . . . . . . . Maine . . . . . . . . . . . . . . . . . . . . . . . . . . . . . . . . . . . Maryland . . . . . . . . . . . . . . . . . . . . . . . . . . . . . . . .
Massachusetts . . . . . . . . . . . . . . . . . . . . . . . . . . . . . Michigan . . . . . . . . . . . . . . . . . . . . . . . . . . . . . . . . Minnesota . . . . . . . . . . . . . . . . . . . . . . . . . . . . . . . . Mississippi . . . . . . . . . . . . . . . . . . . . . . . . . . . . . . . Missouri . . . . . . . . . . . . . . . . . . . . . . . . . . . . . . . . .
Montana . . . . . . . . . . . . . . . . . . . . . . . . . . . . . . . . . Nebraska . . . . . . . . . . . . . . . . . . . . . . . . . . . . . . . . Nevada . . . . . . . . . . . . . . . . . . . . . . . . . . . . . . . . . . New Hampshire . . . . . . . . . . . . . . . . . . . . . . . . . . . New Jersey . . . . . . . . . . . . . . . . . . . . . . . . . . . . . . .
New Mexico . . . . . . . . . . . . . . . . . . . . . . . . . . . . . . New York . . . . . . . . . . . . . . . . . . . . . . . . . . . . . . . . North Carolina . . . . . . . . . . . . . . . . . . . . . . . . . . . . North Dakota . . . . . . . . . . . . . . . . . . . . . . . . . . . . . . Ohio. . . . . . . . . . . . . . . . . . . . . . . . . . . . . . . . . . . . .
Oklahoma . . . . . . . . . . . . . . . . . . . . . . . . . . . . . . . . Oregon . . . . . . . . . . . . . . . . . . . . . . . . . . . . . . . . . . . Pennsylvania . . . . . . . . . . . . . . . . . . . . . . . . . . . . . . Rhode Island . . . . . . . . . . . . . . . . . . . . . . . . . . . . . . South Carolina . . . . . . . . . . . . . . . . . . . . . . . . . . . .
South Dakota . . . . . . . . . . . . . . . . . . . . . . . . . . . . . . Tennessee . . . . . . . . . . . . . . . . . . . . . . . . . . . . . . . . Texas . . . . . . . . . . . . . . . . . . . . . . . . . . . . . . . . . . . Utah . . . . . . . . . . . . . . . . . . . . . . . . . . . . . . . . . . . . . Vermont . . . . . . . . . . . . . . . . . . . . . . . . . . . . . . . . .
Virginia . . . . . . . . . . . . . . . . . . . . . . . . . . . . . . . . . . Washington . . . . . . . . . . . . . . . . . . . . . . . . . . . . . . . West Virginia . . . . . . . . . . . . . . . . . . . . . . . . . . . . . . Wisconsin . . . . . . . . . . . . . . . . . . . . . . . . . . . . . . . . Wyoming . . . . . . . . . . . . . . . . . . . . . . . . . . . . . . . . .
–0.000070
–0.002013–0.003854–0.001928–0.006403–0.000352
–0.001432–0.001549–0.001485–0.000737–0.001334
–0.001157–0.010247–0.001679–0.002038–0.002068
–0.002932–0.003245–0.003723–0.003040–0.001084
–0.000437–0.002590–0.004611–0.006731–0.001315
–0.006507–0.001667–0.001056–0.002879–0.000704
–0.002617–0.001079–0.001281
(NA)–0.001605
–0.005114–0.002276–0.001820–0.000764–0.002655
–0.009550–0.002018–0.001644–0.001969–0.003247
–0.000965–0.001320–0.002455–0.002985–0.004945
16,823
7,3752,0289,801
14,32810,066
5,6514,3091,038
10,9439,948
1,151
12,00916,76910,1184,887
6,342
10,95412,8383,2414,855
2,325
20,16719,06014,9446,139
5,0562,3132,1363,0704,827
4,059
16,7309,305 (NA)
14,444
14,4616,968
18,266649
9,438
6,0289,981
30,7044,0091,662
5,9206,9863,594
13,3112,095
–0.000066
–0.001789–0.002828–0.001483–0.008765–0.000199
–0.000959–0.000814–0.000692–0.000364–0.000897
–0.000846–0.004564–0.002058–0.002294–0.002076
–0.002590–0.002763–0.001421–0.003340–0.000949
–0.000367–0.001899–0.001598–0.006339–0.001437
–0.005775–0.001801–0.001108–0.000896–0.000287
–0.000648–0.000725–0.001279
(NA)–0.001351
–0.002771–0.001995–0.001269–0.000291–0.001677
–0.011761–0.000754–0.001150–0.002043–0.003046
–0.001933–0.000561–0.001928–0.003141–0.005055
15,798
6,5561,4887,539
19,6155,673
3,7842,264
4845,4076,692
8425,348
20,55711,3914,905
5,6029,3284,8993,5614,252
1,95014,7926,606
14,0756,706
4,4882,4982,241
9561,967
1,00611,2479,290 (NA)
12,159
7,8366,108
12,740247
5,961
7,4243,728
21,4904,1591,559
11,8642,9712,822
14,0062,141
(NA) Not available.

158 2011 National Survey of Fishing, Hunting, and Wildlife-Associated Recreation U.S. Fish and Wildlife Service and U.S. Census Bureau
Table D–8.
Parameters a, b, and c for Calculating Approximate Standard Errors for Expenditures for the Detailed Sportspersons Sample
StateSportspersons and anglers 16 years old and older Hunters 16 years old and older
a b c a b cUnited States, total . . . . . . . . . . . . . . . . . . . . . . . . . . . . . .
Alabama . . . . . . . . . . . . . . . . . . . . . . . . . . . . . . . . . . . . . Alaska . . . . . . . . . . . . . . . . . . . . . . . . . . . . . . . . . . . . . . . Arizona . . . . . . . . . . . . . . . . . . . . . . . . . . . . . . . . . . . . . . Arkansas . . . . . . . . . . . . . . . . . . . . . . . . . . . . . . . . . . . . . California . . . . . . . . . . . . . . . . . . . . . . . . . . . . . . . . . . . .
Colorado . . . . . . . . . . . . . . . . . . . . . . . . . . . . . . . . . . . . . Connecticut . . . . . . . . . . . . . . . . . . . . . . . . . . . . . . . . . . . Delaware . . . . . . . . . . . . . . . . . . . . . . . . . . . . . . . . . . . . Florida . . . . . . . . . . . . . . . . . . . . . . . . . . . . . . . . . . . . . . . Georgia . . . . . . . . . . . . . . . . . . . . . . . . . . . . . . . . . . . . . .
Hawaii . . . . . . . . . . . . . . . . . . . . . . . . . . . . . . . . . . . . . . . Idaho . . . . . . . . . . . . . . . . . . . . . . . . . . . . . . . . . . . . . . . . Illinois . . . . . . . . . . . . . . . . . . . . . . . . . . . . . . . . . . . . . . . Indiana . . . . . . . . . . . . . . . . . . . . . . . . . . . . . . . . . . . . . . . Iowa . . . . . . . . . . . . . . . . . . . . . . . . . . . . . . . . . . . . . . . . .
Kansas . . . . . . . . . . . . . . . . . . . . . . . . . . . . . . . . . . . . . . . Kentucky . . . . . . . . . . . . . . . . . . . . . . . . . . . . . . . . . . . . . Louisiana . . . . . . . . . . . . . . . . . . . . . . . . . . . . . . . . . . . . . Maine . . . . . . . . . . . . . . . . . . . . . . . . . . . . . . . . . . . . . . . Maryland . . . . . . . . . . . . . . . . . . . . . . . . . . . . . . . . . . . . .
Massachusetts . . . . . . . . . . . . . . . . . . . . . . . . . . . . . . . . . Michigan . . . . . . . . . . . . . . . . . . . . . . . . . . . . . . . . . . . . . Minnesota . . . . . . . . . . . . . . . . . . . . . . . . . . . . . . . . . . . . Mississippi . . . . . . . . . . . . . . . . . . . . . . . . . . . . . . . . . . . Missouri . . . . . . . . . . . . . . . . . . . . . . . . . . . . . . . . . . . . .
Montana . . . . . . . . . . . . . . . . . . . . . . . . . . . . . . . . . . . . . Nebraska . . . . . . . . . . . . . . . . . . . . . . . . . . . . . . . . . . . . . Nevada . . . . . . . . . . . . . . . . . . . . . . . . . . . . . . . . . . . . . . New Hampshire . . . . . . . . . . . . . . . . . . . . . . . . . . . . . . . New Jersey . . . . . . . . . . . . . . . . . . . . . . . . . . . . . . . . . . .
New Mexico . . . . . . . . . . . . . . . . . . . . . . . . . . . . . . . . . . New York . . . . . . . . . . . . . . . . . . . . . . . . . . . . . . . . . . . . North Carolina . . . . . . . . . . . . . . . . . . . . . . . . . . . . . . . . North Dakota . . . . . . . . . . . . . . . . . . . . . . . . . . . . . . . . . . Ohio. . . . . . . . . . . . . . . . . . . . . . . . . . . . . . . . . . . . . . . . .
Oklahoma . . . . . . . . . . . . . . . . . . . . . . . . . . . . . . . . . . . . Oregon . . . . . . . . . . . . . . . . . . . . . . . . . . . . . . . . . . . . . . . Pennsylvania . . . . . . . . . . . . . . . . . . . . . . . . . . . . . . . . . . Rhode Island . . . . . . . . . . . . . . . . . . . . . . . . . . . . . . . . . . South Carolina . . . . . . . . . . . . . . . . . . . . . . . . . . . . . . . .
South Dakota . . . . . . . . . . . . . . . . . . . . . . . . . . . . . . . . . Tennessee . . . . . . . . . . . . . . . . . . . . . . . . . . . . . . . . . . . . Texas . . . . . . . . . . . . . . . . . . . . . . . . . . . . . . . . . . . . . . . . Utah . . . . . . . . . . . . . . . . . . . . . . . . . . . . . . . . . . . . . . . . Vermont . . . . . . . . . . . . . . . . . . . . . . . . . . . . . . . . . . . . .
Virginia . . . . . . . . . . . . . . . . . . . . . . . . . . . . . . . . . . . . . . Washington . . . . . . . . . . . . . . . . . . . . . . . . . . . . . . . . . . . West Virginia . . . . . . . . . . . . . . . . . . . . . . . . . . . . . . . . . Wisconsin . . . . . . . . . . . . . . . . . . . . . . . . . . . . . . . . . . . . Wyoming . . . . . . . . . . . . . . . . . . . . . . . . . . . . . . . . . . . .
0.001159
0.0219180.0687210.0722040.1905120.041958
0.0387670.0629630.1381010.0311250.133758
0.0992710.1978160.0160860.0844080.110741
0.1192620.0322910.1255430.0731330.069557
0.0411240.0719880.0560480.1434950.027623
0.1786110.1004590.0404280.1274970.027546
0.0360520.1523420.029116
(NA)0.128010
0.0984270.0105680.0398410.0775960.180012
0.1142480.0518840.0492440.0633660.271264
0.0345900.0679520.1735830.0456140.037366
–575,615
–163,227–3,823
–64,996–51,366323,332
15,704
–54,211–7,091
129,668–35,054
–1,810–5,230
–95,43056,304–6,756
–8,287
–262,90772,794
–64,912–8,036
13,503
–130,103–43,079–50,131–7,268
–16,817–1,618
–34,2306,106
11,544
–17,835–343,859–209,241
(NA)–37,131
–170,608
7,416–43,889
–203.9579–120,717
–43,160–61,213–64,415–20,537–10,725
–93,405
22,119–44,746
–215,022–31,308
45,670
21,1972,7657,7135,554
11,979
8,9316,2501,280
13,98010,761
905
3,80623,6617,2935,107
3,770
19,6934,6574,6857,163
3,733
28,40417,1128,984
10,503
2,6222,5512,9622,3836,195
4,123
17,85418,945 (NA)
20,232
14,3079,002
24,057657
6,857
4,68315,30642,1774,2661,629
11,6487,1694,014
29,1922,986
0.001923
0.0262370.0868850.1126680.2082690.056429
0.0804460.1564230.2064800.0444160.180457
0.1542100.2167780.0594220.1131150.110417
0.1304580.0503360.1233530.1330090.119862
0.0925550.0262670.0645080.1464860.066759
0.1052630.1198720.1414570.1767490.036515
0.1475090.2096650.064157
(NA)0.216544
0.2760270.0112360.0378300.1102300.181351
0.1025060.0733350.0772280.0662380.339375
0.0371340.0800420.1173660.0571070.032006
–978,460
–310,700–80,157
32,7113,305
1,177,647
–49,174–403,680
–291–273,423–30,025
–1,865
170,971–369,151
42,035–42,038
–38,144
–549,944–129,712–24,957–92,688
–231
–153,883–189,054
14,053–24,068
–209,610–19,296
–114,26014,447
–45,032
–35,750–176,671–163,564
(NA)–1,019,186
126,33296,792
–316,859–39,344–87,421
–203,831–522,076–819,919
–2,994–128,675
–222,277–119,224–52,107164,685–10,196
44,416
20,6182,5874,5124,9586,717
5,3704,065
82313,7869,196
677
2,33914,4965,3786,849
4,212
21,0146,0862,6026,155
2,727
33,79415,9758,0978,944
3,8012,7851,9681,4436,045
2,313
10,91113,190 (NA)
18,675
2,1017,900
27,692696
5,445
6,35517,76050,8734,2931,810
13,0836,6874,868
22,4833,038
(NA) Not available.
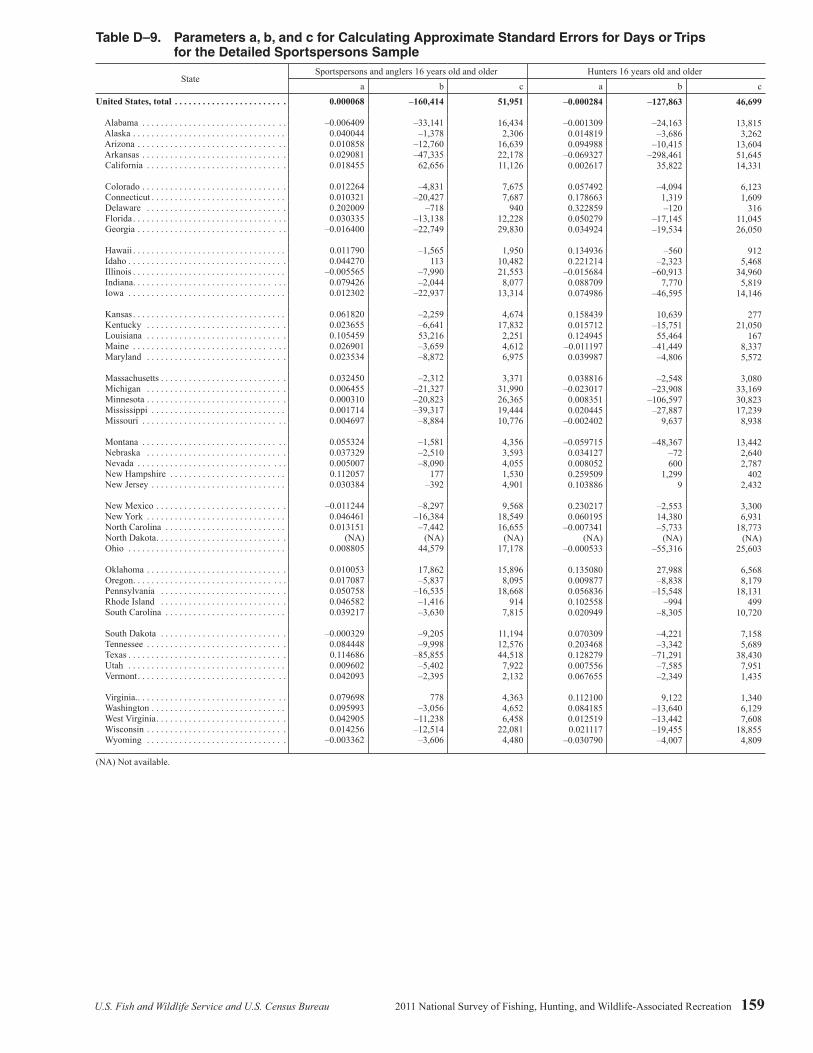
U.S. Fish and Wildlife Service and U.S. Census Bureau 2011 National Survey of Fishing, Hunting, and Wildlife-Associated Recreation 159
Table D–9.
Parameters a, b, and c for Calculating Approximate Standard Errors for Days or Trips for the Detailed Sportspersons Sample
State Sportspersons and anglers 16 years old and older Hunters 16 years old and older
a b c a b cUnited States, total . . . . . . . . . . . . . . . . . . . . . . . .
Alabama . . . . . . . . . . . . . . . . . . . . . . . . . . . . . . . Alaska . . . . . . . . . . . . . . . . . . . . . . . . . . . . . . . . . Arizona . . . . . . . . . . . . . . . . . . . . . . . . . . . . . . . . Arkansas . . . . . . . . . . . . . . . . . . . . . . . . . . . . . . . California . . . . . . . . . . . . . . . . . . . . . . . . . . . . . .
Colorado . . . . . . . . . . . . . . . . . . . . . . . . . . . . . . . Connecticut . . . . . . . . . . . . . . . . . . . . . . . . . . . . . Delaware . . . . . . . . . . . . . . . . . . . . . . . . . . . . . . Florida . . . . . . . . . . . . . . . . . . . . . . . . . . . . . . . . . Georgia . . . . . . . . . . . . . . . . . . . . . . . . . . . . . . . .
Hawaii . . . . . . . . . . . . . . . . . . . . . . . . . . . . . . . . . Idaho . . . . . . . . . . . . . . . . . . . . . . . . . . . . . . . . . . Illinois . . . . . . . . . . . . . . . . . . . . . . . . . . . . . . . . . Indiana. . . . . . . . . . . . . . . . . . . . . . . . . . . . . . . . . Iowa . . . . . . . . . . . . . . . . . . . . . . . . . . . . . . . . . .
Kansas . . . . . . . . . . . . . . . . . . . . . . . . . . . . . . . . . Kentucky . . . . . . . . . . . . . . . . . . . . . . . . . . . . . . Louisiana . . . . . . . . . . . . . . . . . . . . . . . . . . . . . . Maine . . . . . . . . . . . . . . . . . . . . . . . . . . . . . . . . . Maryland . . . . . . . . . . . . . . . . . . . . . . . . . . . . . .
Massachusetts . . . . . . . . . . . . . . . . . . . . . . . . . . . Michigan . . . . . . . . . . . . . . . . . . . . . . . . . . . . . . Minnesota . . . . . . . . . . . . . . . . . . . . . . . . . . . . . . Mississippi . . . . . . . . . . . . . . . . . . . . . . . . . . . . . Missouri . . . . . . . . . . . . . . . . . . . . . . . . . . . . . . .
Montana . . . . . . . . . . . . . . . . . . . . . . . . . . . . . . . Nebraska . . . . . . . . . . . . . . . . . . . . . . . . . . . . . . Nevada . . . . . . . . . . . . . . . . . . . . . . . . . . . . . . . . New Hampshire . . . . . . . . . . . . . . . . . . . . . . . . . New Jersey . . . . . . . . . . . . . . . . . . . . . . . . . . . . .
New Mexico . . . . . . . . . . . . . . . . . . . . . . . . . . . . New York . . . . . . . . . . . . . . . . . . . . . . . . . . . . . . North Carolina . . . . . . . . . . . . . . . . . . . . . . . . . . North Dakota . . . . . . . . . . . . . . . . . . . . . . . . . . . . Ohio . . . . . . . . . . . . . . . . . . . . . . . . . . . . . . . . . .
Oklahoma . . . . . . . . . . . . . . . . . . . . . . . . . . . . . . Oregon . . . . . . . . . . . . . . . . . . . . . . . . . . . . . . . . . Pennsylvania . . . . . . . . . . . . . . . . . . . . . . . . . . . Rhode Island . . . . . . . . . . . . . . . . . . . . . . . . . . . South Carolina . . . . . . . . . . . . . . . . . . . . . . . . . .
South Dakota . . . . . . . . . . . . . . . . . . . . . . . . . . . Tennessee . . . . . . . . . . . . . . . . . . . . . . . . . . . . . . Texas . . . . . . . . . . . . . . . . . . . . . . . . . . . . . . . . . . Utah . . . . . . . . . . . . . . . . . . . . . . . . . . . . . . . . . . Vermont . . . . . . . . . . . . . . . . . . . . . . . . . . . . . . . .
Virginia. . . . . . . . . . . . . . . . . . . . . . . . . . . . . . . . . Washington . . . . . . . . . . . . . . . . . . . . . . . . . . . . . West Virginia . . . . . . . . . . . . . . . . . . . . . . . . . . . . Wisconsin . . . . . . . . . . . . . . . . . . . . . . . . . . . . . . Wyoming . . . . . . . . . . . . . . . . . . . . . . . . . . . . . .
0.000068
–0.0064090.0400440.0108580.0290810.018455
0.0122640.0103210.2020090.030335
–0.016400
0.0117900.044270
–0.0055650.0794260.012302
0.0618200.0236550.1054590.0269010.023534
0.0324500.0064550.0003100.0017140.004697
0.0553240.0373290.0050070.1120570.030384
–0.0112440.0464610.013151
(NA)0.008805
0.0100530.0170870.0507580.0465820.039217
–0.0003290.0844480.1146860.0096020.042093
0.0796980.0959930.0429050.014256
–0.003362
–160,414
–33,141–1,378
–12,760–47,33562,656
–4,831
–20,427–718
–13,138–22,749
–1,565
113–7,990–2,044
–22,937
–2,259–6,64153,216–3,659–8,872
–2,312
–21,327–20,823–39,317–8,884
–1,581–2,510–8,090
177–392
–8,297
–16,384–7,442 (NA)
44,579
17,862–5,837
–16,535–1,416–3,630
–9,205–9,998
–85,855–5,402–2,395
778
–3,056–11,238–12,514–3,606
51,951
16,4342,306
16,63922,17811,126
7,6757,687
94012,22829,830
1,950
10,48221,5538,077
13,314
4,67417,8322,2514,6126,975
3,371
31,99026,36519,44410,776
4,3563,5934,0551,5304,901
9,568
18,54916,655 (NA)
17,178
15,8968,095
18,668914
7,815
11,19412,57644,5187,9222,132
4,3634,6526,458
22,0814,480
–0.000284
–0.0013090.0148190.094988
–0.0693270.002617
0.0574920.1786630.3228590.0502790.034924
0.1349360.221214
–0.0156840.0887090.074986
0.1584390.0157120.124945
–0.0111970.039987
0.038816
–0.0230170.0083510.020445
–0.002402
–0.0597150.0341270.0080520.2595090.103886
0.2302170.060195
–0.007341 (NA)
–0.000533
0.1350800.0098770.0568360.1025580.020949
0.0703090.2034680.1282790.0075560.067655
0.1121000.0841850.0125190.021117
–0.030790
–127,863
–24,163–3,686
–10,415–298,461
35,822
–4,0941,319–120
–17,145–19,534
–560
–2,323–60,913
7,770–46,595
10,639
–15,75155,464
–41,449–4,806
–2,548
–23,908–106,597–27,887
9,637
–48,367–72600
1,2999
–2,55314,380–5,733 (NA)
–55,316
27,988–8,838
–15,548–994
–8,305
–4,221–3,342
–71,291–7,585–2,349
9,122
–13,640–13,442–19,455–4,007
46,699
13,8153,262
13,60451,64514,331
6,1231,609
31611,04526,050
9125,468
34,9605,819
14,146
27721,050
1678,3375,572
3,08033,16930,82317,2398,938
13,4422,6402,787
4022,432
3,3006,931
18,773 (NA)
25,603
6,5688,179
18,131499
10,720
7,1585,689
38,4307,9511,435
1,3406,1297,608
18,8554,809
(NA) Not available.

160 2011 National Survey of Fishing, Hunting, and Wildlife-Associated Recreation U.S. Fish and Wildlife Service and U.S. Census Bureau
Table D–10.
Parameters a and b for Calculating Approximate Standard Errors for Levels of Wildlife-Watching Participants for the Detailed Wildlife-Watching Sample
State Away–from–home participants Wildlife–watching participants1
a b a bUnited States, total . . . . . . . . . . . . . . . . . . . . . . . . . . . . . . . . . .
Alabama . . . . . . . . . . . . . . . . . . . . . . . . . . . . . . . . . . . . . . . . . Alaska . . . . . . . . . . . . . . . . . . . . . . . . . . . . . . . . . . . . . . . . . . . Arizona . . . . . . . . . . . . . . . . . . . . . . . . . . . . . . . . . . . . . . . . . . Arkansas . . . . . . . . . . . . . . . . . . . . . . . . . . . . . . . . . . . . . . . . . California . . . . . . . . . . . . . . . . . . . . . . . . . . . . . . . . . . . . . . . .
Colorado . . . . . . . . . . . . . . . . . . . . . . . . . . . . . . . . . . . . . . . . . Connecticut . . . . . . . . . . . . . . . . . . . . . . . . . . . . . . . . . . . . . . . Delaware . . . . . . . . . . . . . . . . . . . . . . . . . . . . . . . . . . . . . . . . . Florida . . . . . . . . . . . . . . . . . . . . . . . . . . . . . . . . . . . . . . . . . . . Georgia . . . . . . . . . . . . . . . . . . . . . . . . . . . . . . . . . . . . . . . . . .
Hawaii . . . . . . . . . . . . . . . . . . . . . . . . . . . . . . . . . . . . . . . . . . . Idaho . . . . . . . . . . . . . . . . . . . . . . . . . . . . . . . . . . . . . . . . . . . . Illinois . . . . . . . . . . . . . . . . . . . . . . . . . . . . . . . . . . . . . . . . . . . Indiana . . . . . . . . . . . . . . . . . . . . . . . . . . . . . . . . . . . . . . . . . . . Iowa . . . . . . . . . . . . . . . . . . . . . . . . . . . . . . . . . . . . . . . . . . . . .
Kansas . . . . . . . . . . . . . . . . . . . . . . . . . . . . . . . . . . . . . . . . . . . Kentucky . . . . . . . . . . . . . . . . . . . . . . . . . . . . . . . . . . . . . . . . . Louisiana . . . . . . . . . . . . . . . . . . . . . . . . . . . . . . . . . . . . . . . . . Maine . . . . . . . . . . . . . . . . . . . . . . . . . . . . . . . . . . . . . . . . . . . Maryland . . . . . . . . . . . . . . . . . . . . . . . . . . . . . . . . . . . . . . . . .
Massachusetts . . . . . . . . . . . . . . . . . . . . . . . . . . . . . . . . . . . . . Michigan . . . . . . . . . . . . . . . . . . . . . . . . . . . . . . . . . . . . . . . . . Minnesota . . . . . . . . . . . . . . . . . . . . . . . . . . . . . . . . . . . . . . . . Mississippi . . . . . . . . . . . . . . . . . . . . . . . . . . . . . . . . . . . . . . . Missouri . . . . . . . . . . . . . . . . . . . . . . . . . . . . . . . . . . . . . . . . .
Montana . . . . . . . . . . . . . . . . . . . . . . . . . . . . . . . . . . . . . . . . . Nebraska . . . . . . . . . . . . . . . . . . . . . . . . . . . . . . . . . . . . . . . . . Nevada . . . . . . . . . . . . . . . . . . . . . . . . . . . . . . . . . . . . . . . . . . New Hampshire . . . . . . . . . . . . . . . . . . . . . . . . . . . . . . . . . . . New Jersey . . . . . . . . . . . . . . . . . . . . . . . . . . . . . . . . . . . . . . .
New Mexico . . . . . . . . . . . . . . . . . . . . . . . . . . . . . . . . . . . . . . New York . . . . . . . . . . . . . . . . . . . . . . . . . . . . . . . . . . . . . . . . North Carolina . . . . . . . . . . . . . . . . . . . . . . . . . . . . . . . . . . . . North Dakota . . . . . . . . . . . . . . . . . . . . . . . . . . . . . . . . . . . . . . Ohio. . . . . . . . . . . . . . . . . . . . . . . . . . . . . . . . . . . . . . . . . . . . .
Oklahoma . . . . . . . . . . . . . . . . . . . . . . . . . . . . . . . . . . . . . . . . Oregon . . . . . . . . . . . . . . . . . . . . . . . . . . . . . . . . . . . . . . . . . . . Pennsylvania . . . . . . . . . . . . . . . . . . . . . . . . . . . . . . . . . . . . . . Rhode Island . . . . . . . . . . . . . . . . . . . . . . . . . . . . . . . . . . . . . . South Carolina . . . . . . . . . . . . . . . . . . . . . . . . . . . . . . . . . . . .
South Dakota . . . . . . . . . . . . . . . . . . . . . . . . . . . . . . . . . . . . . . Tennessee . . . . . . . . . . . . . . . . . . . . . . . . . . . . . . . . . . . . . . . . Texas . . . . . . . . . . . . . . . . . . . . . . . . . . . . . . . . . . . . . . . . . . . . Utah . . . . . . . . . . . . . . . . . . . . . . . . . . . . . . . . . . . . . . . . . . . . . Vermont . . . . . . . . . . . . . . . . . . . . . . . . . . . . . . . . . . . . . . . . . .
Virginia . . . . . . . . . . . . . . . . . . . . . . . . . . . . . . . . . . . . . . . . . . Washington . . . . . . . . . . . . . . . . . . . . . . . . . . . . . . . . . . . . . . . West Virginia . . . . . . . . . . . . . . . . . . . . . . . . . . . . . . . . . . . . . . Wisconsin . . . . . . . . . . . . . . . . . . . . . . . . . . . . . . . . . . . . . . . . Wyoming . . . . . . . . . . . . . . . . . . . . . . . . . . . . . . . . . . . . . . . . .
–0.000134
–0.003523–0.004221–0.001319–0.003939–0.000739
–0.003019–0.002392–0.001438–0.001411–0.003335
–0.002051–0.007948–0.001219–0.002020–0.003386
–0.003728–0.002201–0.001619–0.003739–0.000762
–0.001036–0.003032–0.005468–0.005131–0.002842
–0.004110–0.003608–0.005369–0.002275–0.000795
–0.003021–0.002450–0.003857
(NA)–0.001006
–0.001850–0.002304–0.003639–0.001580–0.004536
–0.002833–0.007450–0.001436–0.002560–0.007044
–0.002247–0.004645–0.019113–0.004020–0.003576
32,078
12,9082,2216,7038,814
21,116
11,9136,6531,005
20,95624,875
2,0419,315
12,17210,0308,000
8,0647,4315,5823,9863,414
5,512
23,61022,60311,39313,264
3,1945,004
10,8652,4255,449
4,686
37,97528,014 (NA)9,055
5,2307,055
36,5191,340
16,126
1,78836,84026,817
5,2113,605
13,78724,58527,98117,9261,515
–0.000119
–0.009869–0.005350–0.001925–0.003938–0.000937
–0.003309–0.002609–0.002547–0.001591–0.007832
–0.001805–0.008539–0.001994–0.006775–0.003220
–0.003222–0.005428–0.009544–0.006455–0.001982
–0.001839–0.003331–0.006274–0.005454–0.003139
–0.004772–0.004078–0.004111–0.002428–0.001272
–0.004748–0.002910–0.004098
(NA)–0.003043
–0.005081–0.004554–0.004874–0.001829–0.004877
–0.013684–0.004097–0.001909–0.002329–0.006399
–0.002743–0.003371–0.015998–0.005124–0.004694
28,477
36,1632,8159,7878,814
26,764
13,0577,2561,780
23,63458,421
1,79710,00619,91633,6377,607
6,96918,32732,9146,8818,879
9,78325,94025,93412,11014,653
3,7085,6568,3192,5898,715
7,36445,11429,769 (NA)
27,382
14,36713,94248,9141,552
17,337
8,63820,26035,6574,7413,275
16,82817,84623,42122,8511,988
(NA) Not available1 Use these parameters for total wildlife-watching participants and around-the-home participants.

U.S. Fish and Wildlife Service and U.S. Census Bureau 2011 National Survey of Fishing, Hunting, and Wildlife-Associated Recreation 161
Table D–11.
Parameters a, b, and c for Calculating Approximate Standard Errors for Expenditures and Days or Trips for Wildlife-Watching Sample
StateExpenditures Days or trips
a b c a b cUnited States, total . . . . . . . . . . . . . . . . . . . . . . . . . . . . . ..
Alabama . . . . . . . . . . . . . . . . . . . . . . . . . . . . . . . . . . . . . Alaska . . . . . . . . . . . . . . . . . . . . . . . . . . . . . . . . . . . . . . . Arizona . . . . . . . . . . . . . . . . . . . . . . . . . . . . . . . . . . . . . . Arkansas . . . . . . . . . . . . . . . . . . . . . . . . . . . . . . . . . . . . .. California . . . . . . . . . . . . . . . . . . . . . . . . . . . . . . . . . . . .
Colorado . . . . . . . . . . . . . . . . . . . . . . . . . . . . . . . . . . . . .. Connecticut . . . . . . . . . . . . . . . . . . . . . . . . . . . . . . . . . . . Delaware . . . . . . . . . . . . . . . . . . . . . . . . . . . . . . . . . . . . . Florida . . . . . . . . . . . . . . . . . . . . . . . . . . . . . . . . . . . . . . . Georgia . . . . . . . . . . . . . . . . . . . . . . . . . . . . . . . . . . . . . .
Hawaii . . . . . . . . . . . . . . . . . . . . . . . . . . . . . . . . . . . . . . . Idaho . . . . . . . . . . . . . . . . . . . . . . . . . . . . . . . . . . . . . . . .. Illinois . . . . . . . . . . . . . . . . . . . . . . . . . . . . . . . . . . . . . . . Indiana . . . . . . . . . . . . . . . . . . . . . . . . . . . . . . . . . . . . . . . Iowa . . . . . . . . . . . . . . . . . . . . . . . . . . . . . . . . . . . . . . . . .
Kansas . . . . . . . . . . . . . . . . . . . . . . . . . . . . . . . . . . . . . . . Kentucky . . . . . . . . . . . . . . . . . . . . . . . . . . . . . . . . . . . . . Louisiana . . . . . . . . . . . . . . . . . . . . . . . . . . . . . . . . . . . . . Maine . . . . . . . . . . . . . . . . . . . . . . . . . . . . . . . . . . . . . . . Maryland . . . . . . . . . . . . . . . . . . . . . . . . . . . . . . . . . . . .
Massachusetts . . . . . . . . . . . . . . . . . . . . . . . . . . . . . . . . .. Michigan . . . . . . . . . . . . . . . . . . . . . . . . . . . . . . . . . . . . . Minnesota . . . . . . . . . . . . . . . . . . . . . . . . . . . . . . . . . . . . Mississippi . . . . . . . . . . . . . . . . . . . . . . . . . . . . . . . . . . . Missouri . . . . . . . . . . . . . . . . . . . . . . . . . . . . . . . . . . . . .
Montana . . . . . . . . . . . . . . . . . . . . . . . . . . . . . . . . . . . . . Nebraska . . . . . . . . . . . . . . . . . . . . . . . . . . . . . . . . . . . . . Nevada . . . . . . . . . . . . . . . . . . . . . . . . . . . . . . . . . . . . . . New Hampshire . . . . . . . . . . . . . . . . . . . . . . . . . . . . . . . New Jersey . . . . . . . . . . . . . . . . . . . . . . . . . . . . . . . . . . .
New Mexico . . . . . . . . . . . . . . . . . . . . . . . . . . . . . . . . . . New York . . . . . . . . . . . . . . . . . . . . . . . . . . . . . . . . . . . . North Carolina . . . . . . . . . . . . . . . . . . . . . . . . . . . . . . . . North Dakota . . . . . . . . . . . . . . . . . . . . . . . . . . . . . . . . . . Ohio. . . . . . . . . . . . . . . . . . . . . . . . . . . . . . . . . . . . . . . . .
Oklahoma . . . . . . . . . . . . . . . . . . . . . . . . . . . . . . . . . . . . Oregon . . . . . . . . . . . . . . . . . . . . . . . . . . . . . . . . . . . . . . . Pennsylvania . . . . . . . . . . . . . . . . . . . . . . . . . . . . . . . . . . Rhode Island . . . . . . . . . . . . . . . . . . . . . . . . . . . . . . . . . . South Carolina . . . . . . . . . . . . . . . . . . . . . . . . . . . . . . . .
South Dakota . . . . . . . . . . . . . . . . . . . . . . . . . . . . . . . . . . Tennessee . . . . . . . . . . . . . . . . . . . . . . . . . . . . . . . . . . . . Texas . . . . . . . . . . . . . . . . . . . . . . . . . . . . . . . . . . . . . . . . Utah . . . . . . . . . . . . . . . . . . . . . . . . . . . . . . . . . . . . . . . . . Vermont . . . . . . . . . . . . . . . . . . . . . . . . . . . . . . . . . . . . . .
Virginia . . . . . . . . . . . . . . . . . . . . . . . . . . . . . . . . . . . . . . Washington . . . . . . . . . . . . . . . . . . . . . . . . . . . . . . . . . . . West Virginia . . . . . . . . . . . . . . . . . . . . . . . . . . . . . . . . . . Wisconsin . . . . . . . . . . . . . . . . . . . . . . . . . . . . . . . . . . . . Wyoming . . . . . . . . . . . . . . . . . . . . . . . . . . . . . . . . . . . . .
0.001308
0.2924310.1087380.0776750.3134060.048430
0.1243490.0074860.0618950.0837300.249488
0.1204450.2233710.1076050.1938720.021305
0.0724910.1578560.3621400.0941420.095353
0.0140090.0723960.0968600.0400180.077023
0.1022480.2506700.1003120.0243680.089631
0.1102510.1229110.017031
(NA)0.080684
0.2354540.0992980.0846120.0973690.063035
0.0714130.0316350.0727280.0859700.038545
0.0779840.0464350.3692020.2562460.098137
–1,548,024
–9,893–34,916–4,716
–11,247–43,155
–14,729
–436,089–18,947104,408–25,092
–32,991
–147,314–13,356
–322,88594,648
6,025
–96,510107,638–35,39439,360
–163,624
489–27,05223,616
–29,229
27,322–146,886–90,487–13,607
–120,587
1,905–1,425,885
–326,265 (NA)
–39,489
57,625–158,238–12,972–15,709–24,816
123,949–32,698
–140,319–75,950–10,496
46,506
–44,54718,732
–223,513502
112,362
10,5054,6827,5369,078
28,990
9,70216,6073,005
21,05326,678
1,567
10,20318,91913,3964,636
5,5195,4596,4645,0693,760
14,76241,62522,699
8,81111,649
3,4064,9354,7233,2649,071
3,130
68,94856,212 (NA)
26,461
3,59313,40730,5091,525
15,855
5,67921,27644,2258,6312,590
9,684
25,8392,180
26,6432,339
0.002307
–0.0797780.016446
–0.0277720.0627900.006079
0.026976
–0.024420–0.0740270.0075410.050793
0.083382
–0.0623450.044699
–0.0408830.079467
–0.0135180.0298980.2464260.150679
–0.020442
–0.0201040.0461860.018847
–0.0602020.021741
–0.0042150.027770
–0.0385340.043269
–0.020528
0.0214490.006340
–0.058093 (NA)
0.001012
0.0147290.010117
–0.007189–0.0062250.022948
0.0897930.0868240.058100
–0.041299–0.014657
–0.013749–0.0740880.243904
–0.0193570.039285
826,023
174,629–58,833286,426
–194,867–38,139
183,987125,91413,351
–194,343–3,332,773
–9,149
–258,027–354,008–166,121–75,095
–72,502–95,012368,942–50,401–46,263
–59,530
1,002,661–405,415–43,904
–290,522
–16,717347,687–44,832
9,164–231,435
197,267–44,103
–593,772 (NA)
–1,543
–152,377–157,164–465,695
65,378–180,925
–8,087
–18,925–1,079,923
–141,5306,845
–12,650–88,929–8,874
–228,892–9,043
54,100
61,74812,42130,68734,37052,624
10,25423,60610,78557,112
479,805
3,82589,69868,86269,13620,869
27,15443,749
–24,4699,088
37,328
32,483–40,95380,06239,90462,546
12,3493,046
21,999578
57,548
5,81393,311
133,445 (NA)
45,574
38,65946,869
137,5272,641
43,937
10,88412,703
206,15933,2316,875
34,877109,017
7,939138,515
7,534
(NA) Not available.

U.S. Department of the InteriorU.S. Fish & Wildlife Service
http://wsfrprograms.fws.gov
Revised February 2014