Embed Size (px)
Citation preview

Pennsylvania
U.S. Fish & Wildlife Service
2011 National Survey of Fishing, Hunting, and Wildlife-Associated Recreation
Bait


FHW/11-PA (RV)Revised January 2014
2011 National Survey of Fishing, Hunting, and
Wildlife-Associated Recreation
Bait
Pennsylvania
U.S. Department of the Interior Sally Jewell, Secretary
U.S. Fish and Wildlife Service Dan Ashe,Director
U.S. Department of CommercePenny Pritzker,Secretary
Economics and Statistics AdministrationMark Doms,Under Secretary for Economic Affairs
U.S. CENSUS BUREAUJohn H. Thompson,Director

Economics and Statistics AdministrationMark Doms, Under Secretary for Economic Affairs
U.S. Department of the Interior Sally Jewell, Secretary
U.S. CENSUS BUREAU John H. Thompson,Director
U.S. Fish and Wildlife Service Dan Ashe,Director
Wildlife and Sport Fish Restoration Hannibal Bolton, Assistant Director
The U.S. Department of the Interior protects and manages the Nation’s natural resources and cultural heritage; provides scientific and other information about those resources; and honors its trust responsi-bilities or special commitments to American Indians, Alaska Natives, and affiliated Island Communities.The mission of the Department’s U.S. Fish and Wildlife Service is working with others to conserve, protect, and enhance fish, wildlife, and their habitats for the continuing benefit of the American people. The Service is responsible for national programs of vital importance to our natural resources, including administration of the Wildlife and Sport Fish Restoration Programs. These two programs provide finan-cial assistance to the States for projects to enhance and protect fish and wildlife resources and to assure their availability to the public for recreational purposes. Multistate grants from these programs fund the National Survey of Fishing, Hunting, and Wildlife-Associated Recreation.
Suggested Citation
U.S. Department of the Interior, U.S. Fish and Wildlife Service, and U.S. Department of Commerce, U.S. Census Bureau. 2011 National Survey of Fishing, Hunting, and Wildlife-Associated Recreation.

U.S. Fish and Wildlife Service and U.S. Census Bureau 2011 National Survey of Fishing, Hunting, and Wildlife-Associated Recreation—Pennsylvania iii
Contents
List of Tables . . . . . . . . . . . . . . . . . . . . . . . . . . . . . . . . . . . . . . . . . . . . . . . . . . . . . . . . . . . . . . . . . . . . . . . . . . . . . . . . . . . . . . . ivForeword . . . . . . . . . . . . . . . . . . . . . . . . . . . . . . . . . . . . . . . . . . . . . . . . . . . . . . . . . . . . . . . . . . . . . . . . . . . . . . . . . . . . . . . . . . viSurvey Background and Method . . . . . . . . . . . . . . . . . . . . . . . . . . . . . . . . . . . . . . . . . . . . . . . . . . . . . . . . . . . . . . . . . . . . . . . vii
Highlights
Introduction . . . . . . . . . . . . . . . . . . . . . . . . . . . . . . . . . . . . . . . . . . . . . . . . . . . . . . . . . . . . . . . . . . . . . . . . . . . . . . . . . . . . . . . . 2Summary . . . . . . . . . . . . . . . . . . . . . . . . . . . . . . . . . . . . . . . . . . . . . . . . . . . . . . . . . . . . . . . . . . . . . . . . . . . . . . . . . . . . . . . . . . 4Wildlife-Related Recreation . . . . . . . . . . . . . . . . . . . . . . . . . . . . . . . . . . . . . . . . . . . . . . . . . . . . . . . . . . . . . . . . . . . . . . . . . . . 5Sportspersons . . . . . . . . . . . . . . . . . . . . . . . . . . . . . . . . . . . . . . . . . . . . . . . . . . . . . . . . . . . . . . . . . . . . . . . . . . . . . . . . . . . . . . 6Anglers . . . . . . . . . . . . . . . . . . . . . . . . . . . . . . . . . . . . . . . . . . . . . . . . . . . . . . . . . . . . . . . . . . . . . . . . . . . . . . . . . . . . . . . . . . . 7Hunters . . . . . . . . . . . . . . . . . . . . . . . . . . . . . . . . . . . . . . . . . . . . . . . . . . . . . . . . . . . . . . . . . . . . . . . . . . . . . . . . . . . . . . . . . . . 9Wildlife Watchers . . . . . . . . . . . . . . . . . . . . . . . . . . . . . . . . . . . . . . . . . . . . . . . . . . . . . . . . . . . . . . . . . . . . . . . . . . . . . . . . . . . 112001–2011 Comparison . . . . . . . . . . . . . . . . . . . . . . . . . . . . . . . . . . . . . . . . . . . . . . . . . . . . . . . . . . . . . . . . . . . . . . . . . . . . . . 13
Tables
Guide to Statistical Tables . . . . . . . . . . . . . . . . . . . . . . . . . . . . . . . . . . . . . . . . . . . . . . . . . . . . . . . . . . . . . . . . . . . . . . . . . . . . . 16Fishing and Hunting Tables . . . . . . . . . . . . . . . . . . . . . . . . . . . . . . . . . . . . . . . . . . . . . . . . . . . . . . . . . . . . . . . . . . . . . . . . . . . 17Wildlife-Watching Tables . . . . . . . . . . . . . . . . . . . . . . . . . . . . . . . . . . . . . . . . . . . . . . . . . . . . . . . . . . . . . . . . . . . . . . . . . . . . . 33National Tables . . . . . . . . . . . . . . . . . . . . . . . . . . . . . . . . . . . . . . . . . . . . . . . . . . . . . . . . . . . . . . . . . . . . . . . . . . . . . . . . . . . . . 42
Appendixes
A. Definitions . . . . . . . . . . . . . . . . . . . . . . . . . . . . . . . . . . . . . . . . . . . . . . . . . . . . . . . . . . . . . . . . . . . . . . . . . . . . . . . . . . . . . 47B. 2010 Participation of 6- to 15-Year-Olds: Data From Screening Interviews . . . . . . . . . . . . . . . . . . . . . . . . . . . . . . . . . . 51C. Significant Methodological Changes From Previous Surveys and Regional Trends . . . . . . . . . . . . . . . . . . . . . . . . . . . . 57D. Sample Design and Statistical Accuracy . . . . . . . . . . . . . . . . . . . . . . . . . . . . . . . . . . . . . . . . . . . . . . . . . . . . . . . . . . . . . . 67
iv 2011 National Survey of Fishing, Hunting, and Wildlife-Associated Recreation—Pennsylvania U.S. Fish and Wildlife Service and U.S. Census Bureau
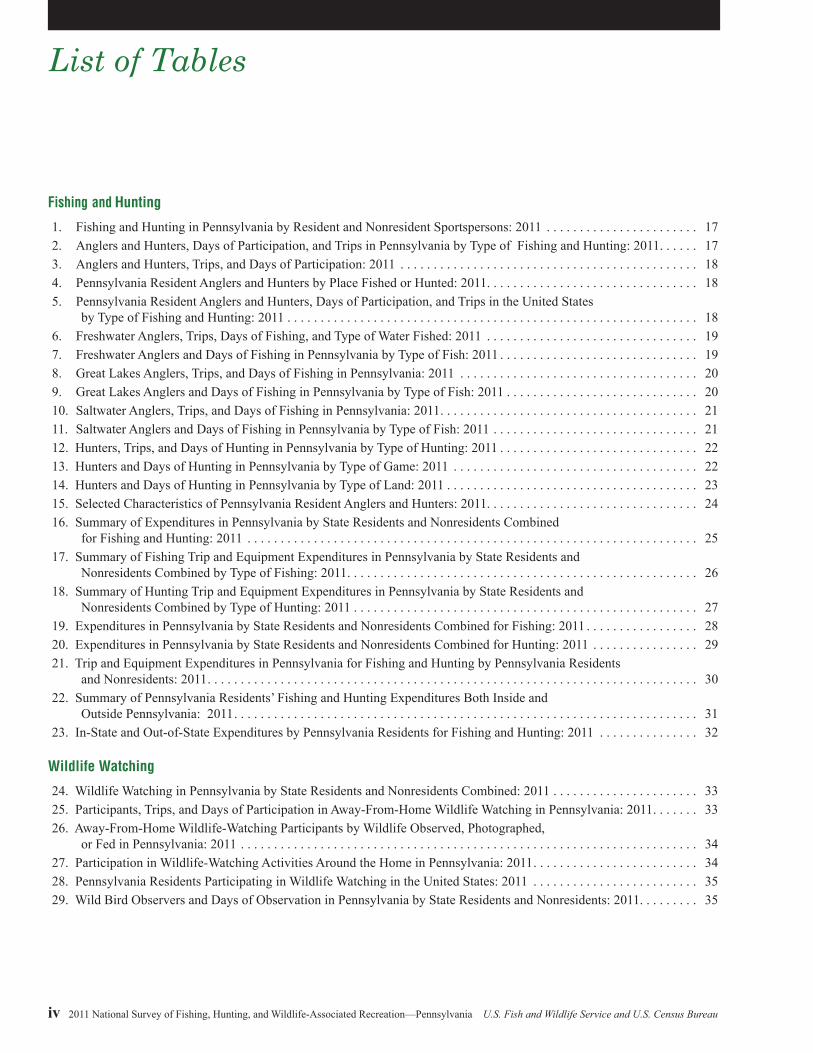
List of Tables
Fishing and Hunting
1. Fishing and Hunting in Pennsylvania by Resident and Nonresident Sportspersons: 2011 . . . . . . . . . . . . . . . . . . . . . . . 172. Anglers and Hunters, Days of Participation, and Trips in Pennsylvania by Type of Fishing and Hunting: 2011 . . . . . . 173. Anglers and Hunters, Trips, and Days of Participation: 2011 . . . . . . . . . . . . . . . . . . . . . . . . . . . . . . . . . . . . . . . . . . . . . 184. Pennsylvania Resident Anglers and Hunters by Place Fished or Hunted: 2011. . . . . . . . . . . . . . . . . . . . . . . . . . . . . . . . 185. Pennsylvania Resident Anglers and Hunters, Days of Participation, and Trips in the United States
by Type of Fishing and Hunting: 2011 . . . . . . . . . . . . . . . . . . . . . . . . . . . . . . . . . . . . . . . . . . . . . . . . . . . . . . . . . . . . . . 186. Freshwater Anglers, Trips, Days of Fishing, and Type of Water Fished: 2011 . . . . . . . . . . . . . . . . . . . . . . . . . . . . . . . . 197. Freshwater Anglers and Days of Fishing in Pennsylvania by Type of Fish: 2011 . . . . . . . . . . . . . . . . . . . . . . . . . . . . . . 198. Great Lakes Anglers, Trips, and Days of Fishing in Pennsylvania: 2011 . . . . . . . . . . . . . . . . . . . . . . . . . . . . . . . . . . . . 209. Great Lakes Anglers and Days of Fishing in Pennsylvania by Type of Fish: 2011 . . . . . . . . . . . . . . . . . . . . . . . . . . . . . 2010. Saltwater Anglers, Trips, and Days of Fishing in Pennsylvania: 2011 . . . . . . . . . . . . . . . . . . . . . . . . . . . . . . . . . . . . . . . 2111. Saltwater Anglers and Days of Fishing in Pennsylvania by Type of Fish: 2011 . . . . . . . . . . . . . . . . . . . . . . . . . . . . . . . 2112. Hunters, Trips, and Days of Hunting in Pennsylvania by Type of Hunting: 2011 . . . . . . . . . . . . . . . . . . . . . . . . . . . . . . 2213. Hunters and Days of Hunting in Pennsylvania by Type of Game: 2011 . . . . . . . . . . . . . . . . . . . . . . . . . . . . . . . . . . . . . 2214. Hunters and Days of Hunting in Pennsylvania by Type of Land: 2011 . . . . . . . . . . . . . . . . . . . . . . . . . . . . . . . . . . . . . . 2315. Selected Characteristics of Pennsylvania Resident Anglers and Hunters: 2011. . . . . . . . . . . . . . . . . . . . . . . . . . . . . . . . 2416. Summary of Expenditures in Pennsylvania by State Residents and Nonresidents Combined
for Fishing and Hunting: 2011 . . . . . . . . . . . . . . . . . . . . . . . . . . . . . . . . . . . . . . . . . . . . . . . . . . . . . . . . . . . . . . . . . . . . 2517. Summary of Fishing Trip and Equipment Expenditures in Pennsylvania by State Residents and
Nonresidents Combined by Type of Fishing: 2011 . . . . . . . . . . . . . . . . . . . . . . . . . . . . . . . . . . . . . . . . . . . . . . . . . . . . . 2618. Summary of Hunting Trip and Equipment Expenditures in Pennsylvania by State Residents and
Nonresidents Combined by Type of Hunting: 2011 . . . . . . . . . . . . . . . . . . . . . . . . . . . . . . . . . . . . . . . . . . . . . . . . . . . . 2719. Expenditures in Pennsylvania by State Residents and Nonresidents Combined for Fishing: 2011 . . . . . . . . . . . . . . . . . 2820. Expenditures in Pennsylvania by State Residents and Nonresidents Combined for Hunting: 2011 . . . . . . . . . . . . . . . . 2921. Trip and Equipment Expenditures in Pennsylvania for Fishing and Hunting by Pennsylvania Residents
and Nonresidents: 2011 . . . . . . . . . . . . . . . . . . . . . . . . . . . . . . . . . . . . . . . . . . . . . . . . . . . . . . . . . . . . . . . . . . . . . . . . . . 3022. Summary of Pennsylvania Residents’ Fishing and Hunting Expenditures Both Inside and
Outside Pennsylvania: 2011 . . . . . . . . . . . . . . . . . . . . . . . . . . . . . . . . . . . . . . . . . . . . . . . . . . . . . . . . . . . . . . . . . . . . . . 3123. In-State and Out-of-State Expenditures by Pennsylvania Residents for Fishing and Hunting: 2011 . . . . . . . . . . . . . . . 32
Wildlife Watching
24. Wildlife Watching in Pennsylvania by State Residents and Nonresidents Combined: 2011 . . . . . . . . . . . . . . . . . . . . . . 3325. Participants, Trips, and Days of Participation in Away-From-Home Wildlife Watching in Pennsylvania: 2011 . . . . . . . 3326. Away-From-Home Wildlife-Watching Participants by Wildlife Observed, Photographed,
or Fed in Pennsylvania: 2011 . . . . . . . . . . . . . . . . . . . . . . . . . . . . . . . . . . . . . . . . . . . . . . . . . . . . . . . . . . . . . . . . . . . . . 3427. Participation in Wildlife-Watching Activities Around the Home in Pennsylvania: 2011 . . . . . . . . . . . . . . . . . . . . . . . . . 3428. Pennsylvania Residents Participating in Wildlife Watching in the United States: 2011 . . . . . . . . . . . . . . . . . . . . . . . . . 3529. Wild Bird Observers and Days of Observation in Pennsylvania by State Residents and Nonresidents: 2011. . . . . . . . . 35

U.S. Fish and Wildlife Service and U.S. Census Bureau 2011 National Survey of Fishing, Hunting, and Wildlife-Associated Recreation—Pennsylvania v
30. Selected Characteristics of Pennsylvania Residents Participating in Wildlife Watching: 2011 . . . . . . . . . . . . . . . . . . . . 3631. Expenditures in Pennsylvania by State Residents and Nonresidents Combined for Wildlife Watching: 2011 . . . . . . . . 3732. Trip and Equipment Expenditures in Pennsylvania for Wildlife Watching by
Pennsylvania Residents and Nonresidents: 2011 . . . . . . . . . . . . . . . . . . . . . . . . . . . . . . . . . . . . . . . . . . . . . . . . . . . . . . 3833. Wildlife-Watching Expenditures Both Inside and Outside Pennsylvania by Pennsylvania Residents: 2011 . . . . . . . . . . 3934. In-State and Out-of-State Expenditures by Pennsylvania Residents for Wildlife Watching: 2011 . . . . . . . . . . . . . . . . . 4035. Participation of Pennsylvania Resident Wildlife-Watching Participants in Fishing and Hunting: 2011 . . . . . . . . . . . . . 4036. Participation of Pennsylvania Resident Sportspersons in Wildlife-Watching Activities: 2011 . . . . . . . . . . . . . . . . . . . . 41
National Tables
37. Participation in Wildlife-Related Recreation by State Residents Both Inside and Outside Their Resident State: 2011 . 4238. Anglers and Hunters by Sportsperson’s State of Residence: 2011. . . . . . . . . . . . . . . . . . . . . . . . . . . . . . . . . . . . . . . . . 4339. Participation in Wildlife-Related Recreation in Each State by Both Residents and Nonresidents of the State: 2011 . . . . . . . . . . . . . . . . . . . . . . . . . . . . . . . . . . . . . . . . . . . . . . . . . . . . . . . . . . . . . . . . . . . 4440. Anglers and Hunters by State Where Fishing or Hunting Took Place: 2011 . . . . . . . . . . . . . . . . . . . . . . . . . . . . . . . . . . 45

vi 2011 National Survey of Fishing, Hunting, and Wildlife-Associated Recreation—Pennsylvania U.S. Fish and Wildlife Service and U.S. Census Bureau
Foreword
When I was growing up, it was taken as a matter of faith that kids belonged outside. I grew up with 4 brothers, and during those long, hot Atlanta summers,it was common for our mom to holler, “You boys get outside, and don’t come back ‘til it’s dark.” It never occurred to me or my brothers to do anything else in our spare time but explore the world around us. The truth is, we had little else to do. But those experiences – waking up on frosty mornings and starting the campfire, scanning trees for a shot at a scampering gray squirrel in the dawn light, scouring creek beds for crawdads and other fishing bait, or simply of the fun we had tramping through the forest – shaped who I am, and drew me to a career in conserva-tion.
That’s why I’m excited by this 2011 National Survey of Fishing, Hunting, and Wildlife-Associated Recreation. This report, the 12th in a series that began in 1955, documents a significant resurgence in the number of people embracing America’s Great Outdoors. Hunting participation has increased by 9 percent, while angling participation grew by 11 percent. Nearly 38 percent of Americans participated in wildlife-related recreation, an increase of 2.6 million participants from the 2006 Survey.
In addition, wildlife-related recre-ation is a major driver of the nation’s economy. The 2011 Survey estimates that Americans spent $145 billion on related gear, trips, licenses, land acqui-sition or leases, and other purchases, representing about one percent of the nation’s gross domestic product. This spending creates thousands of jobs, supports countless local commu-nities and provides vital funding for conservation.
This year marks the 75th anniversary of the Wildlife and Sport Fish Restora-tion Program, a cornerstone of wildlife conservation in the United States. Through excise taxes on firearms, ammunition, archery and angling equipment, the U.S. Fish and Wildlife Service has distributed over $14 billion for State and territorial wildlife conser-vation programs.
This report would not have been possible without the combined efforts of state wildlife agencies – which provided financial support through the Multi-State Conservation Grant Programs – the Association of Fish and Wildlife Agencies and a number of major national conservation organiza-tions. We also owe our gratitude to the thousands of survey respondents from households across America. Because of you, this Survey is the nation’s definitive wildlife-related recreation database and information source concerning participation and purchases associated with hunting, fishing and other forms of wildlife-associated recreation nationwide.
The Fish and Wildlife Service is dedi-cated to connecting people and families with nature. We are proud to celebrate the good news in this report, and we look forward to continuing progress as we work with the States, and all our partners and the public to help keep recreational fishing, hunting, and wildlife watching growing and going strong.
Dan AsheDirector, U.S. Fish and Wildlife Service

U.S. Fish and Wildlife Service and U.S. Census Bureau 2011 National Survey of Fishing, Hunting, and Wildlife-Associated Recreation—Pennsylvania vii
Survey Background and Method
The National Survey of Fishing, Hunting, and Wildlife-Associated Recreation (Survey) has been conducted since 1955 and is one of the oldest and most comprehensive continuing recreation surveys. The Survey collects information on the number of anglers, hunters, and wild-life watchers, how often they partici-pate, and how much they spend on theiractivities in the United States.
Preparations for the 2011 Survey began in 2008 when the Association of Fish and Wildlife Agencies (AFWA) asked the Fish and Wildlife Service to coordinate the twelfth National Survey of wildlife-related recreation. Funding came from the Multistate Conservation Grant Programs, authorized by Wildlifeand Sport Fish Restoration Acts, as amended.
Four regional technical committees were set up under the auspices of AFWA to ensure that State fish and wildlife agencies had an opportunity to participate in all phases of survey plan-ning and design. The committees were made up of agency representatives.
We consulted with State and Federal agencies and nongovernmental organizations such as the American Sportfishing Association and National Shooting Sports Foundation to deter-mine survey content. Other sportsper-sons’ organizations and conservation
groups, industry representatives, and researchers also provided valuable advice.
Data collection for the Survey was carried out in two phases by the U.S. Census Bureau. The first phase was the screen which began in April 2011. During the screening phase, the Census Bureau interviewed a sample of 48,600 households nationwide, to determine who in the household had fished, hunted, or wildlife watched in 2010, and who had engaged or planned to engage in those activities in 2011. In most cases, one adult household member provided information for all members. The screen primarily covered 2010 activities while the next, more in-depth phase covered 2011 activities. For more information on the 2010 data, refer to Appendix B.
The second phase of data collection consisted of three detailed interview waves. The first wave began in April 2011 concurrent with the screen, the second in September 2011, and the last in January 2012. Interviews were conducted with samples of likely anglers, hunters, and wildlife watchers who were identified in the initial screening phase. Interviews were conducted primarily by telephone, with in-person interviews for respondents who could not be reached by phone. Respondents in the second survey phase were limited to those who were
at least 16 years old. Each respondent provided information pertaining only to his or her activities and expendi-tures. Sample sizes were designed to provide statistically reliable results at the state level. Altogether, interviews were completed for 11,330 anglers and hunters and 9,329 wildlife watchers. More detailed information on sampling procedures and response rates is found in Appendix D.
Comparability With Previous Surveys
The 2011 Survey’s questions and methodology were similar to those used in the 2006, 2001, 1996, and 1991 Surveys. Therefore, the estimates are comparable.
The methodology for these Surveys differs significantly from the 1955 to 1985 Surveys, so these estimates are not directly comparable to those of earlier surveys. Changes in meth-odology included reducing the recall period over which respondents had to report their activities and expenditures. Previous Surveys used a 12-month recall period which resulted in greater reporting bias. Research found that the amount of activity and expenditures reported in 12-month recall surveys was overestimated in comparison with that reported using shorter recall periods.

Highlights

Highlights

2 2011 National Survey of Fishing, Hunting, and Wildlife-Associated Recreation—Pennsylvania U.S. Fish and Wildlife Service and U.S. Census Bureau
Introduction
The National Survey of Fishing, Hunting, and Wildlife-Associated Recreation reports results from inter-views with U.S. residents about their fishing, hunting, and wildlife watching. This report focuses on 2011 participa-tion and expenditures of persons 16 years of age and older.
The Survey is a snapshot of one year. The information it collected tells us how many people participated and how much they spent on their activi-ties in the State in 2011. It does not tell us how many anglers, hunters, and wildlife watchers there were because many do not participate every year. For example, based on information collected in the Survey’s household screen phase, we can estimate that about 51 percent more anglers and 44 percent more hunters participated nationally in at least 1 of the 5 years prior to the screen survey year 2010.
In addition to 2011 estimates, we also provide trend information in the High-lights section and Appendix C of the report. The 2011 numbers reported can be compared with those in the 1991, 1996, 2001, and 2006 Survey reports because they used similar methodolo-gies. The 2011 estimates should not be directly compared with results from Surveys conducted prior to 1991 because of changes in methodology to improve accuracy.
The report also provides information on participation in wildlife recreation in 2010, particularly of persons 6 to 15 years of age. The 2010 information is provided in Appendix B. Information about the Survey’s scope and coverage is in Appendix D. The remainder of this section defines important terms used in the Survey.
This report does not provide infor-mation about the State’s wildlife resources. That, and additional infor-mation on wildlife-related recreation, may be obtained from State fish and wildlife agencies. The Association of Fish and Wildlife Agencies can provide the addresses and telephone numbers of those agencies. The Association’s website is www.fishwildlife.org.
Additionally, this report does not provide information about the State’s number of licensed anglers and hunters. Historical license data can be found at wsfrprograms.fws.gov.
Wildlife-Related Recreation
Wildlife-related recreation is fishing, hunting, and wildlife-watching activi-ties. These categories are not mutually exclusive because many individuals participated in more than one activity. Wildlife-related recreation is reported in two major categories: (1) fishing and hunting, and (2) wildlife watching, which includes observing, photo-graphing, and feeding fish or wildlife.
Fishing and Hunting
This Survey reports information about residents of the United States who fished or hunted in 2011, regardless of whether they were licensed. The fishing and hunting sections report information for three groups: (1) sportspersons, (2) anglers, and (3) hunters.
Sportspersons
Sportspersons are those who fished or hunted. Individuals who fished or hunted commercially in 2011 are reported as sportspersons only if they also fished or hunted for recreation. The sportspersons group is composed of the three subgroups shown in the diagram below: (1) those that fished and hunted, (2) those that only fished, and (3) those that only hunted.
The total number of sportspersons is equal to the sum of people who only fished, only hunted, and both hunted and fished. It is not the sum of all anglers and all hunters because those people who both fished and hunted are included in both the angler and hunter population and would be incorrectly counted twice.
Anglers
Anglers are sportspersons who only fished plus those who fished and hunted. Anglers include not only licensed hook and line anglers, but also those who have no license and those who use special methods such as fishing with spears. Three types of fishing are reported: (1) freshwater, excluding the Great Lakes, (2) Great Lakes, and (3) saltwater. Since many anglers participated in more than one type of fishing, the total number of anglers is less than the sum of the three types of fishing.
Sportspersons
Anglers Hunters
Fished only
Fishedandhunted
Huntedonly

U.S. Fish and Wildlife Service and U.S. Census Bureau 2011 National Survey of Fishing, Hunting, and Wildlife-Associated Recreation—Pennsylvania 3
Hunters
Hunters are sportspersons who only hunted plus those who hunted and fished. Hunters include not only licensed hunters using rifles and shotguns, but also those who have no license and those who engage in hunting with archery equipment, muzzleloaders, other primitive firearms, or pistols or handguns.
Four types of hunting are reported: (1) big game, (2) small game, (3) migratory bird, and (4) other animals. Since many hunters partici-pated in more than one type of hunting, the sum of hunters for big game, small game, migratory bird, and other animals exceeds the total number of hunters.
Wildlife Watchers
Since 1980, the National Survey has included information on wildlife-watching activities in addition to fishing and hunting. However, unlike the 1980 and 1985 Surveys, the National Surveys since 1991 have
collected data only for those activities where the primary purpose was wildlife watching (observing, photographing, or feeding wildlife).
The 2011 Survey uses a strict definition of wildlife watching. Participants must either take a “special interest” in wild-life around their homes or take a trip for the “primary purpose” of wildlife watching. Secondary wildlife watching, such as incidentally observing wildlife while pleasure driving, is not included.
Two types of wildlife-watching activity are reported: (1) away-from-home (formerly nonresidential) activities and (2) around-the-home (formerly residen-tial) activities. Because some people participated in more than one type of wildlife watching, the sum of partici-pants in each type will be greater than the total number of wildlife watchers. Only those engaged in activities whose primary purpose was wildlife watching are included in the Survey. The two types of wildlife-watching activity are defined below.
Away-From-Home
This group includes persons who took trips or outings of at least 1 mile from home for the primary purpose of observing, feeding, or photographing fish and wildlife. Trips to fish or hunt or scout and trips to zoos, circuses, aquar-iums, and museums are not considered wildlife-watching activities.
Around-The-Home
This group includes those who participated within 1 mile of home and involves one or more of the following: (1) closely observing or trying to iden-tify birds or other wildlife; (2) photo-graphing wildlife; (3) feeding birds or other wildlife; (4) maintaining natural areas of at least 1/4 acre where benefit to wildlife is the primary concern; (5) maintaining plantings (shrubs, agricultural crops, etc.) where benefit to wildlife is the primary concern; or (6) visiting parks and natural areas within 1 mile of home for the primary purpose of observing, feeding, or photographing wildlife.

4 2011 National Survey of Fishing, Hunting, and Wildlife-Associated Recreation—Pennsylvania U.S. Fish and Wildlife Service and U.S. Census Bureau
2011 Pennsylvania Summary
Fishing
Anglers . . . . . . . . . . . . . . . . . . . . . . . . . Days of fishing . . . . . . . . . . . . . . . . . . . Average days per angler . . . . . . . . . . . . Total expenditures . . . . . . . . . . . . . . . . . Trip-related . . . . . . . . . . . . . . . . . . . Equipment and other . . . . . . . . . . . . Average per angler . . . . . . . . . . . . . . . . Average trip expenditure per day . . . . .
Hunting
Hunters. . . . . . . . . . . . . . . . . . . . . . . . . Days of hunting . . . . . . . . . . . . . . . . . . . Average days per hunter . . . . . . . . . . . . Total expenditures . . . . . . . . . . . . . . . . . Trip-related . . . . . . . . . . . . . . . . . . . Equipment and other . . . . . . . . . . . . Average per hunter . . . . . . . . . . . . . . . . Average trip expenditure per day . . . . .
Wildlife Watching
Total wildlife-watching participants . Away-from-home participants . . . . . Around-the-home participants . . . . . Days of participation away from home . Average days of participation away from home . . . . . . . . . . . . . . . . Total expenditures . . . . . . . . . . . . . . . . . Trip-related . . . . . . . . . . . . . . . . . . . Equipment and other . . . . . . . . . . . . Average per participant . . . . . . . . . . . . . Average trip expenditure per day . . . . .
Activities in Pennsylvania by Residents and Nonresidents
1,101,00010,136,000
9$485,490,000$228,510,000$256,980,000
$409$23
775,00018,247,000
24$970,598,000$172,710,000$797,888,000
$1,207$9
3,598,000809,000
3,228,0009,554,000
12$1,270,888,000
$266,669,000$1,004,219,000
$308$28
Fishing
Anglers . . . . . . . . . . . . . . . . . . . . . . . . . Days of fishing . . . . . . . . . . . . . . . . . . . Average days per angler . . . . . . . . . . . . Total expenditures . . . . . . . . . . . . . . . . . Trip-related . . . . . . . . . . . . . . . . . . . Equipment and other . . . . . . . . . . . . Average per angler . . . . . . . . . . . . . . . . Average trip expenditure per day . . . . .
Hunting
Hunters. . . . . . . . . . . . . . . . . . . . . . . . . Days of hunting . . . . . . . . . . . . . . . . . . . Average days per hunter . . . . . . . . . . . . Total expenditures . . . . . . . . . . . . . . . . . Trip-related . . . . . . . . . . . . . . . . . . . Equipment and other . . . . . . . . . . . . Average per hunter . . . . . . . . . . . . . . . . Average trip expenditure per day . . . . .
Wildlife Watching
Total wildlife-watching participants . Away-from-home participants . . . . . Around-the-home participants . . . . . Days of participation away from home . Average days of participation away from home . . . . . . . . . . . . . . . . Total expenditures . . . . . . . . . . . . . . . . . Trip-related . . . . . . . . . . . . . . . . . . . Equipment and other . . . . . . . . . . . . Average per participant . . . . . . . . . . . . . Average trip expenditure per day . . . . .
Activities by Pennsylvania Residents Both Inside and Outside Pennsylvania
1,008,0009,926,000
10$429,991,000$237,919,000$192,072,000
$426$24
703,00017,826,000
25$995,487,000$183,105,000$812,382,000
$1,416$10
3,329,000734,000
3,228,0007,863,000
11$1,002,614,000
$86,767,000$915,847,000
$301$11

U.S. Fish and Wildlife Service and U.S. Census Bureau 2011 National Survey of Fishing, Hunting, and Wildlife-Associated Recreation—Pennsylvania 5
Wildlife-Related Recreation
Participation in Pennsylvania
The 2011 Survey found that 4.6 million Pennsylvania residents and nonresi-dents 16 years old and older fished, hunted, or wildlife watched in Pennsyl-vania. Of the total number of partici-pants, 1.1 million fished, 775 thousand hunted, and 3.6 million participated in wildlife-watching activities, which includes observing, feeding, and photo-graphing wildlife. The sum of anglers, hunters, and wildlife watchers exceeds the total number of participants in wildlife-related recreation because many of the individuals engaged in more than one wildlife-related activity.
Participation in 2011 by 6- to 15-Year-Old Pennsylvania Residents
The focus of the National Survey is on the activity of participants 16 years old and older. However, the activity of 6- to 15-year-olds can be calculated using the screening data covering the year 2010. It is assumed for estimation purposes that the proportion of 6- to
15-year-old participants to participants 16 years old and older remained the same in 2010 and 2011. Based on this assumption, in addition to the 1.0 million resident anglers 16 years old or older in Pennsylvania, there were 282 thousand resident anglers 6 to 15 years old. Also, there were 703 thousand Pennsylvanians 16 years old and older and 63 thousand Pennsylvanians 6 to 15 years old who hunted. Finally, there were 3.3 million Pennsylvanians 16 years old and older and 586 thousand Pennsylvanians 6 to 15 years old who wildlife watched. Information on 2010 data for 6- to 15-year-olds is provided in Appendix B.
Expenditures in Pennsylvania
In 2011, state residents and nonresi-dents spent $2.8 billion on wildlife recreation in Pennsylvania. Of that total, trip-related expenditures were $668 million and equipment expen-ditures totaled $1.6 billion. The remaining $527 million was spent on licenses, contributions, land ownership and leasing, and other items.
Participants in Wildlife-Related Recreation in Pennsylvania: 2011 (U.S. residents 16 years old and older)
Total . . . . . . . . . . . . . . . . . . . . . . . . . . . . . . . . . . . . . . . . . . . . . SportspersonsTotal . . . . . . . . . . . . . . . . . . . . . . . . . . . . . . . . . . . . . . . . . . . . . Anglers . . . . . . . . . . . . . . . . . . . . . . . . . . . . . . . . . . . . . . . . . Hunters . . . . . . . . . . . . . . . . . . . . . . . . . . . . . . . . . . . . . . . . . Wildlife WatchersTotal . . . . . . . . . . . . . . . . . . . . . . . . . . . . . . . . . . . . . . . . . . . . . Away from home . . . . . . . . . . . . . . . . . . . . . . . . . . . . . . . . . Around the home . . . . . . . . . . . . . . . . . . . . . . . . . . . . . . . . .
Note: Detail does not add to total because of multiple responses.
Source: Tables 1 and 24.
4.6 million
1.4 million1.1 million
775 thousand
3.6 million809 thousand
3.2 million
Percent of Total Participantsby Activity(Total: 4.6 million participants)
WildlifeWatching
HuntingFishing
24%17%
79%
Percent of Total Residential Participants 6 to 15 Years Old by Activity: 2010(Total: 810 thousand participants)
WildlifeWatching
HuntingFishing
45%
71%
8%
1,008,0009,926,000
10$429,991,000$237,919,000$192,072,000
$426$24
703,00017,826,000
25$995,487,000$183,105,000$812,382,000
$1,416$10
3,329,000734,000
3,228,0007,863,000
11$1,002,614,000
$86,767,000$915,847,000
$301$11
Wildlife-RelatedRecreation Expenditures
in Pennsylvania(Total: $2.8 billion)
Trip-related 24%
Equipment57%
Other19%

6 2011 National Survey of Fishing, Hunting, and Wildlife-Associated Recreation—Pennsylvania U.S. Fish and Wildlife Service and U.S. Census Bureau
Sportspersons
In 2011, 1.4 million state resident and nonresident sportspersons 16 years old and older fished or hunted in Pennsyl-vania. This group was comprised of 1.1 million anglers (77 percent of all
sportspersons) and 775 thousand hunters (54 percent of all sportspersons). Among the 1.4 million sportspersons who fished or hunted in the state, 649 thousand (46 percent) fished but did not hunt in
Pennsylvania. Another 323 thousand (23 percent) hunted but did not fish there. The remaining 452 thousand (32 percent) fished and hunted in Pennsyl-vania in 2011.
Sportspersons’ Participation in Pennsylvania (State residents and nonresidents 16 years old and older)
Sportspersons (fished or hunted) . . . . . . . . . . . . . . . . . . . . . . Anglers . . . . . . . . . . . . . . . . . . . . . . . . . . . . . . . . . . . . . . . . . . . Fished only . . . . . . . . . . . . . . . . . . . . . . . . . . . . . . . . . . . . . . Fished and hunted . . . . . . . . . . . . . . . . . . . . . . . . . . . . . . . . Hunters. . . . . . . . . . . . . . . . . . . . . . . . . . . . . . . . . . . . . . . . . . . Hunted only . . . . . . . . . . . . . . . . . . . . . . . . . . . . . . . . . . . . . Hunted and fished . . . . . . . . . . . . . . . . . . . . . . . . . . . . . . . . .
Note: Detail does not add to total because of multiple responses.Source: Table 1.
1.4 million
1.1 million649 thousand452 thousand
775 thousand323 thousand452 thousand

U.S. Fish and Wildlife Service and U.S. Census Bureau 2011 National Survey of Fishing, Hunting, and Wildlife-Associated Recreation—Pennsylvania 7
Anglers
Participants and Days of Fishing
In 2011, 1.1 million state residents and nonresidents 16 years old and older fished in Pennsylvania. Of this total, 891 thousand anglers (81 percent) were state residents and 210 thousand anglers (19 percent) were nonresidents. Anglers fished a total of 10.1 million days in Pennsylvania—an average of 9 days per angler. State residents
fished 8.4 million days—83 percent of all fishing days in Pennsylvania. Nonresidents fished 1.8 million days in Pennsylvania—17 percent of all fishing days in the state.
A large majority of Pennsylvania residents who fished anywhere in the United States did so in their resident state. There were 1.0 million Penn-sylvania residents 16 years old and
older who fished in the United States in 2011 for a total of 9.9 million days. An estimated 88 percent of all Penn-sylvania residents who fished did so in their home state. Of all fishing days by Pennsylvania residents, 84 percent or 8.4 million were in their home state. For further details about fishing in Pennsylvania, see Table 3.
Anglers in Pennsylvania (State residents and nonresidents 16 years old and older)
Anglers . . . . . . . . . . . . . . . . . . . . . . . . . . . . . . . . . . . . . . . . . . . Residents . . . . . . . . . . . . . . . . . . . . . . . . . . . . . . . . . . . . . . . Nonresidents . . . . . . . . . . . . . . . . . . . . . . . . . . . . . . . . . . . . . Days of fishing . . . . . . . . . . . . . . . . . . . . . . . . . . . . . . . . . . . . . Residents . . . . . . . . . . . . . . . . . . . . . . . . . . . . . . . . . . . . . . . Nonresidents . . . . . . . . . . . . . . . . . . . . . . . . . . . . . . . . . . . . .
Source: Table 3.
1.1 million891 thousand210 thousand
10.1 million8.4 million1.8 million
In State/Out of State (State residents 16 years old and older)
Pennsylvania anglers . . . . . . . . . . . . . . . . . . . . . . . . . . . . . . . In Pennsylvania . . . . . . . . . . . . . . . . . . . . . . . . . . . . . . . . . . In other states . . . . . . . . . . . . . . . . . . . . . . . . . . . . . . . . . . . . Days of fishing . . . . . . . . . . . . . . . . . . . . . . . . . . . . . . . . . . . . . In Pennsylvania . . . . . . . . . . . . . . . . . . . . . . . . . . . . . . . . . . In other states . . . . . . . . . . . . . . . . . . . . . . . . . . . . . . . . . . . .
Note: Detail does not add to total because of multiple responses.Source: Table 3.
1.0 million891 thousand311 thousand
9.9 million8.4 million1.6 million
8 2011 National Survey of Fishing, Hunting, and Wildlife-Associated Recreation—Pennsylvania U.S. Fish and Wildlife Service and U.S. Census Bureau
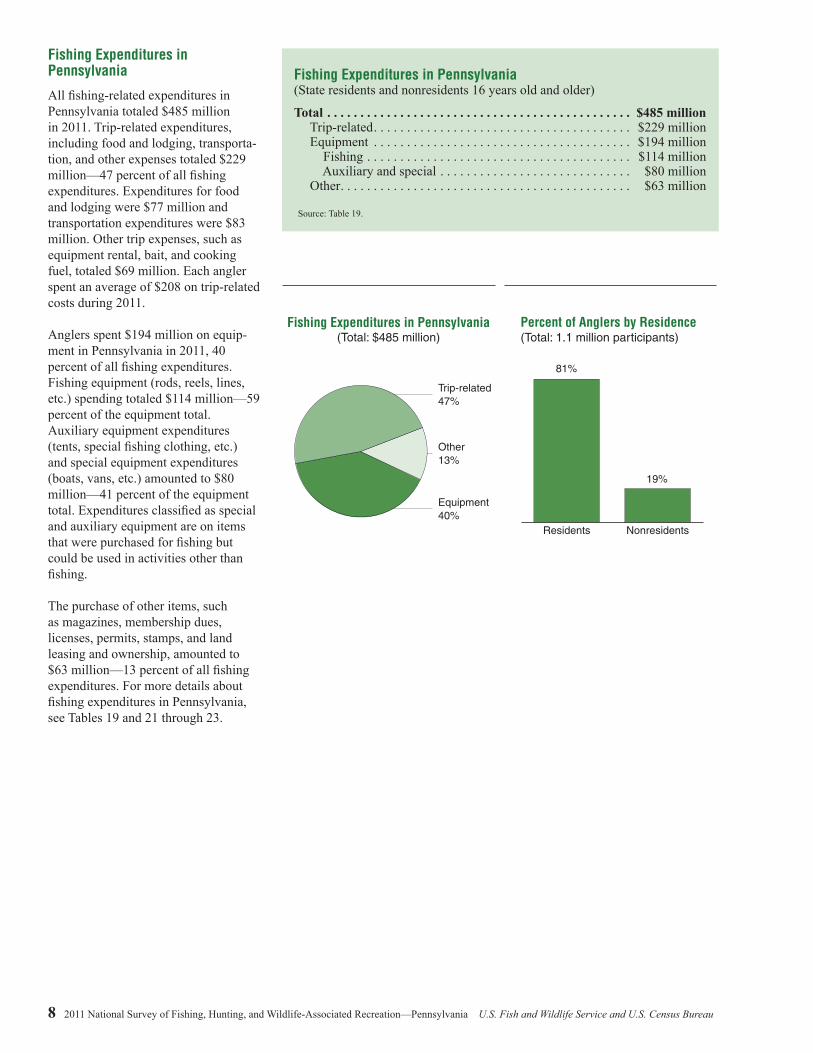
Fishing Expenditures in Pennsylvania
All fishing-related expenditures in Pennsylvania totaled $485 million in 2011. Trip-related expenditures, including food and lodging, transporta-tion, and other expenses totaled $229 million—47 percent of all fishing expenditures. Expenditures for food and lodging were $77 million and transportation expenditures were $83 million. Other trip expenses, such as equipment rental, bait, and cooking fuel, totaled $69 million. Each angler spent an average of $208 on trip-related costs during 2011.
Anglers spent $194 million on equip-ment in Pennsylvania in 2011, 40 percent of all fishing expenditures. Fishing equipment (rods, reels, lines, etc.) spending totaled $114 million—59 percent of the equipment total. Auxiliary equipment expenditures (tents, special fishing clothing, etc.) and special equipment expenditures (boats, vans, etc.) amounted to $80 million—41 percent of the equipment total. Expenditures classified as special and auxiliary equipment are on items that were purchased for fishing but could be used in activities other than fishing.
The purchase of other items, such as magazines, membership dues, licenses, permits, stamps, and land leasing and ownership, amounted to $63 million—13 percent of all fishing expenditures. For more details about fishing expenditures in Pennsylvania, see Tables 19 and 21 through 23.
Fishing Expenditures in Pennsylvania (State residents and nonresidents 16 years old and older)
Total . . . . . . . . . . . . . . . . . . . . . . . . . . . . . . . . . . . . . . . . . . . . . . Trip-related . . . . . . . . . . . . . . . . . . . . . . . . . . . . . . . . . . . . . . . Equipment . . . . . . . . . . . . . . . . . . . . . . . . . . . . . . . . . . . . . . . Fishing . . . . . . . . . . . . . . . . . . . . . . . . . . . . . . . . . . . . . . . . Auxiliary and special . . . . . . . . . . . . . . . . . . . . . . . . . . . . . Other . . . . . . . . . . . . . . . . . . . . . . . . . . . . . . . . . . . . . . . . . . . .
Source: Table 19.
$485 million$229 million$194 million$114 million$80 million$63 million
Fishing Expenditures in Pennsylvania(Total: $485 million)
Equipment 40%
Trip-related47%
Other13%
Percent of Anglers by Residence(Total: 1.1 million participants)
81%
19%
Residents Nonresidents

U.S. Fish and Wildlife Service and U.S. Census Bureau 2011 National Survey of Fishing, Hunting, and Wildlife-Associated Recreation—Pennsylvania 9
Hunters
Participants and Days of Hunting
In 2011, there were 775 thousand residents and nonresidents 16 years old and older who hunted in Pennsyl-vania. Resident hunters numbered 699 thousand, accounting for 90 percent of the hunters in Pennsylvania. There were 76 thousand nonresidents who hunted in Pennsylvania—10 percent of the State’s hunters. Residents and nonresi-
dents hunted 18.2 million days in 2011, an average of 24 days per hunter. Residents hunted 17.6 million days in Pennsylvania or 97 percent of all hunting days, while nonresidents spent 598 thousand days in Pennsylvania or 3 percent of all hunting days.
There were 703 thousand Pennsylvania residents 16 years old and older who hunted in the United States in 2011
for a total of 17.8 million days. An estimated 99 percent of all Pennsyl-vania residents who hunted did so in their home state. Of all hunting days by Pennsylvania residents, 99 percent or 17.6 million were spent pursuing game in their home state. For further informa-tion on hunting activities by Pennsyl-vania residents, see Table 3.
Hunters in Pennsylvania (State residents and nonresidents 16 years old and older)
Hunters. . . . . . . . . . . . . . . . . . . . . . . . . . . . . . . . . . . . . . . . . . . Residents . . . . . . . . . . . . . . . . . . . . . . . . . . . . . . . . . . . . . . . Nonresidents . . . . . . . . . . . . . . . . . . . . . . . . . . . . . . . . . . . . . Days of hunting . . . . . . . . . . . . . . . . . . . . . . . . . . . . . . . . . . . . Residents . . . . . . . . . . . . . . . . . . . . . . . . . . . . . . . . . . . . . . . Nonresidents . . . . . . . . . . . . . . . . . . . . . . . . . . . . . . . . . . . . .
Source: Table 3.
775 thousand699 thousand76 thousand
18.2 million17.6 million
598 thousand
In State/Out of State (State residents 16 years old and older)
Pennsylvania hunters . . . . . . . . . . . . . . . . . . . . . . . . . . . . . . . In Pennsylvania . . . . . . . . . . . . . . . . . . . . . . . . . . . . . . . . . . In other states . . . . . . . . . . . . . . . . . . . . . . . . . . . . . . . . . . . . Days of hunting . . . . . . . . . . . . . . . . . . . . . . . . . . . . . . . . . . . . In Pennsylvania . . . . . . . . . . . . . . . . . . . . . . . . . . . . . . . . . . In other states . . . . . . . . . . . . . . . . . . . . . . . . . . . . . . . . . . . .
… Sample size too small (less than 10) to report data reliably. Source: Table 3.
703 thousand699 thousand
...
17.8 million17.6 million
...

10 2011 National Survey of Fishing, Hunting, and Wildlife-Associated Recreation—Pennsylvania U.S. Fish and Wildlife Service and U.S. Census Bureau
Hunting Expenditures in Pennsylvania
All hunting-related expenditures in Pennsylvania totaled $971 million in 2011. Trip-related expenses, such as food and lodging, transporta-tion, and other trip expenses, totaled $173 million—18 percent of total expenditures. Expenditures for food and lodging were $62 million and transportation expenditures were $99 million. Other trip expenses, such as equipment rental, totaled $12 million for the year. The average trip-related expenditure per hunter was $223.
Hunters spent $564 million on equip-ment—58 percent of all hunting expenditures. Hunting equipment (guns, ammunition, etc.) totaled $319 million and made up 57 percent of all equipment costs. Hunters spent $244 million on auxiliary equipment (tents, special hunting clothes, etc.) and special equipment (boats, vans, etc.), accounting for 43 percent of total equipment expenditures for hunting. Expenditures classified as special and auxiliary equipment are on items that were purchased for hunting but could be used in activities other than hunting.
The purchase of other items, such as magazines, membership dues, licenses, permits, and land leasing, and ownership, cost hunters $234 million—24 percent of all hunting expenditures. For more details on hunting expenditures in Pennsylvania, see Tables 20 through 23.
Hunting Expenditures in Pennsylvania (State residents and nonresidents 16 years old and older)
Total . . . . . . . . . . . . . . . . . . . . . . . . . . . . . . . . . . . . . . . . . . . . . Trip-related . . . . . . . . . . . . . . . . . . . . . . . . . . . . . . . . . . . . . . Equipment . . . . . . . . . . . . . . . . . . . . . . . . . . . . . . . . . . . . . . Hunting . . . . . . . . . . . . . . . . . . . . . . . . . . . . . . . . . . . . . . . Auxiliary and special . . . . . . . . . . . . . . . . . . . . . . . . . . . . Other . . . . . . . . . . . . . . . . . . . . . . . . . . . . . . . . . . . . . . . . . . .
Source: Table 20.
$971 million$173 million$564 million$319 million$244 million$234 million
Hunting Expenditures in Pennsylvania
(Total: $971 million)
Equipment 58%
Trip-related18%
Other24%
Percent of Hunters by Residence(Total: 775 thousand participants)
NonresidentsResidents
90%
10%
Comparative Hunting Expenditures by Type of Hunting
All huntingBig game Small gameMigratory birdsOther animals
$223$205
$61
......
$9 $9
$11
Trip expenditures per hunter:
... Sample size too small (less than 10) to report data reliably.
Trip expenditures per day:
......

U.S. Fish and Wildlife Service and U.S. Census Bureau 2011 National Survey of Fishing, Hunting, and Wildlife-Associated Recreation—Pennsylvania 11
Wildlife Watchers
Participants and Days of Activity
In 2011, 3.6 million U.S. residents 16 years old and older fed, observed, or photographed wildlife in Pennsyl-vania. Most of them, 90 percent (3.2 million), enjoyed their activities close to home and are called “around-the-home” participants. Those persons who enjoyed wildlife at least one mile from
home are called “away-from-home” participants. People participating in away-from-home activities in Pennsylvania in 2011 numbered 809 thousand—22 percent of all wildlife watchers in Pennsylvania. Of the 809 thousand, 502 thousand were state residents and 307 thousand were nonresidents.
Pennsylvanians 16 years old and older who enjoyed away-from-home wildlife watching within their state totaled 502 thousand. Of this group, 502 thousand participants observed wildlife and 191 thousand photographed wildlife. Since some individuals engaged in more than one of the away-from-home activities during the year, the sum of wildlife observers, feeders, and photographers exceeds the total number away-from-home participants.
Pennsylvanians spent 7.2 million days engaged in away-from-home wildlife-watching activities in their state. They spent 6.2 million days observing and 2.3 million days photographing wild-life. For further details about away-from-home activities, see Table 25.
Pennsylvania residents also took an active interest in wildlife around their homes. In 2011, 3.2 million state residents enjoyed observing, feeding, and photographing wildlife within one mile of their homes. Among this around-the-home group, 2.4 million fed, 2.4 million observed, and 1.0 million photographed wildlife around their homes. Another 410 thousand participants maintained natural areas of one-quarter acre or more for wildlife; 300 thousand participants maintained plantings for the benefit of wildlife; and 471 thousand participants visited parks or natural areas within a mile of home because of the wildlife. Summing the number of participants in these six activities results in an estimate that exceeds the total number of around-the-home participants because many people participated in more than one type of around-the-home activity. In addition, 20 percent of Pennsylvanian around-the-home wildlife watchers also enjoyed wildlife away from home. For further details about Pennsylvania residents participating in around-the-home wildlife-watching activities, see Table 27.
Wildlife-Watching Participants in Pennsylvania (State residents and nonresidents 16 years old and older)
Total . . . . . . . . . . . . . . . . . . . . . . . . . . . . . . . . . . . . . . . . . . . . . Around the home . . . . . . . . . . . . . . . . . . . . . . . . . . . . . . . . . Away from home . . . . . . . . . . . . . . . . . . . . . . . . . . . . . . . . .
Note: Detail does not add to total because of multiple responses. Source: Table 24.
3.6 million3.2 million
809 thousand
Away-From-Home Wildlife-Watching Participation in Pennsylvania (State residents and nonresidents 16 years old and older)
Participants, total . . . . . . . . . . . . . . . . . . . . . . . . . . . . . . . . . . Observe wildlife . . . . . . . . . . . . . . . . . . . . . . . . . . . . . . . . . . Photograph wildlife . . . . . . . . . . . . . . . . . . . . . . . . . . . . . . . Feed wildlife. . . . . . . . . . . . . . . . . . . . . . . . . . . . . . . . . . . . .
Days, total . . . . . . . . . . . . . . . . . . . . . . . . . . . . . . . . . . . . . . . . Observe wildlife . . . . . . . . . . . . . . . . . . . . . . . . . . . . . . . . . . Photograph wildlife . . . . . . . . . . . . . . . . . . . . . . . . . . . . . . . Feed wildlife. . . . . . . . . . . . . . . . . . . . . . . . . . . . . . . . . . . . .
Note: Detail does not add to total because of multiple responses. Source: Table 25.
809 thousand807 thousand422 thousand200 thousand
9.6 million8.4 million3.1 million4.2 million
Around-The-Home Wildlife-Watching Participation in Pennsylvania (State residents 16 years old and older)
Total . . . . . . . . . . . . . . . . . . . . . . . . . . . . . . . . . . . . . . . . . . . . . Feed wildlife. . . . . . . . . . . . . . . . . . . . . . . . . . . . . . . . . . . . . Observe wildlife . . . . . . . . . . . . . . . . . . . . . . . . . . . . . . . . . . Photograph wildlife . . . . . . . . . . . . . . . . . . . . . . . . . . . . . . . Maintain natural areas . . . . . . . . . . . . . . . . . . . . . . . . . . . . . Maintain plantings . . . . . . . . . . . . . . . . . . . . . . . . . . . . . . . . Visit parks and natural areas . . . . . . . . . . . . . . . . . . . . . . . .
Note: Detail does not add to total because of multiple responses.Source: Table 27.
3.2 million2.4 million2.4 million1.0 million
410 thousand300 thousand471 thousand

12 2011 National Survey of Fishing, Hunting, and Wildlife-Associated Recreation—Pennsylvania U.S. Fish and Wildlife Service and U.S. Census Bureau
Wild Bird Observers in Pennsylvania (State residents and nonresidents 16 years old and older)
Participants, total . . . . . . . . . . . . . . . . . . . . . . . . . . . . . . . . . . Around the home . . . . . . . . . . . . . . . . . . . . . . . . . . . . . . . . . Away from home . . . . . . . . . . . . . . . . . . . . . . . . . . . . . . . . . Days, total . . . . . . . . . . . . . . . . . . . . . . . . . . . . . . . . . . . . . . . . Around the home . . . . . . . . . . . . . . . . . . . . . . . . . . . . . . . . . Away from home . . . . . . . . . . . . . . . . . . . . . . . . . . . . . . . . .
Note: Detail does not add to total because of multiple responses. Source: Table 29.
Wild Bird Observers
Bird watching attracted many wild-life enthusiasts in Pennsylvania. In 2011, 2.7 million people observed birds around the home and on trips in the state. A majority, 85 percent (2.3 million), observed wild birds around the home while 27 percent (728 thou-sand) took trips away from home to watch birds.
Wildlife-Watching Expenditures in Pennsylvania
Wildlife watchers spent $1.3 billion on wildlife-watching activities in Penn-sylvania in 2011. Trip-related expen-ditures, including food and lodging ($203 million) and transportation ($58 million), amounted to $267 million. This summation comprised 21 percent of all wildlife-watching expenditures by participants. The average of the trip-related expenditures for away-from-home participants was $329 per person in 2011.
Wildlife-watching participants spent nearly $789 million on equipment—62 percent of all their expenditures. Specifically, wildlife-watching equip-ment (binoculars, special clothing, etc.) expenditures totaled $314 million, 40 percent of the equipment total. Auxiliary equipment expenditures (tents, backpacking equipment, etc.) and special equipment expenditures (campers, trucks, etc.) amounted to $475 million—60 percent of all equip-ment costs. Expenditures classified as special and auxiliary equipment are on items that were purchased for wildlife-watching recreation but could be used in activities other than wildlife watching.
Other items purchased by wildlife-watching participants, such as maga-zines, membership dues and contribu-tions, land leasing and ownership, and plantings, totaled $216 million—17 percent of all wildlife-watching expen-ditures. For more details about wildlife-watching expenditures in Pennsylvania, see Table 31.
Wildlife-Watching Expenditures in Pennsylvania
(Total: $1.3 billion)
Equipment 62%
Trip-related21%
Other17%
Away-From-Home Activity by Around-The-Home Participants
(Total: 3.2 million participants)
Both aroundthe homeand away
from home
Around the home only
80%
20%
2.7 million2.3 million
728 thousand
181.4 million176.0 million
5.4 million
Wildlife-Watching Expenditures in Pennsylvania (State residents and nonresidents 16 years old and older)
Total . . . . . . . . . . . . . . . . . . . . . . . . . . . . . . . . . . . . . . . . . . . . . Trip-related . . . . . . . . . . . . . . . . . . . . . . . . . . . . . . . . . . . . . . Equipment . . . . . . . . . . . . . . . . . . . . . . . . . . . . . . . . . . . . . . Wildlife watching . . . . . . . . . . . . . . . . . . . . . . . . . . . . . . . Auxiliary and special . . . . . . . . . . . . . . . . . . . . . . . . . . . . Other . . . . . . . . . . . . . . . . . . . . . . . . . . . . . . . . . . . . . . . . . . .
Source: Table 31.
$1.3 billion$267 million$789 million$314 million$475 million$216 million

U.S. Fish and Wildlife Service and U.S. Census Bureau 2011 National Survey of Fishing, Hunting, and Wildlife-Associated Recreation—Pennsylvania 13
2001–2011 Comparison
Comparing the estimates from the 2001, 2006, and 2011 Surveys gives a perspective on the state of wildlife-related recreation in the early twenty-first century in Pennsylvania. Only the most general recreation comparisons are presented here.
The best way to compare estimates from surveys is not to compare the estimates themselves but to compare the confidence intervals around the esti-
mates. A 90-percent confidence intervalaround the estimate gives the range of estimates that 90 percent of all possiblerepresentative samples would supply. Ifthe 90-percent confidence intervals of the two surveys’ estimates overlap, it is not possible to say the two estimates are statistically different.
The state resident estimates cover the participation and expenditure activity of Pennsylvania residents anywhere in
the United States. The in-state esti-mates cover the participation, day, and expenditure activity if U.S. residents in Pennsylvania.
The expenditure estimates were made comparable by adjusting the estimates for inflation—all estimates are in 2011 dollars.
Pennsylvania 2001 and 2011 Comparison (Numbers in thousands. Expenditures in 2011 dollars)
2001 2011 Percent change FishingAnglers in state . . . . . . . . . . . . . . . . . . . . . . . . . . . . Days in state . . . . . . . . . . . . . . . . . . . . . . . . . . . . . . In-state expenditures by U.S. anglers . . . . . . . . . . . State resident anglers . . . . . . . . . . . . . . . . . . . . . . . Total expenditures by state residents . . . . . . . . . . .
Hunting Hunters in state . . . . . . . . . . . . . . . . . . . . . . . . . . . . Days in state . . . . . . . . . . . . . . . . . . . . . . . . . . . . . .In-state expenditures by U.S. hunters . . . . . . . . . . .State resident hunters . . . . . . . . . . . . . . . . . . . . . . .Total expenditures by state residents . . . . . . . . . . .
Away-From-Home Wildlife Watching Participants in state . . . . . . . . . . . . . . . . . . . . . . . . .Days in state . . . . . . . . . . . . . . . . . . . . . . . . . . . . . . State resident participants . . . . . . . . . . . . . . . . . . . .
Around-The-Home Wildlife Watching Total participants . . . . . . . . . . . . . . . . . . . . . . . . . . . Observers . . . . . . . . . . . . . . . . . . . . . . . . . . . . . . . . Feeders . . . . . . . . . . . . . . . . . . . . . . . . . . . . . . . . . .
Wildlife-Watching Expenditures In-state expenditures by U.S. wildlife watchers . . . Total expenditures by state residents . . . . . . . . . . .
NS Not different from zero at the 10 percent level of significance
1,266 1,101 NS–1318,313 10,136 –45
$737,118 $485,490 –341,270 1,008 –21
$968,142 $429,991 –56
1,000 775 –2313,955 18,247 NS31
$1,195,233 $970,598 NS–19867 703 NS–19
$1,144,602 $995,487 NS–13
1,279 809 –3718,990 9,554 –501,173 734 –37
3,371 3,228 NS–42,325 2,413 NS42,812 2,399 NS–15
$1,221,604 $1,270,888 NS4$1,559,130 $1,002,614 NS–36

14 2011 National Survey of Fishing, Hunting, and Wildlife-Associated Recreation—Pennsylvania U.S. Fish and Wildlife Service and U.S. Census Bureau
Pennsylvania 2006 and 2011 Comparison (Numbers in thousands. Expenditures in 2011 dollars)
2006 2011 Percent change FishingAnglers in state . . . . . . . . . . . . . . . . . . . . . . . . . . . . Days in state . . . . . . . . . . . . . . . . . . . . . . . . . . . . . . In-state expenditures by U.S. anglers . . . . . . . . . . . State resident anglers . . . . . . . . . . . . . . . . . . . . . . . Total expenditures by state residents . . . . . . . . . . .
Hunting Hunters in state . . . . . . . . . . . . . . . . . . . . . . . . . . . . Days in state . . . . . . . . . . . . . . . . . . . . . . . . . . . . . .In-state expenditures by U.S. hunters . . . . . . . . . . .State resident hunters . . . . . . . . . . . . . . . . . . . . . . .Total expenditures by state residents . . . . . . . . . . .
Away-From-Home Wildlife Watching Participants in state . . . . . . . . . . . . . . . . . . . . . . . . .Days in state . . . . . . . . . . . . . . . . . . . . . . . . . . . . . . State resident participants . . . . . . . . . . . . . . . . . . . .
Around-The-Home Wildlife Watching Total participants . . . . . . . . . . . . . . . . . . . . . . . . . . . Observers . . . . . . . . . . . . . . . . . . . . . . . . . . . . . . . . Feeders . . . . . . . . . . . . . . . . . . . . . . . . . . . . . . . . . .
Wildlife-Watching Expenditures In-state expenditures by U.S. wildlife watchers . . . Total expenditures by state residents . . . . . . . . . . .
NS Not different from zero at the 10 percent level of significance
994 1,101 NS1117,967 10,136 –44
$1,440,693 $485,490 –66990 1,008 NS2
$1,813,149 $429,991 –76
1,044 775 –2616,863 18,247 NS8
$1,795,322 $970,598 –46933 703 –25
$1,748,008 $995,487 –43
1,168 809 –3111,972 9,554 NS–201,038 734 NS–29
3,502 3,228 NS–82,349 2,413 NS32,938 2,399 NS–18
$1,609,588 $1,270,888 NS–21$1,906,000 $1,002,614 NS–47
Number of People Who Hunted and Fished in Pennsylvania: 2001–2011(In thousands)
1,266
9941,000 1,044 1,101
775
201120062001
Anglers
Hunters
Number of People Who Wildlife Watched in Pennsylvania: 2001–2011(In thousands)
Around the home
Away from home
201120062001
3,371
1,279
3,502
1,168
3,228
809
Total Expenditures by Participants in Pennsylvania (In millions of 2011 dollars)
Anglers
Hunters
Wildlife Watchers
201120062001
737
1,195 1,222
1,441
1,795
1,610
485
971
1,271

Tables

16 2011 National Survey of Fishing, Hunting, and Wildlife-Associated Recreation—Pennsylvania U.S. Fish and Wildlife Service and U.S. Census Bureau
Guide to Statistical Tables
Purpose and Coverage of Tables
The statistical tables of this report were designed to meet a wide range of needs for those interested in wildlife-related recreation. Special terms used in these tables are defined in Appendix A.
The tables are based on responses to the 2011 Survey, which was designed to collect data about participation in wi ldlife-related recreation. To have taken part in the Survey, a respondent must have been a U.S. resident (a resident of one of the 50 states or the District of Columbia). No one residing outside the United States (including U.S. citizens) was eligible for inter-viewing. Therefore, reported state and national totals do not include partici-pation by those who were not U.S. residents or who were U.S. citizens residing outside the United States.
Comparability With Previous Surveys
The numbers reported can be compared with those in the 1991, 1996, 2001, and 2006 Survey Reports. The methodology used in 2011 was similar to that used in those Surveys. These results should not be directly compared to results from Surveys earlier than 1991 since there were major changes in methodology. These changes were made to improve accuracy in the information provided.
Coverage of an Individual Table
Since the Survey covers many activi-ties in various places by participants of different ages, all table titles, headnotes, stubs, and footnotes are designed to identify and articulate each item being reported in the table. For example, the title of Table 2 shows that data about anglers and hunters, their days of participation, and their number of trips are reported by type of activity. By contrast, the title of Table 7 indi-cates that it contains data on freshwater anglers and the days they fished for different species.
Percentages Reported in the Tables
Percentages are reported in the tables for the convenience of the user. When exclusive groups are being reported, the base of a percentage is apparent from its context because the percents add to 100 percent (plus or minus a rounding error). For example, Table 2 reports the number of trips taken by big game hunters, those taken by small game hunters, those taken by migratory bird hunters, and those taken by hunters pursuing other animals. These comprise 100 percent because they are exclusive categories.
Percents should not add to 100 when nonexclusive groups are being reported. Using Table 2 as an example again, note that adding the percentages associated with the total number of big game hunters, total small game hunters, total migratory bird hunters, and total hunters of other animals will not yield total hunters because respondents could hunt for more than one type of game.
When the base of the percentage is not apparent in context, it is identified in a footnote. For example, Table 15 reports two percentages with different bases: one base being the number of total participants at the head of the column and the other base being the total popu-lation who are described by the row category. Footnotes are used to clarify the bases of the reported percentages.
Footnotes to the Tables
Footnotes are used to clarify the infor-mation or items that are being reported in a table. Symbols in the body of a table indicate important footnotes. The following symbols are used in the tables to refer to the same footnote each time they appear:
* Estimate based on a sample size of 10–29.
... Sample size too small to report data reliably.
Z Less than 0.5 percent.X Not applicable.NA Not available. Estimates based upon fewer than ten responses are regarded as being based on a sample size that is too small for reliable reporting. An estimate based upon at least 10 but fewer than 30 responses is treated as an estimate based on a small sample size. Other footnotes appear, as necessary, to qualify or clarify the estimates reported in the tables. In addition, these two important footnotes appear frequently:
• Detail does not add to total because of multiple responses.
• Detail does not add to total because of multiple responses and nonresponse.
“Multiple responses” is a term used to reflect the fact that individuals or their characteristics fall into more than one category. Using Table 5 as an example, those who fished in saltwater and fresh-water appear in both of these totals. Yet each angler is represented only once in the “Total, all fishing” row. Simi-larly, in Table 12, those who hunt for big game and small game are counted only once as a hunter in the “Total, all hunting” row. Therefore, totals will be smaller than the sum of subcategories when multiple responses exist.
“Nonresponse” exists because the Survey questions were answered volun-tarily, and some respondents did not or could not answer all the questions.

U.S. Fish and Wildlife Service and U.S. Census Bureau 2011 National Survey of Fishing, Hunting, and Wildlife-Associated Recreation—Pennsylvania 17
Table 1. Fishing and Hunting in Pennsylvania by Resident and Nonresident Sportspersons: 2011(Population 16 years old and older. Numbers in thousands)
Sportspersons
Total, state residents and nonresidents State residents Nonresidents
Percent of Percent of Percent of resident nonresident
Number sportspersons Number sportspersons Number sportspersonsTotal sportspersons (fished or hunted) . . . . . . . . . . 1,424 100 1,164 100 261 100
Total anglers . . . . . . . . . . . . . . . . . . . . . . . . . . . . . 1,101 77 891 77 210 81 Fished only . . . . . . . . . . . . . . . . . . . . . . . . . . . . . 649 46 465 40 185 71 Fished and hunted . . . . . . . . . . . . . . . . . . . . . . . . 452 32 426 37 ... ...
Total hunters . . . . . . . . . . . . . . . . . . . . . . . . . . . . . 775 54 699 60 *76 *29 Hunted only . . . . . . . . . . . . . . . . . . . . . . . . . . . . . 323 23 273 23 *50 *19 Hunted and fished . . . . . . . . . . . . . . . . . . . . . . . . 452 32 426 37 ... ...
* Estimate based on a sample size of 10–29. … Sample size too small (less than 10) to report data reliably.
Note: Detail does not add to total because of multiple responses.
Table 2. Anglers and Hunters, Days of Participation, and Trips in Pennsylvania by Type of Fishing and Hunting: 2011(Population 16 years old and older. Numbers in thousands)
Type of fishing and huntingParticipants Days of participation Trips
Number Percent Number Percent Number PercentFISHING
Total, all fishing . . . . . . . . . . . . . . . . . . . . . . . . . . . 1,101 100 10,136 100 7,794 100 Total, all freshwater . . . . . . . . . . . . . . . . . . . . . . . 904 82 9,294 92 7,794 100 Freshwater, except Great Lakes . . . . . . . . . . . 874 79 8,906 88 7,620 98 Great Lakes . . . . . . . . . . . . . . . . . . . . . . . . . . . ... ... ... ... ... ... Saltwater . . . . . . . . . . . . . . . . . . . . . . . . . . . . . . . (X) (X) (X) (X) (X) (X)
HUNTING
Total, all hunting . . . . . . . . . . . . . . . . . . . . . . . . . . 775 100 18,247 100 22,364 100 Big game . . . . . . . . . . . . . . . . . . . . . . . . . . . . . . . 755 97 17,389 95 20,696 93 Small game . . . . . . . . . . . . . . . . . . . . . . . . . . . . . *204 *26 *1,152 *6 *1,118 *5 Migratory birds . . . . . . . . . . . . . . . . . . . . . . . . . . ... ... ... ... ... ... Other animals . . . . . . . . . . . . . . . . . . . . . . . . . . . ... ... ... ... ... ...
* Estimate based on a sample size of 10–29. … Sample size too small (less than 10) to report data reliably.
Note: Detail does not add to total because of multiple responses.
(X) Not applicable.
18 2011 National Survey of Fishing, Hunting, and Wildlife-Associated Recreation—Pennsylvania U.S. Fish and Wildlife Service and U.S. Census Bureau
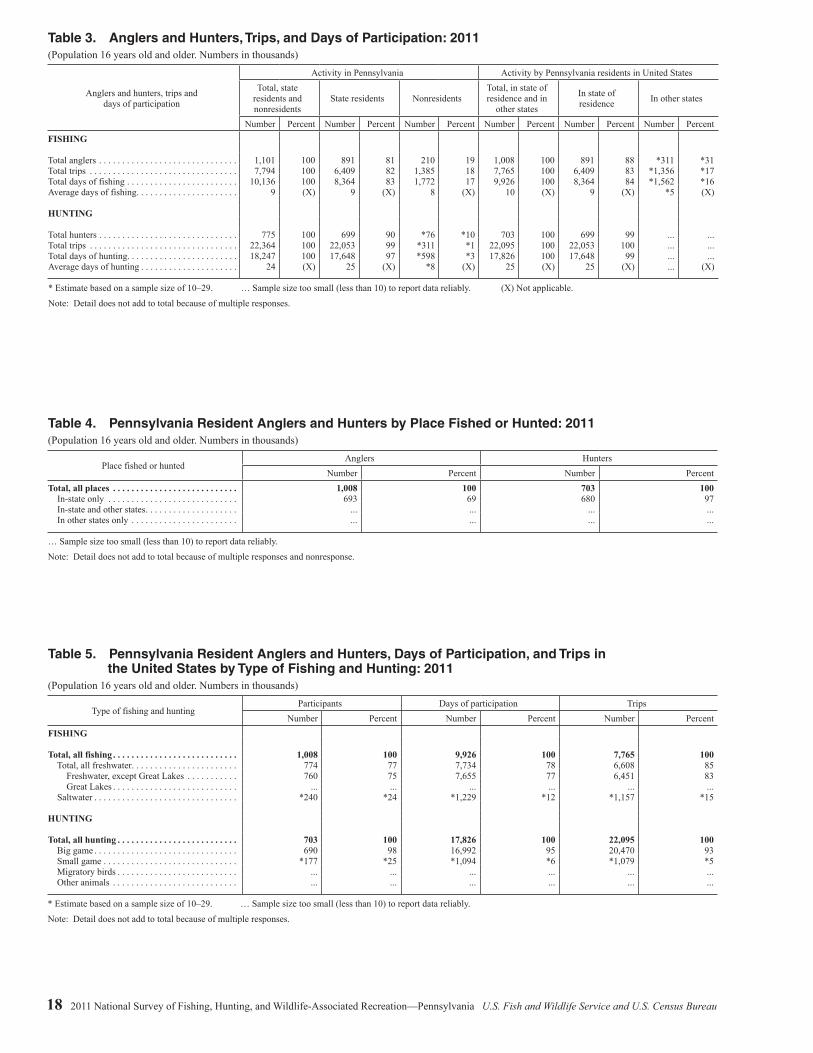
Table 3. Anglers and Hunters, Trips, and Days of Participation: 2011(Population 16 years old and older. Numbers in thousands)
Anglers and hunters, trips and days of participation
Activity in Pennsylvania Activity by Pennsylvania residents in United StatesTotal, state
residents and nonresidents
State residents NonresidentsTotal, in state of residence and in
other states
In state of residence In other states
Number Percent Number Percent Number Percent Number Percent Number Percent Number PercentFISHING
Total anglers . . . . . . . . . . . . . . . . . . . . . . . . . . . . . . 1,101 100 891 81 210 19 1,008 100 891 88 *311 *31 Total trips . . . . . . . . . . . . . . . . . . . . . . . . . . . . . . . . 7,794 100 6,409 82 1,385 18 7,765 100 6,409 83 *1,356 *17 Total days of fishing . . . . . . . . . . . . . . . . . . . . . . . . 10,136 100 8,364 83 1,772 17 9,926 100 8,364 84 *1,562 *16 Average days of fishing. . . . . . . . . . . . . . . . . . . . . . 9 (X) 9 (X) 8 (X) 10 (X) 9 (X) *5 (X)
HUNTING
Total hunters . . . . . . . . . . . . . . . . . . . . . . . . . . . . . . 775 100 699 90 *76 *10 703 100 699 99 ... ... Total trips . . . . . . . . . . . . . . . . . . . . . . . . . . . . . . . . 22,364 100 22,053 99 *311 *1 22,095 100 22,053 100 ... ... Total days of hunting. . . . . . . . . . . . . . . . . . . . . . . . 18,247 100 17,648 97 *598 *3 17,826 100 17,648 99 ... ... Average days of hunting . . . . . . . . . . . . . . . . . . . . . 24 (X) 25 (X) *8 (X) 25 (X) 25 (X) ... (X)
* Estimate based on a sample size of 10–29. … Sample size too small (less than 10) to report data reliably.
Note: Detail does not add to total because of multiple responses.
(X) Not applicable.
Table 4. Pennsylvania Resident Anglers and Hunters by Place Fished or Hunted: 2011(Population 16 years old and older. Numbers in thousands)
Place fished or huntedAnglers Hunters
Number Percent Number PercentTotal, all places . . . . . . . . . . . . . . . . . . . . . . . . . . . 1,008 100 703 100 In-state only . . . . . . . . . . . . . . . . . . . . . . . . . . . . 693 69 680 97 In-state and other states . . . . . . . . . . . . . . . . . . . . ... ... ... ... In other states only . . . . . . . . . . . . . . . . . . . . . . . ... ... ... ...
… Sample size too small (less than 10) to report data reliably.
Note: Detail does not add to total because of multiple responses and nonresponse.
Table 5. Pennsylvania Resident Anglers and Hunters, Days of Participation, and Trips in the United States by Type of Fishing and Hunting: 2011(Population 16 years old and older. Numbers in thousands)
Type of fishing and huntingParticipants Days of participation Trips
Number Percent Number Percent Number PercentFISHING
Total, all fishing . . . . . . . . . . . . . . . . . . . . . . . . . . . 1,008 100 9,926 100 7,765 100 Total, all freshwater . . . . . . . . . . . . . . . . . . . . . . . 774 77 7,734 78 6,608 85 Freshwater, except Great Lakes . . . . . . . . . . . 760 75 7,655 77 6,451 83 Great Lakes . . . . . . . . . . . . . . . . . . . . . . . . . . . ... ... ... ... ... ... Saltwater . . . . . . . . . . . . . . . . . . . . . . . . . . . . . . . *240 *24 *1,229 *12 *1,157 *15
HUNTING
Total, all hunting . . . . . . . . . . . . . . . . . . . . . . . . . . 703 100 17,826 100 22,095 100 Big game . . . . . . . . . . . . . . . . . . . . . . . . . . . . . . . 690 98 16,992 95 20,470 93 Small game . . . . . . . . . . . . . . . . . . . . . . . . . . . . . *177 *25 *1,094 *6 *1,079 *5 Migratory birds . . . . . . . . . . . . . . . . . . . . . . . . . . ... ... ... ... ... ... Other animals . . . . . . . . . . . . . . . . . . . . . . . . . . . ... ... ... ... ... ...
* Estimate based on a sample size of 10–29. … Sample size too small (less than 10) to report data reliably.
Note: Detail does not add to total because of multiple responses.

U.S. Fish and Wildlife Service and U.S. Census Bureau 2011 National Survey of Fishing, Hunting, and Wildlife-Associated Recreation—Pennsylvania 19
Table 6. Freshwater Anglers, Trips, Days of Fishing, and Type of Water Fished: 2011(Population 16 years old and older. Numbers in thousands)
Anglers, trips, and days of fishing
Activity in PennsylvaniaTotal, state residents
and nonresidents State residents Nonresidents
Number Percent Number Percent Number PercentTotal anglers . . . . . . . . . . . . . . . . . . . . . . . . . . . . . . . . . . . . . . . . 874 100 695 80 179 20 Total trips . . . . . . . . . . . . . . . . . . . . . . . . . . . . . . . . . . . . . . . . . . . 7,620 100 6,263 82 1,357 18 Total days of fishing . . . . . . . . . . . . . . . . . . . . . . . . . . . . . . . . . . 8,906 100 7,335 82 1,572 18 Average days of fishing. . . . . . . . . . . . . . . . . . . . . . . . . . . . . . . . . 10 (X) 11 (X) 9 (X)
ANGLERS
Total, all types of water . . . . . . . . . . . . . . . . . . . . . . . . . . . . . . . . 874 100 695 80 179 20 Ponds, lakes, or reservoirs . . . . . . . . . . . . . . . . . . . . . . . . . . . . 653 100 535 82 *118 *18 Rivers or streams . . . . . . . . . . . . . . . . . . . . . . . . . . . . . . . . . . . . 405 100 314 78 *91 *22
DAYS
Total, all types of water . . . . . . . . . . . . . . . . . . . . . . . . . . . . . . . . 8,906 100 7,335 82 1,572 18 Ponds, lakes, or reservoirs . . . . . . . . . . . . . . . . . . . . . . . . . . . . 4,676 100 3,829 82 *848 *18 Rivers or streams . . . . . . . . . . . . . . . . . . . . . . . . . . . . . . . . . . . . 4,496 100 3,845 86 *651 *14
* Estimate based on a sample size of 10–29. (X) Not applicable.
Note: Detail does not add to total because of multiple responses.
Table 7. Freshwater Anglers and Days of Fishing in Pennsylvania by Type of Fish: 2011(Population 16 years old and older. Numbers in thousands)
Anglers and days of fishing
Activity in PennsylvaniaTotal, state residents and nonresidents State residents Nonresidents
NumberPercent of total types
Percent of anglers/days Number
Percent of anglers/days Number
Percent of anglers/days
ANGLERS
Total, all types of fish . . . . . . . . . . . . . . . . . . . . . . . . . . . . . . . . . 874 100 100 695 80 179 20 Crappie . . . . . . . . . . . . . . . . . . . . . . . . . . . . . . . . . . . . . . . . . . . *36 *4 *100 ... ... ... ... Panfish. . . . . . . . . . . . . . . . . . . . . . . . . . . . . . . . . . . . . . . . . . . . *248 *28 *100 *208 *84 ... ... White bass, striped bass, striped bass hybrids . . . . . . . . . . . . . ... ... ... ... ... ... ... Black bass . . . . . . . . . . . . . . . . . . . . . . . . . . . . . . . . . . . . . . . . . 509 58 100 *418 *82 *91 *18 Catfish, bullheads . . . . . . . . . . . . . . . . . . . . . . . . . . . . . . . . . . . ... ... ... ... ... ... ... Walleye, sauger . . . . . . . . . . . . . . . . . . . . . . . . . . . . . . . . . . . . . *62 *7 *100 ... ... ... ... Northern pike, pickerel, muskie, muskie hybrids . . . . . . . . . . . ... ... ... ... ... ... ... Steelhead . . . . . . . . . . . . . . . . . . . . . . . . . . . . . . . . . . . . . . . . . . ... ... ... ... ... ... ... Trout . . . . . . . . . . . . . . . . . . . . . . . . . . . . . . . . . . . . . . . . . . . . . 412 47 100 *314 *76 *97 *24 Salmon . . . . . . . . . . . . . . . . . . . . . . . . . . . . . . . . . . . . . . . . . . . ... ... ... ... ... ... ... Anything1. . . . . . . . . . . . . . . . . . . . . . . . . . . . . . . . . . . . . . . . . . *63 *7 *100 ... ... ... ... Other freshwater fish . . . . . . . . . . . . . . . . . . . . . . . . . . . . . . . . . ... ... ... ... ... ... ...
DAYS
Total, all types of fish . . . . . . . . . . . . . . . . . . . . . . . . . . . . . . . . . 8,906 100 100 7,335 82 1,572 18 Crappie . . . . . . . . . . . . . . . . . . . . . . . . . . . . . . . . . . . . . . . . . . . *685 *8 *100 ... ... ... ... Panfish. . . . . . . . . . . . . . . . . . . . . . . . . . . . . . . . . . . . . . . . . . . . *1,635 *18 *100 *1,500 *92 ... ... White bass, striped bass, striped bass hybrids . . . . . . . . . . . . . ... ... ... ... ... ... ... Black bass . . . . . . . . . . . . . . . . . . . . . . . . . . . . . . . . . . . . . . . . . 3,200 36 100 *2,587 *81 *614 *19 Catfish, bullheads . . . . . . . . . . . . . . . . . . . . . . . . . . . . . . . . . . . ... ... ... ... ... ... ... Walleye, sauger . . . . . . . . . . . . . . . . . . . . . . . . . . . . . . . . . . . . . *598 *7 *100 ... ... ... ... Northern pike, pickerel, muskie, muskie hybrids . . . . . . . . . . . ... ... ... ... ... ... ... Steelhead . . . . . . . . . . . . . . . . . . . . . . . . . . . . . . . . . . . . . . . . . . ... ... ... ... ... ... ... Trout . . . . . . . . . . . . . . . . . . . . . . . . . . . . . . . . . . . . . . . . . . . . . 4,527 51 100 *3,763 *83 *764 *17 Salmon . . . . . . . . . . . . . . . . . . . . . . . . . . . . . . . . . . . . . . . . . . . ... ... ... ... ... ... ... Anything1. . . . . . . . . . . . . . . . . . . . . . . . . . . . . . . . . . . . . . . . . . *460 *5 *100 ... ... ... ... Other freshwater fish . . . . . . . . . . . . . . . . . . . . . . . . . . . . . . . . . ... ... ... ... ... ... ...
* Estimate based on a sample size of 10–29. … Sample size too small (less than 10) to report data reliably.1 Respondent fished for no specific species and identified “Anything” from a list of categories of fish.
Note: Detail does not add to total because of multiple responses.

20 2011 National Survey of Fishing, Hunting, and Wildlife-Associated Recreation—Pennsylvania U.S. Fish and Wildlife Service and U.S. Census Bureau
Table 8. Great Lakes Anglers, Trips, and Days of Fishing in Pennsylvania: 2011(Population 16 years old and older. Numbers in thousands)
Anglers, trips, and days of fishing
Activity in PennsylvaniaTotal, state residents and nonresi-
dents State residents Nonresidents
Number Percent Number Percent Number PercentTotal anglers . . . . . . . . . . . . . . . . . . . . . . . . . . . . . . . . . . . . . . . .Total trips . . . . . . . . . . . . . . . . . . . . . . . . . . . . . . . . . . . . . . . . . . .Total days . . . . . . . . . . . . . . . . . . . . . . . . . . . . . . . . . . . . . . . . . . .Average days of fishing. . . . . . . . . . . . . . . . . . . . . . . . . . . . . . . . .
... ... ... ...
... ... ...
(X)
... ... ... ...
... ... ...
(X)
... ... ... ...
... ... ...
(X)
… Sample size too small (less than 10) to report data reliably. (X) Not applicable.
Table 9. Great Lakes Anglers and Days of Fishing in Pennsylvania by Type of Fish: 2011(Population 16 years old and older. Numbers in thousands)
Anglers and days of fishing
Activity in PennsylvaniaTotal, state residents and nonresidents State residents Nonresidents
NumberPercent of total types
Percent of anglers/days Number
Percent of anglers/days Number
Percent of anglers/days
ANGLERS
Total, all types of fish . . . . . . . . . . . . . . . . . . . . . . . . . . . . . . . . . ... ... ... ... ... ... ... Perch . . . . . . . . . . . . . . . . . . . . . . . . . . . . . . . . . . . . . . . . . . . . . ... ... ... ... ... ... ... Black bass . . . . . . . . . . . . . . . . . . . . . . . . . . . . . . . . . . . . . . . . . ... ... ... ... ... ... ... Walleye, sauger . . . . . . . . . . . . . . . . . . . . . . . . . . . . . . . . . . . . . ... ... ... ... ... ... ... Northern pike, pickerel, muskie, muskie hybrids . . . . . . . . . . . ... ... ... ... ... ... ... Salmon . . . . . . . . . . . . . . . . . . . . . . . . . . . . . . . . . . . . . . . . . . . ... ... ... ... ... ... ... Steelhead . . . . . . . . . . . . . . . . . . . . . . . . . . . . . . . . . . . . . . . . . . ... ... ... ... ... ... ... Lake trout . . . . . . . . . . . . . . . . . . . . . . . . . . . . . . . . . . . . . . . . . ... ... ... ... ... ... ... Other trout . . . . . . . . . . . . . . . . . . . . . . . . . . . . . . . . . . . . . . . . . ... ... ... ... ... ... ... Anything1. . . . . . . . . . . . . . . . . . . . . . . . . . . . . . . . . . . . . . . . . . ... ... ... ... ... ... ... Other Great Lakes fish . . . . . . . . . . . . . . . . . . . . . . . . . . . . . . . ... ... ... ... ... ... ...
DAYS
Total, all types of fish . . . . . . . . . . . . . . . . . . . . . . . . . . . . . . . . . ... ... ... ... ... ... ... Perch . . . . . . . . . . . . . . . . . . . . . . . . . . . . . . . . . . . . . . . . . . . . . ... ... ... ... ... ... ... Black bass . . . . . . . . . . . . . . . . . . . . . . . . . . . . . . . . . . . . . . . . . ... ... ... ... ... ... ... Walleye, sauger . . . . . . . . . . . . . . . . . . . . . . . . . . . . . . . . . . . . . ... ... ... ... ... ... ... Northern pike, pickerel, muskie, muskie hybrids . . . . . . . . . . . ... ... ... ... ... ... ... Salmon . . . . . . . . . . . . . . . . . . . . . . . . . . . . . . . . . . . . . . . . . . . ... ... ... ... ... ... ... Steelhead . . . . . . . . . . . . . . . . . . . . . . . . . . . . . . . . . . . . . . . . . . ... ... ... ... ... ... ... Lake trout . . . . . . . . . . . . . . . . . . . . . . . . . . . . . . . . . . . . . . . . . ... ... ... ... ... ... ... Other trout . . . . . . . . . . . . . . . . . . . . . . . . . . . . . . . . . . . . . . . . . ... ... ... ... ... ... ... Anything1. . . . . . . . . . . . . . . . . . . . . . . . . . . . . . . . . . . . . . . . . . ... ... ... ... ... ... ... Other Great Lakes fish . . . . . . . . . . . . . . . . . . . . . . . . . . . . . . . ... ... ... ... ... ... ...
… Sample size too small (less than 10) to report data reliably.1 Respondent fished for no specific species and identified “Anything” from a list of categories of fish.

U.S. Fish and Wildlife Service and U.S. Census Bureau 2011 National Survey of Fishing, Hunting, and Wildlife-Associated Recreation—Pennsylvania 21
Table 10. Saltwater Anglers, Trips, and Days of Fishing in Pennsylvania: 2011
This table does not apply to this state.
Table 11. Saltwater Anglers and Days of Fishing in Pennsylvania by Type of Fish: 2011
This table does not apply to this state.

22 2011 National Survey of Fishing, Hunting, and Wildlife-Associated Recreation—Pennsylvania U.S. Fish and Wildlife Service and U.S. Census Bureau
Table 12. Hunters, Trips, and Days of Hunting in Pennsylvania by Type of Hunting: 2011(Population 16 years old and older. Numbers in thousands)
Hunters, trips, and days of hunting
Activity in PennsylvaniaTotal, state residents
and nonresidents State residents Nonresidents
Number Percent Number Percent Number PercentHUNTERS
Total, all hunting . . . . . . . . . . . . . . . . . . . . . . . . . . 775 100 699 90 *76 *10 Big game . . . . . . . . . . . . . . . . . . . . . . . . . . . . . . . 755 100 690 91 *65 *9 Small game . . . . . . . . . . . . . . . . . . . . . . . . . . . . . *204 *100 *177 *87 ... ... Migratory birds . . . . . . . . . . . . . . . . . . . . . . . . . . ... ... ... ... ... ... Other animals . . . . . . . . . . . . . . . . . . . . . . . . . . . ... ... ... ... ... ...
TRIPS
Total, all hunting . . . . . . . . . . . . . . . . . . . . . . . . . . 22,364 100 22,053 99 *311 *1 Big game . . . . . . . . . . . . . . . . . . . . . . . . . . . . . . . 20,696 100 20,428 99 *268 *1 Small game . . . . . . . . . . . . . . . . . . . . . . . . . . . . . *1,118 *100 *1,079 *97 ... ... Migratory birds . . . . . . . . . . . . . . . . . . . . . . . . . . ... ... ... ... ... ... Other animals . . . . . . . . . . . . . . . . . . . . . . . . . . . ... ... ... ... ... ...
DAYS
Total, all hunting . . . . . . . . . . . . . . . . . . . . . . . . . . 18,247 100 17,648 97 *598 *3 Big game . . . . . . . . . . . . . . . . . . . . . . . . . . . . . . . 17,389 100 16,814 97 *575 *3 Small game . . . . . . . . . . . . . . . . . . . . . . . . . . . . . *1,152 *100 *1,094 *95 ... ... Migratory birds . . . . . . . . . . . . . . . . . . . . . . . . . . ... ... ... ... ... ... Other animals . . . . . . . . . . . . . . . . . . . . . . . . . . . ... ... ... ... ... ...
* Estimate based on a sample size of 10–29. … Sample size too small (less than 10) to report data reliably.
Note: Detail does not add to total because of multiple responses.
Table 13. Hunters and Days of Hunting in Pennsylvania by Type of Game: 2011(Population 16 years old and older. Numbers in thousands)
Type of gameHunters, state residents and nonresidents Days of hunting
Number Percent Number PercentTotal, all types of game . . . . . . . . . . . . . . . . . . . . . 775 100 18,247 100
Big game, total . . . . . . . . . . . . . . . . . . . . . . . . . . 755 97 17,389 95 Deer . . . . . . . . . . . . . . . . . . . . . . . . . . . . . . . . . 714 92 15,245 84 Elk . . . . . . . . . . . . . . . . . . . . . . . . . . . . . . . . . . ... ... ... ... Bear . . . . . . . . . . . . . . . . . . . . . . . . . . . . . . . . . *85 *11 *233 *1 Wild turkey . . . . . . . . . . . . . . . . . . . . . . . . . . . 234 30 1,663 9 Other big game . . . . . . . . . . . . . . . . . . . . . . . . ... ... ... ...
Small game, total . . . . . . . . . . . . . . . . . . . . . . . . *204 *26 *1,152 *6 Rabbit, hare . . . . . . . . . . . . . . . . . . . . . . . . . . . *57 *7 *584 *3 Quail . . . . . . . . . . . . . . . . . . . . . . . . . . . . . . . . ... ... ... ... Grouse/prairie chicken . . . . . . . . . . . . . . . . . . *64 *8 *253 *1 Squirrel . . . . . . . . . . . . . . . . . . . . . . . . . . . . . . *137 *18 *854 *5 Pheasant . . . . . . . . . . . . . . . . . . . . . . . . . . . . . ... ... ... ... Other small game . . . . . . . . . . . . . . . . . . . . . . ... ... ... ...
Migratory birds, total . . . . . . . . . . . . . . . . . . . . ... ... ... ... Waterfowl . . . . . . . . . . . . . . . . . . . . . . . . . . . . ... ... ... ... Geese . . . . . . . . . . . . . . . . . . . . . . . . . . . . . . ... ... ... ... Ducks . . . . . . . . . . . . . . . . . . . . . . . . . . . . . ... ... ... ... Doves . . . . . . . . . . . . . . . . . . . . . . . . . . . . . . . ... ... ... ... Other migratory birds . . . . . . . . . . . . . . . . . . . ... ... ... ...
Other animals, total1 . . . . . . . . . . . . . . . . . . . . . ... ... ... ...
* Estimate based on a sample size of 10–29. … Sample size too small (less than 10) to report data reliably.1 Includes groundhog, raccoon, fox, coyote, crow, prairie dog, etc.
Note: Detail does not add to total because of multiple responses.

U.S. Fish and Wildlife Service and U.S. Census Bureau 2011 National Survey of Fishing, Hunting, and Wildlife-Associated Recreation—Pennsylvania 23
Table 14. Hunters and Days of Hunting in Pennsylvania by Type of Land: 2011(Population 16 years old and older. Numbers in thousands)
Hunters and days of huntingTotal, state residents
and nonresidents State residents Nonresidents
Number Percent Number Percent Number PercentHUNTERS
Total, all types of land . . . . . . . . . . . . . . . . . . . . . . 775 100 699 100 *76 *100
Public land, total . . . . . . . . . . . . . . . . . . . . . . . . 266 34 *236 *34 ... ... Public land only . . . . . . . . . . . . . . . . . . . . . . . *115 *15 ... ... ... ... Public and private land . . . . . . . . . . . . . . . . . . *152 *20 *138 *20 ... ...
Private land, total . . . . . . . . . . . . . . . . . . . . . . . 620 80 564 81 *56 *74 Private land only . . . . . . . . . . . . . . . . . . . . . . . 468 60 425 61 *43 *57 Private and public land . . . . . . . . . . . . . . . . . . *152 *20 *138 *20 ... ...
DAYS
Total, all types of land . . . . . . . . . . . . . . . . . . . . . . 18,247 100 17,648 100 *598 *100 Public land1 . . . . . . . . . . . . . . . . . . . . . . . . . . . . . 3,219 18 *2,976 *17 ... ... Private land2 . . . . . . . . . . . . . . . . . . . . . . . . . . . . 14,335 79 13,943 79 *392 *66
* Estimate based on a sample size of 10–29. … Sample size too small (less than 10) to report data reliably.1 Days of hunting on public land includes both days spent solely on public land and those spent on public and private land.2 Days of hunting on private land includes both days spent solely on private land and those spent on private and public land.
Note: Detail does not add to total because of multiple responses and nonresponse.

24 2011 National Survey of Fishing, Hunting, and Wildlife-Associated Recreation—Pennsylvania U.S. Fish and Wildlife Service and U.S. Census Bureau
Table 15. Selected Characteristics of Pennsylvania Resident Anglers and Hunters: 2011(Population 16 years old and older. Numbers in thousands)
Characteristic
Population Sportspersons (fished or hunted) Anglers Hunters
Number Percent Number
Percent who par-ticipated
Percent of
sports- persons Number
Percent who par-ticipated
Percent of anglers Number
Percent who par-ticipated
Percent of hunters
Total persons . . . . . . . . . . . . . . . . . . . . . . . . . . .
Population Density of Residence
10,036 100 1,277 13 100 1,008 10 100 703 7 100
Urban . . . . . . . . . . . . . . . . . . . . . . . . . . . . . . . . 7,203 72 707 10 55 620 9 61 *293 *4 *42 Rural . . . . . . . . . . . . . . . . . . . . . . . . . . . . . . . .
Population Size of Residence
2,834 28 570 20 45 389 14 39 410 14 58
Metropolitan Statistical Area (MSA) . . . . . . . 9,592 96 1,108 12 87 901 9 89 570 6 81 1,000,000 or more . . . . . . . . . . . . . . . . . . . . 4,743 47 541 11 42 *467 *10 *46 *245 *5 *35 250,000 to 999,999 . . . . . . . . . . . . . . . . . . . 3,203 32 *219 *7 *17 *198 *6 *20 *73 *2 *10 50,000 to 249,999 . . . . . . . . . . . . . . . . . . . . 1,646 16 347 21 27 *236 *14 *23 *252 *15 *36 Outside MSA . . . . . . . . . . . . . . . . . . . . . . . . . .
Sex
444 4 *169 *38 *13 *107 *24 *11 *133 *30 *19
Male . . . . . . . . . . . . . . . . . . . . . . . . . . . . . . . . 4,795 48 1,097 23 86 853 18 85 624 13 89 Female . . . . . . . . . . . . . . . . . . . . . . . . . . . . . . .
Age
5,242 52 *180 *3 *14 *156 *3 *15 ... ... ...
16 to 17 years . . . . . . . . . . . . . . . . . . . . . . . . . 447 4 ... ... ... ... ... ... ... ... ... 18 to 24 years . . . . . . . . . . . . . . . . . . . . . . . . . 1,485 15 *102 *7 *8 ... ... ... ... ... ... 25 to 34 years . . . . . . . . . . . . . . . . . . . . . . . . . 1,234 12 *143 *12 *11 *112 *9 *11 ... ... ... 35 to 44 years . . . . . . . . . . . . . . . . . . . . . . . . . 1,577 16 *257 *16 *20 *203 *13 *20 *169 *11 *24 45 to 54 years . . . . . . . . . . . . . . . . . . . . . . . . . 2,169 22 283 13 22 *219 *10 *22 *233 *11 *33 55 to 64 years . . . . . . . . . . . . . . . . . . . . . . . . . 1,455 14 *259 *18 *20 *182 *12 *18 *94 *6 *13 65 years and older . . . . . . . . . . . . . . . . . . . . . . 1,670 17 *139 *8 *11 ... ... ... ... ... ... 65 to 74 years . . . . . . . . . . . . . . . . . . . . . . . 1,049 10 ... ... ... ... ... ... ... ... ... 75 and older . . . . . . . . . . . . . . . . . . . . . . . . .
Ethnicity
622 6 ... ... ... ... ... ... ... ... ...
Hispanic . . . . . . . . . . . . . . . . . . . . . . . . . . . . . *548 *5 ... ... ... ... ... ... ... ... ... Non-Hispanic . . . . . . . . . . . . . . . . . . . . . . . . .
Race
9,489 95 1,277 13 100 1,008 11 100 703 7 100
White . . . . . . . . . . . . . . . . . . . . . . . . . . . . . . . . 8,422 84 1,152 14 90 893 11 89 688 8 98 African American . . . . . . . . . . . . . . . . . . . . . . 778 8 ... ... ... ... ... ... ... ... ... All others . . . . . . . . . . . . . . . . . . . . . . . . . . . . .
Annual Household Income
836 8 ... ... ... ... ... ... ... ... ...
Less than $20,000 . . . . . . . . . . . . . . . . . . . . . . 673 7 ... ... ... ... ... ... ... ... ... $20,000 to $29,999 . . . . . . . . . . . . . . . . . . . . . 1,047 10 ... ... ... ... ... ... ... ... ... $30,000 to $39,999 . . . . . . . . . . . . . . . . . . . . . 959 10 *179 *19 *14 *125 *13 *12 *145 *15 *21 $40,000 to $49,999 . . . . . . . . . . . . . . . . . . . . . 871 9 *128 *15 *10 ... ... ... ... ... ... $50,000 to $74,999 . . . . . . . . . . . . . . . . . . . . . 1,433 14 345 24 27 *299 *21 *30 *160 *11 *23 $75,000 to $99,999 . . . . . . . . . . . . . . . . . . . . . 723 7 ... ... ... ... ... ... ... ... ... $100,000 to $149,999 . . . . . . . . . . . . . . . . . . . 1,173 12 *264 *23 *21 *217 *19 *22 *177 *15 *25 $150,000 or more . . . . . . . . . . . . . . . . . . . . . . 976 10 ... ... ... ... ... ... ... ... ... Not reported . . . . . . . . . . . . . . . . . . . . . . . . . .
Education
2,183 22 *83 *4 *6 *60 *3 *6 *52 *2 *7
11 years or less . . . . . . . . . . . . . . . . . . . . . . . . 1,268 13 *147 *12 *12 *124 *10 *12 ... ... ... 12 years . . . . . . . . . . . . . . . . . . . . . . . . . . . . . . 4,084 41 500 12 39 336 8 33 339 8 48 1 to 3 years of college . . . . . . . . . . . . . . . . . . . 1,801 18 *299 *17 *23 *262 *15 *26 *123 *7 *18 4 years or more of college . . . . . . . . . . . . . . . . 2,884 29 *331 *11 *26 *286 *10 *28 *194 *7 *28
* Estimate based on a sample size of 10–29. … Sample size too small (less than 10) to report data reliably.
Note: Detail does not add to total because of multiple responses. Percent who participated columns show the percent of each row’s population who participated in the activity named by the column (the percent of those living in urban areas who fished, etc.). Remaining percent columns show the percent of each column’s participants who are described by the row heading (the percent of anglers who lived in urban areas, etc.).

U.S. Fish and Wildlife Service and U.S. Census Bureau 2011 National Survey of Fishing, Hunting, and Wildlife-Associated Recreation—Pennsylvania 25
Table 16. Summary of Expenditures in Pennsylvania by State Residents and Nonresidents Combined for Fishing and Hunting: 2011(Population 16 years old and older)
Expenditure item Amount (thousands of dollars)
Spenders (thousands)
Average per spender
(dollars)1
Average per sportsperson
(dollars)1
FISHING AND HUNTING
Total . . . . . . . . . . . . . . . . . . . . . . . . . . . . . . . . . . . . 1,523,089 1,604 950 1,020 Food and lodging . . . . . . . . . . . . . . . . . . . . . . . . 138,239 1,093 126 97 Transportation . . . . . . . . . . . . . . . . . . . . . . . . . . . 181,989 1,100 165 128 Other trip costs2 . . . . . . . . . . . . . . . . . . . . . . . . . . 80,993 982 82 57 Equipment (fishing, hunting) . . . . . . . . . . . . . . . 448,231 1,086 413 288 Auxiliary equipment3 . . . . . . . . . . . . . . . . . . . . . 148,611 570 261 96 Special equipment4 . . . . . . . . . . . . . . . . . . . . . . . *213,608 *122 *1,757 *139 Magazines, books, and DVDs . . . . . . . . . . . . . . . *11,547 *217 *53 *8 Membership dues and contributions . . . . . . . . . . *22,113 *218 *102 *13 Other5 . . . . . . . . . . . . . . . . . . . . . . . . . . . . . . . . . 277,757 967 287 194
FISHING
Total . . . . . . . . . . . . . . . . . . . . . . . . . . . . . . . . . . . . 485,490 1,055 460 409 Food and lodging . . . . . . . . . . . . . . . . . . . . . . . . 76,705 737 104 70 Transportation . . . . . . . . . . . . . . . . . . . . . . . . . . . 83,154 697 119 76 Other trip costs2 . . . . . . . . . . . . . . . . . . . . . . . . . . 68,651 826 83 62 Fishing equipment . . . . . . . . . . . . . . . . . . . . . . . . 114,099 685 167 90 Auxiliary equipment3 . . . . . . . . . . . . . . . . . . . . . *12,696 *92 *137 ... Special equipment4 . . . . . . . . . . . . . . . . . . . . . . . ... ... ... ... Magazines, books, and DVDs . . . . . . . . . . . . . . . ... ... ... ... Membership dues and contributions . . . . . . . . . . *4,569 *141 *32 ... Other5 . . . . . . . . . . . . . . . . . . . . . . . . . . . . . . . . . 57,968 518 112 52
HUNTING
Total . . . . . . . . . . . . . . . . . . . . . . . . . . . . . . . . . . . . 970,598 828 1,172 1,207 Food and lodging . . . . . . . . . . . . . . . . . . . . . . . . 61,534 579 106 79 Transportation . . . . . . . . . . . . . . . . . . . . . . . . . . . 98,835 652 152 128 Other trip costs2 . . . . . . . . . . . . . . . . . . . . . . . . . . *12,342 *185 *67 *16 Hunting equipment . . . . . . . . . . . . . . . . . . . . . . . 319,457 609 525 375 Auxiliary equipment3 . . . . . . . . . . . . . . . . . . . . . 100,525 310 324 *122 Special equipment4 . . . . . . . . . . . . . . . . . . . . . . . ... ... ... ... Magazines, books, and DVDs . . . . . . . . . . . . . . . *6,794 *77 *88 ... Membership dues and contributions . . . . . . . . . . ... ... ... ... Other5 . . . . . . . . . . . . . . . . . . . . . . . . . . . . . . . . . 219,789 670 328 283
UNSPECIFIED6
Total . . . . . . . . . . . . . . . . . . . . . . . . . . . . . . . . . . . . *48,623 *208 *234 *32
* Estimate based on a sample size of 10–29. … Sample size too small (less than 10) to report data reliably.1 Average expenditures are annual estimates.2 Includes boating costs, equipment rental, guide fees, access fees, heating and cooking fuel, and ice and bait (for fishing only). 3 Includes sleeping bags, packs, duffel bags, tents, binoculars and field glasses, special fishing and hunting clothing, foul weather gear, boots and waders, maintenance and repair of equipment, processing and taxidermy costs, and electronic equipment such as a GPS device.4 Includes big-ticket items bought primarily for hunting and fishing including boats, campers, cabins, trail bikes, dune buggies, 4 x 4 vehicles, ATVs, 4-wheelers, snowmobiles, pickups, vans, travel and tent trailers, motor homes, house trailers, recreational vehicles (RVs) and other special equipment.5 Includes land leasing and ownership, licenses, stamps, tags, permits, and plantings (for hunting only).6 Respondent could not specify whether expenditure was primarily for either fishing or hunting.
Note: Detail does not add to total because of multiple responses and nonresponse.
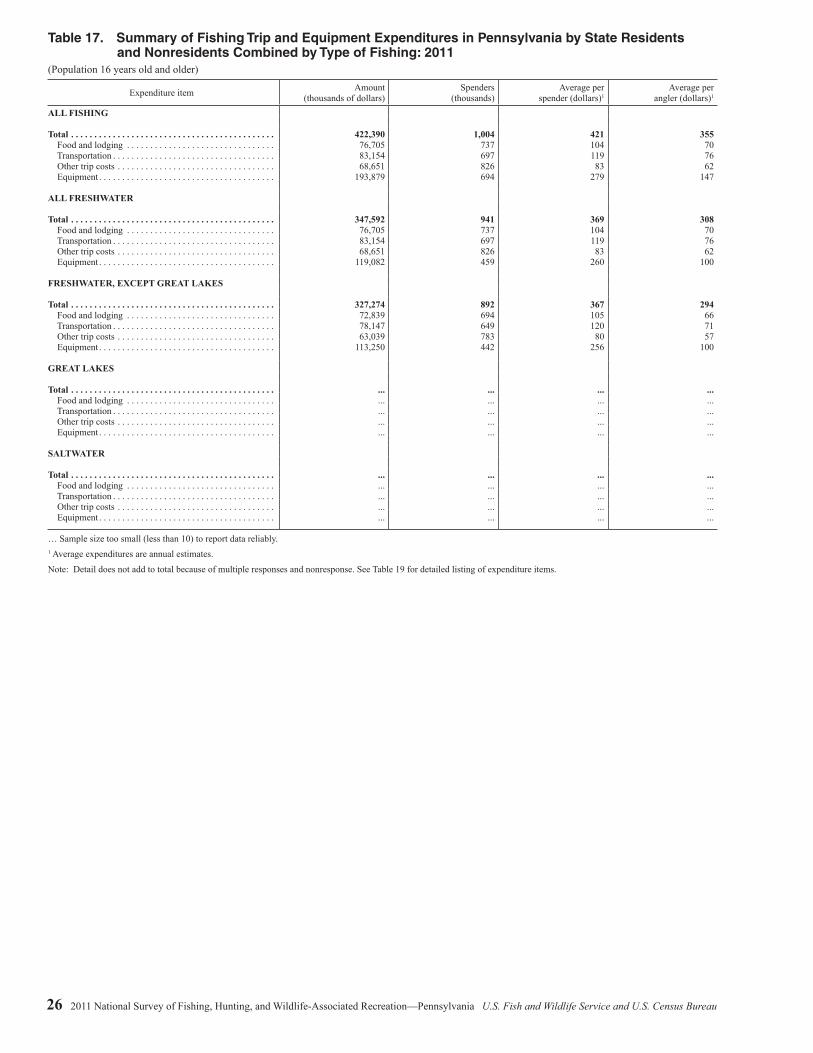
26 2011 National Survey of Fishing, Hunting, and Wildlife-Associated Recreation—Pennsylvania U.S. Fish and Wildlife Service and U.S. Census Bureau
Table 17. Summary of Fishing Trip and Equipment Expenditures in Pennsylvania by State Residents and Nonresidents Combined by Type of Fishing: 2011(Population 16 years old and older)
Expenditure item Amount (thousands of dollars)
Spenders (thousands)
Average per spender (dollars)1
Average per angler (dollars)1
ALL FISHING
Total . . . . . . . . . . . . . . . . . . . . . . . . . . . . . . . . . . . . . . . . . . . . Food and lodging . . . . . . . . . . . . . . . . . . . . . . . . . . . . . . . . Transportation . . . . . . . . . . . . . . . . . . . . . . . . . . . . . . . . . . . Other trip costs . . . . . . . . . . . . . . . . . . . . . . . . . . . . . . . . . . Equipment . . . . . . . . . . . . . . . . . . . . . . . . . . . . . . . . . . . . . .
ALL FRESHWATER
Total . . . . . . . . . . . . . . . . . . . . . . . . . . . . . . . . . . . . . . . . . . . . Food and lodging . . . . . . . . . . . . . . . . . . . . . . . . . . . . . . . . Transportation . . . . . . . . . . . . . . . . . . . . . . . . . . . . . . . . . . . Other trip costs . . . . . . . . . . . . . . . . . . . . . . . . . . . . . . . . . . Equipment . . . . . . . . . . . . . . . . . . . . . . . . . . . . . . . . . . . . . .
FRESHWATER, EXCEPT GREAT LAKES
Total . . . . . . . . . . . . . . . . . . . . . . . . . . . . . . . . . . . . . . . . . . . . Food and lodging . . . . . . . . . . . . . . . . . . . . . . . . . . . . . . . . Transportation . . . . . . . . . . . . . . . . . . . . . . . . . . . . . . . . . . . Other trip costs . . . . . . . . . . . . . . . . . . . . . . . . . . . . . . . . . . Equipment . . . . . . . . . . . . . . . . . . . . . . . . . . . . . . . . . . . . . .
GREAT LAKES
Total . . . . . . . . . . . . . . . . . . . . . . . . . . . . . . . . . . . . . . . . . . . . Food and lodging . . . . . . . . . . . . . . . . . . . . . . . . . . . . . . . . Transportation . . . . . . . . . . . . . . . . . . . . . . . . . . . . . . . . . . . Other trip costs . . . . . . . . . . . . . . . . . . . . . . . . . . . . . . . . . . Equipment . . . . . . . . . . . . . . . . . . . . . . . . . . . . . . . . . . . . . .
SALTWATER
Total . . . . . . . . . . . . . . . . . . . . . . . . . . . . . . . . . . . . . . . . . . . . Food and lodging . . . . . . . . . . . . . . . . . . . . . . . . . . . . . . . . Transportation . . . . . . . . . . . . . . . . . . . . . . . . . . . . . . . . . . . Other trip costs . . . . . . . . . . . . . . . . . . . . . . . . . . . . . . . . . . Equipment . . . . . . . . . . . . . . . . . . . . . . . . . . . . . . . . . . . . . .
422,390 76,705 83,154 68,651
193,879
347,592 76,705 83,154 68,651
119,082
327,274 72,839 78,147 63,039
113,250
... ... ... ... ...
... ... ... ... ...
1,004 737 697 826 694
941 737 697 826 459
892 694 649 783 442
... ... ... ... ...
... ... ... ... ...
421 104 119 83
279
369 104 119 83
260
367 105 120 80
256
... ... ... ... ...
... ... ... ... ...
355 70 76 62
147
308 70 76 62
100
294 66 71 57
100
... ... ... ... ...
... ... ... ... ...
… Sample size too small (less than 10) to report data reliably. 1 Average expenditures are annual estimates.
Note: Detail does not add to total because of multiple responses and nonresponse. See Table 19 for detailed listing of expenditure items.

U.S. Fish and Wildlife Service and U.S. Census Bureau 2011 National Survey of Fishing, Hunting, and Wildlife-Associated Recreation—Pennsylvania 27
Table 18. Summary of Hunting Trip and Equipment Expenditures in Pennsylvania by State Residents and Nonresidents Combined by Type of Hunting: 2011(Population 16 years old and older)
Expenditure item Amount (thousands of dollars)
Spenders (thousands)
Average per spender
(dollars)1
Average per type of hunter
(dollars)1
ALL HUNTING
Total . . . . . . . . . . . . . . . . . . . . . . . . . . . . . . . . . . . . . . . . . Food and lodging . . . . . . . . . . . . . . . . . . . . . . . . . . . . . Transportation . . . . . . . . . . . . . . . . . . . . . . . . . . . . . . . . Other trip costs . . . . . . . . . . . . . . . . . . . . . . . . . . . . . . . Equipment . . . . . . . . . . . . . . . . . . . . . . . . . . . . . . . . . . .
BIG GAME
Total . . . . . . . . . . . . . . . . . . . . . . . . . . . . . . . . . . . . . . . . . Food and lodging . . . . . . . . . . . . . . . . . . . . . . . . . . . . . Transportation . . . . . . . . . . . . . . . . . . . . . . . . . . . . . . . . Other trip costs . . . . . . . . . . . . . . . . . . . . . . . . . . . . . . . Equipment . . . . . . . . . . . . . . . . . . . . . . . . . . . . . . . . . . .
SMALL GAME
Total . . . . . . . . . . . . . . . . . . . . . . . . . . . . . . . . . . . . . . . . . Food and lodging . . . . . . . . . . . . . . . . . . . . . . . . . . . . . Transportation . . . . . . . . . . . . . . . . . . . . . . . . . . . . . . . . Other trip costs . . . . . . . . . . . . . . . . . . . . . . . . . . . . . . . Equipment . . . . . . . . . . . . . . . . . . . . . . . . . . . . . . . . . . .
MIGRATORY BIRDS
Total . . . . . . . . . . . . . . . . . . . . . . . . . . . . . . . . . . . . . . . . . Food and lodging . . . . . . . . . . . . . . . . . . . . . . . . . . . . . Transportation . . . . . . . . . . . . . . . . . . . . . . . . . . . . . . . . Other trip costs . . . . . . . . . . . . . . . . . . . . . . . . . . . . . . . Equipment . . . . . . . . . . . . . . . . . . . . . . . . . . . . . . . . . . .
OTHER ANIMALS
Total . . . . . . . . . . . . . . . . . . . . . . . . . . . . . . . . . . . . . . . . . Food and lodging . . . . . . . . . . . . . . . . . . . . . . . . . . . . . Transportation . . . . . . . . . . . . . . . . . . . . . . . . . . . . . . . . Other trip costs . . . . . . . . . . . . . . . . . . . . . . . . . . . . . . . Equipment . . . . . . . . . . . . . . . . . . . . . . . . . . . . . . . . . . .
736,375 61,534 98,835
*12,342 563,664
569,638 55,367 91,114 *8,334
414,822
*29,027 *4,807 *3,766
... ...
... ... ... ... ...
... ... ... ... ...
783 579 652
*185 643
742 572 628
*174 514
*195 *125 *98
... ...
... ... ... ... ...
... ... ... ... ...
940 106 152 *67 876
767 97
145 *48 807
*149 *38 *38
... ...
... ... ... ... ...
... ... ... ... ...
906 79
128 *16 683
717 71
118 *11 517
*116 *20 *16
... ...
... ... ... ... ...
... ... ... ... ...
* Estimate based on a sample size of 10–29. … Sample size too small (less than 10) to report data reliably.1 Average expenditures are annual estimates.
Note: Detail does not add to total because of multiple responses and nonresponse. See Table 20 for detailed listing of expenditure items.

28 2011 National Survey of Fishing, Hunting, and Wildlife-Associated Recreation—Pennsylvania U.S. Fish and Wildlife Service and U.S. Census Bureau
Table 19. Expenditures in Pennsylvania by State Residents and Nonresidents Combined for Fishing: 2011(Population 16 years old and older)
Expenditure item
Expenditures SpendersAmount
(thousands of dollars)
Average per angler (dollars)1
Number (thousands)
Percent of anglers
Average per spender
(dollars)1
Total, all items . . . . . . . . . . . . . . . . . . . . . . . . . . . . . . . . . . . . . . . . . . . . . . . . . . . . . . . . . . . . 485,490 409 1,055 96 460
TRIP-RELATED EXPENDITURES
Total trip-related . . . . . . . . . . . . . . . . . . . . . . . . . . . . . . . . . . . . . . . . . . . . . . . . . . . . . . . . . . 228,510 208 882 80 259
Food and lodging, total . . . . . . . . . . . . . . . . . . . . . . . . . . . . . . . . . . . . . . . . . . . . . . . . . . . . . 76,705 70 737 67 104 Food . . . . . . . . . . . . . . . . . . . . . . . . . . . . . . . . . . . . . . . . . . . . . . . . . . . . . . . . . . . . . . . . . . 61,197 56 737 67 83 Lodging . . . . . . . . . . . . . . . . . . . . . . . . . . . . . . . . . . . . . . . . . . . . . . . . . . . . . . . . . . . . . . . . *15,507 *14 *88 *8 *177
Transportation . . . . . . . . . . . . . . . . . . . . . . . . . . . . . . . . . . . . . . . . . . . . . . . . . . . . . . . . . . . . . 83,154 76 697 63 119
Other trip costs, total . . . . . . . . . . . . . . . . . . . . . . . . . . . . . . . . . . . . . . . . . . . . . . . . . . . . . . 68,651 62 826 75 83 Privilege and other fees2 . . . . . . . . . . . . . . . . . . . . . . . . . . . . . . . . . . . . . . . . . . . . . . . . . . . *31,305 *28 *231 *21 *136 Boating costs3 . . . . . . . . . . . . . . . . . . . . . . . . . . . . . . . . . . . . . . . . . . . . . . . . . . . . . . . . . . . *8,184 *7 *68 *6 *120 Bait . . . . . . . . . . . . . . . . . . . . . . . . . . . . . . . . . . . . . . . . . . . . . . . . . . . . . . . . . . . . . . . . . . . 20,935 19 725 66 29 Ice . . . . . . . . . . . . . . . . . . . . . . . . . . . . . . . . . . . . . . . . . . . . . . . . . . . . . . . . . . . . . . . . . . . . 6,274 6 263 24 24 Heating and cooking fuel . . . . . . . . . . . . . . . . . . . . . . . . . . . . . . . . . . . . . . . . . . . . . . . . . . *1,953 *2 *74 *7 *26
EQUIPMENT AND OTHER EXPENDITURES PRIMARILY FOR FISHING
Fishing equipment, total . . . . . . . . . . . . . . . . . . . . . . . . . . . . . . . . . . . . . . . . . . . . . . . . . . . . 114,099 90 685 62 167 Reels, rods, and rod-making components . . . . . . . . . . . . . . . . . . . . . . . . . . . . . . . . . . . . . . 46,244 *35 261 24 177 Lines, hooks, sinkers, etc. . . . . . . . . . . . . . . . . . . . . . . . . . . . . . . . . . . . . . . . . . . . . . . . . . . 28,635 23 639 58 45 Artificial lures and flies . . . . . . . . . . . . . . . . . . . . . . . . . . . . . . . . . . . . . . . . . . . . . . . . . . . . 23,072 19 478 43 48 Creels, stringers, fish bags, landing nets, and gaff hooks . . . . . . . . . . . . . . . . . . . . . . . . . . *1,325 *1 *117 *11 *11 Minnow seines, traps, and bait containers . . . . . . . . . . . . . . . . . . . . . . . . . . . . . . . . . . . . . *2,361 *2 *136 *12 *17 Other fishing equipment4 . . . . . . . . . . . . . . . . . . . . . . . . . . . . . . . . . . . . . . . . . . . . . . . . . . *12,462 *11 *201 *18 *62
Auxiliary equipment5 . . . . . . . . . . . . . . . . . . . . . . . . . . . . . . . . . . . . . . . . . . . . . . . . . . . . . . . *12,696 ... *92 *8 *137 Special equipment6 . . . . . . . . . . . . . . . . . . . . . . . . . . . . . . . . . . . . . . . . . . . . . . . . . . . . . . . . . ... ... ... ... ... Other fishing costs7 . . . . . . . . . . . . . . . . . . . . . . . . . . . . . . . . . . . . . . . . . . . . . . . . . . . . . . . . . 63,100 55 678 62 93
* Estimate based on a sample size of 10–29. … Sample size too small (less than 10) to report data reliably. 1 Average expenditures are annual estimates.2 Includes boat or equipment rental and fees for guides, pack trip (party and charter boats, etc.), public land use, and private land use.3 Includes boat launching, mooring, storage, maintenance, insurance, pumpout fees, and fuel.4 Includes electronic fishing devices (depth finders, fish finders, etc.), tackle boxes, ice fishing equipment, and other fishing equipment.5 Includes sleeping bags, packs, duffel bags, tents, binoculars and field glasses, special fishing clothing, foul weather gear, boots and waders, maintenance and repair of equipment, processing and taxidermy costs, and electronic equipment such as a GPS device.6 Includes big-ticket items bought primarily for fishing including boats, campers, cabins, trail bikes, dune buggies, 4 x 4 vehicles, ATVs, 4-wheelers, snowmobiles, pickups, vans, travel and tent trailers, motor homes, house trailers, recreational vehicles (RVs) and other special equipment.7 Includes magazines, books, and DVDs, membership dues and contributions, land leasing and ownership, and licenses, stamps, tags, and permits.
Note: Detail does not add to total because of multiple responses and nonresponse. Percent of anglers may be greater than 100 because spenders who did not fish in this state are included.

U.S. Fish and Wildlife Service and U.S. Census Bureau 2011 National Survey of Fishing, Hunting, and Wildlife-Associated Recreation—Pennsylvania 29
Table 20. Expenditures in Pennsylvania by State Residents and Nonresidents Combined for Hunting: 2011(Population 16 years old and older)
Expenditure item
Expenditures SpendersAmount
(thousands of dollars)
Average per hunter (dollars)1
Number (thousands)
Percent of hunters
Average per spender
(dollars)1
Total, all items . . . . . . . . . . . . . . . . . . . . . . . . . . . . . . . . . . . . . . . . . . . . . . . . . . . . . . . . . . . . . . . . . 970,598 1,207 828 107 1,172
TRIP-RELATED EXPENDITURES
Total trip-related . . . . . . . . . . . . . . . . . . . . . . . . . . . . . . . . . . . . . . . . . . . . . . . . . . . . . . . . . . . . . . . 172,710 223 675 87 256
Food and lodging, total . . . . . . . . . . . . . . . . . . . . . . . . . . . . . . . . . . . . . . . . . . . . . . . . . . . . . . . . . . 61,534 79 579 75 106 Food . . . . . . . . . . . . . . . . . . . . . . . . . . . . . . . . . . . . . . . . . . . . . . . . . . . . . . . . . . . . . . . . . . . . . . . 58,078 75 579 75 100 Lodging . . . . . . . . . . . . . . . . . . . . . . . . . . . . . . . . . . . . . . . . . . . . . . . . . . . . . . . . . . . . . . . . . . . . . ... ... ... ... ...
Transportation . . . . . . . . . . . . . . . . . . . . . . . . . . . . . . . . . . . . . . . . . . . . . . . . . . . . . . . . . . . . . . . . . . 98,835 128 652 84 152
Other trip costs, total . . . . . . . . . . . . . . . . . . . . . . . . . . . . . . . . . . . . . . . . . . . . . . . . . . . . . . . . . . . *12,342 *16 *185 *24 *67 Privilege and other fees2 . . . . . . . . . . . . . . . . . . . . . . . . . . . . . . . . . . . . . . . . . . . . . . . . . . . . . . . . *9,867 *13 *149 *19 *66 Boating costs3 . . . . . . . . . . . . . . . . . . . . . . . . . . . . . . . . . . . . . . . . . . . . . . . . . . . . . . . . . . . . . . . . ... ... ... ... ... Heating and cooking fuel . . . . . . . . . . . . . . . . . . . . . . . . . . . . . . . . . . . . . . . . . . . . . . . . . . . . . . . *2,419 *3 *40 *5 *61
EQUIPMENT AND OTHER EXPENDITURES PRIMARILY FOR HUNTING
Hunting equipment, total . . . . . . . . . . . . . . . . . . . . . . . . . . . . . . . . . . . . . . . . . . . . . . . . . . . . . . . . 319,457 375 609 79 525 Firearms . . . . . . . . . . . . . . . . . . . . . . . . . . . . . . . . . . . . . . . . . . . . . . . . . . . . . . . . . . . . . . . . . . . . *189,146 *234 *163 *21 *1,161 Ammunition . . . . . . . . . . . . . . . . . . . . . . . . . . . . . . . . . . . . . . . . . . . . . . . . . . . . . . . . . . . . . . . . . 31,639 38 383 49 83 Other hunting equipment4 . . . . . . . . . . . . . . . . . . . . . . . . . . . . . . . . . . . . . . . . . . . . . . . . . . . . . . . 98,673 103 429 55 230
Auxiliary equipment5 . . . . . . . . . . . . . . . . . . . . . . . . . . . . . . . . . . . . . . . . . . . . . . . . . . . . . . . . . . . . 100,525 *122 310 40 324 Special equipment6 . . . . . . . . . . . . . . . . . . . . . . . . . . . . . . . . . . . . . . . . . . . . . . . . . . . . . . . . . . . . . . ... ... ... ... ... Other hunting costs7 . . . . . . . . . . . . . . . . . . . . . . . . . . . . . . . . . . . . . . . . . . . . . . . . . . . . . . . . . . . . . 234,223 301 689 89 340
* Estimate based on a sample size of 10–29. … Sample size too small (less than 10) to report data reliably. 1 Average expenditures are annual estimates.2 Includes guide fees, pack trip and package fees, public and private land use access fees, and rental of equipment such as boats and hunting or camping equipment.3 Boating costs include launching, mooring, storage, maintenance, insurance, pumpout fees, and fuel.4 Includes telescopic sights, decoys and game calls, handloading equipment and components, hunting dogs and associated costs, hunting knives, bows, arrows, archery equipment, and other hunting equipment.5 Includes sleeping bags, packs, duffel bags, tents, binoculars and field glasses, special hunting clothing, foul weather gear, boots and waders, maintenance and repair of equipment, processing and taxidermy costs, and electronic equipment such as a GPS device.6 Includes big-ticket items bought primarily for hunting including boats, campers, cabins, trail bikes, dune buggies, 4 x 4 vehicles, ATVs, 4-wheelers, snowmobiles, pickups, vans, travel and tent trailers, motor homes, house trailers, recreational vehicles (RVs) and other special equipment.7 Includes magazines, books, and DVDs, membership dues and contributions, land leasing and ownership, and licenses, stamps, tags, and permits.
Note: Detail does not add to total because of multiple responses and nonresponse. Percent of hunters may be greater than 100 because spenders who did not hunt in this state are included.

30 2011 National Survey of Fishing, Hunting, and Wildlife-Associated Recreation—Pennsylvania U.S. Fish and Wildlife Service and U.S. Census Bureau
Table 21. Trip and Equipment Expenditures in Pennsylvania for Fishing and Hunting by Pennsylvania Residents and Nonresidents: 2011(Population 16 years old and older)
Expenditure itemAmount
(thousands of dollars)
Spenders (thousands)
Average per spender
(dollars)1
Average per sportsperson
(dollars)1
STATE RESIDENTS AND NONRESIDENTS
Trip and equipment expenditures for fishing and hunting, total . . . . . . . . . . . . . . . . . . . . 1,211,672 1,514 800 1,564
Trip and equipment expenditures for fishing, total . . . . . . . . . . . . . . . . . . . . . . . . . . . . . . . 424,710 1,022 416 355 Food and lodging . . . . . . . . . . . . . . . . . . . . . . . . . . . . . . . . . . . . . . . . . . . . . . . . . . . . . . . . . 76,705 737 104 70 Transportation . . . . . . . . . . . . . . . . . . . . . . . . . . . . . . . . . . . . . . . . . . . . . . . . . . . . . . . . . . . . 83,154 697 119 76 Boating costs2 . . . . . . . . . . . . . . . . . . . . . . . . . . . . . . . . . . . . . . . . . . . . . . . . . . . . . . . . . . . . *8,184 *68 *120 *7 Other trip costs3 . . . . . . . . . . . . . . . . . . . . . . . . . . . . . . . . . . . . . . . . . . . . . . . . . . . . . . . . . . . 60,467 821 74 55 Equipment . . . . . . . . . . . . . . . . . . . . . . . . . . . . . . . . . . . . . . . . . . . . . . . . . . . . . . . . . . . . . . . 196,199 713 275 147
Trip and equipment expenditures for hunting, total . . . . . . . . . . . . . . . . . . . . . . . . . . . . . . 751,880 837 898 906 Food and lodging . . . . . . . . . . . . . . . . . . . . . . . . . . . . . . . . . . . . . . . . . . . . . . . . . . . . . . . . . 61,534 579 106 79 Transportation . . . . . . . . . . . . . . . . . . . . . . . . . . . . . . . . . . . . . . . . . . . . . . . . . . . . . . . . . . . . 98,835 652 152 128 Boating costs2 . . . . . . . . . . . . . . . . . . . . . . . . . . . . . . . . . . . . . . . . . . . . . . . . . . . . . . . . . . . . ... ... ... ... Other trip costs3 . . . . . . . . . . . . . . . . . . . . . . . . . . . . . . . . . . . . . . . . . . . . . . . . . . . . . . . . . . . *12,286 *185 *66 *16 Equipment . . . . . . . . . . . . . . . . . . . . . . . . . . . . . . . . . . . . . . . . . . . . . . . . . . . . . . . . . . . . . . . 579,169 697 831 683
Unspecified equipment4 . . . . . . . . . . . . . . . . . . . . . . . . . . . . . . . . . . . . . . . . . . . . . . . . . . . . . *35,082 *181 *194 ...
STATE RESIDENTS
Trip and equipment expenditures for fishing and hunting, total . . . . . . . . . . . . . . . . . . . . 966,875 1,144 845 1,383
Trip and equipment expenditures for fishing, total . . . . . . . . . . . . . . . . . . . . . . . . . . . . . . . 277,562 774 359 304 Food and lodging . . . . . . . . . . . . . . . . . . . . . . . . . . . . . . . . . . . . . . . . . . . . . . . . . . . . . . . . . 37,804 560 67 42 Transportation . . . . . . . . . . . . . . . . . . . . . . . . . . . . . . . . . . . . . . . . . . . . . . . . . . . . . . . . . . . . 54,013 513 105 61 Boating costs2 . . . . . . . . . . . . . . . . . . . . . . . . . . . . . . . . . . . . . . . . . . . . . . . . . . . . . . . . . . . . ... ... ... ... Other trip costs3 . . . . . . . . . . . . . . . . . . . . . . . . . . . . . . . . . . . . . . . . . . . . . . . . . . . . . . . . . . . 33,098 652 51 37 Equipment . . . . . . . . . . . . . . . . . . . . . . . . . . . . . . . . . . . . . . . . . . . . . . . . . . . . . . . . . . . . . . . 149,206 598 249 160
Trip and equipment expenditures for hunting, total . . . . . . . . . . . . . . . . . . . . . . . . . . . . . . 657,772 679 969 939 Food and lodging . . . . . . . . . . . . . . . . . . . . . . . . . . . . . . . . . . . . . . . . . . . . . . . . . . . . . . . . . 43,796 517 85 63 Transportation . . . . . . . . . . . . . . . . . . . . . . . . . . . . . . . . . . . . . . . . . . . . . . . . . . . . . . . . . . . . 83,652 577 145 120 Boating costs2 . . . . . . . . . . . . . . . . . . . . . . . . . . . . . . . . . . . . . . . . . . . . . . . . . . . . . . . . . . . . ... ... ... ... Other trip costs3 . . . . . . . . . . . . . . . . . . . . . . . . . . . . . . . . . . . . . . . . . . . . . . . . . . . . . . . . . . . *8,103 *166 *49 *12 Equipment . . . . . . . . . . . . . . . . . . . . . . . . . . . . . . . . . . . . . . . . . . . . . . . . . . . . . . . . . . . . . . . 522,221 598 873 745
Unspecified equipment4 . . . . . . . . . . . . . . . . . . . . . . . . . . . . . . . . . . . . . . . . . . . . . . . . . . . . . ... ... ... ...
NONRESIDENTS
Trip and equipment expenditures for fishing and hunting, total . . . . . . . . . . . . . . . . . . . . 244,796 369 663 3,223
Trip and equipment expenditures for fishing, total . . . . . . . . . . . . . . . . . . . . . . . . . . . . . . . 147,147 248 593 569 Food and lodging . . . . . . . . . . . . . . . . . . . . . . . . . . . . . . . . . . . . . . . . . . . . . . . . . . . . . . . . . 38,901 176 220 185 Transportation . . . . . . . . . . . . . . . . . . . . . . . . . . . . . . . . . . . . . . . . . . . . . . . . . . . . . . . . . . . . 29,142 185 158 139 Boating costs2 . . . . . . . . . . . . . . . . . . . . . . . . . . . . . . . . . . . . . . . . . . . . . . . . . . . . . . . . . . . . ... ... ... ... Other trip costs3 . . . . . . . . . . . . . . . . . . . . . . . . . . . . . . . . . . . . . . . . . . . . . . . . . . . . . . . . . . . 27,369 169 162 130 Equipment . . . . . . . . . . . . . . . . . . . . . . . . . . . . . . . . . . . . . . . . . . . . . . . . . . . . . . . . . . . . . . . *46,993 *114 *411 *92
Trip and equipment expenditures for hunting, total . . . . . . . . . . . . . . . . . . . . . . . . . . . . . . 94,107 158 595 *598 Food and lodging . . . . . . . . . . . . . . . . . . . . . . . . . . . . . . . . . . . . . . . . . . . . . . . . . . . . . . . . . *17,738 *62 *288 *234 Transportation . . . . . . . . . . . . . . . . . . . . . . . . . . . . . . . . . . . . . . . . . . . . . . . . . . . . . . . . . . . . *15,182 *75 *202 *200 Boating costs2 . . . . . . . . . . . . . . . . . . . . . . . . . . . . . . . . . . . . . . . . . . . . . . . . . . . . . . . . . . . . ... ... ... ... Other trip costs3 . . . . . . . . . . . . . . . . . . . . . . . . . . . . . . . . . . . . . . . . . . . . . . . . . . . . . . . . . . . ... ... ... ... Equipment . . . . . . . . . . . . . . . . . . . . . . . . . . . . . . . . . . . . . . . . . . . . . . . . . . . . . . . . . . . . . . . 56,948 98 578 ...
Unspecified equipment4 . . . . . . . . . . . . . . . . . . . . . . . . . . . . . . . . . . . . . . . . . . . . . . . . . . . . . ... ... ... ...
* Estimate based on a sample size of 10–29. … Sample size too small (less than 10) to report data reliably.1 Average expenditures are annual estimates.2 Includes boat launching, mooring, storage, maintenance, insurance, pumpout fees, and fuel.3 Includes equipment rental, guide and access fees, ice and bait for fishing, and heating and cooking oil.4 Respondent could not specify whether item was for hunting or fishing.
Note: Detail does not add to total because of multiple responses and nonresponse.

U.S. Fish and Wildlife Service and U.S. Census Bureau 2011 National Survey of Fishing, Hunting, and Wildlife-Associated Recreation—Pennsylvania 31
Table 22. Summary of Pennsylvania Residents’ Fishing and Hunting Expenditures Both Inside and Outside Pennsylvania: 2011(Population 16 years old and older)
Expenditure itemAmount
(thousands of dollars)
Spenders (thousands)
Average per spender
(dollars)1
Average per sportsperson
(dollars)1
FISHING AND HUNTING
Total . . . . . . . . . . . . . . . . . . . . . . . . . . . . . . . . . . . . . . . . . 1,472,760 1,253 1,175 1,153 Food and lodging . . . . . . . . . . . . . . . . . . . . . . . . . . . . . 144,641 937 154 113 Transportation . . . . . . . . . . . . . . . . . . . . . . . . . . . . . . . . 184,125 925 199 144 Other trip costs2 . . . . . . . . . . . . . . . . . . . . . . . . . . . . . . . 92,256 881 105 72 Equipment (fishing, hunting) . . . . . . . . . . . . . . . . . . . . 435,785 947 460 341 Auxiliary equipment3 . . . . . . . . . . . . . . . . . . . . . . . . . . 161,305 590 273 126 Special equipment4 . . . . . . . . . . . . . . . . . . . . . . . . . . . . ... ... ... ... Magazines, books, and DVDs . . . . . . . . . . . . . . . . . . . . *13,608 *245 *56 *11 Membership dues and contributions . . . . . . . . . . . . . . . *19,194 *205 *94 *15 Other5 . . . . . . . . . . . . . . . . . . . . . . . . . . . . . . . . . . . . . . 225,555 821 275 177
FISHING
Total . . . . . . . . . . . . . . . . . . . . . . . . . . . . . . . . . . . . . . . . . 429,991 849 506 426 Food and lodging . . . . . . . . . . . . . . . . . . . . . . . . . . . . . 83,113 628 132 82 Transportation . . . . . . . . . . . . . . . . . . . . . . . . . . . . . . . . 82,392 579 142 82 Other trip costs2 . . . . . . . . . . . . . . . . . . . . . . . . . . . . . . . 72,414 743 97 72 Fishing equipment . . . . . . . . . . . . . . . . . . . . . . . . . . . . . 111,062 631 176 110 Auxiliary equipment3 . . . . . . . . . . . . . . . . . . . . . . . . . . *13,551 *100 *136 *13 Special equipment4 . . . . . . . . . . . . . . . . . . . . . . . . . . . . ... ... ... ... Magazines, books, and DVDs . . . . . . . . . . . . . . . . . . . . ... ... ... ... Membership dues and contributions . . . . . . . . . . . . . . . ... ... ... ... Other5 . . . . . . . . . . . . . . . . . . . . . . . . . . . . . . . . . . . . . . 14,988 431 35 15
HUNTING
Total . . . . . . . . . . . . . . . . . . . . . . . . . . . . . . . . . . . . . . . . . 995,487 687 1,450 1,416 Food and lodging . . . . . . . . . . . . . . . . . . . . . . . . . . . . . 61,529 517 119 88 Transportation . . . . . . . . . . . . . . . . . . . . . . . . . . . . . . . . 101,734 577 176 145 Other trip costs2 . . . . . . . . . . . . . . . . . . . . . . . . . . . . . . . *19,842 *170 *116 *28 Hunting equipment . . . . . . . . . . . . . . . . . . . . . . . . . . . . 323,151 542 596 460 Auxiliary equipment3 . . . . . . . . . . . . . . . . . . . . . . . . . . *119,055 *354 *337 *169 Special equipment4 . . . . . . . . . . . . . . . . . . . . . . . . . . . . ... ... ... ... Magazines, books, and DVDs . . . . . . . . . . . . . . . . . . . . ... ... ... ... Membership dues and contributions . . . . . . . . . . . . . . . ... ... ... ... Other5 . . . . . . . . . . . . . . . . . . . . . . . . . . . . . . . . . . . . . . 210,566 602 350 300
UNSPECIFIED6
Total . . . . . . . . . . . . . . . . . . . . . . . . . . . . . . . . . . . . . . . . . *45,310 *211 *215 *35
* Estimate based on a sample size of 10–29. … Sample size too small (less than 10) to report data reliably.1 Average expenditures are annual estimates.2 Includes boating costs, equipment rental, guide fees, access fees, heating and cooking fuel, and ice and bait (for fishing only).3 Includes sleeping bags, packs, duffel bags, tents, binoculars and field glasses, special fishing and hunting clothing, foul weather gear, boots and waders, maintenance and repair of equipment, processing and taxidermy costs, and electronic equipment such as a GPS device.4 Includes big-ticket items bought primarily for hunting and fishing including boats, campers, cabins, trail bikes, dune buggies, 4 x 4 vehicles, ATVs, 4-wheelers, snowmobiles, pickups, vans, travel and tent trailers, motor homes, house trailers, recreational vehicles (RVs) and other special equipment.5 Includes land leasing and ownership, licenses, stamps, tags, and permits, and plantings (for hunting only).6 Respondent could not specify whether expenditure was primarily for fishing or hunting.
Note: Detail does not add to total because of multiple responses and nonresponse. See Tables 19–20 for a detailed listing of expenditure items.

32 2011 National Survey of Fishing, Hunting, and Wildlife-Associated Recreation—Pennsylvania U.S. Fish and Wildlife Service and U.S. Census Bureau
Table 23. In-State and Out-of-State Expenditures by Pennsylvania Residents for Fishing and Hunting: 2011(State population 16 years old and older)
Expenditure item Amount (thousands of dollars)
Spenders (thousands)
Average per spender (dollars)1
Average per sportsperson
(dollars)1
IN PENNSYLVANIA
Expenditures for fishing and hunting, total . . . . . . . . . . . . . . . . . . . . . 1,207,208 1,214 994 848 Trip-related expenditures . . . . . . . . . . . . . . . . . . . . . . . . . . . . . . . . . . . 263,908 1,050 251 185 Equipment (fishing and hunting) . . . . . . . . . . . . . . . . . . . . . . . . . . . . . 377,416 926 408 265 Auxiliary equipment2 . . . . . . . . . . . . . . . . . . . . . . . . . . . . . . . . . . . . . . 129,262 501 258 91 Special equipment3 . . . . . . . . . . . . . . . . . . . . . . . . . . . . . . . . . . . . . . . . ... ... ... ... Other4 . . . . . . . . . . . . . . . . . . . . . . . . . . . . . . . . . . . . . . . . . . . . . . . . . . 240,333 929 259 169
Expenditures for fishing, total . . . . . . . . . . . . . . . . . . . . . . . . . . . . . . . . 292,911 806 363 266 Trip-related expenditures . . . . . . . . . . . . . . . . . . . . . . . . . . . . . . . . . . . 128,356 687 187 117 Fishing equipment . . . . . . . . . . . . . . . . . . . . . . . . . . . . . . . . . . . . . . . . . 89,002 588 151 81 Auxiliary equipment2 . . . . . . . . . . . . . . . . . . . . . . . . . . . . . . . . . . . . . . ... ... ... ... Special equipment3 . . . . . . . . . . . . . . . . . . . . . . . . . . . . . . . . . . . . . . . . ... ... ... ... Other4 . . . . . . . . . . . . . . . . . . . . . . . . . . . . . . . . . . . . . . . . . . . . . . . . . . 15,480 541 29 14
Expenditures for hunting, total . . . . . . . . . . . . . . . . . . . . . . . . . . . . . . . 867,477 683 1,270 1,119 Trip-related expenditures . . . . . . . . . . . . . . . . . . . . . . . . . . . . . . . . . . . 135,551 600 226 175 Hunting equipment . . . . . . . . . . . . . . . . . . . . . . . . . . . . . . . . . . . . . . . . 286,947 537 534 370 Auxiliary equipment2 . . . . . . . . . . . . . . . . . . . . . . . . . . . . . . . . . . . . . . *90,256 *279 *323 *116 Special equipment3 . . . . . . . . . . . . . . . . . . . . . . . . . . . . . . . . . . . . . . . . ... ... ... ... Other4 . . . . . . . . . . . . . . . . . . . . . . . . . . . . . . . . . . . . . . . . . . . . . . . . . . 211,041 614 344 272
Unspecified expenditures for fishing and hunting, total5 . . . . . . . . . . *44,953 *181 *249 *32
OUT OF STATE
Expenditures for fishing and hunting, total . . . . . . . . . . . . . . . . . . . . . 265,551 1,048 253 186 Trip-related expenditures . . . . . . . . . . . . . . . . . . . . . . . . . . . . . . . . . . . *157,115 *308 *510 *110 Equipment (fishing and hunting) . . . . . . . . . . . . . . . . . . . . . . . . . . . . . *58,369 *947 *62 *41 Auxiliary equipment2 . . . . . . . . . . . . . . . . . . . . . . . . . . . . . . . . . . . . . . *32,044 *590 *54 *22 Special equipment3 . . . . . . . . . . . . . . . . . . . . . . . . . . . . . . . . . . . . . . . . ... ... ... ... Other4 . . . . . . . . . . . . . . . . . . . . . . . . . . . . . . . . . . . . . . . . . . . . . . . . . . *18,024 *392 *46 *13
Expenditures for fishing, total . . . . . . . . . . . . . . . . . . . . . . . . . . . . . . . . *137,080 *687 *200 *124 Trip-related expenditures . . . . . . . . . . . . . . . . . . . . . . . . . . . . . . . . . . . *109,562 *304 *361 *99 Fishing equipment . . . . . . . . . . . . . . . . . . . . . . . . . . . . . . . . . . . . . . . . . ... ... ... ... Auxiliary equipment2 . . . . . . . . . . . . . . . . . . . . . . . . . . . . . . . . . . . . . . ... ... ... ... Special equipment3 . . . . . . . . . . . . . . . . . . . . . . . . . . . . . . . . . . . . . . . . ... ... ... ... Other4 . . . . . . . . . . . . . . . . . . . . . . . . . . . . . . . . . . . . . . . . . . . . . . . . . . ... ... ... ...
Expenditures for hunting, total . . . . . . . . . . . . . . . . . . . . . . . . . . . . . . . *128,264 *613 *209 *166 Trip-related expenditures . . . . . . . . . . . . . . . . . . . . . . . . . . . . . . . . . . . ... ... ... ... Hunting equipment . . . . . . . . . . . . . . . . . . . . . . . . . . . . . . . . . . . . . . . . *36,204 *542 *67 *47 Auxiliary equipment2 . . . . . . . . . . . . . . . . . . . . . . . . . . . . . . . . . . . . . . ... ... ... ... Special equipment3 . . . . . . . . . . . . . . . . . . . . . . . . . . . . . . . . . . . . . . . . ... ... ... ... Other4 . . . . . . . . . . . . . . . . . . . . . . . . . . . . . . . . . . . . . . . . . . . . . . . . . . ... ... ... ...
Unspecified expenditures for fishing and hunting, total5 . . . . . . . . . . ... ... ... ...
* Estimate based on a sample size of 10–29. … Sample size too small (less than 10) to report data reliably.1 Average expenditures are annual estimates.2 Auxiliary equipment includes sleeping bags, packs, duffel bags, tents, binoculars and field glasses, special fishing and hunting clothing, foul weather gear, boots and waders, maintenance and repair of equipment, processing and taxidermy costs, and electronic equipment such as a GPS device.3 Special equipment includes boats, campers, cabins, trail bikes, dune buggies, 4 x 4 vehicles, ATVs, 4-wheelers, snowmobiles, pickups, vans, travel and tent trailers, motor homes, house trailers, recreational vehicles (RVs) and other special equipment.4 Other equipment includes expenditures for magazines, books, DVDs, membership dues and contributions, land leasing and ownership, licenses, stamps, tags, and permits, and plantings.5 Respondent could not specify whether expenditure was primarily for either fishing or hunting.
Note: Detail does not add to total because of multiple responses and nonresponse.

U.S. Fish and Wildlife Service and U.S. Census Bureau 2011 National Survey of Fishing, Hunting, and Wildlife-Associated Recreation—Pennsylvania 33
Table 24. Wildlife Watching in Pennsylvania by State Residents and Nonresidents Combined: 2011(Population 16 years old and older. Numbers in thousands)
Participants Number PercentTotal participants . . . . . . . . . . . . . . . . . . . . . . . . . . . . . . . . . . . . . . . . . . . . . . . 3,598 100 Away from home . . . . . . . . . . . . . . . . . . . . . . . . . . . . . . . . . . . . . . . . . . . . . . . 809 22 Observe wildlife . . . . . . . . . . . . . . . . . . . . . . . . . . . . . . . . . . . . . . . . . . . . . 807 22 Photograph wildlife . . . . . . . . . . . . . . . . . . . . . . . . . . . . . . . . . . . . . . . . . . . 422 12 Feed wildlife . . . . . . . . . . . . . . . . . . . . . . . . . . . . . . . . . . . . . . . . . . . . . . . . *200 *6
Around the home . . . . . . . . . . . . . . . . . . . . . . . . . . . . . . . . . . . . . . . . . . . . . . . 3,228 90 Observe wildlife . . . . . . . . . . . . . . . . . . . . . . . . . . . . . . . . . . . . . . . . . . . . . 2,413 67 Photograph wildlife . . . . . . . . . . . . . . . . . . . . . . . . . . . . . . . . . . . . . . . . . . . 1,034 29 Feed wildlife . . . . . . . . . . . . . . . . . . . . . . . . . . . . . . . . . . . . . . . . . . . . . . . . 2,399 67 Visit parks or natural areas1 . . . . . . . . . . . . . . . . . . . . . . . . . . . . . . . . . . . . . *471 *13 Maintain plantings or natural areas . . . . . . . . . . . . . . . . . . . . . . . . . . . . . . . *600 *17
* Estimate based on a sample size of 10–29. 1 Includes visits only to parks or natural areas within one mile of home.
Note: Detail does not add to total because of multiple responses.
Table 25. Participants, Trips, and Days of Participation in Away-From-Home Wildlife Watching in Pennsylvania: 2011(Population 16 years old and older. Numbers in thousands)
Participants, trips, and days of participation
Activity in PennsylvaniaTotal, state residents
and nonresidents State residents Nonresidents
Number Percent Number Percent Number PercentPARTICIPANTS
Total participants . . . . . . . . . . . . . . . . . . . . . . . . . . . . . . . 809 100 *502 *100 307 100 Observe wildlife . . . . . . . . . . . . . . . . . . . . . . . . . . . . . . . 807 100 *502 *100 305 99 Photograph wildlife . . . . . . . . . . . . . . . . . . . . . . . . . . . . . 422 52 *191 *38 *231 *75 Feed wildlife . . . . . . . . . . . . . . . . . . . . . . . . . . . . . . . . . . *200 *25 ... ... ... ...
TRIPS
Total Trips . . . . . . . . . . . . . . . . . . . . . . . . . . . . . . . . . . . . . 8,381 100 *6,638 *100 1,743 100 Average days per trip . . . . . . . . . . . . . . . . . . . . . . . . . . . . . 1 (X) *1 (X) 1 (X)
DAYS
Total days . . . . . . . . . . . . . . . . . . . . . . . . . . . . . . . . . . . . . . 9,554 100 *7,217 *100 2,337 100 Observing wildlife . . . . . . . . . . . . . . . . . . . . . . . . . . . . . 8,382 88 *6,162 *85 2,220 95 Photographing wildlife . . . . . . . . . . . . . . . . . . . . . . . . . . 3,103 32 *2,250 *31 *853 *37 Feeding wildlife . . . . . . . . . . . . . . . . . . . . . . . . . . . . . . . *4,244 *44 ... ... ... ...
Average days per participant . . . . . . . . . . . . . . . . . . . . . . 12 (X) *14 (X) 8 (X) Observing wildlife . . . . . . . . . . . . . . . . . . . . . . . . . . . . . 10 (X) *12 (X) 7 (X) Photographing wildlife . . . . . . . . . . . . . . . . . . . . . . . . . . 7 (X) *12 (X) *4 (X) Feeding wildlife . . . . . . . . . . . . . . . . . . . . . . . . . . . . . . . *21 (X) ... (X) ... (X)
* Estimate based on a sample size of 10–29. … Sample size too small (less than 10) to report data reliably.
Note: Detail does not add to total because of multiple responses and nonresponse.
(X) Not applicable.

34 2011 National Survey of Fishing, Hunting, and Wildlife-Associated Recreation—Pennsylvania U.S. Fish and Wildlife Service and U.S. Census Bureau
Table 26. Away-From-Home Wildlife-Watching Participants by Wildlife Observed, Photographed, or Fed in Pennsylvania: 2011(Population 16 years old and older. Numbers in thousands)
Wildlife observed, photographed, or fedTotal, state residents
and nonresidents State residents Nonresidents
Number Percent Number Percent Number PercentTotal all wildlife . . . . . . . . . . . . . . . . . . . . . . . . . . . . . . . . . . . . . 809 100 *502 *62 307 38
Total birds . . . . . . . . . . . . . . . . . . . . . . . . . . . . . . . . . . . . . . . . . 730 100 *426 *58 304 42 Songbirds (cardinals, robins, warblers, etc.) . . . . . . . . . . . . . . 609 100 *335 *55 274 45 Birds of prey (hawks, owls, eagles, etc.) . . . . . . . . . . . . . . . . 345 100 *189 *55 *156 *45 Waterfowl (ducks, geese, swans, etc.). . . . . . . . . . . . . . . . . . . 483 100 *318 *66 *165 *34 Other water birds (shorebirds, herons, cranes, etc.) . . . . . . . . *238 *100 ... ... *115 *48 Other birds (pheasants, turkeys, road runners, etc.) . . . . . . . . *179 *100 *125 *70 *54 *30
Total land mammals . . . . . . . . . . . . . . . . . . . . . . . . . . . . . . . . . 442 100 *208 *47 235 53 Large land mammals (bears, bison, elk, etc.) . . . . . . . . . . . . . 293 100 *159 *54 *134 *46 Small land mammals (prairie dogs, squirrels, etc.) . . . . . . . . . 356 100 *148 *41 *208 *59
Fish (salmon, sharks, etc.) . . . . . . . . . . . . . . . . . . . . . . . . . . . . . . *224 *100 ... ... *53 *24 Marine mammals (whales, dolphins, etc.) . . . . . . . . . . . . . . . . . ... ... ... ... ... ... Other wildlife (butterflies, turtles, etc.) . . . . . . . . . . . . . . . . . . . *282 *100 *166 *59 *116 *41
* Estimate based on a sample size of 10–29. … Sample size too small (less than 10) to report data reliably.
Note: Detail does not add to total because of multiple responses.
Table 27. Participation in Wildlife-Watching Activities Around the Home in Pennsylvania: 2011(State population 16 years old and older. Numbers in thousands)
Around the homeParticipants
Number PercentTotal around-the-home participants . . . . . . . . . . . . . . . . . . . . . . . . . . . . . . . . . . . . 3,228 100 Observe wildlife . . . . . . . . . . . . . . . . . . . . . . . . . . . . . . . . . . . . . . . . . . . . . . . . . . . 2,413 75 Visit parks and natural areas1 . . . . . . . . . . . . . . . . . . . . . . . . . . . . . . . . . . . . . . . . . *471 *15 Photograph wildlife . . . . . . . . . . . . . . . . . . . . . . . . . . . . . . . . . . . . . . . . . . . . . . . . . 1,034 32 Feed wildlife . . . . . . . . . . . . . . . . . . . . . . . . . . . . . . . . . . . . . . . . . . . . . . . . . . . . . . 2,399 74 Maintain natural areas . . . . . . . . . . . . . . . . . . . . . . . . . . . . . . . . . . . . . . . . . . . . . . . *410 *13 Maintain plantings . . . . . . . . . . . . . . . . . . . . . . . . . . . . . . . . . . . . . . . . . . . . . . . . . *300 *9
Participants Observing Wildlife Total, all wildlife . . . . . . . . . . . . . . . . . . . . . . . . . . . . . . . . . . . . . . . . . . . . . . . . . . 2,413 100 Birds . . . . . . . . . . . . . . . . . . . . . . . . . . . . . . . . . . . . . . . . . . . . . . . . . . . . . . . . . . 2,292 95 Land mammals . . . . . . . . . . . . . . . . . . . . . . . . . . . . . . . . . . . . . . . . . . . . . . . . . . 1,858 77 Large mammals . . . . . . . . . . . . . . . . . . . . . . . . . . . . . . . . . . . . . . . . . . . . . . . . 1,647 68 Small mammals . . . . . . . . . . . . . . . . . . . . . . . . . . . . . . . . . . . . . . . . . . . . . . . . 1,541 64 Amphibians or reptiles . . . . . . . . . . . . . . . . . . . . . . . . . . . . . . . . . . . . . . . . . . . . *416 *17 Insects or spiders . . . . . . . . . . . . . . . . . . . . . . . . . . . . . . . . . . . . . . . . . . . . . . . . . *768 *32 Fish and other wildlife . . . . . . . . . . . . . . . . . . . . . . . . . . . . . . . . . . . . . . . . . . . . ... ...
Total, 1 day or more . . . . . . . . . . . . . . . . . . . . . . . . . . . . . . . . . . . . . . . . . . . . . . . 2,413 100 1 to 10 days . . . . . . . . . . . . . . . . . . . . . . . . . . . . . . . . . . . . . . . . . . . . . . . . . . . . . *561 *23 11 to 50 days . . . . . . . . . . . . . . . . . . . . . . . . . . . . . . . . . . . . . . . . . . . . . . . . . . . . *1,032 *43 51 to 200 days . . . . . . . . . . . . . . . . . . . . . . . . . . . . . . . . . . . . . . . . . . . . . . . . . . . *465 *19 201 days or more . . . . . . . . . . . . . . . . . . . . . . . . . . . . . . . . . . . . . . . . . . . . . . . . . *318 *13
Participants Visiting Parks or Natural Areas1
Total, 1 day or more . . . . . . . . . . . . . . . . . . . . . . . . . . . . . . . . . . . . . . . . . . . . . . . *471 *100 1 to 5 days . . . . . . . . . . . . . . . . . . . . . . . . . . . . . . . . . . . . . . . . . . . . . . . . . . . . . . ... ... 6 to 10 days . . . . . . . . . . . . . . . . . . . . . . . . . . . . . . . . . . . . . . . . . . . . . . . . . . . . . ... ... 11 days or more . . . . . . . . . . . . . . . . . . . . . . . . . . . . . . . . . . . . . . . . . . . . . . . . . . ... ...
Participants Photographing Wildlife Total, 1 day or more . . . . . . . . . . . . . . . . . . . . . . . . . . . . . . . . . . . . . . . . . . . . . . . 1,034 100 1 to 3 days . . . . . . . . . . . . . . . . . . . . . . . . . . . . . . . . . . . . . . . . . . . . . . . . . . . . . . *187 *18 4 to 10 days . . . . . . . . . . . . . . . . . . . . . . . . . . . . . . . . . . . . . . . . . . . . . . . . . . . . . *451 *44 11 or more days . . . . . . . . . . . . . . . . . . . . . . . . . . . . . . . . . . . . . . . . . . . . . . . . . . *388 *38
Participants Feeding Wildlife Total, all wildlife . . . . . . . . . . . . . . . . . . . . . . . . . . . . . . . . . . . . . . . . . . . . . . . . . . 2,399 100 Wild birds . . . . . . . . . . . . . . . . . . . . . . . . . . . . . . . . . . . . . . . . . . . . . . . . . . . . . . 2,209 92 Other wildlife . . . . . . . . . . . . . . . . . . . . . . . . . . . . . . . . . . . . . . . . . . . . . . . . . . . *637 *27
* Estimate based on a sample size of 10–29. … Sample size too small (less than 10) to report data reliably.1 Includes visits only to parks or natural areas within one mile of home.
Note: Detail does not add to total because of multiple responses and nonresponse.

U.S. Fish and Wildlife Service and U.S. Census Bureau 2011 National Survey of Fishing, Hunting, and Wildlife-Associated Recreation—Pennsylvania 35
Table 28. Pennsylvania Residents Participating in Wildlife Watching in the United States: 2011(State population 16 years old and older. Numbers in thousands)
Participants Number Percent of participants Percent of populationTotal participants . . . . . . . . . . . . . . . . . . . . . . . . . . . . . . . . . . . . . . . . . . . 3,329 100 33 Away from home . . . . . . . . . . . . . . . . . . . . . . . . . . . . . . . . . . . . . . . . . . . 734 22 7 Around the home . . . . . . . . . . . . . . . . . . . . . . . . . . . . . . . . . . . . . . . . . . . 3,228 97 32 Observe wildlife . . . . . . . . . . . . . . . . . . . . . . . . . . . . . . . . . . . . . . . . . 2,413 72 24 Photograph wildlife . . . . . . . . . . . . . . . . . . . . . . . . . . . . . . . . . . . . . . . 1,034 31 10 Feed wild birds or other wildlife . . . . . . . . . . . . . . . . . . . . . . . . . . . . . 2,399 72 24 Maintain plantings or natural areas . . . . . . . . . . . . . . . . . . . . . . . . . . . *600 *18 *6 Visit parks or natural areas1 . . . . . . . . . . . . . . . . . . . . . . . . . . . . . . . . . *471 *14 *5
* Estimate based on a sample size of 10–29. 1 Includes visits only to parks or natural areas within one mile of home.
Note: Detail does not add to total because of multiple responses. The column showing percent of participants is based on total participants. The column showing percent of population is based on the state population 16 years old and older, including those who did not participate in wildlife watching.
Table 29. Wild Bird Observers and Days of Observation in Pennsylvania by State Residents and Nonresidents: 2011(Population 16 years old and older. Numbers in thousands)
Observers and days of observationTotal, state residents
and nonresidents State residents Nonresidents
Number Percent Number Percent Number PercentOBSERVERS
Total bird observers . . . . . . . . . . . . . . . . . . . . . . . . . . . 2,699 100 2,397 100 302 100 Around-the-home observers . . . . . . . . . . . . . . . . . . . . 2,292 85 2,292 96 (X) (X) Away-from-home observers . . . . . . . . . . . . . . . . . . . . 728 27 *426 *18 302 100
DAYS
Total days observing birds . . . . . . . . . . . . . . . . . . . . . . 181,377 100 179,164 100 2,213 100 Around the home . . . . . . . . . . . . . . . . . . . . . . . . . . . . . 176,019 97 176,019 98 (X) (X) Away from home . . . . . . . . . . . . . . . . . . . . . . . . . . . . . 5,359 3 *3,145 *2 2,213 100
* Estimate based on a sample size of 10–29. (X) Not applicable.
Note: Detail does not add to total because of multiple responses.

36 2011 National Survey of Fishing, Hunting, and Wildlife-Associated Recreation—Pennsylvania U.S. Fish and Wildlife Service and U.S. Census Bureau
Table 30. Selected Characteristics of Pennsylvania Residents Participating in Wildlife Watching: 2011(State population 16 years old and older. Numbers in thousands)
Characteristic
PopulationParticipants
Total Away from home Around the home
Number Percent Number
Percent who par-ticipated Percent Number
Percent who par-ticipated Percent Number
Percent who par-ticipated Percent
Total persons . . . . . . . . . . . . . . . . . . . . . . . . . . . . .
Population Density of Residence
10,036 100 3,329 33 100 734 7 100 3,228 32 100
Urban . . . . . . . . . . . . . . . . . . . . . . . . . . . . . . . . . . 7,203 72 1,648 23 50 *353 *5 *48 1,631 23 51 Rural . . . . . . . . . . . . . . . . . . . . . . . . . . . . . . . . . .
Population Size of Residence
2,834 28 1,681 59 50 *382 *13 *52 1,597 56 49
Metropolitan Statistical Area (MSA) . . . . . . . . . 9,592 96 3,174 33 95 *683 *7 *93 3,118 33 97 1,000,000 or more . . . . . . . . . . . . . . . . . . . . . . 4,743 47 1,072 23 32 ... ... ... 1,063 22 33 250,000 to 999,999 . . . . . . . . . . . . . . . . . . . . . 3,203 32 1,383 43 42 ... ... ... 1,383 43 43 50,000 to 249,999 . . . . . . . . . . . . . . . . . . . . . . 1,646 16 720 44 22 *171 *10 *23 672 41 21 Outside MSA . . . . . . . . . . . . . . . . . . . . . . . . . . . .
Sex
444 4 ... ... ... ... ... ... ... ... ...
Male . . . . . . . . . . . . . . . . . . . . . . . . . . . . . . . . . . 4,795 48 1,444 30 43 *414 *9 *56 1,358 28 42 Female . . . . . . . . . . . . . . . . . . . . . . . . . . . . . . . . .
Age
5,242 52 1,885 36 57 *321 *6 *44 1,869 36 58
16 to 17 years . . . . . . . . . . . . . . . . . . . . . . . . . . . 447 4 ... ... ... ... ... ... ... ... ... 18 to 24 years . . . . . . . . . . . . . . . . . . . . . . . . . . . 1,485 15 ... ... ... ... ... ... ... ... ... 25 to 34 years . . . . . . . . . . . . . . . . . . . . . . . . . . . 1,234 12 ... ... ... ... ... ... ... ... ... 35 to 44 years . . . . . . . . . . . . . . . . . . . . . . . . . . . 1,577 16 *730 *46 *22 ... ... ... *636 *40 *20 45 to 54 years . . . . . . . . . . . . . . . . . . . . . . . . . . . 2,169 22 *513 *24 *15 ... ... ... *513 *24 *16 55 to 64 years . . . . . . . . . . . . . . . . . . . . . . . . . . . 1,455 14 *705 *48 *21 ... ... ... *698 *48 *22 65 years and older . . . . . . . . . . . . . . . . . . . . . . . . 1,670 17 675 40 20 ... ... ... 675 40 21 65 to 74 years . . . . . . . . . . . . . . . . . . . . . . . . . 1,049 10 *408 *39 *12 ... ... ... *408 *39 *13 75 and older . . . . . . . . . . . . . . . . . . . . . . . . . . .
Ethnicity
622 6 *268 *43 *8 ... ... ... *268 *43 *8
Hispanic . . . . . . . . . . . . . . . . . . . . . . . . . . . . . . . *548 *5 ... ... ... ... ... ... ... ... ... Non-Hispanic . . . . . . . . . . . . . . . . . . . . . . . . . . .
Race
9,489 95 3,329 35 100 734 8 100 3,228 34 100
White . . . . . . . . . . . . . . . . . . . . . . . . . . . . . . . . . . 8,422 84 3,006 36 90 734 9 100 2,905 34 90 African American . . . . . . . . . . . . . . . . . . . . . . . . 778 8 ... ... ... ... ... ... ... ... ... All others . . . . . . . . . . . . . . . . . . . . . . . . . . . . . . .
Annual Household Income
836 8 ... ... ... ... ... ... ... ... ...
Less than $20,000 . . . . . . . . . . . . . . . . . . . . . . . . 673 7 ... ... ... ... ... ... ... ... ... $20,000 to $29,999 . . . . . . . . . . . . . . . . . . . . . . . 1,047 10 ... ... ... ... ... ... ... ... ... $30,000 to $39,999 . . . . . . . . . . . . . . . . . . . . . . . 959 10 *616 *64 *19 ... ... ... *616 *64 *19 $40,000 to $49,999 . . . . . . . . . . . . . . . . . . . . . . . 871 9 ... ... ... ... ... ... ... ... ... $50,000 to $74,999 . . . . . . . . . . . . . . . . . . . . . . . 1,433 14 *752 *52 *23 *292 *20 *40 *659 *46 *20 $75,000 to $99,999 . . . . . . . . . . . . . . . . . . . . . . . 723 7 *306 *42 *9 ... ... ... *306 *42 *9 $100,000 to $149,999 . . . . . . . . . . . . . . . . . . . . . 1,173 12 *359 *31 *11 ... ... ... *359 *31 *11 $150,000 or more . . . . . . . . . . . . . . . . . . . . . . . . 976 10 ... ... ... ... ... ... ... ... ... Not reported . . . . . . . . . . . . . . . . . . . . . . . . . . . .
Education
2,183 22 *395 *18 *12 ... ... ... *386 *18 *12
11 years or less . . . . . . . . . . . . . . . . . . . . . . . . . . 1,268 13 *455 *36 *14 ... ... ... *455 *36 *14 12 years . . . . . . . . . . . . . . . . . . . . . . . . . . . . . . . . 4,084 41 1,117 27 34 ... ... ... 1,109 27 34 1 to 3 years of college . . . . . . . . . . . . . . . . . . . . . 1,801 18 *465 *26 *14 ... ... ... *419 *23 *13 4 years or more of college . . . . . . . . . . . . . . . . . 2,884 29 1,291 45 39 *517 *18 *70 1,245 43 39
* Estimate based on a sample size of 10–29. … Sample size too small (less than 10) to report data reliably.
Note: Detail does not add to total because of multiple responses and nonresponse. Percent who participated columns show the percent of each row’s population who participated in the activity named by the column (the percent of those living in urban areas who participated, etc.). Percent columns show the percent of each column’s participants who are described by the row heading (the percent of those who participated who live in urban areas, etc.).

U.S. Fish and Wildlife Service and U.S. Census Bureau 2011 National Survey of Fishing, Hunting, and Wildlife-Associated Recreation—Pennsylvania 37
Table 31. Expenditures in Pennsylvania by State Residents and Nonresidents Combined for Wildlife Watching: 2011(Population 16 years old and older)
Expenditure item Expenditures (thousands of dollars)
Average per participant
(dollars)1
Spenders
Number (thousands)
Percent of wildlife-watching
participants2
Averageper spender
(dollars)1
Total, all items . . . . . . . . . . . . . . . . . . . . . . . . . . . . . . . . . . . . . . . . . . . . . . . . . . . . . 1,270,888 308 2,570 71 494
TRIP EXPENDITURES
Total, trip-related . . . . . . . . . . . . . . . . . . . . . . . . . . . . . . . . . . . . . . . . . . . . . . . . . . 266,669 329 757 94 352 Food and lodging . . . . . . . . . . . . . . . . . . . . . . . . . . . . . . . . . . . . . . . . . . . . . . . . . 203,405 252 623 77 327 Food . . . . . . . . . . . . . . . . . . . . . . . . . . . . . . . . . . . . . . . . . . . . . . . . . . . . . . . . . 167,143 207 623 77 268 Lodging . . . . . . . . . . . . . . . . . . . . . . . . . . . . . . . . . . . . . . . . . . . . . . . . . . . . . . . *36,262 *45 *127 *16 *286 Transportation . . . . . . . . . . . . . . . . . . . . . . . . . . . . . . . . . . . . . . . . . . . . . . . . . . . . 58,372 71 720 89 81 Other trip costs3 . . . . . . . . . . . . . . . . . . . . . . . . . . . . . . . . . . . . . . . . . . . . . . . . . . . ... ... ... ... ...
EQUIPMENT AND OTHER EXPENDITURES
Total . . . . . . . . . . . . . . . . . . . . . . . . . . . . . . . . . . . . . . . . . . . . . . . . . . . . . . . . . . . . . 1,004,219 234 2,254 63 446
Wildlife-watching equipment, total . . . . . . . . . . . . . . . . . . . . . . . . . . . . . . . . . . . . 314,038 72 2,063 57 152 Binoculars, spotting scopes . . . . . . . . . . . . . . . . . . . . . . . . . . . . . . . . . . . . . . . . . . ... ... ... ... ... Film and photo processing . . . . . . . . . . . . . . . . . . . . . . . . . . . . . . . . . . . . . . . . . . ... ... ... ... ... Cameras, special lenses, video cameras, and other photographic equipment, including memory cards . . . . . . . . . . . . . . . . . . . . . . . . . . . . . . . . . . *53,200 *14 *220 *6 *241 Day packs, carrying cases, and special clothing . . . . . . . . . . . . . . . . . . . . . . . . . . *23,529 *5 *255 *7 *92 Bird food . . . . . . . . . . . . . . . . . . . . . . . . . . . . . . . . . . . . . . . . . . . . . . . . . . . . . . . . 138,993 32 1,426 40 97 Food for other wildlife . . . . . . . . . . . . . . . . . . . . . . . . . . . . . . . . . . . . . . . . . . . . . *41,418 *5 *451 *13 *92 Nest boxes, bird houses, bird feeders, and bird baths . . . . . . . . . . . . . . . . . . . . . . 24,643 6 820 23 30 Other equipment (including field guides) . . . . . . . . . . . . . . . . . . . . . . . . . . . . . . . ... ... ... ... ...
Auxiliary equipment4 . . . . . . . . . . . . . . . . . . . . . . . . . . . . . . . . . . . . . . . . . . . . . . . . *67,809 ... *207 *6 *327 Special equipment5 . . . . . . . . . . . . . . . . . . . . . . . . . . . . . . . . . . . . . . . . . . . . . . . . . . ... ... ... ... ... Magazines, books, and DVDs . . . . . . . . . . . . . . . . . . . . . . . . . . . . . . . . . . . . . . . . . . *10,639 *3 *169 *5 *63 Membership dues and contributions . . . . . . . . . . . . . . . . . . . . . . . . . . . . . . . . . . . . . *24,015 *6 *314 *9 *76 Land leasing and ownership . . . . . . . . . . . . . . . . . . . . . . . . . . . . . . . . . . . . . . . . . . . ... ... ... ... ... Plantings . . . . . . . . . . . . . . . . . . . . . . . . . . . . . . . . . . . . . . . . . . . . . . . . . . . . . . . . . . *31,192 *9 *293 *8 *106
* Estimate based on a sample size of 10–29. … Sample size too small (less than 10) to report data reliably. 1 Average expenditures are annual estimates.2 Percent of wildlife-watching participants column for trip-related expenditures is based on away-from-home participation. For equipment and other expenditures, the percent of wildlife-watching participants column is based on total wildlife-watching participants.3 Includes equipment rental and fees for guides, pack trips, public land use and private land use, boat fuel, other boating costs, and heating and cooking fuel.4 Includes tents, tarps, frame packs and other backpacking equipment, other camping equipment, and other auxiliary equipment.5 Includes boats, campers, cabins, trail bikes, dune buggies, 4 x 4 vehicles, ATVs, 4-wheelers, snowmobiles, pickups, vans, travel and tent trailers, motor homes, house trailers, recreational vehicles (RVs) and other special equipment.
Note: Detail does not add to total because of multiple responses and nonresponse.

38 2011 National Survey of Fishing, Hunting, and Wildlife-Associated Recreation—Pennsylvania U.S. Fish and Wildlife Service and U.S. Census Bureau
Table 32. Trip and Equipment Expenditures in Pennsylvania for Wildlife Watching by Pennsylvania Residents and Nonresidents: 2011(Population 16 years old and older)
Expenditure item Amount(thousands of dollars)
Spenders (thousands)
Average per spender
(dollars)1
Average per participant
(dollars)1
STATE RESIDENTS AND NONRESIDENTS
Total . . . . . . . . . . . . . . . . . . . . . . . . . . . . . . . . . . . . . . . . . . . . . . . . . . 1,055,256 2,484 425 259 Food and lodging . . . . . . . . . . . . . . . . . . . . . . . . . . . . . . . . . . . . . . 203,405 623 327 252 Transportation . . . . . . . . . . . . . . . . . . . . . . . . . . . . . . . . . . . . . . . . . 58,372 720 81 71 Other trip costs2 . . . . . . . . . . . . . . . . . . . . . . . . . . . . . . . . . . . . . . . . ... ... ... ... Equipment3 . . . . . . . . . . . . . . . . . . . . . . . . . . . . . . . . . . . . . . . . . . . 788,587 2,153 366 185
STATE RESIDENTS
Total . . . . . . . . . . . . . . . . . . . . . . . . . . . . . . . . . . . . . . . . . . . . . . . . . . 709,227 1,976 359 215 Food and lodging . . . . . . . . . . . . . . . . . . . . . . . . . . . . . . . . . . . . . . *20,339 *378 *54 *41 Transportation . . . . . . . . . . . . . . . . . . . . . . . . . . . . . . . . . . . . . . . . . *27,901 *439 *64 *54 Other trip costs2 . . . . . . . . . . . . . . . . . . . . . . . . . . . . . . . . . . . . . . . . ... ... ... ... Equipment3 . . . . . . . . . . . . . . . . . . . . . . . . . . . . . . . . . . . . . . . . . . . 659,780 1,884 350 200
NONRESIDENTS
Total . . . . . . . . . . . . . . . . . . . . . . . . . . . . . . . . . . . . . . . . . . . . . . . . . . 346,029 509 680 726 Food and lodging . . . . . . . . . . . . . . . . . . . . . . . . . . . . . . . . . . . . . . 183,067 244 749 597 Transportation . . . . . . . . . . . . . . . . . . . . . . . . . . . . . . . . . . . . . . . . . 30,471 281 108 99 Other trip costs2 . . . . . . . . . . . . . . . . . . . . . . . . . . . . . . . . . . . . . . . . ... ... ... ... Equipment3 . . . . . . . . . . . . . . . . . . . . . . . . . . . . . . . . . . . . . . . . . . . 128,807 269 479 ...
* Estimate based on a sample size of 10–29. … Sample size too small (less than 10) to report data reliably. 1 Average expenditures are annual estimates.2 Includes equipment rental and fees for guides, pack trips, public land use, private land use, boat fuel, other boating costs, and heating and cooking fuel.3 Includes wildlife-watching auxiliary and special equipment.
Note: Detail does not add to total because of multiple responses and nonresponse. See Table 33 for detailed listed of expenditure items.

U.S. Fish and Wildlife Service and U.S. Census Bureau 2011 National Survey of Fishing, Hunting, and Wildlife-Associated Recreation—Pennsylvania 39
Table 33. Wildlife-Watching Expenditures Both Inside and Outside Pennsylvania by Pennsylvania Residents: 2011(State population 16 years old and older)
Expenditure item Expenditures (thousands of dollars)
Average per participant
(dollars)1
Spenders
Number (thousands)
Percent of wildlife-watching
participants2Average per
spender (dollars)1
Total, all items . . . . . . . . . . . . . . . . . . . . . . . . . . . . . . . . . . . . . . . . . . . 1,002,614 301 2,020 61 496
TRIP EXPENDITURES
Total, trip-related . . . . . . . . . . . . . . . . . . . . . . . . . . . . . . . . . . . . . . . . *86,767 *118 *493 *67 *176 Food and lodging . . . . . . . . . . . . . . . . . . . . . . . . . . . . . . . . . . . . . . . *42,106 *57 *446 *61 *94 Food . . . . . . . . . . . . . . . . . . . . . . . . . . . . . . . . . . . . . . . . . . . . . . . *30,327 *41 *446 *61 *68 Lodging . . . . . . . . . . . . . . . . . . . . . . . . . . . . . . . . . . . . . . . . . . . . . ... ... ... ... ... Transportation . . . . . . . . . . . . . . . . . . . . . . . . . . . . . . . . . . . . . . . . . . *41,518 *57 *476 *65 *87 Other trip costs3 . . . . . . . . . . . . . . . . . . . . . . . . . . . . . . . . . . . . . . . . . ... ... ... ... ...
EQUIPMENT AND OTHER EXPENDITURES
Total . . . . . . . . . . . . . . . . . . . . . . . . . . . . . . . . . . . . . . . . . . . . . . . . . . . 915,847 275 1,943 58 471
Wildlife-watching equipment, total . . . . . . . . . . . . . . . . . . . . . . . . . . 301,729 91 1,853 56 163 Binoculars, spotting scopes . . . . . . . . . . . . . . . . . . . . . . . . . . . . . . . . ... ... ... ... ... Film and photo processing . . . . . . . . . . . . . . . . . . . . . . . . . . . . . . . . ... ... ... ... ... Cameras, special lenses, video cameras, and other photographic equipment, including memory cards . . . . . . . . . . . . . *68,622 *21 *201 *6 *342 Day packs, carrying cases, and special clothing . . . . . . . . . . . . . . . . *23,937 *7 *269 *8 *89 Bird food . . . . . . . . . . . . . . . . . . . . . . . . . . . . . . . . . . . . . . . . . . . . . . 118,329 36 1,325 40 89 Food for other wildlife . . . . . . . . . . . . . . . . . . . . . . . . . . . . . . . . . . . *18,310 *6 *364 *11 *50 Nest boxes, bird houses, bird feeders, and bird baths . . . . . . . . . . . . 30,777 9 802 24 38 Other equipment . . . . . . . . . . . . . . . . . . . . . . . . . . . . . . . . . . . . . . . . ... ... ... ... ...
Auxiliary equipment4 . . . . . . . . . . . . . . . . . . . . . . . . . . . . . . . . . . . . . . ... ... ... ... ... Special equipment5 . . . . . . . . . . . . . . . . . . . . . . . . . . . . . . . . . . . . . . . . ... ... ... ... ... Magazines, books, and DVDs . . . . . . . . . . . . . . . . . . . . . . . . . . . . . . . . *11,348 *3 *158 *5 *72 Membership dues and contributions . . . . . . . . . . . . . . . . . . . . . . . . . . . *24,095 *7 *317 *10 *76 Land leasing and ownership . . . . . . . . . . . . . . . . . . . . . . . . . . . . . . . . . ... ... ... ... ... Plantings . . . . . . . . . . . . . . . . . . . . . . . . . . . . . . . . . . . . . . . . . . . . . . . . *31,192 *9 *293 *9 *106
* Estimate based on a sample size of 10–29. … Sample size too small (less than 10) to report data reliably. 1 Average expenditures are annual estimates.2 Percent of wildlife-watching participants column for trip-related expenditures is based on away-from-home participation. For equipment and other expenditures, the percent of wildlife-watching participants column is based on total wildlife-watching participants.3 Includes equipment rental and fees for guides, pack trips, public land use and private land use, boat fuel, other boating costs, and heating and cooking fuel.4 Includes tents, tarps, frame packs and other backpacking equipment, other camping equipment, and other auxiliary equipment.5 Includes boats, campers, cabins, trail bikes, dune buggies, 4 x 4 vehicles, ATVs, 4-wheelers, snowmobiles, pickups, vans, travel and tent trailers, motor homes, house trailers, recreational vehicles (RVs) and other special equipment.
Note: Detail does not add to total because of multiple responses and nonresponse.
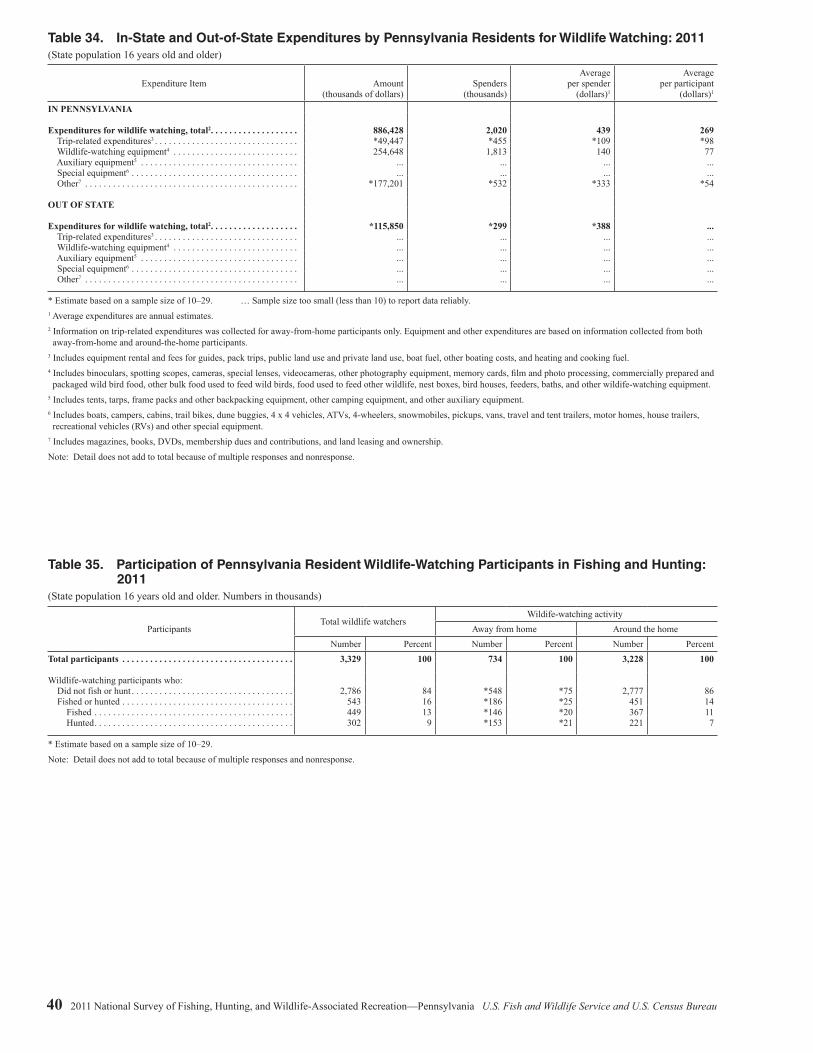
40 2011 National Survey of Fishing, Hunting, and Wildlife-Associated Recreation—Pennsylvania U.S. Fish and Wildlife Service and U.S. Census Bureau
Table 34. In-State and Out-of-State Expenditures by Pennsylvania Residents for Wildlife Watching: 2011(State population 16 years old and older)
Expenditure Item Amount (thousands of dollars)
Spenders (thousands)
Average per spender
(dollars)1
Average per participant
(dollars)1
IN PENNSYLVANIA
Expenditures for wildlife watching, total2. . . . . . . . . . . . . . . . . . . 886,428 2,020 439 269 Trip-related expenditures3 . . . . . . . . . . . . . . . . . . . . . . . . . . . . . . . *49,447 *455 *109 *98 Wildlife-watching equipment4 . . . . . . . . . . . . . . . . . . . . . . . . . . . 254,648 1,813 140 77 Auxiliary equipment5 . . . . . . . . . . . . . . . . . . . . . . . . . . . . . . . . . . ... ... ... ... Special equipment6 . . . . . . . . . . . . . . . . . . . . . . . . . . . . . . . . . . . . ... ... ... ... Other7 . . . . . . . . . . . . . . . . . . . . . . . . . . . . . . . . . . . . . . . . . . . . . . *177,201 *532 *333 *54
OUT OF STATE
Expenditures for wildlife watching, total2. . . . . . . . . . . . . . . . . . . *115,850 *299 *388 ... Trip-related expenditures3 . . . . . . . . . . . . . . . . . . . . . . . . . . . . . . . ... ... ... ... Wildlife-watching equipment4 . . . . . . . . . . . . . . . . . . . . . . . . . . . ... ... ... ... Auxiliary equipment5 . . . . . . . . . . . . . . . . . . . . . . . . . . . . . . . . . . ... ... ... ... Special equipment6 . . . . . . . . . . . . . . . . . . . . . . . . . . . . . . . . . . . . ... ... ... ... Other7 . . . . . . . . . . . . . . . . . . . . . . . . . . . . . . . . . . . . . . . . . . . . . . ... ... ... ...
* Estimate based on a sample size of 10–29. … Sample size too small (less than 10) to report data reliably.1 Average expenditures are annual estimates.2 Information on trip-related expenditures was collected for away-from-home participants only. Equipment and other expenditures are based on information collected from both away-from-home and around-the-home participants.3 Includes equipment rental and fees for guides, pack trips, public land use and private land use, boat fuel, other boating costs, and heating and cooking fuel.4 Includes binoculars, spotting scopes, cameras, special lenses, videocameras, other photography equipment, memory cards, film and photo processing, commercially prepared and packaged wild bird food, other bulk food used to feed wild birds, food used to feed other wildlife, nest boxes, bird houses, feeders, baths, and other wildife-watching equipment.5 Includes tents, tarps, frame packs and other backpacking equipment, other camping equipment, and other auxiliary equipment.6 Includes boats, campers, cabins, trail bikes, dune buggies, 4 x 4 vehicles, ATVs, 4-wheelers, snowmobiles, pickups, vans, travel and tent trailers, motor homes, house trailers, recreational vehicles (RVs) and other special equipment.7 Includes magazines, books, DVDs, membership dues and contributions, and land leasing and ownership.
Note: Detail does not add to total because of multiple responses and nonresponse.
Table 35. Participation of Pennsylvania Resident Wildlife-Watching Participants in Fishing and Hunting: 2011(State population 16 years old and older. Numbers in thousands)
ParticipantsTotal wildlife watchers
Wildife-watching activityAway from home Around the home
Number Percent Number Percent Number PercentTotal participants . . . . . . . . . . . . . . . . . . . . . . . . . . . . . . . . . . . . . 3,329 100 734 100 3,228 100
Wildlife-watching participants who: Did not fish or hunt . . . . . . . . . . . . . . . . . . . . . . . . . . . . . . . . . . . 2,786 84 *548 *75 2,777 86 Fished or hunted . . . . . . . . . . . . . . . . . . . . . . . . . . . . . . . . . . . . . 543 16 *186 *25 451 14 Fished . . . . . . . . . . . . . . . . . . . . . . . . . . . . . . . . . . . . . . . . . . . 449 13 *146 *20 367 11 Hunted . . . . . . . . . . . . . . . . . . . . . . . . . . . . . . . . . . . . . . . . . . . 302 9 *153 *21 221 7
* Estimate based on a sample size of 10–29.
Note: Detail does not add to total because of multiple responses and nonresponse.

U.S. Fish and Wildlife Service and U.S. Census Bureau 2011 National Survey of Fishing, Hunting, and Wildlife-Associated Recreation—Pennsylvania 41
Table 36. Participation of Pennsylvania Resident Sportspersons in Wildlife-Watching Activities: 2011(State population 16 years old and older. Numbers in thousands)
SportspersonsSportspersons Anglers Hunters
Number Percent Number Percent Number PercentTotal sportspersons . . . . . . . . . . . . . . . . . . . . . . . . . . . . . . . . . . . . . . . . . . . . 1,277 100 1,008 100 703 100
Sportspersons who: Did not engage in wildlife-watching activities . . . . . . . . . . . . . . . . . . . . . . 734 57 560 55 401 57 Engaged in wildlife-watching activities . . . . . . . . . . . . . . . . . . . . . . . . . . . 543 43 449 45 302 43 Away from home . . . . . . . . . . . . . . . . . . . . . . . . . . . . . . . . . . . . . . . . . . . *186 *15 *146 *14 *153 *22 Around the home . . . . . . . . . . . . . . . . . . . . . . . . . . . . . . . . . . . . . . . . . . . 451 35 367 36 221 31
* Estimate based on a sample size of 10–29.
Note: Detail does not add to total because of multiple responses and nonresponse.

42 2011 National Survey of Fishing, Hunting, and Wildlife-Associated Recreation—Pennsylvania U.S. Fish and Wildlife Service and U.S. Census Bureau
Table 37. Participation in Wildlife-Related Recreation by State Residents Both Inside and Outside Their Resident State: 2011
(Population 16 years old and older. Numbers in thousands)
Participant’s state of residence
Population
Total participants Sportspersons Wildlife-watching participants
NumberPercent of population Number
Percent of population Number
Percent of population
United States, total . . . . . . . . . . . . . . . . 239,313 90,108 38 37,397 16 71,776 30
Alabama . . . . . . . . . . . . . . . . . . . . . . . 3,664 1,490 41 744 20 1,079 29 Alaska . . . . . . . . . . . . . . . . . . . . . . . . . 526 337 64 235 45 247 47 Arizona . . . . . . . . . . . . . . . . . . . . . . . . 5,084 1,660 33 721 14 1,281 25 Arkansas . . . . . . . . . . . . . . . . . . . . . . . 2,238 1,119 50 572 26 828 37 California . . . . . . . . . . . . . . . . . . . . . . 28,562 7,360 26 1,898 7 6,475 23
Colorado . . . . . . . . . . . . . . . . . . . . . . . 3,946 1,854 47 727 18 1,456 37 Connecticut . . . . . . . . . . . . . . . . . . . . . 2,781 1,204 43 347 12 1,093 39 Delaware . . . . . . . . . . . . . . . . . . . . . . . 699 260 37 101 14 209 30 Florida . . . . . . . . . . . . . . . . . . . . . . . . . 14,855 4,652 31 2,068 14 3,598 24 Georgia . . . . . . . . . . . . . . . . . . . . . . . . 7,459 2,752 37 981 13 2,206 30
Hawaii . . . . . . . . . . . . . . . . . . . . . . . . . 995 222 22 108 11 161 16 Idaho . . . . . . . . . . . . . . . . . . . . . . . . . . 1,172 638 54 331 28 464 40 Illinois . . . . . . . . . . . . . . . . . . . . . . . . . 9,988 3,493 35 1,487 15 2,784 28 Indiana . . . . . . . . . . . . . . . . . . . . . . . . . 4,965 2,131 43 842 17 1,681 34 Iowa . . . . . . . . . . . . . . . . . . . . . . . . . . . 2,363 1,097 46 586 25 780 33
Kansas . . . . . . . . . . . . . . . . . . . . . . . . . 2,163 1,011 47 453 21 776 36 Kentucky . . . . . . . . . . . . . . . . . . . . . . . 3,376 1,470 44 643 19 1,221 36 Louisiana . . . . . . . . . . . . . . . . . . . . . . . 3,449 1,380 40 802 23 840 24 Maine . . . . . . . . . . . . . . . . . . . . . . . . . 1,066 520 49 233 22 401 38 Maryland . . . . . . . . . . . . . . . . . . . . . . . 4,480 1,396 31 426 9 1,224 27
Massachusetts . . . . . . . . . . . . . . . . . . . 5,320 1,779 33 464 9 1,530 29 Michigan . . . . . . . . . . . . . . . . . . . . . . . 7,787 3,709 48 1,636 21 3,067 39 Minnesota . . . . . . . . . . . . . . . . . . . . . . 4,133 2,107 51 1,400 34 1,498 36 Mississippi . . . . . . . . . . . . . . . . . . . . . 2,220 1,017 46 700 32 630 28 Missouri . . . . . . . . . . . . . . . . . . . . . . . 4,667 2,105 45 1,001 21 1,645 35
Montana . . . . . . . . . . . . . . . . . . . . . . . 777 334 43 223 29 258 33 Nebraska . . . . . . . . . . . . . . . . . . . . . . . 1,387 499 36 258 19 362 26 Nevada . . . . . . . . . . . . . . . . . . . . . . . . 2,024 594 29 171 8 504 25 New Hampshire . . . . . . . . . . . . . . . . . 1,066 470 44 168 16 388 36 New Jersey . . . . . . . . . . . . . . . . . . . . . 6,852 2,057 30 709 10 1,708 25
New Mexico . . . . . . . . . . . . . . . . . . . . 1,551 592 38 252 16 486 31 New York . . . . . . . . . . . . . . . . . . . . . . 15,503 5,143 33 1,980 13 4,081 26 North Carolina . . . . . . . . . . . . . . . . . . 7,264 2,717 37 1,394 19 2,124 29 North Dakota . . . . . . . . . . . . . . . . . . . . (NA) (NA) (NA) (NA) (NA) (NA) (NA) Ohio. . . . . . . . . . . . . . . . . . . . . . . . . . . 8,999 4,078 45 1,603 18 3,155 35
Oklahoma . . . . . . . . . . . . . . . . . . . . . . 2,828 1,549 55 770 27 1,233 44 Oregon . . . . . . . . . . . . . . . . . . . . . . . . . 3,061 1,396 46 444 15 1,239 40 Pennsylvania . . . . . . . . . . . . . . . . . . . . 10,036 4,063 40 1,277 13 3,329 33 Rhode Island . . . . . . . . . . . . . . . . . . . . 848 309 36 94 11 270 32 South Carolina . . . . . . . . . . . . . . . . . . 3,555 1,299 37 615 17 944 27
South Dakota . . . . . . . . . . . . . . . . . . . . 631 371 59 190 30 267 42 Tennessee . . . . . . . . . . . . . . . . . . . . . . 4,945 2,121 43 923 19 1,733 35 Texas . . . . . . . . . . . . . . . . . . . . . . . . . . 18,681 5,888 32 2,711 15 4,263 23 Utah . . . . . . . . . . . . . . . . . . . . . . . . . . . 2,036 784 39 406 20 558 27 Vermont . . . . . . . . . . . . . . . . . . . . . . . . 512 316 62 134 26 273 53
Virginia . . . . . . . . . . . . . . . . . . . . . . . . 6,136 2,580 42 842 14 2,212 36 Washington . . . . . . . . . . . . . . . . . . . . . 5,293 2,311 44 968 18 1,932 37 West Virginia . . . . . . . . . . . . . . . . . . . . 1,464 868 59 322 22 751 51 Wisconsin . . . . . . . . . . . . . . . . . . . . . . 4,460 2,499 56 1,198 27 2,152 48 Wyoming . . . . . . . . . . . . . . . . . . . . . . . 424 250 59 145 34 182 43(NA) Not available.
Note: Detail does not add to total because of multiple responses. U.S. totals include responses from participants residing in the District of Columbia, as described in Appendix D.

U.S. Fish and Wildlife Service and U.S. Census Bureau 2011 National Survey of Fishing, Hunting, and Wildlife-Associated Recreation—Pennsylvania 43
Table 38. Anglers and Hunters by Sportsperson’s State of Residence: 2011(Population 16 years old and older. Numbers in thousands)
Sportsperson’s state of residence
Population
Fished or hunted Fished only Hunted only Fished and hunted
NumberPercent of population Number
Percent of population Number
Percent of population Number
Percent of population
United States, total . . . . . . . . 239,313 37,397 16 23,714 10 4,285 2 9,389 4
Alabama . . . . . . . . . . . . . . . 3,664 744 20 252 7 *228 *6 264 7 Alaska . . . . . . . . . . . . . . . . . 526 235 45 129 25 *24 *5 82 16 Arizona . . . . . . . . . . . . . . . . 5,084 721 14 462 9 *135 *3 *124 *2 Arkansas . . . . . . . . . . . . . . . 2,238 572 26 252 11 *105 *5 214 10 California . . . . . . . . . . . . . . 28,562 1,898 7 1,431 5 198 1 269 1
Colorado . . . . . . . . . . . . . . . 3,946 727 18 567 14 *60 *2 99 3 Connecticut . . . . . . . . . . . . . 2,781 347 12 265 10 ... ... 76 3 Delaware . . . . . . . . . . . . . . . 699 101 14 78 11 *9 *1 *14 *2 Florida . . . . . . . . . . . . . . . . . 14,855 2,068 14 1,731 12 *78 *1 252 2 Georgia . . . . . . . . . . . . . . . . 7,459 981 13 672 9 *138 *2 171 2
Hawaii . . . . . . . . . . . . . . . . . 995 108 11 85 9 ... ... *21 *2 Idaho . . . . . . . . . . . . . . . . . . 1,172 331 28 169 14 ... ... *119 *10 Illinois . . . . . . . . . . . . . . . . . 9,988 1,487 15 976 10 *252 *3 260 3 Indiana . . . . . . . . . . . . . . . . . 4,965 842 17 465 9 *56 *1 322 6 Iowa . . . . . . . . . . . . . . . . . . . 2,363 586 25 369 16 *64 *3 152 6
Kansas . . . . . . . . . . . . . . . . . 2,163 453 21 275 13 *18 *1 159 7 Kentucky . . . . . . . . . . . . . . . 3,376 643 19 327 10 *151 *4 165 5 Louisiana . . . . . . . . . . . . . . . 3,449 802 23 511 15 *69 *2 222 6 Maine . . . . . . . . . . . . . . . . . 1,066 233 22 92 9 *37 *3 104 10 Maryland . . . . . . . . . . . . . . . 4,480 426 9 337 8 ... ... *72 *2
Massachusetts . . . . . . . . . . . 5,320 464 9 398 7 ... ... 59 1 Michigan . . . . . . . . . . . . . . . 7,787 1,636 21 1,128 14 *170 *2 337 4 Minnesota . . . . . . . . . . . . . . 4,133 1,400 34 925 22 *71 *2 403 10 Mississippi . . . . . . . . . . . . . 2,220 700 32 263 12 *96 *4 340 15 Missouri . . . . . . . . . . . . . . . 4,667 1,001 21 507 11 132 3 363 8
Montana . . . . . . . . . . . . . . . 777 223 29 114 15 *30 *4 78 10 Nebraska . . . . . . . . . . . . . . . 1,387 258 19 143 10 *61 *4 54 4 Nevada . . . . . . . . . . . . . . . . 2,024 171 8 122 6 *15 *1 *34 *2 New Hampshire . . . . . . . . . 1,066 168 16 125 12 ... ... *39 *4 New Jersey . . . . . . . . . . . . . 6,852 709 10 593 9 *30 *(Z) 86 1
New Mexico . . . . . . . . . . . . 1,551 252 16 185 12 *21 *1 *47 *3 New York . . . . . . . . . . . . . . 15,503 1,980 13 1,241 8 *172 *1 567 4 North Carolina . . . . . . . . . . 7,264 1,394 19 1,077 15 *88 *1 230 3 North Dakota . . . . . . . . . . . . (NA) (NA) (NA) (NA) (NA) (NA) (NA) (NA) (NA) Ohio. . . . . . . . . . . . . . . . . . . 8,999 1,603 18 1,075 12 *168 *2 360 4
Oklahoma . . . . . . . . . . . . . . 2,828 770 27 551 19 ... ... *193 *7 Oregon . . . . . . . . . . . . . . . . . 3,061 444 15 263 9 *58 *2 *123 *4 Pennsylvania . . . . . . . . . . . . 10,036 1,277 13 574 6 269 3 434 4 Rhode Island . . . . . . . . . . . . 848 94 11 77 9 ... ... 16 2 South Carolina . . . . . . . . . . 3,555 615 17 377 11 *42 *1 196 6
South Dakota . . . . . . . . . . . . 631 190 30 *58 *9 *27 *4 106 17 Tennessee . . . . . . . . . . . . . . 4,945 923 19 637 13 *91 *2 196 4 Texas . . . . . . . . . . . . . . . . . . 18,681 2,711 15 1,631 9 *356 *2 724 4 Utah . . . . . . . . . . . . . . . . . . . 2,036 406 20 245 12 *55 *3 106 5 Vermont . . . . . . . . . . . . . . . . 512 134 26 64 12 30 6 41 8
Virginia . . . . . . . . . . . . . . . . 6,136 842 14 488 8 135 2 219 4 Washington . . . . . . . . . . . . . 5,293 968 18 749 14 *54 *1 165 3 West Virginia . . . . . . . . . . . . 1,464 322 22 111 8 *83 *6 128 9 Wisconsin . . . . . . . . . . . . . . 4,460 1,198 27 434 10 *260 *6 504 11 Wyoming . . . . . . . . . . . . . . . 424 145 34 69 16 *30 *7 46 11* Estimate based on a sample size of 10–29. … Sample size too small (less than 10) to report data reliably.
Note: U.S. totals include responses from participants residing in the District of Columbia, as described in Appendix D.
(NA) Not available. (Z) Less than 0.5 percent.

44 2011 National Survey of Fishing, Hunting, and Wildlife-Associated Recreation—Pennsylvania U.S. Fish and Wildlife Service and U.S. Census Bureau
Table 39. Participation in Wildlife-Related Recreation in Each State by Both Residents and Nonresidents of the State: 2011
(Population 16 years old and older. Numbers in thousands)
State where activity took placeTotal participants Sportspersons Wildlife-watching participantsNumber Percent Number Percent Number Percent
United States, total . . . . . . . . . . . . . . . . . . . . . . . . . . . . 90,108 100 37,397 42 71,776 80
Alabama . . . . . . . . . . . . . . . . . . . . . . . . . . . . . . . . . . . 1,732 100 948 55 1,114 64 Alaska . . . . . . . . . . . . . . . . . . . . . . . . . . . . . . . . . . . . . 1,014 100 563 55 640 63 Arizona . . . . . . . . . . . . . . . . . . . . . . . . . . . . . . . . . . . . 2,136 100 786 37 1,566 73 Arkansas . . . . . . . . . . . . . . . . . . . . . . . . . . . . . . . . . . . 1,323 100 696 53 852 64 California . . . . . . . . . . . . . . . . . . . . . . . . . . . . . . . . . . 7,849 100 1,820 23 6,733 86
Colorado . . . . . . . . . . . . . . . . . . . . . . . . . . . . . . . . . . . 2,315 100 919 40 1,782 77 Connecticut . . . . . . . . . . . . . . . . . . . . . . . . . . . . . . . . . 1,361 100 350 26 1,178 87 Delaware . . . . . . . . . . . . . . . . . . . . . . . . . . . . . . . . . . . 344 100 177 52 243 71 Florida . . . . . . . . . . . . . . . . . . . . . . . . . . . . . . . . . . . . . 6,354 100 3,152 50 4,308 68 Georgia . . . . . . . . . . . . . . . . . . . . . . . . . . . . . . . . . . . . 3,058 100 1,059 35 2,393 78
Hawaii . . . . . . . . . . . . . . . . . . . . . . . . . . . . . . . . . . . . . 465 100 158 34 358 77 Idaho . . . . . . . . . . . . . . . . . . . . . . . . . . . . . . . . . . . . . . 838 100 534 64 558 67 Illinois . . . . . . . . . . . . . . . . . . . . . . . . . . . . . . . . . . . . . 3,799 100 1,309 34 3,019 79 Indiana . . . . . . . . . . . . . . . . . . . . . . . . . . . . . . . . . . . . . 2,308 100 867 38 1,719 74 Iowa . . . . . . . . . . . . . . . . . . . . . . . . . . . . . . . . . . . . . . . 1,255 100 598 48 837 67
Kansas . . . . . . . . . . . . . . . . . . . . . . . . . . . . . . . . . . . . . 1,156 100 527 46 792 69 Kentucky . . . . . . . . . . . . . . . . . . . . . . . . . . . . . . . . . . . 1,710 100 713 42 1,319 77 Louisiana . . . . . . . . . . . . . . . . . . . . . . . . . . . . . . . . . . . 1,709 100 904 53 1,010 59 Maine . . . . . . . . . . . . . . . . . . . . . . . . . . . . . . . . . . . . . 1,117 100 413 37 838 75 Maryland . . . . . . . . . . . . . . . . . . . . . . . . . . . . . . . . . . . 1,613 100 445 28 1,362 84
Massachusetts . . . . . . . . . . . . . . . . . . . . . . . . . . . . . . . 2,199 100 538 24 1,828 83 Michigan . . . . . . . . . . . . . . . . . . . . . . . . . . . . . . . . . . . 4,397 100 1,938 44 3,199 73 Minnesota . . . . . . . . . . . . . . . . . . . . . . . . . . . . . . . . . . 2,518 100 1,649 65 1,577 63 Mississippi . . . . . . . . . . . . . . . . . . . . . . . . . . . . . . . . . 1,350 100 782 58 781 58 Missouri . . . . . . . . . . . . . . . . . . . . . . . . . . . . . . . . . . . 2,494 100 1,277 51 1,716 69
Montana . . . . . . . . . . . . . . . . . . . . . . . . . . . . . . . . . . . 570 100 335 59 402 71 Nebraska . . . . . . . . . . . . . . . . . . . . . . . . . . . . . . . . . . . 558 100 289 52 384 69 Nevada . . . . . . . . . . . . . . . . . . . . . . . . . . . . . . . . . . . . 734 100 163 22 643 88 New Hampshire . . . . . . . . . . . . . . . . . . . . . . . . . . . . . 786 100 247 31 630 80 New Jersey . . . . . . . . . . . . . . . . . . . . . . . . . . . . . . . . . 2,438 100 794 33 1,875 77
New Mexico . . . . . . . . . . . . . . . . . . . . . . . . . . . . . . . . 783 100 304 39 566 72 New York . . . . . . . . . . . . . . . . . . . . . . . . . . . . . . . . . . 5,536 100 2,109 38 4,239 77 North Carolina . . . . . . . . . . . . . . . . . . . . . . . . . . . . . . 3,497 100 1,631 47 2,432 70 North Dakota . . . . . . . . . . . . . . . . . . . . . . . . . . . . . . . . (NA) (NA) (NA) (NA) (NA) (NA) Ohio. . . . . . . . . . . . . . . . . . . . . . . . . . . . . . . . . . . . . . . 4,344 100 1,561 36 3,197 74
Oklahoma . . . . . . . . . . . . . . . . . . . . . . . . . . . . . . . . . . 1,727 100 779 45 1,263 73 Oregon . . . . . . . . . . . . . . . . . . . . . . . . . . . . . . . . . . . . . 1,786 100 703 39 1,440 81 Pennsylvania . . . . . . . . . . . . . . . . . . . . . . . . . . . . . . . . 4,564 100 1,424 31 3,598 79 Rhode Island . . . . . . . . . . . . . . . . . . . . . . . . . . . . . . . . 402 100 179 45 308 77 South Carolina . . . . . . . . . . . . . . . . . . . . . . . . . . . . . . 1,729 100 847 49 1,103 64
South Dakota . . . . . . . . . . . . . . . . . . . . . . . . . . . . . . . . 662 100 430 65 384 58 Tennessee . . . . . . . . . . . . . . . . . . . . . . . . . . . . . . . . . . 2,584 100 994 38 1,955 76 Texas . . . . . . . . . . . . . . . . . . . . . . . . . . . . . . . . . . . . . . 6,305 100 2,713 43 4,376 69 Utah . . . . . . . . . . . . . . . . . . . . . . . . . . . . . . . . . . . . . . . 1,015 100 493 49 717 71 Vermont . . . . . . . . . . . . . . . . . . . . . . . . . . . . . . . . . . . . 512 100 254 50 370 72
Virginia . . . . . . . . . . . . . . . . . . . . . . . . . . . . . . . . . . . . 3,269 100 1,068 33 2,509 77 Washington . . . . . . . . . . . . . . . . . . . . . . . . . . . . . . . . . 2,756 100 1,005 36 2,168 79 West Virginia . . . . . . . . . . . . . . . . . . . . . . . . . . . . . . . . 1,176 100 447 38 850 72 Wisconsin . . . . . . . . . . . . . . . . . . . . . . . . . . . . . . . . . . 3,500 100 1,554 44 2,359 67 Wyoming . . . . . . . . . . . . . . . . . . . . . . . . . . . . . . . . . . . 775 100 390 50 518 67* Estimate based on a sample size of 10–29. (NA) Not available.
Note: Detail does not add to total because of multiple responses. U.S. totals include responses from participants residing in the District of Columbia, as described in Appendix D.

U.S. Fish and Wildlife Service and U.S. Census Bureau 2011 National Survey of Fishing, Hunting, and Wildlife-Associated Recreation—Pennsylvania 45
Table 40. Anglers and Hunters by State Where Fishing or Hunting Took Place: 2011(Population 16 years old and older. Numbers in thousands)
State where fishing or hunting took place
Anglers HuntersTotal anglers, residents and nonresidents
State residents NonresidentsTotal hunters, residents and nonresidents
State residents Nonresidents
Number Percent Number Percent Number Percent Number Percent Number Percent Number PercentUnited States, total . . . . . 33,112 100 30,037 91 6,964 21 13,674 100 12,890 94 1,942 14
Alabama . . . . . . . . . . . . 683 100 473 69 210 31 535 100 492 92 *44 *8 Alaska . . . . . . . . . . . . . . 538 100 211 39 327 61 125 100 104 83 ... ... Arizona . . . . . . . . . . . . . 637 100 533 84 *104 *16 269 100 225 83 *45 *17 Arkansas . . . . . . . . . . . . 555 100 458 83 *97 *17 363 100 316 87 ... ... California . . . . . . . . . . . 1,674 100 1,576 94 98 6 394 100 377 96 ... ...
Colorado . . . . . . . . . . . . 767 100 593 77 175 23 259 100 144 55 *115 *45 Connecticut . . . . . . . . . . 342 100 277 81 *65 *19 50 100 46 93 ... ... Delaware . . . . . . . . . . . . 166 100 59 36 *107 *64 23 100 19 84 ... ... Florida . . . . . . . . . . . . . . 3,092 100 1,895 61 1,197 39 242 100 215 89 ... ... Georgia . . . . . . . . . . . . . 829 100 764 92 *65 *8 392 100 293 75 *98 *25
Hawaii . . . . . . . . . . . . . . 157 100 104 66 ... ... *23 *100 *23 *100 ... ... Idaho . . . . . . . . . . . . . . . 447 100 238 53 208 47 246 100 *162 *66 *85 *34 Illinois . . . . . . . . . . . . . . 1,044 100 955 92 *88 *8 512 100 459 90 ... ... Indiana . . . . . . . . . . . . . . 801 100 720 90 *81 *10 392 100 377 96 ... ... Iowa . . . . . . . . . . . . . . . . 473 100 416 88 *58 *12 253 100 200 79 ... ...
Kansas . . . . . . . . . . . . . . 400 100 372 93 *28 *7 283 100 170 60 *112 *40 Kentucky . . . . . . . . . . . . 554 100 451 81 *103 *19 347 100 316 91 ... ... Louisiana . . . . . . . . . . . . 825 100 700 85 *125 *15 277 100 253 91 ... ... Maine . . . . . . . . . . . . . . 341 100 193 56 149 44 181 100 141 78 *40 *22 Maryland . . . . . . . . . . . . 426 100 347 81 80 19 88 100 *69 *78 *19 *22
Massachusetts . . . . . . . . 532 100 377 71 155 29 56 100 52 93 ... ... Michigan . . . . . . . . . . . . 1,744 100 1,397 80 347 20 529 100 501 95 ... ... Minnesota . . . . . . . . . . . 1,562 100 1,303 83 259 17 477 100 457 96 ... ... Mississippi . . . . . . . . . . 651 100 600 92 ... ... 483 100 436 90 ... ... Missouri . . . . . . . . . . . . 1,071 100 827 77 244 23 576 100 477 83 *100 *17
Montana . . . . . . . . . . . . 267 100 185 69 82 31 150 100 104 70 *46 *30 Nebraska . . . . . . . . . . . . 207 100 177 85 ... ... 128 100 110 86 ... ... Nevada . . . . . . . . . . . . . 147 100 114 78 ... ... 43 100 39 91 ... ... New Hampshire . . . . . . 228 100 153 67 75 33 56 100 42 74 *14 *26 New Jersey . . . . . . . . . . 766 100 509 66 *257 *34 94 100 93 99 ... ...
New Mexico . . . . . . . . . 278 100 213 77 *65 *23 69 100 64 93 ... ... New York . . . . . . . . . . . 1,882 100 1,585 84 297 16 823 100 739 90 *84 *10 North Carolina . . . . . . . 1,525 100 1,196 78 329 22 335 100 259 77 *76 *23 North Dakota . . . . . . . . . (NA) (NA) (NA) (NA) (NA) (NA) (NA) (NA) (NA) (NA) (NA) (NA) Ohio. . . . . . . . . . . . . . . . 1,342 100 1,257 94 *85 *6 553 100 516 93 *37 *7
Oklahoma . . . . . . . . . . . 729 100 680 93 *49 *7 244 100 219 90 ... ... Oregon . . . . . . . . . . . . . . 638 100 373 59 264 41 196 100 181 92 ... ... Pennsylvania . . . . . . . . . 1,101 100 891 81 210 19 775 100 699 90 *76 *10 Rhode Island . . . . . . . . . 175 100 79 45 96 55 20 100 15 77 ... ... South Carolina . . . . . . . 744 100 561 75 *182 *25 254 100 180 71 *74 *29
South Dakota . . . . . . . . . 268 100 156 58 *112 *42 270 100 127 47 144 53 Tennessee . . . . . . . . . . . 826 100 709 86 *117 *14 375 100 276 74 ... ... Texas . . . . . . . . . . . . . . . 2,246 100 2,133 95 *114 *5 1,147 100 1,080 94 *67 *6 Utah . . . . . . . . . . . . . . . . 414 100 343 83 *70 *17 193 100 158 82 *35 *18 Vermont . . . . . . . . . . . . . 207 100 95 46 112 54 90 100 66 74 ... ...
Virginia . . . . . . . . . . . . . 833 100 649 78 184 22 432 100 326 75 *106 *25 Washington . . . . . . . . . . 938 100 835 89 *103 *11 219 100 200 92 ... ... West Virginia . . . . . . . . . 305 100 222 73 *84 *27 247 100 184 74 ... ... Wisconsin . . . . . . . . . . . 1,247 100 910 73 337 27 895 100 763 85 *131 *15 Wyoming . . . . . . . . . . . . 303 100 110 36 *193 *64 140 100 76 54 *64 *46* Estimate based on a sample size of 10–29. … Sample size too small (less than 10) to report data reliably. (NA) Not available.
Note: For the U.S. row, detail does not add to total because of multiple responses. U.S. totals include responses from participants residing in the District of Columbia, as described in Appendix D.


U.S. Fish and Wildlife Service and U.S. Census Bureau 2011 National Survey of Fishing, Hunting, and Wildlife-Associated Recreation—Pennsylvania 47
Appendix A


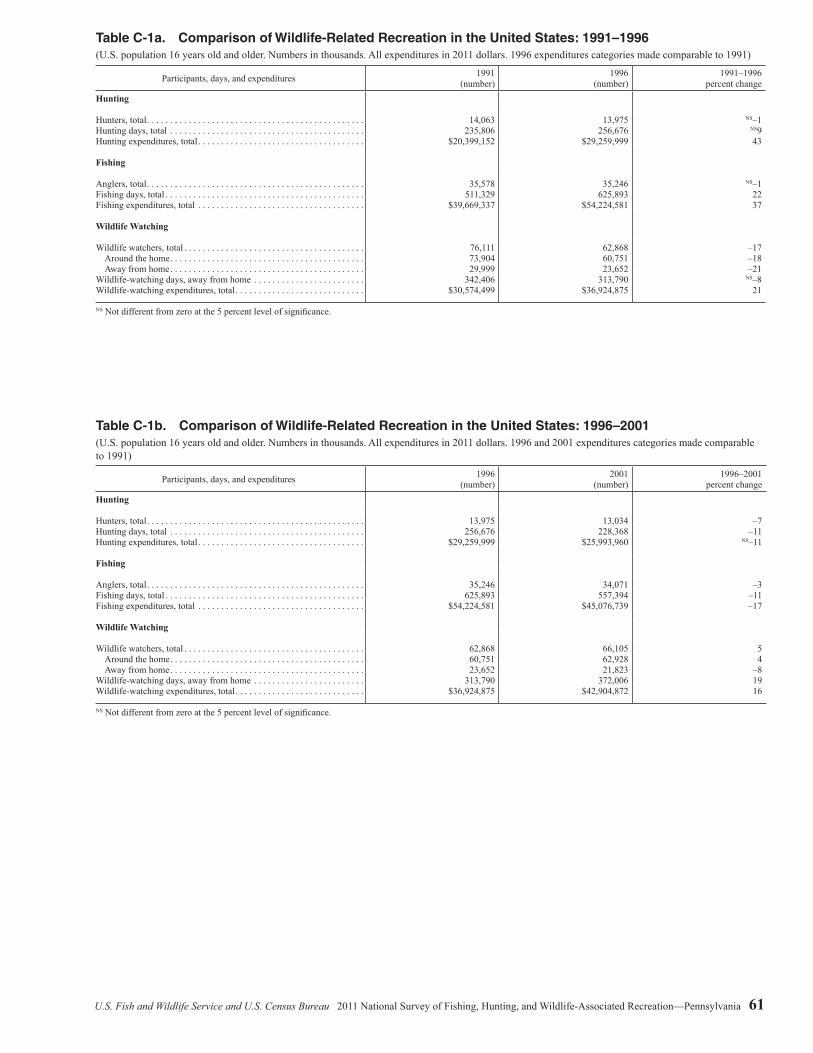


U.S. Fish and Wildlife Service and U.S. Census Bureau 2011 National Survey of Fishing, Hunting, and Wildlife-Associated Recreation—Pennsylvania 63
Table C-1e. Comparison of Wildlife-Related Recreation in the United States: 1991–2011(U.S. population 16 years old and older. Numbers in thousands. All expenditures in 2011 dollars. 2011 expenditures categories made comparable to 1991)
Participants, days, and expenditures 1991 (number)
2011 (number)
1991–2011 percent change
Hunting
Hunters, total . . . . . . . . . . . . . . . . . . . . . . . . . . . . . . . . . . . . . . . . . . . . . . . . . . . 14,063 13,674 NS–3Hunting days, total . . . . . . . . . . . . . . . . . . . . . . . . . . . . . . . . . . . . . . . . . . . . . . 235,806 281,884 20Hunting expenditures, total . . . . . . . . . . . . . . . . . . . . . . . . . . . . . . . . . . . . . . . . $20,399,152 $32,579,640 60
Fishing
Anglers, total . . . . . . . . . . . . . . . . . . . . . . . . . . . . . . . . . . . . . . . . . . . . . . . . . . . 35,578 33,112 –7Fishing days, total . . . . . . . . . . . . . . . . . . . . . . . . . . . . . . . . . . . . . . . . . . . . . . . 511,329 553,841 8Fishing expenditures, total . . . . . . . . . . . . . . . . . . . . . . . . . . . . . . . . . . . . . . . . $39,669,337 $41,624,599 NS5
Wildlife Watching
Wildlife watchers, total . . . . . . . . . . . . . . . . . . . . . . . . . . . . . . . . . . . . . . . . . . . 76,111 71,776 –6 Around the home . . . . . . . . . . . . . . . . . . . . . . . . . . . . . . . . . . . . . . . . . . . . . . 73,904 68,598 –7 Away from home . . . . . . . . . . . . . . . . . . . . . . . . . . . . . . . . . . . . . . . . . . . . . . 29,999 22,496 –25Wildlife-watching days, away from home . . . . . . . . . . . . . . . . . . . . . . . . . . . . 342,406 335,625 NS–2Wildlife-watching expenditures, total . . . . . . . . . . . . . . . . . . . . . . . . . . . . . . . . $30,574,499 $43,636,608 43
NS Not different from zero at the 5 percent level of significance.
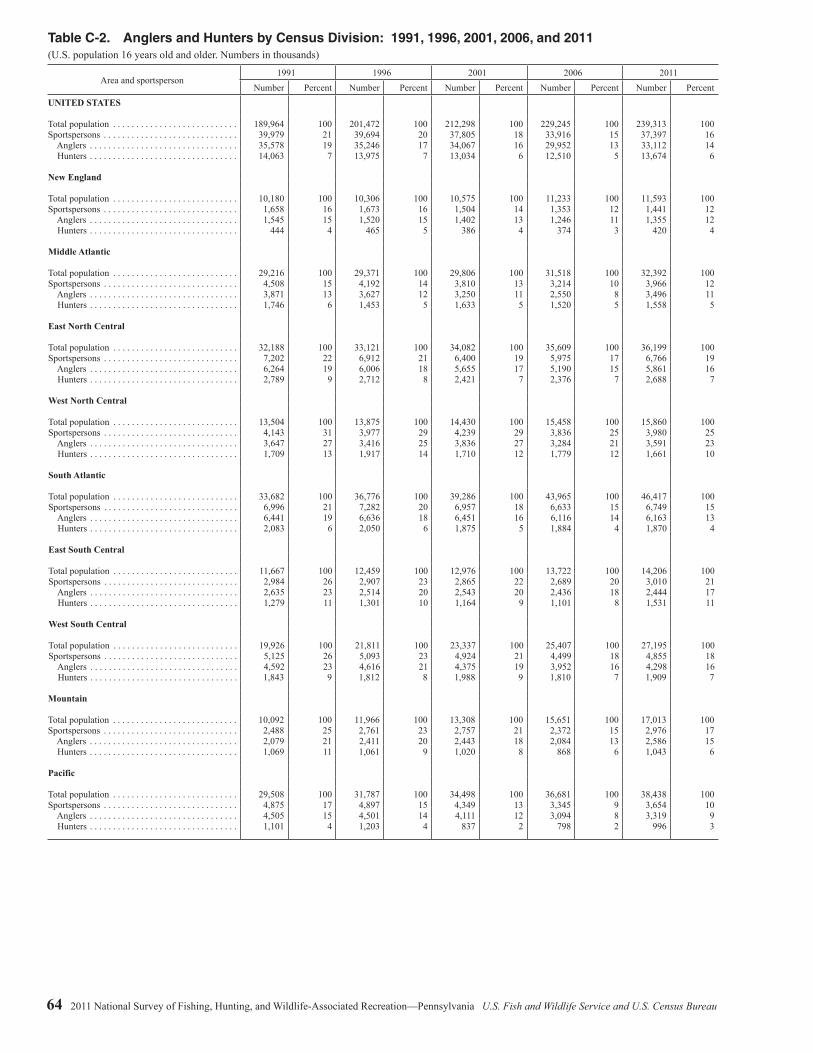
64 2011 National Survey of Fishing, Hunting, and Wildlife-Associated Recreation—Pennsylvania U.S. Fish and Wildlife Service and U.S. Census Bureau
Table C-2. Anglers and Hunters by Census Division: 1991, 1996, 2001, 2006, and 2011(U.S. population 16 years old and older. Numbers in thousands)
Area and sportsperson1991 1996 2001 2006 2011
Number Percent Number Percent Number Percent Number Percent Number PercentUNITED STATES
Total population . . . . . . . . . . . . . . . . . . . . . . . . . . . 189,964 100 201,472 100 212,298 100 229,245 100 239,313 100Sportspersons . . . . . . . . . . . . . . . . . . . . . . . . . . . . . 39,979 21 39,694 20 37,805 18 33,916 15 37,397 16 Anglers . . . . . . . . . . . . . . . . . . . . . . . . . . . . . . . . 35,578 19 35,246 17 34,067 16 29,952 13 33,112 14 Hunters . . . . . . . . . . . . . . . . . . . . . . . . . . . . . . . . 14,063 7 13,975 7 13,034 6 12,510 5 13,674 6
New England
Total population . . . . . . . . . . . . . . . . . . . . . . . . . . . 10,180 100 10,306 100 10,575 100 11,233 100 11,593 100Sportspersons . . . . . . . . . . . . . . . . . . . . . . . . . . . . . 1,658 16 1,673 16 1,504 14 1,353 12 1,441 12 Anglers . . . . . . . . . . . . . . . . . . . . . . . . . . . . . . . . 1,545 15 1,520 15 1,402 13 1,246 11 1,355 12 Hunters . . . . . . . . . . . . . . . . . . . . . . . . . . . . . . . . 444 4 465 5 386 4 374 3 420 4
Middle Atlantic
Total population . . . . . . . . . . . . . . . . . . . . . . . . . . . 29,216 100 29,371 100 29,806 100 31,518 100 32,392 100Sportspersons . . . . . . . . . . . . . . . . . . . . . . . . . . . . . 4,508 15 4,192 14 3,810 13 3,214 10 3,966 12 Anglers . . . . . . . . . . . . . . . . . . . . . . . . . . . . . . . . 3,871 13 3,627 12 3,250 11 2,550 8 3,496 11 Hunters . . . . . . . . . . . . . . . . . . . . . . . . . . . . . . . . 1,746 6 1,453 5 1,633 5 1,520 5 1,558 5
East North Central
Total population . . . . . . . . . . . . . . . . . . . . . . . . . . . 32,188 100 33,121 100 34,082 100 35,609 100 36,199 100Sportspersons . . . . . . . . . . . . . . . . . . . . . . . . . . . . . 7,202 22 6,912 21 6,400 19 5,975 17 6,766 19 Anglers . . . . . . . . . . . . . . . . . . . . . . . . . . . . . . . . 6,264 19 6,006 18 5,655 17 5,190 15 5,861 16 Hunters . . . . . . . . . . . . . . . . . . . . . . . . . . . . . . . . 2,789 9 2,712 8 2,421 7 2,376 7 2,688 7
West North Central
Total population . . . . . . . . . . . . . . . . . . . . . . . . . . . 13,504 100 13,875 100 14,430 100 15,458 100 15,860 100Sportspersons . . . . . . . . . . . . . . . . . . . . . . . . . . . . . 4,143 31 3,977 29 4,239 29 3,836 25 3,980 25 Anglers . . . . . . . . . . . . . . . . . . . . . . . . . . . . . . . . 3,647 27 3,416 25 3,836 27 3,284 21 3,591 23 Hunters . . . . . . . . . . . . . . . . . . . . . . . . . . . . . . . . 1,709 13 1,917 14 1,710 12 1,779 12 1,661 10
South Atlantic
Total population . . . . . . . . . . . . . . . . . . . . . . . . . . . 33,682 100 36,776 100 39,286 100 43,965 100 46,417 100Sportspersons . . . . . . . . . . . . . . . . . . . . . . . . . . . . . 6,996 21 7,282 20 6,957 18 6,633 15 6,749 15 Anglers . . . . . . . . . . . . . . . . . . . . . . . . . . . . . . . . 6,441 19 6,636 18 6,451 16 6,116 14 6,163 13 Hunters . . . . . . . . . . . . . . . . . . . . . . . . . . . . . . . . 2,083 6 2,050 6 1,875 5 1,884 4 1,870 4
East South Central
Total population . . . . . . . . . . . . . . . . . . . . . . . . . . . 11,667 100 12,459 100 12,976 100 13,722 100 14,206 100Sportspersons . . . . . . . . . . . . . . . . . . . . . . . . . . . . . 2,984 26 2,907 23 2,865 22 2,689 20 3,010 21 Anglers . . . . . . . . . . . . . . . . . . . . . . . . . . . . . . . . 2,635 23 2,514 20 2,543 20 2,436 18 2,444 17 Hunters . . . . . . . . . . . . . . . . . . . . . . . . . . . . . . . . 1,279 11 1,301 10 1,164 9 1,101 8 1,531 11
West South Central
Total population . . . . . . . . . . . . . . . . . . . . . . . . . . . 19,926 100 21,811 100 23,337 100 25,407 100 27,195 100Sportspersons . . . . . . . . . . . . . . . . . . . . . . . . . . . . . 5,125 26 5,093 23 4,924 21 4,499 18 4,855 18 Anglers . . . . . . . . . . . . . . . . . . . . . . . . . . . . . . . . 4,592 23 4,616 21 4,375 19 3,952 16 4,298 16 Hunters . . . . . . . . . . . . . . . . . . . . . . . . . . . . . . . . 1,843 9 1,812 8 1,988 9 1,810 7 1,909 7
Mountain
Total population . . . . . . . . . . . . . . . . . . . . . . . . . . . 10,092 100 11,966 100 13,308 100 15,651 100 17,013 100Sportspersons . . . . . . . . . . . . . . . . . . . . . . . . . . . . . 2,488 25 2,761 23 2,757 21 2,372 15 2,976 17 Anglers . . . . . . . . . . . . . . . . . . . . . . . . . . . . . . . . 2,079 21 2,411 20 2,443 18 2,084 13 2,586 15 Hunters . . . . . . . . . . . . . . . . . . . . . . . . . . . . . . . . 1,069 11 1,061 9 1,020 8 868 6 1,043 6
Pacific
Total population . . . . . . . . . . . . . . . . . . . . . . . . . . . 29,508 100 31,787 100 34,498 100 36,681 100 38,438 100Sportspersons . . . . . . . . . . . . . . . . . . . . . . . . . . . . . 4,875 17 4,897 15 4,349 13 3,345 9 3,654 10 Anglers . . . . . . . . . . . . . . . . . . . . . . . . . . . . . . . . 4,505 15 4,501 14 4,111 12 3,094 8 3,319 9 Hunters . . . . . . . . . . . . . . . . . . . . . . . . . . . . . . . . 1,101 4 1,203 4 837 2 798 2 996 3

U.S. Fish and Wildlife Service and U.S. Census Bureau 2011 National Survey of Fishing, Hunting, and Wildlife-Associated Recreation—Pennsylvania 65
Table C-3. Wildlife-Watching Participants by Census Division: 1991, 1996, 2001, 2006, and 2011(U.S. population 16 years old and older. Numbers in thousands)
Area and wildlife watcher1991 1996 2001 2006 2011
Number Percent Number Percent Number Percent Number Percent Number PercentUNITED STATES
Total population . . . . . . . . . . . . . . . . . . . . . . . . . . . 189,964 100 201,472 100 212,298 100 229,245 100 239,313 100Total wildlife watchers . . . . . . . . . . . . . . . . . . . . . . 76,111 40 62,868 31 66,105 31 71,132 31 71,776 30 Away from home . . . . . . . . . . . . . . . . . . . . . . . . . 29,999 16 23,652 12 21,823 10 22,977 10 22,496 9 Around the home . . . . . . . . . . . . . . . . . . . . . . . . . 73,904 39 60,751 30 62,928 30 67,756 30 68,598 29
New England
Total population . . . . . . . . . . . . . . . . . . . . . . . . . . . 10,180 100 10,306 100 10,575 100 11,233 100 11,593 100Total wildlife watchers . . . . . . . . . . . . . . . . . . . . . . 4,598 45 3,710 36 3,875 37 4,489 40 3,954 34 Away from home . . . . . . . . . . . . . . . . . . . . . . . . . 1,856 18 1,443 14 1,155 11 1,340 12 1,187 10 Around the home . . . . . . . . . . . . . . . . . . . . . . . . . 4,544 45 3,586 35 3,765 36 4,310 38 3,858 33
Middle Atlantic
Total population . . . . . . . . . . . . . . . . . . . . . . . . . . . 29,216 100 29,371 100 29,806 100 31,518 100 32,392 100Total wildlife watchers . . . . . . . . . . . . . . . . . . . . . . 10,556 36 8,185 28 8,740 29 8,723 28 9,118 28 Away from home . . . . . . . . . . . . . . . . . . . . . . . . . 4,166 14 2,960 10 2,849 10 2,729 9 2,561 8 Around the home . . . . . . . . . . . . . . . . . . . . . . . . . 10,282 35 8,023 27 8,452 28 8,451 27 8,744 27
East North Central
Total population . . . . . . . . . . . . . . . . . . . . . . . . . . . 32,188 100 33,121 100 34,082 100 35,609 100 36,199 100Total wildlife watchers . . . . . . . . . . . . . . . . . . . . . . 14,511 45 11,731 35 11,631 34 12,215 34 12,840 35 Away from home . . . . . . . . . . . . . . . . . . . . . . . . . 5,572 17 4,501 14 3,571 10 3,792 11 3,168 9 Around the home . . . . . . . . . . . . . . . . . . . . . . . . . 14,175 44 11,297 34 11,196 33 11,845 33 12,492 35
West North Central
Total population . . . . . . . . . . . . . . . . . . . . . . . . . . . 13,504 100 13,875 100 14,430 100 15,458 100 15,860 100Total wildlife watchers . . . . . . . . . . . . . . . . . . . . . . 6,924 51 5,089 37 6,206 43 6,741 44 5,479 35 Away from home . . . . . . . . . . . . . . . . . . . . . . . . . 2,654 20 1,927 14 2,059 14 2,163 14 1,783 11 Around the home . . . . . . . . . . . . . . . . . . . . . . . . . 6,722 50 4,900 35 5,938 41 6,447 42 5,201 33
South Atlantic
Total population . . . . . . . . . . . . . . . . . . . . . . . . . . . 33,682 100 36,776 100 39,286 100 43,965 100 46,417 100Total wildlife watchers . . . . . . . . . . . . . . . . . . . . . . 13,047 39 11,252 31 11,395 29 12,862 29 13,315 29 Away from home . . . . . . . . . . . . . . . . . . . . . . . . . 4,450 13 3,992 11 3,469 9 3,208 7 4,393 9 Around the home . . . . . . . . . . . . . . . . . . . . . . . . . 12,813 38 10,964 30 10,911 28 12,432 28 12,767 28
East South Central
Total population . . . . . . . . . . . . . . . . . . . . . . . . . . . 11,667 100 12,459 100 12,976 100 13,722 100 14,206 100Total wildlife watchers . . . . . . . . . . . . . . . . . . . . . . 4,864 42 3,904 31 4,514 35 4,931 36 4,663 33 Away from home . . . . . . . . . . . . . . . . . . . . . . . . . 1,592 14 1,118 9 1,086 8 1,758 13 1,456 10 Around the home . . . . . . . . . . . . . . . . . . . . . . . . . 4,765 41 3,795 30 4,390 34 4,683 34 4,394 31
West South Central
Total population . . . . . . . . . . . . . . . . . . . . . . . . . . . 19,926 100 21,811 100 23,337 100 25,407 100 27,195 100Total wildlife watchers . . . . . . . . . . . . . . . . . . . . . . 7,035 35 5,933 27 5,747 25 6,764 27 7,164 26 Away from home . . . . . . . . . . . . . . . . . . . . . . . . . 2,459 12 2,096 10 1,822 8 2,127 8 1,728 6 Around the home . . . . . . . . . . . . . . . . . . . . . . . . . 6,817 34 5,773 26 5,490 24 6,319 25 7,087 26
Mountain
Total population . . . . . . . . . . . . . . . . . . . . . . . . . . . 10,092 100 11,966 100 13,308 100 15,651 100 17,013 100Total wildlife watchers . . . . . . . . . . . . . . . . . . . . . . 4,437 44 4,099 34 4,619 35 4,968 32 5,189 30 Away from home . . . . . . . . . . . . . . . . . . . . . . . . . 2,215 22 1,967 16 2,019 15 2,004 13 2,230 13 Around the home . . . . . . . . . . . . . . . . . . . . . . . . . 4,145 41 3,855 32 4,282 32 4,605 29 4,716 28
Pacific
Total population . . . . . . . . . . . . . . . . . . . . . . . . . . . 29,508 100 31,787 100 34,498 100 36,681 100 38,438 100Total wildlife watchers . . . . . . . . . . . . . . . . . . . . . . 10,139 34 8,966 28 9,377 27 9,439 26 10,054 26 Away from home . . . . . . . . . . . . . . . . . . . . . . . . . 5,035 17 3,648 11 3,793 11 3,856 11 3,990 10 Around the home . . . . . . . . . . . . . . . . . . . . . . . . . 9,641 33 8,558 27 8,504 25 8,664 24 9,337 24


U.S. Fish and Wildlife Service and U.S. Census Bureau 2011 National Survey of Fishing, Hunting, and Wildlife-Associated Recreation—Pennsylvania 67
Appendix D

68 2011 National Survey of Fishing, Hunting, and Wildlife-Associated Recreation—Pennsylvania U.S. Fish and Wildlife Service and U.S. Census Bureau
Appendix D.Sample Design and Statistical Accuracy
This appendix is presented in two parts. The first part is the U.S. Census Bureau Source and Accuracy Statement. This statement describes the sampling design for the 2011 Survey and highlights the steps taken to produce estimates from the completed ques-tionnaires. The statement explains the use of standard errors and confidence intervals. It also provides comprehen-sive information about errors charac-teristic of surveys and formulas and parameters to calculate an approximate standard error or confidence interval for each number published in this report. The second part, Tables D-1 through D-9, reports estimates and approximate standard errors for selected measures of participation and expenditures for wildlife-related recreation.
Source and Accuracy Statement for the Pennsylvania State Report of the 2011 National Survey of Fishing, Hunting, and Wildlife-Associated Recreation
SOURCE OF DATA
The estimates in this report are based on data collected in the 2011 National Survey of Fishing, Hunting, and Wild-life-Associated Recreation (FHWAR) conducted by the Census Bureau and sponsored by the U.S. Fish and Wildlife Service.
The eligible universe for the FHWAR is the civilian noninstitutionalized and nonbarrack military population living in the United States. The institutional-ized population, which is excluded from the population universe, is composed primarily of the population in correctional institutions and nursing homes (98 percent of the 4 million institutionalized people in Census 2010).
The 2011 FHWAR was designed to provide state-level estimates of the
number of participants in recreational hunting and fishing and in wildlife watching activities (e.g., wildlife obser-vation). Information was collected on the number of participants, where and how often they participated, the type of wildlife encountered, and the amounts of money spent on wildlife-related recreation.
The survey was conducted in two stages: an initial screening of house-holds to identify likely sportspersons and wildlife-watching participants and a series of follow-up interviews of selected persons to collect detailed data about their wildlife-related recreation during 2011.
SAMPLE DESIGN
The 2011 FHWAR sample was selected from the Census Bureau’s master address file (MAF).
The FHWAR is a multistage prob-ability sample, with coverage in all 50 states and the District of Columbia.1 In the first stage of the sampling process, primary sampling units (PSUs) are selected for sample. The PSUs are defined to correspond to the Office of Management and Budget definitions of Core Based Statistical Area defini-tions and to improve efficiency in field operations. The United States is divided into 2,025 PSUs. These PSUs are grouped into 824 strata. Within each stratum, a single PSU is chosen for the sample, with its probability of selection proportional to its population as of the 2000 decennial census. This PSU represents the entire stratum from which it was selected. In the case of strata consisting of only one PSU, the PSU is chosen with certainty.
1 The sample size in the District of Columbia (D.C.) is not of sufficient size to produce reliable estimates for only D.C. The sample responses from D.C. are included in the U.S. totals for complete coverage of the U.S. (excluding Puerto Rico and the U.S. Virgin Islands).
Within the selected PSUs, the FHWAR sample was selected from the MAF.
FHWAR Screening Sample
The total screening sample in Penn-sylvania consisted of 729 households. Interviewing for the screen was conducted during April, May, and June 2011. Due to a high noncontact rate, an additional personal visit screening interview, for a subsample of noncon-tact cases, occurred again in February, March, April, or May 2012. Of all housing units in sample, about 662 were determined to be eligible for inter-view. Interviewers obtained interviews at 456 of these units for a Pennsylvania response rate of 69 percent.2 Pennsyl-vania’s weighted response rate was 76 percent. The interviewers asked screening questions for all household members 6 years old and older. Nonin-terviews occur when the occupants are not found at home after repeated calls or are unavailable for some other reason.
Data for the FHWAR sportspersons sample and wildlife-watchers sample were collected in three waves.3 The first wave started in April 2011, the second in September 2011, and the third in January 2012. In the sportspersons sample, all persons who hunted or fished in 2011 by the time of the screening interview were interviewed in the first wave. The remaining sportspersons in sample were interviewed in the second wave. The reference period was the preceding 4 months for waves 1 and 2. In wave 3, the reference period was either 4, 8, or 12 months depending on when the sample person was first interviewed. 2 Response rates are calculated by using APPOR’s RR2 formula. 3 The sample cases selected due to high noncontact rates were only interviewed once. They received a screener and if they had some form of participation a detailed questionnaire. These participants did not get three waves of interviewing. The reference period for these sampled cases was between 13 and 16 months.

U.S. Fish and Wildlife Service and U.S. Census Bureau 2011 National Survey of Fishing, Hunting, and Wildlife-Associated Recreation—Pennsylvania 69
Detailed Samples
Two independent detailed samples were chosen from the FHWAR screening sample. One consisted of sportsper-sons (people who hunt or fish) and the other of wildlife watchers (people who observe, photograph, or feed wildlife).
A. Sportspersons
The Census Bureau selected the detailed samples based on informa-tion reported during the screening phase. Based on information collected from the household respon-dent, every person 16 years old and older in the FHWAR screening sample was assigned to a sportsper-sons stratum. The criteria for the strata included time devoted to hunting or fishing in previous years, participation in hunting or fishing in 2011 by the time of the screening interview, and intentions to partici-pate in hunting and fishing activities during the remainder of 2011.4 The four sportspersons categories were:
1. Active—a person who had already participated in hunting or fishing in 2011 at the time of the screener interview.
2. Likely—a person who had not participated in 2011 at the time of the screener, but had partici-pated in 2010 OR was likely to participate in 2011.
3. Inactive—a person who had not participated in 2010 or 2011 AND was somewhat unlikely to participate in 2011.
4. Nonparticipant—a person who had not participated in 2010 or 2011 AND was very unlikely to participate in 2011.
Due to the high noncontact rates in wave 1, all persons in the active, likely, and inactive groups were selected with certainty.
Active sportspersons were given the detailed interview twice—at the time of the screening interview (in April, May, or June 2011) and again in January or February 2012.5 Likely sportspersons and inactive sportsper-sons were also interviewed twice—
4 The sample cases selected due to high noncontact rates were not assigned a sportsperson stratum. 5 The sample cases selected due to high noncontact rates were given the detailed sportsperson interview once.
first in September or October 2011, then in January or February 2012. Persons in the nonparticipant group were not eligible for a detailed inter-view. About 251 persons were desig-nated for interviews in Pennsylvania. The detailed sportspersons sample sizes varied by state to get reliable state-level estimates. During each interview period, about 34 percent of the designated persons were not found at home or were unavailable for some other reason. Overall, about 165 detailed sportspersons interviews were completed at a response rate of 66 percent.
B. Wildlife Watchers
The wildlife-watching detailed sample was also selected based on information reported during the screening phase. Based on informa-tion collected from the household respondent, every person 16 years old and older was assigned to a stratum. The criteria for the strata included time devoted to wildlife watching activities in previous years, participation in wildlife watching activities in 2011 by the time of the screening interview, and intentions to participate in wildlife watching activities during the remainder of 2011.6 The five wildlife-watching categories were:
1. Active—a person who had already participated in 2011 at the time of the screening interview.
2. Avid—a person who had not yet participated in 2011, but in 2010 had taken trips to participate in wildlife-watching activities for 21 or more days or had spent $300 or more.
3. Average—a person who had not yet participated in 2011, but in 2010 had taken trips to wildlife watch for less than 21 days and had spent less than $300 OR had not participated in wildlife-watching activities but was very likely to in the remainder of 2011.
4. Infrequent—a person who had not participated in 2010 or 2011, but was somewhat
6 The sample cases selected due to high noncontact rates were not assigned a wildlife watcher stratum. Wildlife-watching participants in these cases were then subsampled into the detailed questionnaire.
likely or somewhat unlikely to participate in the remainder of 2011.
5. Nonparticipant—a person who had not participated in 2010 or 2011 AND was very unlikely to participate during the remainder of 2011.
Persons were selected for the detailed sample based on these groupings, but persons in the nonpar-ticipant group were not eligible for a detailed interview.
A subsample of each of the other groups was selected to receive a detailed interview with the chance of selection diminishing as the likeli-hood of participation diminished. Wildlife-watching participants were given the detailed interview twice.7 Some received their first detailed interview at the same time as the screening interview (in April, May, or June 2011). The rest received their first detailed interview in September or October 2011. All wildlife- watching participants received their second interview in January or February 2012. Some respondents were given the screener and detailed interview in February, March, April, or May 2012. About 240 persons were designated for interviews in Pennsylvania. The detailed wildlife-watching sample sizes varied by state to get reliable state-level estimates. During each interview period, about 38 percent of the designated persons were not found at home or were unavailable for some other reason. Overall, about 148 detailed wildlife watcher interviews were completed at a response rate of 62 percent.
ESTIMATION PROCEDURE
Several stages of adjustments were used to derive the final 2011 FHWAR person weights. A brief description of the major components of the weights is given below. All statistics for the popu-lation 6 to 15 years of age were derived from the screening interview. Statistics for the population 16 years old and older come from both the screening and detailed interviews. Estimates that come from the screening sample are presented in Appendix B.
7 The sample cases selected due to high noncontact rates were given the detailed wildlife-watching interview once.

70 2011 National Survey of Fishing, Hunting, and Wildlife-Associated Recreation—Pennsylvania U.S. Fish and Wildlife Service and U.S. Census Bureau
A. Screening Sample
Every interviewed person in the screening sample received a screening weight that was the product of the following factors:
1. Base Weight. The base weight is the inverse of the house-hold’s probability of selection.
2. Household Noninterview Adjustment. The noninterview adjustment inflates the weight assigned to interviewed house-holds to account for house-holds eligible for interview but for which no interview was obtained.
3. First-Stage Adjustment. The 824 areas designated for our samples were selected from 2,025 such areas of the United States. Some sample areas represent only themselves and are referred to as self-repre-senting. The remaining areas represent other areas similar in selected characteristics and are thus designated non-self-repre-senting. The first-stage factor reduces the component of variation arising from sampling the non-self-representing areas.
4. Second-Stage Adjustment. This adjustment brings the estimates of the total population into agreement with census-based estimates of the civilian nonin-stitutionalized and nonbarrack military populations for each state.
B. Sportspersons Sample
Every interviewed person in the sportspersons detailed sample received a weight that was the product of the following factors:
1. Screening Weight. This is the person’s final weight from the screening sample.
2. Sportspersons Stratum Adjust-ment. This factor inflates the weights of persons selected for the detailed sample to account for the subsampling done within each sportsperson stratum.
3. Sportspersons Noninterview Adjustment. This factor adjusts
the weights of the interviewed sportspersons to account for sportspersons selected for the detailed sample for whom no interview was obtained. A person was considered a nonin-terview if he or she was not interviewed in the third wave of interviewing.
4. Sportspersons Ratio Adjustment Factor. This is a ratio adjust-ment of the detailed sample to the screening sample within the sportspersons sampling strata. This adjustment brings the population estimates of persons aged 16 years old and older from the detailed sample into agreement with the same estimates from the screening sample, which was a much larger sample.
C. Wildlife-Watchers Sample
Every interviewed person in the wildlife-watchers detailed sample received a weight that was the product of the following factors:
1. Screening Weight. This is the person’s final weight from the screening sample.
2. Wildlife-Watchers Stratum Adjustment. This factor inflates the weights of persons selected for the detailed sample to account for the subsampling done within each wildlife watcher stratum.
3. Wildlife-Watchers Noninterview Adjustment. This factor adjusts the weights of the interviewed wildlife-watching participants to account for wildlife watchers selected for the detailed sample for whom no interview was obtained. A person was consid-ered a noninterview if he or she was not interviewed in the third wave of interviewing.
4. Wildlife-Watchers Ratio Adjust-ment Factor. This is a ratio adjustment of the detailed sample to the screening sample within the wildlife-watchers sampling strata. This adjust-ment brings the population estimates of persons aged 16 years old and older from the detailed sample into agreement
with the same estimates from the screening sample, which was a much larger sample.
ACCURACY OF THE ESTIMATES
A sample survey estimate has two types of error: sampling and nonsampling. The accuracy of an estimate depends on both types of error. The nature of the sampling error is known given the survey design; the full extent of the nonsampling error is unknown.
NONSAMPLING ERROR
For a given estimator, the difference between the estimate that would result if the sample were to include the entire population and the true population value being estimated is known as nonsampling error. There are several sources of nonsampling error that may occur during the development or execution of the survey. It can occur because of circumstances created by the interviewer, the respondent, the survey instrument, or the way the data are collected and processed. For example, errors could occur because:
• The interviewer records the wrong answer, the respondent provides incorrect information, the respon-dent estimates the requested information, or an unclear survey question is misunderstood by the respondent (measurement error).
• Some individuals who should have been included in the survey frame were missed (coverage error).
• Responses are not collected from all those in the sample or the respondent is unwilling to provide information (nonresponse error).
• Values are estimated imprecisely for missing data (imputation error).
• Forms may be lost; data may be incorrectly keyed, coded, or recoded, etc. (processing error).
The Census Bureau employs quality control procedures throughout the production process, including the overall design of surveys, the wording of questions, and the review of the work of interviewers and coders to minimize these errors. Two types of

U.S. Fish and Wildlife Service and U.S. Census Bureau 2011 National Survey of Fishing, Hunting, and Wildlife-Associated Recreation—Pennsylvania 71
nonsampling error that can be exam-ined to a limited extent are nonresponse and undercoverage.
Nonresponse. The effect of nonre-sponse cannot be measured directly, but one indication of its potential effect is the nonresponse rate. For the FHWAR screener interview in Pennsyl-vania, the household-level nonresponse rate was 31 percent. The person-level nonresponse rate for the detailed sportsperson interview in Pennsylvania was an additional 34 percent and for the wildlife watchers it was 38 percent. Since the screener nonresponse rate is a household-level rate and the detailed interview nonresponse rate is a person-level rate, we cannot combine these rates to derive an overall nonresponse rate. Since it is unlikely the nonre-sponding households to the FHWAR have the same number of persons as the households successfully interviewed, combining these rates would result in an overestimate of the “true” person-level overall nonresponse rate for the detailed interviews.
Coverage. Overall screener under-coverage is estimated to be about 13 percent. Ratio estimation to indepen-dent population controls, as described previously, partially corrects for the bias due to survey undercoverage. However, biases exist in the estimates to the extent that missed persons in missed households or missed persons in interviewed households have different characteristics from those of inter-viewed persons in the same age group.
Comparability of Data. Data obtained from the 2011 FHWAR and other sources are not entirely comparable. This results from differences in inter-viewer training and experience and in differing survey processes. This is an example of nonsampling variability not reflected in the standard errors. Therefore, caution should be used when comparing results from different sources. (See Appendix C.)
A Nonsampling Error Warning. Since the full extent of the nonsampling error is unknown, one should be particularly careful when interpreting results based on small differences between estimates. The Census Bureau recommends that data users incorporate information about nonsampling errors into their analyses, as nonsampling error could
impact the conclusions drawn from the results. Caution should also be used when interpreting results based on a relatively small number of cases. Summary measures (such as medians and percentage distributions) probably do not reveal useful information when computed on a subpopulation smaller than 90,000 for screener data, 100,000 for the detailed sportsperson data, and 235,000 for the wildlife-watchers data.
SAMPLING ERROR
Since the FHWAR estimates come from a sample, they may differ from figures from an enumeration of the entire population using the same ques-tionnaires, instructions, and enumera-tors. For a given estimator, the differ-ence between an estimate based on a sample and the estimate that would result if the sample were to include the entire population is known as sampling error. Standard errors, as calculated by methods described in “Standard Errors and Their Use,” are primarily measures of the magnitude of sampling error. However, they may include some nons-ampling error.
Standard Errors and Their Use. The sample estimate and its standard error enable one to construct a confidence interval. A confidence interval is a range that has a known probability of including the average result of all possible samples. For example, if all possible samples were surveyed under essentially the same general conditions and using the same sample design, and if an estimate and its standard error were calculated from each sample, then approximately 95 percent of the inter-vals from 1.96 standard errors below the estimate to 1.96 standard errors above the estimate would include the average result of all possible samples. A particular confidence interval may or may not contain the average estimate derived from all possible samples. However, one can say with specified confidence that the interval includes the average estimate calculated from all possible samples. Standard errors may also be used to perform hypothesis testing, a procedure for distinguishing between population parameters using sample estimates. The most common type of hypothesis is that the population parameters are different. An example would be comparing the proportion of anglers to the proportion of hunters. Tests may be performed at various
levels of significance. A significance level is the probability of concluding that the characteristics are different when, in fact, they are the same. For example, to conclude that two charac-teristics are different at the 0.05 level of significance, the absolute value of the estimated difference between charac-teristics must be greater than or equal to 1.96 times the standard error of the difference. This report uses 95-percent confidence intervals and 0.05 level of significance to determine statistical validity. Consult standard statistical textbooks for alternative criteria.
Estimating Standard Errors. The Census Bureau uses replication methods to estimate the standard errors of FHWAR estimates. These methods primarily measure the magnitude of sampling error. However, they do measure some effects of nonsampling error as well. They do not measure systematic biases in the data associ-ated with nonsampling error. Bias is the average over all possible samples of the differences between the sample estimates and the true value.
Generalized Variance Parameters. While it is possible to compute and present an estimate of the standard error based on the survey data for each estimate in a report, there are a number of reasons why this is not done. A presentation of the individual standard errors would be of limited use, since one could not possibly predict all of the combinations of results that may be of interest to data users. Addition-ally, data users have access to FHWAR microdata files, and it is impossible to compute in advance the standard error for every estimate one might obtain from those data sets. Moreover, vari-ance estimates are based on sample data and have variances of their own. Therefore, some methods of stabi-lizing these estimates of variance, for example, by generalizing or averaging over time, may be used to improve their reliability. Experience has shown that certain groups of estimates have similar relationships between their variances and expected values. Modeling or generalizing may provide more stable variance estimates by taking advan-tage of these similarities. The gener-alized variance function is a simple model that expresses the variance as a function of the expected value of the survey estimate. The parameters of the

72 2011 National Survey of Fishing, Hunting, and Wildlife-Associated Recreation—Pennsylvania U.S. Fish and Wildlife Service and U.S. Census Bureau
generalized variance function are estimated using direct replicate variances. These generalized variance parameters provide a relatively easy method to obtain approximate standard errors for numerous characteristics. Table D-2 provide the generalized variance parameters for FHWAR data. Methods for using the parameters to calculate standard errors of various estimates are given in the next sections.
Standard Errors of Estimated Numbers. The approximate standard error, sx, of an estimated number shown in this report can be obtained using the following formulas. Formula (1) is used to calculate the standard errors of levels of sportspersons, anglers, and wildlife watchers.
(1)
Here, x is the size of the estimate and a and b are the parameters in the tables associated with the particular characteristic.
Formula (2) is used for standard errors of aggregates, i.e., trips, days, and expenditures.
(2)
Here, x is again the size of the estimate; y is the base of the estimate; and a, b, and c are the parameters in the tables associ-ated with the particular characteristic.
Illustration of the Computation of the Standard Error of an Estimated Number
Suppose there were an estimated 37,397,000 persons age 16 years old and older who either fished or hunted in the United States in 2011. Using formula (1) with the parameters a = –0.000070 and b = 16,823 from table D-2, the approximate stan-dard error of the estimated number of 37,397,000 sportspersons age 16 years old and older is
The 95-percent confidence interval for the estimated number of sportspersons 16 years old and older is from 35,968,000 to 38,826,000, i.e., 37,397,000 ± 1.96 x 728,857. Therefore, a conclusion that the average estimate derived from all possible samples lies within a range computed in this way would be correct for roughly 95 percent of all possible samples.
Suppose there were an estimated 13,674,000 hunters age 16 years old and older who engaged in 281,884,000 days of partici-pation in 2011. Using formula (2) with the parameters a = –0.000284, b = –127,863, and c = 46,699 from table D-2, the approximate standard error on 281,884,000 estimated days on an estimated base of 13,674,000 hunters is
The 95-percent confidence interval on the estimate of 281,884,000 days is from 253,295,000 to 310,473,000, i.e., 281,884,000 ± 1.96 x 14,586,000. Again, a conclusion that the average estimate derived from all possible samples lies within a range computed in this way would be correct for roughly 95 percent of all possible samples.
Standard Errors of Estimated Percentages. The reliability of an estimated percentage, computed using sample data for both numerator and denominator, depends on the size of the percentage and its base. Estimated percentages are relatively more reliable than the corresponding estimates of the numerators of the percentages, particularly if the percentages are 50 percent or more. When the numerator and the denominator of the percentage are in different categories, use the parameter in the tables indicated by the numerator.
The approximate standard error, sx,p, can be obtained by use of the formula
(3)
Here, x is the total number of sportspersons, hunters, etc., which is the base of the percentage; p is the percentage; and b is the parameter in the tables associated with the characteristic in the numerator of the percentage.
150 2006 National Survey of Fishing, Hunting, and Wildlife-Associated Recreation U.S. Fish & Wildlife Service
Standard Errors of Estimated Numbers. The approximate standard error, sx
, of an estimated number shown in this report can be obtained using the following formulas. Formula (1) is used to calculate the standard errors of levels of sportspersons, anglers, and wildlife-watchers.
Here, x is the size of the estimate and a and b are the parameters in the tables associated with the particular characteristic.
Formula (2) is used for standard errors of aggregates, i.e., trips, days, and expenditures.
Here, x is again the size of the estimate; y is the base of the estimate; and a, b, and c are the parameters in the tables associ-ated with the particular characteristic.
Illustration of the Computation of the Standard Error of an Estimated Number
Table 1 in this report shows that 33,916,000 persons 16 years old and older either fi shed or hunted in the United States in 2006. Using formula (1) with the parameters a = -0.000027 and b = 6,125 from table D-7, the approximate standard error of the estimate number of 33,916,000 sportspersons 16 years old and older is
The 95-percent confi dence interval for the estimate number of sportspersons 16 years old and older is from 33,092,000 to 34,740,000, ie., 33,916,000 ± 1.96 x 420,330. Therefore, a conclusion that the average estimate derived from all possible samples lies within a range computed in this way would be correct for roughly 95 percent of all possible samples.
Table 1 shows that 12,510,000 hunters 16 years old and older engaged in 219,925,000 days of participation in 2006. Using formula (2) with the parameters a = -0.000235, b = -85,241, and c = 22,698 from table D-9, the approximate standard error on 219,925,000 estimated days on an estimated base of 12,510,000 hunters is
The 95-percent confi dence interval on the estimate of 219,925,000 days is from 205,044,000 to 234,806,000, ie., 219,925,000 ± 1.96 x 7,592,000. Again, a conclusion that the average estimate derived from all possible samples lies within a range computed in this way would be correct for roughly 95 percent of all possible samples.
Standard Errors of Estimated Percentages. The reliability of an estimated percentage, computed using sample data for both numerator and denominator, depends on the size of the percentage and its base. Estimated percentages are relatively more reliable than the corresponding estimates of the numerators of the percentages, particularly if the percentages are 50 percent or more. When the numerator and the denominator of the percentage are in different categories, use the parameter in the tables indicated by the numerator.
The approximate standard error, sx,p,
can be obtained by use of the formula
Here, x is the total number of sportspersons, hunters, etc., which is the base of the percentage; p is the percentage (0 ≤ p ≤ 100); and b is the parameter in the tables associated with the characteristic in the numerator of the percentage.
Illustration of the Computation of the Standard Error of an Estimated Percentage
Table 1 shows that of the 12,510,000 hunters 16 years old and older, 18.3 percent hunted migratory birds. From table D-7, the appropriate b parameter is 5,756. Using formula (3), the approximate standard error on the estimate of 18.3 percent is
(1)s ax bxx2
(2)s ax bx cxyx
22
sx 0000027 33 916 000 6125 33 916 000 420 3302. , , , , , ,
sx 0000235 219 925 000 85 241 219 925 00022 698 219 925 000
12 510 0007 592 0002
2
. , , , , ,, , ,
, ,, ,
(3)
,p
s bp pxx p,
( )100
15.8 to 17.6, i.e., 16.7 ± 1.96 x 0.45.
15.8 to 17.6, i.e., 16.7 ± 1.96 x 0.45.
150 2006 National Survey of Fishing, Hunting, and Wildlife-Associated Recreation U.S. Fish & Wildlife Service
Standard Errors of Estimated Numbers. The approximate standard error, sx
, of an estimated number shown in this report can be obtained using the following formulas. Formula (1) is used to calculate the standard errors of levels of sportspersons, anglers, and wildlife-watchers.
Here, x is the size of the estimate and a and b are the parameters in the tables associated with the particular characteristic.
Formula (2) is used for standard errors of aggregates, i.e., trips, days, and expenditures.
Here, x is again the size of the estimate; y is the base of the estimate; and a, b, and c are the parameters in the tables associ-ated with the particular characteristic.
Illustration of the Computation of the Standard Error of an Estimated Number
Table 1 in this report shows that 33,916,000 persons 16 years old and older either fi shed or hunted in the United States in 2006. Using formula (1) with the parameters a = -0.000027 and b = 6,125 from table D-7, the approximate standard error of the estimate number of 33,916,000 sportspersons 16 years old and older is
The 95-percent confi dence interval for the estimate number of sportspersons 16 years old and older is from 33,092,000 to 34,740,000, ie., 33,916,000 ± 1.96 x 420,330. Therefore, a conclusion that the average estimate derived from all possible samples lies within a range computed in this way would be correct for roughly 95 percent of all possible samples.
Table 1 shows that 12,510,000 hunters 16 years old and older engaged in 219,925,000 days of participation in 2006. Using formula (2) with the parameters a = -0.000235, b = -85,241, and c = 22,698 from table D-9, the approximate standard error on 219,925,000 estimated days on an estimated base of 12,510,000 hunters is
The 95-percent confi dence interval on the estimate of 219,925,000 days is from 205,044,000 to 234,806,000, ie., 219,925,000 ± 1.96 x 7,592,000. Again, a conclusion that the average estimate derived from all possible samples lies within a range computed in this way would be correct for roughly 95 percent of all possible samples.
Standard Errors of Estimated Percentages. The reliability of an estimated percentage, computed using sample data for both numerator and denominator, depends on the size of the percentage and its base. Estimated percentages are relatively more reliable than the corresponding estimates of the numerators of the percentages, particularly if the percentages are 50 percent or more. When the numerator and the denominator of the percentage are in different categories, use the parameter in the tables indicated by the numerator.
The approximate standard error, sx,p,
can be obtained by use of the formula
Here, x is the total number of sportspersons, hunters, etc., which is the base of the percentage; p is the percentage (0 ≤ p ≤ 100); and b is the parameter in the tables associated with the characteristic in the numerator of the percentage.
Illustration of the Computation of the Standard Error of an Estimated Percentage
Table 1 shows that of the 12,510,000 hunters 16 years old and older, 18.3 percent hunted migratory birds. From table D-7, the appropriate b parameter is 5,756. Using formula (3), the approximate standard error on the estimate of 18.3 percent is
(1)s ax bxx2
(2)s ax bx cxyx
22
sx 0000027 33 916 000 6125 33 916 000 420 3302. , , , , , ,
sx 0000235 219 925 000 85 241 219 925 00022 698 219 925 000
12 510 0007 592 0002
2
. , , , , ,, , ,
, ,, ,
(3)
,p
s bp pxx p,
( )100

U.S. Fish and Wildlife Service and U.S. Census Bureau 2011 National Survey of Fishing, Hunting, and Wildlife-Associated Recreation—Alabama 73
Illustration of the Computation of the Standard Error of an Estimated Percentage
Suppose there were an estimated 13,674,000 hunters age 16 years old and older of whom 18.9 percent hunted migratory birds. From table D-2, the appropriate b parameter is 15,798. Using formula (3), the approximate standard error on the estmate of 18.9 percent is
i-
Consequently, the 95-percent confidence interval for the estimate percentage of migratory bird hunters 16 years old and older is from 16.3 percent to 21.5 percent, i.e., 18.9 ± 1.96 x 1.33.
Standard Error of a Difference. The standard error of the difference between two sample estimates is approximately equal to
(4)s s sx y x y− = +2 2
where sx and sy are the standard errors of the estimates x and y. The estimates can be numbers, percentages, ratios, etc. This will represent the actual standard error quite accurately for the difference between estimates of the same characteristic in two different areas, or for the difference between separate and uncorrelated characteristics in the same area. However, if there is a high positive (negative) correlation between the two characteristics, the formula will overestimate (underestimate) the true standard error.
Illustration of the Computation of the Standard Error of a Difference
Suppose there were an estimated 13,608,000 females in the age range of 18-24 of whom 726,000 or 5.3 percent were sportspersons. Similarly, suppose there were an estimated 12,909,000 males in the same age range of whom 2,160,000 or 16.7 percent were sportspersons. The apparent difference between the percentage of female and male sportspersons is 11.4 percent. Using formula (3) and the appropriate b parameter from table D-2, the approximate standard errors of 5.3 percent and 16.7 percent are 0.79 and 1.35, respectively. Using formula (4), the approximate standard error of the estimated differ-ence of 11.4 percent is
The 95-percent confidence interval on the difference between 18- to 24-year-old female and male sportspersons is from 8.3 to 14.5, i.e., 11.4 ± 1.96 x 1.56. Since the interval does not contain zero, we can conclude with 95 percent confidence that the percentage of 18- to 24-year-old female sportspersons is less than the percentage of 18- to 24-year-old male sportspersons.
Standard Errors of Estimated Averages. Certain mean values for sportspersons, anglers, etc., shown in the report were calcu-lated as the ratio of two numbers. For example, average days per angler is calculated as:
xy
total daystotal anglers
=
Standard errors for these averages may be approximated by the use of formula (5) below.
(5)s x
ysx
sy
rs sxyx y
x y x y=
+
−
2 2
2
In formula (5), r represents the correlation coefficient between the numerator and the denominator of the estimate. In the above formula, use 0.7 as an estimate of r.
Illustration of the Computation of the Standard Error of an Estimated Average
Suppose that the estimated number of the average days per angler age 16 years old and older for all fishing was 16.7 days. Using formulas (1) and (2) above, we compute the standard error on total days, 553,841,000, and total anglers, 33,112,000, to be 20,329,124 and 693,033, respectively. The approximate standard error on the estimated average of 16.7 days is
Therefore, the 95-percent confidence interval on the estimated average of 16.7 days is from 15.8 to 17.6, i.e., 16.7 ± 1.96 x 0.45.
15.8 to 17.6, i.e., 16.7 ± 1.96 x 0.45.
U.S. Fish & Wildlife Service 2006 National Survey of Fishing, Hunting, and Wildlife-Associated Recreation 151
Consequently, the 95-percent confidence interval for the estimate percentage of migratory bird hunters 16 years old and older is from 16.7 percent to 19.9 percent, ie. 18.3 ± 1.96 x 0.83.
Standard Error of a Difference. The standard error of the difference between two sample estimates is approximately equal to
where sx
and sy
are the standard errors of the estimates x and y. The estimates can be numbers, percentages, ratios, etc. This will represent the actual standard error quite accurately for the difference between estimates of the same characteristic in two different areas, or for the difference between separate and uncorrelated characteristics in the same area. However, if there is a high positive (negative) correlation between the two characteristics, the formula will overestimate (underestimate) the true standard error.
Illustration of the Computation of the Standard Error of a Difference
In Table 8, of the 11,655,000 females in the age range of 18-24, 726,000 or 6.2 percent are sportspersons. Similarly, of the 11,638,000 males in the same age range, 1,929,000 or 16.6 percent are sportspersons. The apparent difference between the percent of female and male participants is 10.4 percent. Using formula (3) and the appropriate b parameter from table D-7, the approximate standard errors of 6.2 percent and 16.6 percent are 0.55 and 0.85, respectively. Using formula (4), the approximate standard error of the estimated difference of 10.4 percent is
The 95-percent confidence interval on the difference between 18-24 year old female and male sportspersons is from 8.4 to 12.4, i.e., 10.4 ± 1.96 x 1.02. Since the interval does not contain zero, we can conclude with 95 percent confidence that the percentage of 18-24 year old female sportspersons is less than the percentage of 18-24 year old male sportspersons.
Standard Errors of Estimated Averages. Certain mean values for sportspersons, anglers, etc., shown in the report were calcu-lated as the ratio of two numbers. For example, average days per angler is calculated as:
Standard errors for these averages may be approximated by the use of formula (5) below.
In formula (5), r represents the correlation coefficient between the numerator and the denominator of the estimate. In the above formula, use 0.7 as an estimate of r.
Illustration of the Computation of the Standard Error of an Estimated Average
Table 2 shows that the average days per angler 16 years old and older for all fishing was 17.3 days. Using formulas (1) and (2) above, we compute the standard error on total days, 516,781,000, and total anglers, 29,952,000, to be 15,828,079 and 399,342, respectively. The approximate standard error on the estimated average of 17.3 days is
Therefore, the 95-percent confidence interval on the estimated average of 17.3 days is from 16.5 to 18.0, i.e., 17.3 ± 1.96 x 0.40.
( )sx p,
, . ., ,
.=× × −
=5 756 183 100 183
12 510 000083
(4)
sx y− = + =055 085 1022 2. . .
xy
total daystotal anglers
=
(5)s xy
sx
sy
rs sxyx y
x y x y=
+
−
2 2
2
sx y =
+
− ×
××
=516 78100029 952 000
158 280 079516 781000
399 34229 952 000
2 0715828 079 399 342
516 781000 29 952 000040
2 2, ,, ,
, ,, ,
,, ,
., , ,, , , ,
.
15.8 to 17.6, i.e., 16.7 ± 1.96 x 0.45.
U.S. Fish & Wildlife Service 2006 National Survey of Fishing, Hunting, and Wildlife-Associated Recreation 151
Consequently, the 95-percent confidence interval for the estimate percentage of migratory bird hunters 16 years old and older is from 16.7 percent to 19.9 percent, ie. 18.3 ± 1.96 x 0.83.
Standard Error of a Difference. The standard error of the difference between two sample estimates is approximately equal to
where sx
and sy
are the standard errors of the estimates x and y. The estimates can be numbers, percentages, ratios, etc. This will represent the actual standard error quite accurately for the difference between estimates of the same characteristic in two different areas, or for the difference between separate and uncorrelated characteristics in the same area. However, if there is a high positive (negative) correlation between the two characteristics, the formula will overestimate (underestimate) the true standard error.
Illustration of the Computation of the Standard Error of a Difference
In Table 8, of the 11,655,000 females in the age range of 18-24, 726,000 or 6.2 percent are sportspersons. Similarly, of the 11,638,000 males in the same age range, 1,929,000 or 16.6 percent are sportspersons. The apparent difference between the percent of female and male participants is 10.4 percent. Using formula (3) and the appropriate b parameter from table D-7, the approximate standard errors of 6.2 percent and 16.6 percent are 0.55 and 0.85, respectively. Using formula (4), the approximate standard error of the estimated difference of 10.4 percent is
The 95-percent confidence interval on the difference between 18-24 year old female and male sportspersons is from 8.4 to 12.4, i.e., 10.4 ± 1.96 x 1.02. Since the interval does not contain zero, we can conclude with 95 percent confidence that the percentage of 18-24 year old female sportspersons is less than the percentage of 18-24 year old male sportspersons.
Standard Errors of Estimated Averages. Certain mean values for sportspersons, anglers, etc., shown in the report were calcu-lated as the ratio of two numbers. For example, average days per angler is calculated as:
Standard errors for these averages may be approximated by the use of formula (5) below.
In formula (5), r represents the correlation coefficient between the numerator and the denominator of the estimate. In the above formula, use 0.7 as an estimate of r.
Illustration of the Computation of the Standard Error of an Estimated Average
Table 2 shows that the average days per angler 16 years old and older for all fishing was 17.3 days. Using formulas (1) and (2) above, we compute the standard error on total days, 516,781,000, and total anglers, 29,952,000, to be 15,828,079 and 399,342, respectively. The approximate standard error on the estimated average of 17.3 days is
Therefore, the 95-percent confidence interval on the estimated average of 17.3 days is from 16.5 to 18.0, i.e., 17.3 ± 1.96 x 0.40.
( )sx p,
, . ., ,
.=× × −
=5 756 183 100 183
12 510 000083
(4)s s sx y x y− = +2 2
sx y− = + =055 085 1022 2. . .
(5)s xy
sx
sy
rs sxyx y
x y x y=
+
−
2 2
2
sx y =
+
− ×
××
=516 78100029 952 000
158 280 079516 781000
399 34229 952 000
2 0715828 079 399 342
516 781000 29 952 000040
2 2, ,, ,
, ,, ,
,, ,
., , ,, , , ,
.
U.S. Fish & Wildlife Service 2006 National Survey of Fishing, Hunting, and Wildlife-Associated Recreation 151
Consequently, the 95-percent confidence interval for the estimate percentage of migratory bird hunters 16 years old and older is from 16.7 percent to 19.9 percent, ie. 18.3 ± 1.96 x 0.83.
Standard Error of a Difference. The standard error of the difference between two sample estimates is approximately equal to
where sx
and sy
are the standard errors of the estimates x and y. The estimates can be numbers, percentages, ratios, etc. This will represent the actual standard error quite accurately for the difference between estimates of the same characteristic in two different areas, or for the difference between separate and uncorrelated characteristics in the same area. However, if there is a high positive (negative) correlation between the two characteristics, the formula will overestimate (underestimate) the true standard error.
Illustration of the Computation of the Standard Error of a Difference
In Table 8, of the 11,655,000 females in the age range of 18-24, 726,000 or 6.2 percent are sportspersons. Similarly, of the 11,638,000 males in the same age range, 1,929,000 or 16.6 percent are sportspersons. The apparent difference between the percent of female and male participants is 10.4 percent. Using formula (3) and the appropriate b parameter from table D-7, the approximate standard errors of 6.2 percent and 16.6 percent are 0.55 and 0.85, respectively. Using formula (4), the approximate standard error of the estimated difference of 10.4 percent is
The 95-percent confidence interval on the difference between 18-24 year old female and male sportspersons is from 8.4 to 12.4, i.e., 10.4 ± 1.96 x 1.02. Since the interval does not contain zero, we can conclude with 95 percent confidence that the percentage of 18-24 year old female sportspersons is less than the percentage of 18-24 year old male sportspersons.
Standard Errors of Estimated Averages. Certain mean values for sportspersons, anglers, etc., shown in the report were calcu-lated as the ratio of two numbers. For example, average days per angler is calculated as:
Standard errors for these averages may be approximated by the use of formula (5) below.
above formula, use 0.7 as an estimate of r.
Illustration of the Computation of the Standard Error of an Estimated Average
Table 2 shows that the average days per angler 16 years old and older for all fishing was 17.3 days. Using formulas (1) and (2) above, we compute the standard error on total days, 516,781,000, and total anglers, 29,952,000, to be 15,828,079 and 399,342, respectively. The approximate standard error on the estimated average of 17.3 days is
Therefore, the 95-percent confidence interval on the estimated average of 17.3 days is from 16.5 to 18.0, i.e., 17.3 ± 1.96 x 0.40.
( )sx p,
, . ., ,
.=× × −
=5 756 183 100 183
12 510 000083
(4)s s sx y x y− = +2 2
sx y− = + =055 085 1022 2. . .
xy
total daystotal anglers
=
(5)
sx y =
+
− ×
××
=516 78100029 952 000
158 280 079516 781000
399 34229 952 000
2 0715828 079 399 342
516 781000 29 952 000040
2 2, ,, ,
, ,, ,
,, ,
., , ,, , , ,
.
15.8 to 17.6, i.e., 16.7 ± 1.96 x 0.45.

74 2011 National Survey of Fishing, Hunting, and Wildlife-Associated Recreation—Pennsylvania U.S. Fish and Wildlife Service and U.S. Census Bureau
Table D–1. Approximate Standard Errors of Resident Anglers, Days of Fishing by State Residents, and Expenditures for Fishing by State Residents(Numbers in thousands)
StateParticipation Spenders Days Expenditures in dollars
Estimate Standard error Estimate Standard error Estimate Standard error Estimate Standard error
Alabama . . . . . . . . . . . . . . 516 57 504 57 10,176 1,516 353,352 89,051Alaska . . . . . . . . . . . . . . . . 211 16 210 16 3,121 702 283,792 81,203Arizona . . . . . . . . . . . . . . . 586 71 576 71 5,283 1,014 800,892 234,202Arkansas . . . . . . . . . . . . . . 467 73 429 70 15,141 4,103 427,997 192,997California . . . . . . . . . . . . . 1,700 127 1,668 126 25,662 4,251 2,407,827 534,480
Colorado . . . . . . . . . . . . . . 666 56 660 56 8,726 1,330 587,110 134,300Connecticut . . . . . . . . . . . . 340 36 335 36 5,713 979 501,922 143,300Delaware . . . . . . . . . . . . . . 92 9 84 9 1,681 774 53,904 21,099Florida . . . . . . . . . . . . . . . . 1,991 137 1,866 134 49,500 9,419 3,767,291 740,646Georgia . . . . . . . . . . . . . . . 844 86 796 84 9,061 1,162 708,539 271,868
Hawaii . . . . . . . . . . . . . . . . 107 10 99 10 1,739 297 183,067 60,275Idaho . . . . . . . . . . . . . . . . . 289 51 258 49 2,424 688 214,435 98,860Illinois . . . . . . . . . . . . . . . . 1,236 135 1,189 133 15,614 1,664 1,438,080 272,550Indiana . . . . . . . . . . . . . . . . 786 82 757 81 21,542 6,448 649,164 199,166Iowa . . . . . . . . . . . . . . . . . . 522 45 506 44 6,909 1,283 400,613 139,248
Kansas . . . . . . . . . . . . . . . . 434 47 382 45 4,694 1,260 271,039 97,386Kentucky . . . . . . . . . . . . . . 492 68 459 66 10,245 2,494 748,710 204,830Louisiana . . . . . . . . . . . . . . 733 86 642 82 18,351 6,126 614,348 223,976Maine . . . . . . . . . . . . . . . . 197 23 191 23 2,915 646 175,364 54,699Maryland . . . . . . . . . . . . . . 410 43 388 41 5,676 1,121 675,969 200,533
Massachusetts . . . . . . . . . . 457 31 436 31 9,166 1,823 464,082 103,476Michigan . . . . . . . . . . . . . . 1,465 155 1,379 151 26,744 4,434 2,270,407 690,623Minnesota . . . . . . . . . . . . . 1,328 131 1,301 130 24,903 3,462 2,152,446 566,142Mississippi . . . . . . . . . . . . 603 81 557 79 8,700 1,493 492,876 196,856Missouri . . . . . . . . . . . . . . 870 66 814 64 14,448 1,854 504,652 101,573
Montana . . . . . . . . . . . . . . 192 27 189 27 3,263 909 385,305 169,026Nebraska . . . . . . . . . . . . . . 197 20 193 20 2,924 684 177,859 59,964Nevada . . . . . . . . . . . . . . . 156 18 154 17 2,044 336 180,624 44,049New Hampshire . . . . . . . . 164 21 159 20 4,155 1,448 251,615 94,985New Jersey . . . . . . . . . . . . 679 54 633 53 9,578 1,856 1,208,259 233,487
New Mexico . . . . . . . . . . . 232 28 224 28 3,868 646 383,861 89,540New York . . . . . . . . . . . . . 1,809 164 1,699 159 29,112 6,898 1,998,582 806,095North Carolina . . . . . . . . . 1,307 100 1,196 96 23,491 3,757 1,475,942 312,448North Dakota . . . . . . . . . . . (NA) (NA) (NA) (NA) (NA) (NA) (NA) (NA)Ohio. . . . . . . . . . . . . . . . . . 1,435 132 1,287 126 19,116 2,906 2,084,348 790,163
Oklahoma . . . . . . . . . . . . . 744 89 678 86 8,661 1,585 789,216 272,608Oregon . . . . . . . . . . . . . . . . 386 48 386 48 4,673 897 424,004 78,075Pennsylvania . . . . . . . . . . . 1,008 129 849 119 9,926 2,581 401,294 104,696Rhode Island . . . . . . . . . . . 93 7 87 7 1,764 416 96,538 28,169South Carolina . . . . . . . . . 574 67 545 66 11,459 2,626 878,388 385,347
South Dakota . . . . . . . . . . . 164 27 164 27 3,649 933 185,669 70,106Tennessee . . . . . . . . . . . . . 833 83 799 82 17,834 5,611 1,393,250 371,233Texas . . . . . . . . . . . . . . . . . 2,355 251 2,079 238 34,735 12,578 1,711,265 451,117Utah . . . . . . . . . . . . . . . . . . 351 34 342 34 5,612 991 381,829 105,114Vermont . . . . . . . . . . . . . . . 105 12 103 12 1,885 466 64,264 34,423
Virginia . . . . . . . . . . . . . . . 707 61 663 59 10,342 3,032 888,554 202,725Washington . . . . . . . . . . . . 914 73 893 72 17,818 5,660 1,190,626 328,230West Virginia . . . . . . . . . . . 239 27 237 27 4,767 1,239 443,057 193,337Wisconsin . . . . . . . . . . . . . 938 99 938 99 15,320 2,946 1,058,160 292,733Wyoming . . . . . . . . . . . . . . 115 13 113 13 2,170 400 115,501 29,110
(NA) Not available.
Note: Detail does not add to total because of multiple responses. U.S. totals include responses from participants residing in the District of Columbia.

U.S. Fish and Wildlife Service and U.S. Census Bureau 2011 National Survey of Fishing, Hunting, and Wildlife-Associated Recreation—Pennsylvania 75
Table D–2. Approximate Standard Errors of Resident Hunters, Days of Hunting by State Residents, and Expenditures for Hunting by State Residents(Numbers in thousands)
StateParticipation Spenders Days Expenditures in dollars
Estimate Standard error Estimate Standard error Estimate Standard error Estimate Standard error
Alabama . . . . . . . . . . . . . . 492 53 455 51 10,393 1,625 839,960 224,100Alaska . . . . . . . . . . . . . . . . 106 11 106 11 1,071 220 365,926 121,954Arizona . . . . . . . . . . . . . . . 259 43 259 43 3,157 1,199 383,974 138,536Arkansas . . . . . . . . . . . . . . 320 73 316 73 10,689 2,707 947,623 448,460California . . . . . . . . . . . . . 467 51 451 50 8,036 1,562 1,067,043 287,163
Colorado . . . . . . . . . . . . . . 160 24 160 24 1,806 552 288,719 97,414Connecticut . . . . . . . . . . . . 82 13 82 13 1,348 602 366,741 166,007Delaware . . . . . . . . . . . . . . 23 3 21 3 451 262 60,848 30,161Florida . . . . . . . . . . . . . . . . 329 42 320 41 6,636 1,892 939,600 277,470Georgia . . . . . . . . . . . . . . . 309 45 303 44 7,992 2,731 752,267 345,361
Hawaii . . . . . . . . . . . . . . . . 23 4 23 4 786 328 55,666 23,851Idaho . . . . . . . . . . . . . . . . . 162 27 162 27 2,009 1,012 182,948 88,148Illinois . . . . . . . . . . . . . . . . 512 100 507 99 7,786 1,648 1,265,876 374,926Indiana . . . . . . . . . . . . . . . . 377 63 368 62 10,902 3,530 209,736 75,017Iowa . . . . . . . . . . . . . . . . . . 216 31 211 31 4,158 1,495 424,907 160,555
Kansas . . . . . . . . . . . . . . . . 177 30 176 30 4,144 1,671 296,342 116,392Kentucky . . . . . . . . . . . . . . 316 52 312 51 11,959 3,404 768,353 262,787Louisiana . . . . . . . . . . . . . . 291 36 270 35 6,672 2,441 657,110 250,820Maine . . . . . . . . . . . . . . . . 141 21 134 20 2,410 422 163,222 63,693Maryland . . . . . . . . . . . . . . 88 19 88 19 1,418 448 278,697 121,312
Massachusetts . . . . . . . . . . 66 11 66 11 1,402 406 128,540 47,031Michigan . . . . . . . . . . . . . . 507 84 507 84 11,217 2,251 2,398,864 730,996Minnesota . . . . . . . . . . . . . 475 53 468 52 7,944 1,943 1,072,204 336,451Mississippi . . . . . . . . . . . . 436 70 436 70 8,755 2,087 815,823 331,464Missouri . . . . . . . . . . . . . . 495 54 475 53 9,437 1,219 772,614 225,991
Montana . . . . . . . . . . . . . . 108 20 107 20 2,158 444 496,374 185,967Nebraska . . . . . . . . . . . . . . 115 16 115 16 1,576 376 543,421 206,253Nevada . . . . . . . . . . . . . . . 49 10 49 10 893 229 141,828 60,308New Hampshire . . . . . . . . 44 6 43 6 1,330 691 47,328 21,720New Jersey . . . . . . . . . . . . 115 15 110 15 2,921 1,033 222,544 67,231
New Mexico . . . . . . . . . . . 68 8 67 8 911 479 125,291 53,414New York . . . . . . . . . . . . . 739 89 733 89 17,741 4,707 1,490,461 706,094North Carolina . . . . . . . . . 317 53 295 51 8,133 1,840 635,322 209,378North Dakota . . . . . . . . . . . (NA) (NA) (NA) (NA) (NA) (NA) (NA) (NA)Ohio. . . . . . . . . . . . . . . . . . 528 78 519 77 8,966 1,833 715,707 358,642
Oklahoma . . . . . . . . . . . . . 219 40 169 35 5,201 2,147 340,188 182,827Oregon . . . . . . . . . . . . . . . . 181 32 178 32 2,264 512 219,069 51,869Pennsylvania . . . . . . . . . . . 703 91 687 90 17,826 5,097 942,880 262,999Rhode Island . . . . . . . . . . . 17 2 17 2 311 112 26,131 10,110South Carolina . . . . . . . . . 238 36 238 36 4,239 1,073 418,461 189,013
South Dakota . . . . . . . . . . . 133 28 133 28 2,880 1,009 245,326 94,842Tennessee . . . . . . . . . . . . . 286 32 278 31 9,595 4,531 386,714 142,545Texas . . . . . . . . . . . . . . . . . 1,080 148 1,036 145 19,848 7,946 1,696,128 601,706Utah . . . . . . . . . . . . . . . . . . 161 25 161 25 2,618 609 363,040 110,650Vermont . . . . . . . . . . . . . . . 71 10 69 10 1,614 474 301,144 181,982
Virginia . . . . . . . . . . . . . . . 354 63 352 63 10,306 3,522 887,041 241,384Washington . . . . . . . . . . . . 218 25 218 25 2,756 903 482,244 160,283West Virginia . . . . . . . . . . . 211 23 211 23 3,254 686 446,272 167,171Wisconsin . . . . . . . . . . . . . 763 94 759 94 10,219 2,142 2,258,882 665,515Wyoming . . . . . . . . . . . . . . 76 12 76 12 1,170 199 149,128 39,991
(NA) Not available.
Note: Detail does not add to total because of multiple responses. U.S. totals include responses from participants residing in the District of Columbia.
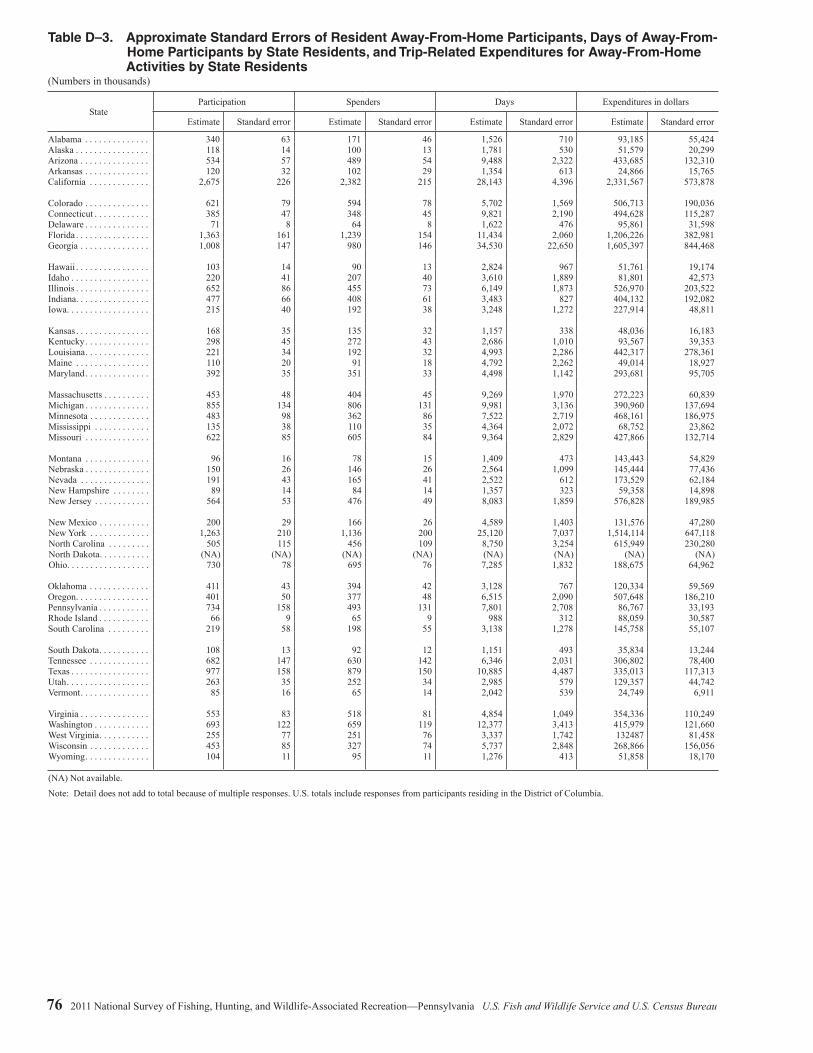
76 2011 National Survey of Fishing, Hunting, and Wildlife-Associated Recreation—Pennsylvania U.S. Fish and Wildlife Service and U.S. Census Bureau
Table D–3. Approximate Standard Errors of Resident Away-From-Home Participants, Days of Away-From- Home Participants by State Residents, and Trip-Related Expenditures for Away-From-Home Activities by State Residents (Numbers in thousands)
StateParticipation Spenders Days Expenditures in dollars
Estimate Standard error Estimate Standard error Estimate Standard error Estimate Standard error
Alabama . . . . . . . . . . . . . . 340 63 171 46 1,526 710 93,185 55,424Alaska . . . . . . . . . . . . . . . . 118 14 100 13 1,781 530 51,579 20,299Arizona . . . . . . . . . . . . . . . 534 57 489 54 9,488 2,322 433,685 132,310Arkansas . . . . . . . . . . . . . . 120 32 102 29 1,354 613 24,866 15,765California . . . . . . . . . . . . . 2,675 226 2,382 215 28,143 4,396 2,331,567 573,878
Colorado . . . . . . . . . . . . . . 621 79 594 78 5,702 1,569 506,713 190,036Connecticut . . . . . . . . . . . . 385 47 348 45 9,821 2,190 494,628 115,287Delaware . . . . . . . . . . . . . . 71 8 64 8 1,622 476 95,861 31,598Florida . . . . . . . . . . . . . . . . 1,363 161 1,239 154 11,434 2,060 1,206,226 382,981Georgia . . . . . . . . . . . . . . . 1,008 147 980 146 34,530 22,650 1,605,397 844,468
Hawaii . . . . . . . . . . . . . . . . 103 14 90 13 2,824 967 51,761 19,174Idaho . . . . . . . . . . . . . . . . . 220 41 207 40 3,610 1,889 81,801 42,573Illinois . . . . . . . . . . . . . . . . 652 86 455 73 6,149 1,873 526,970 203,522Indiana . . . . . . . . . . . . . . . . 477 66 408 61 3,483 827 404,132 192,082Iowa . . . . . . . . . . . . . . . . . . 215 40 192 38 3,248 1,272 227,914 48,811
Kansas . . . . . . . . . . . . . . . . 168 35 135 32 1,157 338 48,036 16,183Kentucky . . . . . . . . . . . . . . 298 45 272 43 2,686 1,010 93,567 39,353Louisiana . . . . . . . . . . . . . . 221 34 192 32 4,993 2,286 442,317 278,361Maine . . . . . . . . . . . . . . . . 110 20 91 18 4,792 2,262 49,014 18,927Maryland . . . . . . . . . . . . . . 392 35 351 33 4,498 1,142 293,681 95,705
Massachusetts . . . . . . . . . . 453 48 404 45 9,269 1,970 272,223 60,839Michigan . . . . . . . . . . . . . . 855 134 806 131 9,981 3,136 390,960 137,694Minnesota . . . . . . . . . . . . . 483 98 362 86 7,522 2,719 468,161 186,975Mississippi . . . . . . . . . . . . 135 38 110 35 4,364 2,072 68,752 23,862Missouri . . . . . . . . . . . . . . 622 85 605 84 9,364 2,829 427,866 132,714
Montana . . . . . . . . . . . . . . 96 16 78 15 1,409 473 143,443 54,829Nebraska . . . . . . . . . . . . . . 150 26 146 26 2,564 1,099 145,444 77,436Nevada . . . . . . . . . . . . . . . 191 43 165 41 2,522 612 173,529 62,184New Hampshire . . . . . . . . 89 14 84 14 1,357 323 59,358 14,898New Jersey . . . . . . . . . . . . 564 53 476 49 8,083 1,859 576,828 189,985
New Mexico . . . . . . . . . . . 200 29 166 26 4,589 1,403 131,576 47,280New York . . . . . . . . . . . . . 1,263 210 1,136 200 25,120 7,037 1,514,114 647,118North Carolina . . . . . . . . . 505 115 456 109 8,750 3,254 615,949 230,280North Dakota . . . . . . . . . . . (NA) (NA) (NA) (NA) (NA) (NA) (NA) (NA)Ohio. . . . . . . . . . . . . . . . . . 730 78 695 76 7,285 1,832 188,675 64,962
Oklahoma . . . . . . . . . . . . . 411 43 394 42 3,128 767 120,334 59,569Oregon . . . . . . . . . . . . . . . . 401 50 377 48 6,515 2,090 507,648 186,210Pennsylvania . . . . . . . . . . . 734 158 493 131 7,801 2,708 86,767 33,193Rhode Island . . . . . . . . . . . 66 9 65 9 988 312 88,059 30,587South Carolina . . . . . . . . . 219 58 198 55 3,138 1,278 145,758 55,107
South Dakota . . . . . . . . . . . 108 13 92 12 1,151 493 35,834 13,244Tennessee . . . . . . . . . . . . . 682 147 630 142 6,346 2,031 306,802 78,400Texas . . . . . . . . . . . . . . . . . 977 158 879 150 10,885 4,487 335,013 117,313Utah . . . . . . . . . . . . . . . . . . 263 35 252 34 2,985 579 129,357 44,742Vermont . . . . . . . . . . . . . . . 85 16 65 14 2,042 539 24,749 6,911
Virginia . . . . . . . . . . . . . . . 553 83 518 81 4,854 1,049 354,336 110,249Washington . . . . . . . . . . . . 693 122 659 119 12,377 3,413 415,979 121,660West Virginia . . . . . . . . . . . 255 77 251 76 3,337 1,742 132487 81,458Wisconsin . . . . . . . . . . . . . 453 85 327 74 5,737 2,848 268,866 156,056Wyoming . . . . . . . . . . . . . . 104 11 95 11 1,276 413 51,858 18,170
(NA) Not available.
Note: Detail does not add to total because of multiple responses. U.S. totals include responses from participants residing in the District of Columbia.

U.S. Fish and Wildlife Service and U.S. Census Bureau 2011 National Survey of Fishing, Hunting, and Wildlife-Associated Recreation—Pennsylvania 77
Table D–4. Parameters a and b for Calculating Approximate Standard Errors of Sportspersons, Anglers, Hunters, and Wildlife-Watching Participants(These parameters are to be used only to calculate estimates of standard errors for characteristics developed from the screening sample)
State6 years old and older 6 to 15 years old only
a b a bUnited States, total . . . . . . . . . . . . . . . . . . . . . . . . –0.000043 12,272 –0.000387 15,783
Alabama . . . . . . . . . . . . . . . . . . . . . . . . . . . . . . . –0.001517 6,503 –0.009621 5,974 Alaska . . . . . . . . . . . . . . . . . . . . . . . . . . . . . . . . . –0.001275 795 –0.010120 986 Arizona . . . . . . . . . . . . . . . . . . . . . . . . . . . . . . . . –0.000765 4,622 –0.003646 3,484 Arkansas . . . . . . . . . . . . . . . . . . . . . . . . . . . . . . . –0.001766 4,647 –0.014655 5,761 California . . . . . . . . . . . . . . . . . . . . . . . . . . . . . . –0.000236 7,936 –0.002632 13,492
Colorado . . . . . . . . . . . . . . . . . . . . . . . . . . . . . . . –0.000805 3,719 –0.006685 4,508 Connecticut . . . . . . . . . . . . . . . . . . . . . . . . . . . . . –0.000429 1,384 –0.004817 2,149 Delaware . . . . . . . . . . . . . . . . . . . . . . . . . . . . . . . –0.000758 614 –0.009410 1,051 Florida . . . . . . . . . . . . . . . . . . . . . . . . . . . . . . . . . –0.000354 6,040 –0.004700 10,400 Georgia . . . . . . . . . . . . . . . . . . . . . . . . . . . . . . . . –0.000756 6,717 –0.003496 4,981
Hawaii . . . . . . . . . . . . . . . . . . . . . . . . . . . . . . . . . –0.000603 694 –0.007618 1,184 Idaho . . . . . . . . . . . . . . . . . . . . . . . . . . . . . . . . . . –0.001708 2,389 –0.017208 3,904 Illinois . . . . . . . . . . . . . . . . . . . . . . . . . . . . . . . . . –0.000633 7,425 –0.005382 9,348 Indiana . . . . . . . . . . . . . . . . . . . . . . . . . . . . . . . . . –0.000849 4,951 –0.012557 10,925 Iowa . . . . . . . . . . . . . . . . . . . . . . . . . . . . . . . . . . . –0.000988 2,714 –0.008723 3,356
Kansas . . . . . . . . . . . . . . . . . . . . . . . . . . . . . . . . . –0.001014 2,584 –0.009102 3,499 Kentucky . . . . . . . . . . . . . . . . . . . . . . . . . . . . . . . –0.001476 5,802 –0.009316 5,165 Louisiana . . . . . . . . . . . . . . . . . . . . . . . . . . . . . . . –0.000840 3,418 –0.014093 8,744 Maine . . . . . . . . . . . . . . . . . . . . . . . . . . . . . . . . . –0.001824 2,210 –0.016808 2,441 Maryland . . . . . . . . . . . . . . . . . . . . . . . . . . . . . . . –0.000570 2,976 –0.008290 6,120
Massachusetts . . . . . . . . . . . . . . . . . . . . . . . . . . . –0.000394 2,406 –0.003000 2,365 Michigan . . . . . . . . . . . . . . . . . . . . . . . . . . . . . . . –0.001153 10,458 –0.009872 12,626 Minnesota . . . . . . . . . . . . . . . . . . . . . . . . . . . . . . –0.001905 9,166 –0.015878 10,749 Mississippi . . . . . . . . . . . . . . . . . . . . . . . . . . . . . –0.001191 3,137 –0.012208 5,053 Missouri . . . . . . . . . . . . . . . . . . . . . . . . . . . . . . . –0.000858 4,672 –0.004859 3,768
Montana . . . . . . . . . . . . . . . . . . . . . . . . . . . . . . . –0.001690 1,418 –0.015626 1,816 Nebraska . . . . . . . . . . . . . . . . . . . . . . . . . . . . . . . –0.001546 2,519 –0.015670 3,805 Nevada . . . . . . . . . . . . . . . . . . . . . . . . . . . . . . . . –0.000431 1,029 –0.007455 2,739 New Hampshire . . . . . . . . . . . . . . . . . . . . . . . . . –0.000920 1,125 –0.015100 2,356 New Jersey . . . . . . . . . . . . . . . . . . . . . . . . . . . . . –0.000359 2,868 –0.003386 3,831
New Mexico . . . . . . . . . . . . . . . . . . . . . . . . . . . . –0.000706 1,294 –0.006025 1,703 New York . . . . . . . . . . . . . . . . . . . . . . . . . . . . . . –0.000416 7,444 –0.005818 13,956 North Carolina . . . . . . . . . . . . . . . . . . . . . . . . . . –0.000905 7,706 –0.008882 11,091 North Dakota . . . . . . . . . . . . . . . . . . . . . . . . . . . . (NA) (NA) (NA) (NA) Ohio. . . . . . . . . . . . . . . . . . . . . . . . . . . . . . . . . . . –0.000807 8,454 –0.006870 10,159
Oklahoma . . . . . . . . . . . . . . . . . . . . . . . . . . . . . . –0.001132 3,772 –0.008501 4,297 Oregon . . . . . . . . . . . . . . . . . . . . . . . . . . . . . . . . . –0.001359 4,806 –0.010991 5,226 Pennsylvania . . . . . . . . . . . . . . . . . . . . . . . . . . . . –0.000593 6,843 –0.005995 9,017 Rhode Island . . . . . . . . . . . . . . . . . . . . . . . . . . . . –0.000308 300 –0.003287 405 South Carolina . . . . . . . . . . . . . . . . . . . . . . . . . . –0.000739 3,060 –0.005611 3,303
South Dakota . . . . . . . . . . . . . . . . . . . . . . . . . . . . –0.001620 1,194 –0.034414 3,643 Tennessee . . . . . . . . . . . . . . . . . . . . . . . . . . . . . . –0.000730 4,204 –0.003532 2,887 Texas . . . . . . . . . . . . . . . . . . . . . . . . . . . . . . . . . . –0.000807 18,178 –0.004712 18,120 Utah . . . . . . . . . . . . . . . . . . . . . . . . . . . . . . . . . . . –0.001050 2,638 –0.008515 4,056 Vermont . . . . . . . . . . . . . . . . . . . . . . . . . . . . . . . . –0.001401 811 –0.014942 1,003
Virginia . . . . . . . . . . . . . . . . . . . . . . . . . . . . . . . . –0.000533 3,805 –0.004771 4,816 Washington . . . . . . . . . . . . . . . . . . . . . . . . . . . . . –0.000640 3,938 –0.006644 5,691 West Virginia . . . . . . . . . . . . . . . . . . . . . . . . . . . . –0.001618 2,714 –0.015297 3,266 Wisconsin . . . . . . . . . . . . . . . . . . . . . . . . . . . . . . –0.002449 12,656 –0.016762 11,855 Wyoming . . . . . . . . . . . . . . . . . . . . . . . . . . . . . . . –0.002057 1,013 –0.029622 2,038
(NA) Not available.
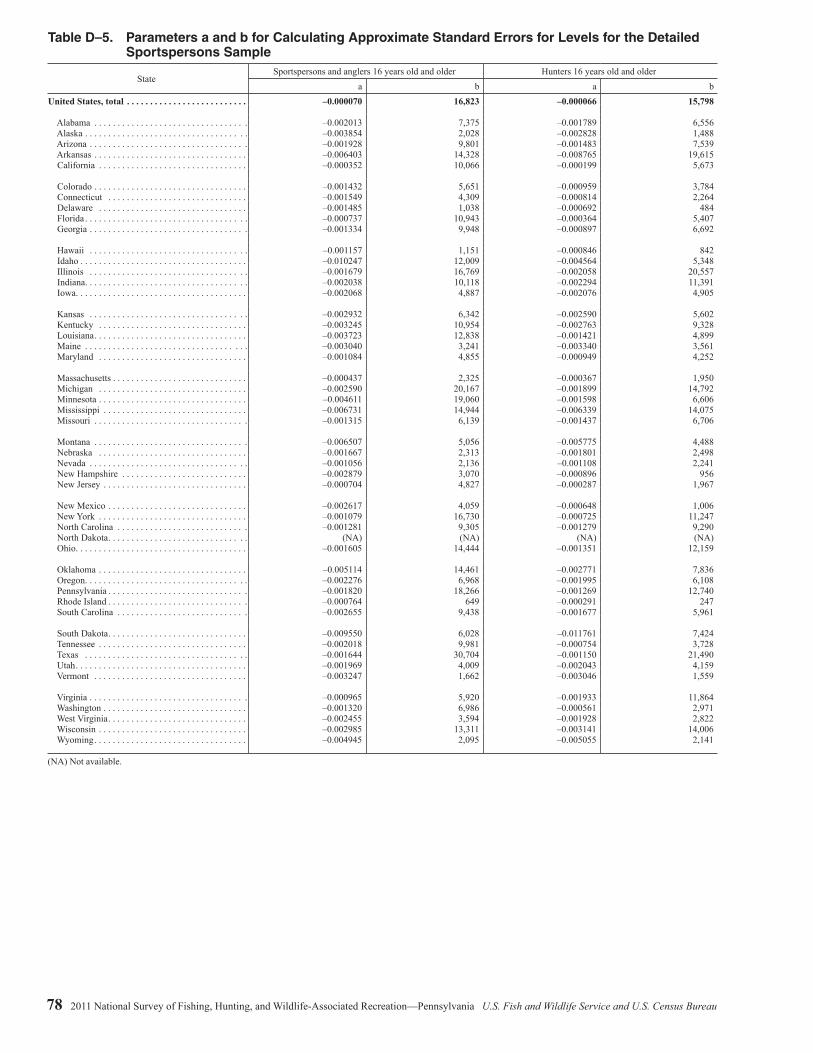
78 2011 National Survey of Fishing, Hunting, and Wildlife-Associated Recreation—Pennsylvania U.S. Fish and Wildlife Service and U.S. Census Bureau
Table D–5. Parameters a and b for Calculating Approximate Standard Errors for Levels for the Detailed Sportspersons Sample
StateSportspersons and anglers 16 years old and older Hunters 16 years old and older
a b a bUnited States, total . . . . . . . . . . . . . . . . . . . . . . . . . . –0.000070 16,823 –0.000066 15,798
Alabama . . . . . . . . . . . . . . . . . . . . . . . . . . . . . . . . . –0.002013 7,375 –0.001789 6,556 Alaska . . . . . . . . . . . . . . . . . . . . . . . . . . . . . . . . . . . –0.003854 2,028 –0.002828 1,488 Arizona . . . . . . . . . . . . . . . . . . . . . . . . . . . . . . . . . . –0.001928 9,801 –0.001483 7,539 Arkansas . . . . . . . . . . . . . . . . . . . . . . . . . . . . . . . . . –0.006403 14,328 –0.008765 19,615 California . . . . . . . . . . . . . . . . . . . . . . . . . . . . . . . . –0.000352 10,066 –0.000199 5,673
Colorado . . . . . . . . . . . . . . . . . . . . . . . . . . . . . . . . . –0.001432 5,651 –0.000959 3,784 Connecticut . . . . . . . . . . . . . . . . . . . . . . . . . . . . . . –0.001549 4,309 –0.000814 2,264 Delaware . . . . . . . . . . . . . . . . . . . . . . . . . . . . . . . . –0.001485 1,038 –0.000692 484 Florida . . . . . . . . . . . . . . . . . . . . . . . . . . . . . . . . . . . –0.000737 10,943 –0.000364 5,407 Georgia . . . . . . . . . . . . . . . . . . . . . . . . . . . . . . . . . . –0.001334 9,948 –0.000897 6,692
Hawaii . . . . . . . . . . . . . . . . . . . . . . . . . . . . . . . . . . –0.001157 1,151 –0.000846 842 Idaho . . . . . . . . . . . . . . . . . . . . . . . . . . . . . . . . . . . . –0.010247 12,009 –0.004564 5,348 Illinois . . . . . . . . . . . . . . . . . . . . . . . . . . . . . . . . . . –0.001679 16,769 –0.002058 20,557 Indiana . . . . . . . . . . . . . . . . . . . . . . . . . . . . . . . . . . . –0.002038 10,118 –0.002294 11,391 Iowa . . . . . . . . . . . . . . . . . . . . . . . . . . . . . . . . . . . . . –0.002068 4,887 –0.002076 4,905
Kansas . . . . . . . . . . . . . . . . . . . . . . . . . . . . . . . . . . –0.002932 6,342 –0.002590 5,602 Kentucky . . . . . . . . . . . . . . . . . . . . . . . . . . . . . . . . –0.003245 10,954 –0.002763 9,328 Louisiana . . . . . . . . . . . . . . . . . . . . . . . . . . . . . . . . . –0.003723 12,838 –0.001421 4,899 Maine . . . . . . . . . . . . . . . . . . . . . . . . . . . . . . . . . . . –0.003040 3,241 –0.003340 3,561 Maryland . . . . . . . . . . . . . . . . . . . . . . . . . . . . . . . . –0.001084 4,855 –0.000949 4,252
Massachusetts . . . . . . . . . . . . . . . . . . . . . . . . . . . . . –0.000437 2,325 –0.000367 1,950 Michigan . . . . . . . . . . . . . . . . . . . . . . . . . . . . . . . . –0.002590 20,167 –0.001899 14,792 Minnesota . . . . . . . . . . . . . . . . . . . . . . . . . . . . . . . . –0.004611 19,060 –0.001598 6,606 Mississippi . . . . . . . . . . . . . . . . . . . . . . . . . . . . . . . –0.006731 14,944 –0.006339 14,075 Missouri . . . . . . . . . . . . . . . . . . . . . . . . . . . . . . . . . –0.001315 6,139 –0.001437 6,706
Montana . . . . . . . . . . . . . . . . . . . . . . . . . . . . . . . . . –0.006507 5,056 –0.005775 4,488 Nebraska . . . . . . . . . . . . . . . . . . . . . . . . . . . . . . . . –0.001667 2,313 –0.001801 2,498 Nevada . . . . . . . . . . . . . . . . . . . . . . . . . . . . . . . . . . –0.001056 2,136 –0.001108 2,241 New Hampshire . . . . . . . . . . . . . . . . . . . . . . . . . . . –0.002879 3,070 –0.000896 956 New Jersey . . . . . . . . . . . . . . . . . . . . . . . . . . . . . . . –0.000704 4,827 –0.000287 1,967
New Mexico . . . . . . . . . . . . . . . . . . . . . . . . . . . . . . –0.002617 4,059 –0.000648 1,006 New York . . . . . . . . . . . . . . . . . . . . . . . . . . . . . . . . –0.001079 16,730 –0.000725 11,247 North Carolina . . . . . . . . . . . . . . . . . . . . . . . . . . . . –0.001281 9,305 –0.001279 9,290 North Dakota . . . . . . . . . . . . . . . . . . . . . . . . . . . . . . (NA) (NA) (NA) (NA) Ohio. . . . . . . . . . . . . . . . . . . . . . . . . . . . . . . . . . . . . –0.001605 14,444 –0.001351 12,159
Oklahoma . . . . . . . . . . . . . . . . . . . . . . . . . . . . . . . . –0.005114 14,461 –0.002771 7,836 Oregon . . . . . . . . . . . . . . . . . . . . . . . . . . . . . . . . . . . –0.002276 6,968 –0.001995 6,108 Pennsylvania . . . . . . . . . . . . . . . . . . . . . . . . . . . . . . –0.001820 18,266 –0.001269 12,740 Rhode Island . . . . . . . . . . . . . . . . . . . . . . . . . . . . . . –0.000764 649 –0.000291 247 South Carolina . . . . . . . . . . . . . . . . . . . . . . . . . . . . –0.002655 9,438 –0.001677 5,961
South Dakota . . . . . . . . . . . . . . . . . . . . . . . . . . . . . . –0.009550 6,028 –0.011761 7,424 Tennessee . . . . . . . . . . . . . . . . . . . . . . . . . . . . . . . . –0.002018 9,981 –0.000754 3,728 Texas . . . . . . . . . . . . . . . . . . . . . . . . . . . . . . . . . . . –0.001644 30,704 –0.001150 21,490 Utah . . . . . . . . . . . . . . . . . . . . . . . . . . . . . . . . . . . . . –0.001969 4,009 –0.002043 4,159 Vermont . . . . . . . . . . . . . . . . . . . . . . . . . . . . . . . . . –0.003247 1,662 –0.003046 1,559
Virginia . . . . . . . . . . . . . . . . . . . . . . . . . . . . . . . . . . –0.000965 5,920 –0.001933 11,864 Washington . . . . . . . . . . . . . . . . . . . . . . . . . . . . . . . –0.001320 6,986 –0.000561 2,971 West Virginia . . . . . . . . . . . . . . . . . . . . . . . . . . . . . . –0.002455 3,594 –0.001928 2,822 Wisconsin . . . . . . . . . . . . . . . . . . . . . . . . . . . . . . . . –0.002985 13,311 –0.003141 14,006 Wyoming . . . . . . . . . . . . . . . . . . . . . . . . . . . . . . . . . –0.004945 2,095 –0.005055 2,141
(NA) Not available.

U.S. Fish and Wildlife Service and U.S. Census Bureau 2011 National Survey of Fishing, Hunting, and Wildlife-Associated Recreation—Pennsylvania 79
Table D–6. Parameters a, b, and c for Calculating Approximate Standard Errors for Expenditures for the Detailed Sportspersons Sample
StateSportspersons and anglers 16 years old and older Hunters 16 years old and older
a b c a b cUnited States, total . . . . . . . . . . . . . . . . . . . . . . . . . . . . . . 0.001159 –575,615 45,670 0.001923 –978,460 44,416
Alabama . . . . . . . . . . . . . . . . . . . . . . . . . . . . . . . . . . . . . 0.021918 –163,227 21,197 0.026237 –310,700 20,618 Alaska . . . . . . . . . . . . . . . . . . . . . . . . . . . . . . . . . . . . . . . 0.068721 –3,823 2,765 0.086885 –80,157 2,587 Arizona . . . . . . . . . . . . . . . . . . . . . . . . . . . . . . . . . . . . . . 0.072204 –64,996 7,713 0.112668 32,711 4,512 Arkansas . . . . . . . . . . . . . . . . . . . . . . . . . . . . . . . . . . . . . 0.190512 –51,366 5,554 0.208269 3,305 4,958 California . . . . . . . . . . . . . . . . . . . . . . . . . . . . . . . . . . . . 0.041958 323,332 11,979 0.056429 1,177,647 6,717
Colorado . . . . . . . . . . . . . . . . . . . . . . . . . . . . . . . . . . . . . 0.038767 15,704 8,931 0.080446 –49,174 5,370 Connecticut . . . . . . . . . . . . . . . . . . . . . . . . . . . . . . . . . . . 0.062963 –54,211 6,250 0.156423 –403,680 4,065 Delaware . . . . . . . . . . . . . . . . . . . . . . . . . . . . . . . . . . . . 0.138101 –7,091 1,280 0.206480 –291 823 Florida . . . . . . . . . . . . . . . . . . . . . . . . . . . . . . . . . . . . . . . 0.031125 129,668 13,980 0.044416 –273,423 13,786 Georgia . . . . . . . . . . . . . . . . . . . . . . . . . . . . . . . . . . . . . . 0.133758 –35,054 10,761 0.180457 –30,025 9,196
Hawaii . . . . . . . . . . . . . . . . . . . . . . . . . . . . . . . . . . . . . . . 0.099271 –1,810 905 0.154210 –1,865 677 Idaho . . . . . . . . . . . . . . . . . . . . . . . . . . . . . . . . . . . . . . . . 0.197816 –5,230 3,806 0.216778 170,971 2,339 Illinois . . . . . . . . . . . . . . . . . . . . . . . . . . . . . . . . . . . . . . . 0.016086 –95,430 23,661 0.059422 –369,151 14,496 Indiana . . . . . . . . . . . . . . . . . . . . . . . . . . . . . . . . . . . . . . . 0.084408 56,304 7,293 0.113115 42,035 5,378 Iowa . . . . . . . . . . . . . . . . . . . . . . . . . . . . . . . . . . . . . . . . . 0.110741 –6,756 5,107 0.110417 –42,038 6,849
Kansas . . . . . . . . . . . . . . . . . . . . . . . . . . . . . . . . . . . . . . . 0.119262 –8,287 3,770 0.130458 –38,144 4,212 Kentucky . . . . . . . . . . . . . . . . . . . . . . . . . . . . . . . . . . . . . 0.032291 –262,907 19,693 0.050336 –549,944 21,014 Louisiana . . . . . . . . . . . . . . . . . . . . . . . . . . . . . . . . . . . . . 0.125543 72,794 4,657 0.123353 –129,712 6,086 Maine . . . . . . . . . . . . . . . . . . . . . . . . . . . . . . . . . . . . . . . 0.073133 –64,912 4,685 0.133009 –24,957 2,602 Maryland . . . . . . . . . . . . . . . . . . . . . . . . . . . . . . . . . . . . . 0.069557 –8,036 7,163 0.119862 –92,688 6,155
Massachusetts . . . . . . . . . . . . . . . . . . . . . . . . . . . . . . . . . 0.041124 13,503 3,733 0.092555 –231 2,727 Michigan . . . . . . . . . . . . . . . . . . . . . . . . . . . . . . . . . . . . . 0.071988 –130,103 28,404 0.026267 –153,883 33,794 Minnesota . . . . . . . . . . . . . . . . . . . . . . . . . . . . . . . . . . . . 0.056048 –43,079 17,112 0.064508 –189,054 15,975 Mississippi . . . . . . . . . . . . . . . . . . . . . . . . . . . . . . . . . . . 0.143495 –50,131 8,984 0.146486 14,053 8,097 Missouri . . . . . . . . . . . . . . . . . . . . . . . . . . . . . . . . . . . . . 0.027623 –7,268 10,503 0.066759 –24,068 8,944
Montana . . . . . . . . . . . . . . . . . . . . . . . . . . . . . . . . . . . . . 0.178611 –16,817 2,622 0.105263 –209,610 3,801 Nebraska . . . . . . . . . . . . . . . . . . . . . . . . . . . . . . . . . . . . . 0.100459 –1,618 2,551 0.119872 –19,296 2,785 Nevada . . . . . . . . . . . . . . . . . . . . . . . . . . . . . . . . . . . . . . 0.040428 –34,230 2,962 0.141457 –114,260 1,968 New Hampshire . . . . . . . . . . . . . . . . . . . . . . . . . . . . . . . 0.127497 6,106 2,383 0.176749 14,447 1,443 New Jersey . . . . . . . . . . . . . . . . . . . . . . . . . . . . . . . . . . . 0.027546 11,544 6,195 0.036515 –45,032 6,045
New Mexico . . . . . . . . . . . . . . . . . . . . . . . . . . . . . . . . . . 0.036052 –17,835 4,123 0.147509 –35,750 2,313 New York . . . . . . . . . . . . . . . . . . . . . . . . . . . . . . . . . . . . 0.152342 –343,859 17,854 0.209665 –176,671 10,911 North Carolina . . . . . . . . . . . . . . . . . . . . . . . . . . . . . . . . 0.029116 –209,241 18,945 0.064157 –163,564 13,190 North Dakota . . . . . . . . . . . . . . . . . . . . . . . . . . . . . . . . . . (NA) (NA) (NA) (NA) (NA) (NA) Ohio. . . . . . . . . . . . . . . . . . . . . . . . . . . . . . . . . . . . . . . . . 0.128010 –37,131 20,232 0.216544 –1,019,186 18,675
Oklahoma . . . . . . . . . . . . . . . . . . . . . . . . . . . . . . . . . . . . 0.098427 –170,608 14,307 0.276027 126,332 2,101 Oregon . . . . . . . . . . . . . . . . . . . . . . . . . . . . . . . . . . . . . . . 0.010568 7,416 9,002 0.011236 96,792 7,900 Pennsylvania . . . . . . . . . . . . . . . . . . . . . . . . . . . . . . . . . . 0.039841 –43,889 24,057 0.037830 –316,859 27,692 Rhode Island . . . . . . . . . . . . . . . . . . . . . . . . . . . . . . . . . . 0.077596 –203.9579 657 0.110230 –39,344 696 South Carolina . . . . . . . . . . . . . . . . . . . . . . . . . . . . . . . . 0.180012 –120,717 6,857 0.181351 –87,421 5,445
South Dakota . . . . . . . . . . . . . . . . . . . . . . . . . . . . . . . . . 0.114248 –43,160 4,683 0.102506 –203,831 6,355 Tennessee . . . . . . . . . . . . . . . . . . . . . . . . . . . . . . . . . . . . 0.051884 –61,213 15,306 0.073335 –522,076 17,760 Texas . . . . . . . . . . . . . . . . . . . . . . . . . . . . . . . . . . . . . . . . 0.049244 –64,415 42,177 0.077228 –819,919 50,873 Utah . . . . . . . . . . . . . . . . . . . . . . . . . . . . . . . . . . . . . . . . 0.063366 –20,537 4,266 0.066238 –2,994 4,293 Vermont . . . . . . . . . . . . . . . . . . . . . . . . . . . . . . . . . . . . . 0.271264 –10,725 1,629 0.339375 –128,675 1,810
Virginia . . . . . . . . . . . . . . . . . . . . . . . . . . . . . . . . . . . . . . 0.034590 –93,405 11,648 0.037134 –222,277 13,083 Washington . . . . . . . . . . . . . . . . . . . . . . . . . . . . . . . . . . . 0.067952 22,119 7,169 0.080042 –119,224 6,687 West Virginia . . . . . . . . . . . . . . . . . . . . . . . . . . . . . . . . . 0.173583 –44,746 4,014 0.117366 –52,107 4,868 Wisconsin . . . . . . . . . . . . . . . . . . . . . . . . . . . . . . . . . . . . 0.045614 –215,022 29,192 0.057107 164,685 22,483 Wyoming . . . . . . . . . . . . . . . . . . . . . . . . . . . . . . . . . . . . 0.037366 –31,308 2,986 0.032006 –10,196 3,038
(NA) Not available.

80 2011 National Survey of Fishing, Hunting, and Wildlife-Associated Recreation—Pennsylvania U.S. Fish and Wildlife Service and U.S. Census Bureau
Table D–7. Parameters a, b, and c for Calculating Approximate Standard Errors for Days or Trips for the Detailed Sportspersons Sample
State Sportspersons and anglers 16 years old and older Hunters 16 years old and older
a b c a b cUnited States, total . . . . . . . . . . . . . . . . . . . . . . . . 0.000068 –160,414 51,951 –0.000284 –127,863 46,699
Alabama . . . . . . . . . . . . . . . . . . . . . . . . . . . . . . . –0.006409 –33,141 16,434 –0.001309 –24,163 13,815 Alaska . . . . . . . . . . . . . . . . . . . . . . . . . . . . . . . . . 0.040044 –1,378 2,306 0.014819 –3,686 3,262 Arizona . . . . . . . . . . . . . . . . . . . . . . . . . . . . . . . . 0.010858 –12,760 16,639 0.094988 –10,415 13,604 Arkansas . . . . . . . . . . . . . . . . . . . . . . . . . . . . . . . 0.029081 –47,335 22,178 –0.069327 –298,461 51,645 California . . . . . . . . . . . . . . . . . . . . . . . . . . . . . . 0.018455 62,656 11,126 0.002617 35,822 14,331
Colorado . . . . . . . . . . . . . . . . . . . . . . . . . . . . . . . 0.012264 –4,831 7,675 0.057492 –4,094 6,123 Connecticut . . . . . . . . . . . . . . . . . . . . . . . . . . . . . 0.010321 –20,427 7,687 0.178663 1,319 1,609 Delaware . . . . . . . . . . . . . . . . . . . . . . . . . . . . . . 0.202009 –718 940 0.322859 –120 316 Florida . . . . . . . . . . . . . . . . . . . . . . . . . . . . . . . . . 0.030335 –13,138 12,228 0.050279 –17,145 11,045 Georgia . . . . . . . . . . . . . . . . . . . . . . . . . . . . . . . . –0.016400 –22,749 29,830 0.034924 –19,534 26,050
Hawaii . . . . . . . . . . . . . . . . . . . . . . . . . . . . . . . . . 0.011790 –1,565 1,950 0.134936 –560 912 Idaho . . . . . . . . . . . . . . . . . . . . . . . . . . . . . . . . . . 0.044270 113 10,482 0.221214 –2,323 5,468 Illinois . . . . . . . . . . . . . . . . . . . . . . . . . . . . . . . . . –0.005565 –7,990 21,553 –0.015684 –60,913 34,960 Indiana. . . . . . . . . . . . . . . . . . . . . . . . . . . . . . . . . 0.079426 –2,044 8,077 0.088709 7,770 5,819 Iowa . . . . . . . . . . . . . . . . . . . . . . . . . . . . . . . . . . 0.012302 –22,937 13,314 0.074986 –46,595 14,146
Kansas . . . . . . . . . . . . . . . . . . . . . . . . . . . . . . . . . 0.061820 –2,259 4,674 0.158439 10,639 277 Kentucky . . . . . . . . . . . . . . . . . . . . . . . . . . . . . . 0.023655 –6,641 17,832 0.015712 –15,751 21,050 Louisiana . . . . . . . . . . . . . . . . . . . . . . . . . . . . . . 0.105459 53,216 2,251 0.124945 55,464 167 Maine . . . . . . . . . . . . . . . . . . . . . . . . . . . . . . . . . 0.026901 –3,659 4,612 –0.011197 –41,449 8,337 Maryland . . . . . . . . . . . . . . . . . . . . . . . . . . . . . . 0.023534 –8,872 6,975 0.039987 –4,806 5,572
Massachusetts . . . . . . . . . . . . . . . . . . . . . . . . . . . 0.032450 –2,312 3,371 0.038816 –2,548 3,080 Michigan . . . . . . . . . . . . . . . . . . . . . . . . . . . . . . 0.006455 –21,327 31,990 –0.023017 –23,908 33,169 Minnesota . . . . . . . . . . . . . . . . . . . . . . . . . . . . . . 0.000310 –20,823 26,365 0.008351 –106,597 30,823 Mississippi . . . . . . . . . . . . . . . . . . . . . . . . . . . . . 0.001714 –39,317 19,444 0.020445 –27,887 17,239 Missouri . . . . . . . . . . . . . . . . . . . . . . . . . . . . . . . 0.004697 –8,884 10,776 –0.002402 9,637 8,938
Montana . . . . . . . . . . . . . . . . . . . . . . . . . . . . . . . 0.055324 –1,581 4,356 –0.059715 –48,367 13,442 Nebraska . . . . . . . . . . . . . . . . . . . . . . . . . . . . . . 0.037329 –2,510 3,593 0.034127 –72 2,640 Nevada . . . . . . . . . . . . . . . . . . . . . . . . . . . . . . . . 0.005007 –8,090 4,055 0.008052 600 2,787 New Hampshire . . . . . . . . . . . . . . . . . . . . . . . . . 0.112057 177 1,530 0.259509 1,299 402 New Jersey . . . . . . . . . . . . . . . . . . . . . . . . . . . . . 0.030384 –392 4,901 0.103886 9 2,432
New Mexico . . . . . . . . . . . . . . . . . . . . . . . . . . . . –0.011244 –8,297 9,568 0.230217 –2,553 3,300 New York . . . . . . . . . . . . . . . . . . . . . . . . . . . . . . 0.046461 –16,384 18,549 0.060195 14,380 6,931 North Carolina . . . . . . . . . . . . . . . . . . . . . . . . . . 0.013151 –7,442 16,655 –0.007341 –5,733 18,773 North Dakota . . . . . . . . . . . . . . . . . . . . . . . . . . . . (NA) (NA) (NA) (NA) (NA) (NA) Ohio . . . . . . . . . . . . . . . . . . . . . . . . . . . . . . . . . . 0.008805 44,579 17,178 –0.000533 –55,316 25,603
Oklahoma . . . . . . . . . . . . . . . . . . . . . . . . . . . . . . 0.010053 17,862 15,896 0.135080 27,988 6,568 Oregon . . . . . . . . . . . . . . . . . . . . . . . . . . . . . . . . . 0.017087 –5,837 8,095 0.009877 –8,838 8,179 Pennsylvania . . . . . . . . . . . . . . . . . . . . . . . . . . . 0.050758 –16,535 18,668 0.056836 –15,548 18,131 Rhode Island . . . . . . . . . . . . . . . . . . . . . . . . . . . 0.046582 –1,416 914 0.102558 –994 499 South Carolina . . . . . . . . . . . . . . . . . . . . . . . . . . 0.039217 –3,630 7,815 0.020949 –8,305 10,720
South Dakota . . . . . . . . . . . . . . . . . . . . . . . . . . . –0.000329 –9,205 11,194 0.070309 –4,221 7,158 Tennessee . . . . . . . . . . . . . . . . . . . . . . . . . . . . . . 0.084448 –9,998 12,576 0.203468 –3,342 5,689 Texas . . . . . . . . . . . . . . . . . . . . . . . . . . . . . . . . . . 0.114686 –85,855 44,518 0.128279 –71,291 38,430 Utah . . . . . . . . . . . . . . . . . . . . . . . . . . . . . . . . . . 0.009602 –5,402 7,922 0.007556 –7,585 7,951 Vermont . . . . . . . . . . . . . . . . . . . . . . . . . . . . . . . . 0.042093 –2,395 2,132 0.067655 –2,349 1,435
Virginia. . . . . . . . . . . . . . . . . . . . . . . . . . . . . . . . . 0.079698 778 4,363 0.112100 9,122 1,340 Washington . . . . . . . . . . . . . . . . . . . . . . . . . . . . . 0.095993 –3,056 4,652 0.084185 –13,640 6,129 West Virginia . . . . . . . . . . . . . . . . . . . . . . . . . . . . 0.042905 –11,238 6,458 0.012519 –13,442 7,608 Wisconsin . . . . . . . . . . . . . . . . . . . . . . . . . . . . . . 0.014256 –12,514 22,081 0.021117 –19,455 18,855 Wyoming . . . . . . . . . . . . . . . . . . . . . . . . . . . . . . –0.003362 –3,606 4,480 –0.030790 –4,007 4,809
(NA) Not available.

U.S. Fish and Wildlife Service and U.S. Census Bureau 2011 National Survey of Fishing, Hunting, and Wildlife-Associated Recreation—Pennsylvania 81
Table D–8. Parameters a and b for Calculating Approximate Standard Errors for Levels of Wildlife-Watching Participants for the Detailed Wildlife-Watching Sample
State Away–from–home participants Wildlife–watching participants1
a b a bUnited States, total . . . . . . . . . . . . . . . . . . . . . . . . . . . . . . . . . . –0.000134 32,078 –0.000119 28,477
Alabama . . . . . . . . . . . . . . . . . . . . . . . . . . . . . . . . . . . . . . . . . –0.003523 12,908 –0.009869 36,163 Alaska . . . . . . . . . . . . . . . . . . . . . . . . . . . . . . . . . . . . . . . . . . . –0.004221 2,221 –0.005350 2,815 Arizona . . . . . . . . . . . . . . . . . . . . . . . . . . . . . . . . . . . . . . . . . . –0.001319 6,703 –0.001925 9,787 Arkansas . . . . . . . . . . . . . . . . . . . . . . . . . . . . . . . . . . . . . . . . . –0.003939 8,814 –0.003938 8,814 California . . . . . . . . . . . . . . . . . . . . . . . . . . . . . . . . . . . . . . . . –0.000739 21,116 –0.000937 26,764
Colorado . . . . . . . . . . . . . . . . . . . . . . . . . . . . . . . . . . . . . . . . . –0.003019 11,913 –0.003309 13,057 Connecticut . . . . . . . . . . . . . . . . . . . . . . . . . . . . . . . . . . . . . . . –0.002392 6,653 –0.002609 7,256 Delaware . . . . . . . . . . . . . . . . . . . . . . . . . . . . . . . . . . . . . . . . . –0.001438 1,005 –0.002547 1,780 Florida . . . . . . . . . . . . . . . . . . . . . . . . . . . . . . . . . . . . . . . . . . . –0.001411 20,956 –0.001591 23,634 Georgia . . . . . . . . . . . . . . . . . . . . . . . . . . . . . . . . . . . . . . . . . . –0.003335 24,875 –0.007832 58,421
Hawaii . . . . . . . . . . . . . . . . . . . . . . . . . . . . . . . . . . . . . . . . . . . –0.002051 2,041 –0.001805 1,797 Idaho . . . . . . . . . . . . . . . . . . . . . . . . . . . . . . . . . . . . . . . . . . . . –0.007948 9,315 –0.008539 10,006 Illinois . . . . . . . . . . . . . . . . . . . . . . . . . . . . . . . . . . . . . . . . . . . –0.001219 12,172 –0.001994 19,916 Indiana . . . . . . . . . . . . . . . . . . . . . . . . . . . . . . . . . . . . . . . . . . . –0.002020 10,030 –0.006775 33,637 Iowa . . . . . . . . . . . . . . . . . . . . . . . . . . . . . . . . . . . . . . . . . . . . . –0.003386 8,000 –0.003220 7,607
Kansas . . . . . . . . . . . . . . . . . . . . . . . . . . . . . . . . . . . . . . . . . . . –0.003728 8,064 –0.003222 6,969 Kentucky . . . . . . . . . . . . . . . . . . . . . . . . . . . . . . . . . . . . . . . . . –0.002201 7,431 –0.005428 18,327 Louisiana . . . . . . . . . . . . . . . . . . . . . . . . . . . . . . . . . . . . . . . . . –0.001619 5,582 –0.009544 32,914 Maine . . . . . . . . . . . . . . . . . . . . . . . . . . . . . . . . . . . . . . . . . . . –0.003739 3,986 –0.006455 6,881 Maryland . . . . . . . . . . . . . . . . . . . . . . . . . . . . . . . . . . . . . . . . . –0.000762 3,414 –0.001982 8,879
Massachusetts . . . . . . . . . . . . . . . . . . . . . . . . . . . . . . . . . . . . . –0.001036 5,512 –0.001839 9,783 Michigan . . . . . . . . . . . . . . . . . . . . . . . . . . . . . . . . . . . . . . . . . –0.003032 23,610 –0.003331 25,940 Minnesota . . . . . . . . . . . . . . . . . . . . . . . . . . . . . . . . . . . . . . . . –0.005468 22,603 –0.006274 25,934 Mississippi . . . . . . . . . . . . . . . . . . . . . . . . . . . . . . . . . . . . . . . –0.005131 11,393 –0.005454 12,110 Missouri . . . . . . . . . . . . . . . . . . . . . . . . . . . . . . . . . . . . . . . . . –0.002842 13,264 –0.003139 14,653
Montana . . . . . . . . . . . . . . . . . . . . . . . . . . . . . . . . . . . . . . . . . –0.004110 3,194 –0.004772 3,708 Nebraska . . . . . . . . . . . . . . . . . . . . . . . . . . . . . . . . . . . . . . . . . –0.003608 5,004 –0.004078 5,656 Nevada . . . . . . . . . . . . . . . . . . . . . . . . . . . . . . . . . . . . . . . . . . –0.005369 10,865 –0.004111 8,319 New Hampshire . . . . . . . . . . . . . . . . . . . . . . . . . . . . . . . . . . . –0.002275 2,425 –0.002428 2,589 New Jersey . . . . . . . . . . . . . . . . . . . . . . . . . . . . . . . . . . . . . . . –0.000795 5,449 –0.001272 8,715
New Mexico . . . . . . . . . . . . . . . . . . . . . . . . . . . . . . . . . . . . . . –0.003021 4,686 –0.004748 7,364 New York . . . . . . . . . . . . . . . . . . . . . . . . . . . . . . . . . . . . . . . . –0.002450 37,975 –0.002910 45,114 North Carolina . . . . . . . . . . . . . . . . . . . . . . . . . . . . . . . . . . . . –0.003857 28,014 –0.004098 29,769 North Dakota . . . . . . . . . . . . . . . . . . . . . . . . . . . . . . . . . . . . . . (NA) (NA) (NA) (NA) Ohio. . . . . . . . . . . . . . . . . . . . . . . . . . . . . . . . . . . . . . . . . . . . . –0.001006 9,055 –0.003043 27,382
Oklahoma . . . . . . . . . . . . . . . . . . . . . . . . . . . . . . . . . . . . . . . . –0.001850 5,230 –0.005081 14,367 Oregon . . . . . . . . . . . . . . . . . . . . . . . . . . . . . . . . . . . . . . . . . . . –0.002304 7,055 –0.004554 13,942 Pennsylvania . . . . . . . . . . . . . . . . . . . . . . . . . . . . . . . . . . . . . . –0.003639 36,519 –0.004874 48,914 Rhode Island . . . . . . . . . . . . . . . . . . . . . . . . . . . . . . . . . . . . . . –0.001580 1,340 –0.001829 1,552 South Carolina . . . . . . . . . . . . . . . . . . . . . . . . . . . . . . . . . . . . –0.004536 16,126 –0.004877 17,337
South Dakota . . . . . . . . . . . . . . . . . . . . . . . . . . . . . . . . . . . . . . –0.002833 1,788 –0.013684 8,638 Tennessee . . . . . . . . . . . . . . . . . . . . . . . . . . . . . . . . . . . . . . . . –0.007450 36,840 –0.004097 20,260 Texas . . . . . . . . . . . . . . . . . . . . . . . . . . . . . . . . . . . . . . . . . . . . –0.001436 26,817 –0.001909 35,657 Utah . . . . . . . . . . . . . . . . . . . . . . . . . . . . . . . . . . . . . . . . . . . . . –0.002560 5,211 –0.002329 4,741 Vermont . . . . . . . . . . . . . . . . . . . . . . . . . . . . . . . . . . . . . . . . . . –0.007044 3,605 –0.006399 3,275
Virginia . . . . . . . . . . . . . . . . . . . . . . . . . . . . . . . . . . . . . . . . . . –0.002247 13,787 –0.002743 16,828 Washington . . . . . . . . . . . . . . . . . . . . . . . . . . . . . . . . . . . . . . . –0.004645 24,585 –0.003371 17,846 West Virginia . . . . . . . . . . . . . . . . . . . . . . . . . . . . . . . . . . . . . . –0.019113 27,981 –0.015998 23,421 Wisconsin . . . . . . . . . . . . . . . . . . . . . . . . . . . . . . . . . . . . . . . . –0.004020 17,926 –0.005124 22,851 Wyoming . . . . . . . . . . . . . . . . . . . . . . . . . . . . . . . . . . . . . . . . . –0.003576 1,515 –0.004694 1,988
(NA) Not available1 Use these parameters for total wildlife-watching participants and around-the-home participants.

82 2011 National Survey of Fishing, Hunting, and Wildlife-Associated Recreation—Pennsylvania U.S. Fish and Wildlife Service and U.S. Census Bureau
Table D–9. Parameters a, b, and c for Calculating Approximate Standard Errors for Expenditures and Days or Trips for Wildlife-Watching Sample
StateExpenditures Days or trips
a b c a b cUnited States, total . . . . . . . . . . . . . . . . . . . . . . . . . . . . . .. 0.001308 –1,548,024 112,362 0.002307 826,023 54,100
Alabama . . . . . . . . . . . . . . . . . . . . . . . . . . . . . . . . . . . . . 0.292431 –9,893 10,505 –0.079778 174,629 61,748 Alaska . . . . . . . . . . . . . . . . . . . . . . . . . . . . . . . . . . . . . . . 0.108738 –34,916 4,682 0.016446 –58,833 12,421 Arizona . . . . . . . . . . . . . . . . . . . . . . . . . . . . . . . . . . . . . . 0.077675 –4,716 7,536 –0.027772 286,426 30,687 Arkansas . . . . . . . . . . . . . . . . . . . . . . . . . . . . . . . . . . . . .. 0.313406 –11,247 9,078 0.062790 –194,867 34,370 California . . . . . . . . . . . . . . . . . . . . . . . . . . . . . . . . . . . . 0.048430 –43,155 28,990 0.006079 –38,139 52,624
Colorado . . . . . . . . . . . . . . . . . . . . . . . . . . . . . . . . . . . . .. 0.124349 –14,729 9,702 0.026976 183,987 10,254 Connecticut . . . . . . . . . . . . . . . . . . . . . . . . . . . . . . . . . . . 0.007486 –436,089 16,607 –0.024420 125,914 23,606 Delaware . . . . . . . . . . . . . . . . . . . . . . . . . . . . . . . . . . . . . 0.061895 –18,947 3,005 –0.074027 13,351 10,785 Florida . . . . . . . . . . . . . . . . . . . . . . . . . . . . . . . . . . . . . . . 0.083730 104,408 21,053 0.007541 –194,343 57,112 Georgia . . . . . . . . . . . . . . . . . . . . . . . . . . . . . . . . . . . . . . 0.249488 –25,092 26,678 0.050793 –3,332,773 479,805
Hawaii . . . . . . . . . . . . . . . . . . . . . . . . . . . . . . . . . . . . . . . 0.120445 –32,991 1,567 0.083382 –9,149 3,825 Idaho . . . . . . . . . . . . . . . . . . . . . . . . . . . . . . . . . . . . . . . .. 0.223371 –147,314 10,203 –0.062345 –258,027 89,698 Illinois . . . . . . . . . . . . . . . . . . . . . . . . . . . . . . . . . . . . . . . 0.107605 –13,356 18,919 0.044699 –354,008 68,862 Indiana . . . . . . . . . . . . . . . . . . . . . . . . . . . . . . . . . . . . . . . 0.193872 –322,885 13,396 –0.040883 –166,121 69,136 Iowa . . . . . . . . . . . . . . . . . . . . . . . . . . . . . . . . . . . . . . . . . 0.021305 94,648 4,636 0.079467 –75,095 20,869
Kansas . . . . . . . . . . . . . . . . . . . . . . . . . . . . . . . . . . . . . . . 0.072491 6,025 5,519 –0.013518 –72,502 27,154 Kentucky . . . . . . . . . . . . . . . . . . . . . . . . . . . . . . . . . . . . . 0.157856 –96,510 5,459 0.029898 –95,012 43,749 Louisiana . . . . . . . . . . . . . . . . . . . . . . . . . . . . . . . . . . . . . 0.362140 107,638 6,464 0.246426 368,942 –24,469 Maine . . . . . . . . . . . . . . . . . . . . . . . . . . . . . . . . . . . . . . . 0.094142 –35,394 5,069 0.150679 –50,401 9,088 Maryland . . . . . . . . . . . . . . . . . . . . . . . . . . . . . . . . . . . . 0.095353 39,360 3,760 –0.020442 –46,263 37,328
Massachusetts . . . . . . . . . . . . . . . . . . . . . . . . . . . . . . . . .. 0.014009 –163,624 14,762 –0.020104 –59,530 32,483 Michigan . . . . . . . . . . . . . . . . . . . . . . . . . . . . . . . . . . . . . 0.072396 489 41,625 0.046186 1,002,661 –40,953 Minnesota . . . . . . . . . . . . . . . . . . . . . . . . . . . . . . . . . . . . 0.096860 –27,052 22,699 0.018847 –405,415 80,062 Mississippi . . . . . . . . . . . . . . . . . . . . . . . . . . . . . . . . . . . 0.040018 23,616 8,811 –0.060202 –43,904 39,904 Missouri . . . . . . . . . . . . . . . . . . . . . . . . . . . . . . . . . . . . . 0.077023 –29,229 11,649 0.021741 –290,522 62,546
Montana . . . . . . . . . . . . . . . . . . . . . . . . . . . . . . . . . . . . . 0.102248 27,322 3,406 –0.004215 –16,717 12,349 Nebraska . . . . . . . . . . . . . . . . . . . . . . . . . . . . . . . . . . . . . 0.250670 –146,886 4,935 0.027770 347,687 3,046 Nevada . . . . . . . . . . . . . . . . . . . . . . . . . . . . . . . . . . . . . . 0.100312 –90,487 4,723 –0.038534 –44,832 21,999 New Hampshire . . . . . . . . . . . . . . . . . . . . . . . . . . . . . . . 0.024368 –13,607 3,264 0.043269 9,164 578 New Jersey . . . . . . . . . . . . . . . . . . . . . . . . . . . . . . . . . . . 0.089631 –120,587 9,071 –0.020528 –231,435 57,548
New Mexico . . . . . . . . . . . . . . . . . . . . . . . . . . . . . . . . . . 0.110251 1,905 3,130 0.021449 197,267 5,813 New York . . . . . . . . . . . . . . . . . . . . . . . . . . . . . . . . . . . . 0.122911 –1,425,885 68,948 0.006340 –44,103 93,311 North Carolina . . . . . . . . . . . . . . . . . . . . . . . . . . . . . . . . 0.017031 –326,265 56,212 –0.058093 –593,772 133,445 North Dakota . . . . . . . . . . . . . . . . . . . . . . . . . . . . . . . . . . (NA) (NA) (NA) (NA) (NA) (NA) Ohio. . . . . . . . . . . . . . . . . . . . . . . . . . . . . . . . . . . . . . . . . 0.080684 –39,489 26,461 0.001012 –1,543 45,574
Oklahoma . . . . . . . . . . . . . . . . . . . . . . . . . . . . . . . . . . . . 0.235454 57,625 3,593 0.014729 –152,377 38,659 Oregon . . . . . . . . . . . . . . . . . . . . . . . . . . . . . . . . . . . . . . . 0.099298 –158,238 13,407 0.010117 –157,164 46,869 Pennsylvania . . . . . . . . . . . . . . . . . . . . . . . . . . . . . . . . . . 0.084612 –12,972 30,509 –0.007189 –465,695 137,527 Rhode Island . . . . . . . . . . . . . . . . . . . . . . . . . . . . . . . . . . 0.097369 –15,709 1,525 –0.006225 65,378 2,641 South Carolina . . . . . . . . . . . . . . . . . . . . . . . . . . . . . . . . 0.063035 –24,816 15,855 0.022948 –180,925 43,937
South Dakota . . . . . . . . . . . . . . . . . . . . . . . . . . . . . . . . . . 0.071413 123,949 5,679 0.089793 –8,087 10,884 Tennessee . . . . . . . . . . . . . . . . . . . . . . . . . . . . . . . . . . . . 0.031635 –32,698 21,276 0.086824 –18,925 12,703 Texas . . . . . . . . . . . . . . . . . . . . . . . . . . . . . . . . . . . . . . . . 0.072728 –140,319 44,225 0.058100 –1,079,923 206,159 Utah . . . . . . . . . . . . . . . . . . . . . . . . . . . . . . . . . . . . . . . . . 0.085970 –75,950 8,631 –0.041299 –141,530 33,231 Vermont . . . . . . . . . . . . . . . . . . . . . . . . . . . . . . . . . . . . . . 0.038545 –10,496 2,590 –0.014657 6,845 6,875
Virginia . . . . . . . . . . . . . . . . . . . . . . . . . . . . . . . . . . . . . . 0.077984 46,506 9,684 –0.013749 –12,650 34,877 Washington . . . . . . . . . . . . . . . . . . . . . . . . . . . . . . . . . . . 0.046435 –44,547 25,839 –0.074088 –88,929 109,017 West Virginia . . . . . . . . . . . . . . . . . . . . . . . . . . . . . . . . . . 0.369202 18,732 2,180 0.243904 –8,874 7,939 Wisconsin . . . . . . . . . . . . . . . . . . . . . . . . . . . . . . . . . . . . 0.256246 –223,513 26,643 –0.019357 –228,892 138,515 Wyoming . . . . . . . . . . . . . . . . . . . . . . . . . . . . . . . . . . . . . 0.098137 502 2,339 0.039285 –9,043 7,534
(NA) Not available.


U.S. Department of the InteriorU.S. Fish & Wildlife Service
http://wsfrprograms.fws.gov
Revised January 2014