Embed Size (px)
Citation preview

Final Report
Sept 26, 2008
The Economic Impacts of Hunting, Fishing and Wildlife Watching in Colorado
Prepared for
Colorado Division of Wildlife Prepared by
BBC Research & Consulting 3773 Cherry Creek N. Drive, Suite 850 Denver, Colorado 80209-3827 303.321.2547 fax 303.399.0448 www.bbcresearch.com [email protected]

Table of Contents
BBC RESEARCH & CONSULTING i
Executive Summary
Background .................................................................................................................................... 1
Overview of Statewide Economic Impacts of Hunting and Fishing .................................................. 1
Overview of Statewide Economic Impacts of Wildlife Watching Activities ....................................... 2
I. Introduction
Background .................................................................................................................................... 3
Objectives ...................................................................................................................................... 3
Process ........................................................................................................................................... 4
Model Capabilities .......................................................................................................................... 4
II. Model Overview
III. Statewide Results
Statewide Economic Impacts of Hunting and Fishing ..................................................................... 9
Statewide Economic Impacts of Hunting and Fishing by Residents and Non-Residents ................. 11
Statewide Economic Impacts of Wildlife Watching Activities ......................................................... 13
IV. County-Level Results
V. Comparison with Previous Impact Estimates

BBC RESEARCH & CONSULTING EXECUTIVE SUMMARY, PAGE 1
EXECUTIVE SUMMARY
Background
In 1988, the Colorado Division of Wildlife (CDOW) selected BBC Research & Consulting (BBC) to build a model that estimated the economic effects of hunting and fishing in Colorado. CDOW used and maintained this model, and provided periodic updates of economic effects as new information became available. State and local government officials and CDOW personnel regularly used the model’s results to help them educate the public, consider policy choices and allocate resources.
BBC last revised and updated the model in 2004, using 2002 data. In early 2008, CDOW asked BBC to complete a new update, based on the most recently available data. In addition to desiring a more current set of economic impact estimates, CDOW recognized that, due to circumstances in 2002 including drought, wildfires and a poor economy, estimates for 2002 may not accurately reflect the prevailing economic impact of hunting, fishing and wildlife watching in Colorado.
The estimates presented here are based on data from a number of different sources, including CDOW game harvest information for 2007, a survey of Colorado anglers conducted by CDOW in early 2008, CDOW expenditure data for Fiscal Year 2007 and the U.S. Fish and Wildlife Service’s (USFWS) 2006 National Survey of Fishing, Hunting and Wildlife-Associated Recreation.
Overview of Statewide Economic Impacts of Hunting and Fishing
Hunting and fishing are an important part of Colorado’s tourism economy. During 2007, the most recent year for which hunting and fishing data are available, there were roughly 12.7 million hunting and fishing activity days in Colorado. An activity day consists of one hunter or angler spending at least part of one day hunting or fishing. Colorado residents account for approximately 91 percent of hunting and fishing activity days.
Direct expenditures. Excluding purchases of hunting and fishing licenses (captured in CDOW expenditures), hunters and anglers spent an estimated $1.0 billion on trip expenses and sporting equipment in Colorado during 2007. In addition, CDOW spent $58 million on operations that directly support hunting and fishing in the state. (Information about the CDOW budget categories involved in this estimate are provided on page 10 of the main report.) Combining these, total direct expenditures in support of hunting and fishing were approximately $1.1 billion.
Total impact. The total economic impact of hunting and fishing is the sum of new dollars injected into the economy (trip expenses, sporting equipment purchases and CDOW expenditures that support hunting and fishing) and the secondary impact of the dollars that are re-spent within the economy. The secondary economic impact of hunting and fishing dollars during 2007 is estimated at $767 million, yielding a total impact of just over $1.8 billion.
BBC RESEARCH & CONSULTING EXECUTIVE SUMMARY, PAGE 2
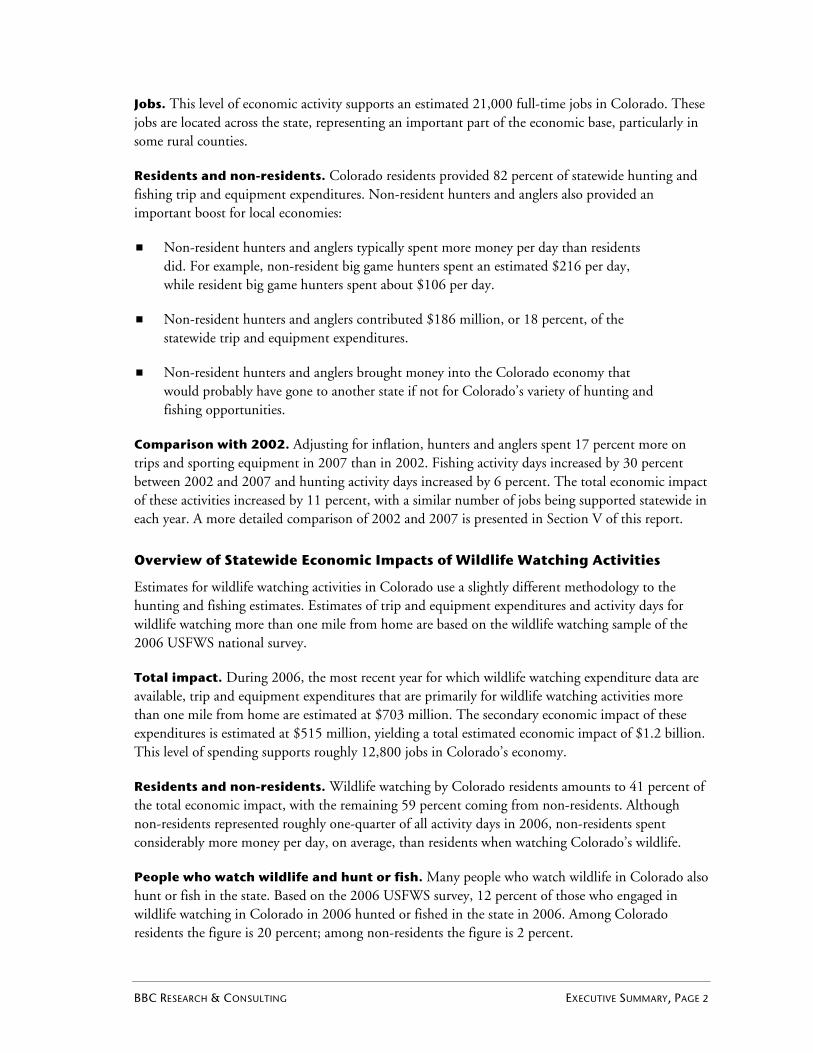
Jobs. This level of economic activity supports an estimated 21,000 full-time jobs in Colorado. These jobs are located across the state, representing an important part of the economic base, particularly in some rural counties.
Residents and non-residents. Colorado residents provided 82 percent of statewide hunting and fishing trip and equipment expenditures. Non-resident hunters and anglers also provided an important boost for local economies:
Non-resident hunters and anglers typically spent more money per day than residents did. For example, non-resident big game hunters spent an estimated $216 per day, while resident big game hunters spent about $106 per day.
Non-resident hunters and anglers contributed $186 million, or 18 percent, of the statewide trip and equipment expenditures.
Non-resident hunters and anglers brought money into the Colorado economy that would probably have gone to another state if not for Colorado’s variety of hunting and fishing opportunities.
Comparison with 2002. Adjusting for inflation, hunters and anglers spent 17 percent more on trips and sporting equipment in 2007 than in 2002. Fishing activity days increased by 30 percent between 2002 and 2007 and hunting activity days increased by 6 percent. The total economic impact of these activities increased by 11 percent, with a similar number of jobs being supported statewide in each year. A more detailed comparison of 2002 and 2007 is presented in Section V of this report.
Overview of Statewide Economic Impacts of Wildlife Watching Activities
Estimates for wildlife watching activities in Colorado use a slightly different methodology to the hunting and fishing estimates. Estimates of trip and equipment expenditures and activity days for wildlife watching more than one mile from home are based on the wildlife watching sample of the 2006 USFWS national survey.
Total impact. During 2006, the most recent year for which wildlife watching expenditure data are available, trip and equipment expenditures that are primarily for wildlife watching activities more than one mile from home are estimated at $703 million. The secondary economic impact of these expenditures is estimated at $515 million, yielding a total estimated economic impact of $1.2 billion. This level of spending supports roughly 12,800 jobs in Colorado’s economy.
Residents and non-residents. Wildlife watching by Colorado residents amounts to 41 percent of the total economic impact, with the remaining 59 percent coming from non-residents. Although non-residents represented roughly one-quarter of all activity days in 2006, non-residents spent considerably more money per day, on average, than residents when watching Colorado’s wildlife.
People who watch wildlife and hunt or fish. Many people who watch wildlife in Colorado also hunt or fish in the state. Based on the 2006 USFWS survey, 12 percent of those who engaged in wildlife watching in Colorado in 2006 hunted or fished in the state in 2006. Among Colorado residents the figure is 20 percent; among non-residents the figure is 2 percent.

BBC RESEARCH & CONSULTING SECTION I, PAGE 3
SECTION I. Introduction
Background
In 1988, the Colorado Division of Wildlife (CDOW) selected BBC Research & Consulting (BBC) to build a model that estimated the economic effects of hunting and fishing in Colorado. The Division used and maintained this model and provided periodic updates of economic effects as new information became available. State and local government officials and CDOW personnel regularly used the model’s results to help them educate the public, consider policy choices and allocate resources.
BBC last completed a model update in October 2004, providing estimates of the economic impact of hunting and fishing in 2002 and of wildlife watching in 2001. BBC’s estimates and CDOW data both showed a decline in hunting and fishing activity as well as expenditures in 2002 relative to previous years. It was recognized that lower activity and total expenditures may have resulted from unfavorable conditions in 2002, including drought, wildfires and a weak economy. By providing a new set of estimates based on the most recently available data, BBC has been able to provide an assessment that more accurately reflects the prevailing economic impact of hunting, fishing and wildlife watching in Colorado.
Objectives
CDOW specified several objectives for this update.
Work with CDOW personnel to integrate the most recently available information and refine working assumptions;
Provide statewide and individual county estimates of the economic effects of elk hunting, deer hunting, other big game hunting, small game hunting and fishing;
Distinguish between resident and non-resident impacts; and
Provide a statewide estimate of the economic effects of wildlife watching, using a methodology similar to that for hunting and fishing.
BBC RESEARCH & CONSULTING SECTION I, PAGE 4
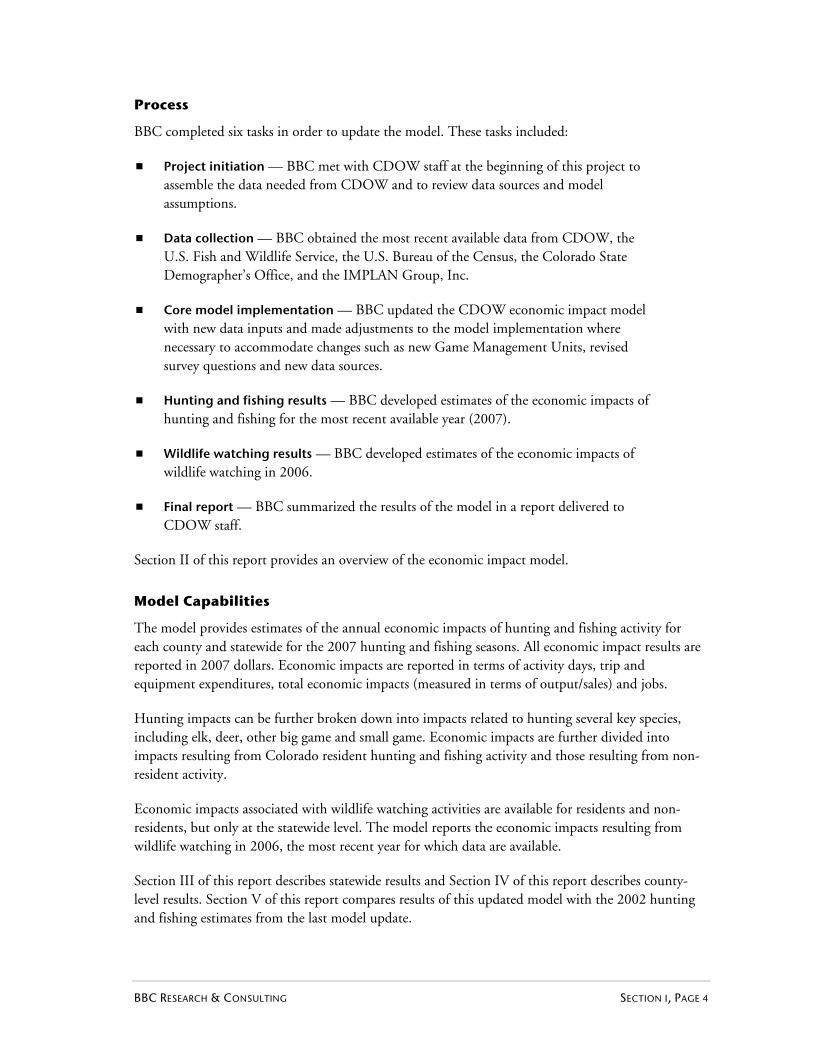
Process
BBC completed six tasks in order to update the model. These tasks included:
Project initiation — BBC met with CDOW staff at the beginning of this project to assemble the data needed from CDOW and to review data sources and model assumptions.
Data collection — BBC obtained the most recent available data from CDOW, the U.S. Fish and Wildlife Service, the U.S. Bureau of the Census, the Colorado State Demographer’s Office, and the IMPLAN Group, Inc.
Core model implementation — BBC updated the CDOW economic impact model with new data inputs and made adjustments to the model implementation where necessary to accommodate changes such as new Game Management Units, revised survey questions and new data sources.
Hunting and fishing results — BBC developed estimates of the economic impacts of hunting and fishing for the most recent available year (2007).
Wildlife watching results — BBC developed estimates of the economic impacts of wildlife watching in 2006.
Final report — BBC summarized the results of the model in a report delivered to CDOW staff.
Section II of this report provides an overview of the economic impact model.
Model Capabilities
The model provides estimates of the annual economic impacts of hunting and fishing activity for each county and statewide for the 2007 hunting and fishing seasons. All economic impact results are reported in 2007 dollars. Economic impacts are reported in terms of activity days, trip and equipment expenditures, total economic impacts (measured in terms of output/sales) and jobs.
Hunting impacts can be further broken down into impacts related to hunting several key species, including elk, deer, other big game and small game. Economic impacts are further divided into impacts resulting from Colorado resident hunting and fishing activity and those resulting from non-resident activity.
Economic impacts associated with wildlife watching activities are available for residents and non-residents, but only at the statewide level. The model reports the economic impacts resulting from wildlife watching in 2006, the most recent year for which data are available.
Section III of this report describes statewide results and Section IV of this report describes county-level results. Section V of this report compares results of this updated model with the 2002 hunting and fishing estimates from the last model update.

BBC RESEARCH & CONSULTING SECTION II, PAGE 5
SECTION II. Model Overview
The updated economic impact model developed for CDOW combines the most recently available information from a variety of sources to generate estimates of the impacts of hunting, fishing and wildlife watching in Colorado. This section of the report provides an overview of the model.
General model structure. The overall structure of the economic impact model is shown in Exhibit II-1, on the next page. The model begins with information about resident and non-resident participants in Colorado. Estimates of equipment expenditures and per-visitor day direct expenditures for trip costs come from the U.S. Fish and Wildlife Service and U.S. Bureau of the Census “2006 National Survey of Fishing, Hunting, and Wildlife Associated Recreation.” Estimates of the number of hunting and fishing activity days, along with their location, come from CDOW surveys and license sales.
The model then estimates direct expenditures, by type of visitor and activity, based on estimated expenditures per visitor day and per trip (specific to each type of activity and each type of visitor), combined with data on CDOW expenditures that support hunting and fishing activities. The location of sales depends on the type of expenditure, the locations where hunting and fishing activities take place and where equipment or trip support services are purchased.
Secondary expenditures, reflecting the re-spending of hunting and fishing dollars within Colorado, are estimated using the IMPLAN input-output model originally developed by the U.S. Forest Service. The model then combines the direct and secondary expenditures to produce total economic impact estimates and estimates of total employment related to hunting and fishing activities.
The wildlife watching component of the model follows a similar structure. However, due to data limitations, there is no county-level detail available for wildlife watching impacts. Economic effects of wildlife watching are only provided at a statewide level.

BBC RESEARCH & CONSULTING SECTION II, PAGE 6
Exhibit II-1. Overall Economic Impact Model Structure
Trip and Equipment
Expenditures
Direct Expenditures
SecondaryExpenditures
Locationof Sales
Nature of Activity
Participants
LicenseExpenditures
DivisionExpenditures
Out of StateVisitors
Colorado StateResidents
CO Counties Denver Metro Out of State
In-State Re-Spending
• Big Game Hunting (Deer, Elk and Other Big Game)
• Small Game Hunting (Including Migratory Birds)
• Fishing
Source: BBC Research & Consulting.

BBC RESEARCH & CONSULTING SECTION II, PAGE 7
Inputs to the model. Data for the model come from a variety of sources and are depicted in Exhibit II-2:
CDOW provided data on hunting and fishing activity levels by location and species, direct CDOW expenditures and license agent commissions, and the geographic and economic relationship between Game Management Units and county boundaries;
Colorado-specific information in the U.S. Fish and Wildlife Service and U.S. Bureau of the Census “2006 National Survey of Fishing, Hunting, and Wildlife Associated Recreation” provides estimates of hunting, fishing and wildlife watching expenditures in Colorado per visitor and per visitor day;
Data from the U.S. Census County Business Patterns was used to apportion equipment expenditures based on the locations of retail outlets for hunting, fishing and wildlife watching equipment;
Data from the U.S. Department of Commerce, Bureau of Economic Analysis was used to convert all dollar figures into 2007 dollars; and
The IMPLAN economic impact model was used to estimate secondary economic impacts (“re-spending” effects) and total employment impacts.
Exhibit II-2. Inputs to the Model
CDOW Expenditures License Agent Commissions
Census Data on County Business
PatternsUS Bureau of
Economic Analysis Price Escalators
Interviews with CDOW Staff
GMU-to-County Expenditure Distribution
CDOW Big Game Harvest Surveys
Total Activity Days andCounty-level Distribution
2008 CDOW Survey of Colorado Anglers
CDOW Small Game Hunting
Surveys & USFWS Waterfowl Survey
IMPLAN EconomicImpact Model
Expenditures
Activity
Economic Impacts
2006 USFWS Survey of Fishing, Hunting and Wildlife-Associated
Recreation
Source: BBC Research & Consulting.

BBC RESEARCH & CONSULTING SECTION II, PAGE 8
Model outputs. Apart from producing overall statewide estimates of the total economic impact of hunting, fishing and wildlife watching activities, the model is able to produce a variety of more specialized results. As summarized in Exhibit II-3, the model can show results for hunting and fishing impacts at both the state and county levels, as well as results for wildlife watching impacts at the state level. The model can also generate impact results for more specific activities, such as elk hunting or small game hunting. A variety of economic measures are available from the model, including direct expenditures, total output and jobs.
Exhibit II-3. Available Model Results
Source:
BBC Research & Consulting.
Geography
County-level
State-level
Residency
Colorado
Non-resident
Activity
Elk hunting
Deer hunting
Other big game hunting
Small game hunting
Fishing
Wildlife watching
Economic Impacts
Direct expenditures
Secondary spending
Total impact(direct and secondary)
Jobs
Employee earnings
Direct expenditure categories
Trip expenses
Equipment purchases
CDOW expenditures

BBC RESEARCH & CONSULTING SECTION III, PAGE 9
SECTION III. Statewide Results
Statewide Economic Impacts of Hunting and Fishing
Hunting and fishing are an important and sizable portion of Colorado’s tourism economy.
Exhibit III-1 summarizes direct expenditures, total economic impacts and total jobs in Colorado related to hunting and fishing in 2007. Overall, the economic impacts of fishing were greater than those of hunting, reflecting the fact that fishing activity days represented more than 80 percent of all activity days. However, the economic impact of each hunting day is nearly twice that of an individual fishing day, on average. Among the major game species hunted in Colorado in 2007, the economic impacts of elk hunting were the largest, followed by deer hunting.
Exhibit III-1. Statewide Economic Impacts of Hunting and Fishing in 2007
Activity
Elk hunting $172,700 $295,500 3,400
Deer hunting 58,300 99,900 1,160
Other big game hunting 4,700 8,300 100
Fishing 725,200 1,259,400 14,610
Small game hunting 56,900 98,700 1,350
CDOW expenditures 58,500 81,500 730
Total $1,076,300 $1,843,300 21,350
Total3
jobs($ in thousands)($ in thousands)Direct expenditures1 Total impact2
Note: Measured in 2007 dollars.
1. Trip and equipment expenditures and CDOW expenditures in support of these activities. 2. Direct expenditures plus secondary spending by businesses and households (multiplier effects). 3. Includes job creation from direct and secondary expenditures.
Source: BBC Research & Consulting, based on data from CDOW and USFWS 2006 national survey.

BBC RESEARCH & CONSULTING SECTION III, PAGE 10
Direct expenditures. Hunters and anglers spent an estimated $1.0 billion on trip expenses1 and sporting equipment2 (direct expenditures) in Colorado during 2007. Expenditures by Colorado residents made up about 82 percent of this total. Expenditures per day were greater, on average, for non-residents than for Colorado residents. In addition, CDOW spent an estimated $58 million on items that directly support hunting and fishing activities in the state. (For a description of included CDOW budgetary groups, see below.3) When combined, total direct expenditures are estimated to equal $1.1 billion.
Total economic impacts. Businesses receive revenue from hunter and angler purchases and use a portion of this money to pay employees and purchase goods and services that support business operations. Thus, the hunter and angler expenditures re-circulate in the local economy — providing an economic impact beyond just the original expenditures. This additional re-spending impact is often termed a “multiplier” effect or secondary impact.
The total economic impact of the hunting and fishing industry consists of both new dollars injected into the economy from hunter and angler trip expenses and sporting equipment purchases (direct expenditures) and the secondary impact as these dollars are re-spent within the economy. The secondary economic impact of hunting and fishing dollars during 2007 is estimated at $767 million. Adding this figure to the trip and equipment purchases, the total estimated impact is $1.8 billion.
Jobs. A portion of the direct expenditures of hunters and anglers and the subsequent re-spending of these revenues pay for wages and salaries that currently support an estimated 21,000 full-time jobs in Colorado. These jobs, located across Colorado, form an important component of the local economic base, particularly in certain rural counties.
Activity days. During 2007, the most recent year for which data are available, there were about 12.7 million hunting and fishing activity days. An activity day consists of one hunter or angler spending at least part of one day hunting or fishing. Resident hunter and angler activity days comprised approximately 91 percent of the total hunting and fishing activity days in Colorado. Non-resident hunter and angler activity days were 9 percent of the total. The portion of non-resident activity days varied considerably for different activities: non-residents were responsible for less than 5 percent of fishing activity days but more than one-third of big game activity days. Exhibit III-2 on the next page shows these results.
1 Includes expenditures on the following goods and services: food, lodging, public transportation, private transportation,
guide fees, public land access fees, private land access fees, equipment rental, boat fuel, other boating costs, and heating and cooking fuel. Excludes expenditures on hunting and fishing licenses as these are represented by CDOW expenditures. 2 Includes some or all of the expenditures on the following items: guns and rifles, ammunition, other hunting equipment,
fishing gear, camping equipment, binoculars, clothing, taxidermy, boats, trucks, campers, recreational vehicles, magazines and books, membership dues and contributions, film, bird food, and food for other wildlife. 3 CDOW expenditures include the following expenditure groups: operating (i.e. instate travel, supplies, motor vehicles,
etc.), capital (IT, equipment, etc.), and all other expenditures in direct support of fish and wildlife management.

BBC RESEARCH & CONSULTING SECTION III, PAGE 11
Exhibit III-2. Hunting and Fishing Activity Days, 2007
Activity
Big game hunting 1,005 596 1,601
Small game hunting 582 23 605
Fishing 9,995 471 10,466
Total 11,582 1,090 12,672
Resident Non-resident Totalactivity days activity days activity days(thousands) (thousands) (thousands)
Source: BBC Research & Consulting, based on fishing and hunting activity data provided by CDOW.
Statewide Economic Impacts of Hunting and Fishing by Residents and Non-Residents
Resident and non-resident hunters and anglers provide an important boost for local economies and bring money into the Colorado economy that may well be spent in another state if not for Colorado’s unique outdoor experience. Residents contributed approximately $832 million, or 82 percent of the statewide trip and equipment expenditures (excluding direct CDOW expenditures). Non-residents contributed $186 million, or 18 percent, of these direct expenditures.
Daily expenditures. Non-residents typically spent more money per day than residents. For example, non-resident big game hunters spent an estimated $216 per day in 2007, while resident big game hunters spent about $106. Exhibit III-3 shows additional information about average per day expenditures.
Exhibit III-3. Average Expenditures per Hunter and Angler per Day, 2007
Activity
Big game hunting $106 $216
Small game hunting $94 $87
Fishing $67 $118
Resident Non-resident$ per day $ per day
Note: Measured in 2007 dollars.
Source: BBC Research & Consulting, based on 2006 USFWS national survey.
Expenditure type. Exhibits III-4 and III-5, on the next page, show how hunters and anglers spent their trip and equipment expenditures in Colorado. For both residents and non-residents, the primary trip expenditures – food, lodging and transportation – represented a sizable portion of total direct expenditures. These trip expenditures made up approximately 40 percent of the total for residents and 62 percent of the total for non-residents. Guide and membership fees were a much larger share of non-resident than resident expenditures, while equipment expenditures (for sporting goods purchased in Colorado) were a much greater share of resident expenditures.

BBC RESEARCH & CONSULTING SECTION III, PAGE 12
Exhibit III-4. Direct Expenditures by Expenditure Type for Residents
Source:
BBC Research & Consulting, based on 2006 USFWS national survey.
Food and lodging (21%)
Guide and membership fees (2%)
Transportation (19%)
Sporting goods (34%)
Boating (16%)
Other (8%)
Exhibit III-5. Direct Expenditures by Expenditure Type for Non-residents
Source:
BBC Research & Consulting, based on 2006 USFWS national survey.
Food and lodging (35%)
Guide and membership fees (31%)
Transportation (27%)
Sporting goods (3%)Other (4%)
Expenditures by activity. Exhibit III-6 shows additional detail for expenditures by place of residence and hunting or fishing activity. Non-residents were responsible for more than one-half of all direct expenditures relating to deer and elk hunting. Residents contributed more than 90 percent of fishing-related direct expenditures.
Exhibit III-6. Hunting and Fishing Trip and Equipment Expenditures by Residents and Non-Residents, 2007
Activity
Hunting
Deer $29,600 $28,700 $58,300
Elk 73,200 99,500 172,700
Other big game 4,100 600 4,700
Small game 54,900 2,000 56,900
Subtotal $161,800 $130,800 $292,600
Fishing 669,700 55,500 725,200
Total $831,500 $186,300 $1,017,800
Resident Non-resident Total direct expenditures($ in thousands) ($ in thousands) ($ in thousands)
Note: Measured in 2007 dollars.
Source: BBC Research & Consulting, based on CDOW hunting and fishing activity data and 2006 USFWS national survey.

BBC RESEARCH & CONSULTING SECTION III, PAGE 13
Statewide Economic Impacts of Wildlife Watching Activities
Estimates for wildlife watching activities in Colorado use a slightly different methodology to the hunting and fishing estimates. Hunting and fishing figures are based on a combination of estimates of per-day expenditures from the 2006 USFWS national survey and CDOW estimates of activity days for 2007. For wildlife watching, all estimates are based on the wildlife watching sample of the 2006 USFWS national survey as CDOW does not collect activity day data for wildlife watching. All estimates provided here are for wildlife watching activities that take place at least one mile from home.
Total economic impacts. Trip and equipment expenditures that are primarily for wildlife watching activities more than one mile from home are estimated at $703 million for calendar year 2006 (the most recent year available). The secondary economic impact of these expenditures is estimated at $515 million, yielding a total estimated impact of $1.22 billion. Direct and secondary expenditures at this level are estimated to support approximately 12,800 jobs in Colorado.
Wildlife watching by Colorado residents made up about $498 million, or 41 percent of the total economic impact of wildlife watching in 2006. Non-residents watching wildlife in Colorado contributed an estimated $720 million to the Colorado economy. Exhibit III-7 shows the total economic impacts of wildlife watching in Colorado.
Exhibit III-7. Economic Impact of Wildlife Watching in Colorado, 2006
Note: Measured in 2007 dollars.
1. Trip and equipment expenditures in support of wildlife watching. 2. Direct expenditures plus secondary spending by businesses and households (multiplier effects). 3. Includes job creation from direct and secondary expenditures.
Source: BBC Research & Consulting, based on 2006 USFWS national survey.
Non-resident $417,400 $720,300 7,220
Resident 285,800 497,900 5,560
Total $703,200 $1,218,200 12,780
Direct expenditures1 Total impact2 Total3
($ in thousands) ($ in thousands) jobs
Expenditures per day. Although residents were responsible for approximately three-quarters of all wildlife watching activity days, non-residents spent considerably more per day, on average, than residents. Estimates of total activity days and daily expenditures for residents and non-residents are shown in Exhibit III-8.
Exhibit III-8. Activity Days and Daily Direct Expenditures for Wildlife Watching, 2006
Note: Per day expenditures measured in 2007 dollars.
Source: BBC Research & Consulting, based on 2006 USFWS national survey.
Non-resident 2,394 $174
Resident 7,010 $41
Total 9,404 N/A
Activity days Per day(thousands) expenditure

BBC RESEARCH & CONSULTING SECTION III, PAGE 14
People who watch wildlife and hunt or fish. Many people who watch wildlife in Colorado also hunt or fish in the state. Based on the wildlife watching sample of the 2006 USFWS survey, 12 percent of the individuals who watched wildlife in Colorado in 2006 also hunted or fished in the state in that year. Among Colorado residents, the figure was 20 percent; among non-residents the figure was 2 percent.
BBC RESEARCH & CONSULTING SECTION IV, PAGE 15
SECTION IV. County-Level Results
The hunting and fishing portion of the model also estimates the economic effects of these activities for individual counties. In absolute terms, the largest impacts on business output and employment from hunting and fishing take place in the Colorado counties with the largest populations and economies. This occurs because a large portion of the equipment expenditures occurs where hunters and anglers live. Consequently, urban areas can see large economic contributions from hunting and fishing, even though urban areas have little or no local hunting and fishing activity. Three counties in the Denver Metropolitan Area, as well as El Paso, Larimer and Boulder County, have more than 1,000 jobs supported by hunting and fishing.
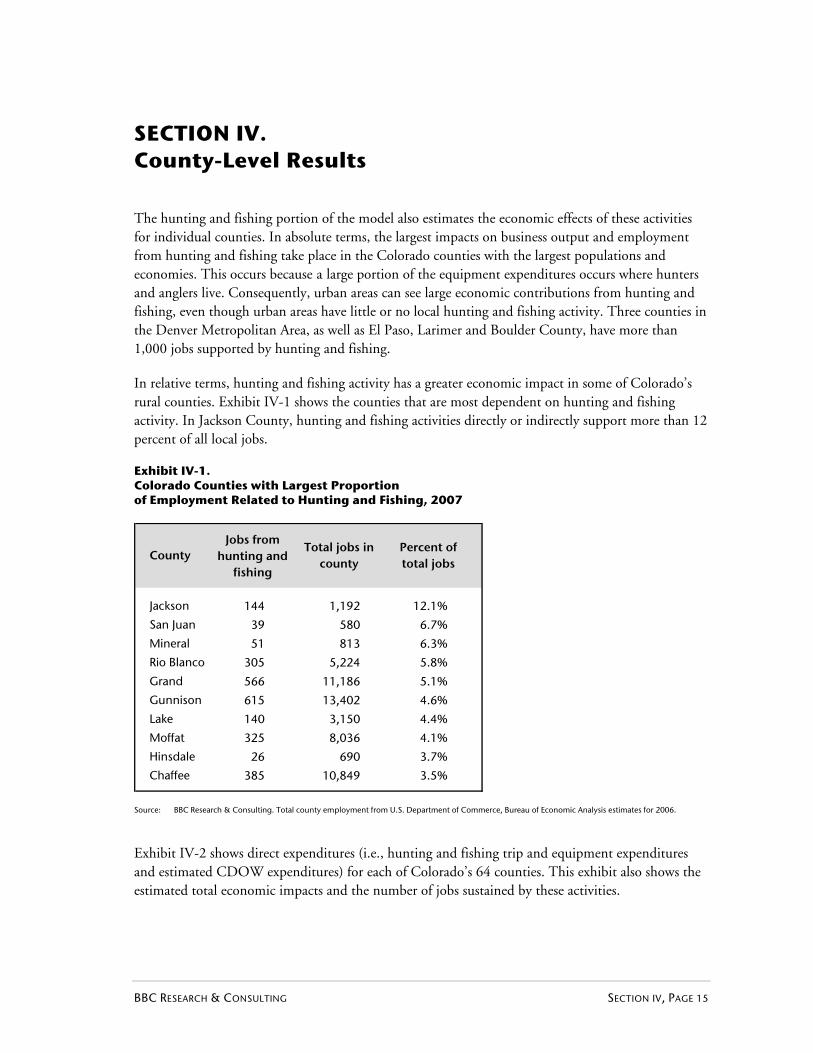
In relative terms, hunting and fishing activity has a greater economic impact in some of Colorado’s rural counties. Exhibit IV-1 shows the counties that are most dependent on hunting and fishing activity. In Jackson County, hunting and fishing activities directly or indirectly support more than 12 percent of all local jobs.
Exhibit IV-1. Colorado Counties with Largest Proportion of Employment Related to Hunting and Fishing, 2007
Jackson 144 1,192 12.1%
San Juan 39 580 6.7%
Mineral 51 813 6.3%
Rio Blanco 305 5,224 5.8%
Grand 566 11,186 5.1%
Gunnison 615 13,402 4.6%
Lake 140 3,150 4.4%
Moffat 325 8,036 4.1%
Hinsdale 26 690 3.7%
Chaffee 385 10,849 3.5%
Total jobs in county
CountyPercent of total jobs
Jobs from hunting and
fishing
Source: BBC Research & Consulting. Total county employment from U.S. Department of Commerce, Bureau of Economic Analysis estimates for 2006.
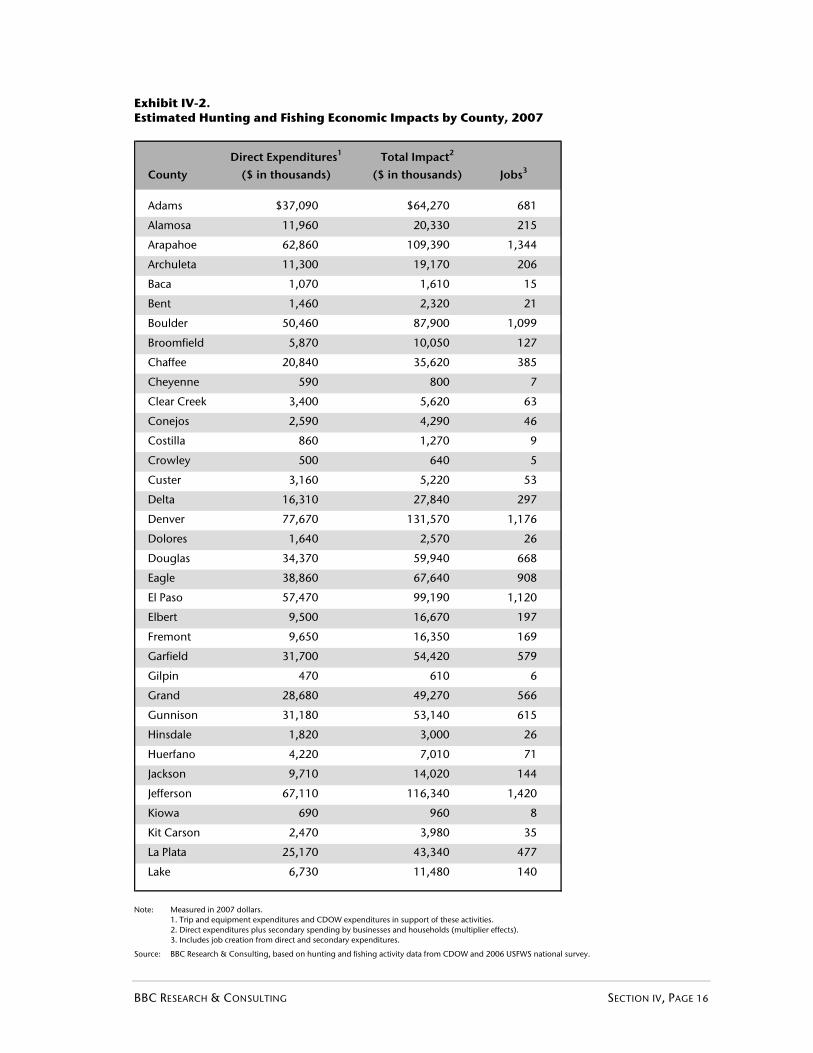
Exhibit IV-2 shows direct expenditures (i.e., hunting and fishing trip and equipment expenditures and estimated CDOW expenditures) for each of Colorado’s 64 counties. This exhibit also shows the estimated total economic impacts and the number of jobs sustained by these activities.
BBC RESEARCH & CONSULTING SECTION IV, PAGE 16
Exhibit IV-2. Estimated Hunting and Fishing Economic Impacts by County, 2007
County
Adams $37,090 $64,270 681
Alamosa 11,960 20,330 215
Arapahoe 62,860 109,390 1,344
Archuleta 11,300 19,170 206
Baca 1,070 1,610 15
Bent 1,460 2,320 21
Boulder 50,460 87,900 1,099
Broomfield 5,870 10,050 127
Chaffee 20,840 35,620 385
Cheyenne 590 800 7
Clear Creek 3,400 5,620 63
Conejos 2,590 4,290 46
Costilla 860 1,270 9
Crowley 500 640 5
Custer 3,160 5,220 53
Delta 16,310 27,840 297
Denver 77,670 131,570 1,176
Dolores 1,640 2,570 26
Douglas 34,370 59,940 668
Eagle 38,860 67,640 908
El Paso 57,470 99,190 1,120
Elbert 9,500 16,670 197
Fremont 9,650 16,350 169
Garfield 31,700 54,420 579
Gilpin 470 610 6
Grand 28,680 49,270 566
Gunnison 31,180 53,140 615
Hinsdale 1,820 3,000 26
Huerfano 4,220 7,010 71
Jackson 9,710 14,020 144
Jefferson 67,110 116,340 1,420
Kiowa 690 960 8
Kit Carson 2,470 3,980 35
La Plata 25,170 43,340 477
Lake 6,730 11,480 140
Direct Expenditures1 Total Impact2
($ in thousands)($ in thousands) Jobs3
Note: Measured in 2007 dollars.
1. Trip and equipment expenditures and CDOW expenditures in support of these activities. 2. Direct expenditures plus secondary spending by businesses and households (multiplier effects). 3. Includes job creation from direct and secondary expenditures.
Source: BBC Research & Consulting, based on hunting and fishing activity data from CDOW and 2006 USFWS national survey.

BBC RESEARCH & CONSULTING SECTION IV, PAGE 17
Exhibit IV-2 (Continued). Estimated Hunting and Fishing Economic Impacts by County, 2007
County
Larimer $89,070 $154,830 1,739
Las Animas 6,800 11,470 118
Lincoln 1,940 3,090 26
Logan 7,470 12,620 134
Mesa 43,980 76,100 813
Mineral 2,660 4,430 51
Moffat 18,450 31,170 325
Montezuma 12,230 20,790 221
Montrose 17,150 29,180 320
Morgan 3,940 6,540 52
Otero 3,090 5,020 54
Ouray 2,110 3,440 37
Park 10,450 17,790 207
Phillips 990 1,500 11
Pitkin 14,250 24,850 327
Prowers 3,350 5,500 53
Pueblo 38,270 65,990 697
Rio Blanco 17,890 30,040 305
Rio Grande 7,880 13,350 136
Routt 27,980 45,630 528
Saguache 2,280 3,350 23
San Juan 2,390 3,970 39
San Miguel 10,090 17,380 227
Sedgwick 1,190 1,850 14
Summit 29,710 51,800 708
Teller 5,330 8,960 107
Washington 1,050 1,600 11
Weld 22,480 39,210 372
Yuma 2,410 4,020 34
Total $1,076,310 $1,843,310 20,614
Jobs3
Direct Expenditures1 Total Impact2
($ in thousands) ($ in thousands)
Note: Measured in 2007 dollars. Values may not sum due to rounding.
1. Trip and equipment expenditures and CDOW expenditures in support of these activities. 2. Direct expenditures plus secondary spending by businesses and households (multiplier effects). 3. Includes job creation from direct and secondary expenditures.
Source: BBC Research & Consulting, based on hunting and fishing activity data from CDOW and 2006 USFWS national survey.

BBC RESEARCH & CONSULTING SECTION IV, PAGE 18
Exhibit IV-3 provides additional detail regarding the county-level economic impacts of hunting and fishing. In this exhibit, total economic impacts are shown in five categories: resident and non-resident hunting impacts, resident and non-resident fishing impacts, and impacts from expenditures by CDOW.
Exhibit IV-3. Economic Impacts by County, Activity and Residence, 2007
County
Adams $6,540 $2,220 $53,630 $1,660 $220 $64,270
Alamosa 2,490 4,490 7,250 5,320 790 20,330
Arapahoe 19,950 4,750 79,260 5,210 210 109,390
Archuleta 2,670 9,040 4,720 1,840 890 19,170
Baca 370 240 790 40 160 1,610
Bent 270 110 1,540 20 380 2,320
Boulder 16,280 2,410 66,610 2,460 140 87,900
Broomfield 2,000 280 7,420 260 90 10,050
Chaffee 3,970 2,910 25,600 2,240 900 35,620
Cheyenne 290 160 170 10 170 800
Clear Creek 880 410 4,100 150 80 5,620
Conejos 480 120 1,760 1,480 460 4,290
Costilla 180 220 410 20 440 1,270
Crowley 160 40 270 10 160 640
Custer 600 630 3,180 390 410 5,220
Delta 3,360 7,990 14,980 1,220 300 27,840
Denver 13,450 7,860 76,740 9,370 24,150 131,570
Dolores 300 1,560 490 130 90 2,570
Douglas 6,690 1,400 48,430 3,300 120 59,940
Eagle 18,840 9,820 35,670 3,150 160 67,640
El Paso 14,840 4,420 72,820 4,830 2,270 99,190
Elbert 2,600 1,060 11,500 760 750 16,670
Fremont 1,850 940 12,370 320 880 16,350
Garfield 8,430 16,390 24,670 1,230 3,700 54,420
Gilpin 330 110 80 0 70 610
Grand 7,220 6,690 32,490 1,680 1,190 49,270
Gunnison 7,230 12,270 25,550 7,200 890 53,140
Hinsdale 280 210 1,070 660 780 3,000
Huerfano 860 1,220 4,050 350 530 7,010
Jackson 1,660 4,350 6,690 600 730 14,020
Jefferson 18,950 3,670 89,200 4,250 260 116,340
Kiowa 200 110 460 30 160 960
Kit Carson 720 300 2,180 70 710 3,980
La Plata 5,780 9,510 19,010 6,050 2,980 43,340
Lake 1,970 940 7,770 720 80 11,480
Hunting ($ in thousands)
Resident Non-Resident ($ in thousands)
Total Impact
($ in thousands)
Fishing ($ in thousands) CDOW1
Non-ResidentResident
Note: Measured in 2007 dollars.
Total economic impacts include direct expenditures plus secondary spending by business and households (multiplier effects).
1. Total impacts from CDOW in support of hunting and fishing.
Source: BBC Research & Consulting, based on hunting and fishing activity data from CDOW and 2006 USFWS national survey.

BBC RESEARCH & CONSULTING SECTION IV, PAGE 19
Exhibit IV-3 (continued). Economic Impacts by County, Activity and Residence, 2007
County
Larimer $20,580 $5,900 $117,430 $4,090 $6,820 $154,830
Las Animas 930 1,340 8,020 670 510 11,470
Lincoln 570 230 1,490 60 750 3,090
Logan 1,820 310 9,890 80 520 12,620
Mesa 9,790 10,410 51,060 2,110 2,720 76,100
Mineral 760 600 1,710 1,020 340 4,430
Moffat 6,190 16,650 6,570 490 1,280 31,170
Montezuma 2,380 5,860 9,100 2,570 890 20,790
Montrose 3,680 7,830 14,390 2,500 790 29,180
Morgan 1,290 360 3,010 170 1,710 6,540
Otero 1,020 380 3,290 160 170 5,020
Ouray 410 690 1,930 180 240 3,440
Park 2,310 1,150 13,710 520 90 17,790
Phillips 290 110 560 30 510 1,500
Pitkin 6,350 2,040 13,640 2,150 670 24,850
Prowers 1,010 290 3,330 160 710 5,500
Pueblo 5,400 1,670 55,860 1,770 1,280 65,990
Rio Blanco 4,870 20,970 2,670 350 1,180 30,040
Rio Grande 1,360 1,680 5,050 3,750 1,510 13,350
Routt 8,380 14,190 19,560 2,710 780 45,630
Saguache 630 880 640 50 1,150 3,350
San Juan 570 800 1,690 140 780 3,970
San Miguel 4,410 4,280 7,710 730 250 17,380
Sedgwick 420 100 800 20 510 1,850
Summit 12,730 1,480 34,830 2,050 720 51,800
Teller 1,780 530 6,420 130 90 8,960
Washington 240 90 730 30 510 1,600
Weld 7,130 1,460 23,080 860 6,680 39,210
Yuma 1,010 240 1,640 70 1,050 4,020
Total $281,000 $221,370 $1,162,740 $96,650 $81,510 $1,843,310
($ in thousands) ($ in thousands)Resident Non-Resident Resident Non-ResidentHunting ($ in thousands) Fishing ($ in thousands) CDOW1 Total Impact
Note: Measured in 2007 dollars.
Total economic impacts include direct expenditures plus secondary spending by business and households (multiplier effects).
1. Total impacts from CDOW support of hunting and fishing.
Source: BBC Research & Consulting, based on hunting and fishing activity data from CDOW and 2006 USFWS national survey.

BBC RESEARCH & CONSULTING SECTION V, PAGE 20
SECTION V. Comparison with Previous Impact Estimates
When updating an economic impact model, it is informative to compare the results of the new model and most recent information with prior economic impact estimates. CDOW updated the original model estimates in 1997 using 1996 data and BBC updated the model in 2004 using 2002 data. As there were substantial methodological changes made to the model after 1997, comparisons are only made here between the 2002 and 2007 estimates.
Comparison with 2002 results. Exhibit V-1 compares the direct expenditures and total economic impact for the 2007 hunting and fishing season with estimates for the 2002 hunting and fishing seasons. After adjusting for inflation, both the total direct expenditure on hunting and fishing and the total economic impact of these activities in Colorado increased from 2002 to 2007.
Exhibit V-1. Comparison of Hunting and Fishing Expenditures and Impacts, 2002 and 2007
Big game hunting $276,300 $235,700 $491,500 $403,700
Small game hunting 93,000 56,900 168,000 98,700
Fishing 501,000 725,200 896,000 1,259,400
CDOW expenditures 53,400 58,600 99,700 81,500
Total $923,700 $1,076,300 $1,655,200 $1,843,300
2002 2007
Total Impact2 Direct Expenditures1
($ in thousands) ($ in thousands)
2002 2007
Note: Measured in 2007 dollars.
1. Trip and equipment expenditures and CDOW expenditures in support of these activities. 2. Direct expenditures plus secondary spending by businesses and households (multiplier effects). Source: BBC Research & Consulting, based on CDOW data and USFWS national surveys.
The year of the last update, 2002, was recognized to be a poor year for hunting and fishing in Colorado due to a number of factors, such as drought and wildfires. The increased economic impact of hunting and fishing in 2007 can partly be explained by an increase in total activity days, particularly for fishing. There were a total of 10.5 million fishing activity days in 2007, compared to 8.05 million in 2002. Big game activity days also increased between these two periods, although small game activity days declined. Exhibit V-2 compares the total activity days for 2002 and 2007.

BBC RESEARCH & CONSULTING SECTION V, PAGE 21
Exhibit V-2. Hunting and Fishing Activity Days, 2002 and 2007
Source: BBC Research & Consulting, based on CDOW data.
Big game hunting 1,421 1,607
Small game hunting 672 605
Fishing 8,054 10,466
Total 10,147 12,672
2002 2007
Total activity days
(in thousands)
Despite the overall increase in activity days, the total number of non-resident activity days has declined between 2002 and 2007. As non-residents tend to spend more per day than residents, this has resulted in the increase in direct expenditures and total impacts being small relative to the increase in total activity days. Between 2002 and 2007, hunting and fishing direct expenditures increased by approximately 17 percent, while total activity days increased by approximately 25 percent.
Exhibit V-3 compares the per-day expenditures for hunting and fishing in 2002 and 2007. Although the figures for Colorado residents are broadly similar for both years, average hunting expenditures per day have declined for non-residents while average per-day fishing expenditures for non-residents have increased. Note that methodological differences between the two study periods may account for some of the differences in expenditures and that sample sizes in the 2006 USFWS national survey for some non-resident activities were small.
Exhibit V-3. Per-day Expenditures, 2002 and 2007
Big game hunting $112 $106 $351 $216
Small game hunting $124 $94 $201 $87
Fishing $60 $67 $68 $118
20072002 2007 2002
$ per day$ per dayResident Non-resident
Note: Measured in 2007 dollars.
Source: BBC Research & Consulting from 2001 and 2006 USFWS national surveys.
The estimated total number of jobs supported by hunting and fishing is roughly the same in 2007 as in 2002. At the county level, the individual counties with the highest percentage of jobs supported by hunting and fishing are largely the same. Of the ten counties with the highest percentage of jobs supported by hunting and fishing in 2002, nine are also in the top ten in 2007.
Wildlife watching. Exhibit V-4 on the next page compares the economic impact of wildlife watching in 2001 and 2006. After adjusting for inflation, both direct expenditures and the total impact of wildlife watching were greater in 2006 than in 2001. In both years, non-residents spent more money and had a greater economic impact than residents. Wildlife watching supported a similar number of jobs in 2006 and 2001.

BBC RESEARCH & CONSULTING SECTION V, PAGE 22
Exhibit V-4. Comparison of Wildlife Watching Expenditures and Impacts, 2001 and 2006
Resident $184,700 $285,800 $336,800 $497,900
Non-resident 390,700 417,400 690,800 720,300
Total $575,400 $703,200 $1,027,600 $1,218,200
2001 2006 2001 2006
Total Impact1Direct Expenditures
($ in thousands) ($ in thousands)
Note: Measured in 2007 dollars.
1. Direct expenditures plus secondary spending by businesses and households (multiplier effects).
Source: BBC Research & Consulting from 2001 and 2006 USFWS national surveys.
Comparability of models. Slight methodological differences between model years may also contribute to changes in estimates of economic impacts. In addition, BBC model results are primarily based on estimates derived from surveys, including the national U.S. Fish and Wildlife Service survey. Due to this being a nationwide survey, samples sizes specific to Colorado in some categories were small, requiring BBC to use alternative methods for estimating expenditures.
For these reasons, caution should be used when making comparisons between years, particularly for individual categories (such as small game hunting and non-resident activities) where the total number of activity days is small.