Embed Size (px)
Citation preview
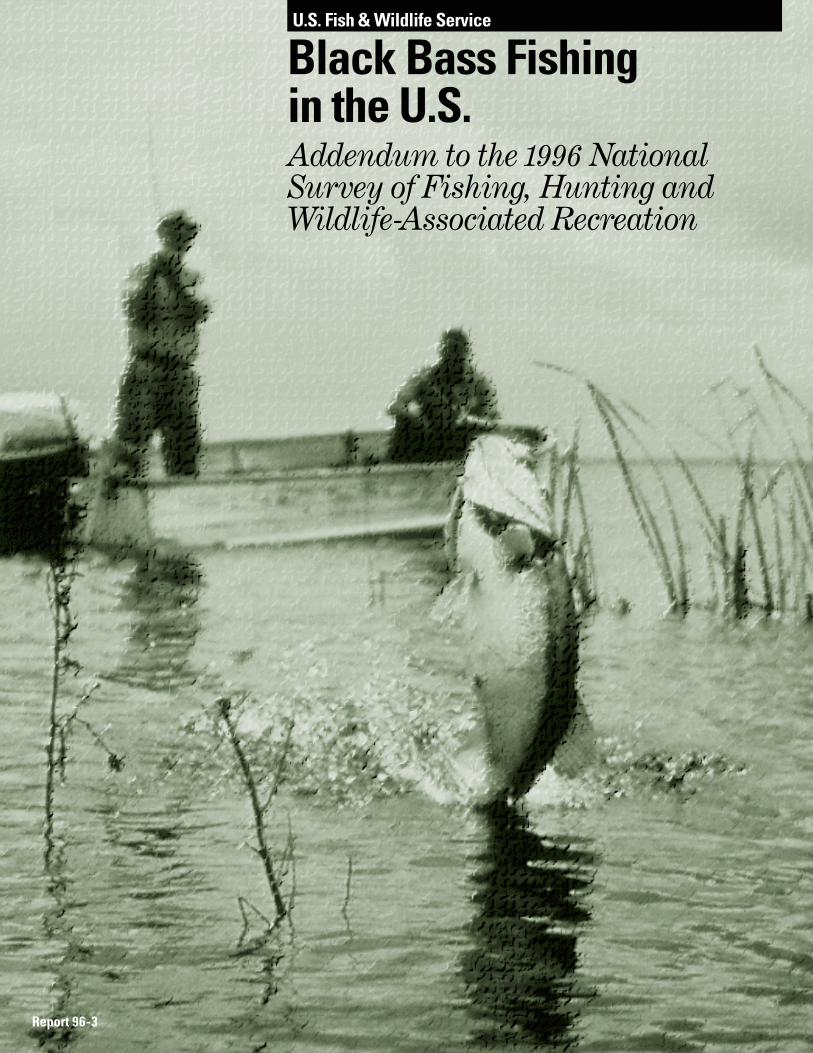
Black Bass Fishing in the U.S.Addendum to the 1996 National Survey of Fishing, Hunting andWildlife-Associated Recreation
U.S. Fish & Wildlife Service
Report 96-3

Black Bass Fishing in the U.S.Addendum to the 1996 National Survey of Fishing, Hunting andWildlife-Associated RecreationReport 96-3
March 1999Revised September 1999
Genevieve PullisDivision of Federal AidU.S. Fish and Wildlife ServiceWashington, D.C.
and
Andrew LaughlandDivision of EconomicsU.S. Fish and Wildlife ServiceWashington, D.C.
Division of Federal AidU.S. Fish and Wildlife ServiceWashington, D.C. 20240Director, Jamie ClarkChief, Division of Federal Aid, Bob Lange
This report is intended to complement the National and State reports from the1996 National survey of Fishing, Hunting, and Wildlife-Associated Recreation. The conclusions are the authors’ and do not represent official positions of the U.S. Fish and Wildlife Service.
Front Cover — USFWS photo
U.S. Fish & Wildlife Service
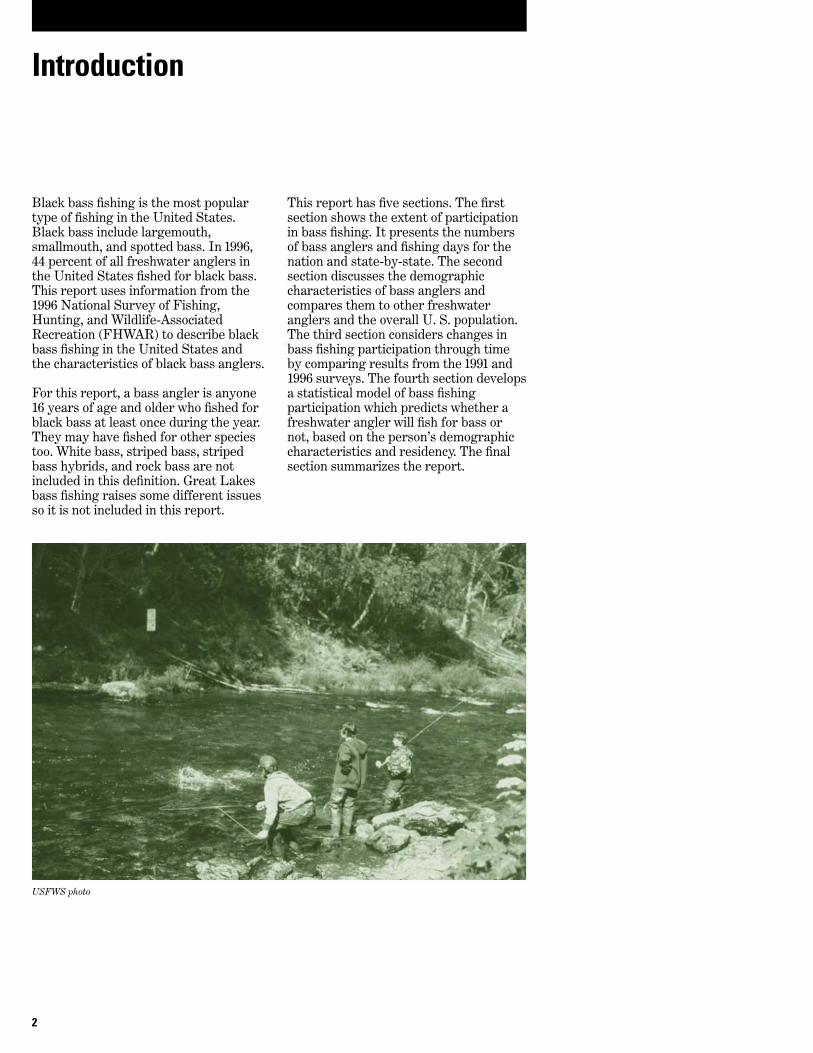
Black bass fishing is the most populartype of fishing in the United States.Black bass include largemouth,smallmouth, and spotted bass. In 1996, 44 percent of all freshwater anglers inthe United States fished for black bass.This report uses information from the1996 National Survey of Fishing,Hunting, and Wildlife-AssociatedRecreation (FHWAR) to describe blackbass fishing in the United States and the characteristics of black bass anglers.
For this report, a bass angler is anyone16 years of age and older who fished forblack bass at least once during the year.They may have fished for other speciestoo. White bass, striped bass, stripedbass hybrids, and rock bass are notincluded in this definition. Great Lakesbass fishing raises some different issuesso it is not included in this report.
This report has five sections. The firstsection shows the extent of participationin bass fishing. It presents the numbersof bass anglers and fishing days for thenation and state-by-state. The secondsection discusses the demographiccharacteristics of bass anglers andcompares them to other freshwateranglers and the overall U. S. population.The third section considers changes inbass fishing participation through timeby comparing results from the 1991 and1996 surveys. The fourth section developsa statistical model of bass fishingparticipation which predicts whether afreshwater angler will fish for bass ornot, based on the person’s demographiccharacteristics and residency. The finalsection summarizes the report.
2
Introduction
USFWS photo
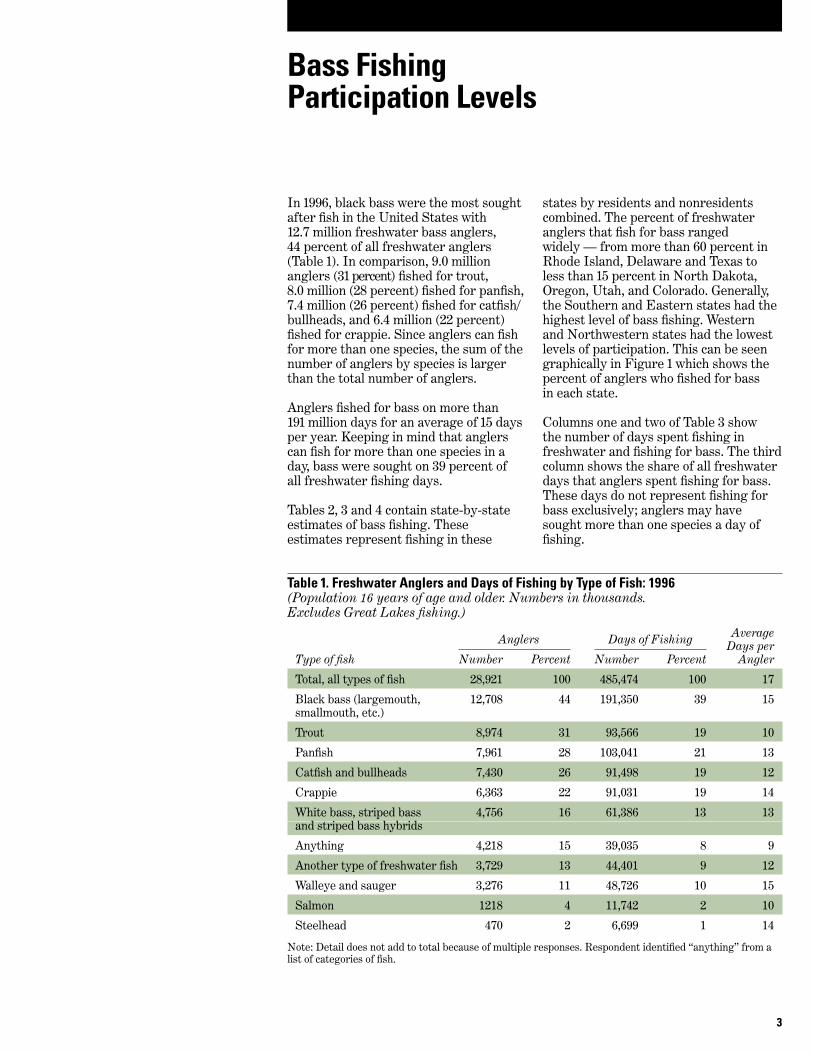
In 1996, black bass were the most soughtafter fish in the United States with12.7 million freshwater bass anglers, 44 percent of all freshwater anglers(Table 1). In comparison, 9.0 millionanglers (31 percent) fished for trout, 8.0 million (28 percent) fished for panfish, 7.4 million (26 percent) fished for catfish/bullheads, and 6.4 million (22 percent)fished for crappie. Since anglers can fishfor more than one species, the sum of thenumber of anglers by species is largerthan the total number of anglers.
Anglers fished for bass on more than191 million days for an average of 15 daysper year. Keeping in mind that anglerscan fish for more than one species in aday, bass were sought on 39 percent of all freshwater fishing days.
Tables 2, 3 and 4 contain state-by-stateestimates of bass fishing. Theseestimates represent fishing in these
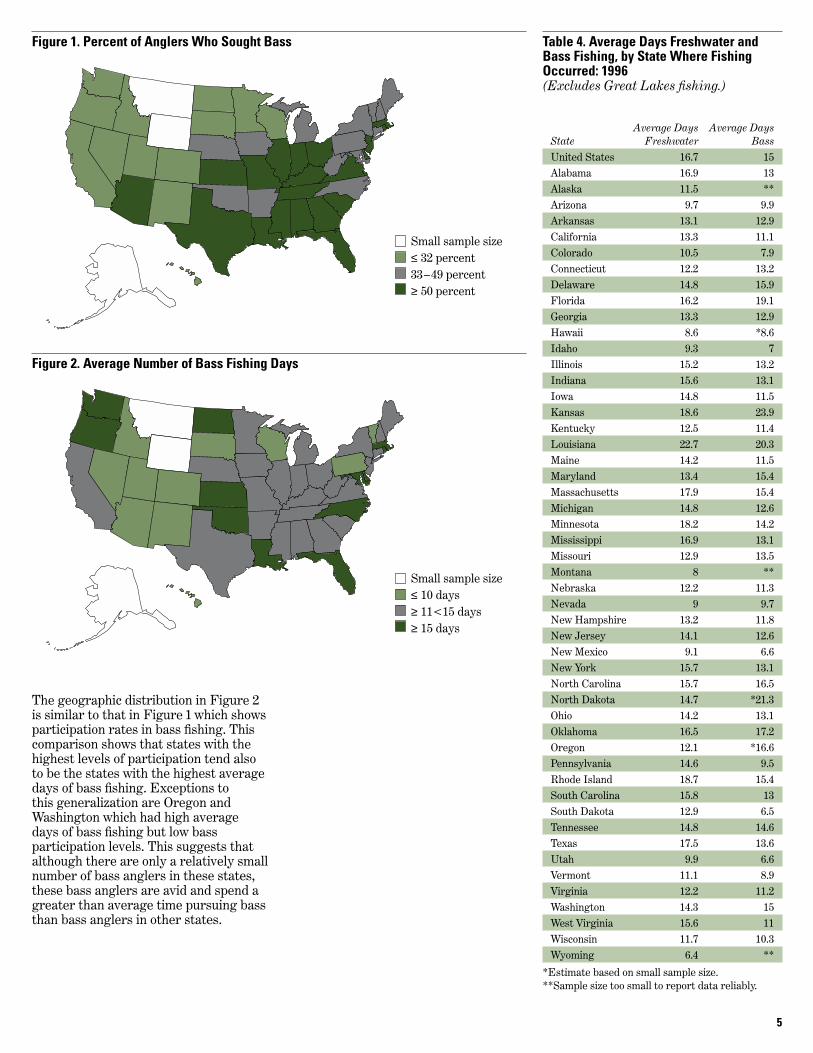
states by residents and nonresidentscombined. The percent of freshwateranglers that fish for bass rangedwidely — from more than 60 percent inRhode Island, Delaware and Texas toless than 15 percent in North Dakota,Oregon, Utah, and Colorado. Generally,the Southern and Eastern states had thehighest level of bass fishing. Western and Northwestern states had the lowestlevels of participation. This can be seengraphically in Figure 1 which shows thepercent of anglers who fished for bass in each state.
Columns one and two of Table 3 show the number of days spent fishing infreshwater and fishing for bass. The thirdcolumn shows the share of all freshwaterdays that anglers spent fishing for bass.These days do not represent fishing forbass exclusively; anglers may havesought more than one species a day offishing.
3
Bass Fishing Participation Levels
Table 1. Freshwater Anglers and Days of Fishing by Type of Fish: 1996(Population 16 years of age and older. Numbers in thousands. Excludes Great Lakes fishing.)
Average Anglers Days of Fishing Days perType of fish Number Percent Number Percent Angler
Total, all types of fish 28,921 100 485,474 100 17
Black bass (largemouth, 12,708 44 191,350 39 15smallmouth, etc.)
Trout 8,974 31 93,566 19 10
Panfish 7,961 28 103,041 21 13
Catfish and bullheads 7,430 26 91,498 19 12
Crappie 6,363 22 91,031 19 14
White bass, striped bass 4,756 16 61,386 13 13and striped bass hybrids
Anything 4,218 15 39,035 8 9
Another type of freshwater fish 3,729 13 44,401 9 12
Walleye and sauger 3,276 11 48,726 10 15
Salmon 1218 4 11,742 2 10
Steelhead 470 2 6,699 1 14
Note: Detail does not add to total because of multiple responses. Respondent identified “anything” from alist of categories of fish.

The pattern of days of bass fishing issimilar to angler participation; Easternparticipants spend a greater share offreshwater fishing days bass fishing thanWestern participants. Notable exceptionsto this pattern are Pennsylvania, Iowa,and Mississippi which have higher (45percent or over ) bass participation ratesbut relatively lower levels (less than 40percent) of freshwater days fishing forbass. This suggests that bass anglers inthese states fished fewer days than otheranglers or fewer days for bass than bassanglers in other states. That is, althoughmany people fish for bass in these states,they spend relatively more time pursuingother species.
Table 4 shows the average number ofdays freshwater and bass fishing bystate. Nationally, anglers averaged17 days of freshwater fishing and 15 daysof bass fishing. The majority of stateshad a lower average number of days bass fishing than all freshwater fishing.Eleven states however, had slightlyhigher than average days of fishing forbass than for all freshwater fish. This is noteworthy considering that a bassfishing day is also a freshwater fishingday. However, it can be explained by thefact that many avid anglers in thesestates fished exclusively for bass on manyof their fishing days. This, combined withthe fact that some freshwater anglers didnot fish for bass at all, explains how theaverage days of bass fishing can begreater than the average days of allfreshwater fishing.
The average number of days anglersspent fishing for bass, by state, is showngraphically in Figure 2. Several stateshave no marking in them. The samplesize for these states was less than 30 sotheir average days are not judgedreliable enough to include in this figure.The lightly shaded areas show stateswhere the average number of bass fishing days is less than or equal to ten.States with moderate shading indicateaverage days greater than or equal to11 but less than 15. The heavily shadedstates are states where the average daysof bass fishing are equal to or greaterthan fifteen.
4
Table 2. Freshwater and Black BassAnglers, by State Where FishingOccurred: 1996(Population 16 years of age and older.Numbers in thousands. Excludes GreatLakes fishing.)
Freshwater Bass Anglers
State Anglers Number PercentUnited States 28,921 12,708 44Alabama 843 454 54Alaska 313 ** **Arizona 483 247 51Arkansas 739 335 45California 2,175 652 30Colorado 787 84 11Connecticut 318 131 41Delaware 66 43 65Florida 1,137 663 58Georgia 967 496 51Hawaii 22 *7 *32Idaho 474 73 15Illinois 1,123 602 54Indiana 863 505 59Iowa 477 218 46Kansas 341 188 55Kentucky 772 405 52Louisiana 815 409 50Maine 290 117 40Maryland 319 146 46Massachusetts 377 228 60Michigan 1,311 494 38Minnesota 1,421 428 30Mississippi 487 246 51Missouri 1,138 620 54Montana 329 ** **Nebraska 247 91 37Nevada 219 52 24New Hampshire 237 114 48New Jersey 428 240 56New Mexico 312 73 23New York 1,111 548 49North Carolina 1,009 495 49North Dakota 90 *6 *6.7Ohio 908 480 53Oklahoma 891 325 36Oregon 589 *73 *12Pennsylvania 1,277 576 45Rhode Island 72 49 68South Carolina 716 407 57South Dakota 213 49 23Tennessee 767 399 52Texas 2,147 1,315 61Utah 397 *46 *12Vermont 176 66 38Virginia 761 446 59Washington 768 150 20West Virginia 323 151 47Wisconsin 1,232 372 30Wyoming 379 ** **
*Estimate based on small sample size.**Sample size too small to report data reliably.
Table 3. Days Freshwater and Black Bass Fishing, by State WhereFishing Occurred: 1996(Numbers in thousands. Excludes GreatLakes fishing.)
Days of
Days FishingBass Fishing
State in Freshwater Number PercentUnited States 485,474 191,350 39Alabama 14,256 5,906 41Alaska 3,602 ** **Arizona 4,689 2,440 52Arkansas 9,661 4,275 44California 28,987 7,162 25Colorado 8,232 661 8Connecticut 3,880 1,724 44Delaware 980 678 69Florida 18,409 12,647 69Georgia 12,857 6,359 49Hawaii 189 *58 *31Idaho 4,411 498 11Illinois 17,089 7,964 47Indiana 13,456 6,567 49Iowa 7,062 2,455 35Kansas 6,355 4,442 70Kentucky 9,631 4,633 48Louisiana 18,493 8,276 45Maine 4,107 1,351 33Maryland 4,290 2,247 52Massachusetts 6,746 3,524 52Michigan 19,456 6,244 32Minnesota 25,897 6,077 23Mississippi 8,213 3,197 39Missouri 14,682 8,368 57Montana 2,617 ** **Nebraska 3,004 1,025 34Nevada 1,976 492 25New Hampshire 3,139 1,352 43New Jersey 6,021 3,018 50New Mexico 2,836 482 17New York 17,412 7,051 40North Carolina 15,831 8,013 51North Dakota 1,321 *131 *10Ohio 12,878 6,237 48Oklahoma 14,674 5,546 38Oregon 7,117 *1,212 *17Pennsylvania 18,635 5,444 29Rhode Island 1,347 755 56South Carolina 11,341 5,256 46South Dakota 2,748 316 11Tennessee 11,317 5,787 51Texas 37,575 17,913 48Utah 3,936 *301 *8Vermont 1,951 583 30Virginia 9,282 5,006 54Washington 10,975 2,122 19West Virginia 5,040 1,624 32Wisconsin 14,398 3,733 26Wyoming 2,415 ** **
*Estimate based on small sample size.**Sample size too small to report data reliably.
5
Figure 1. Percent of Anglers Who Sought Bass
Small sample size≤ 32 percent33–49 percent≥ 50 percent
Figure 2. Average Number of Bass Fishing Days
Small sample size≤ 10 days≥ 11<15 days≥ 15 days
Table 4. Average Days Freshwater andBass Fishing, by State Where FishingOccurred: 1996(Excludes Great Lakes fishing.)
Average Days Average DaysState Freshwater BassUnited States 16.7 15Alabama 16.9 13Alaska 11.5 **Arizona 9.7 9.9Arkansas 13.1 12.9California 13.3 11.1Colorado 10.5 7.9Connecticut 12.2 13.2Delaware 14.8 15.9Florida 16.2 19.1Georgia 13.3 12.9Hawaii 8.6 *8.6Idaho 9.3 7Illinois 15.2 13.2Indiana 15.6 13.1Iowa 14.8 11.5Kansas 18.6 23.9Kentucky 12.5 11.4Louisiana 22.7 20.3Maine 14.2 11.5Maryland 13.4 15.4Massachusetts 17.9 15.4Michigan 14.8 12.6Minnesota 18.2 14.2Mississippi 16.9 13.1Missouri 12.9 13.5Montana 8 **Nebraska 12.2 11.3Nevada 9 9.7New Hampshire 13.2 11.8New Jersey 14.1 12.6New Mexico 9.1 6.6New York 15.7 13.1North Carolina 15.7 16.5North Dakota 14.7 *21.3Ohio 14.2 13.1Oklahoma 16.5 17.2Oregon 12.1 *16.6Pennsylvania 14.6 9.5Rhode Island 18.7 15.4South Carolina 15.8 13South Dakota 12.9 6.5Tennessee 14.8 14.6Texas 17.5 13.6Utah 9.9 6.6Vermont 11.1 8.9Virginia 12.2 11.2Washington 14.3 15West Virginia 15.6 11Wisconsin 11.7 10.3Wyoming 6.4 **
*Estimate based on small sample size.**Sample size too small to report data reliably.
The geographic distribution in Figure 2is similar to that in Figure 1 which showsparticipation rates in bass fishing. Thiscomparison shows that states with thehighest levels of participation tend also to be the states with the highest averagedays of bass fishing. Exceptions to this generalization are Oregon andWashington which had high average days of bass fishing but low bassparticipation levels. This suggests thatalthough there are only a relatively smallnumber of bass anglers in these states,these bass anglers are avid and spend agreater than average time pursuing bassthan bass anglers in other states.
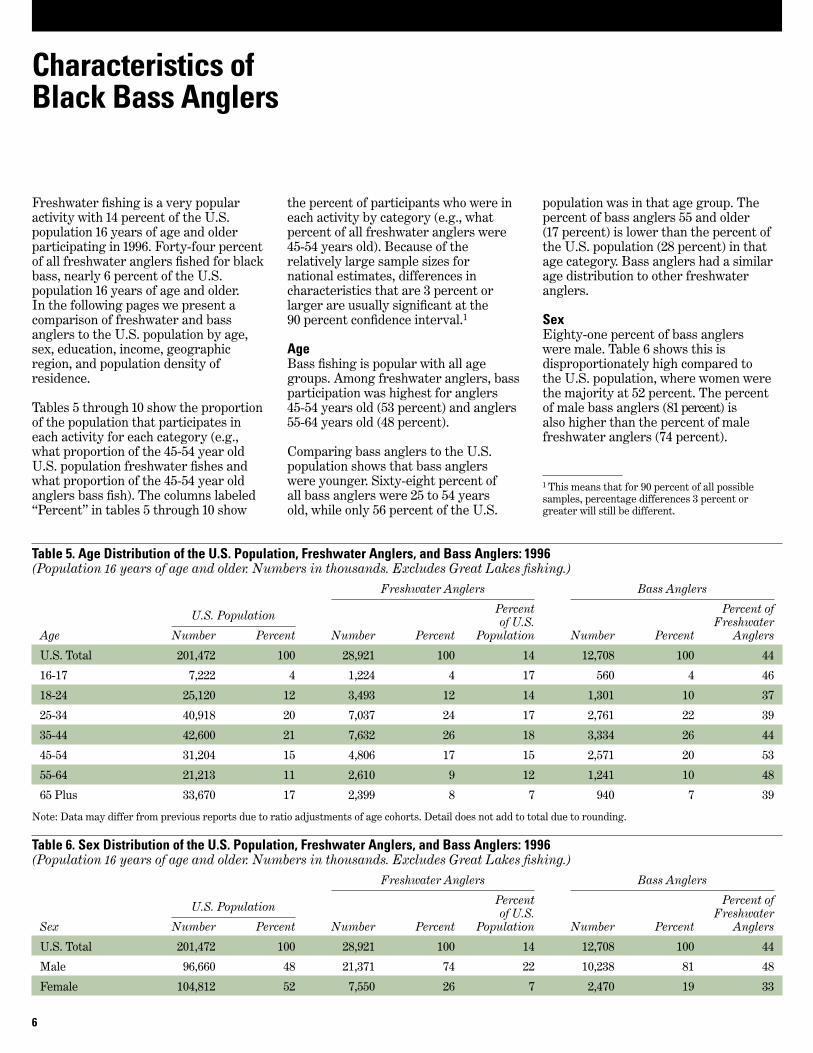
Freshwater fishing is a very popularactivity with 14 percent of the U.S.population 16 years of age and olderparticipating in 1996. Forty-four percentof all freshwater anglers fished for blackbass, nearly 6 percent of the U.S.population 16 years of age and older. In the following pages we present acomparison of freshwater and bassanglers to the U.S. population by age,sex, education, income, geographicregion, and population density ofresidence.
Tables 5 through 10 show the proportionof the population that participates ineach activity for each category (e.g.,what proportion of the 45-54 year oldU.S. population freshwater fishes andwhat proportion of the 45-54 year oldanglers bass fish). The columns labeled“Percent” in tables 5 through 10 show
the percent of participants who were ineach activity by category (e.g., whatpercent of all freshwater anglers were45-54 years old). Because of therelatively large sample sizes fornational estimates, differences incharacteristics that are 3 percent orlarger are usually significant at the90 percent confidence interval.1
AgeBass fishing is popular with all agegroups. Among freshwater anglers, bassparticipation was highest for anglers45-54 years old (53 percent) and anglers55-64 years old (48 percent).
Comparing bass anglers to the U.S.population shows that bass anglerswere younger. Sixty-eight percent of all bass anglers were 25 to 54 years old, while only 56 percent of the U.S.
population was in that age group. Thepercent of bass anglers 55 and older (17 percent) is lower than the percent ofthe U.S. population (28 percent) in thatage category. Bass anglers had a similarage distribution to other freshwateranglers.
SexEighty-one percent of bass anglers were male. Table 6 shows this isdisproportionately high compared to the U.S. population, where women werethe majority at 52 percent. The percentof male bass anglers (81 percent) is also higher than the percent of malefreshwater anglers (74 percent).
6
Characteristics of Black Bass Anglers
Table 5. Age Distribution of the U.S. Population, Freshwater Anglers, and Bass Anglers: 1996(Population 16 years of age and older. Numbers in thousands. Excludes Great Lakes fishing.)
Freshwater Anglers Bass Anglers
U.S. Population Percent Percent of of U.S. Freshwater
Age Number Percent Number Percent Population Number Percent Anglers
U.S. Total 201,472 100 28,921 100 14 12,708 100 44
16-17 7,222 4 1,224 4 17 560 4 46
18-24 25,120 12 3,493 12 14 1,301 10 37
25-34 40,918 20 7,037 24 17 2,761 22 39
35-44 42,600 21 7,632 26 18 3,334 26 44
45-54 31,204 15 4,806 17 15 2,571 20 53
55-64 21,213 11 2,610 9 12 1,241 10 48
65 Plus 33,670 17 2,399 8 7 940 7 39
Note: Data may differ from previous reports due to ratio adjustments of age cohorts. Detail does not add to total due to rounding.
Table 6. Sex Distribution of the U.S. Population, Freshwater Anglers, and Bass Anglers: 1996(Population 16 years of age and older. Numbers in thousands. Excludes Great Lakes fishing.)
Freshwater Anglers Bass Anglers
U.S. Population Percent Percent of of U.S. Freshwater
Sex Number Percent Number Percent Population Number Percent Anglers
U.S. Total 201,472 100 28,921 100 14 12,708 100 44
Male 96,660 48 21,371 74 22 10,238 81 48
Female 104,812 52 7,550 26 7 2,470 19 33
1 This means that for 90 percent of all possiblesamples, percentage differences 3 percent orgreater will still be different.
While many females 16 years of age andolder participated in freshwater fishing(7.5 million), this was only 7 percent ofthe female population in the U.S. Incomparison, 22 percent of the U.S. malepopulation 16 years of age and olderparticipated in freshwater fishing. Inaddition, female anglers were less likelyto participate in bass fishing than maleanglers. Female freshwater anglersparticipated in bass fishing at a rate of 33 percent while male freshwater anglersparticipated at a rate of 48 percent. As aresult, women made up 26 percent offreshwater anglers and only 19 percent of bass anglers.
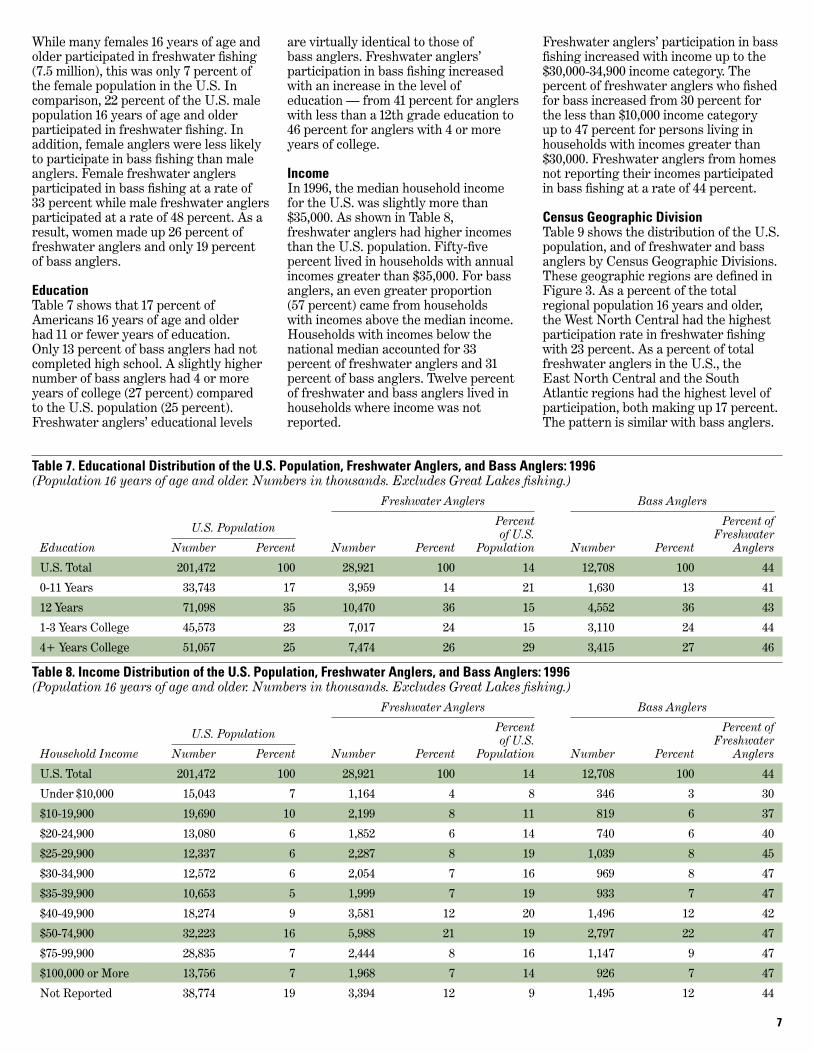
EducationTable 7 shows that 17 percent ofAmericans 16 years of age and older had 11 or fewer years of education. Only 13 percent of bass anglers had notcompleted high school. A slightly highernumber of bass anglers had 4 or moreyears of college (27 percent) compared to the U.S. population (25 percent).Freshwater anglers’ educational levels
are virtually identical to those of bass anglers. Freshwater anglers’participation in bass fishing increasedwith an increase in the level ofeducation — from 41 percent for anglerswith less than a 12th grade education to46 percent for anglers with 4 or moreyears of college.
IncomeIn 1996, the median household incomefor the U.S. was slightly more than$35,000. As shown in Table 8,freshwater anglers had higher incomesthan the U.S. population. Fifty-fivepercent lived in households with annualincomes greater than $35,000. For bassanglers, an even greater proportion(57 percent) came from households with incomes above the median income.Households with incomes below thenational median accounted for 33percent of freshwater anglers and 31percent of bass anglers. Twelve percentof freshwater and bass anglers lived inhouseholds where income was notreported.
Freshwater anglers’ participation in bassfishing increased with income up to the$30,000-34,900 income category. Thepercent of freshwater anglers who fishedfor bass increased from 30 percent forthe less than $10,000 income category up to 47 percent for persons living inhouseholds with incomes greater than$30,000. Freshwater anglers from homesnot reporting their incomes participatedin bass fishing at a rate of 44 percent.
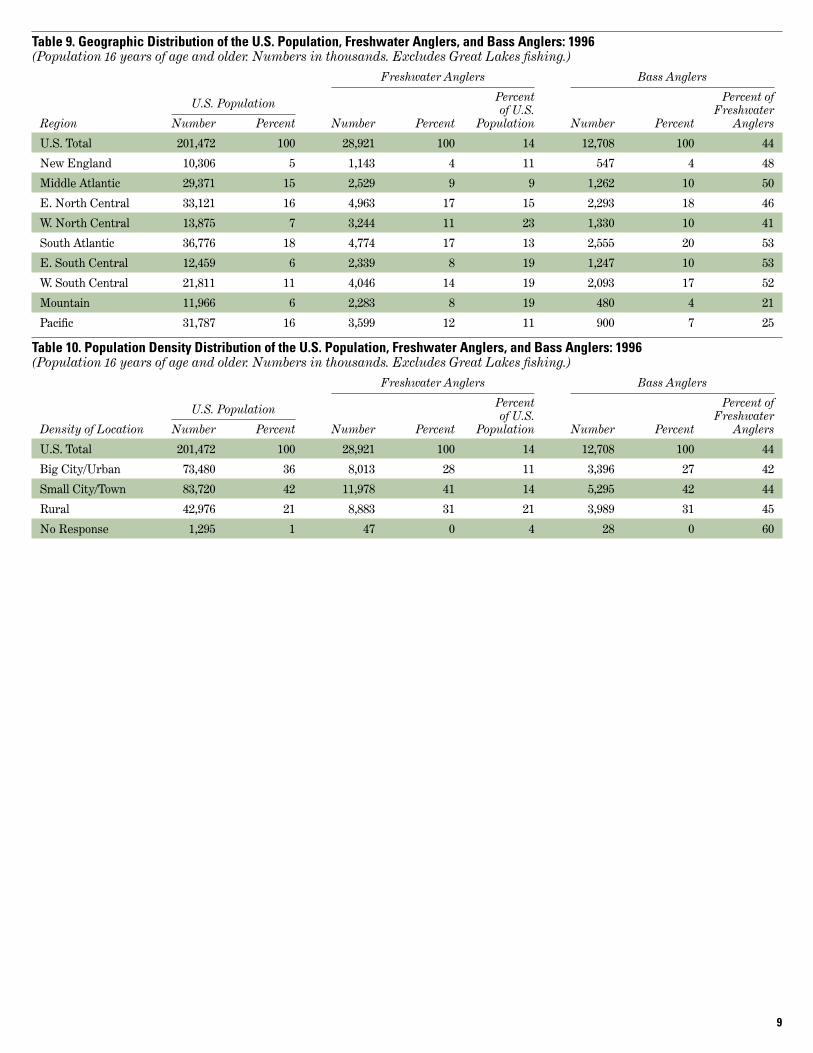
Census Geographic DivisionTable 9 shows the distribution of the U.S.population, and of freshwater and bassanglers by Census Geographic Divisions.These geographic regions are defined inFigure 3. As a percent of the totalregional population 16 years and older,the West North Central had the highestparticipation rate in freshwater fishingwith 23 percent. As a percent of totalfreshwater anglers in the U.S., the East North Central and the SouthAtlantic regions had the highest level ofparticipation, both making up 17 percent.The pattern is similar with bass anglers.
7
Table 7. Educational Distribution of the U.S. Population, Freshwater Anglers, and Bass Anglers: 1996(Population 16 years of age and older. Numbers in thousands. Excludes Great Lakes fishing.)
Freshwater Anglers Bass Anglers
U.S. Population Percent Percent of of U.S. Freshwater
Education Number Percent Number Percent Population Number Percent Anglers
U.S. Total 201,472 100 28,921 100 14 12,708 100 44
0-11 Years 33,743 17 3,959 14 21 1,630 13 41
12 Years 71,098 35 10,470 36 15 4,552 36 43
1-3 Years College 45,573 23 7,017 24 15 3,110 24 44
4+ Years College 51,057 25 7,474 26 29 3,415 27 46
Table 8. Income Distribution of the U.S. Population, Freshwater Anglers, and Bass Anglers: 1996(Population 16 years of age and older. Numbers in thousands. Excludes Great Lakes fishing.)
Freshwater Anglers Bass Anglers
U.S. Population Percent Percent of of U.S. Freshwater
Household Income Number Percent Number Percent Population Number Percent Anglers
U.S. Total 201,472 100 28,921 100 14 12,708 100 44
Under $10,000 15,043 7 1,164 4 8 346 3 30
$10-19,900 19,690 10 2,199 8 11 819 6 37
$20-24,900 13,080 6 1,852 6 14 740 6 40
$25-29,900 12,337 6 2,287 8 19 1,039 8 45
$30-34,900 12,572 6 2,054 7 16 969 8 47
$35-39,900 10,653 5 1,999 7 19 933 7 47
$40-49,900 18,274 9 3,581 12 20 1,496 12 42
$50-74,900 32,223 16 5,988 21 19 2,797 22 47
$75-99,900 28,835 7 2,444 8 16 1,147 9 47
$100,000 or More 13,756 7 1,968 7 14 926 7 47
Not Reported 38,774 19 3,394 12 9 1,495 12 44
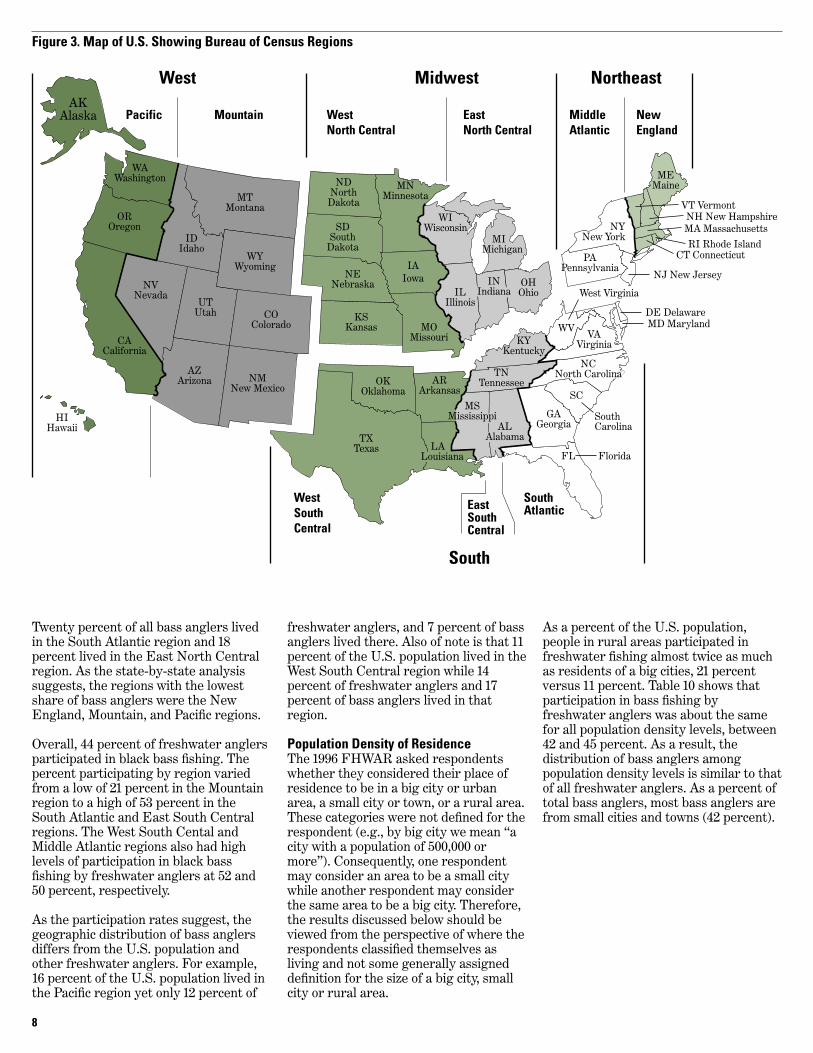
Twenty percent of all bass anglers livedin the South Atlantic region and 18percent lived in the East North Centralregion. As the state-by-state analysissuggests, the regions with the lowestshare of bass anglers were the NewEngland, Mountain, and Pacific regions.
Overall, 44 percent of freshwater anglersparticipated in black bass fishing. Thepercent participating by region variedfrom a low of 21 percent in the Mountainregion to a high of 53 percent in theSouth Atlantic and East South Centralregions. The West South Cental andMiddle Atlantic regions also had highlevels of participation in black bassfishing by freshwater anglers at 52 and50 percent, respectively.
As the participation rates suggest, thegeographic distribution of bass anglersdiffers from the U.S. population andother freshwater anglers. For example,16 percent of the U.S. population lived inthe Pacific region yet only 12 percent of
freshwater anglers, and 7 percent of bassanglers lived there. Also of note is that 11percent of the U.S. population lived in theWest South Central region while 14percent of freshwater anglers and 17percent of bass anglers lived in thatregion.
Population Density of ResidenceThe 1996 FHWAR asked respondentswhether they considered their place ofresidence to be in a big city or urbanarea, a small city or town, or a rural area.These categories were not defined for therespondent (e.g., by big city we mean “acity with a population of 500,000 ormore”). Consequently, one respondentmay consider an area to be a small citywhile another respondent may considerthe same area to be a big city. Therefore,the results discussed below should beviewed from the perspective of where therespondents classified themselves asliving and not some generally assigneddefinition for the size of a big city, smallcity or rural area.
As a percent of the U.S. population,people in rural areas participated infreshwater fishing almost twice as muchas residents of a big cities, 21 percentversus 11 percent. Table 10 shows thatparticipation in bass fishing byfreshwater anglers was about the samefor all population density levels, between42 and 45 percent. As a result, thedistribution of bass anglers amongpopulation density levels is similar to thatof all freshwater anglers. As a percent oftotal bass anglers, most bass anglers arefrom small cities and towns (42 percent).
8
Figure 3. Map of U.S. Showing Bureau of Census Regions
West
Mountain WestNorth Central
WestSouthCentral
EastSouthCentral
SouthAtlantic
EastNorth Central
MiddleAtlantic
NewEngland
Pacific
Midwest
South
NortheastAK
Alaska
WAWashington
IDIdaho
OROregon
CACalifornia
HIHawaii
NVNevada
UTUtah
AZArizona NM
New Mexico
COColorado
WYWyoming
MTMontana
NDNorth
Dakota
MNMinnesota
IAIowa
WIWisconsin
OHOhio
KYKentucky
WVVA
Virginia
TNTennessee
GAGeorgia
FL
SC
ILIllinois
MOMissouri
SDSouth
Dakota
NENebraska
KSKansas
OKOklahoma
ARArkansas
TXTexas
ALAlabama
INIndiana
LALouisiana
MSMississippi South
Carolina
NCNorth Carolina
Florida
West Virginia
DE Delaware
NJ New Jersey
CT ConnecticutRI Rhode Island
MA MassachusettsNH New Hampshire
VT Vermont
MD Maryland
PAPennsylvania
MEMaine
NYNew York MI
Michigan
9
Table 9. Geographic Distribution of the U.S. Population, Freshwater Anglers, and Bass Anglers: 1996(Population 16 years of age and older. Numbers in thousands. Excludes Great Lakes fishing.)
Freshwater Anglers Bass Anglers
U.S. Population Percent Percent of of U.S. Freshwater
Region Number Percent Number Percent Population Number Percent Anglers
U.S. Total 201,472 100 28,921 100 14 12,708 100 44
New England 10,306 5 1,143 4 11 547 4 48
Middle Atlantic 29,371 15 2,529 9 9 1,262 10 50
E. North Central 33,121 16 4,963 17 15 2,293 18 46
W. North Central 13,875 7 3,244 11 23 1,330 10 41
South Atlantic 36,776 18 4,774 17 13 2,555 20 53
E. South Central 12,459 6 2,339 8 19 1,247 10 53
W. South Central 21,811 11 4,046 14 19 2,093 17 52
Mountain 11,966 6 2,283 8 19 480 4 21
Pacific 31,787 16 3,599 12 11 900 7 25
Table 10. Population Density Distribution of the U.S. Population, Freshwater Anglers, and Bass Anglers: 1996(Population 16 years of age and older. Numbers in thousands. Excludes Great Lakes fishing.)
Freshwater Anglers Bass Anglers
U.S. Population Percent Percent of of U.S. Freshwater
Density of Location Number Percent Number Percent Population Number Percent Anglers
U.S. Total 201,472 100 28,921 100 14 12,708 100 44
Big City/Urban 73,480 36 8,013 28 11 3,396 27 42
Small City/Town 83,720 42 11,978 41 14 5,295 42 44
Rural 42,976 21 8,883 31 21 3,989 31 45
No Response 1,295 1 47 0 4 28 0 60

From 1991 to 1996 the number offreshwater anglers changed little —30.2 million to 28.9 million. Similarly, thenumber of bass anglers remained almostthe same — 12.9 million in 1991 and 12.7million in 1996. Both of these changes arewithin the margin of error for thissample size at the 95 percent confidencelevel so we cannot be sure that thenumber of anglers actually changed.2However, fishing activity has increased.Freshwater fishing days rose 13 percentwhile bass fishing days increased 21percent. Corresponding with this, theaverage fishing days per angler increasedfor freshwater anglers from 14.3 days in1991 to 16.7 days in 1996, and for bassanglers from 12.3 days in 1991 to 15.0 daysin 1996 (Table 12). This indicates thatfreshwater anglers and bass anglers arenot increasing in numbers but they arebecoming more avid — that is, theyspend more time fishing.
A comparison of the average number offishing days by state finds that theaverage days spent fishing increased agreat deal for some states. (Table 12). InKansas, for example, the average numberof freshwater days increased from 11.0days in 1991 to 18.6 days in 1996; daysspent black bass fishing increased from9.8 days in 1991 to 23.9 days in 1996.Other states which saw large increases(greater than 5 days) in averagefreshwater and/or black bass averagedays were Florida, Louisiana, Maryland,Minnesota, North Carolina, NorthDakota, Oregon and Washington.3
10
1991–1996 Comparison of Bass Fishing Activity
Table 11. 1991-1996 Comparison of Activity: Participants and Days of Fishing(Population 16 years of age and older. Numbers in thousands. Excludes Great Lakes fishing.)
1991 1996 Percent Participants and Days Number Number Change
Anglers, All Freshwater 30,186 28,921 *–4
Anglers, Bass 12,857 12,708 *–1
Days, All Freshwater 430,922 485,474 13
Days, Bass 158,226 191,350 21
Figure 4. 1991-1996 Participants and Days(In millions)
* The difference is within the margin of error of the sample size at the 0.05 level of significance. This meansthat for 95 percent of all possible samples, the estimates for the number of freshwater and bass anglers in1991 are not different from the estimate for 1996.
2 This means that for 95 percent of all possiblesamples, the estimates for the number offreshwater and bass anglers in 1991 are notdifferent from the estimates for 1996.3 North Dakota’s estimates for 1991 and 1996 andOregon’s estimates for 1996 are based on smallsample sizes and may not be as reliable as estimatesfor other states.
30.212.712.9
485
431
191
158
Number of Bass Anglers*
14
12
10
8
6
4
2
0
28.9
Number of Freshwater Anglers*
35
30
25
20
15
10
5
0
Freshwater Days of Fishing
500
400
300
200
100
0
Bass Days of Fishing
250
200
150
100
50
0
1991 1996 1991 1996
1991 1996 1991 1996
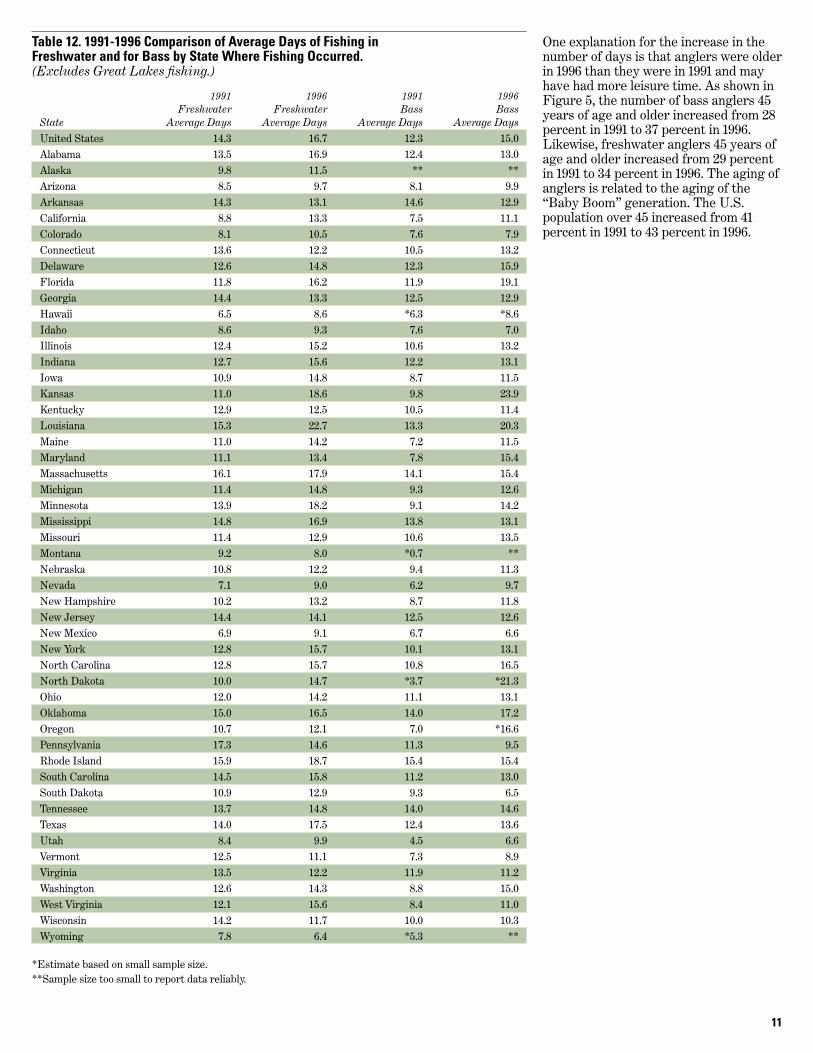
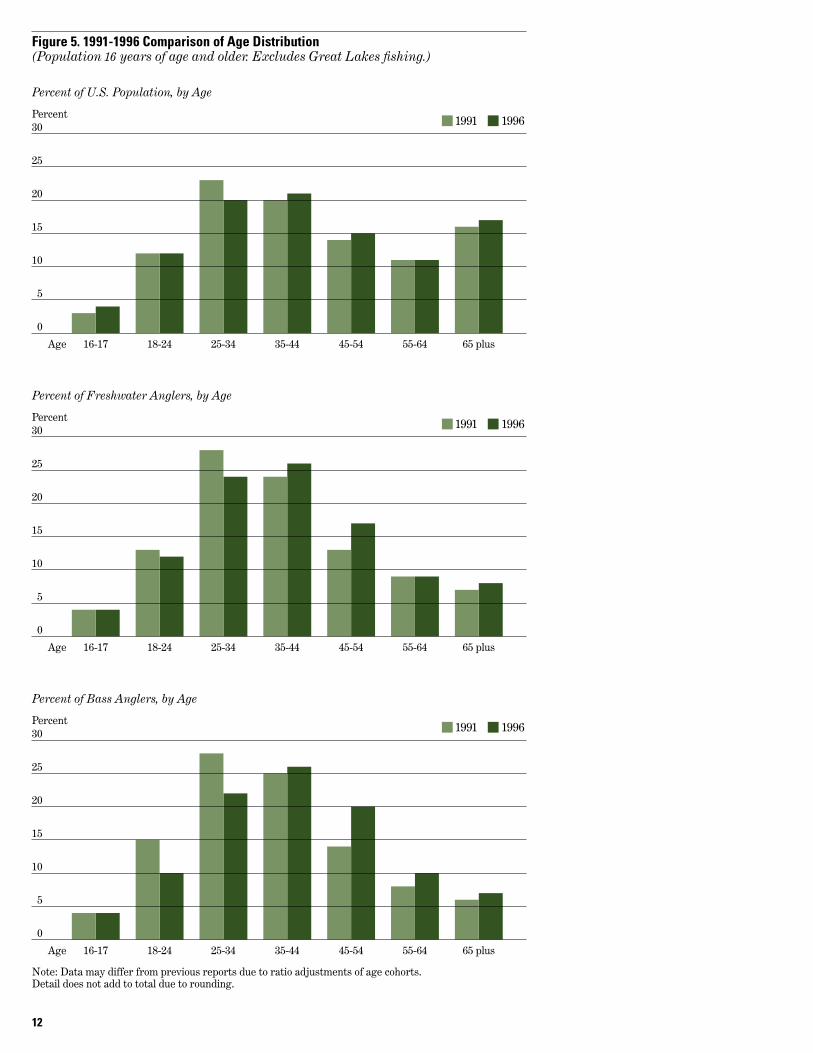
One explanation for the increase in thenumber of days is that anglers were olderin 1996 than they were in 1991 and mayhave had more leisure time. As shown inFigure 5, the number of bass anglers 45years of age and older increased from 28percent in 1991 to 37 percent in 1996.Likewise, freshwater anglers 45 years ofage and older increased from 29 percentin 1991 to 34 percent in 1996. The aging ofanglers is related to the aging of the“Baby Boom” generation. The U.S.population over 45 increased from 41percent in 1991 to 43 percent in 1996.
11
Table 12. 1991-1996 Comparison of Average Days of Fishing in Freshwater and for Bass by State Where Fishing Occurred.(Excludes Great Lakes fishing.)
1991 1996 1991 1996Freshwater Freshwater Bass Bass
State Average Days Average Days Average Days Average DaysUnited States 14.3 16.7 12.3 15.0Alabama 13.5 16.9 12.4 13.0Alaska 9.8 11.5 ** **Arizona 8.5 9.7 8.1 9.9Arkansas 14.3 13.1 14.6 12.9California 8.8 13.3 7.5 11.1Colorado 8.1 10.5 7.6 7.9Connecticut 13.6 12.2 10.5 13.2Delaware 12.6 14.8 12.3 15.9Florida 11.8 16.2 11.9 19.1Georgia 14.4 13.3 12.5 12.9Hawaii 6.5 8.6 *6.3 *8.6Idaho 8.6 9.3 7.6 7.0Illinois 12.4 15.2 10.6 13.2Indiana 12.7 15.6 12.2 13.1Iowa 10.9 14.8 8.7 11.5Kansas 11.0 18.6 9.8 23.9Kentucky 12.9 12.5 10.5 11.4Louisiana 15.3 22.7 13.3 20.3Maine 11.0 14.2 7.2 11.5Maryland 11.1 13.4 7.8 15.4Massachusetts 16.1 17.9 14.1 15.4Michigan 11.4 14.8 9.3 12.6Minnesota 13.9 18.2 9.1 14.2Mississippi 14.8 16.9 13.8 13.1Missouri 11.4 12.9 10.6 13.5Montana 9.2 8.0 *0.7 **Nebraska 10.8 12.2 9.4 11.3Nevada 7.1 9.0 6.2 9.7New Hampshire 10.2 13.2 8.7 11.8New Jersey 14.4 14.1 12.5 12.6New Mexico 6.9 9.1 6.7 6.6New York 12.8 15.7 10.1 13.1North Carolina 12.8 15.7 10.8 16.5North Dakota 10.0 14.7 *3.7 *21.3Ohio 12.0 14.2 11.1 13.1Oklahoma 15.0 16.5 14.0 17.2Oregon 10.7 12.1 7.0 *16.6Pennsylvania 17.3 14.6 11.3 9.5Rhode Island 15.9 18.7 15.4 15.4South Carolina 14.5 15.8 11.2 13.0South Dakota 10.9 12.9 9.3 6.5Tennessee 13.7 14.8 14.0 14.6Texas 14.0 17.5 12.4 13.6Utah 8.4 9.9 4.5 6.6Vermont 12.5 11.1 7.3 8.9Virginia 13.5 12.2 11.9 11.2Washington 12.6 14.3 8.8 15.0West Virginia 12.1 15.6 8.4 11.0Wisconsin 14.2 11.7 10.0 10.3Wyoming 7.8 6.4 *5.3 **
*Estimate based on small sample size.**Sample size too small to report data reliably.
12
Figure 5. 1991-1996 Comparison of Age Distribution(Population 16 years of age and older. Excludes Great Lakes fishing.)
Percent of Bass Anglers, by Age
Percent30
25
20
15
10
5
0
Age 16-17 18-24 25-34 35-44 45-54 55-64 65 plus
Note: Data may differ from previous reports due to ratio adjustments of age cohorts. Detail does not add to total due to rounding.
1991 1996
1991 1996
1991 1996
Percent of U.S. Population, by Age
Percent30
25
20
15
10
5
0
Age 16-17 18-24 25-34 35-44 45-54 55-64 65 plus
Percent of Freshwater Anglers, by Age
Percent30
25
20
15
10
5
0
Age 16-17 18-24 25-34 35-44 45-54 55-64 65 plus
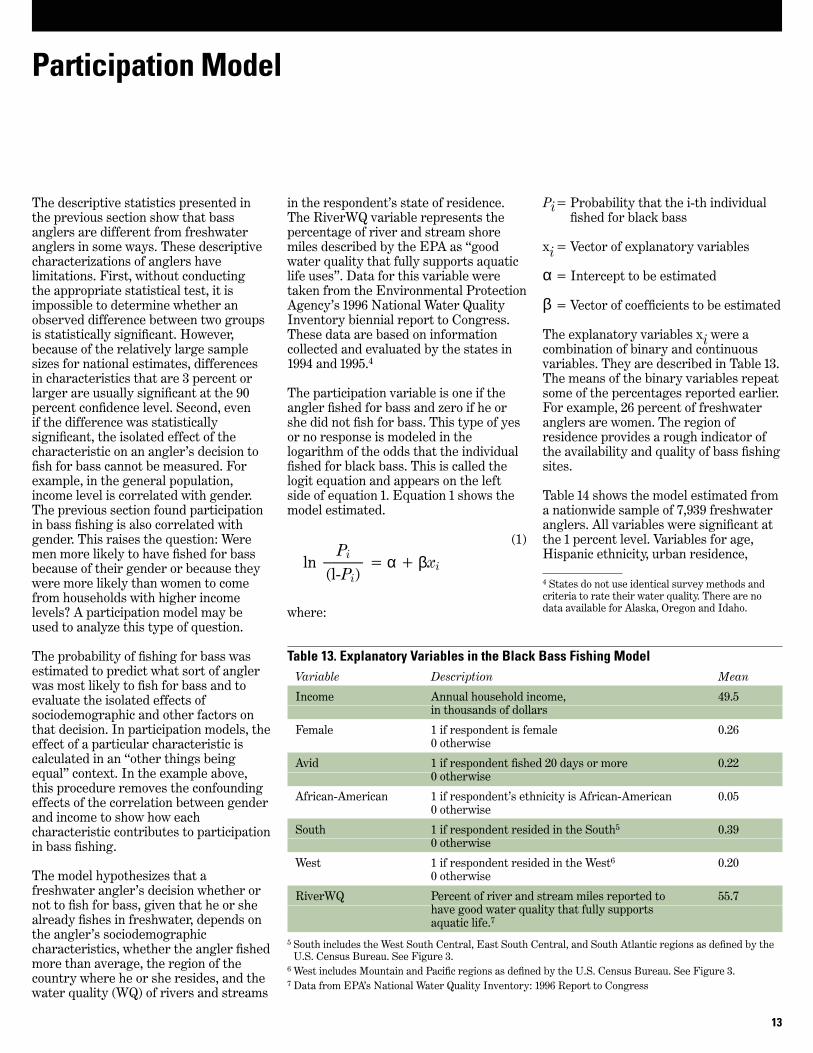
The descriptive statistics presented inthe previous section show that bassanglers are different from freshwateranglers in some ways. These descriptivecharacterizations of anglers havelimitations. First, without conducting the appropriate statistical test, it isimpossible to determine whether anobserved difference between two groupsis statistically significant. However,because of the relatively large samplesizes for national estimates, differencesin characteristics that are 3 percent orlarger are usually significant at the 90percent confidence level. Second, even if the difference was statisticallysignificant, the isolated effect of thecharacteristic on an angler’s decision tofish for bass cannot be measured. Forexample, in the general population,income level is correlated with gender.The previous section found participationin bass fishing is also correlated withgender. This raises the question: Weremen more likely to have fished for bassbecause of their gender or because theywere more likely than women to comefrom households with higher incomelevels? A participation model may beused to analyze this type of question.
The probability of fishing for bass wasestimated to predict what sort of anglerwas most likely to fish for bass and toevaluate the isolated effects ofsociodemographic and other factors onthat decision. In participation models, theeffect of a particular characteristic iscalculated in an “other things beingequal” context. In the example above,this procedure removes the confoundingeffects of the correlation between genderand income to show how eachcharacteristic contributes to participationin bass fishing.
The model hypothesizes that afreshwater angler’s decision whether ornot to fish for bass, given that he or shealready fishes in freshwater, depends onthe angler’s sociodemographiccharacteristics, whether the angler fishedmore than average, the region of thecountry where he or she resides, and thewater quality (WQ) of rivers and streams
in the respondent’s state of residence.The RiverWQ variable represents thepercentage of river and stream shoremiles described by the EPA as “goodwater quality that fully supports aquaticlife uses”. Data for this variable weretaken from the Environmental ProtectionAgency’s 1996 National Water QualityInventory biennial report to Congress.These data are based on informationcollected and evaluated by the states in1994 and 1995.4
The participation variable is one if theangler fished for bass and zero if he orshe did not fish for bass. This type of yesor no response is modeled in thelogarithm of the odds that the individualfished for black bass. This is called thelogit equation and appears on the leftside of equation 1. Equation 1 shows themodel estimated.
where:
(1)Piln _____ = α + βxi(l-Pi)
Pi= Probability that the i-th individualfished for black bass
xi = Vector of explanatory variables
α = Intercept to be estimated
β = Vector of coefficients to be estimated
The explanatory variables xi were acombination of binary and continuousvariables. They are described in Table 13.The means of the binary variables repeatsome of the percentages reported earlier.For example, 26 percent of freshwateranglers are women. The region ofresidence provides a rough indicator ofthe availability and quality of bass fishingsites.
Table 14 shows the model estimated froma nationwide sample of 7,939 freshwateranglers. All variables were significant atthe 1 percent level. Variables for age,Hispanic ethnicity, urban residence,
13
Participation Model
Table 13. Explanatory Variables in the Black Bass Fishing ModelVariable Description Mean
Income Annual household income, 49.5in thousands of dollars
Female 1 if respondent is female 0.260 otherwise
Avid 1 if respondent fished 20 days or more 0.220 otherwise
African-American 1 if respondent’s ethnicity is African-American 0.050 otherwise
South 1 if respondent resided in the South5 0.390 otherwise
West 1 if respondent resided in the West6 0.200 otherwise
RiverWQ Percent of river and stream miles reported to 55.7have good water quality that fully supports aquatic life.7
5 South includes the West South Central, East South Central, and South Atlantic regions as defined by theU.S. Census Bureau. See Figure 3.
6 West includes Mountain and Pacific regions as defined by the U.S. Census Bureau. See Figure 3.7 Data from EPA’s National Water Quality Inventory: 1996 Report to Congress
4 States do not use identical survey methods andcriteria to rate their water quality. There are nodata available for Alaska, Oregon and Idaho.
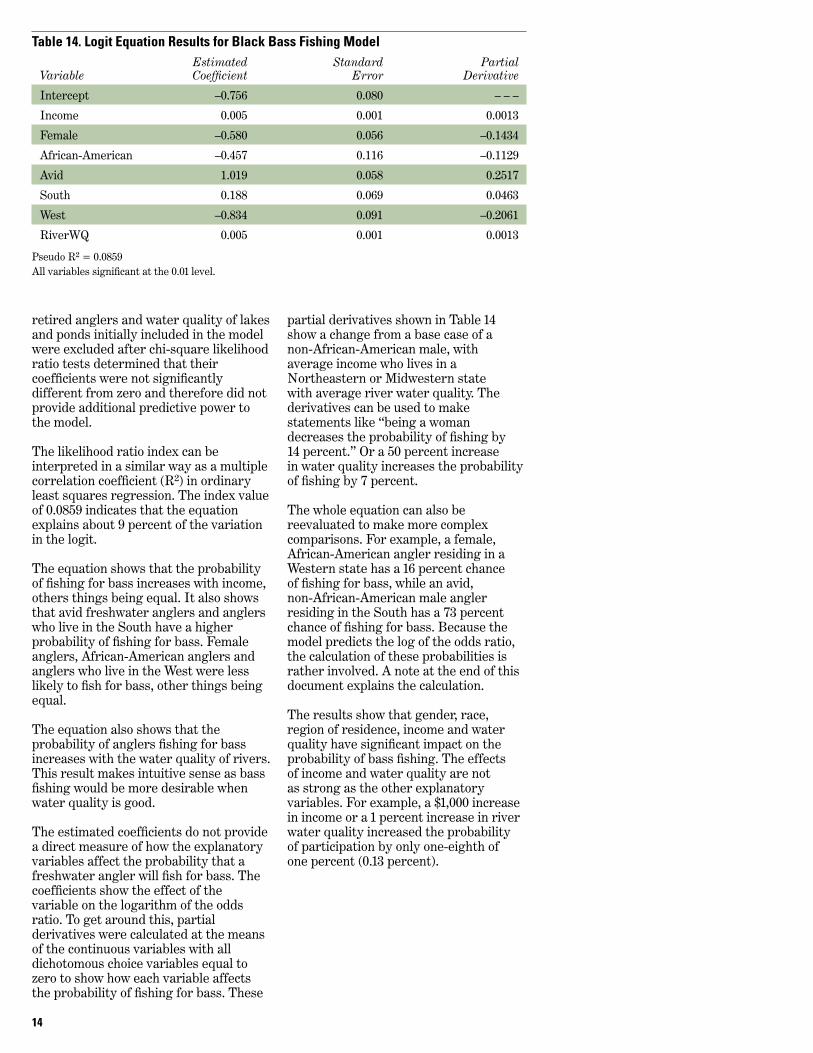
partial derivatives shown in Table 14show a change from a base case of a non-African-American male, withaverage income who lives in aNortheastern or Midwestern state with average river water quality. Thederivatives can be used to makestatements like “being a womandecreases the probability of fishing by14 percent.” Or a 50 percent increase in water quality increases the probabilityof fishing by 7 percent.
The whole equation can also bereevaluated to make more complexcomparisons. For example, a female,African-American angler residing in aWestern state has a 16 percent chance of fishing for bass, while an avid, non-African-American male anglerresiding in the South has a 73 percentchance of fishing for bass. Because themodel predicts the log of the odds ratio,the calculation of these probabilities israther involved. A note at the end of thisdocument explains the calculation.
The results show that gender, race,region of residence, income and waterquality have significant impact on theprobability of bass fishing. The effects of income and water quality are not as strong as the other explanatoryvariables. For example, a $1,000 increasein income or a 1 percent increase in riverwater quality increased the probability of participation by only one-eighth of one percent (0.13 percent).
retired anglers and water quality of lakesand ponds initially included in the modelwere excluded after chi-square likelihoodratio tests determined that theircoefficients were not significantlydifferent from zero and therefore did notprovide additional predictive power tothe model.
The likelihood ratio index can beinterpreted in a similar way as a multiplecorrelation coefficient (R2) in ordinaryleast squares regression. The index valueof 0.0859 indicates that the equationexplains about 9 percent of the variationin the logit.
The equation shows that the probabilityof fishing for bass increases with income,others things being equal. It also showsthat avid freshwater anglers and anglerswho live in the South have a higherprobability of fishing for bass. Femaleanglers, African-American anglers andanglers who live in the West were lesslikely to fish for bass, other things beingequal.
The equation also shows that theprobability of anglers fishing for bassincreases with the water quality of rivers.This result makes intuitive sense as bassfishing would be more desirable whenwater quality is good.
The estimated coefficients do not providea direct measure of how the explanatoryvariables affect the probability that afreshwater angler will fish for bass. Thecoefficients show the effect of thevariable on the logarithm of the oddsratio. To get around this, partialderivatives were calculated at the meansof the continuous variables with alldichotomous choice variables equal tozero to show how each variable affectsthe probability of fishing for bass. These
14
Table 14. Logit Equation Results for Black Bass Fishing ModelEstimated Standard Partial
Variable Coefficient Error Derivative
Intercept –0.756 0.080 – – –
Income 0.005 0.001 0.0013
Female –0.580 0.056 –0.1434
African-American –0.457 0.116 –0.1129
Avid 1.019 0.058 0.2517
South 0.188 0.069 0.0463
West –0.834 0.091 –0.2061
RiverWQ 0.005 0.001 0.0013
Pseudo R2 = 0.0859All variables significant at the 0.01 level.
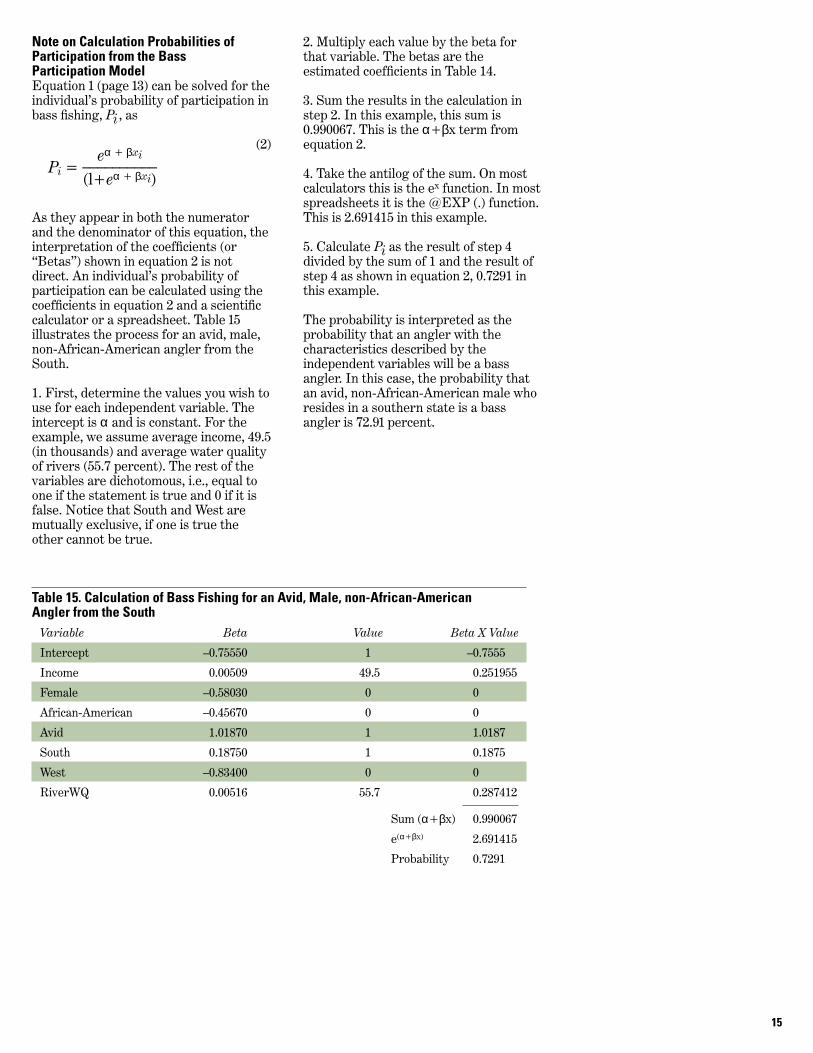
Note on Calculation Probabilities ofParticipation from the Bass Participation ModelEquation 1 (page 13) can be solved for theindividual’s probability of participation inbass fishing, Pi , as
As they appear in both the numeratorand the denominator of this equation, theinterpretation of the coefficients (or“Betas”) shown in equation 2 is notdirect. An individual’s probability ofparticipation can be calculated using thecoefficients in equation 2 and a scientificcalculator or a spreadsheet. Table 15illustrates the process for an avid, male,non-African-American angler from theSouth.
1. First, determine the values you wish touse for each independent variable. Theintercept is α and is constant. For theexample, we assume average income, 49.5(in thousands) and average water qualityof rivers (55.7 percent). The rest of thevariables are dichotomous, i.e., equal toone if the statement is true and 0 if it isfalse. Notice that South and West aremutually exclusive, if one is true theother cannot be true.
(2)eα + βxi
Pi = __________(l+eα + βxi)
2. Multiply each value by the beta forthat variable. The betas are theestimated coefficients in Table 14.
3. Sum the results in the calculation instep 2. In this example, this sum is0.990067. This is the α+βx term fromequation 2.
4. Take the antilog of the sum. On mostcalculators this is the ex function. In mostspreadsheets it is the @EXP (.) function.This is 2.691415 in this example.
5. Calculate Pi as the result of step 4divided by the sum of 1 and the result ofstep 4 as shown in equation 2, 0.7291 inthis example.
The probability is interpreted as theprobability that an angler with thecharacteristics described by theindependent variables will be a bassangler. In this case, the probability thatan avid, non-African-American male whoresides in a southern state is a bassangler is 72.91 percent.
15
Table 15. Calculation of Bass Fishing for an Avid, Male, non-African-American Angler from the South
Variable Beta Value Beta X Value
Intercept –0.75550 1 –0.7555
Income 0.00509 49.5 0.251955
Female –0.58030 0 0
African-American –0.45670 0 0
Avid 1.01870 1 1.0187
South 0.18750 1 0.1875
West –0.83400 0 0
RiverWQ 0.00516 55.7 0.287412
Sum (α+βx) 0.990067
e(α+βx) 2.691415
Probability 0.7291
The 1996 National Survey of Fishing,Hunting, and Wildlife-AssociatedRecreation shows that fishing for blackbass appealed to a large number offreshwater anglers. In fact, bass werepursued by more anglers than any other fish that the survey covered. A comparison of 1991 and 1996 FHWARsurveys finds that the average number ofdays fishing for bass increased althoughthe number of bass anglers remainedalmost the same.
From a sociodemographic standpoint,there are some interesting differencesbetween freshwater anglers overall andbass anglers. Bass anglers tend to bewealthier, more Southern and more male than other anglers. A probability
16
of participation showed thatsociodemographic characteristics andwater quality had a significant impact on whether an angler sought bass oranother species. Also of note is thefinding that avid freshwater anglers aremuch more likely to fish for bass thannon-avid freshwater anglers. This meansthat bass anglers tend to be more avidthan freshwater anglers in general.
These findings from the 1996 FHWARunderscore the importance of bassfor millions of freshwater anglers.Information about who these bass anglersare, their age, sex, race, where they live,and so on can be used by recreationmanagers and others to enhance thefishing experiences of many anglers.
Summary
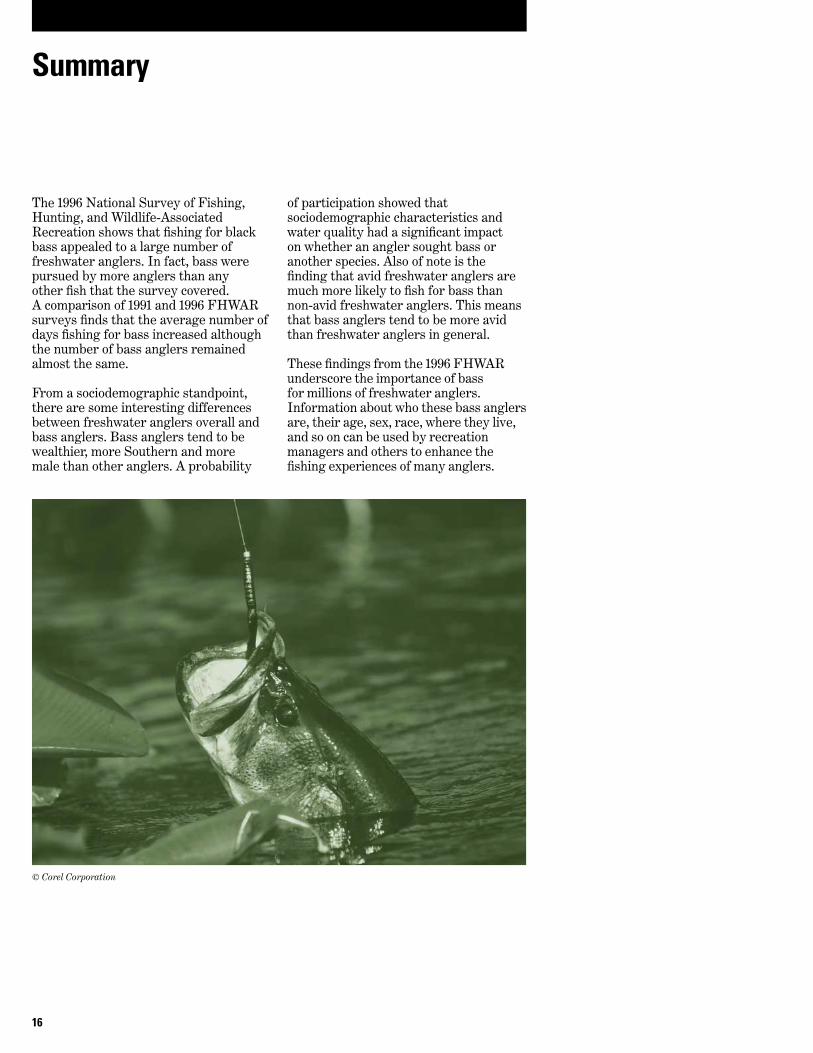
© Corel Corporation


U.S. Department of the InteriorU.S. Fish & Wildlife ServiceDivision of EconomicsArlington, Virginia
http://www.fws.gov