Embed Size (px)
Citation preview

0
2009-10
TUITION AND FEE RATES
A National Comparison
Washington Higher Education Coordinating Board
March 2010

0
917 Lakeridge Way SW P.O. Box 43430 Olympia, WA 98504-3430 360.753.7800 www.hecb.wa.gov
Jesus Hernandez, chair Wenatchee Charley Bingham Tacoma Ethelda Burke Lakewood Gene Colin Seattle Roberta Greene Spokane Bill Grinstein Seattle Earl Hale Lacey Andrew Helm Spokane Nita Rinehart Seattle Sam Smith Seattle Ann Daley Executive Director This publication is available on the HECB Web site at: http://www.hecb.wa.gov/research/issues/tuition.asp

Table of Contents
Introduction to the 41st Annual National Tuition and Fees Report ................................................. Page 1 Part One – Resident Undergraduate Tuition and Required Fees by State ...................................... Page 3 Chart 1 ..................................................................................................................................................... Page 4 Flagship Universities Resident Undergraduate Tuition and Required Fees Chart 2 ..................................................................................................................................................... Page 5 Flagship Universities Percentage Change in Resident Undergraduate Tuition and Required Fees Chart 3 ..................................................................................................................................................... Page 6 Comprehensive Colleges and Universities Resident Undergraduate Tuition and Required Fees Chart 4 ..................................................................................................................................................... Page 7 Comprehensive Colleges and Universities Percentage Change in Resident Undergraduate Tuition and Required Fees Chart 5 ..................................................................................................................................................... Page 8 Community Colleges Resident Undergraduate Tuition and Required Fees Chart 6 ..................................................................................................................................................... Page 9 Community Colleges Percentage Change in Resident Undergraduate Tuition and Required Fees Part Two – National Comparisons of Tuition and Required Fees by State ..................................... Page 11 National Table 1...................................................................................................................................... Page 12 Flagship Universities Resident Undergraduate Tuition and Required Fees National Table 2...................................................................................................................................... Page 13 Flagship Universities Nonresident Undergraduate Tuition and Required Fees National Table 3...................................................................................................................................... Page 14 Flagship Universities Resident Graduate Tuition and Required Fees National Table 4...................................................................................................................................... Page 15 Flagship Universities Nonresident Graduate Tuition and Required Fees National Table 5...................................................................................................................................... Page 16 Comprehensive Colleges and Universities Resident Undergraduate Tuition and Required Fees National Table 6...................................................................................................................................... Page 17 Comprehensive Colleges and Universities Nonresident Undergraduate Tuition and Required Fees National Table 7...................................................................................................................................... Page 18 Comprehensive Colleges and Universities Resident Graduate Tuition and Required Fees National Table 8...................................................................................................................................... Page 19 Comprehensive Colleges and Universities Nonresident Graduate Tuition and Required Fees National Table 9...................................................................................................................................... Page 20 Community Colleges Resident Tuition and Required Fees – Estimated State Averages National Table 10 ................................................................................................................................... Page 21 Community Colleges Nonresident Tuition and Required Fees – Estimated State Averages Part Three – Washington Peer Group Comparisons of Tuition and Required Fees .................... Page 23 Peer Institution Comparison Groups Introduction ............................................................................ Page 25 Peers Table 1 ........................................................................................................................................... Page 26 University of Washington and Peer Institutions Resident Undergraduate Tuition and Required Fees Peers Table 2 ........................................................................................................................................... Page 27 University of Washington and Peer Institutions Nonresident Undergraduate Tuition and Required Fees

Table of Contents
(continued)
Peers Table 3 ........................................................................................................................................... Page 28 University of Washington and Peer Institutions Resident Graduate Tuition and Required Fees Peers Table 4 ........................................................................................................................................... Page 29 University of Washington and Peer Institutions Nonresident Graduate Tuition and Required Fees Peers Table 5. .......................................................................................................................................... Page 30 Washington State University and Peer Institutions Resident Undergraduate Tuition and Required Fees Peers Table 6 ........................................................................................................................................... Page 31 Washington State University and Peer Institutions Nonresident Undergraduate Tuition and Required Fees Peers Table 7 ........................................................................................................................................... Page 32 Washington State University and Peer Institutions Resident Graduate Tuition and Required Fees Peers Table 8 ........................................................................................................................................... Page 33 Washington State University and Peer Institutions Nonresident Graduate Tuition and Required Fees Peers Table 9 ........................................................................................................................................... Page 34 University of Washington and Peer Institutions Resident Medical Tuition and Required Fees Peers Table 10 ......................................................................................................................................... Page 35 University of Washington and Peer Institutions Nonresident Medical Tuition and Required Fees Peers Table 11 ......................................................................................................................................... Page 36 University of Washington and Peer Institutions Resident Dental Tuition and Required Fees Peers Table 12 ......................................................................................................................................... Page 37 University of Washington and Peer Institutions Nonresident Dental Tuition and Required Fees Peers Table 13… ..................................................................................................................................... Page 38 University of Washington and Peer Institutions Resident Law Tuition and Required Fees Peers Table 14 ......................................................................................................................................... Page 39 University of Washington and Peer Institutions Nonresident Law Tuition and Required Fees Peers Table 15… ..................................................................................................................................... Page 40 Washington State University and Peer Institutions Resident Veterinary Medicine Tuition and Required Fees Peers Table 16 ......................................................................................................................................... Page 41 Washington State University and Peer Institutions Nonresident Veterinary Medicine Tuition and Required Fees Peers Table 17 ......................................................................................................................................... Page 42 The Evergreen State College and Peer Institutions Resident Undergraduate Tuition and Required Fees Peers Table 18 ......................................................................................................................................... Page 43 The Evergreen State College and Peer Institutions Nonresident Undergraduate Tuition and Required Fees Peers Table 19 ......................................................................................................................................... Page 44 The Evergreen State College Resident Graduate Tuition and Required Fees Peers Table 20… ..................................................................................................................................... Page 45 The Evergreen State College and Peer Institutions Nonresident Graduate Tuition and Required Fees Endnotes .................................................................................................................................................. Page 47 Appendix A ............................................................................................................................................. Page 55 List of colleges and universities included in National Tables 1-8

March 2010 2009-10 Tuition and Fee Rates A National Comparison Introduction This is the 41st annual report of tuition and fee rates at public institutions in the 50 states. Data contained in this report were compiled using Washington Higher Education Coordinating Board (HECB) surveys of state agencies or individual institutions. HECB staff greatly appreciates the continued cooperation and assistance of survey respondents. Their efforts to provide accurate and timely data have enabled these reports to serve as source documents for many states as they develop their own tuition and fee analyses. With each annual survey, respondents have an opportunity to review and revise previously reported data. Though small in number, such revisions may affect the national averages reported in prior editions. Revisions are indicated with footnotes or endnotes included in the report. Data represent average undergraduate tuition at over 200 state public institutions, as well as average graduate tuition at over 190 public institutions with graduate programs. Not all public institutions are included in this survey; newly founded public institutions are not added to the survey in order to keep the data comparable over time. Full-time undergraduate tuition and required fee amounts were based on 45 quarter hours or 30 semester hours and full-time graduate tuition and required fees were based on 30 quarter hours or 20 semester hours per year.1
Tuition and required fees include total academic year tuition and required fees for full-time students. Optional fees are not included unless they are paid by all full-time students.
Appendix A, page 55, contains a listing of institutions by state included in Tables 1-8. For more information, please contact Coke Putnam at (360) 753-7870 or by e-mail at [email protected].
1 Full-time graduate tuition in some states covers 24 semester hours per year, instead of 20.
1

1

3
Part One
Resident Undergraduate Tuition and Required Fees by State
Charts 1 through 6 present data on the 2009-10 resident undergraduate tuition and required fees. The charts also report the percentage change in tuition and required fees from 2008-09 to 2009-10 by state for flagship universities, the average of comprehensive colleges and universities, and the average of community colleges. These data are included in the National Tables 1, 5, and 9. Charts 1 through 6 are listed in decreasing order of magnitude.

4
Flagship Universities Chart 1
Resident Undergraduate Tuition and Required Fees 2009-10
3,7264,373
4,9014,9325,1015,1065,1335,2335,3045,334
5,6255,745
6,4596,4686,493
6,7276,8246,8426,8506,8577,0007,0147,168
7,4147,4307,5877,630
7,9327,9638,043
8,2418,310
8,5018,6638,7068,842
9,1569,2949,4349,4869,5289,6269,672
9,88610,634
11,29311,659
11,88612,66012,743
13,55414,416
$0 $2,000 $4,000 $6,000 $8,000 $10,000 $12,000 $14,000
WyomingFloridaNevada
IdahoNew MexicoMississippi
AlaskaLouisiana
West VirginiaMontana
North CarolinaUtah
ArkansasSouth Dakota
OklahomaNorth Dakota
IowaArizona
TennesseeNebraskaAlabama
New YorkHawaii
KansasOregon
WASHINGTONGeorgia
ColoradoNATIONAL AVERAGE
MarylandKentucky
WisconsinMissouri
IndianaOhio
TexasSouth Carolina
WA PEER AVERAGE*CaliforniaDelaware
Rhode IslandMaine
VirginiaConnecticut
MassachusettsMinnesota
MichiganNew Jersey
IllinoisNew Hampshire
VermontPennsylvania
*For a list of Washington peers included in the Washington Peer Average, see Peers - Table 1, page 26.

5
Flagship Universities Chart 2
Percentage Change in Resident Undergraduate Tuition and Required Fees 2008-09 to 2009-10
0.0%0.3%0.4%0.5%
0.9%2.9%2.9%3.0%3.3%3.4%3.6%3.8%3.9%4.0%4.0%4.1%4.2%4.6%4.6%4.6%4.8%5.0%5.2%5.3%5.5%5.5%5.6%5.6%5.8%5.9%6.2%6.4%6.5%
7.1%7.5%
8.7%9.0%9.1%9.4%9.6%9.7%9.8%9.8%
11.0%11.6%
13.3%14.5%
15.5%15.8%
23.7%26.5%
0% 5% 10% 15% 20% 25% 30%
MississippiOklahoma
OhioMissouriMarylandArkansasLouisianaWyoming
New JerseyNorth Dakota
IllinoisSouth Carolina
MontanaMassachusetts
West VirginiaVirginia
NebraskaNorth Carolina
AlaskaIowa
IndianaTexas
KentuckyPennsylvania
KansasNew Mexico
VermontCaliforniaMichigan
MaineConnecticut
MinnesotaNATIONAL AVERAGE
IdahoWA PEER AVERAGE*
NevadaUtah
ColoradoNew Hampshire
AlabamaTennessee
DelawareWisconsin
Rhode IslandSouth Dakota
New YorkWASHINGTON
HawaiiOregonFlorida
ArizonaGeorgia
0.0%
*For a list of Washington peers included in the Washington Peer Average, see Peers - Table 1, page 26.

6
Chart 3
Comprehensive Colleges and Universities Resident Undergraduate Tuition and Required Fees
2009-10
3,588 4,026 4,087 4,148 4,189
4,372 4,448 4,451 4,549 4,645
4,916 4,956 4,977 5,005
5,219 5,403 5,502 5,589
5,857 5,910 5,986 6,027
6,252 6,2576,295 6,358 6,395 6,408 6,511 6,550 6,597 6,636 6,734 6,759
7,345 7,348 7,485 7,533 7,628 7,683
7,960 8,196
8,387 8,700
9,139 9,933
11,133
$0 $2,000 $4,000 $6,000 $8,000 $10,000 $12,000
New MexicoLouisiana
UtahNorth Carolina
OklahomaFlorida
MontanaColorado
KansasMississippi
IdahoCalifornia
NevadaWest Virginia
NebraskaGeorgia
WASHINGTONNorth Dakota
ArkansasTennessee
MissouriNew YorkAlabama
NATIONAL AVERAGEMinnesota
TexasWisconsin
Rhode IslandOregon
South DakotaKentucky
IowaArizona
MainePennsylvania
MassachusettsConnecticut
MarylandIndianaVirginia
South CarolinaVermont
OhioMichigan
New HampshireIllinois
New Jersey

7
Chart 4
Comprehensive Colleges and Universities Percentage Change in Resident Undergraduate Tuition and Required Fees
2008-09 to 2009-10
0.0%0.0%0.0%
1.0%1.6%
2.3%2.5%
3.5%3.6%3.7%4.0%4.1%4.3%4.4%4.4%4.5%4.6%4.6%
5.1%5.4%5.5%5.8%5.8%5.9%6.0%6.2%6.3%6.3%6.5%6.6%6.6%6.7%6.7%7.1%
7.5%8.4%
9.0%10.4%
10.8%11.0%
12.4%13.1%
13.9%14.2%
21.3%26.2%
28.7%
0.0% 5.0% 10.0% 15.0% 20.0% 25.0% 30.0%
OklahomaMississippi
MissouriMontana
OhioArkansasMaryland
MinnesotaNew Jersey
North DakotaIndiana
IowaSouth Carolina
NebraskaPennsylvania
KentuckyNew Mexico
North CarolinaLouisiana
ConnecticutVirginia
IdahoMaine
South DakotaUtah
MassachusettsNew Hampshire
WisconsinKansas
TexasOregon
VermontNATIONAL AVERAGE
TennesseeWest Virginia
IllinoisMichiganAlabama
NevadaRhode Island
New YorkColorado
FloridaWASHINGTON
ArizonaCalifornia
Georgia

8
Chart 5
Community Colleges Resident Undergraduate Tuition and Required Fees
2009-10
7801,125
1,6841,761
1,8491,9291,9501,965
2,1182,199
2,3202,4282,5042,5532,5902,6012,6512,6662,7002,7062,7302,7812,816
2,9252,9622,9682,9953,0293,090
3,2003,2043,217
3,3103,3763,4273,4403,5213,567
3,7013,7403,7503,8083,842
4,0574,3054,315
4,5674,6974,776
6,262
$0 $1,000 $2,000 $3,000 $4,000 $5,000 $6,000 $7,000
CaliforniaNew Mexico
North CarolinaMississippi
TexasLouisiana
ArizonaNevada
WyomingKansas
NebraskaHawaii
ArkansasFlorida
IdahoUtah
MichiganIllinois
AlabamaOklahoma
West VirginiaVirginia
DelawareWASHINGTON
ColoradoTennessee
GeorgiaNATIONAL AVERAGE
IndianaConnecticut
MaineMontanaMaryland
Rhode IslandPennsylvania
OhioMissouriOregon
New JerseySouth Carolina
KentuckyNorth Dakota
IowaNew York
MassachusettsAlaska
WisconsinMinnesota
VermontNew Hampshire

9
Chart 6
Community Colleges Percentage Change in Resident Undergraduate Tuition and Required Fees
2008-09 to 2009-10
-0.4%-0.2%
0.0%0.0%0.3%0.6%0.8%0.8%
1.6%1.7%2.0%
2.9%2.9%3.1%3.3%
4.2%4.3%4.4%4.5%4.5%4.9%4.9%5.2%5.2%5.3%5.5%5.7%5.8%6.2%6.6%6.9%7.0%7.1%7.2%7.6%7.7%7.9%
8.6%8.8%9.3%9.7%
10.5%11.3%
11.8%13.9%
18.4%23.2%
30.0%30.3%30.6%
-10% -5% 0% 5% 10% 15% 20% 25% 30% 35%
MississippiAlabama
WisconsinNew York
North DakotaOklahoma
MaineArizonaKansas
MarylandMinnesotaArkansasKentuckyVermont
NebraskaSouth Carolina
MontanaWyomingMichiganDelaware
New HampshireAlaska
IowaIndiana
TexasIllinois
NATIONAL AVERAGENew Jersey
NevadaPennsylvania
WASHINGTONConnecticut
VirginiaUtahOhio
TennesseeColorado
Rhode IslandMassachusetts
HawaiiOregonFlorida
IdahoNorth Carolina
New MexicoCalifornia
West VirginiaGeorgia
MissouriLouisiana

10

11
Part Two
National Comparisons of Tuition and Required Fees by State
2005-06 through 2009-10
Tables 1 through 10 provide tuition and required fee rates and changes over the last five academic years. National Tables 1 through 8 display tuition and required fee rates for full-time undergraduate and graduate students at public four-year institutions. National Tables 9 and 10 display state-reported averages for community colleges. Tables 1 through 10 are listed in alphabetical order by state.

12
2005-06 2006-07 2007-08 2008-09 2009-10One Year Four Year
Alabama 4,864 5,278 5,700 6,400 7,000 9.4% 43.9%Alaska 3,951 4,308 4,573 4,908 5,133 4.6% 29.9%Arizona 4,393 4,754 5,037 5,531 6,842 23.7% 55.7%Arkansas 5,495 5,808 6,038 6,399 6,459 0.9% 17.5%California 7,434 7,800 8,385 8,932 9,434 5.6% 26.9%Colorado 5,372 5,643 6,635 7,278 7,932 9.0% 47.7%Connecticut 7,912 8,362 8,842 9,338 9,886 5.9% 24.9%Delaware 7,318 7,940 8,150 8,646 9,486 9.7% 29.6%Florida 3,094 3,206 3,372 * 3,777 4,373 15.8% 41.3%Georgia 4,628 4,964 5,622 * 6,030 7,630 26.5% 64.9%Hawaii 3,697 4,523 5,391 6,259 7,168 14.5% 93.9%Idaho 3,968 4,200 4,410 4,632 4,932 6.5% 24.3%Illinois 8,634 9,882 11,130 * 12,240 12,660 3.4% 46.6%Indiana 7,161 7,513 7,837 8,281 8,663 4.6% 21.0%Iowa 5,612 6,115 6,273 6,524 6,824 4.6% 21.6%Kansas 5,413 6,153 6,600 7,042 7,414 5.3% 37.0%Kentucky 5,896 6,604 7,199 * 7,848 8,241 5.0% 39.8%Louisiana 4,509 4,621 4,675 5,086 5,233 2.9% 16.1%Maine 6,910 7,494 8,330 9,100 9,626 5.8% 39.3%Maryland 7,821 7,906 7,969 8,005 8,043 0.5% 2.8%Massachusetts 9,278 9,600 9,924 10,234 10,634 3.9% 14.6%Michigan 9,213 9,723 10,447 11,037 11,659 5.6% 26.5%Minnesota 8,622 9,432 9,598 10,634 11,293 6.2% 31.0%Mississippi 4,320 4,603 4,934 5,107 5,106 0.0% 18.2%Missouri 7,415 7,784 8,098 8,467 8,501 0.4% 14.6%Montana 4,894 5,227 5,141 5,141 5,334 3.8% 9.0%Nebraska 5,526 5,867 6,216 6,585 6,857 4.1% 24.1%Nevada 3,476 3,684 4,029 4,561 4,901 7.5% 41.0%New Hampshire 9,778 10,401 11,070 11,680 12,743 9.1% 30.3%New Jersey 9,237 9,958 10,686 11,540 11,886 3.0% 28.7%New Mexico 4,108 4,337 4,571 4,834 5,101 5.5% 24.2%New York 6,068 6,129 6,218 6,285 7,014 11.6% 15.6%North Carolina 4,613 5,033 5,340 5,397 5,625 4.2% 21.9%North Dakota 5,327 5,792 6,130 6,513 6,727 3.3% 26.3%Ohio 7,795 8,667 8,676 * 8,679 8,706 0.3% 11.7%Oklahoma 4,408 5,110 5,607 6,493 6,493 0.0% 47.3%Oregon 5,193 5,970 6,168 6,435 7,430 15.5% 43.1%Pennsylvania 11,508 11,905 12,844 13,706 14,416 5.2% 25.3%Rhode Island 7,284 7,724 8,184 8,678 * 9,528 9.8% 30.8%South Carolina 7,314 7,808 8,346 8,838 9,156 3.6% 25.2%South Dakota 4,829 5,072 5,393 5,828 6,468 11.0% 33.9%Tennessee 5,290 5,576 5,932 6,250 6,850 9.6% 29.5%Texas 7,438 7,986 8,060 8,438 8,842 4.8% 18.9%Utah 4,298 4,663 4,987 5,285 5,745 8.7% 33.7%Vermont 10,748 11,324 12,054 12,844 13,554 5.5% 26.1%Virginia 7,180 7,845 8,500 9,300 9,672 4.0% 34.7%WASHINGTON 5,505 5,880 6,280 * 6,697 * 7,587 * 13.3% 37.8%West Virginia 4,164 4,476 4,722 5,100 5,304 4.0% 27.4%Wisconsin 6,280 6,726 7,184 7,569 8,310 9.8% 32.3%Wyoming 3,426 3,515 3,552 3,621 3,726 2.9% 8.8%
National Average 6,172 6,618 7,021 7,481 7,963 6.4% 29.0%Washington Rank 26 27 25 25 25
CHANGES FROM PREVIOUS YEAR:National Average 7.2% 6.1% 6.5% 6.4%Washington 6.8% 6.8% 6.6% 13.3%
^Fees reduced from prior academic year. *See Endnotes.
Percentage Change
NATIONAL - TABLE 1
RESIDENT UNDERGRADUATE TUITION AND REQUIRED FEESFLAGSHIP UNIVERSITIES

13
2005-06 2006-07 2007-08 2008-09 2009-10One Year Four Year
Alabama 13,516 15,294 16,518 18,000 19,200 6.7% 42.1%Alaska 11,724 12,845 13,722 14,328 15,231 6.3% 29.9%Arizona 13,023 ^ 14,960 16,271 18,665 22,251 19.2% 70.9%Arkansas 13,222 13,942 14,492 15,276 15,336 0.4% 16.0%California 25,254 26,484 28,005 29,540 33,051 11.9% 30.9%Colorado 22,826 23,539 24,797 26,756 28,186 5.3% 23.5%Connecticut 20,416 21,562 22,786 24,050 25,486 6.0% 24.8%Delaware 17,474 18,450 19,400 21,126 23,366 10.6% 33.7%Florida 16,610 17,791 18,686 20,831 22,574 8.4% 35.9%Georgia 16,848 18,040 20,726 * 22,342 * 25,840 15.7% 53.4%Hawaii 10,177 12,395 14,655 16,915 19,216 13.6% 88.8%Idaho 12,738 13,800 14,490 14,712 15,012 2.0% 17.9%Illinois 22,720 23,968 25,216 * 26,024 * 26,802 3.0% 18.0%Indiana 19,558 20,522 22,316 24,769 26,160 5.6% 33.8%Iowa 16,998 18,339 19,445 20,638 22,198 7.6% 30.6%Kansas 13,866 15,123 16,107 17,119 18,097 5.7% 30.5%Kentucky 12,884 14,063 14,995 * 15,990 * 16,790 5.0% 30.3%Louisiana 12,809 12,921 12,975 13,800 14,363 4.1% 12.1%Maine 17,050 18,444 20,540 22,510 23,876 6.1% 40.0%Maryland 20,145 21,345 22,208 23,076 23,990 4.0% 19.1%Massachusetts 18,397 19,322 20,502 21,732 23,232 6.9% 26.3%Michigan 27,601 29,131 29,131 33,069 34,937 5.6% 26.6%Minnesota 20,252 21,062 21,228 14,634 15,293 4.5% -24.5%Mississippi 9,744 10,566 11,438 12,467 13,046 4.6% 33.9%Missouri 17,192 18,050 18,754 19,558 19,592 0.2% 14.0%Montana 13,883 15,032 16,558 16,558 17,767 7.3% 28.0%Nebraska 14,436 15,317 16,236 17,205 17,897 4.0% 24.0%Nevada 12,943 13,595 14,839 15,656 17,241 10.1% 33.2%New Hampshire 21,498 22,851 24,030 25,160 26,713 6.2% 24.3%New Jersey 16,835 18,463 19,855 21,488 22,518 4.8% 33.8%New Mexico 13,437 14,132 14,942 15,708 17,253 9.8% 28.4%New York 12,328 12,389 12,478 12,545 14,914 18.9% 21.0%North Carolina 18,411 19,681 20,988 22,295 23,513 5.5% 27.7%North Dakota 12,659 13,786 14,523 15,325 15,846 3.4% 25.2%Ohio 19,018 20,562 21,285 * 21,918 * 22,278 1.6% 17.1%Oklahoma 12,301 13,399 14,721 16,474 16,474 0.0% 33.9%Oregon 16,569 18,768 19,332 19,992 23,720 18.6% 43.2%Pennsylvania 21,744 22,453 23,712 24,940 25,946 4.0% 19.3%Rhode Island 19,926 21,424 23,038 24,776 * 26,026 5.0% 30.6%South Carolina 18,956 20,236 21,632 22,908 23,732 3.6% 25.2%South Dakota 9,816 6,263 ^ 6,630 7,148 7,841 9.7% -20.1%Tennessee 16,360 17,142 18,714 19,208 20,946 9.0% 28.0%Texas 16,636 16,710 17,816 19,136 20,416 6.7% 22.7%Utah 13,371 14,593 15,662 16,600 18,136 9.3% 35.6%Vermont 24,934 26,308 27,938 29,682 31,410 5.8% 26.0%Virginia 24,100 25,945 27,750 29,600 31,672 7.0% 31.4%WASHINGTON 19,802 21,178 22,026 * 23,114 * 24,262 * 5.0% 22.5%West Virginia 12,874 13,840 14,600 15,770 16,402 4.0% 27.4%Wisconsin 20,280 20,726 21,434 21,818 23,059 5.7% 13.7%Wyoming 9,816 10,055 10,392 11,031 11,646 5.6% 18.6%
National Average 16,720 17,736 18,811 19,880 21,215 6.7% 26.9%Washington Rank 14 12 13 12 13
CHANGES FROM PREVIOUS YEAR:National Average 6.1% 6.1% 5.7% 6.7%Washington 6.9% 4.0% 4.9% 5.0%
^Fees reduced from prior academic year. *See Endnotes.
NATIONAL - TABLE 2FLAGSHIP UNIVERSITIES
NONRESIDENT UNDERGRADUATE TUITION AND REQUIRED FEES
Percentage Change

14
2005-06 2006-07 2007-08 2008-09 2009-10One Year Four Year
Alabama 4,864 5,278 5,700 6,400 7,000 9.4% 43.9%Alaska 5,574 6,083 6,491 6,928 7,212 4.1% 29.4%Arizona 4,733 5,440 5,757 6,321 7,632 20.7% 61.3%Arkansas 7,009 6,165 ^ 6,423 6,784 6,825 0.6% -2.6%California 8,440 8,868 9,579 10,214 10,444 2.3% 23.7%Colorado 6,956 7,659 8,247 8,934 9,685 8.4% 39.2%Connecticut 8,970 9,510 10,052 10,594 11,226 6.0% 25.2%Delaware 17,336 18,306 19,244 20,946 22,952 9.6% 32.4%Florida 4,792 5,689 6,232 6,826 7,985 17.0% 66.6%Georgia 5,358 5,658 6,170 6,670 7,560 13.3% 41.1%Hawaii 5,013 6,055 7,139 8,223 9,348 13.7% 86.5%Idaho 4,508 4,740 4,950 5,212 5,556 6.6% 23.2%Illinois 6,492 7,378 9,346 10,293 10,759 4.5% 65.7%Indiana 6,258 6,594 7,207 7,870 7,898 0.4% 26.2%Iowa 6,424 6,959 7,158 7,436 7,863 5.7% 22.4%Kansas 4,638 5,181 5,569 5,949 6,257 5.2% 34.9%Kentucky 6,318 7,036 7,670 8,360 8,778 5.0% 38.9%Louisiana 4,407 4,501 4,563 4,919 5,752 16.9% 30.5%Maine 6,072 6,564 7,368 8,070 8,580 6.3% 41.3%Maryland 8,861 9,320 9,721 10,132 10,626 4.9% 19.9%Massachusetts 9,557 9,884 10,095 10,408 10,928 5.0% 14.3%Michigan 14,271 14,991 15,747 16,541 17,475 5.6% 22.5%Minnesota 9,655 11,146 11,388 12,608 13,401 6.3% 38.8%Mississippi 4,320 4,603 4,934 5,107 5,106 0.0% 18.2%Missouri 7,171 7,532 7,804 8,154 8,187 0.4% 14.2%Montana 4,613 4,882 5,828 5,828 6,038 3.6% 30.9%Nebraska 4,906 5,207 5,517 5,839 6,083 4.2% 24.0%Nevada 3,232 3,487 3,937 4,552 4,917 8.0% 52.1%New Hampshire 9,296 9,883 10,506 11,166 11,930 6.8% 28.3%New Jersey 11,681 12,840 13,836 14,976 15,429 3.0% 32.1%New Mexico 4,517 4,765 5,023 5,306 5,597 5.5% 23.9%New York 8,170 8,219 8,289 8,341 9,883 18.5% 21.0%North Carolina 5,014 5,680 6,236 6,693 7,162 7.0% 42.8%North Dakota 5,659 6,154 6,510 6,912 7,140 3.3% 26.2%Ohio 8,832 9,438 9,972 10,440 10,708 2.6% 21.2%Oklahoma 3,579 4,130 4,521 5,175 5,175 0.0% 44.6%Oregon 10,548 11,055 11,577 12,144 12,698 4.6% 20.4%Pennsylvania 13,003 13,483 14,508 15,468 16,258 5.1% 25.0%Rhode Island 7,308 7,858 8,444 9,080 * 9,946 9.5% 36.1%South Carolina 8,138 8,688 9,288 9,836 10,188 3.6% 25.2%South Dakota 4,008 4,202 4,448 4,795 5,258 9.7% 31.2%Tennessee 6,000 6,320 6,720 7,074 7,748 9.5% 29.1%Texas 5,656 6,421 6,448 7,126 7,732 8.5% 36.7%Utah 3,787 4,105 4,390 4,653 5,059 8.7% 33.6%Vermont 8,596 11,158 11,880 12,664 13,370 5.6% 55.5%Virginia 9,800 10,550 11,240 12,140 12,628 4.0% 28.9%WASHINGTON 8,402 8,963 9,812 * 10,442 * 11,122 * 6.5% 32.4%West Virginia 4,582 4,926 5,196 5,612 5,838 4.0% 27.4%Wisconsin 8,734 9,180 9,638 10,023 10,514 4.9% 20.4%Wyoming 3,766 3,875 4,014 3,933 4,556 15.9% 21.0%
National Average 6,996 7,532 8,047 8,602 9,160 6.5% 30.9%Washington Rank 16 15 13 11 11
CHANGES FROM PREVIOUS YEAR:National Average 7.7% 6.8% 6.9% 6.5%Washington 6.7% 9.5% 6.4% 6.5%
^Fees reduced from prior academic year. *See Endnotes.
NATIONAL - TABLE 3
RESIDENT GRADUATE TUITION AND REQUIRED FEESFLAGSHIP UNIVERSITIES
Percentage Change

15
2005-06 2006-07 2007-08 2008-09 2009-10One Year Four Year
Alabama 13,516 15,294 16,518 18,000 19,200 6.7% 42.1%Alaska 10,755 11,755 12,590 13,208 13,944 5.6% 29.7%Arizona 13,381 15,230 16,564 18,958 22,544 18.9% 68.5%Arkansas 15,417 13,540 ^ 14,089 14,833 14,874 0.3% -3.5%California 23,401 23,829 24,567 25,220 26,386 4.6% 12.8%Colorado 22,436 22,865 23,161 24,126 24,841 3.0% 10.7%Connecticut 21,030 22,290 23,534 24,814 26,310 6.0% 25.1%Delaware 17,336 18,306 19,244 20,946 22,952 9.6% 32.4%Florida 17,799 18,293 18,836 19,430 22,480 15.7% 26.3%Georgia 19,758 20,778 21,424 22,078 22,464 1.7% 13.7%Hawaii 11,301 13,927 16,595 19,263 21,972 14.1% 94.4%Idaho 13,278 14,340 15,030 15,292 15,636 2.2% 17.8%Illinois 15,052 15,938 19,813 20,921 21,814 4.3% 44.9%Indiana 16,657 17,669 19,390 21,271 21,299 0.1% 27.9%Iowa 17,328 18,353 19,144 20,318 # 21,467 5.7% 23.9%Kansas 10,589 11,490 12,257 13,038 13,772 5.6% 30.1%Kentucky 13,968 15,154 16,158 17,228 18,089 5.0% 29.5%Louisiana 12,707 12,801 12,862 13,633 14,902 9.3% 17.3%Maine 16,232 17,544 19,588 21,490 22,800 6.1% 40.5%Maryland 17,401 18,820 19,601 20,412 21,526 5.5% 23.7%Massachusetts 18,006 18,910 19,178 20,140 21,430 6.4% 19.0%Michigan 28,689 30,137 31,657 33,255 35,133 5.6% 22.5%Minnesota 17,330 18,244 18,486 19,701 20,499 4.1% 18.3%Mississippi 9,744 10,566 11,438 12,467 13,046 4.6% 33.9%Missouri 17,167 18,027 18,697 19,414 19,527 0.6% 13.7%Montana 12,583 13,579 17,224 17,224 19,751 14.7% 57.0%Nebraska 11,666 12,372 13,117 13,894 14,458 4.1% 23.9%Nevada 12,699 13,398 14,747 15,647 17,257 10.3% 35.9%New Hampshire 21,016 22,333 23,476 24,646 25,900 5.1% 23.2%New Jersey 16,762 18,430 19,862 21,528 22,581 4.9% 34.7%New Mexico 13,814 14,575 15,361 16,146 17,732 9.8% 28.4%New York 12,190 12,239 12,309 12,361 14,763 19.4% 21.1%North Carolina 19,012 19,678 20,234 21,091 21,560 2.2% 13.4%North Dakota 13,547 14,752 15,537 16,390 16,949 3.4% 25.1%Ohio 21,429 22,791 24,126 25,302 25,948 2.6% 21.1%Oklahoma 10,061 10,936 12,005 13,369 13,369 0.0% 32.9%Oregon 15,138 15,591 16,341 17,166 17,990 4.8% 18.8%Pennsylvania 23,488 24,323 25,710 27,084 28,210 4.2% 20.1%Rhode Island 17,778 19,114 20,552 22,102 * 23,218 5.0% 30.6%South Carolina 17,156 18,316 19,580 20,736 21,480 3.6% 25.2%South Dakota 8,521 8,895 9,329 10,006 8,363 -16.4% -1.9%Tennessee 17,070 17,886 18,962 20,032 21,844 9.0% 28.0%Texas 11,604 13,162 12,774 ^ 13,574 14,294 5.3% 23.2%Utah 11,809 12,885 13,829 14,658 16,014 9.3% 35.6%Vermont 20,416 26,142 27,764 29,502 31,226 5.8% 52.9%Virginia 20,400 20,550 21,240 22,140 22,628 2.2% 10.9%WASHINGTON 19,452 20,786 21,609 * 22,914 * 24,462 * 6.8% 25.8%West Virginia 13,282 14,278 15,064 16,270 16,920 4.0% 27.4%Wisconsin 24,004 24,450 24,908 24,944 25,068 0.5% 4.4%Wyoming 9,586 9,815 10,134 9,765 11,366 16.4% 18.6%
National Average 16,095 17,108 18,124 19,159 20,245 5.7% 25.8%Washington Rank 12 10 10 10 10
CHANGES FROM PREVIOUS YEAR:National Average 6.3% 5.9% 5.7% 5.7%Washington 6.9% 4.0% 6.0% 6.8%
^Fees reduced from prior academic year. *See Endnotes.#Revised from 2008-09 report.
NATIONAL - TABLE 4FLAGSHIP UNIVERSITIES
NONRESIDENT GRADUATE TUITION AND REQUIRED FEES
Percentage Change

16
2005-06 2006-07 2007-08 2008-09 2009-10
One Year Four YearAlabama 5 4,570 4,627 5,107 5,664 6,252 10.4% 36.8%Arizona 2 4,446 4,616 4,905 5,553 6,734 21.3% 51.5%Arkansas 4 4,951 5,188 5,409 5,726 5,857 2.3% 18.3%California 11 3,225 3,228 3,604 3,927 4,956 26.2% 53.7%Colorado 5 3,212 3,287 3,636 3,937 4,451 13.1% 38.6%Connecticut 3 5,925 6,231 6,660 7,103 7,485 5.4% 26.3%Florida ** 3,288 3,383 3,565 * 3,839 4,372 13.9% 33.0%Georgia 8 3,245 3,434 3,852 * 4,200 5,403 28.7% 66.5%Idaho 2 3,936 4,172 4,405 4,648 4,916 5.8% 24.9%Illinois 5 6,780 7,511 8,335 * 9,165 9,933 8.4% 46.5%Indiana 2 6,171 6,643 6,990 7,334 7,628 4.0% 23.6%Iowa 1 5,602 6,112 6,190 6,376 6,636 4.1% 18.5%Kansas 4 3,538 3,771 4,037 4,271 4,549 6.5% 28.6%Kentucky 7 4,813 5,367 5,810 6,316 6,597 4.5% 37.1%Louisiana 7 3,412 3,570 3,641 3,830 4,026 5.1% 18.0%Maine 3 4,836 5,259 5,754 6,388 6,759 5.8% 39.8%Maryland 6 6,755 6,942 7,168 7,353 # 7,533 2.5% 11.5%Massachusetts 7 5,882 6,286 6,592 6,917 7,348 6.2% 24.9%Michigan 6 6,256 6,687 7,328 7,981 8,700 9.0% 39.1%Minnesota ** 5,251 5,656 5,894 6,083 6,295 3.5% 19.9%Mississippi 5 3,982 4,231 4,468 4,645 4,645 0.0% 16.7%Missouri 5 5,112 5,386 5,740 5,983 5,986 0.0% 17.1%Montana 2 4,403 4,615 4,403 4,403 4,448 1.0% 1.0%Nebraska 2 4,234 4,479 4,768 4,999 5,219 4.4% 23.3%Nevada 1 3,270 3,732 4,081 4,493 4,977 10.8% 52.2%New Hampshire 2 7,190 7,639 8,121 8,601 9,139 6.3% 27.1%New Jersey 7 8,653 9,269 9,919 10,749 11,133 3.6% 28.7%New Mexico 1 2,864 3,065 3,223 3,431 3,588 4.6% 25.3%New York 10 5,238 5,318 5,379 5,363 6,027 12.4% 15.1%North Carolina 5 3,244 3,652 3,915 3,967 4,148 4.6% 27.9%North Dakota 4 4,530 4,882 5,142 5,391 5,589 3.7% 23.4%Ohio 4 7,567 8,162 8,167 * 8,254 8,387 1.6% 10.8%Oklahoma 6 3,284 3,500 3,820 4,189 4,189 0.0% 27.6%Oregon 4 4,727 5,551 5,858 6,106 6,511 6.6% 37.7%Pennsylvania 14 6,263 6,464 6,743 7,034 7,345 4.4% 17.3%Rhode Island 1 4,676 4,958 5,256 5,771 * 6,408 11.0% 37.0%South Carolina 1 5,984 6,512 7,038 7,632 7,960 4.3% 33.0%South Dakota 2 4,793 5,351 5,743 6,187 6,550 5.9% 36.6%Tennessee 6 4,629 4,808 5,212 5,520 5,910 7.1% 27.7%Texas 9 4,682 5,121 5,481 5,966 6,358 6.6% 35.8%Utah 1 3,165 3,432 3,664 3,854 4,087 6.0% 29.1%Vermont 2 6,484 6,828 7,243 7,684 8,196 6.7% 26.4%Virginia 5 5,906 6,426 6,854 7,286 7,683 5.5% 30.1%WASHINGTON 3 4,178 4,419 4,572 * 4,819 * 5,502 * 14.2% 31.7%West Virginia 7 3,886 4,141 4,387 4,654 5,005 7.5% 28.8%Wisconsin 4 5,072 5,334 5,703 6,051 6,395 5.7% 26.1%
4,872 5,201 5,517 5,862 6,257 6.7% 28.4%Washington Rank 32 32 31 31 30
CHANGES FROM PREVIOUS YEAR:National Average 6.8% 6.1% 6.2% 6.7%Washington 5.8% 3.4% 5.4% 14.2%
^Fees reduced from prior academic year. *See Endnotes.^^Alaska, Delaware, Hawaii, and Wyoming are not included.** Florida and Minnesota reported a single state comprehensive college and university tuition and required fees rate.#Revised from 2008-09 report.
NATIONAL - TABLE 5COMPREHENSIVE COLLEGES AND UNIVERSITIES
RESIDENT UNDERGRADUATE TUITION AND REQUIRED FEES (State Averages)
Number of Institutions in Survey
Percentage Change
National Average^^
17
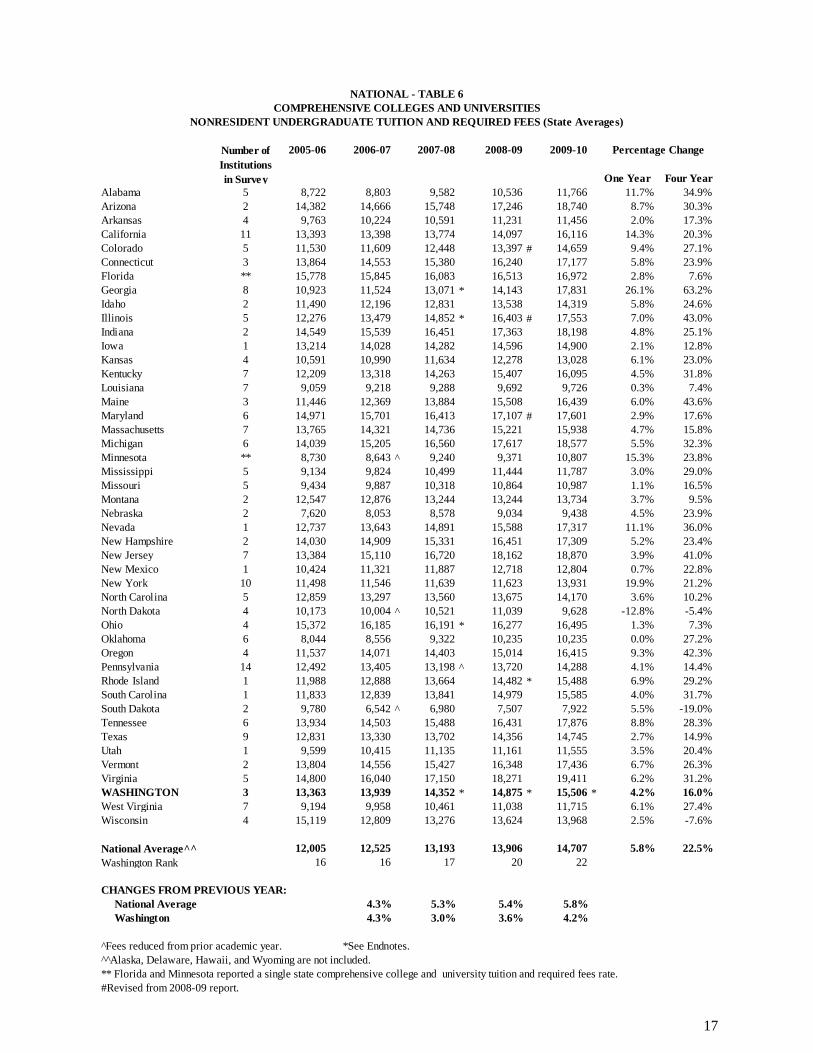
2005-06 2006-07 2007-08 2008-09 2009-10
One Year Four YearAlabama 5 8,722 8,803 9,582 10,536 11,766 11.7% 34.9%Arizona 2 14,382 14,666 15,748 17,246 18,740 8.7% 30.3%Arkansas 4 9,763 10,224 10,591 11,231 11,456 2.0% 17.3%California 11 13,393 13,398 13,774 14,097 16,116 14.3% 20.3%Colorado 5 11,530 11,609 12,448 13,397 # 14,659 9.4% 27.1%Connecticut 3 13,864 14,553 15,380 16,240 17,177 5.8% 23.9%Florida ** 15,778 15,845 16,083 16,513 16,972 2.8% 7.6%Georgia 8 10,923 11,524 13,071 * 14,143 17,831 26.1% 63.2%Idaho 2 11,490 12,196 12,831 13,538 14,319 5.8% 24.6%Illinois 5 12,276 13,479 14,852 * 16,403 # 17,553 7.0% 43.0%Indiana 2 14,549 15,539 16,451 17,363 18,198 4.8% 25.1%Iowa 1 13,214 14,028 14,282 14,596 14,900 2.1% 12.8%Kansas 4 10,591 10,990 11,634 12,278 13,028 6.1% 23.0%Kentucky 7 12,209 13,318 14,263 15,407 16,095 4.5% 31.8%Louisiana 7 9,059 9,218 9,288 9,692 9,726 0.3% 7.4%Maine 3 11,446 12,369 13,884 15,508 16,439 6.0% 43.6%Maryland 6 14,971 15,701 16,413 17,107 # 17,601 2.9% 17.6%Massachusetts 7 13,765 14,321 14,736 15,221 15,938 4.7% 15.8%Michigan 6 14,039 15,205 16,560 17,617 18,577 5.5% 32.3%Minnesota ** 8,730 8,643 ^ 9,240 9,371 10,807 15.3% 23.8%Mississippi 5 9,134 9,824 10,499 11,444 11,787 3.0% 29.0%Missouri 5 9,434 9,887 10,318 10,864 10,987 1.1% 16.5%Montana 2 12,547 12,876 13,244 13,244 13,734 3.7% 9.5%Nebraska 2 7,620 8,053 8,578 9,034 9,438 4.5% 23.9%Nevada 1 12,737 13,643 14,891 15,588 17,317 11.1% 36.0%New Hampshire 2 14,030 14,909 15,331 16,451 17,309 5.2% 23.4%New Jersey 7 13,384 15,110 16,720 18,162 18,870 3.9% 41.0%New Mexico 1 10,424 11,321 11,887 12,718 12,804 0.7% 22.8%New York 10 11,498 11,546 11,639 11,623 13,931 19.9% 21.2%North Carolina 5 12,859 13,297 13,560 13,675 14,170 3.6% 10.2%North Dakota 4 10,173 10,004 ^ 10,521 11,039 9,628 -12.8% -5.4%Ohio 4 15,372 16,185 16,191 * 16,277 16,495 1.3% 7.3%Oklahoma 6 8,044 8,556 9,322 10,235 10,235 0.0% 27.2%Oregon 4 11,537 14,071 14,403 15,014 16,415 9.3% 42.3%Pennsylvania 14 12,492 13,405 13,198 ^ 13,720 14,288 4.1% 14.4%Rhode Island 1 11,988 12,888 13,664 14,482 * 15,488 6.9% 29.2%South Carolina 1 11,833 12,839 13,841 14,979 15,585 4.0% 31.7%South Dakota 2 9,780 6,542 ^ 6,980 7,507 7,922 5.5% -19.0%Tennessee 6 13,934 14,503 15,488 16,431 17,876 8.8% 28.3%Texas 9 12,831 13,330 13,702 14,356 14,745 2.7% 14.9%Utah 1 9,599 10,415 11,135 11,161 11,555 3.5% 20.4%Vermont 2 13,804 14,556 15,427 16,348 17,436 6.7% 26.3%Virginia 5 14,800 16,040 17,150 18,271 19,411 6.2% 31.2%WASHINGTON 3 13,363 13,939 14,352 * 14,875 * 15,506 * 4.2% 16.0%West Virginia 7 9,194 9,958 10,461 11,038 11,715 6.1% 27.4%Wisconsin 4 15,119 12,809 13,276 13,624 13,968 2.5% -7.6%
12,005 12,525 13,193 13,906 14,707 5.8% 22.5%Washington Rank 16 16 17 20 22
CHANGES FROM PREVIOUS YEAR:National Average 4.3% 5.3% 5.4% 5.8%Washington 4.3% 3.0% 3.6% 4.2%
^Fees reduced from prior academic year. *See Endnotes.^^Alaska, Delaware, Hawaii, and Wyoming are not included.** Florida and Minnesota reported a single state comprehensive college and university tuition and required fees rate.#Revised from 2008-09 report.
NATIONAL - TABLE 6COMPREHENSIVE COLLEGES AND UNIVERSITIES
NONRESIDENT UNDERGRADUATE TUITION AND REQUIRED FEES (State Averages)
Number of Institutions in Survey
Percentage Change
National Average^^
18
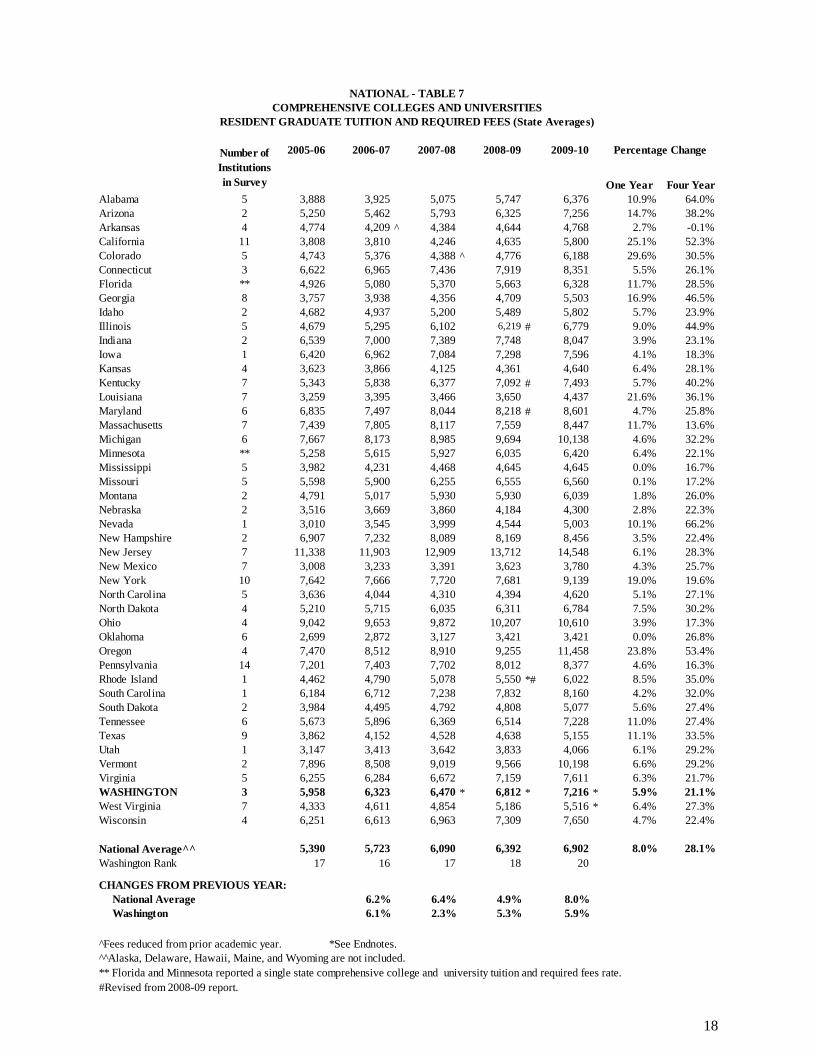
2005-06 2006-07 2007-08 2008-09 2009-10
One Year Four YearAlabama 5 3,888 3,925 5,075 5,747 6,376 10.9% 64.0%Arizona 2 5,250 5,462 5,793 6,325 7,256 14.7% 38.2%Arkansas 4 4,774 4,209 ^ 4,384 4,644 4,768 2.7% -0.1%California 11 3,808 3,810 4,246 4,635 5,800 25.1% 52.3%Colorado 5 4,743 5,376 4,388 ^ 4,776 6,188 29.6% 30.5%Connecticut 3 6,622 6,965 7,436 7,919 8,351 5.5% 26.1%Florida ** 4,926 5,080 5,370 5,663 6,328 11.7% 28.5%Georgia 8 3,757 3,938 4,356 4,709 5,503 16.9% 46.5%Idaho 2 4,682 4,937 5,200 5,489 5,802 5.7% 23.9%Illinois 5 4,679 5,295 6,102 6,219 # 6,779 9.0% 44.9%Indiana 2 6,539 7,000 7,389 7,748 8,047 3.9% 23.1%Iowa 1 6,420 6,962 7,084 7,298 7,596 4.1% 18.3%Kansas 4 3,623 3,866 4,125 4,361 4,640 6.4% 28.1%Kentucky 7 5,343 5,838 6,377 7,092 # 7,493 5.7% 40.2%Louisiana 7 3,259 3,395 3,466 3,650 4,437 21.6% 36.1%Maryland 6 6,835 7,497 8,044 8,218 # 8,601 4.7% 25.8%Massachusetts 7 7,439 7,805 8,117 7,559 8,447 11.7% 13.6%Michigan 6 7,667 8,173 8,985 9,694 10,138 4.6% 32.2%Minnesota ** 5,258 5,615 5,927 6,035 6,420 6.4% 22.1%Mississippi 5 3,982 4,231 4,468 4,645 4,645 0.0% 16.7%Missouri 5 5,598 5,900 6,255 6,555 6,560 0.1% 17.2%Montana 2 4,791 5,017 5,930 5,930 6,039 1.8% 26.0%Nebraska 2 3,516 3,669 3,860 4,184 4,300 2.8% 22.3%Nevada 1 3,010 3,545 3,999 4,544 5,003 10.1% 66.2%New Hampshire 2 6,907 7,232 8,089 8,169 8,456 3.5% 22.4%New Jersey 7 11,338 11,903 12,909 13,712 14,548 6.1% 28.3%New Mexico 7 3,008 3,233 3,391 3,623 3,780 4.3% 25.7%New York 10 7,642 7,666 7,720 7,681 9,139 19.0% 19.6%North Carolina 5 3,636 4,044 4,310 4,394 4,620 5.1% 27.1%North Dakota 4 5,210 5,715 6,035 6,311 6,784 7.5% 30.2%Ohio 4 9,042 9,653 9,872 10,207 10,610 3.9% 17.3%Oklahoma 6 2,699 2,872 3,127 3,421 3,421 0.0% 26.8%Oregon 4 7,470 8,512 8,910 9,255 11,458 23.8% 53.4%Pennsylvania 14 7,201 7,403 7,702 8,012 8,377 4.6% 16.3%Rhode Island 1 4,462 4,790 5,078 5,550 *# 6,022 8.5% 35.0%South Carolina 1 6,184 6,712 7,238 7,832 8,160 4.2% 32.0%South Dakota 2 3,984 4,495 4,792 4,808 5,077 5.6% 27.4%Tennessee 6 5,673 5,896 6,369 6,514 7,228 11.0% 27.4%Texas 9 3,862 4,152 4,528 4,638 5,155 11.1% 33.5%Utah 1 3,147 3,413 3,642 3,833 4,066 6.1% 29.2%Vermont 2 7,896 8,508 9,019 9,566 10,198 6.6% 29.2%Virginia 5 6,255 6,284 6,672 7,159 7,611 6.3% 21.7%WASHINGTON 3 5,958 6,323 6,470 * 6,812 * 7,216 * 5.9% 21.1%West Virginia 7 4,333 4,611 4,854 5,186 5,516 * 6.4% 27.3%Wisconsin 4 6,251 6,613 6,963 7,309 7,650 4.7% 22.4%
5,390 5,723 6,090 6,392 6,902 8.0% 28.1%Washington Rank 17 16 17 18 20
CHANGES FROM PREVIOUS YEAR:National Average 6.2% 6.4% 4.9% 8.0%Washington 6.1% 2.3% 5.3% 5.9%
^Fees reduced from prior academic year. *See Endnotes.^^Alaska, Delaware, Hawaii, Maine, and Wyoming are not included.** Florida and Minnesota reported a single state comprehensive college and university tuition and required fees rate.#Revised from 2008-09 report.
NATIONAL - TABLE 7COMPREHENSIVE COLLEGES AND UNIVERSITIES
RESIDENT GRADUATE TUITION AND REQUIRED FEES (State Averages)
Number of Institutions in Survey
Percentage Change
National Average^^
19
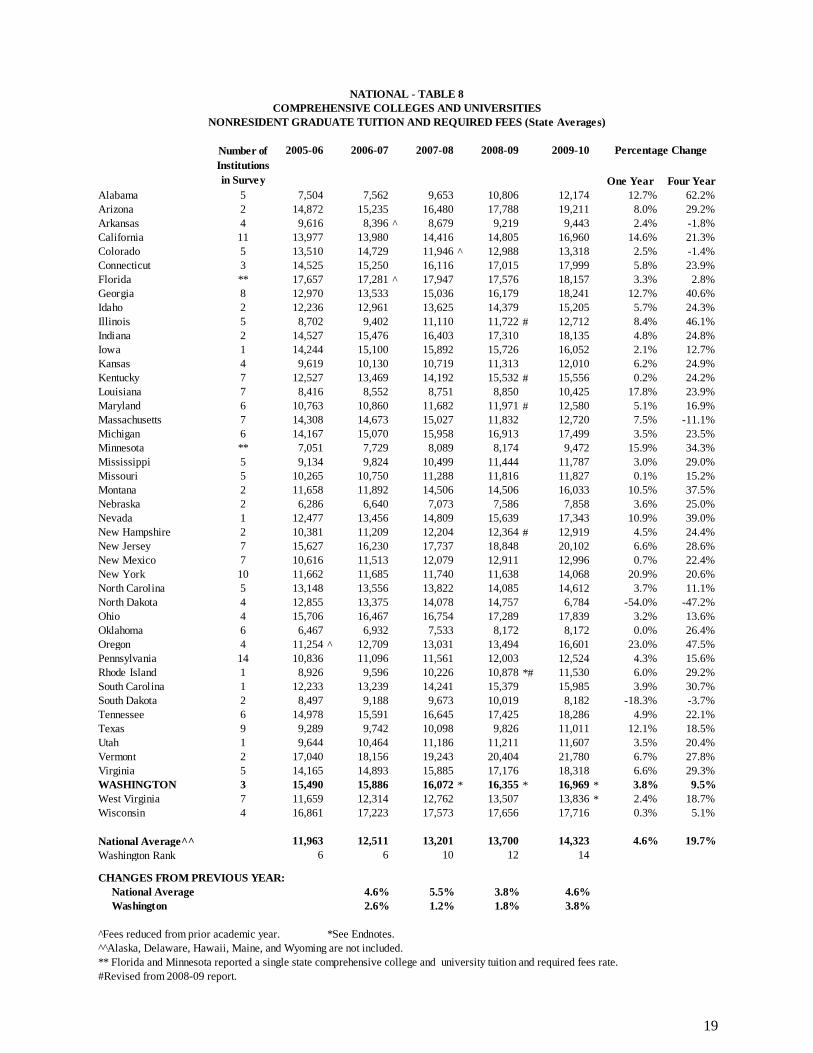
2005-06 2006-07 2007-08 2008-09 2009-10
One Year Four YearAlabama 5 7,504 7,562 9,653 10,806 12,174 12.7% 62.2%Arizona 2 14,872 15,235 16,480 17,788 19,211 8.0% 29.2%Arkansas 4 9,616 8,396 ^ 8,679 9,219 9,443 2.4% -1.8%California 11 13,977 13,980 14,416 14,805 16,960 14.6% 21.3%Colorado 5 13,510 14,729 11,946 ^ 12,988 13,318 2.5% -1.4%Connecticut 3 14,525 15,250 16,116 17,015 17,999 5.8% 23.9%Florida ** 17,657 17,281 ^ 17,947 17,576 18,157 3.3% 2.8%Georgia 8 12,970 13,533 15,036 16,179 18,241 12.7% 40.6%Idaho 2 12,236 12,961 13,625 14,379 15,205 5.7% 24.3%Illinois 5 8,702 9,402 11,110 11,722 # 12,712 8.4% 46.1%Indiana 2 14,527 15,476 16,403 17,310 18,135 4.8% 24.8%Iowa 1 14,244 15,100 15,892 15,726 16,052 2.1% 12.7%Kansas 4 9,619 10,130 10,719 11,313 12,010 6.2% 24.9%Kentucky 7 12,527 13,469 14,192 15,532 # 15,556 0.2% 24.2%Louisiana 7 8,416 8,552 8,751 8,850 10,425 17.8% 23.9%Maryland 6 10,763 10,860 11,682 11,971 # 12,580 5.1% 16.9%Massachusetts 7 14,308 14,673 15,027 11,832 12,720 7.5% -11.1%Michigan 6 14,167 15,070 15,958 16,913 17,499 3.5% 23.5%Minnesota ** 7,051 7,729 8,089 8,174 9,472 15.9% 34.3%Mississippi 5 9,134 9,824 10,499 11,444 11,787 3.0% 29.0%Missouri 5 10,265 10,750 11,288 11,816 11,827 0.1% 15.2%Montana 2 11,658 11,892 14,506 14,506 16,033 10.5% 37.5%Nebraska 2 6,286 6,640 7,073 7,586 7,858 3.6% 25.0%Nevada 1 12,477 13,456 14,809 15,639 17,343 10.9% 39.0%New Hampshire 2 10,381 11,209 12,204 12,364 # 12,919 4.5% 24.4%New Jersey 7 15,627 16,230 17,737 18,848 20,102 6.6% 28.6%New Mexico 7 10,616 11,513 12,079 12,911 12,996 0.7% 22.4%New York 10 11,662 11,685 11,740 11,638 14,068 20.9% 20.6%North Carolina 5 13,148 13,556 13,822 14,085 14,612 3.7% 11.1%North Dakota 4 12,855 13,375 14,078 14,757 6,784 -54.0% -47.2%Ohio 4 15,706 16,467 16,754 17,289 17,839 3.2% 13.6%Oklahoma 6 6,467 6,932 7,533 8,172 8,172 0.0% 26.4%Oregon 4 11,254 ^ 12,709 13,031 13,494 16,601 23.0% 47.5%Pennsylvania 14 10,836 11,096 11,561 12,003 12,524 4.3% 15.6%Rhode Island 1 8,926 9,596 10,226 10,878 *# 11,530 6.0% 29.2%South Carolina 1 12,233 13,239 14,241 15,379 15,985 3.9% 30.7%South Dakota 2 8,497 9,188 9,673 10,019 8,182 -18.3% -3.7%Tennessee 6 14,978 15,591 16,645 17,425 18,286 4.9% 22.1%Texas 9 9,289 9,742 10,098 9,826 11,011 12.1% 18.5%Utah 1 9,644 10,464 11,186 11,211 11,607 3.5% 20.4%Vermont 2 17,040 18,156 19,243 20,404 21,780 6.7% 27.8%Virginia 5 14,165 14,893 15,885 17,176 18,318 6.6% 29.3%WASHINGTON 3 15,490 15,886 16,072 * 16,355 * 16,969 * 3.8% 9.5%West Virginia 7 11,659 12,314 12,762 13,507 13,836 * 2.4% 18.7%Wisconsin 4 16,861 17,223 17,573 17,656 17,716 0.3% 5.1%
11,963 12,511 13,201 13,700 14,323 4.6% 19.7%Washington Rank 6 6 10 12 14
CHANGES FROM PREVIOUS YEAR:National Average 4.6% 5.5% 3.8% 4.6%Washington 2.6% 1.2% 1.8% 3.8%
^Fees reduced from prior academic year. *See Endnotes.^^Alaska, Delaware, Hawaii, Maine, and Wyoming are not included.** Florida and Minnesota reported a single state comprehensive college and university tuition and required fees rate.#Revised from 2008-09 report.
NATIONAL - TABLE 8COMPREHENSIVE COLLEGES AND UNIVERSITIES
NONRESIDENT GRADUATE TUITION AND REQUIRED FEES (State Averages)
Number of Institutions in Survey
Percentage Change
National Average^^

20
2005-06 2006-07 2007-08 2008-09 2009-10One Year Four Year
Alabama 2,700 2,700 2,700 2,700 2,700 0.0% 0.0%Alaska 3,335 3,672 3,917 4,100 4,315 5.2% 29.4%Arizona 1,584 1,718 1,806 1,917 1,950 1.7% 23.1%Arkansas 2,088 2,233 2,251 2,428 2,504 3.1% 19.9%California 780 690 ^ 600 ^ 600 780 30.0% 0.0%Colorado 1,980 ^ 2,024 2,598 2,722 2,962 8.8% 49.6%Connecticut 2,536 2,672 2,828 2,984 3,200 7.2% 26.2%Delaware 2,196 2,364 2,490 2,684 # 2,816 4.9% 28.2%Florida 1,915 2,034 2,034 2,283 2,553 11.8% 33.3%Georgia 1,733 1,938 2,113 2,293 2,995 30.6% 72.8%Hawaii 1,520 1,731 1,946 2,198 2,428 10.5% 59.7%Idaho 1,894 1,996 2,105 2,273 2,590 13.9% 36.7%Illinois 2,237 2,307 2,359 2,521 2,666 5.8% 19.2%Indiana 2,822 3,232 3,396 2,930 * 3,090 5.5% 9.5%Iowa 3,056 3,467 3,491 ^ 3,649 3,842 5.3% 25.7%Kansas 1,939 1,988 2,011 2,156 2,199 2.0% 13.4%Kentucky 2,940 3,270 3,450 3,630 3,750 3.3% 27.6%Louisiana 1,918 1,940 1,855 ^ 1,936 1,929 -0.4% 0.6%Maine 2,732 2,972 3,072 3,153 3,204 1.6% 17.3%Maryland 3,057 3,093 3,129 3,218 # 3,310 2.9% 8.3%Massachusetts 3,477 3,526 3,661 3,924 # 4,305 9.7% 23.8%Michigan 2,185 2,311 2,434 2,527 2,651 4.9% 21.3%Minnesota 4,042 4,283 4,444 4,565 4,697 2.9% 16.2%Mississippi 1,692 1,712 1,722 1,761 1,761 0.0% 4.1%Missouri 3,051 3,092 3,375 3,529 3,521 -0.2% 15.4%Montana 2,503 2,744 3,079 3,079 3,217 4.5% 28.5%Nebraska 1,884 1,998 2,160 2,225 2,320 4.3% 23.1%Nevada 1,643 1,695 1,763 1,838 1,965 6.9% 19.6%New Hampshire 5,689 5,537 ^ 5,903 5,953 6,262 5.2% 10.1%New Jersey 2,934 3,115 3,275 3,473 3,701 6.6% 26.1%New Mexico 1,191 1,243 909 ^ 913 1,125 23.2% -5.5%New York 3,257 3,425 3,563 4,033 4,057 0.6% 24.6%North Carolina 1,264 1,334 1,414 1,422 1,684 18.4% 33.2%North Dakota 3,202 3,442 3,624 3,779 3,808 0.8% 18.9%Ohio 3,011 3,169 3,179 3,187 * 3,440 * 7.9% 14.2%Oklahoma 2,165 2,294 2,479 2,684 2,706 0.8% 25.0%Oregon 2,980 3,108 3,127 3,206 3,567 11.3% 19.7%Pennsylvania 2,849 2,980 3,076 3,202 3,427 7.0% 20.3%Rhode Island 2,470 2,686 2,846 3,090 # 3,376 9.3% 36.7%South Carolina 3,132 3,295 3,412 3,583 3,740 4.4% 19.4%Tennessee 2,393 2,482 2,628 2,733 2,968 8.6% 24.0%Texas 1,493 1,722 1,639 ^ 1,750 1,849 5.7% 23.8%Utah 2,096 2,220 2,319 2,416 2,601 7.7% 24.1%Vermont 3,912 4,104 4,320 4,584 4,776 4.2% 22.1%Virginia 2,135 2,269 2,404 2,584 2,781 7.6% 30.3%WASHINGTON 2,445 2,586 2,676 * 2,730 * 2,925 * 7.1% 19.6%West Virginia 1,803 1,892 1,978 2,095 2,730 30.3% 51.4%Wisconsin 4,237 4,511 4,520 4,555 4,567 0.3% 7.8%Wyoming 1,818 1,836 1,923 2,027 2,118 4.5% 16.5%
Average^^ 2,488 2,626 2,735 2,854 3,029 6.2% 21.7%Washington Rank 24 24 24 24 26
CHANGES FROM PREVIOUS YEAR:National Average 5.5% 4.2% 4.3% 6.2%Washington 5.8% 3.5% 2.0% 7.1%
**In-district rates for Arizona, Arkansas, Colorado, Montana, Oregon, and Pennsylvania. ^^There are no community colleges operating in South Dakota.^Fees reduced from prior academic year. *See Endnotes.#Revised from 2008-09 report.
NATIONAL - TABLE 9COMMUNITY COLLEGES
RESIDENT TUITION AND REQUIRED FEES (Estimated State Averages)**
Percentage Change

21
2005-06 2006-07 2007-08 2008-09 2009-10One Year Four Year
Alabama 4,830 4,830 4,830 4,830 4,830 0.0% 0.0%Alaska 11,108 12,209 13,066 13,709 14,413 5.1% 29.8%Arizona 6,917 7,485 7,847 7,975 8,385 5.1% 21.2%Arkansas 3,839 3,960 4,026 4,259 4,317 1.4% 12.5%California 5,310 5,490 5,790 5,409 5,880 8.7% 10.7%Colorado 7,880 ^ 7,504 ^ 9,072 9,507 9,989 5.1% 26.8%Connecticut 7,568 7,976 8,444 8,912 9,560 7.3% 26.3%Delaware 5,130 5,470 5,740 6,194 6,524 5.3% 27.2%Florida 7,011 7,323 7,325 8,386 9,385 11.9% 33.9%Georgia 6,397 6,926 7,481 8,081 10,270 27.1% 60.5%Hawaii 7,310 7,659 8,010 8,399 8,758 4.3% 19.8%Idaho 5,840 6,072 6,281 6,589 6,995 6.2% 19.8%Illinois 7,455 ^ 8,062 7,933 ^ 8,010 8,684 8.4% 16.5%Indiana 6,705 6,973 7,516 5,879 * 6,306 7.3% -6.0%Iowa 4,379 4,893 4,821 ^ 4,971 4,858 -2.3% 10.9%Kansas 3,014 3,101 3,144 3,094 3,168 2.4% 5.1%Kentucky 8,820 9,810 10,350 11,700 12,750 9.0% 44.6%Louisiana 4,255 4,282 4,279 ^ 4,365 4,074 -6.7% -4.3%Maine 5,162 5,402 5,502 5,613 5,724 2.0% 10.9%Maryland 7,162 7,378 7,534 7,890 7,949 0.7% 11.0%Massachusetts 7,160 10,087 10,380 10,100 # 10,811 7.0% N/AMichigan 4,300 4,609 4,910 5,295 5,461 3.1% 27.0%Minnesota 5,783 ^ 6,353 5,379 ^ 5,400 5,605 3.8% -3.1%Mississippi 3,662 3,682 3,734 3,773 3,773 0.0% 3.0%Missouri 4,151 4,202 4,524 4,723 4,688 -0.7% 12.9%Montana 6,835 7,439 8,273 8,273 8,739 5.6% 27.9%Nebraska 2,445 2,589 2,786 2,870 2,979 3.8% 21.8%Nevada 6,558 6,657 7,148 7,547 8,153 8.0% 24.3%New Hampshire 12,955 12,321 ^ 13,103 13,153 13,782 4.8% 6.4%New Jersey 5,709 5,982 6,317 6,705 7,121 6.2% 24.7%New Mexico 2,989 3,209 2,174 ^ 2,114 2,931 38.6% -1.9%New York 6,469 6,767 6,915 7,201 7,316 1.6% 13.1%North Carolina 7,024 7,094 7,536 7,544 7,806 3.5% 11.1%North Dakota 6,157 6,664 6,311 ^* 6,601 6,630 0.4% 7.7%Ohio 6,317 6,413 6,424 6,429 *# 6,703 * 4.3% 6.1%Oklahoma 5,273 5,544 5,964 6,403 6,425 0.3% 21.8%Oregon 6,710 7,061 7,127 7,258 7,484 3.1% 11.5%Pennsylvania 7,935 8,258 8,480 8,728 9,043 3.6% 14.0%Rhode Island 6,700 7,296 7,766 8,216 9,008 9.6% 34.4%South Carolina 6,578 6,961 7,249 7,632 8,021 5.1% 21.9%Tennessee 8,807 9,158 9,704 10,273 11,452 11.5% 30.0%Texas 3,286 3,629 3,722 3,945 4,154 5.3% 26.4%Utah 7,187 7,562 7,937 6,914 7,169 3.7% -0.3%Vermont 7,824 8,208 8,640 9,168 9,552 4.2% 22.1%Virginia 6,581 7,221 7,659 7,839 8,244 5.2% 25.3%WASHINGTON 7,653 7,794 7,884 * 7,944 * 8,145 * 2.5% 6.4%West Virginia 6,533 6,739 6,910 7,116 7,768 9.2% 18.9%Wisconsin 12,937 11,495 ^ 11,503 11,539 11,551 0.1% -10.7%Wyoming 4,574 4,692 4,907 5,110 5,382 5.3% 17.7%
Average^^ 6,392 6,704 6,946 7,134 7,525 5.5% 17.7%Washington Rank 9 11 15 18 20
CHANGES FROM PREVIOUS YEAR:National Average 4.9% 3.6% 2.7% 5.5%Washington 1.8% 1.2% 0.8% 2.5%
**In-district rates for Arizona, Arkansas, Colorado, Montana, Oregon, and Pennsylvania. ^^There are no community colleges operating in South Dakota.^Fees reduced from prior academic year. *See Endnotes.#Revised from 2008-09 report.
NATIONAL - TABLE 10
NONRESIDENT TUITION AND REQUIRED FEES (Estimated State Averages)**COMMUNITY COLLEGES
Percentage Change

22

23
Part Three
Washington Peer Group Comparisons of Tuition and Required Fees
2005-06 through 2009-10
The institutions listed in Tables 1 through 20 are in alphabetical order by state.

24

25
Peer Institution Comparison Groups
In 1988, the HECB undertook a study to develop peer groups reflecting a national perspective. Concurrently, a special joint legislative and executive study group was appointed to review the higher education master plan funding recommendations, with peer comparison groups identified as one of its areas of study. The addition of the peer group tables in the late 1980s was done to fulfill state law related to HECB duties and is continued today for the report’s consistency. The Joint Study Group and the board worked together and adopted the following peer policies: 1. The Carnegie Foundation’s classification of institutions was used as the basis for selecting
comparison groups for Washington institutions of higher education in 1988. 2. The national comparison group for the University of Washington is all public institutions
in the Carnegie classification Research Universities category I with medical schools. These institutions typically offer a wide range of baccalaureate programs and are committed to graduate education through the doctorate.
3. The national comparison group for Washington State University is all public land grant
universities in the Carnegie classification Research Universities categories I and II with veterinary schools. Research category II differ from category I by the fewer number of doctoral degrees offered.
4. The national comparison group for Central, Eastern, and Western Washington
Universities is all public institutions in the Carnegie classification Comprehensive Colleges and Universities category I. These institutions typically offer a wide range of baccalaureate programs and are committed to graduate education through the master’s degree.
5. The national comparison group for the Washington community college system is all state
community college systems. The Carnegie Foundation’s classification system has changed multiple times since 1988. In 2005-06, the system was changed extensively. For example, research institutions are now differentiated by the amount of research activity using a multi-measure index for very high research activity (RU/VH), high research activity (RU/H), and doctoral/research universities (DRU). The new categories are not directly comparable to the categories in previous classification schemes (Research I and II, Doctoral I and II, and Doctoral/Research – Extensive and Intensive). Nevertheless, while institutions’ classifications may have changed over the years, peer groups in this report have not to ensure comparability across annual surveys. In 1990, the HECB adopted a peer group for The Evergreen State College using the Carnegie Foundation classification of institutions. The board screened a composite category of public institutions in the Comprehensive I and Liberal Arts II classification. (Institutions in the Liberal Arts II classification are primarily undergraduate colleges with major emphasis on baccalaureate programs.) The selected peer institutions were also based on size, similarities of degrees awarded, and other characteristics common to The Evergreen State College.

26
2005-06 2006-07 2007-08 2008-09 2009-10One Year Four Year
University of Arizona 4,393 4,754 5,037 5,531 6,842 23.7% 55.7%University of California-Davis 8,129 8,323 8,925 9,497 10,990 15.7% 35.2%University of California-Irvine 7,475 7,514 8,348 8,775 9,984 13.8% 33.6%University of California-Los Angeles 7,062 7,141 7,713 8,310 9,149 10.1% 29.6%University of California-San Diego 7,975 7,426 ^ 8,305 8,906 9,401 5.6% 17.9%University of Florida 3,094 3,206 3,372 3,777 4,373 15.8% 41.3%University of Hawaii at Manoa 3,697 4,523 5,391 6,259 7,168 14.5% 93.9%University of Illinois at Chicago 8,498 9,742 10,546 11,716 12,034 2.7% 41.6%University of Iowa 5,612 6,115 6,273 6,524 6,824 4.6% 21.6%University of Kentucky 5,896 6,604 7,199 * 7,848 8,241 5.0% 39.8%Michigan State University 8,107 8,887 9,912 10,690 11,383 6.5% 40.4%University of Michigan-Ann Arbor 9,213 9,723 10,447 11,037 11,659 5.6% 26.5%University of Minnesota-Twin Cities 8,622 9,432 9,598 10,634 11,293 6.2% 31.0%University of Missouri-Columbia 7,415 7,784 8,098 8,467 8,501 0.4% 14.6%University of New Mexico-Main Campus 4,108 4,337 4,571 4,834 5,101 5.5% 24.2%Cornell University-NY State Statutory Colleges 17,367 18,241 19,291 20,364 21,814 7.1% 25.6%University of North Carolina at Chapel Hill 4,613 5,033 5,340 5,397 5,625 4.2% 21.9%Ohio State University-Main Campus 7,795 8,667 8,676 * 8,679 8,706 0.3% 11.7%University of Cincinnati-Main Campus 8,877 9,399 9,399 9,399 9,399 0.0% 5.9%University of Pittsburgh-Main Campus 11,436 12,138 12,876 13,642 14,154 3.8% 23.8%Texas A & M University 6,234 6,968 7,326 7,899 8,391 6.2% 34.6%University of Utah 4,298 4,663 4,987 5,285 5,745 8.7% 33.7%University of Virginia-Main Campus 7,180 7,845 8,500 9,300 9,672 4.0% 34.7%UNIVERSITY OF WASHINGTON 5,505 5,880 6,280 * 6,697 * 7,587 * 13.3% 37.8%University of Wisconsin-Madison 6,280 6,726 7,184 7,569 8,310 9.8% 32.3%
Average (25 institutions) 7,155 7,643 8,144 8,681 9,294 7.1% 29.9%University of Washington Rank 19 19 18 18 18
CHANGES FROM PREVIOUS YEAR25 Institution Average:$ 488 501 538 612% Increase 6.8% 6.6% 6.6% 7.1%
University of Washington:$ 375 400 417 890% Increase 6.8% 6.8% 6.6% 13.3%
^Fees reduced from prior academic year. *See Endnotes.
PEERS - TABLE 1UNIVERSITY OF WASHINGTON AND PEER INSTITUTIONS
RESIDENT UNDERGRADUATE TUITION AND REQUIRED FEES
Percentage Change

27
2005-06 2006-07 2007-08 2008-09 2009-10One Year Four Year
University of Arizona 13,023 ^ 14,960 16,271 18,665 22,251 19.2% 70.9%University of California-Davis 25,949 27,007 28,545 30,105 33,707 12.0% 29.9%University of California-Irvine 25,295 26,198 27,968 29,383 32,701 11.3% 29.3%University of California-Los Angeles 24,882 25,825 27,333 29,918 31,820 6.4% 27.9%University of California-San Diego 25,138 26,110 27,925 29,813 33,257 11.6% 32.3%University of Florida 16,610 17,791 18,686 20,831 22,574 8.4% 35.9%University of Hawaii at Manoa 10,177 12,395 14,655 16,915 19,216 13.6% 88.8%University of Illinois at Chicago 20,888 22,132 22,936 24,106 24,424 1.3% 16.9%University of Iowa 16,998 18,339 19,445 20,638 22,198 7.6% 30.6%University of Kentucky 12,884 14,063 14,995 * 15,990 16,790 5.0% 30.3%Michigan State University 19,808 21,476 23,714 26,084 27,781 6.5% 40.3%University of Michigan-Ann Arbor 27,601 29,131 29,131 33,069 34,937 5.6% 26.6%University of Minnesota-Twin Cities 20,252 21,062 21,228 14,634 15,293 4.5% -24.5%University of Missouri-Columbia 17,192 18,050 18,754 19,558 19,592 0.2% 14.0%University of New Mexico-Main Campus 13,437 14,132 14,942 15,708 17,253 9.8% 28.4%Cornell University-NY State Statutory Colleges 30,367 31,881 33,681 35,404 37,954 7.2% 25.0%University of North Carolina at Chapel Hill 18,411 19,681 20,988 22,295 23,513 5.5% 27.7%Ohio State University-Main Campus 19,018 20,562 21,285 * 21,918 22,278 1.6% 17.1%University of Cincinnati-Main Campus 22,629 23,922 23,922 23,922 23,922 0.0% 5.7%University of Pittsburgh-Main Campus 20,784 21,456 22,386 23,290 23,852 2.4% 14.8%Texas A & M University 13,914 15,217 15,666 22,330 22,701 1.7% 63.2%University of Utah 13,371 14,593 15,662 16,600 18,136 9.3% 35.6%University of Virginia-Main Campus 24,100 25,945 27,750 29,600 31,672 7.0% 31.4%UNIVERSITY OF WASHINGTON 19,802 21,178 22,026 * 23,114 * 24,262 * 5.0% 22.5%University of Wisconsin-Madison 20,280 20,726 21,434 21,818 23,059 5.7% 13.7%
Average (25 institutions) 19,712 20,953 22,053 23,428 25,006 6.7% 26.9%University of Washington Rank 14 12 12 12 10
CHANGES FROM PREVIOUS YEAR25 Institution Average:$ 1,241 1,100 1,375 1,577% Increase 6.3% 5.2% 6.2% 6.7%
University of Washington:$ 1,376 848 1,088 1,148% Increase 6.9% 4.0% 4.9% 5.0%
^Fees reduced from prior academic year. *See Endnotes.
PEERS - TABLE 2UNIVERSITY OF WASHINGTON AND PEER INSTITUTIONS
NONRESIDENT UNDERGRADUATE TUITION AND REQUIRED FEES
Percentage Change

28
2005-06 2006-07 2007-08 2008-09 2009-10One Year Four Year
University of Arizona 4,733 5,440 5,757 6,321 7,632 20.7% 61.3%University of California-Davis 8,960 9,142 9,651 10,618 11,632 9.5% 29.8%University of California-Irvine 9,395 9,669 10,716 11,262 11,961 6.2% 27.3%University of California-Los Angeles 8,110 8,276 8,968 9,670 10,655 10.2% 31.4%University of California-San Diego 8,612 8,669 9,376 10,076 11,045 9.6% 28.2%University of Florida 4,792 5,689 6,232 6,826 7,985 17.0% 66.6%University of Hawaii at Manoa 5,013 6,055 7,139 8,223 9,348 13.7% 86.5%University of Illinois at Chicago 6,650 7,348 9,088 10,380 # 10,763 3.7% 61.8%University of Iowa 6,424 6,959 7,158 7,436 7,863 5.7% 22.4%University of Kentucky 6,318 7,036 7,670 8,360 8,778 5.0% 38.9%Michigan State University 8,855 9,426 10,330 11,300 10,948 -3.1% 23.6%University of Michigan-Ann Arbor 14,271 14,991 15,747 16,541 17,475 5.6% 22.5%University of Minnesota-Twin Cities 9,655 11,146 11,388 12,608 13,401 6.3% 38.8%University of Missouri-Columbia 7,171 7,532 7,804 8,154 8,187 0.4% 14.2%University of New Mexico-Main Campus 4,517 4,765 5,023 5,306 5,597 5.5% 23.9%Cornell University-NY State Statutory Colleges 19,362 20,868 20,868 20,870 # 20,870 0.0% 7.8%University of North Carolina at Chapel Hill 5,014 5,680 6,236 6,693 7,162 7.0% 42.8%Ohio State University-Main Campus 8,832 9,438 9,972 10,440 10,708 2.6% 21.2%University of Cincinnati-Main Campus 10,773 11,661 12,111 12,354 12,273 -0.7% 13.9%University of Pittsburgh-Main Campus 13,774 14,622 15,530 16,462 17,092 3.8% 24.1%Texas A & M University 5,371 5,747 6,229 6,752 7,088 5.0% 32.0%University of Utah 3,787 4,105 4,390 4,653 5,059 8.7% 33.6%University of Virginia-Main Campus 9,800 10,550 11,240 12,140 12,628 4.0% 28.9%UNIVERSITY OF WASHINGTON 8,402 8,963 9,812 * 10,442 * 11,122 * 6.5% 32.4%University of Wisconsin-Madison 8,734 9,180 9,638 10,023 10,514 4.9% 20.4%
Average (25 institutions) 8,293 8,918 9,523 10,156 10,711 5.5% 29.2%University of Washington Rank 13 12 10 10 9
CHANGES FROM PREVIOUS YEAR25 Institution Average:$ 625 605 633 555% Increase 7.5% 6.8% 6.7% 5.5%
University of Washington:$ 561 849 630 680% Increase 6.7% 9.5% 6.4% 6.5%
^Fees reduced from prior academic year. *See Endnotes.#Revised from 2008-09 report.
PEERS - TABLE 3UNIVERSITY OF WASHINGTON AND PEER INSTITUTIONS
RESIDENT GRADUATE TUITION AND REQUIRED FEES
Percentage Change

29
2005-06 2006-07 2007-08 2008-09 2009-10One Year Four Year
University of Arizona 13,381 15,230 16,564 18,958 22,544 18.9% 68.5%University of California-Davis 23,921 24,103 24,639 25,624 26,674 4.1% 11.5%University of California-Irvine 24,356 24,631 25,704 26,268 27,003 2.8% 10.9%University of California-Los Angeles 23,071 23,237 23,956 24,676 25,691 4.1% 11.4%University of California-San Diego 23,573 23,630 24,364 25,082 26,087 4.0% 10.7%University of Florida 17,799 18,293 18,836 19,430 22,480 15.7% 26.3%University of Hawaii at Manoa 11,301 13,927 16,595 19,263 21,972 14.1% 94.4%University of Illinois at Chicago 14,648 15,346 18,826 20,379 # 20,762 1.9% 41.7%University of Iowa 17,328 18,353 19,144 20,318 # 21,467 5.7% 23.9%University of Kentucky 13,968 15,154 16,158 17,228 18,089 5.0% 29.5%Michigan State University 17,387 18,648 20,440 22,310 23,666 6.1% 36.1%University of Michigan-Ann Arbor 28,689 30,137 31,657 33,255 35,133 5.6% 22.5%University of Minnesota-Twin Cities 17,330 18,244 18,486 19,701 20,499 4.1% 18.3%University of Missouri-Columbia 17,167 18,027 18,697 19,414 19,527 0.6% 13.7%University of New Mexico-Main Campus 13,814 14,575 15,361 16,146 17,732 9.8% 28.4%Cornell University-NY State Statutory Colleges 19,362 20,868 20,868 20,870 # 20,870 0.0% 7.8%University of North Carolina at Chapel Hill 19,012 19,678 20,234 21,091 21,560 2.2% 13.4%Ohio State University-Main Campus 21,429 22,791 24,126 25,302 25,948 2.6% 21.1%University of Cincinnati-Main Campus 19,878 21,495 21,945 22,383 23,055 3.0% 16.0%University of Pittsburgh-Main Campus 25,592 26,412 27,570 28,686 29,384 2.4% 14.8%Texas A & M University 11,491 12,247 11,789 ^ 12,372 12,628 2.1% 9.9%University of Utah 11,809 12,885 13,829 14,658 16,014 9.3% 35.6%University of Virginia-Main Campus 20,400 20,550 21,240 22,140 22,628 2.2% 10.9%UNIVERSITY OF WASHINGTON 19,452 20,786 21,609 * 22,914 * 24,462 * 6.8% 25.8%University of Wisconsin-Madison 24,004 24,450 24,908 24,944 25,068 0.5% 4.4%
Average (25 institutions) 18,806 19,748 20,702 21,736 22,838 5.1% 21.4%University of Washington Rank 11 11 10 9 9
CHANGES FROM PREVIOUS YEAR25 Institution Average:$ 941 954 1,035 1,101% Increase 5.0% 4.8% 5.0% 5.1%
University of Washington:$ 1,334 823 1,305 1,548% Increase 6.9% 4.0% 6.0% 6.8%
^Fees reduced from prior academic year. *See Endnotes.#Revised from 2008-09 report.
PEERS - TABLE 4UNIVERSITY OF WASHINGTON AND PEER INSTITUTIONS
NONRESIDENT GRADUATE TUITION AND REQUIRED FEES
Percentage Change

30
2005-06 2006-07 2007-08 2008-09 2009-10One Year Four Year
Auburn University-Main Campus 5,278 5,496 5,834 6,500 6,972 7.3% 32.1%University of California-Davis 8,129 8,323 8,925 9,497 10,990 15.7% 35.2%Colorado State University 4,442 4,597 5,419 5,874 6,318 7.6% 42.2%University of Florida 3,094 3,206 3,372 3,777 4,373 15.8% 41.3%University of Georgia 4,628 4,964 5,622 * 6,030 7,630 26.5% 64.9%University of Illinois at Urbana 8,634 9,882 11,130 12,240 12,660 3.4% 46.6%Purdue University-Main Campus 6,458 7,096 7,416 7,750 8,638 11.5% 33.8%Iowa State University 5,634 6,060 6,161 6,360 6,651 4.6% 18.1%Kansas State Univ of Ag and Applied Science 5,124 5,779 6,235 6,627 6,870 3.7% 34.1%Louisiana State University A & M 4,509 4,621 4,675 5,086 5,233 2.9% 16.1%Michigan State University 8,107 8,887 9,912 10,690 11,383 6.5% 40.4%University of Minnesota-Twin Cities 8,622 9,432 9,598 10,634 11,293 6.2% 31.0%Mississippi State University 4,312 4,595 4,978 5,150 5,150 0.0% 19.4%University of Missouri-Columbia 7,415 7,784 8,098 8,467 8,501 0.4% 14.6%Cornell University-NY State Statutory Colleges 17,367 18,241 19,291 20,364 21,814 7.1% 25.6%North Carolina State University at Raleigh 4,338 4,783 5,117 5,274 5,475 3.8% 26.2%Ohio State University-Main Campus 7,795 8,667 8,676 * 8,679 8,706 0.3% 11.7%Oklahoma State University-Main Campus 4,365 4,997 5,491 6,201 6,201 0.0% 42.1%University of Tennessee-Knoxville 5,290 5,576 5,932 6,250 6,850 9.6% 29.5%Texas A & M University 6,234 6,968 7,326 7,899 8,391 6.2% 34.6%Virginia Tech 6,378 6,973 7,397 8,198 8,605 5.0% 34.9%WASHINGTON STATE UNIVERSITY 5,506 5,887 6,290 6,720 * 7,600 13.1% 38.0%University of Wisconsin-Madison 6,280 6,726 7,184 7,569 8,310 9.8% 32.3%
Average (23 institutions) 6,432 6,937 7,395 7,906 8,461 7.0% 31.5%Washington State University Rank 13 13 12 12 13
CHANGES FROM PREVIOUS YEAR23 Institution Average:$ 504 458 511 556% Increase 7.8% 6.6% 6.9% 7.0%
Washington State University$ 381 403 430 880% Increase 6.9% 6.8% 6.8% 13.1%
^Fees reduced from prior academic year. *See Endnotes.
PEERS - TABLE 5WASHINGTON STATE UNIVERSITY AND PEER INSTITUTIONSRESIDENT UNDERGRADUATE TUITION AND REQUIRED FEES
Percentage Change

31
2005-06 2006-07 2007-08 2008-09 2009-10One Year Four Year
Auburn University-Main Campus 14,878 15,496 16,334 18,260 19,452 6.5% 30.7%University of California-Davis 25,949 27,007 28,545 30,105 33,707 12.0% 29.9%Colorado State University 15,404 16,125 18,859 21,590 22,240 3.0% 44.4%University of Florida 16,610 17,791 18,686 20,831 22,574 8.4% 35.9%University of Georgia 16,848 18,040 20,726 * 22,342 25,840 15.7% 53.4%University of Illinois at Urbana 22,720 23,968 25,216 26,024 26,802 3.0% 18.0%Purdue University-Main Campus 19,824 21,266 22,224 23,224 25,118 8.2% 26.7%Iowa State University 15,724 16,554 16,919 17,350 17,871 3.0% 13.7%Kansas State Univ of Ag and Applied Science 14,454 15,514 15,970 16,932 17,577 3.8% 21.6%Louisiana State University A & M 12,809 12,921 12,975 13,800 14,363 4.1% 12.1%Michigan State University 19,808 21,476 23,714 26,084 27,781 6.5% 40.3%University of Minnesota-Twin Cities 20,252 21,062 21,228 14,634 15,293 4.5% -24.5%Mississippi State University 9,769 10,551 11,469 12,501 13,019 4.1% 33.3%University of Missouri-Columbia 17,192 18,050 18,754 19,558 19,592 0.2% 14.0%Cornell University-NY State Statutory Colleges 30,367 31,881 33,681 35,404 37,954 7.2% 25.0%North Carolina State University at Raleigh 16,536 16,981 17,315 17,572 17,960 2.2% 8.6%Ohio State University-Main Campus 19,018 20,562 21,285 * 21,918 22,278 1.6% 17.1%Oklahoma State University-Main Campus 12,389 13,569 14,916 16,556 16,556 0.0% 33.6%University of Tennessee-Knoxville 16,360 17,142 18,714 19,208 20,946 9.0% 28.0%Texas A & M University 13,914 15,217 15,666 22,330 22,701 1.7% 63.2%Virginia Tech 17,837 19,049 19,775 20,825 21,878 5.1% 22.7%WASHINGTON STATE UNIVERSITY 14,514 15,527 16,604 * 17,756 * 18,676 * 5.2% 28.7%University of Wisconsin-Madison 20,280 20,726 21,434 21,818 23,059 5.7% 13.7%
Average (23 institutions) 17,542 18,542 19,609 20,723 21,880 5.6% 24.7%Washington State University Rank 18 17 17 16 16
CHANGES FROM PREVIOUS YEAR23 Institution Average:$ 1,001 1,067 1,114 1,157% Increase 5.7% 5.8% 5.7% 5.6%
Washington State University$ 1,013 1,077 1,152 920% Increase 7.0% 6.9% 6.9% 5.2%
^Fees reduced from prior academic year. *See Endnotes.
PEERS - TABLE 6WASHINGTON STATE UNIVERSITY AND PEER INSTITUTIONS
NONRESIDENT UNDERGRADUATE TUITION AND REQUIRED FEES
Percentage Change
32
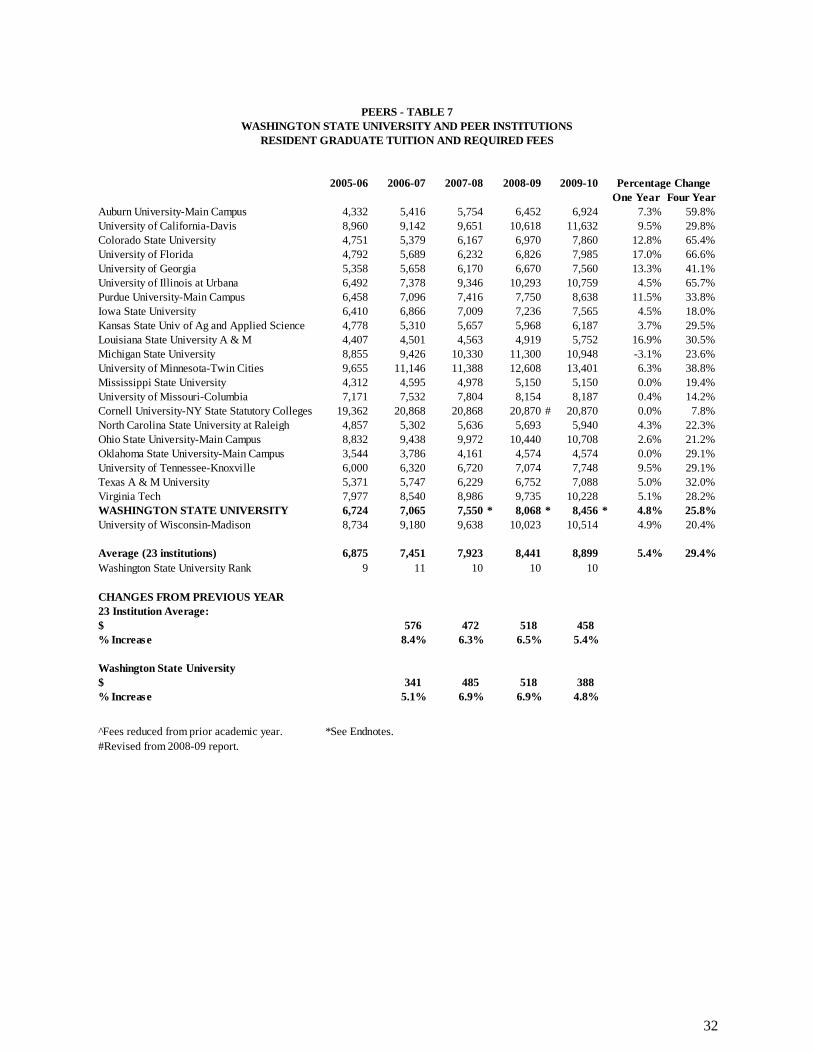
2005-06 2006-07 2007-08 2008-09 2009-10One Year Four Year
Auburn University-Main Campus 4,332 5,416 5,754 6,452 6,924 7.3% 59.8%University of California-Davis 8,960 9,142 9,651 10,618 11,632 9.5% 29.8%Colorado State University 4,751 5,379 6,167 6,970 7,860 12.8% 65.4%University of Florida 4,792 5,689 6,232 6,826 7,985 17.0% 66.6%University of Georgia 5,358 5,658 6,170 6,670 7,560 13.3% 41.1%University of Illinois at Urbana 6,492 7,378 9,346 10,293 10,759 4.5% 65.7%Purdue University-Main Campus 6,458 7,096 7,416 7,750 8,638 11.5% 33.8%Iowa State University 6,410 6,866 7,009 7,236 7,565 4.5% 18.0%Kansas State Univ of Ag and Applied Science 4,778 5,310 5,657 5,968 6,187 3.7% 29.5%Louisiana State University A & M 4,407 4,501 4,563 4,919 5,752 16.9% 30.5%Michigan State University 8,855 9,426 10,330 11,300 10,948 -3.1% 23.6%University of Minnesota-Twin Cities 9,655 11,146 11,388 12,608 13,401 6.3% 38.8%Mississippi State University 4,312 4,595 4,978 5,150 5,150 0.0% 19.4%University of Missouri-Columbia 7,171 7,532 7,804 8,154 8,187 0.4% 14.2%Cornell University-NY State Statutory Colleges 19,362 20,868 20,868 20,870 # 20,870 0.0% 7.8%North Carolina State University at Raleigh 4,857 5,302 5,636 5,693 5,940 4.3% 22.3%Ohio State University-Main Campus 8,832 9,438 9,972 10,440 10,708 2.6% 21.2%Oklahoma State University-Main Campus 3,544 3,786 4,161 4,574 4,574 0.0% 29.1%University of Tennessee-Knoxville 6,000 6,320 6,720 7,074 7,748 9.5% 29.1%Texas A & M University 5,371 5,747 6,229 6,752 7,088 5.0% 32.0%Virginia Tech 7,977 8,540 8,986 9,735 10,228 5.1% 28.2%WASHINGTON STATE UNIVERSITY 6,724 7,065 7,550 * 8,068 * 8,456 * 4.8% 25.8%University of Wisconsin-Madison 8,734 9,180 9,638 10,023 10,514 4.9% 20.4%
Average (23 institutions) 6,875 7,451 7,923 8,441 8,899 5.4% 29.4%Washington State University Rank 9 11 10 10 10
CHANGES FROM PREVIOUS YEAR23 Institution Average:$ 576 472 518 458% Increase 8.4% 6.3% 6.5% 5.4%
Washington State University$ 341 485 518 388% Increase 5.1% 6.9% 6.9% 4.8%
^Fees reduced from prior academic year. *See Endnotes.#Revised from 2008-09 report.
PEERS - TABLE 7
RESIDENT GRADUATE TUITION AND REQUIRED FEESWASHINGTON STATE UNIVERSITY AND PEER INSTITUTIONS
Percentage Change

33
2005-06 2006-07 2007-08 2008-09 2009-10One Year Four Year
Auburn University-Main Campus 12,332 15,416 16,254 18,212 19,404 6.5% 57.3%University of California-Davis 23,921 24,103 24,639 25,624 26,674 4.1% 11.5%Colorado State University 16,019 16,773 17,704 18,603 19,512 4.9% 21.8%University of Florida 17,799 18,293 18,836 19,430 22,480 15.7% 26.3%University of Georgia 19,758 20,778 21,424 22,078 22,464 1.7% 13.7%University of Illinois at Urbana 15,052 15,938 19,813 20,921 21,814 4.3% 44.9%Purdue University-Main Campus 19,824 21,266 22,224 23,224 25,118 8.2% 26.7%Iowa State University 16,422 17,280 17,669 18,120 18,665 3.0% 13.7%Kansas State Univ of Ag and Applied Science 11,244 11,930 12,277 12,975 13,467 3.8% 19.8%Louisiana State University A & M 12,707 12,801 12,862 13,633 14,902 9.3% 17.3%Michigan State University 17,387 18,648 20,440 22,310 23,666 6.1% 36.1%University of Minnesota-Twin Cities 17,330 18,244 18,486 19,701 20,499 4.1% 18.3%Mississippi State University 9,769 10,551 11,469 12,501 13,019 4.1% 33.3%University of Missouri-Columbia 17,167 18,027 18,697 19,414 19,527 0.6% 13.7%Cornell University-NY State Statutory Colleges 19,362 20,868 20,868 20,870 # 20,870 0.0% 7.8%North Carolina State University at Raleigh 16,905 17,350 17,684 17,741 17,988 1.4% 6.4%Ohio State University-Main Campus 21,429 22,791 24,126 25,302 25,948 2.6% 21.1%Oklahoma State University-Main Campus 10,474 11,186 12,296 13,517 13,517 0.0% 29.1%University of Tennessee-Knoxville 17,070 17,886 18,962 20,032 21,844 9.0% 28.0%Texas A & M University 11,491 12,247 11,789 ^ 12,372 12,628 2.1% 9.9%Virginia Tech 12,835 14,057 15,351 16,866 17,928 6.3% 39.7%WASHINGTON STATE UNIVERSITY 16,378 17,203 18,398 * 19,676 * 20,644 * 4.9% 26.0%University of Wisconsin-Madison 24,004 24,450 24,908 24,944 25,068 0.5% 4.4%
Average (23 institutions) 16,377 17,308 18,138 19,046 19,898 4.5% 21.5%Washington State University Rank 14 14 13 11 11
CHANGES FROM PREVIOUS YEAR23 Institution Average:$ 931 830 908 851% Increase 5.7% 4.8% 5.0% 4.5%
Washington State University$ 825 1,195 1,278 968% Increase 5.0% 6.9% 6.9% 4.9%
^Fees reduced from prior academic year. *See Endnotes.#Revised from 2008-09 report.
PEERS - TABLE 8WASHINGTON STATE UNIVERSITY AND PEER INSTITUTIONS
NONRESIDENT GRADUATE TUITION AND REQUIRED FEES
Percentage Change

34
2005-06 2006-07 2007-08 2008-09 2009-10One Year Four Year
University of Arizona 14,452 15,946 17,725 18,765 21,618 15.2% 49.6%University of California-Davis 22,820 25,565 25,754 27,414 30,257 10.4% 32.6%University of California-Irvine 22,896 23,446 24,329 25,795 27,915 8.2% 21.9%University of California-Los Angeles 21,503 22,085 22,551 24,173 30,692 27.0% 42.7%University of California-San Diego 21,891 22,541 22,959 24,701 26,390 6.8% 20.5%University of Florida 18,391 19,863 21,849 25,126 28,785 14.6% 56.5%University of Hawaii at Manoa 16,263 18,457 20,693 22,929 25,206 9.9% 55.0%University of Illinois at Chicago 26,420 27,728 28,624 30,308 33,144 9.4% 25.5%University of Iowa 19,736 20,819 25,094 26,113 27,749 6.3% 40.6%University of Kentucky 18,826 21,312 23,752 26,344 29,233 11.0% 55.3%Michigan State University 15,865 16,996 18,640 20,272 21,428 5.7% 35.1%University of Michigan-Ann Arbor 22,433 23,565 24,755 26,006 27,284 4.9% 21.6%University of Minnesota-Twin Cities 19,220 20,555 20,466 ^ 32,360 33,747 4.3% 75.6%University of Missouri-Columbia 21,896 22,987 23,847 24,856 24,889 0.1% 13.7%University of New Mexico-Main Campus 12,933 13,281 13,995 14,671 15,402 5.0% 19.1%University of North Carolina at Chapel Hill 10,740 11,373 11,919 12,891 13,360 3.6% 24.4%Ohio State University-Main Campus 25,206 27,093 29,034 30,363 29,403 -3.2% 16.7%University of Cincinnati-Main Campus 23,580 25,965 26,910 27,987 29,385 5.0% 24.6%University of Pittsburgh-Main Campus 32,798 33,834 35,990 37,442 # 37,442 0.0% 14.2%Texas A & M University 9,012 9,012 10,532 11,231 11,394 1.5% 26.4%University of Utah 17,647 19,272 20,692 21,933 25,138 14.6% 42.4%University of Virginia-Main Campus 28,700 30,100 31,305 32,650 35,150 7.7% 22.5%UNIVERSITY OF WASHINGTON 14,354 15,767 17,320 * 19,017 * 20,892 * 9.9% 45.5%University of Wisconsin-Madison 21,814 22,260 22,718 23,102 23,594 2.1% 8.2%
Average (24 institutions) 19,975 21,243 22,561 24,435 26,229 7.3% 31.3%University of Washington Rank 21 21 21 20 21
CHANGES FROM PREVIOUS YEAR24 Institution Average:$ 1,268 1,318 1,875 1,794% Increase 6.3% 6.2% 8.3% 7.3%
University of Washington $ 1,413 1,553 1,697 1,875% Increase 9.8% 9.8% 9.8% 9.9%
**Medical degrees are not offered at Cornell University Statutory Colleges. ^Fees reduced from prior academic year. *See Endnotes.#Revised from 2008-09 report.
PEERS - TABLE 9UNIVERSITY OF WASHINGTON AND PEER INSTITUTIONS
RESIDENT MEDICAL TUITION AND REQUIRED FEES**
Percentage Change

35
2005-06 2006-07 2007-08 2008-09 2009-10One Year Four Year
University of Arizona 14,452 # 15,946 # 17,725 # 18,765 # 21,618 15.2% 49.6%University of California-Davis 35,065 37,810 37,999 39,659 42,502 7.2% 21.2%University of California-Irvine 37,857 35,691 ^ 36,574 38,040 40,160 5.6% 6.1%University of California-Los Angeles 33,748 34,330 34,796 36,418 40,505 11.2% 20.0%University of California-San Diego 34,136 34,787 35,204 36,944 38,635 4.6% 13.2%University of Florida 48,425 49,103 51,089 54,366 58,025 6.7% 19.8%University of Hawaii at Manoa 29,967 35,257 40,589 45,921 51,294 11.7% 71.2%University of Illinois at Chicago 54,532 55,782 57,520 60,650 66,520 9.7% 22.0%University of Iowa 38,942 40,889 41,124 41,927 43,563 3.9% 11.9%University of Kentucky 37,687 41,322 45,155 49,220 53,639 9.0% 42.3%Michigan State University 34,465 36,996 40,560 43,748 46,406 6.1% 34.6%University of Michigan-Ann Arbor 34,785 36,889 39,119 41,486 43,638 5.2% 25.5%University of Minnesota-Twin Cities 33,817 25,289 ^ 25,342 39,893 41,655 4.4% 23.2%University of Missouri-Columbia 42,620 44,749 46,433 48,368 48,400 0.1% 13.6%University of New Mexico-Main Campus 37,072 38,144 40,101 42,043 44,142 5.0% 19.1%University of North Carolina at Chapel Hill 34,406 35,039 35,585 36,957 37,426 1.3% 8.8%Ohio State University-Main Campus 38,037 ^ 40,695 43,452 45,501 44,913 -1.3% 18.1%University of Cincinnati-Main Campus 41,004 45,132 46,077 42,987 45,135 5.0% 10.1%University of Pittsburgh-Main Campus 37,536 38,714 39,854 41,462 # 41,462 0.0% 10.5%Texas A & M University 21,568 24,512 23,782 ^ 24,331 24,494 0.7% 13.6%University of Utah 32,806 35,864 38,529 40,840 46,881 14.8% 42.9%University of Virginia-Main Campus 38,700 40,100 41,305 42,650 45,150 5.9% 16.7%UNIVERSITY OF WASHINGTON 34,192 37,589 41,324 * 45,422 * 49,932 * 9.9% 46.0%University of Wisconsin-Madison 32,938 33,384 33,842 34,226 34,718 1.4% 5.4%
Average (24 institutions) 35,782 37,251 38,878 41,326 43,784 5.9% 22.4%University of Washington Rank 16 12 7 7 5
CHANGES FROM PREVIOUS YEAR24 Institution Average:$ 1,469 1,628 2,448 2,458% Increase 4.1% 4.4% 6.3% 5.9%
University of Washington $ 3,397 3,735 4,098 4,510% Increase 9.9% 9.9% 9.9% 9.9%
**Medical degrees are not offered at Cornell University Statutory Colleges. ^Fees reduced from prior academic year. *See Endnotes.#Revised from 2008-09 report.
PEERS - TABLE 10UNIVERSITY OF WASHINGTON AND PEER INSTITUTIONS
NONRESIDENT MEDICAL TUITION AND REQUIRED FEES**
Percentage Change

36
2005-06 2006-07 2007-08 2008-09 2009-10One Year Four Year
University of California-Los Angeles 22,167 25,715 26,266 28,093 30,692 9.2% 38.5%University of Florida 16,138 18,094 19,904 22,889 26,827 17.2% 66.2%University of Illinois at Chicago 21,374 23,374 26,590 29,172 31,708 8.7% 48.3%University of Iowa 20,796 21,927 25,854 26,681 31,187 16.9% 50.0%University of Kentucky 17,267 19,534 21,274 22,780 23,910 5.0% 38.5%University of Michigan-Ann Arbor 23,387 24,567 26,543 27,884 29,268 5.0% 25.1%University of Minnesota-Twin Cities 20,326 22,381 22,325 ^ 34,514 38,033 10.2% 87.1%University of North Carolina at Chapel Hill 12,795 14,461 14,517 16,474 18,443 12.0% 44.1%Ohio State University-Main Campus 23,619 25,638 27,627 29,550 30,840 4.4% 30.6%University of Pittsburgh-Main Campus 30,342 32,166 # 33,110 34,448 # 35,798 3.9% 18.0%UNIVERSITY OF WASHINGTON 14,354 15,767 17,320 * 19,017 * 20,892 * 9.9% 45.5%
Average (11 institutions) 20,233 22,148 23,757 26,500 28,873 9.0% 42.7%University of Washington Rank 10 10 10 10 10
CHANGES FROM PREVIOUS YEAR11 Institution Average:$ 1,914 1,610 2,743 2,372% Increase 9.5% 7.3% 11.5% 9.0%
University of Washington $ 1,413 1,553 1,697 1,875% Increase 9.8% 9.8% 9.8% 9.9%
**Dental degrees are not offered by the following University of Washington peer universities:University of ArizonaUniversity of California-DavisUniversity of California-IrvineUniversity of California-San DiegoUniversity of Hawaii at ManoaMichigan State UniversityUniversity of Missouri-ColumbiaUniversity of New Mexico Main CampusCornell University Statutory CollegeUniversity of Cincinnati Main CampusTexas A & M University Main CampusUniversity of UtahUniversity of Virginia Main CampusUniversity of Wisconsin-Madison
^Fees reduced from prior academic year. *See Endnotes.#Revised from 2008-09 report.
PEERS - TABLE 11UNIVERSITY OF WASHINGTON AND PEER INSTITUTIONS
RESIDENT DENTAL TUITION AND REQUIRED FEES**
Percentage Change

37
2005-06 2006-07 2007-08 2008-09 2009-10One Year Four Year
University of California-Los Angeles 34,412 35,975 36,393 36,067 40,505 12.3% 17.7%University of Florida 43,278 44,575 46,385 49,370 53,308 8.0% 23.2%University of Illinois at Chicago 47,872 49,872 51,948 55,872 61,974 10.9% 29.5%University of Iowa 36,828 38,681 43,480 44,871 50,397 12.3% 36.8%University of Kentucky 38,465 42,114 44,854 46,474 # 48,789 5.0% 26.8%University of Michigan-Ann Arbor 37,573 39,469 41,461 43,554 45,824 5.2% 22.0%University of Minnesota-Twin Cities 32,356 37,359 37,977 56,528 62,450 10.5% 93.0%University of North Carolina at Chapel Hill 29,777 29,943 29,999 30,856 31,325 1.5% 5.2%Ohio State University-Main Campus 49,485 53,055 56,688 60,063 62,115 3.4% 25.5%University of Pittsburgh-Main Campus 38,086 39,280 # 40,438 42,068 # 43,102 2.5% 13.2%UNIVERSITY OF WASHINGTON 34,192 37,589 41,324 * 45,422 * 49,932 * 9.9% 46.0%
Average (11 institutions) 38,393 40,719 42,813 46,468 49,975 7.5% 30.2%University of Washington Rank 9 8 7 6 6
CHANGES FROM PREVIOUS YEAR11 Institution Average:$ 2,326 2,094 3,654 3,507% Increase 6.1% 5.1% 8.5% 7.5%
University of Washington $ 3,397 3,735 4,098 4,510% Increase 9.9% 9.9% 9.9% 9.9%
**Dental degrees are not offered by the following University of Washington peer universities:University of ArizonaUniversity of California-DavisUniversity of California-IrvineUniversity of California-San DiegoUniversity of Hawaii at ManoaMichigan State UniversityUniversity of Missouri-ColumbiaUniversity of New Mexico Main CampusCornell University Statutory CollegeUniversity of Cincinnati Main CampusTexas A&M University Main CampusUniversity of UtahUniversity of Virginia Main CampusUniversity of Wisconsin-Madison
^Fees reduced from prior academic year. *See Endnotes.#Revised from 2008-09 report.
PEERS - TABLE 12UNIVERSITY OF WASHINGTON AND PEER INSTITUTIONSNONRESIDENT DENTAL TUITION AND REQUIRED FEES**
Percentage Change

38
2005-06 2006-07 2007-08 2008-09 2009-10One Year Four Year
University of Arizona 13,191 16,190 17,544 19,571 20,882 6.7% 58.3%University of California-Davis 23,524 24,358 25,489 28,515 34,528 21.1% 46.8%University of California-Los Angeles 24,581 25,457 27,056 31,103 35,028 12.6% 42.5%University of Florida 6,444 7,889 8,647 9,871 11,488 16.4% 78.3%University of Hawaii at Manoa 12,303 13,081 13,901 14,721 15,582 5.8% 26.7%University of Illinois at Urbana 17,488 20,458 25,972 31,152 36,323 16.6% 107.7%University of Iowa 13,211 14,542 16,341 17,916 21,432 19.6% 62.2%University of Kentucky 11,385 12,842 13,998 15,258 16,021 5.0% 40.7%University of Michigan-Ann Arbor 32,919 35,501 38,949 41,500 43,200 4.1% 31.2%University of Minnesota-Twin Cities 18,422 21,965 21,684 ^ 25,253 28,670 13.5% 55.6%University of Missouri-Columbia 13,614 14,295 14,824 15,462 15,495 0.2% 13.8%University of New Mexico-Main Campus 8,816 9,566 10,562 11,593 12,619 8.9% 43.1%University of North Carolina at Chapel Hill 11,981 12,947 13,004 15,045 16,014 6.4% 33.7%Ohio State University-Main Campus 17,624 17,450 ^ 19,246 20,920 22,433 7.2% 27.3%University of Cincinnati-Main Campus 16,210 18,032 18,982 19,362 19,942 3.0% 23.0%University of Pittsburgh-Main Campus 20,182 21,408 22,756 24,122 # 25,058 3.9% 24.2%University of Utah 7,926 8,636 9,261 9,815 12,761 30.0% 61.0%University of Virginia-Main Campus 28,300 30,700 33,500 36,800 38,800 5.4% 37.1%UNIVERSITY OF WASHINGTON 14,702 16,150 17,741 * 19,480 * 22,162 * 13.8% 50.7%University of Wisconsin-Madison 11,654 12,649 13,704 14,730 16,422 11.5% 40.9%
Average (20 institutions) 16,224 17,706 19,158 21,109 23,243 10.1% 43.3%University of Washington Rank 10 11 10 10 9
CHANGES FROM PREVIOUS YEAR20 Institution Average:$ 1,482 1,452 1,951 2,134% Increase 9.1% 8.2% 10.2% 10.1%
University of Washington $ 1,448 1,591 1,739 2,682% Increase 9.8% 9.9% 9.8% 13.8%
^Fees reduced from prior academic year. *See Endnotes.#Revised from 2008-09 report.
PEERS - TABLE 13UNIVERSITY OF WASHINGTON AND PEER INSTITUTIONS
RESIDENT LAW TUITION AND REQUIRED FEES
Percentage Change

39
2005-06 2006-07 2007-08 2008-09 2009-10One Year Four Year
University of Arizona 22,171 25,980 28,351 32,208 35,794 11.1% 61.4%University of California-Davis 35,769 36,603 37,734 40,760 45,474 11.6% 27.1%University of California-Los Angeles 35,545 36,381 37,849 41,624 45,668 9.7% 28.5%University of Florida 22,692 23,380 24,139 25,363 26,980 6.4% 18.9%University of Hawaii at Manoa 20,967 22,825 24,725 26,625 28,566 7.3% 36.2%University of Illinois at Urbana 28,392 31,664 35,972 39,152 43,323 10.7% 52.6%University of Iowa 27,989 29,986 32,589 34,684 39,138 12.8% 39.8%University of Kentucky 21,244 23,272 24,804 26,436 27,758 5.0% 30.7%University of Michigan-Ann Arbor 35,919 38,501 41,949 44,500 46,200 3.8% 28.6%University of Minnesota-Twin Cities 28,516 31,465 31,148 ^ 35,656 38,072 6.8% 33.5%University of Missouri-Columbia 25,986 27,285 28,306 29,496 29,529 0.1% 13.6%University of New Mexico-Main Campus 21,393 23,213 24,467 25,693 28,234 9.9% 32.0%University of North Carolina at Chapel Hill 24,199 25,365 25,422 27,863 29,332 5.3% 21.2%Ohio State University-Main Campus 31,226 31,868 33,946 35,870 37,383 4.2% 19.7%University of Cincinnati-Main Campus 29,284 32,152 33,102 33,764 34,776 3.0% 18.8%University of Pittsburgh-Main Campus 28,790 29,706 31,012 32,266 # 33,054 2.4% 14.8%University of Utah 16,897 18,454 19,815 21,003 24,420 16.3% 44.5%University of Virginia-Main Campus 33,300 35,700 38,500 41,800 43,800 4.8% 31.5%UNIVERSITY OF WASHINGTON 21,632 23,773 26,126 * 28,704 * 32,672 * 13.8% 51.0%University of Wisconsin-Madison 28,866 30,812 32,770 34,654 36,346 4.9% 25.9%
Average (20 institutions) 27,039 28,919 30,636 32,906 35,326 7.4% 30.6%University of Washington Rank 16 15 14 14 13
CHANGES FROM PREVIOUS YEAR20 Institution Average:$ 1,880 1,717 2,270 2,420% Increase 7.0% 5.9% 7.4% 7.4%
University of Washington $ 2,141 2,353 2,578 3,968% Increase 9.9% 9.9% 9.9% 13.8%
^Fees reduced from prior academic year. *See Endnotes.#Revised from 2008-09 report.
PEERS - TABLE 14UNIVERSITY OF WASHINGTON AND PEER INSTITUTIONS
NONRESIDENT LAW TUITION AND REQUIRED FEES
Percentage Change

40
2005-06 2006-07 2007-08 2008-09 2009-10One Year Four Year
Auburn University-Main Campus 9,418 9,816 10,374 11,620 12,412 6.8% 31.8%University of California-Davis 21,701 22,233 22,403 24,263 27,045 11.5% 24.6%Colorado State University 12,199 12,547 14,407 16,448 18,759 14.1% 53.8%University of Florida 13,735 15,596 17,155 19,728 23,350 18.4% 70.0%University of Georgia 11,376 11,978 12,492 13,222 14,330 8.4% 26.0%University of Illinois at Urbana 15,958 17,566 20,282 21,392 22,656 5.9% 42.0%Purdue University-Main Campus 12,194 12,926 15,052 15,730 16,518 5.0% 35.5%Iowa State University 12,692 14,834 15,391 15,886 16,577 4.3% 30.6%Kansas State Univ of Ag and Applied Science 13,278 *# 14,744 *# 16,045 *# 16,980 *# 17,629 * 3.8% 32.8%Louisiana State University A & M 11,677 11,789 11,859 12,533 14,641 16.8% 25.4%Michigan State University 16,065 17,196 18,860 20,476 21,644 5.7% 34.7%University of Minnesota-Twin Cities 18,416 20,729 20,847 23,071 24,775 7.4% 34.5%Mississippi State University 8,050 9,258 12,968 14,008 15,048 7.4% 86.9%University of Missouri-Columbia 14,930 15,677 16,862 17,746 17,778 0.2% 19.1%Cornell University-NY State Statutory Colleges 22,062 23,068 24,068 26,500 26,570 0.3% 20.4%North Carolina State University at Raleigh 9,801 10,246 10,580 10,637 10,884 2.3% 11.0%Ohio State University-Main Campus 17,955 19,629 21,342 23,307 24,093 3.4% 34.2%Oklahoma State University-Main Campus 11,445 12,072 13,129 14,295 14,295 0.0% 24.9%University of Tennessee-Knoxville 11,612 13,326 14,590 15,348 18,366 19.7% 58.2%Texas A & M University 11,607 ^ 12,891 12,764 ^ 14,399 15,064 4.6% 29.8%Virginia Tech 13,769 14,738 15,951 17,336 18,415 6.2% 33.7%WASHINGTON STATE UNIVERSITY 13,776 15,003 16,044 * 17,156 * 18,332 * 6.9% 33.1%University of Wisconsin-Madison 15,932 16,378 16,836 17,220 17,711 2.9% 11.2%
Average (23 institutions) 13,898 14,967 16,100 17,361 18,561 6.9% 33.6%Washington State University Rank 9 10 11 11 11
CHANGES FROM PREVIOUS YEAR23 Institution Average:$ 1,069 1,133 1,261 1,200% Increase 7.7% 7.6% 7.8% 6.9%
Washington State University$ 1,227 1,041 1,112 1,176% Increase 8.9% 6.9% 6.9% 6.9%
^Fees reduced from prior academic year. *See Endnotes.#Revised from 2008-09 report.
PEERS - TABLE 15WASHINGTON STATE UNIVERSITY AND PEER INSTITUTIONS
RESIDENT VETERINARY MEDICINE TUITION AND REQUIRED FEES
Percentage Change
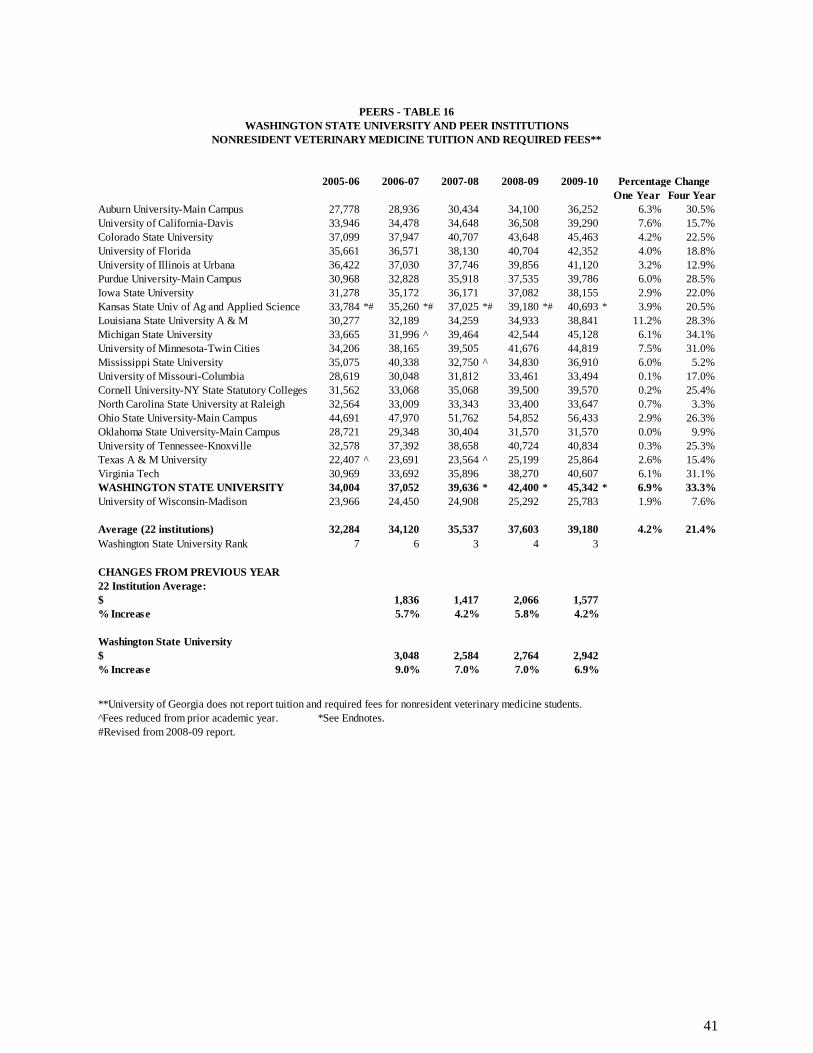
41
2005-06 2006-07 2007-08 2008-09 2009-10One Year Four Year
Auburn University-Main Campus 27,778 28,936 30,434 34,100 36,252 6.3% 30.5%University of California-Davis 33,946 34,478 34,648 36,508 39,290 7.6% 15.7%Colorado State University 37,099 37,947 40,707 43,648 45,463 4.2% 22.5%University of Florida 35,661 36,571 38,130 40,704 42,352 4.0% 18.8%University of Illinois at Urbana 36,422 37,030 37,746 39,856 41,120 3.2% 12.9%Purdue University-Main Campus 30,968 32,828 35,918 37,535 39,786 6.0% 28.5%Iowa State University 31,278 35,172 36,171 37,082 38,155 2.9% 22.0%Kansas State Univ of Ag and Applied Science 33,784 *# 35,260 *# 37,025 *# 39,180 *# 40,693 * 3.9% 20.5%Louisiana State University A & M 30,277 32,189 34,259 34,933 38,841 11.2% 28.3%Michigan State University 33,665 31,996 ^ 39,464 42,544 45,128 6.1% 34.1%University of Minnesota-Twin Cities 34,206 38,165 39,505 41,676 44,819 7.5% 31.0%Mississippi State University 35,075 40,338 32,750 ^ 34,830 36,910 6.0% 5.2%University of Missouri-Columbia 28,619 30,048 31,812 33,461 33,494 0.1% 17.0%Cornell University-NY State Statutory Colleges 31,562 33,068 35,068 39,500 39,570 0.2% 25.4%North Carolina State University at Raleigh 32,564 33,009 33,343 33,400 33,647 0.7% 3.3%Ohio State University-Main Campus 44,691 47,970 51,762 54,852 56,433 2.9% 26.3%Oklahoma State University-Main Campus 28,721 29,348 30,404 31,570 31,570 0.0% 9.9%University of Tennessee-Knoxville 32,578 37,392 38,658 40,724 40,834 0.3% 25.3%Texas A & M University 22,407 ^ 23,691 23,564 ^ 25,199 25,864 2.6% 15.4%Virginia Tech 30,969 33,692 35,896 38,270 40,607 6.1% 31.1%WASHINGTON STATE UNIVERSITY 34,004 37,052 39,636 * 42,400 * 45,342 * 6.9% 33.3%University of Wisconsin-Madison 23,966 24,450 24,908 25,292 25,783 1.9% 7.6%
Average (22 institutions) 32,284 34,120 35,537 37,603 39,180 4.2% 21.4%Washington State University Rank 7 6 3 4 3
CHANGES FROM PREVIOUS YEAR22 Institution Average:$ 1,836 1,417 2,066 1,577% Increase 5.7% 4.2% 5.8% 4.2%
Washington State University$ 3,048 2,584 2,764 2,942% Increase 9.0% 7.0% 7.0% 6.9%
**University of Georgia does not report tuition and required fees for nonresident veterinary medicine students.^Fees reduced from prior academic year. *See Endnotes.#Revised from 2008-09 report.
PEERS - TABLE 16WASHINGTON STATE UNIVERSITY AND PEER INSTITUTIONS
NONRESIDENT VETERINARY MEDICINE TUITION AND REQUIRED FEES**
Percentage Change

42
2005-06 2006-07 2007-08 2008-09 2009-10One Year Four Year
University of Montevallo 5,664 5,664 6,080 6,650 7,010 5.4% 23.8%Sonoma State University 3,616 3,648 3,946 4,272 5,290 23.8% 46.3%Eastern Connecticut State University 5,964 6,442 6,961 7,406 7,813 5.5% 31.0%Fort Hays State University 3,053 3,192 3,356 3,540 3,762 6.3% 23.2%Coppin State University 4,714 4,745 4,980 5,140 # 5,276 2.6% 11.9%Saint Mary's College of Maryland 10,896 11,418 11,989 12,604 13,234 5.0% 21.5%University of Minnesota-Morris 9,721 10,640 9,331 ^ 10,006 10,715 7.1% 10.2%Missouri Western State University 4,778 5,168 5,330 5,560 5,560 0.0% 16.4%Keene State College 7,352 7,822 8,298 8,778 9,334 6.3% 27.0%SUNY College at Fredonia 5,441 5,482 5,542 5,588 6,259 12.0% 15.0%SUNY College at Geneseo 5,520 5,560 5,606 5,658 6,326 11.8% 14.6%SUNY College at Oneonta 5,362 5,397 5,405 5,502 6,172 12.2% 15.1%SUNY College at Potsdam 5,279 5,357 5,401 5,457 6,124 12.2% 16.0%North Carolina Central University 3,096 3,396 3,606 3,729 3,922 5.2% 26.7%Winston-Salem State University 2,805 3,108 3,300 3,389 3,522 3.9% 25.6%Southern Oregon State University 4,909 5,233 5,502 5,739 6,252 8.9% 27.4%East Stroudsburg University of Pennsylvania 6,399 6,577 6,809 7,090 7,394 4.3% 15.5%University of Pittsburgh-Johnstown 10,540 10,876 11,332 11,754 11,754 0.0% 11.5%College of Charleston 6,668 7,234 7,778 8,400 8,988 7.0% 34.8%Francis Marion University 5,984 6,512 7,038 7,632 7,960 4.3% 33.0%University of South Carolina Upstate 6,636 7,218 7,760 8,342 8,642 3.6% 30.2%Longwood University 7,020 7,589 8,058 8,499 8,925 5.0% 27.1%University of Mary Washington 5,634 6,084 6,494 6,774 7,112 5.0% 26.2%THE EVERGREEN STATE COLLEGE 4,130 4,372 4,590 * 4,797 * 5,413 * 12.8% 31.1%University of Wisconsin-Green Bay 5,425 5,716 5,959 6,308 6,614 4.9% 21.9%University of Wisconsin-River Falls 5,080 5,323 5,752 6,077 6,389 5.1% 25.8%University of Wisconsin-Superior 5,182 5,572 5,911 6,360 6,736 5.9% 30.0%
Average (27 institutions) 5,810 6,124 6,375 6,706 7,130 6.3% 22.7%The Evergreen State College Rank 23 23 23 23 22
CHANGES FROM PREVIOUS YEAR27 Institution Average:$ 314 251 331 424% Increase 5.4% 4.1% 5.2% 6.3%
The Evergreen State College$ 242 218 207 616% Increase 5.9% 5.0% 4.5% 12.8%
^Fees reduced from prior academic year. *See Endnotes.#Revised from 2008-09 report.
PEERS - TABLE 17THE EVERGREEN STATE COLLEGE AND PEER INSTITUTIONSRESIDENT UNDERGRADUATE TUITION AND REQUIRED FEES
Percentage Change

43
2005-06 2006-07 2007-08 2008-09 2009-10One Year Four Year
University of Montevallo 11,124 11,124 11,930 12,800 13,550 5.9% 21.8%Sonoma State University 13,786 13,818 14,116 14,442 16,450 13.9% 19.3%Eastern Connecticut State University 13,903 14,764 15,681 16,543 17,505 5.8% 25.9%Fort Hays State University 9,575 10,038 10,544 11,124 11,915 7.1% 24.4%Coppin State University 11,235 11,768 12,753 13,365 # 13,971 4.5% 24.4%Saint Mary's College of Maryland 19,773 21,260 22,323 23,454 24,627 5.0% 24.5%University of Minnesota-Morris 9,721 10,640 9,331 ^ 10,006 10,715 7.1% 10.2%Missouri Western State University 8,406 9,008 9,290 9,688 10,288 6.2% 22.4%Keene State College 14,192 15,092 15,848 16,628 17,504 5.3% 23.3%SUNY College at Fredonia 11,701 11,742 11,802 11,848 14,159 19.5% 21.0%SUNY College at Geneseo 11,780 11,820 11,867 11,918 14,266 19.7% 21.1%SUNY College at Oneonta 11,622 11,657 11,715 11,762 14,072 19.6% 21.1%SUNY College at Potsdam 11,539 11,617 11,661 11,717 14,024 19.7% 21.5%North Carolina Central University 12,840 13,140 13,350 13,473 13,991 3.8% 9.0%Winston-Salem State University 11,445 11,748 11,940 12,029 12,508 4.0% 9.3%Southern Oregon State University 14,686 16,918 17,580 18,285 19,914 8.9% 35.6%East Stroudsburg University of Pennsylvania 13,822 14,200 14,664 15,220 15,830 4.0% 14.5%University of Pittsburgh-Johnstown 20,428 20,468 20,912 21,314 21,314 0.0% 4.3%College of Charleston 15,342 16,800 18,732 20,418 21,846 7.0% 42.4%Francis Marion University 11,833 12,839 13,841 14,979 15,585 4.0% 31.7%University of South Carolina Upstate 13,474 14,656 15,752 16,684 17,284 3.6% 28.3%Longwood University 13,754 15,259 16,378 17,112 18,225 6.5% 32.5%University of Mary Washington 14,776 15,964 16,968 17,942 18,840 5.0% 27.5%THE EVERGREEN STATE COLLEGE 14,537 14,558 14,934 * 15,657 * 16,429 * 4.9% 13.0%University of Wisconsin-Green Bay 15,471 13,191 ^ 13,532 13,881 14,187 2.2% -8.3%University of Wisconsin-River Falls 15,126 12,798 ^ 13,324 13,650 13,962 2.3% -7.7%University of Wisconsin-Superior 15,228 13,046 ^ 13,484 13,933 14,309 2.7% -6.0%
Average (27 institutions) 13,375 13,701 14,232 14,810 15,825 6.9% 18.3%The Evergreen State College Rank 9 10 10 10 11
CHANGES FROM PREVIOUS YEAR27 Institution Average:$ 326 530 579 1,015% Increase 2.4% 3.9% 4.1% 6.9%
The Evergreen State College$ 21 376 723 772% Increase 0.1% 2.6% 4.8% 4.9%
^Fees reduced from prior academic year. *See Endnotes.#Revised from 2008-09 report.
PEERS - TABLE 18THE EVERGREEN STATE COLLEGE AND PEER INSTITUTIONS
NONRESIDENT UNDERGRADUATE TUITION AND REQUIRED FEES
Percentage Change

44
2005-06 2006-07 2007-08 2008-09 2009-10One Year Four Year
University of Montevallo 4,035 4,054 5,204 5,762 6,074 5.4% 50.5%Sonoma State University 4,198 4,230 4,588 4,980 6,226 25.0% 48.3%Eastern Connecticut State University 6,710 7,225 7,784 8,269 8,733 5.6% 30.1%Fort Hays State University 2,811 2,943 3,093 3,263 3,479 6.6% 23.8%Coppin State University 6,395 6,639 7,335 6,982 # 7,222 3.4% 12.9%Saint Mary's College of Maryland N/A 11,418 11,989 12,604 13,234 5.0% N/AKeene State College 7,352 7,822 8,298 8,778 9,334 6.3% 27.0%SUNY College at Fredonia 7,991 8,032 8,092 8,138 9,659 18.7% 20.9%SUNY College at Geneseo 7,506 7,531 7,554 7,574 9,071 19.8% 20.8%SUNY College at Oneonta 7,912 7,657 ^ 7,685 7,710 9,216 19.5% 16.5%SUNY College at Potsdam 7,699 7,767 7,811 7,847 9,364 19.3% 21.6%North Carolina Central University 3,544 3,844 4,054 4,243 4,543 7.1% 28.2%Winston-Salem State University 3,164 3,467 3,659 3,830 3,981 3.9% 25.8%Southern Oregon State University 8,701 9,526 9,936 10,434 11,919 14.2% 37.0%East Stroudsburg University of Pennsylvania 7,201 7,401 7,655 7,981 8,312 4.1% 15.4%College of Charleston 6,668 7,234 7,778 8,820 9,886 12.1% 48.3%Francis Marion University 6,184 6,712 7,238 7,832 8,160 4.2% 32.0%Longwood University 7,480 ^ 5,619 ^ 5,619 6,128 6,430 4.9% -14.0%University of Mary Washington 5,080 5,500 5,840 6,080 6,400 5.3% 26.0%THE EVERGREEN STATE COLLEGE 6,523 6,544 6,567 * 6,567 * 6,886 * 4.9% 5.6%University of Wisconsin-Green Bay 6,767 7,058 7,301 7,650 7,956 4.0% 17.6%University of Wisconsin-River Falls 6,305 6,665 7,022 7,347 7,659 4.2% 21.5%University of Wisconsin-Superior 6,374 6,764 7,104 7,495 7,871 5.0% 23.5%
Average (23 institutions) 6,209 6,594 6,922 7,231 7,896 9.2% 27.2%The Evergreen State College Rank 12 16 16 16 16
CHANGES FROM PREVIOUS YEAR23 Institution Average:$ 384 328 309 665% Increase 6.2% 5.0% 4.5% 9.2%
The Evergreen State College$ 21 23 0 319% Increase 0.3% 0.4% 0.0% 4.9%
**Graduate degrees are not offered at the following TESC peer institutions:Missouri Western State UniversityUniversity of Minnesota-MorrisUniversity of Pittsburgh-JohnstownUniversity of South Carolina Upstate
^Fees reduced from prior academic year. *See Endnotes.#Revised from 2008-09 report.
PEERS - TABLE 19THE EVERGREEN STATE COLLEGE AND PEER INSTITUTIONS
RESIDENT GRADUATE TUITION AND REQUIRED FEES**
Percentage Change

45
2005-06 2006-07 2007-08 2008-09 2009-10One Year Four Year
University of Montevallo 7,915 7,934 10,196 11,042 11,666 5.7% 47.4%Sonoma State University 14,368 14,400 14,758 15,150 17,386 14.8% 21.0%Eastern Connecticut State University 14,613 15,510 16,464 17,365 18,381 5.9% 25.8%Fort Hays State University 7,422 7,782 8,173 8,623 9,241 7.2% 24.5%Coppin State University 9,595 9,999 10,995 10,782 # 11,182 3.7% 16.5%Saint Mary's College of Maryland N/A 11,418 11,989 12,604 13,324 5.7% N/AKeene State College 14,192 15,092 15,848 16,628 # 17,504 5.3% 23.3%SUNY College at Fredonia 12,011 12,052 12,112 12,158 14,539 19.6% 21.0%SUNY College at Geneseo 11,526 11,551 11,574 11,594 13,951 20.3% 21.0%SUNY College at Oneonta 11,932 11,677 ^ 11,705 11,730 14,096 20.2% 18.1%SUNY College at Potsdam 11,719 11,785 11,831 11,867 14,244 20.0% 21.5%North Carolina Central University 13,125 13,425 13,635 14,064 15,002 6.7% 14.3%Winston-Salem State University 11,657 11,960 12,152 12,663 13,167 4.0% 13.0%Southern Oregon State University 14,389 15,724 16,341 17,061 18,810 10.3% 30.7%East Stroudsburg University of Pennsylvania 10,798 11,094 11,474 11,931 12,416 4.1% 15.0%College of Charleston 15,342 16,800 18,732 21,438 24,030 12.1% 56.6%Francis Marion University 12,233 13,239 14,241 15,379 15,985 3.9% 30.7%Longwood University 12,933 ^ 12,133 ^ 12,179 13,328 14,150 6.2% 9.4%University of Mary Washington 11,660 12,520 13,296 14,056 14,851 5.7% 27.4%THE EVERGREEN STATE COLLEGE 19,960 19,981 20,004 * 20,004 * 20,020 * 0.1% 0.3%University of Wisconsin-Green Bay 17,377 17,668 17,911 17,995 18,021 0.1% 3.7%University of Wisconsin-River Falls 16,914 17,275 17,632 17,692 17,725 0.2% 4.8%University of Wisconsin-Superior 16,984 17,374 17,714 18,840 17,936 -4.8% 5.6%
Average (23 institutions) 13,121 13,408 13,955 14,521 15,549 7.1% 18.5%The Evergreen State College Rank 1 1 1 2 2
CHANGES FROM PREVIOUS YEAR23 Institution Average:$ 287 546 567 1,028% Increase 2.2% 4.1% 4.1% 7.1%
The Evergreen State College$ 21 23 0 16% Increase 0.1% 0.1% 0.0% 0.1%
**Graduate degrees are not offered at the following TESC peer institutions:Missouri Western State UniversityUniversity of Minnesota-MorrisUniversity of Pittsburgh-JohnstownUniversity of South Carolina Upstate
^Fees reduced from prior academic year. *See Endnotes.#Revised from 2008-09 report.
PEERS - TABLE 20THE EVERGREEN STATE COLLEGE AND PEER INSTITUTIONSNONRESIDENT GRADUATE TUITION AND REQUIRED FEES**
Percentage Change

46

47
ENDNOTES FOR
NATIONAL AND PEER TABLES
47

48

49
Endnotes Pertinent information about the tuition and fee data reported in all tables of this document is included below. Only tables with endnotes are included in this listing.
National - Table 1:
Flagship Universities: Resident Undergraduate Tuition and Required Fees
• Florida: There was a 5 percent increase effective
January 2008. • Georgia: Reflects entry-level rates that are fixed for
four years of undergraduate study. • Illinois: Tuition and fees reflect entry-level rates. • Kentucky: Tuition and fees reflect average of
upper- and lower-divisions. • Ohio: Tuition and fees (beginning in 2006-07)
reflect entering students in that year. • Rhode Island: Includes one-time assessment fee of
$200 ($250 for University of Rhode Island students) in spring 2009 due to decreases in state appropriations to higher education.
• Washington: Required fees only reflect services and activities, and technology fees.
National - Table 2:
Flagship Universities: Nonresident Undergraduate Tuition and Required Fees
• Georgia: Reflects entry-level rates that are fixed for
four years of undergraduate study. • Illinois: Tuition and fees reflect entry-level rates. • Kentucky: Tuition and fees reflect average of
upper- and lower-divisions. • Ohio: Tuition and fees (beginning in 2006-07)
reflect entering students in that year. • Rhode Island: Includes one-time assessment fee of
$200 ($250 for University of Rhode Island students) in spring 2009 due to decreases in state appropriations to higher education.
• Washington: Required fees only reflect services and activities, and technology fees.
National - Table 3:
Flagship Universities: Resident Graduate Tuition and Required Fees
• Rhode Island: Includes one-time assessment fee of
$200 ($250 for University of Rhode Island students) in spring 2009 due to decreases in state appropriations to higher education.
• Washington: Required fees only reflect services and activities, and technology fees. University of Washington rates are for the Tier II graduate level.

50
Endnotes (continued) National - Table 4:
Flagship Universities: Nonresident Graduate Tuition and Required Fees
• Rhode Island: Includes one-time assessment fee of
$200 ($250 for University of Rhode Island students) in spring 2009 due to decreases in state appropriations to higher education.
• Washington: Required fees only reflect services and activities, and technology fees. University of Washington rates are for the Tier II graduate level.
National - Table 5:
Comprehensive Colleges and Universities: Resident Undergraduate Tuition and Required Fees (State Averages)
• Florida: There was a 5 percent increase effective
January 2008. • Georgia: Reflects entry-level rates that are fixed for
four years of undergraduate study. • Illinois: Tuition and fees reflect entry-level rates. • Ohio: Tuition and fees (beginning in 2006-07)
reflect entering students in that year. • Rhode Island: Includes one-time assessment fee of
$200 ($250 for University of Rhode Island students) in spring 2009 due to decreases in state appropriations to higher education.
• Washington: Required fees only reflect services and activities, and technology fees.
National - Table 6:
Comprehensive Colleges and Universities: Nonresident Undergraduate Tuition and Required Fees (State Averages)
• Georgia: Reflects entry-level rates that are fixed for
four years of undergraduate study. • Illinois: Tuition and fees reflect entry-level rates. • Ohio: Tuition and fees (beginning in 2006-07)
reflect entering students in that year. • Rhode Island: Includes one-time assessment fee of
$200 ($250 for University of Rhode Island students) in spring 2009 due to decreases in state appropriations to higher education.
• Washington: Required fees only reflect services and activities, and technology fees.
National - Table 7:
Comprehensive Colleges and Universities: Resident Graduate Tuition and Required Fees (State Averages)
• Rhode Island: Includes one-time assessment fee of
$200 ($250 for University of Rhode Island students) in spring 2009 due to decreases in state appropriations to higher education.
• West Virginia: In 2009-10 does not include tuition and required fees at West Virginia University Institute of Technology.
• Washington: Required fees only reflect services and activities, and technology fees.

51
Endnotes (continued) National - Table 8:
Comprehensive Colleges and Universities: Nonresident Graduate Tuition and Required Fees (State Averages)
• Rhode Island: Includes one-time assessment fee of
$200 ($250 for University of Rhode Island students) in spring 2009 due to decreases in state appropriations to higher education.
• West Virginia: In 2009-10 does not include tuition and required fees at West Virginia University Institute of Technology.
• Washington: Required fees only reflect services and activities, and technology fees.
• National - Table 9:
Community Colleges: Resident Tuition and Required Fees (Estimated State Averages)
• Indiana: Tuition and fees reflect those at Ivy Tech
Community College of Indiana. In prior reports, Indiana reported a blended tuition that included Vincennes University (two-year).
• Ohio: Beginning in FY2008, the University System of Ohio converted all public technical colleges into community colleges. Tuition and fees for the formerly technical colleges were not included in prior community college averages of tuition and fees.
• Washington: Required fees only reflect services and activities, and technology fees.
National - Table 10:
Community Colleges: Nonresident Tuition and Required Fees (Estimated State Averages)
• Indiana: tuition and fees reflect those at Ivy Tech
Community College of Indiana. In prior reports, Indiana reported a blended tuition that included Vincennes University (two-year).
• North Dakota: Nonresident rates now charged at 1.5 times resident rate (previously, the charge was 2.67 of resident rate).
• Ohio: Beginning in FY2008, the University System of Ohio converted all public technical colleges into community colleges. Tuition and fees for the formerly technical colleges were not included in prior community college averages of tuition and fees.
• Washington: Required fees only reflect services and activities, and technology fees.

52
Endnotes (continued) Peers - Table 1:
University of Washington and Peer Institutions: Resident Undergraduate Tuition and Required Fees
• Kentucky: Tuition and fees reflect average of
upper- and lower-divisions. • Ohio: Tuition and fees (beginning in 2006-07)
reflect entering students in that year. • Washington: Required fees only reflect services
and activities, and technology fees.
Peers - Table 2:
University of Washington and Peer Institutions: Nonresident Undergraduate Tuition and Required Fees
• Kentucky: Tuition and fees reflect average of
upper- and lower-divisions. • Ohio: Tuition and fees (beginning in 2006-07)
reflect entering students in that year. • Washington: Required fees only reflect services
and activities, and technology fees.
Peers - Table 3:
University of Washington and Peer Institutions: Resident Graduate Tuition and Required Fees
• Washington: Required fees only reflect services
and activities, and technology fees. University of Washington rates are tier II.
Peers - Table 4:
University of Washington and Peer Institutions: Nonresident Graduate Tuition and Required Fees
• Washington: Required fees only reflect services
and activities, and technology fees. University of Washington rates are tier II.
Peers - Table 5:
Washington State University and Peer Institutions: Resident Undergraduate Tuition and Required Fees
• Georgia: Reflects entry-level rates that are fixed for
four years of undergraduate study. • Ohio: Tuition and fees (beginning in 2006-07)
reflect entering students in that year. • Washington: Required fees only reflect services
and activities, and technology fees.
Peers - Table 6:
Washington State University and Peer Institutions: Nonresident Undergraduate Tuition and Required Fees
• Georgia: Reflects entry-level rates that are fixed for
four years of undergraduate study. • Ohio: Tuition and fees (beginning in 2006-07)
reflect entering students in that year. • Washington: Required fees only reflect services
and activities, and technology fees.
Peers - Table 7 and Table 8:
Washington State University and Peer Institutions: Resident and Nonresident Graduate Tuition and Required Fees
• Washington: Required fees only reflect services
and activities, and technology fees.

53
Endnotes (continued) Peers - Table 9 and Table 10:
University of Washington and Peer Institutions: Resident and Nonresident Medical Tuition and Required Fees
• Washington: required fees only reflect services and
activities, and technology fees.
Peers - Table 11 and Table 12:
University of Washington and Peer Institutions: Resident and Nonresident Dental Tuition and Required Fees
• Washington: required fees only reflect services and
activities, and technology fees.
Peers - Table 13 and Table 14:
University of Washington and Peer Institutions: Resident and Nonresident Law Tuition and Required Fees
• Washington: required fees only reflect services and
activities, and technology fees.
Peers - Table 15 and Table 16:
Washington State University and Peer Institutions: Resident and Nonresident Veterinary Medicine Tuition and Required Fees
• Kansas: Tuition and required fees for Kansas State
University of Ag and Applied Science were modified to more accurately reflect annual full-time tuition and required fees for veterinary students.
• Washington: required fees only reflect services and activities, and technology fees.
Peers – Table 17 through Table 20:
The Evergreen State College and Peer Institutions: Resident and Nonresident Tuition and Required Fees
• Washington: required fees only reflect services and
activities, and technology fees.

54

55
APPENDIX A LIST OF INCLUDED COLLEGES AND UNIVERSITIES
NATIONAL TABLES 1 through 8
55

56
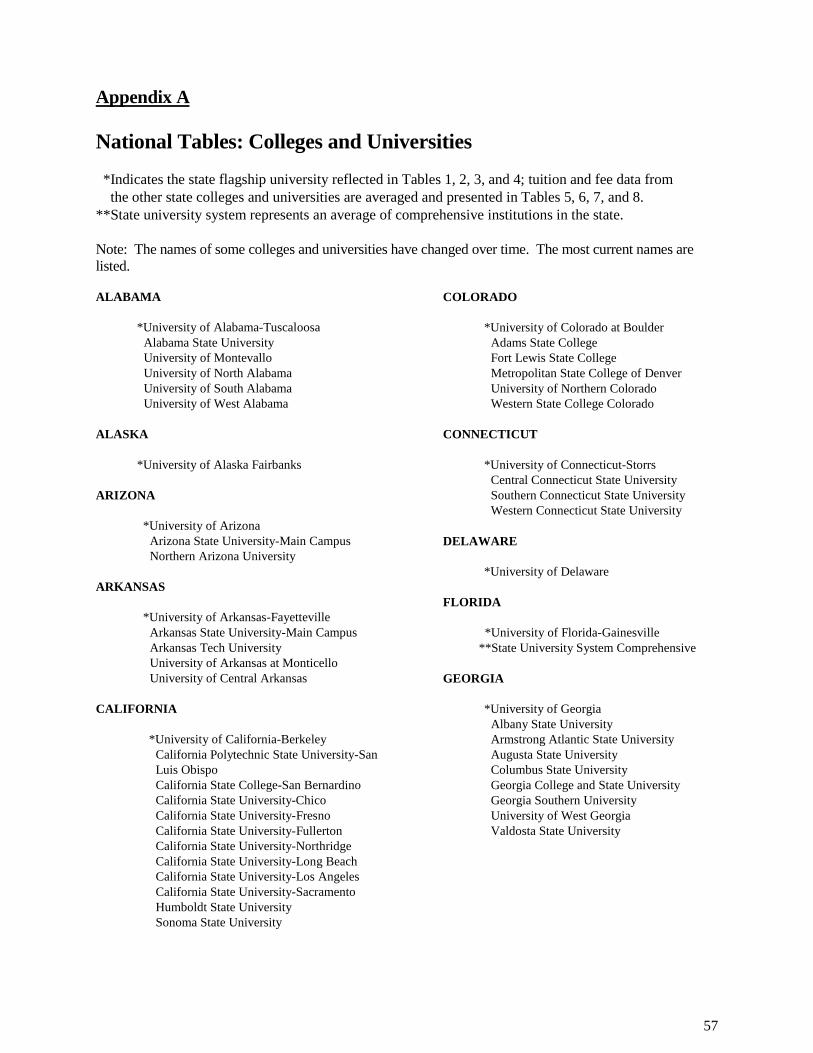
57
Appendix A
National Tables: Colleges and Universities *Indicates the state flagship university reflected in Tables 1, 2, 3, and 4; tuition and fee data from the other state colleges and universities are averaged and presented in Tables 5, 6, 7, and 8. **State university system represents an average of comprehensive institutions in the state. Note: The names of some colleges and universities have changed over time. The most current names are listed.
ALABAMA
*University of Alabama-Tuscaloosa Alabama State University University of Montevallo University of North Alabama University of South Alabama University of West Alabama
ALASKA
*University of Alaska Fairbanks ARIZONA
*University of Arizona Arizona State University-Main Campus Northern Arizona University
ARKANSAS
*University of Arkansas-Fayetteville Arkansas State University-Main Campus Arkansas Tech University University of Arkansas at Monticello University of Central Arkansas
CALIFORNIA
*University of California-Berkeley California Polytechnic State University-San Luis Obispo California State College-San Bernardino California State University-Chico California State University-Fresno California State University-Fullerton California State University-Northridge California State University-Long Beach California State University-Los Angeles California State University-Sacramento Humboldt State University Sonoma State University
COLORADO
*University of Colorado at Boulder
Adams State College Fort Lewis State College Metropolitan State College of Denver University of Northern Colorado Western State College Colorado
CONNECTICUT
*University of Connecticut-Storrs Central Connecticut State University Southern Connecticut State University Western Connecticut State University
DELAWARE
*University of Delaware
FLORIDA
*University of Florida-Gainesville **State University System Comprehensive
GEORGIA
*University of Georgia
Albany State University Armstrong Atlantic State University Augusta State University Columbus State University Georgia College and State University Georgia Southern University University of West Georgia Valdosta State University

58
National Tables: Colleges and Universities (continued)
HAWAII
*University of Hawaii at Manoa
IDAHO
*University of Idaho Boise State University Idaho State University
ILLINOIS
*University of Illinois at Urbana/Champaign Eastern Illinois University Illinois State University Northeastern Illinois University Northern Illinois University Western Illinois University
INDIANA
*Indiana University-Bloomington Ball State University Indiana State University
IOWA
*University of Iowa University of Northern Iowa
KANSAS
*University of Kansas-Main Campus Emporia State University Fort Hays State University Pittsburg State University Wichita State University
KENTUCKY
*University of Kentucky-Lexington Eastern Kentucky University Kentucky State University Morehead State University Murray State University Northern Kentucky University University of Louisville Western Kentucky University
LOUISIANA
*Louisiana State University-Baton Rouge
Grambling State University Louisiana Technical University McNeese State University Nicholls State University Northwestern State University of LA Southeastern Louisiana University University of Louisiana-Monroe
MAINE
*University of Maine University of Maine at Fort Kent University of Maine at Machias University of Maine at Presque Isle
MARYLAND
*University of Maryland-College Park Bowie State University Coppin State University Frostburg State University Morgan State University St. Mary's College of Maryland Towson State University
MASSACHUSETTS
*University of Massachusetts-Amherst Fitchburg State College Framingham State College Massachusetts College of Art and Design Massachusetts College of Liberal Arts Salem State College University of Massachusetts-Dartmouth Worcester State College
MICHIGAN
*University of Michigan-Ann Arbor Central Michigan University Eastern Michigan University Grand Valley State University Northern Michigan University Oakland University Western Michigan University

59
National Tables: Colleges and Universities (continued)
MINNESOTA
*University of Minnesota-Twin Cities
**State University System Comprehensive
MISSISSIPPI
*University of Mississippi-Main Campus Alcorn State University Jackson State University Mississippi University for Women Mississippi Valley State University University of Southern Mississippi
MISSOURI
*University of Missouri-Columbia Missouri Southern State University Missouri State University Missouri Western State University Truman State University University of Central Missouri
MONTANA
*University of Montana-Missoula Montana State University-Billings University of Montana-Western
NEBRASKA
*University of Nebraska-Lincoln University of Nebraska-Kearney Wayne State College
NEVADA
*University of Nevada-Reno University of Nevada-Las Vegas
NEW HAMPSHIRE
*University of New Hampshire-Durham
Keene State College Plymouth State College
NEW JERSEY
*Rutgers University-New Brunswick Ramapo College of New Jersey Richard Stockton College of NJ Rowan University Montclair State University New Jersey City University New Jersey Institute of Technology The College of New Jersey
NEW MEXICO
*University of New Mexico-Main Campus Western New Mexico University
NEW YORK
*University of Buffalo SUNY at Fredonia SUNY at Geneseo SUNY College at Brockport SUNY College at Buffalo SUNY College at New Paltz SUNY College at Old Westbury SUNY College at Oswego SUNY College at Plattsburgh SUNY College at Potsdam SUNY Empire State College
NORTH CAROLINA
*University of N. Carolina at Chapel Hill Appalachian State University East Carolina University North Carolina Central University Western Carolina University Winston Salem State University

60
National Tables: Colleges and Universities (continued) NORTH DAKOTA
*University of North Dakota-Grand Forks
Dickinson State University Mayville State University Minot State University Valley City State University
OHIO
*Ohio State University-Main Campus Bowling Green State University-Main Campus University of Akron-Main Campus University of Toledo Wright State University-Main Campus
OKLAHOMA
*University of Oklahoma-Norman East Central University Northeastern State University Northwestern OK State University Southeastern OK State University Southwestern OK State University University of Central Oklahoma
OREGON
*University of Oregon-Eugene Eastern Oregon University Oregon Institute of Technology Portland State University Southern Oregon University
PENNSYLVANIA
*Pennsylvania State University-Main Campus Bloomsburg University of Pennsylvania California University of Pennsylvania Cheyney University of Pennsylvania Clarion University of Pennsylvania East Stroudsburg University of Pennsylvania Edinboro University of Pennsylvania Indiana University of Pennsylvania Kutztown University of Pennsylvania Lock Haven University of Pennsylvania Mansfield University of Pennsylvania Millersville University of Pennsylvania Slippery Rock University of Pennsylvania Shippensburg University of Pennsylvania
RHODE ISLAND
*University of Rhode Island
Rhode Island College
SOUTH CAROLINA
*University of South Carolina/Columbia Francis Marion College
SOUTH DAKOTA
*University of South Dakota-Vermillion Black Hills State University Dakota State University
TENNESSEE
*University of Tennessee-Knoxville Austin Peay State University East Tennessee State University Middle Tennessee State University University of Memphis University of Tennessee-Chattanooga University of Tennessee-Martin
TEXAS
*University of Texas at Austin Angelo State University Midwestern State University Sam Houston State University Stephen F. Austin State University Texas A&M University-Commerce Texas A&M University-Kingsville Texas State University-San Marcos University of North Texas West Texas A&M University
UTAH
*University of Utah Weber State University
VERMONT
*University of Vermont Castleton State College Lyndon State College
West Chester University of Pennsylvania

61
National Tables: Colleges and Universities (continued) VIRGINIA
*University of Virginia–Main Campus
George Mason University James Madison University Longwood College Old Dominion University Radford University
WASHINGTON
*University of Washington Central Washington University Eastern Washington University Western Washington University
WEST VIRGINIA
*West Virginia University-Morgantown Bluefield State College Concord University Fairmont State University Marshall University Shepherd University West Liberty State College West Virginia University Institute of Technology
WISCONSIN
*University of Wisconsin-Madison University of Wisconsin-Eau Claire University of Wisconsin-Oshkosh University of Wisconsin-River Falls University of Wisconsin-Stevens Point
WYOMING
*University of Wyoming