Embed Size (px)
Citation preview

7/30/2019 20040916-0840-Robert Broadwater-Real Time DG Control and Rel (1)
http://slidepdf.com/reader/full/20040916-0840-robert-broadwater-real-time-dg-control-and-rel-1 1/28
1
Robert Broadwater EDD
Blacksburg, Virginia
Real Time DG Control andReliability Improvements
2004 T&D Conference St. Louis, Missouri

7/30/2019 20040916-0840-Robert Broadwater-Real Time DG Control and Rel (1)
http://slidepdf.com/reader/full/20040916-0840-robert-broadwater-real-time-dg-control-and-rel-1 2/28
2
Economics of DG GenerationDGs may sometimes be used to
avoid large capital investments,often to solve problems that onlyexist for a short period

7/30/2019 20040916-0840-Robert Broadwater-Real Time DG Control and Rel (1)
http://slidepdf.com/reader/full/20040916-0840-robert-broadwater-real-time-dg-control-and-rel-1 3/28
3
Using DG to Correct Low Voltage

7/30/2019 20040916-0840-Robert Broadwater-Real Time DG Control and Rel (1)
http://slidepdf.com/reader/full/20040916-0840-robert-broadwater-real-time-dg-control-and-rel-1 4/28
4
Zoom In to DG Site

7/30/2019 20040916-0840-Robert Broadwater-Real Time DG Control and Rel (1)
http://slidepdf.com/reader/full/20040916-0840-robert-broadwater-real-time-dg-control-and-rel-1 5/28
5
DG Corrects Problem

7/30/2019 20040916-0840-Robert Broadwater-Real Time DG Control and Rel (1)
http://slidepdf.com/reader/full/20040916-0840-robert-broadwater-real-time-dg-control-and-rel-1 6/28
6
Hierarchical Control
Units available for
economic dispatch
Level 2: Economic Dispatch of
Aggregated Units
Level 1: Local Control

7/30/2019 20040916-0840-Robert Broadwater-Real Time DG Control and Rel (1)
http://slidepdf.com/reader/full/20040916-0840-robert-broadwater-real-time-dg-control-and-rel-1 7/28
7
Control System
Constraints
Set
points
to PI
Real-
time
measure
mentsfrom PI
Load
Scale
Historical measurements
Control
Power Flow

7/30/2019 20040916-0840-Robert Broadwater-Real Time DG Control and Rel (1)
http://slidepdf.com/reader/full/20040916-0840-robert-broadwater-real-time-dg-control-and-rel-1 8/28
8
Historical Measurements
8760 hourly kW, kVar measurements for some large
customers12 kWHr measurements for other loads
–Load research statistics are usedto estimate kW, kVar loads

7/30/2019 20040916-0840-Robert Broadwater-Real Time DG Control and Rel (1)
http://slidepdf.com/reader/full/20040916-0840-robert-broadwater-real-time-dg-control-and-rel-1 9/28
9
Glendale Circuit
Substation
DG

7/30/2019 20040916-0840-Robert Broadwater-Real Time DG Control and Rel (1)
http://slidepdf.com/reader/full/20040916-0840-robert-broadwater-real-time-dg-control-and-rel-1 10/28
10
Distribution Transformer Models
7/30/2019 20040916-0840-Robert Broadwater-Real Time DG Control and Rel (1)
http://slidepdf.com/reader/full/20040916-0840-robert-broadwater-real-time-dg-control-and-rel-1 11/28
11
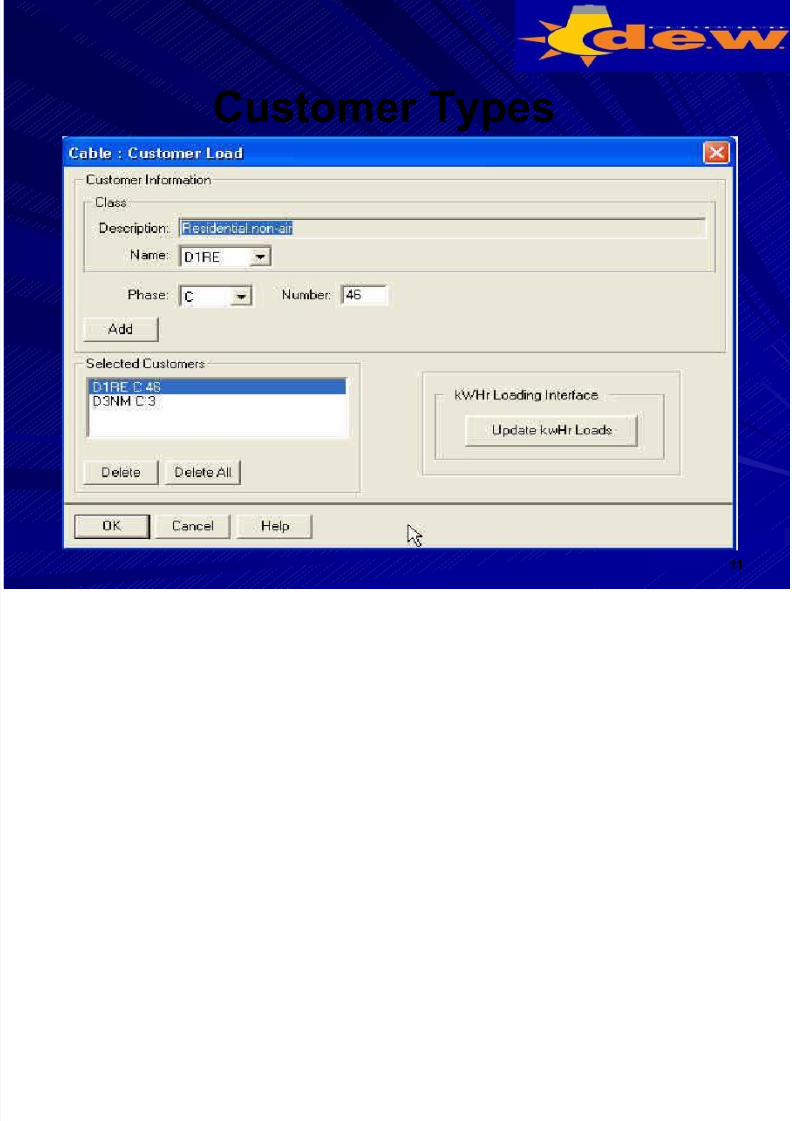
Customer Types

7/30/2019 20040916-0840-Robert Broadwater-Real Time DG Control and Rel (1)
http://slidepdf.com/reader/full/20040916-0840-robert-broadwater-real-time-dg-control-and-rel-1 12/28
12
Monthly kWHr Measurements

7/30/2019 20040916-0840-Robert Broadwater-Real Time DG Control and Rel (1)
http://slidepdf.com/reader/full/20040916-0840-robert-broadwater-real-time-dg-control-and-rel-1 13/28
13
Control SystemConstraints
Set
points
to PI
Real-
time
measure
mentsfrom PI
Load
Scale
Historical measurements
Control
Power Flow

7/30/2019 20040916-0840-Robert Broadwater-Real Time DG Control and Rel (1)
http://slidepdf.com/reader/full/20040916-0840-robert-broadwater-real-time-dg-control-and-rel-1 14/28
14
Scaling of Model LoadsSome model loads are scaled to
cause power flow results to matchreal-time measurements
Non-scalable loads
Load scaling restrictions

7/30/2019 20040916-0840-Robert Broadwater-Real Time DG Control and Rel (1)
http://slidepdf.com/reader/full/20040916-0840-robert-broadwater-real-time-dg-control-and-rel-1 15/28
15
Control System
Constraints
Set
points
to PI
Real-
time
measure
mentsfrom PI
Load
Scale
Historical measurements
Control
Power Flow

7/30/2019 20040916-0840-Robert Broadwater-Real Time DG Control and Rel (1)
http://slidepdf.com/reader/full/20040916-0840-robert-broadwater-real-time-dg-control-and-rel-1 16/28
16
Control of Voltages and CurrentsNo direct measurement of problems
Use model to predict problems
Use model to calculate generationlevels needed to eliminateproblems
–Low voltages
–Equipment overloads

7/30/2019 20040916-0840-Robert Broadwater-Real Time DG Control and Rel (1)
http://slidepdf.com/reader/full/20040916-0840-robert-broadwater-real-time-dg-control-and-rel-1 17/28
17
DG Control Features
Control performed 24 X 7
Complete control calculation,including power flow, requires 1-2seconds per circuit
Calculates “just right” level of generation
Takes into account constraints
7/30/2019 20040916-0840-Robert Broadwater-Real Time DG Control and Rel (1)
http://slidepdf.com/reader/full/20040916-0840-robert-broadwater-real-time-dg-control-and-rel-1 18/28
18
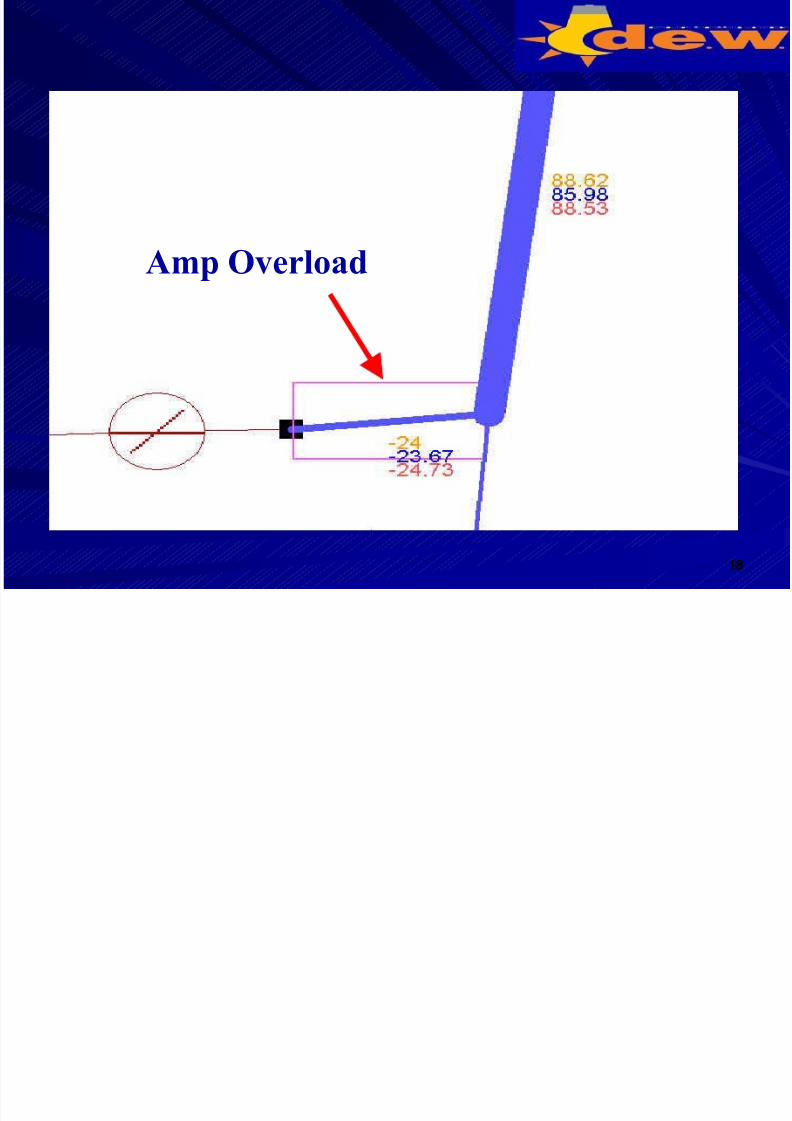
Amp Overload

7/30/2019 20040916-0840-Robert Broadwater-Real Time DG Control and Rel (1)
http://slidepdf.com/reader/full/20040916-0840-robert-broadwater-real-time-dg-control-and-rel-1 19/28
19
Sub Amps
% Sub Loading
Overloaded Components
Output Report
7/30/2019 20040916-0840-Robert Broadwater-Real Time DG Control and Rel (1)
http://slidepdf.com/reader/full/20040916-0840-robert-broadwater-real-time-dg-control-and-rel-1 20/28
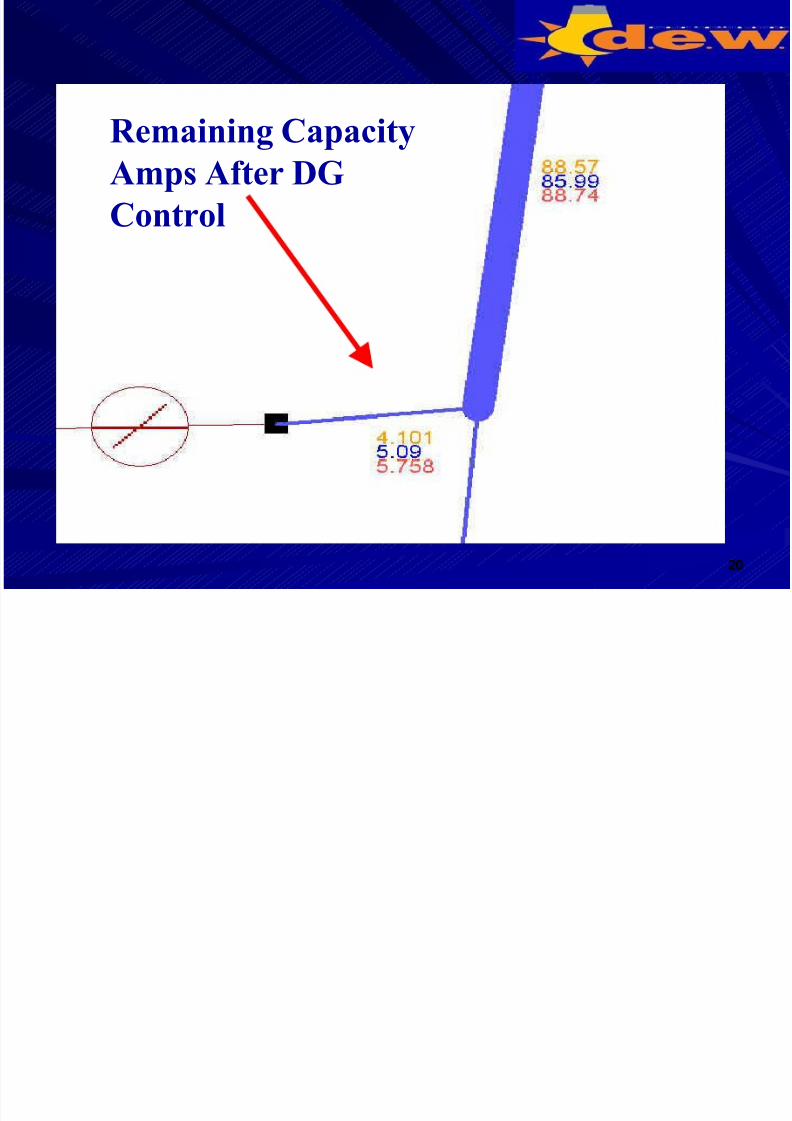
20
Remaining CapacityAmps After DG
Control

7/30/2019 20040916-0840-Robert Broadwater-Real Time DG Control and Rel (1)
http://slidepdf.com/reader/full/20040916-0840-robert-broadwater-real-time-dg-control-and-rel-1 21/28
21
Reliability for Time Varying Load
0.1
0.2
0.3
0.4
0.5
0.6
0.7
0.8
D o wn
T i m e ( Hr / yr )
Estimated Load Down Time
7/30/2019 20040916-0840-Robert Broadwater-Real Time DG Control and Rel (1)
http://slidepdf.com/reader/full/20040916-0840-robert-broadwater-real-time-dg-control-and-rel-1 22/28
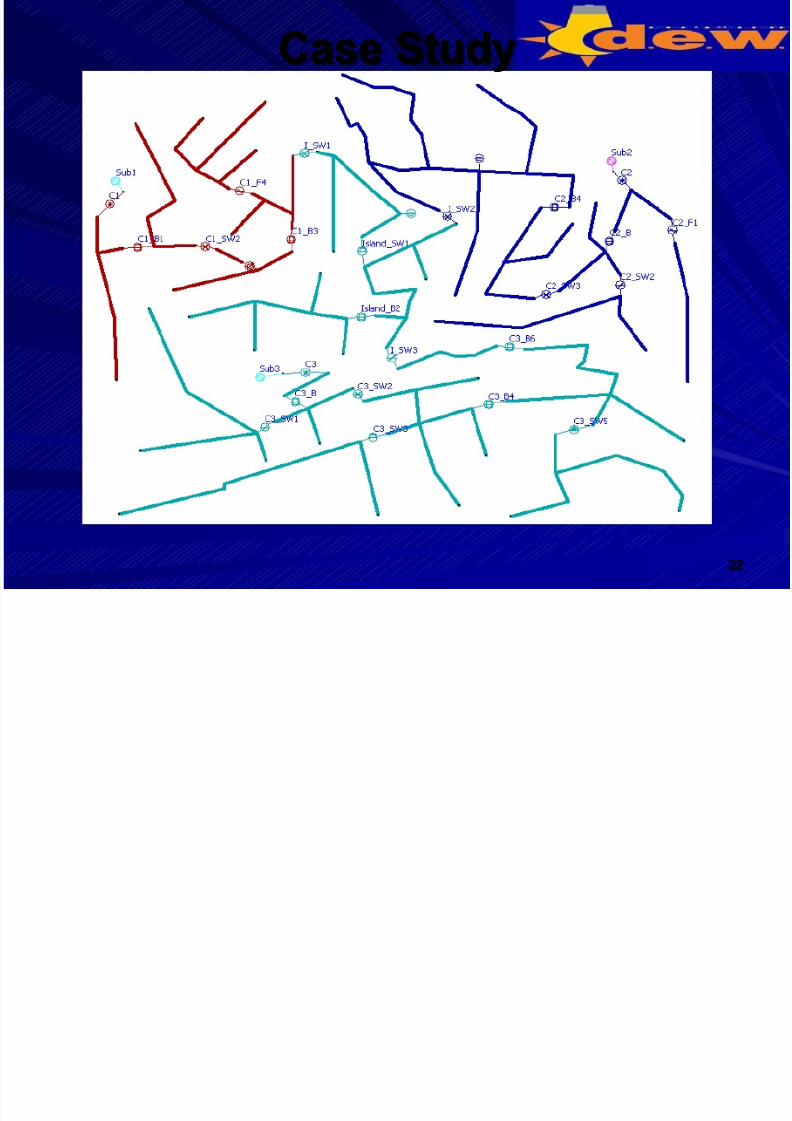
22
Case Study

7/30/2019 20040916-0840-Robert Broadwater-Real Time DG Control and Rel (1)
http://slidepdf.com/reader/full/20040916-0840-robert-broadwater-real-time-dg-control-and-rel-1 23/28
23
Circuit Load and System Load Daily Load
1000
3000
5000
7000
9000
11000
13000
15000
17000
19000
21000
23000
25000
27000
29000
0 3 6 9 12 15 18 21
Time Point
F e e d e r F l o w ( K W )
C1
C2
C3
Sys

7/30/2019 20040916-0840-Robert Broadwater-Real Time DG Control and Rel (1)
http://slidepdf.com/reader/full/20040916-0840-robert-broadwater-real-time-dg-control-and-rel-1 24/28
24
Optimum Locations
Optimal loss reduction
Best reliabilityimprovement

7/30/2019 20040916-0840-Robert Broadwater-Real Time DG Control and Rel (1)
http://slidepdf.com/reader/full/20040916-0840-robert-broadwater-real-time-dg-control-and-rel-1 25/28
25
Analysis Results
DG Effects on System Reliability and Loss
Time point
3am 6am 12pm 6pm
C1_B3 C1_F4 DIF* C1_B3 C1_F4 DIF I_SW3 C3_B6 DIF Island_SW1 C1_F4 DIF
System
Loss (%) 4.15 4.14 0.01 4.21 4.19 0.02 4. 35 3. 90 0.45 5.45 3.81 1.64
SAIDISYSImprovement
(%) 27.74 25.81 1.93 20.25 20.25 0 42.41 35.44 6.97 20.25 18.99 1.26
* DIF stands for the difference of system loss and SAIDI improvement by placingthe DG at optimal loss location and optimal reliability location.

7/30/2019 20040916-0840-Robert Broadwater-Real Time DG Control and Rel (1)
http://slidepdf.com/reader/full/20040916-0840-robert-broadwater-real-time-dg-control-and-rel-1 26/28
26
Economic Considerations
Assume 5 ¢ per kwHr
9am-5pm(1097kw – 975kw ) x 8hr x $.05 = $48.8
$48.8 = 6.97% reliability improvement ?
7/30/2019 20040916-0840-Robert Broadwater-Real Time DG Control and Rel (1)
http://slidepdf.com/reader/full/20040916-0840-robert-broadwater-real-time-dg-control-and-rel-1 27/28
27
DG Placement for Best
Reliability
If DGs are to be shut down when
circuits experience outages, then DGsshould be placed in circuits that havethe lowest failure rates.
If DGs can be operated as islands, then
DGs should be placed in circuits thathave the highest failure rates.

7/30/2019 20040916-0840-Robert Broadwater-Real Time DG Control and Rel (1)
http://slidepdf.com/reader/full/20040916-0840-robert-broadwater-real-time-dg-control-and-rel-1 28/28
28
ConclusionsDG placement in a circuit
DG placement in a system of circuits
Optimal DG placement