Embed Size (px)
Citation preview

8/3/2019 2004 Presentation Q10
http://slidepdf.com/reader/full/2004-presentation-q10 1/20
Quick Tip #10:
Tuning PL/SQL proceduresusing DBMS_PROFILER
Tim GormanPrincipal - SageLogix, Inc.
Email: [email protected]
www.SageLogix.Com
International Oracle Users GroupLive 2004

8/3/2019 2004 Presentation Q10
http://slidepdf.com/reader/full/2004-presentation-q10 2/20
Agenda
•Overview of tuning tools in Oracle – Tuning SQL
– SQL Trace
–
TKPROF –Oracle Trace Analyzer
–Hotsos Profiler (www.hotsos.com)
–UB Tools Analyzer (www.ubtools.com)
– Tuning PL/SQL
– DBMS_PROFILER
8/3/2019 2004 Presentation Q10
http://slidepdf.com/reader/full/2004-presentation-q10 3/20
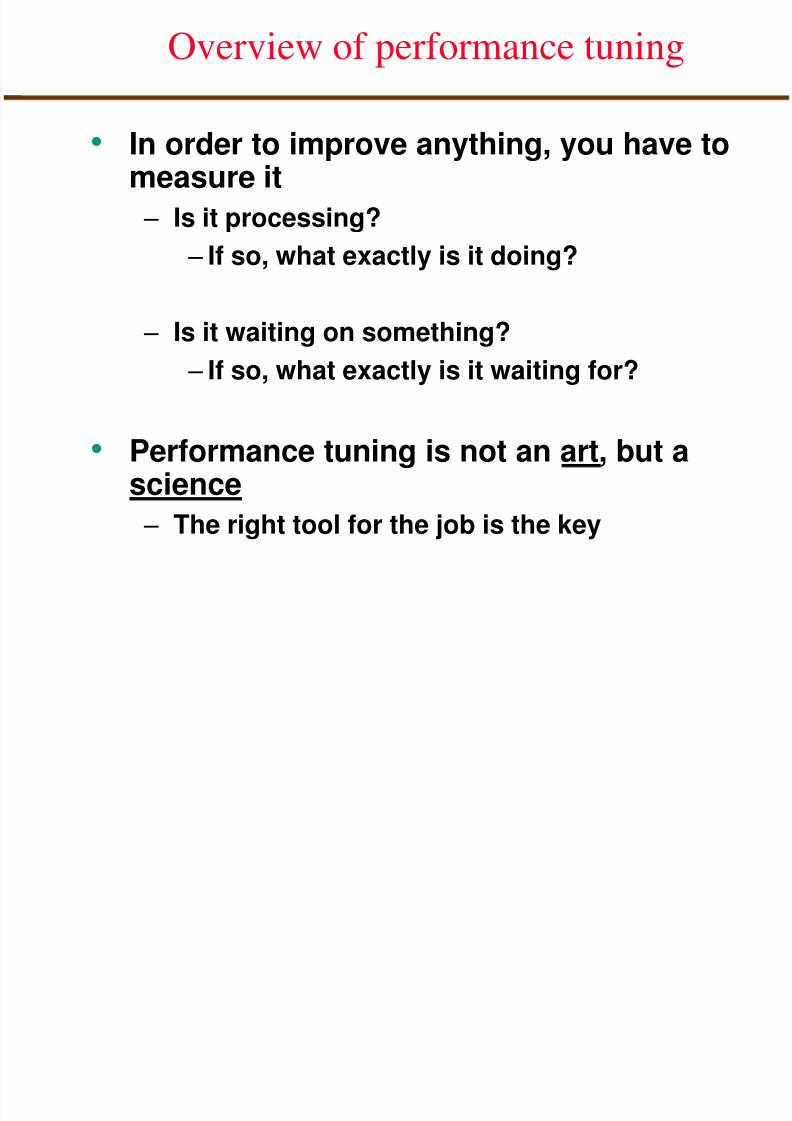
Overview of performance tuning
• In order to improve anything, you have tomeasure it
– Is it processing?
– If so, what exactly is it doing?
– Is it waiting on something?
– If so, what exactly is it waiting for?
• Performance tuning is not an art, but ascience
– The right tool for the job is the key
8/3/2019 2004 Presentation Q10
http://slidepdf.com/reader/full/2004-presentation-q10 4/20
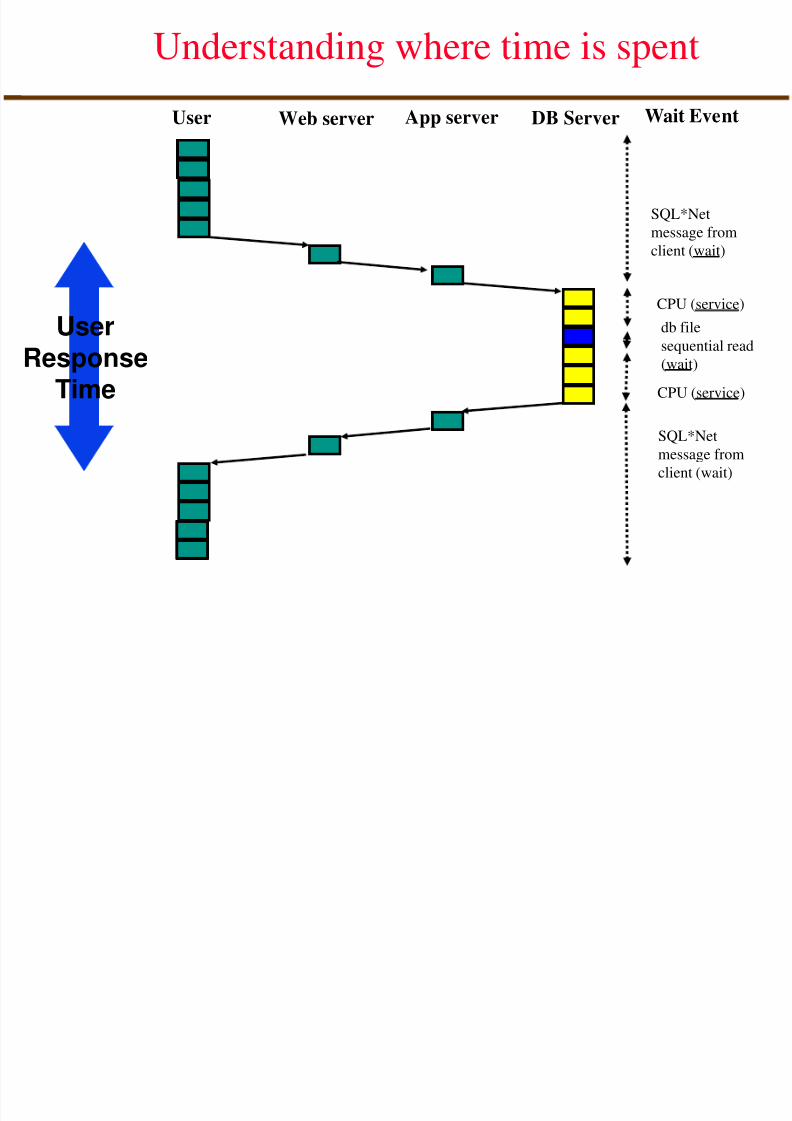
Understanding where time is spent
User Web server App server DB Server
SQL*Net
message from
client (wait)
SQL*Net
message from
client (wait)
CPU (service)
CPU (service)
db file
sequential read
(wait)
Wait Event
UserResponse
Time
8/3/2019 2004 Presentation Q10
http://slidepdf.com/reader/full/2004-presentation-q10 5/20
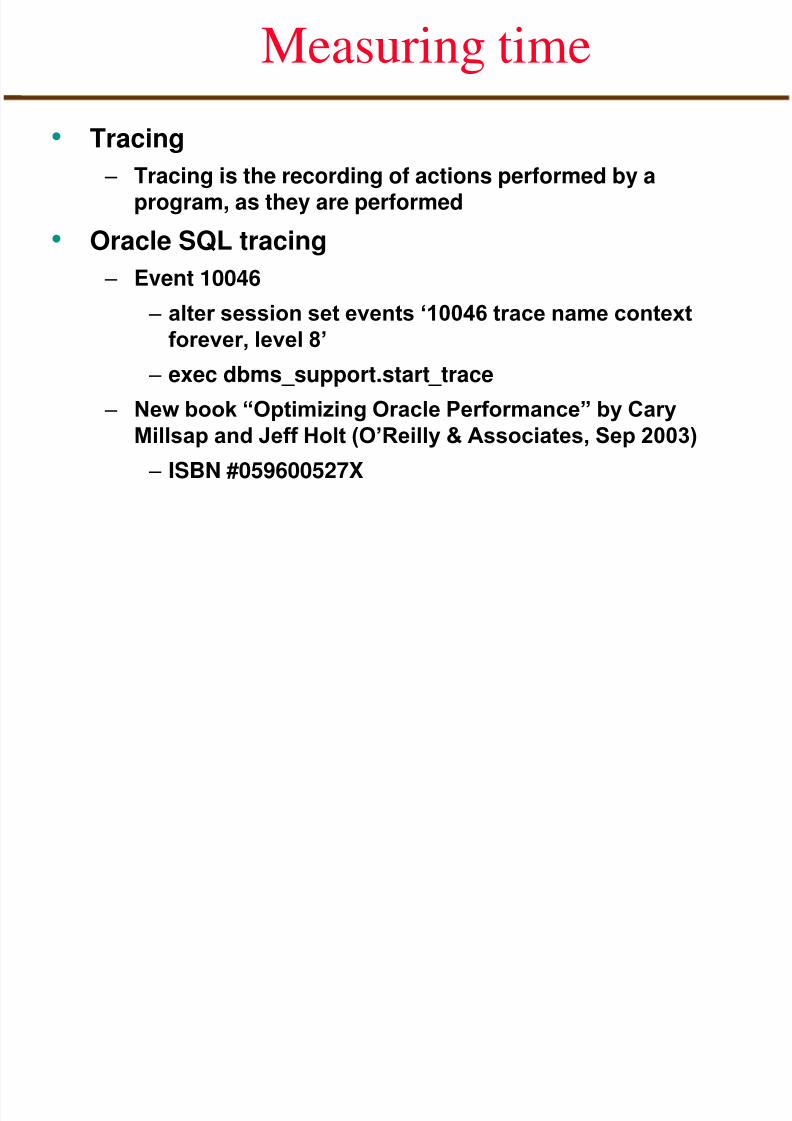
Measuring time
• Tracing – Tracing is the recording of actions performed by a
program, as they are performed
• Oracle SQL tracing
– Event 10046
– alter session set events „10046 trace name contextforever, level 8‟
– exec dbms_support.start_trace
–
New book “Optimizing Oracle Performance” by CaryMillsap and Jeff Holt (O‟Reilly & Associates, Sep 2003)
– ISBN #059600527X

8/3/2019 2004 Presentation Q10
http://slidepdf.com/reader/full/2004-presentation-q10 6/20
Summarizing trace data
• Recording every action performed by a programgenerates huge volumes of data to analyze
– Forest and trees
– Look at the trees for diagnosing failures
– Look at the forest to tune performance
• Application profiling
– “C” programs: UNIX “prof”
– Java programs: EJP on http://www.sourceforge.net
– Commercial products from http://www.semdesigns.com
– profilers for Java, C#, C++, C, COBOL, other languages
– TKPROF for SQL trace data
• Profiling is the summarization of trace data
8/3/2019 2004 Presentation Q10
http://slidepdf.com/reader/full/2004-presentation-q10 7/20
Profiling
• Using the UNIX “prof” utility as anexample:
– Compile a “C” program using the “-p” optionto the “cc” compiler command
– When compiled/linked program is executed,trace information is output to a file specifiedby $PROFDIR environment variable (defaultis “./mon.out”)
–
UNIX “prof” utility then reads trace informationand produces a summarized “profile report”which summarizes:
– Number of calls to functions
–
Amount of time spent in each function

8/3/2019 2004 Presentation Q10
http://slidepdf.com/reader/full/2004-presentation-q10 8/20
Profiling
• SQL Trace is another example – SQL trace is enabled on a session
– All SQL statements executed in that sessiondump trace information to a “.trc” file in
USER_DUMP_DEST – TKPROF program simply reads information in
the “.trc” file and summarizes it, displaying:
– Execution counts
– CPU and elapsed times
– Number of physical, logical I/O
– Number of rows fetched

8/3/2019 2004 Presentation Q10
http://slidepdf.com/reader/full/2004-presentation-q10 9/20
What if the problem is not SQL?
• SQL statements perform work in the database
– Summarizing SQL trace info is the best tool fortuning SQL
•What if the performance problem was in: – The network? Operating system? DB instance?
– Database wait events can help
– An application program, such as:
– Java, C#, C++, C, COBOL, Fortran, Lisp?
– PL/SQL?

8/3/2019 2004 Presentation Q10
http://slidepdf.com/reader/full/2004-presentation-q10 10/20
DBMS_PROFILER
• Introduced with Oracle8i • Not installed with typical installation
– Some files in “$ORACLE_HOME/rdbms/admin”
– Documented in MetaLink note #243755.1
– Download “prof.zip ” from MetaLink
– “Oracle PL/SQL Supplied Packages” reference on“DBMS_PROFILER”
•Generates trace data in PL/SQL programs – Trace data saved to tables in database
– SQL*Plus script produces summarized “profilereport” as HTML

8/3/2019 2004 Presentation Q10
http://slidepdf.com/reader/full/2004-presentation-q10 11/20
DBMS_PROFILER
• Files found in “$ORACLE_HOME/rdbms/admin” • SQL*Plus script “profload.sql ” creates the package
DBMS_PROFILER
– Run once for global setup on database
–
Must be performed by SYS user – Also validates package after creation
• SQL*Plus script “proftab.sql ” creates tables tostore trace data
– Create private sets of tables for each user
– Each user has the three tables and single sequence
– Create a “global set” of tables for all users
– DBA is responsible for granting appropriatepermissions and creating synonyms for the three
tables and the single sequence

8/3/2019 2004 Presentation Q10
http://slidepdf.com/reader/full/2004-presentation-q10 12/20
DBMS_PROFILER
• Important extra files provided in “prof.zip ” – SQL*Plus script “profiler.sql ”
– Queries data generated by runs of theDBMS_PROFILER package
– Generates HTML profiler report as output
– SQL*Plus script “profgsrc.sql ”
– Extracts the source of a stored package,
procedure, or function to an ASCII text file forediting
–So that DBMS_PROFILER procedures canbe added to that source code…

8/3/2019 2004 Presentation Q10
http://slidepdf.com/reader/full/2004-presentation-q10 13/20
Using DBMS_PROFILER
• Initial setup:
– DBMS_PROFILER package has been created bythe DBA using “profload.sql ”…
–
developer/user has created the tables using“proftab.sql ”
• Add profiler procedures to PL/SQL source
– Procedure START_PROFILER(„run-comment ‟)
– Procedure STOP_PROFILER
• Recompile and run the procedure
8/3/2019 2004 Presentation Q10
http://slidepdf.com/reader/full/2004-presentation-q10 14/20
Using DBMS_PROFILER
• After running an instrumented PL/SQLprogram:
– Execute the SQL*Plus script “profiler.sql ”
– It will display each session‟s RUN-ID, atimestamp, and the RUN-COMMENT
– Choose the appropriate RUN-ID
– Produces spooled output to a file named
“profiler_<RUNID>.html ”

8/3/2019 2004 Presentation Q10
http://slidepdf.com/reader/full/2004-presentation-q10 15/20
Case Study #1
• A PL/SQL procedure named PROFTEST1 – It queries data from a table
– Stores the data in a comma-separated string
–
Then, repeatedly parses and displays each itemin the string
• There are (at least) two ways to call theINSTR() function:
– instr(string, „,‟, 1, n)
– instr(string, „,‟, x, 1)
– Which is faster??? Is there a difference?
8/3/2019 2004 Presentation Q10
http://slidepdf.com/reader/full/2004-presentation-q10 16/20
Case Study #1
•Files: – proftest1.sql
– DDL to create stored procedure and table
–Including use of DBMS_PROFILER
– run_proftest1.sql
– SQL*Plus script to run the test
– proftest1.tkp
–
Output from tkprof <trc-file> <tkp-file> sort=prsela,exeela,fchela explain=<un>/<pwd>
– proftest1_18.html
– proftest1_19.html

8/3/2019 2004 Presentation Q10
http://slidepdf.com/reader/full/2004-presentation-q10 17/20
Case Study #1
• No real surprise when you think about it – But using “instr(string, pattern, m, n)” is faster
– But THAT MUCH FASTER???

8/3/2019 2004 Presentation Q10
http://slidepdf.com/reader/full/2004-presentation-q10 18/208
Case Study #2
• Script to estimate the number of rows perblock
– Originally written for Oracle v6
–
Adapted to Oracle7 without modification – New ROWID formats in v8+ forced changes to
the script
• Started using DBMS_ROWID package in
query
– Extremely slow

8/3/2019 2004 Presentation Q10
http://slidepdf.com/reader/full/2004-presentation-q10 19/20
Case Study #2
• DBMS_PROFILER does not affect PL/SQLmodules called within SQL statements
– Unless they are instrumented themselves withSTART/STOP_PROFILER
• The resolution of replacing DBMS_ROWIDpackage calls with SUBSTR was easilydetermined using SQL Trace and TKPROF
– But DBMS_PROFILER provided somecorroboration, at least… :-)

8/3/2019 2004 Presentation Q10
http://slidepdf.com/reader/full/2004-presentation-q10 20/20
Quick Tip #Q10Q & A
Slides and scripts will be posted onhttp://www.SageLogix.com
andhttp://www.EvDBT.com
Email: [email protected]